alternative energy generation opportunities in critical ... · energy needs of critical...
TRANSCRIPT
NREL is a national laboratory of the U.S. Department of Energy Office of Energy Efficiency & Renewable Energy Operated by the Alliance for Sustainable Energy, LLC.
This report is available at no cost from the National Renewable Energy Laboratory (NREL) at www.nrel.gov/publications.
Contract No. DE-AC36-08GO28308
Alternative Energy Generation Opportunities in Critical Infrastructure New Jersey E. Hotchkiss, I. Metzger, J. Salasovich, and P. Schwabe Produced under direction of U.S. Federal Emergency Management Agency by the National Renewable Energy Laboratory (NREL) under Interagency Agreement IAG-13-1902 and Task No. WFU11000.
Technical Report NREL/TP-7A40-60631 November 2013
NREL is a national laboratory of the U.S. Department of Energy Office of Energy Efficiency & Renewable Energy Operated by the Alliance for Sustainable Energy, LLC.
This report is available at no cost from the National Renewable Energy Laboratory (NREL) at www.nrel.gov/publications.
Contract No. DE-AC36-08GO28308
National Renewable Energy Laboratory 15013 Denver West Parkway Golden, CO 80401 303-275-3000 • www.nrel.gov
Alternative Energy Generation Opportunities in Critical Infrastructure New Jersey E. Hotchkiss, I. Metzger, J. Salasovich, and P. Schwabe
Prepared under Task No. WFU1.1000
Technical Report NREL/TP-7A40-60631 November 2013
NOTICE
This report was prepared as an account of work sponsored by an agency of the United States government. Neither the United States government nor any agency thereof, nor any of their employees, makes any warranty, express or implied, or assumes any legal liability or responsibility for the accuracy, completeness, or usefulness of any information, apparatus, product, or process disclosed, or represents that its use would not infringe privately owned rights. Reference herein to any specific commercial product, process, or service by trade name, trademark, manufacturer, or otherwise does not necessarily constitute or imply its endorsement, recommendation, or favoring by the United States government or any agency thereof. The views and opinions of authors expressed herein do not necessarily state or reflect those of the United States government or any agency thereof.
This report is available at no cost from the National Renewable Energy Laboratory (NREL) at www.nrel.gov/publications.
Available electronically at http://www.osti.gov/bridge
Available for a processing fee to U.S. Department of Energy and its contractors, in paper, from:
U.S. Department of Energy Office of Scientific and Technical Information P.O. Box 62 Oak Ridge, TN 37831-0062 phone: 865.576.8401 fax: 865.576.5728 email: mailto:[email protected]
Available for sale to the public, in paper, from:
U.S. Department of Commerce National Technical Information Service 5285 Port Royal Road Springfield, VA 22161 phone: 800.553.6847 fax: 703.605.6900 email: [email protected] online ordering: http://www.ntis.gov/help/ordermethods.aspx
Cover Photos: (left to right) photo by Pat Corkery, NREL 16416, photo from SunEdison, NREL 17423, photo by Pat Corkery, NREL 16560, photo by Dennis Schroeder, NREL 17613, photo by Dean Armstrong, NREL 17436, photo by Pat Corkery, NREL 17721.
Printed on paper containing at least 50% wastepaper, including 10% post consumer waste.

i This report is available at no cost from the National Renewable Energy Laboratory (NREL) at www.nrel.gov/publications.
Acknowledgments The U.S. Departments of Energy’s National Renewable Energy Laboratory team thanks the U.S. Department of Homeland Security’s Federal Emergency Management Agency (FEMA) and the state of New Jersey offices, including the Governor’s Office of Recovery and Rebuilding (GORR), the Office of Emergency Management (OEM), the Office of Homeland Security and Preparedness (OHSP), the Department of Environmental Protection (DEP), and the Board of Public Utilities (BPU) for the opportunity to perform the distributed generation assessment of critical facilities throughout the state. In particular, the assessment team is grateful to the facility managers, directors, engineers, and operators at the various critical facilities for their generous assistance and cooperation. Special thanks to Micky Mulvenna from U.S. Army Corp of Engineers (on behalf of FEMA); Eric Daleo from the NJ GORR; Sergeant Gallagher and Sergeant Pellegrino from OEM; Brad Mason and Steven Gutkin from OHSP; Michele Siekerka, Jaime Ewalt Gray, and Steve Jenks from DEP; and Mike Winka, Ed Mercer, and Mike Thulen from the BPU for their assistance throughout the assessment.
ii This report is available at no cost from the National Renewable Energy Laboratory (NREL) at www.nrel.gov/publications.
List of Acronyms and Abbreviations AC alternating current
ACUA Atlantic County Utilities Authority
BPU Board of Public Utilities
CCMUA Camden County Municipal Utilities Authority
CHP combined heat and power
DC direct current
DEP Department of Environmental Protection
DG distributed generation
FEMA U.S. Federal Emergency Management Agency
GORR Governor’s Office of Recovery and Rebuilding
HMGP Hazard Mitigation Grant Program
IEEE Institute of Electrical and Electronics Engineers
kV kilovolt
kW kilowatt
LCOE levelized cost of energy
LOI letters of intent
MW megawatt
MWh megawatt-hour
NREL National Renewable Energy Laboratory
OEM Office of Emergency Management
OHSP Office of Homeland Security and Preparedness
OpenEI Open Energy Information
PV photovoltaics
REC renewable energy certificates
RPS renewable portfolio standard
UPS uninterruptible power supply

iii This report is available at no cost from the National Renewable Energy Laboratory (NREL) at www.nrel.gov/publications.
Executive Summary Following Hurricane Sandy in October 2012, the New Jersey Office of Emergency Management (OEM) requested letters of intent (LOI) from communities across the state impacted by the hurricane and seeking funding through the Hazard Mitigation Grant Program (HMGP), which provides funding for public buildings. Approximately 1,200 applicants submitted LOIs, which were then categorized by NJ OEM staff into areas of need. Nearly 640 of the LOIs submitted requested backup energy generation systems, indicating a need for more resilient energy systems. In addition, the majority of requests asked for diesel-powered backup generators, which had high failure rates during the storm due to long-term outages, which reduced local fuel resources.
As a result, a cross-agency effort was initiated to identify critical infrastructure in New Jersey and opportunities for more resilient distributed generation systems. The NJ OEM, Office of Homeland Security and Preparedness, Department of Environmental Protection, the Governor’s Office of Recovery and Rebuilding (GORR), and the NJ Board of Public Utilities (BPU) have been working collaboratively with the U.S. Department of Homeland Security’s Federal Emergency Management Agency (FEMA) and the U.S. Department of Energy’s National Renewable Energy Laboratory (NREL) to identify energy needs of critical infrastructure and life-safety facilities across the state to ensure continuous operation through future disaster events.
The National Renewable Energy Laboratory, in collaboration with FEMA and the various state agencies, conducted a comprehensive questionnaire administered through NJ OEM of the 640 applicants who submitted energy-related LOIs for the HMGP. The questionnaire assessed the energy needs of critical infrastructure, and identified state-wide opportunities for more resilient DG systems that can operate in parallel with the grid during normal operation and isolate (island) critical facilities with on-site energy generation during grid outages. In addition, several site visits of buildings representing different categories of critical infrastructure were conducted to determine the market potential and applicability of technologies that would allow critical facilities to operate independently of the grid during future disaster events.
The following report describes the findings from the critical infrastructure energy questionnaire and site visits, resilient DG technology and policy opportunities, and the financial assessment of resilient DG systems. This report is intended for integration into a larger proposal being developed by the BPU and GORR for the creation of an energy bank to finance applicable projects through the U.S. Department for Housing and Urban Development’s Community Development Block Grant program. Through smart financing and design, New Jersey can utilize funding from the Hurricane Sandy Relief Bill (H.R. 41) to create projects that will 1) improve the resiliency of the energy system during disaster events, 2) reduce critical facility energy demand and operating costs during normal operating conditions, and 3) take large strides toward achieving the goals outlined in the current New Jersey Energy Master Plan.

iv This report is available at no cost from the National Renewable Energy Laboratory (NREL) at www.nrel.gov/publications.
Table of Contents Acknowledgments ....................................................................................................................................... i List of Acronyms and Abbreviations ........................................................................................................ ii Executive Summary ................................................................................................................................... iii List of Figures ............................................................................................................................................. v List of Tables ............................................................................................................................................... v Assessment of New Jersey’s Critical Infrastructure ............................................................................... 1
Questionnaire Results ............................................................................................................................. 1 Energy Resiliency through Alternative Energy ...................................................................................... 9
Microgrid Basics .............................................................................................................................. 9 Potential Alternative Energy Generation Technologies ................................................................. 10
Market Potential Analysis .................................................................................................................... 14 Energy Resiliency Policy Opportunities .............................................................................................. 18
Leveraging Funds .......................................................................................................................... 18 Renewable Energy Certificates ...................................................................................................... 19 Net Metering .................................................................................................................................. 20 Permitting and Policies .................................................................................................................. 21
Financial Considerations of Distributed Generation Technologies ...................................................... 23 Conclusions ............................................................................................................................................... 30 Bibliography .............................................................................................................................................. 31 Appendix: Critical Infrastructure Questionnaire.................................................................................... 32
v This report is available at no cost from the National Renewable Energy Laboratory (NREL) at www.nrel.gov/publications.
List of Figures Figure 1. Types of facilities requesting funding ...................................................................................... 2 Figure 2. Type of building ownership ....................................................................................................... 2 Figure 3. Square footage of facilities requesting funding ...................................................................... 3 Figure 4. Number of full-time employees ................................................................................................. 3 Figure 5. Facility energy sources .............................................................................................................. 4 Figure 6. Types of demand rates ............................................................................................................... 4 Figure 7. Energy failure by fuel type ......................................................................................................... 5 Figure 8. Length of time without power .................................................................................................... 6 Figure 9. Types of alternative backup power systems currently installed ........................................... 7 Figure 10. Number of utility feeds per facility .......................................................................................... 7 Figure 11. Feeder configuration ................................................................................................................ 8 Figure 12. Heating sources within critical infrastructure ....................................................................... 8 Figure 13. Target reliability of critical facilities ........................................................................................ 9 Figure 14. NREL’s systematic method to microgrids incorporating long-term planning with high
reliability and high economic value (ellipse size indicates initial cost)........................................ 10 Figure 15. Major components of a grid-connected photovoltaic system ........................................... 13 Figure 16. U.S. wind resource map at a height of 30 meters ................................................................ 14 Figure 17. Middlesex County Utilities Authority Wastewater treatment facility in Sayreville, New
Jersey .................................................................................................................................................. 16 Figure 18. JFK Hospital in Edison, New Jersey ..................................................................................... 18 Figure 19. Richard Stockton College and surrounding AtlantiCare Hospital and schools ............... 22 Figure 20. AtlantiCare Hospital ................................................................................................................ 23 Figure 21. Levelized cost of energy by technology type ...................................................................... 25 Figure 22. Overnight capital cost ............................................................................................................ 26 Figure 23. Fixed operating cost ............................................................................................................... 27 Figure 24. Variable operating cost .......................................................................................................... 28 Figure 25. Capacity factor ........................................................................................................................ 29
List of Tables Table 1. Number of Facilities Responding to Funding LOI, by Type ................................................... 15
1 This report is available at no cost from the National Renewable Energy Laboratory (NREL) at www.nrel.gov/publications.
Assessment of New Jersey’s Critical Infrastructure Following Hurricane Sandy, a cross-agency effort was conducted to identify critical infrastructure in New Jersey. Infrastructure identified as critical included public buildings that serve a life-support or infrastructure-support purpose—wastewater treatment facilities, hospitals, and emergency dispatch centers, for example. The U.S. Department of Energy’s National Renewable Energy Laboratory (NREL) collaborated with the U.S. Department of Homeland Security’s Federal Emergency Management Agency (FEMA) and various state offices, including the Office of Emergency Management (OEM), Office of Homeland Security and Preparedness (OHSP), Department of Environmental Protection (DEP), the Governor’s Office of Recovery and Rebuilding (GORR), and the NJ Board of Public Utilities (BPU), to develop a comprehensive questionnaire of the 640 applicants who submitted energy-related letters of intent (LOIs) for the Hazard Mitigation Grant Program (HMGP). The questionnaire assessed the energy needs of critical infrastructure and identified state-wide opportunities for more resilient distributed generation systems, which can operate in parallel with the grid during normal operation and isolate (island) critical facilities with on-site energy generation during grid outages. In addition, several site visits were conducted of buildings representing different categories of critical infrastructure to determine the market potential and applicability of technologies that would allow critical facilities to operate independently of the grid during future disaster events.
Questionnaire Results The questionnaire resulted in over 640 responses, and to understand the types of requests being made for energy-related funding, the summary of those responses is shown in this section. More than 640 responses were received due to participants submitting information on multiple facilities. The questionnaire is included in the Appendix.
The majority of the critical facility types requesting funding fall under office buildings, as shown in Figure 1, which are mostly owned by municipalities (see Figure 2). Over 150 requests were received from communications, dispatch, fire, and police centers, followed by schools and wastewater treatment facilities.

2 This report is available at no cost from the National Renewable Energy Laboratory (NREL) at www.nrel.gov/publications.
Figure 1. Types of facilities requesting funding
Figure 2 shows the breakdown of facilities by ownership type, indicating that the majority of requests are being made by municipalities within the state of New Jersey.
Figure 2. Type of building ownership
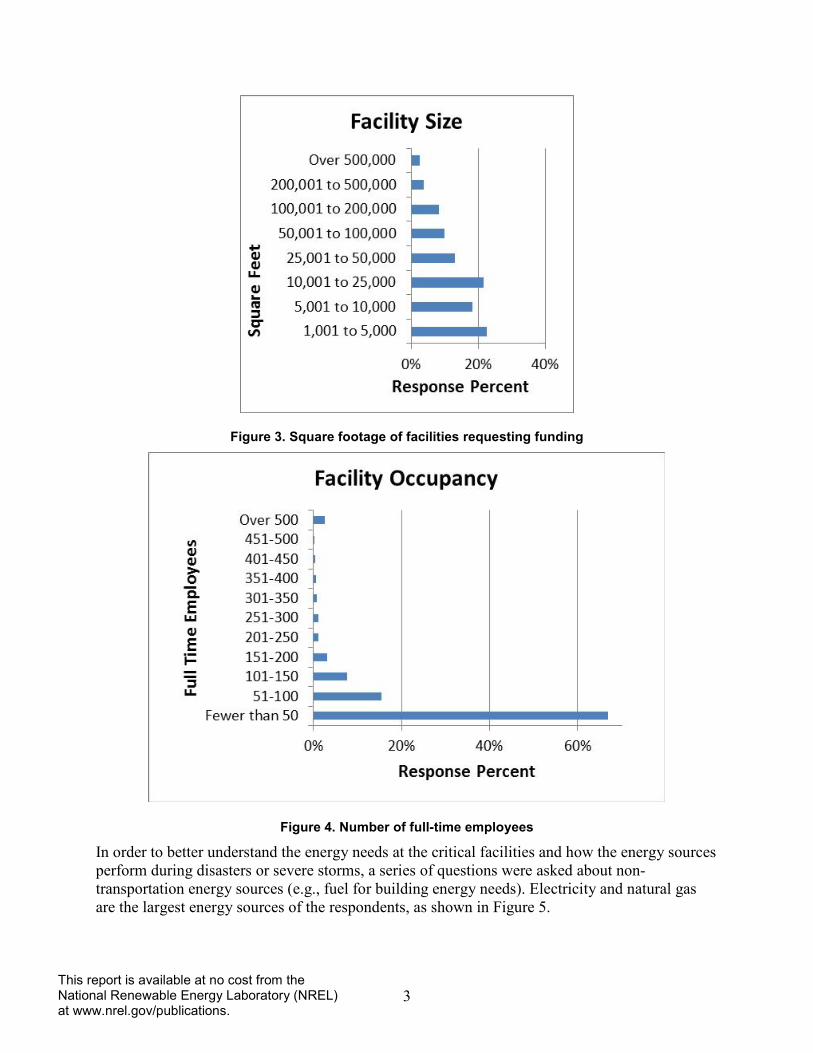
The questionnaire respondents indicated nearly 50% of the facilities in need of energy-related systems for hazard mitigation are smaller than 50,000 square feet (as shown in Figure 3), and over 60% responded that they have fewer than 50 employees (shown in Figure 4).
3 This report is available at no cost from the National Renewable Energy Laboratory (NREL) at www.nrel.gov/publications.
Figure 3. Square footage of facilities requesting funding
Figure 4. Number of full-time employees
In order to better understand the energy needs at the critical facilities and how the energy sources perform during disasters or severe storms, a series of questions were asked about non-transportation energy sources (e.g., fuel for building energy needs). Electricity and natural gas are the largest energy sources of the respondents, as shown in Figure 5.

4 This report is available at no cost from the National Renewable Energy Laboratory (NREL) at www.nrel.gov/publications.
Figure 5. Facility energy sources
Demand charges, which are included with energy charges in applicable rate structures, charge customers for their power demand (usually in maximum kilowatts (kW) demanded over a specific interval). Demand charges can be fixed or vary by season or hour. Of those respondents with electricity needs, 63% pay demand charges. There are a number of ways to structure a demand rate, so respondents were asked to identify the type of demand rate structure at their facilities. Nearly 60% of the respondents with demand rates are being charged a constant fee, 28% pay a ratchet rate, and 13% pay a block rate, as shown in Figure 6.
Figure 6. Types of demand rates
The rate structure impacts the type of alternative energy systems that will be beneficial to a site. For example, a solar photovoltaic (PV) system may offset a site’s load by providing electricity during high demand hours; however, because demand is often measured in 15-minute intervals, if a PV system’s output is reduced as a result of clouds during this peak load period, the actual

5 This report is available at no cost from the National Renewable Energy Laboratory (NREL) at www.nrel.gov/publications.
benefit of PV on demand reduction can be substantially reduced. However, if a site has a cogeneration system sized to the base load power demand, significant energy and demand savings can be achieved.
Questionnaire participants were asked about their experiences during Hurricane Sandy and other storms to determine how many of the sites lost power, as well as which energy sources to the facility failed. Of the total respondents, 84% reported losing power during Hurricane Sandy. Nearly all of those facilities lost electricity, but some experienced outages with other fuel sources, as shown in Figure 7. Nearly half of the facilities without power were unable to regain power for one week; approximately 25% were without power for two weeks (shown in Figure 8). During the site visits that NREL conducted, a few facilities reported sections of their operations had still not been fully restored after the hurricane, nearly nine months after the storm.
Figure 7. Energy failure by fuel type

6 This report is available at no cost from the National Renewable Energy Laboratory (NREL) at www.nrel.gov/publications.
Figure 8. Length of time without power
Questionnaire responses determined that 86% of the facilities had experienced failures during previous storms, indicating a vulnerability to power outages.
To understand what types of backup systems currently exist within critical infrastructure to supply power during outages, questions targeted whether backup power existed, what kind of systems were already in place, and whether these systems failed during Hurricane Sandy. Of the total respondents, 66% indicated they do currently have backup power or thermal systems. The types of systems range from uninterruptible power supplies (UPS), to co-generation, solar PV, solar hot water systems and fuel cells. The majority of respondents had either UPS or PV systems installed, as shown in Figure 9. Respondents were asked to identify whether the alternative systems failed during Hurricane Sandy, and only 43% said yes, compared to the 95% who said yes to the grid systems failing.
It is assumed the majority of the alternative systems that failed during the storm were solar PV, due to a lack of dynamic controls (e.g., dynamic inverters and transfer switches), which allow a PV system to be operated in island mode during a grid outage. There are very few known cases of PV systems operating during Hurricane Sandy. One such example was Bayonne School, where facility staff was able to operate its PV system by manually disconnecting from the grid and isolating equipment.

7 This report is available at no cost from the National Renewable Energy Laboratory (NREL) at www.nrel.gov/publications.
Figure 9. Types of alternative backup power systems currently installed
Nearly 80% of the critical facilities questioned have one utility feed to the site, and approximately 60% have a radial feeder configuration, as shown in Figure 10 and Figure 11. Both of these factors impact the type of alternative energy or backup power considerations at the sites in terms of cost and complexity of modifying the existing feeders to incorporate backup power systems.
Figure 10. Number of utility feeds per facility

8 This report is available at no cost from the National Renewable Energy Laboratory (NREL) at www.nrel.gov/publications.
Figure 11. Feeder configuration
To understand the full energy needs on-site (other than electrical), respondents were asked to identify their primary heating source. Approximately 35% of critical facilities obtain their heat from hot water systems, 26% from electricity, and 17% from steam systems, while 23% indicated another source of heating (see Figure 12). Diversifying the source of heating in critical infrastructure is beneficial during power outages and future storms if they were to occur during the winter months.
Figure 12. Heating sources within critical infrastructure
The state requested information relating to food service to understand cooking and refrigeration needs within critical infrastructure. This question was chosen to determine where critical food supplies might be needed, or where cooking facilities might exist within shelters, to help prioritize needs within communities. Of the total respondents, only 27% provide food service on-

9 This report is available at no cost from the National Renewable Energy Laboratory (NREL) at www.nrel.gov/publications.
site. The low percentage of food services provided indicated that cooking needs are not a high priority in these facilities.
Participants were asked to provide the reliability target for their facilities to determine the number of hours per year that would be acceptable for power outages. This gauge is usually measured by a factor of three to five nines (0.999 to 0.99999), where 0.999 is multiplied by the total number of hours in a year to determine acceptable outages. Respondents were given the option of selecting unknown, which was the majority of the responses; however, approximately 15% selected the need to operate almost continuously, as shown in Figure 13. When asked about the cost of downtime, only 100 respondents answered the question, with values ranging from $100/hour to $1,000,000/hour of downtime.
Figure 13. Target reliability of critical facilities
Energy Resiliency through Alternative Energy Alternative energy generation technologies help build energy resiliency. Alternative fuels or energy generation options lessen the impact on the grid during storms and natural disasters and, if designed to do so, can incorporate islanding of buildings or campuses. Microgrids and renewable energy technologies are a part of the resilient design options. Microgrid Basics Microgrids are integral to energy resiliency. They are simply defined as systems that have at least one distributed energy resource and associated loads, and can form intentional islands in the electrical distribution system to operate independently of the power grid. When creating an island, an upstream switch is opened, and the distributed energy resource must maintain the proper voltage and frequency to supply islanded loads. Switch technology varies widely, and may result in momentary interruptions when transferring from grid power, in which case the distributed generator should be able to restart (black-start) and pick up the islanded load. When reconnecting to the grid, it is important that the microgrid synchronize the voltage on both sides of the switch before closing.
The typical components that make up a microgrid are distributed generators, distributed storage (optional), interconnection switches, and control systems. Controls and interconnection switches
10 This report is available at no cost from the National Renewable Energy Laboratory (NREL) at www.nrel.gov/publications.
are often selected for specific distributed generation technology and may be consolidated into packaged solutions. The Institute of Electrical and Electronics Engineers (IEEE) has developed standard IEEE P1547.7 Draft Guide for Design, Operation, and Integration of Distributed Resource Island Systems with Electrical Power Systems, which is a useful resource in designing microgrids.
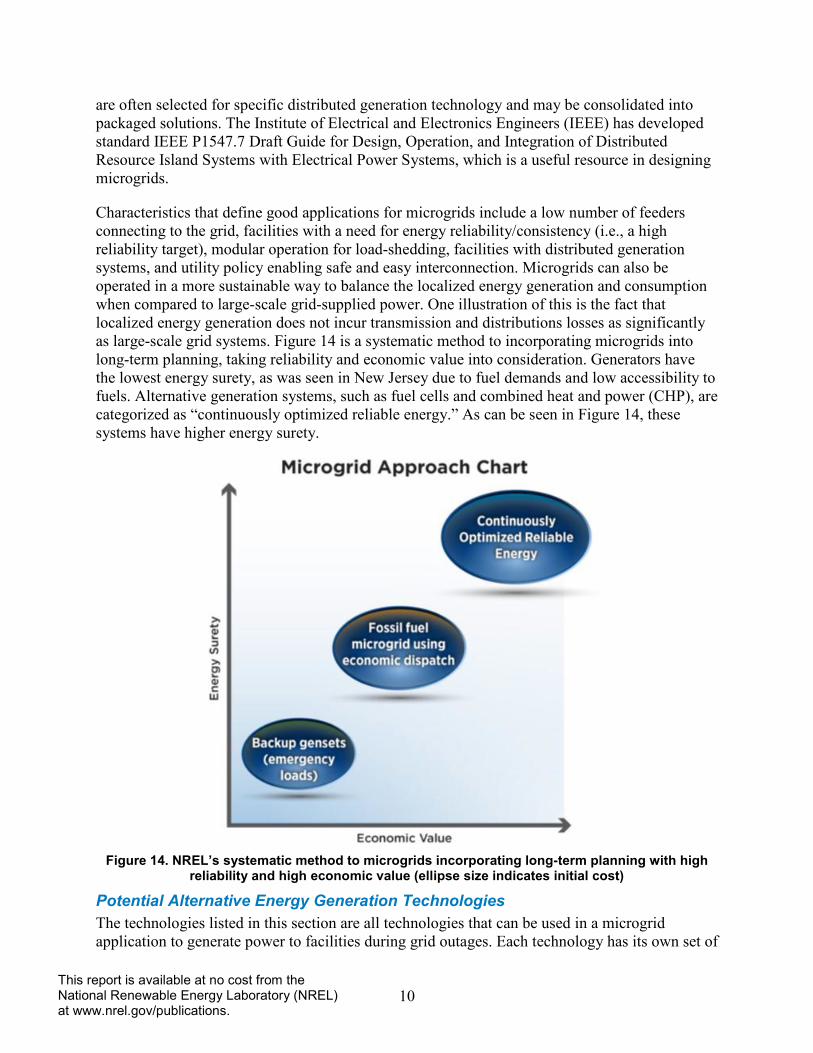
Characteristics that define good applications for microgrids include a low number of feeders connecting to the grid, facilities with a need for energy reliability/consistency (i.e., a high reliability target), modular operation for load-shedding, facilities with distributed generation systems, and utility policy enabling safe and easy interconnection. Microgrids can also be operated in a more sustainable way to balance the localized energy generation and consumption when compared to large-scale grid-supplied power. One illustration of this is the fact that localized energy generation does not incur transmission and distributions losses as significantly as large-scale grid systems. Figure 14 is a systematic method to incorporating microgrids into long-term planning, taking reliability and economic value into consideration. Generators have the lowest energy surety, as was seen in New Jersey due to fuel demands and low accessibility to fuels. Alternative generation systems, such as fuel cells and combined heat and power (CHP), are categorized as “continuously optimized reliable energy.” As can be seen in Figure 14, these systems have higher energy surety.
Figure 14. NREL’s systematic method to microgrids incorporating long-term planning with high
reliability and high economic value (ellipse size indicates initial cost)
Potential Alternative Energy Generation Technologies The technologies listed in this section are all technologies that can be used in a microgrid application to generate power to facilities during grid outages. Each technology has its own set of

11 This report is available at no cost from the National Renewable Energy Laboratory (NREL) at www.nrel.gov/publications.
benefits and considerations. Not every technology is appropriate for each facility type; therefore, performance constraints and technical considerations need to be evaluated before approving the installation of a technology.
Cogeneration, Tri-generation, and Combined Heat and Power (CHP) Cogeneration, tri-generation, and combined heat and power (CHP) systems are integrated energy systems that are located at, or near, a facility and generate electrical and/or mechanical power, as well as recover waste heat for heating, cooling, dehumidification, or more electricity generation. Recovering waste heat from on-site power generators to serve thermal loads (e.g., heating or air conditioning) can double the overall efficiency, reaching capacity factors of 90% in some instances. Generators in these systems can utilize a variety of fuel sources or multiple fuels, and co-produce two or more forms of energy. Often, on-site generation using natural gas can improve reliability because fuel is distributed through underground pipelines rather than overhead electrical wires, which are susceptible to failure due to high winds and/or ice. Natural gas, which is not used as much as other fuels in New Jersey, may reduce operating costs and the environmental impact of the facility by reducing the imported electricity from other fossil fuel resources. These systems are often used for energy islanding, creating a microgrid consisting of the generators and loads co-located at a facility or multiple facilities within a district.
Combined-cycle generation describes a power generator that recovers waste heat to produce more power, thus improving the overall efficiency of the system. This type of system is ideal for facilities that do not have year-round thermal loads, but have high electrical needs and high demand costs.
If a facility has a high heating and/or cooling demand year-round, waste heat can be recovered from a generator and can be used to drive an absorption chiller or steam-driven compressor to create chilled water. These systems have several benefits compared to normal compressor cooling, such as the elimination of chlorofluorocarbon (CFC) or hydrochlorofluorocarbon (HCFC) refrigerants use (which are ozone depleting), quieter operation than conventional systems, low pressure with no large rotating components, high reliability, and low maintenance. Characteristics that define good applications for absorption chillers include year-round heating and/or cooling loads, existing steam boilers and distribution, and high demand costs.
Waste-to-Energy Waste-to-energy is the process of generating electricity and/or heat from the incineration of waste or from a waste by-product and is a form of energy recovery. Most waste-to-energy systems produce energy through a combustion process, such as incineration of solid waste or by using fuels created from a waste process, such as methane from a landfill. Many waste-to-energy systems utilize cogeneration plants to create electricity or utilize thermal energy. Cogeneration incinerators typically have efficiencies of 80%, depending on the energy output of the waste being incinerated, but can achieve much higher efficiencies with flue gas condensation and reheat technologies to capture heat losses.
The most commonly used type of waste-to-energy is incineration. Incineration typically requires the burning of the fuel source (e.g., municipal solid waste) to heat water to power steam generators for the production of electricity and/or heat. Other processes exist, which are also categorized as waste-to-energy, but produce energy without direct combustion. These include

12 This report is available at no cost from the National Renewable Energy Laboratory (NREL) at www.nrel.gov/publications.
gasification, thermal depolymerization, pyrolysis, plastic pyrolysis, plasma gasification processes, anaerobic digestion, and mechanical biological treatment. The successful implementation of a waste-to-energy system is largely dependent upon a constant fuel source, whether it be municipal solid waste for incineration or a nearby supply of methane gas from landfills. As such, these technologies are most effective at facilities located near landfills and wastewater treatment plants. Where a site generates a constant excess of a fuel, it may be possible to incorporate a district cogeneration system to supply multiple buildings with energy.
Fuel Cells Fuel cells can be used to power vehicles, buildings, and even small devices, such as laptop computers. Fuel cell systems can be extremely efficient, achieving overall efficiencies of 80% or more when heat production is combined with power generation. Fuel cell systems can operate on natural gas, which was one of the most resilient fuel distribution systems during Hurricane Sandy, and can provide energy for heating and cooling, and electricity to power community-scale systems.
A fuel cell uses the chemical energy of a fuel to produce electricity with water and heat as byproducts. Fuel cells are unique in terms of the variety of their potential applications; they can provide energy for systems as large as a utility power station and as small as a laptop computer. Basically, a fuel cell is a device that uses fuel and oxygen to create electricity by an electrochemical process. A single fuel cell consists of an electrolyte and two catalyst-coated electrodes (a porous anode and cathode). The application for different fuel cell types varies, as does the operating temperature and stack size. While there are different fuel cell types, all fuel cells work similarly, requiring a fuel (such as natural gas or hydrogen) to feed the anode where a catalyst separates the positive and negative electrons from the positive ions in the fuel to create an electrical current. There are several benefits to fuel cells compared to engine-based generators, including the fact that they are quiet, have low maintenance, are cleaner, and have low emissions. Other advantages include quick start-up, high efficiency, fuel flexibility, and pairing with combined heat and power systems, to name a few. The high implementation costs of fuel cells, coupled with it being a newer, still developing technology, has created a lower level of implementation of these technologies.
Solar Photovoltaic (PV) System Photovoltaics are semiconductor devices that convert sunlight directly into electricity. They can do so without any moving parts and without generating any noise or pollution. They must be mounted in an unshaded location; rooftops, carports, and unused land are common mounting locations.
The amount of energy produced by a panel depends on several factors. These factors include the type of collector, the tilt and azimuth of the collector, the temperature, and the level of sunlight and weather conditions. An inverter is required to convert the direct current (DC) to alternating current (AC) of the desired voltage compatible with building and utility power systems. The remainder of the system consists of conductors/conduit, switches, disconnects, and fuses. Grid-connected PV systems feed power into the facility’s electrical system and often do not include batteries.

13 This report is available at no cost from the National Renewable Energy Laboratory (NREL) at www.nrel.gov/publications.
Figure 15 shows the major components of a grid-connected PV system and illustrates how these components are interconnected in a grid-connected PV system.
Figure 15. Major components of a grid-connected photovoltaic system. Illustration by Jim Leyshon, NREL
PV systems can be instrumental in providing power to areas that have been affected by severe storms. Advanced controls on the inverter have to be installed so the PV system can operate without the grid during power outages. When installing PV technologies, all local codes should be followed to meet wind loading requirements in hurricane zones.
Wind Turbines Large-scale wind turbines are commonly classified as any wind turbine larger than 100 kilowatts (kW) and small-scale wind turbines are classified as less than 100 kW. The wind resource at a site has the largest impact on whether or not a wind project will be feasible. Installing a temporary anemometer and collecting at least a year’s worth of wind speed data is highly recommended for large-scale turbines to determine the feasibility of a wind project. Figure 16 shows the wind resource in the United States at a hub height of 30 meters. Urban settings are not ideal for wind turbines, as the surrounding buildings would shelter turbines from the wind and cause turbulence.
Wind turbines can provide power after a severe storm to areas that have been affected. During severe storms, the winds could be higher than the cut-out wind speed, and the turbines would be nonoperational to protect the blades during high wind. After a severe storm with high winds, wind turbines could provide power as long there are advanced controls that allow the turbines to operate independently of the electrical grid. Very few turbines were reported to have damage after Hurricane Sandy; however, small- to medium-sized turbines often have a feature that allows them to be tilted during storms for protection.

14 This report is available at no cost from the National Renewable Energy Laboratory (NREL) at www.nrel.gov/publications.
Figure 16. U.S. wind resource map at a height of 30 meters
Source: NREL (http://www.nrel.gov/gis/images/30m_US_Wind.jpg)
Market Potential Analysis The state of New Jersey is interested in understanding where there are potential opportunities for various types of energy generation technologies for critical infrastructure. The site visits, along with the questionnaires, were used as methods for collecting information related to energy needs and applicability for specific technologies. Table 1 shows the types of facilities requesting assistance through an LOI. The majority of requests received were from schools, followed by wastewater and water treatment facilities. It should be noted that not all respondents answered every question in the questionnaire, so totals will not always equal the total number of respondents.

15 This report is available at no cost from the National Renewable Energy Laboratory (NREL) at www.nrel.gov/publications.
Table 1. Number of Facilities Responding to Funding LOI, by Type
Facility Type Number of Facilities
School 112 Wastewater Treatment 70 Water Treatment 42 Communications 36 Healthcare 23 Stormwater Treatment 14 Prison/Correctional Facility 13 Energy Generation 6 Hospital 5 Transportation 5
Wastewater treatment, water treatment, and stormwater treatment facilities total 126 facilities, which is the largest requestor by category type. This is one of the largest areas of potential. Site visits were conducted at six different water and/or wastewater treatment facilities to determine the potential technology applications. Brick Township Municipal Utilities Authority (MUA), located on Highway 88 in West Brick, New Jersey, is one example of a site where a district CHP plant, combined cycle system, fuel cells, and upgrades to switchgear would be applicable.
The Brick MUA water treatment facility is capable of processing up to 20 million gallons of clean drinking water per day. During Hurricane Sandy, the water treatment facility lost power for nine days, but through smart preparation and some backup generation, was able to continue to function. In preparation for the storm, the facility was able to fill all available water storage tanks and use gravity-fed water from the Brick Reservoir to maintain some level of operation. Critical loads of approximately 1,000 kW, which represent an estimated one-fourth of the total facility load, were powered by diesel generators during the outage. This facility has significant electrical loads to operate all of the pumps, but little need for thermal energy. However, the nearby hospital, which is under expansion, could be a beneficial partner for a district CHP plant by purchasing excess energy or by creating their own CHP plant on-site. Otherwise, the water treatment facility would be a good candidate for combined-cycle generation, fuel cells, and upgraded switchgear/controls to improve reliability.
Middlesex County Utilities Authority wastewater treatment facility, located in Sayreville, is the second largest wastewater treatment facility in New Jersey. This facility processes 147 million gallons of wastewater per day, serving approximately 800,000-900,000 people in Middlesex, Summerset, and Union counties. The wastewater treatment facility has two 10-megawatt (MW) combined cycle generators that run on landfill gas, and upgraded switchgear and controls to operate independently from the grid in island mode. The sludge effluent is used as landfill cover and replenishes the landfill. While the treatment facility is designed for high reliability and was able to continue operation during Hurricane Sandy, the pumping stations feeding the facility were not. Several pumping stations (i.e., Greenbrook, South Amboy) failed to operate, resulting in significant overflows of sewage into the watershed. These pumping stations are good opportunities for fuel cells, solar photovoltaic panels with battery systems, combined-cycle, and interconnections to landfill gas for backup generators.

16 This report is available at no cost from the National Renewable Energy Laboratory (NREL) at www.nrel.gov/publications.
Figure 17. Middlesex County Utilities Authority Wastewater treatment facility in Sayreville, New
Jersey Source: Google Earth
The Rahway Valley Sewage Authority wastewater treatment facility serves more than 300,000 residents and 3,500 industrial and commercial customers in 14 communities in central New Jersey. This site currently operates an anaerobic digester to capture the methane gas from the sewage and a CHP system to provide power and process heating. The system and operators have the ability to manually island the site, but require utility power to do so and are in need of upgraded controls and switchgear. During Hurricane Sandy, the site initiated “island mode” prior to the storm and operated off-grid for three days. The current CHP system is relatively new, and significantly oversized with a capacity of 6.2 MW. The facility only has a peak load of 3.2 MW and average load of 1.8 MW. Because the facility used Environmental Infrastructure Trust funding to upgrade the system, there are restrictions on selling the excess power back to the grid. However, a prison located nearby presents a great opportunity for a district power and steam system provided by the excess capacity from Rahway Valley Sewage Authority. This could be an allowable project for funding under the HMGP, but would require coordination between the various entities involved. Site staff has been actively investigating opportunities to better utilize the oversized CHP system and have several ideas to improve system resiliency for their facility and the community, including upgraded controls and power distribution, district power and heat for the nearby prison, a heat exchanger to utilize waste heat for process hot water, and adsorption chillers to use waste heat for cooling.
The Camden County Municipal Utilities Authority (CCMUA) is a good example of a site that is working toward resiliency, despite not being impacted during Hurricane Sandy. The CCMUA has been impacted by severe flooding events and other storms in the area, so energy reliability is of great importance. The CCMUA treats 58 million gallons of sewage per day at two plants: the Delaware No. 1 Water Pollution Control Facility and the Winslow Water Pollution Control Facility. The waste travels through 110 miles of pipe with the assistance of 25 pumping stations. The county is 226 square miles in area, with a population of about 500,000. The site’s treatment facilities are partially gravity fed, which assists with power reduction. The largest concern to the CCMUA is stormwater, which significantly contributes to treatment demands. This is a site that is a good candidate for the separation of stormwater pipes from wastewater pipes into the facility

17 This report is available at no cost from the National Renewable Energy Laboratory (NREL) at www.nrel.gov/publications.
(to reduce the energy used to treat rainwater and runoff during and after storms), heat recovery systems in the dryer process and on the effluent, as well as CHP using biogases, food waste, or sludge from the site. Waste-to-energy options are a natural next step for the facilities.
Hospitals present another area where CHP plants would be beneficial, due to their large thermal demand. Many of the hospitals visited had undergone extensive energy reduction projects through carbon abatement programs or utility incentive programs. JFK Hospital, located in Edison, is a good example where the energy demands have been reduced and where CHP would be a good fit. In every case, energy efficiency measures are encouraged before implementing distributed generation projects because reducing the energy consumption on-site will allow for more appropriate sizing of technologies, and as a result, may reduce costs of the systems being installed.
JFK Hospital recently completed energy efficiency upgrades through the Statewide Carbon Abatement Program. The facility has an approximate electric base load of 3,500 kW and year-round heating and cooling needs. During Hurricane Sandy, the facility lost power for two days. Backup generators burning natural gas and diesel fuel were used to supply 2,000 kW to the critical circuits. However, air conditioning and the majority of ventilation fans were not connected to backup power. Fortunately, the weather conditions during and after the storm were moderate so the building could continue to function without air conditioning and forced air. Within the next year, the facility is working with the electrical utility to upgrade the power service from a 13.2-kilovolt (kV) substation to a 26.4-kV substation located on the opposite side of the facility’s parking lot. This facility would be a good candidate for CHP or tri-generation to provide heating, cooling, and power to improve reliability. The facility staff feels confident in their knowledge of CHP to be able to operate the system without much training or outside support.

18 This report is available at no cost from the National Renewable Energy Laboratory (NREL) at www.nrel.gov/publications.
Figure 18. JFK Hospital in Edison, New Jersey
Source: Google Earth
Energy Resiliency Policy Opportunities There are many technical considerations for integrating alternative energy generation systems with critical facilities; however, there are also some policy opportunities that were uncovered during the site visits. Many different programmatic criteria combine to create a feasible process for implementing alternative energy systems. These criteria may include funding for capital costs, permitting, and a holistic approach to islanding and energy distribution.
Leveraging Funds The economics of renewable energy and energy efficiency technologies are currently characterized by high upfront costs with little, to no, fuel or maintenance expenditures. However, the high upfront cost of renewable energy and energy efficiency technologies can deplete scarce financial resources. This requires widely available and affordable financing to deploy energy investments at scale. While a number of financing and incentive options exist to help overcome the high upfront cost barrier, including grants, tax credits, and other subsidies, these programs are typically limited by annual funding availability.
One tool that is increasingly being considered to finance various energy technologies is the creation and operation of dedicated energy banks. Energy banks, often referred to as “green banks,” or “infrastructure banks,” can be developed in a number of different forms and may offer a more sustainable form of financing assistance by a government or another entity. The Coalition for Green Capital describes the goals of a green bank as two-fold: “[to] increase the amount of clean electricity at competitive prices per state dollar and increase efficiency of consumption to maximize benefits to consumers per state dollar.”
In the United States, examples of green banks can be found both at the federal (e.g., Overseas Private Investment Corporation) and state level—particularly in the Northeastern United States (e.g., Connecticut Clean Energy Finance and Investment Authority, New York City Energy
19 This report is available at no cost from the National Renewable Energy Laboratory (NREL) at www.nrel.gov/publications.
Efficiency Corporation). More information about the formation, roles, and tools of energy banks can be found at:
• The Brookings Institute, “State Clean Energy Finance Banks: New Investment Facilities for Clean Energy Deployment.” www.brookings.edu/~/media/research/files/papers/2012/9/12%20state%20energy%20investment%20muro/12%20state%20energy%20investment%20muro.pdf
• Coalition for Green Capital, “Rooftop Solar PV ‘Green Bank’ Financing Model Now Available.” www.coalitionforgreencapital.com/the-model.html
• Coalition for Green Capital, “What Is a Green Bank.” www.coalitionforgreencapital.com/whats-a-green-bank.html
• Congressman Chris Van Hollen, “Van Hollen Introduces the Green Bank Act of 2009.” http://vanhollen.house.gov/news/documentsingle.aspx?DocumentID=142912
• Connecticut Clean Energy Finance and Investment Authority. www.ctcleanenergy.com/
• National Renewable Energy Laboratory, “Mobilizing Public Markets to Finance Renewable Energy Projects: Insights from Expert Stakeholders.” www.nrel.gov/docs/fy12osti/55021.pdf
• New York City Energy Efficiency Corporation (NYCEEC). www.nyceec.com/
• World Bank, “World Bank Green Bonds.” http://treasury.worldbank.org/cmd/htm/WorldBankGreenBonds.html.
There are many current incentive programs for energy installations and efficient technologies, and there may be opportunities for leveraging existing funding streams to maximize capital funds. For example, the NJ BPU provides incentives for specific technologies, as well as a Hurricane Sandy relief incentive for specific zip codes. These incentives, combined with other state or federal funds, may reduce the overall capital costs of energy generation technologies, if relevant to the applicant. All funding options should be considered to maximize the financing potential within the state in conjunction with a green bank for New Jersey.
Renewable Energy Certificates Renewable energy certificates (RECs),1 also known as green certificates, green tags, or tradable renewable certificates, are tradable commodities in the United States that represent proof of electric energy generation from eligible renewable energy resources (renewable electricity). The RECs that are associated with the electricity produced and are retained by the site remain with the customer-generator. If, however, the customer chooses to receive financial compensation for the net excess generation remaining after a 12-month period, the utility will be granted the RECs associated with only that surplus they purchase. Currently, New Jersey has one of the most aggressive renewable portfolio standards (RPS) in the United States, and therefore, there is a
1 For a description of renewable energy certificates, see http://apps3.eere.energy.gov/greenpower/markets/ certificates.

20 This report is available at no cost from the National Renewable Energy Laboratory (NREL) at www.nrel.gov/publications.
very good REC market. The DSIRE2 website provides a good summary of the renewable portfolio standard in New Jersey:
New Jersey's renewable portfolio standard (RPS)—one of the most aggressive in the United States—requires each supplier/provider serving retail customers in the state to procure 22.5% of the electricity it sells in New Jersey from qualifying renewables by 2021 (“energy year” 2021 runs from June 2020-May 2021). In addition, the standard also contains a separate solar specific provision, which requires suppliers and providers to procure at least 4.1% of sales from qualifying solar electric generation facilities by energy year 2028.
Net Metering Net metering is an electricity policy for consumers who own renewable energy systems. Under net metering, a system owner receives retail credit for at least a portion of the electricity it generates. As part of the Energy Policy Act of 2005, under Section 1251, all public electric utilities are required upon request to make net metering available to their customers:3
(11) NET METERING.—Each electric utility shall make available upon request net metering service to any electric consumer that the electric utility serves. For purposes of this paragraph, the term ‘net metering service’ means service to an electric consumer under which electric energy generated by that electric consumer from an eligible on-site generating facility and delivered to the local distribution facilities may be used to offset electric energy provided by the electric utility to the electric consumer during the applicable billing period.
New Jersey's net metering law, which took effect in 1999 and was significantly expanded in 2004, requires utilities to offer net metering to all customers with PV, solar thermal electric, wind, geothermal electric, wave, tidal, biomass, landfill gas, anaerobic digestion, and fuel cell systems. There is no system capacity limit in New Jersey, but the system size cannot exceed the customer’s annual on-site energy use.
In July 2012, New Jersey started to develop rulemaking to allow public entities to engage in “net metering aggregation” of solar systems, and as a result, enacted S.B. 1925. It requires the BPU to develop rules within 270 days to require electric utilities to allow public entities, such as state and local governments, local agencies, and school districts, to engage in "net metering aggregation" of solar facilities. In order to qualify for net metering aggregation, the solar facility must be on property owned by the customer, be owned by the single customer, and with the exception of state entities, be located within the customer's territorial jurisdiction. For state entity projects, all facilities must be located within five miles of one another. In addition, for all customers, all facilities must be located within the territory of the same electric utility, be served by the same basic generation service provider or electric power supplier, and all facilities must be within the same customer class of the applicable electric utility tariff. The law also outlines
2 For a full description of the renewable portfolio standard in New Jersey, see http://www.dsireusa.org/incentives/incentive.cfm?Incentive_Code=NJ05R&re=0&ee=0. 3 Energy Policy Act of 2005, Title XII—Electricity, Subtitle E—Amendments to PURPA, Section 1251— Net Metering and Additional Standards. http://www.gpo.gov/fdsys/pkg/PLAW-109publ58/pdf/PLAW-109publ58.pdf.
21 This report is available at no cost from the National Renewable Energy Laboratory (NREL) at www.nrel.gov/publications.
certain other requirements and procedures for net metering aggregation. A rulemaking will be necessary to implement the new provisions of the law.
Permitting and Policies One of the constraints of microgrids is the ability to operate within an islanded mode where alternative energy generation systems exist. New Jersey is ranked third in the nation in terms of the total number of solar panels installed. According to Solar New Jersey, as of May 31, 2013, more than 22,000 solar PV systems had been installed in the state, totaling over 1,000 MW. Many of the solar PV systems were not able to operate during Hurricane Sandy due to the lack of dynamic controls or transfer switches.
One example of this issue was experienced by the Atlantic County Utilities Authority (ACUA). ACUA has approximately 250 staff and an operating budget of $64 million per year. It operates a 40-million gallon/day wastewater treatment plant, a regional sewage collection system, a landfill, recycling center, composting facility, a waste transfer station, a vehicle maintenance center, and a recycling and trash collection service. The ACUA sewerage system services 14 municipalities within Atlantic County. The waste disposal system includes an 800-ton/day landfill and serves 100,000 homes and businesses in the county. The ACUA has innovative processes, and is considering even more innovative systems for renewable energy and energy conservation.
ACUA constructed the first wind farm in Atlantic City, has a 500-kW solar PV project and landfill gas-to-electricity project, and operates the state’s largest biodiesel fleet with the first public compressed natural gas station in the southern part of the state. The wastewater treatment facility in Atlantic City is situated next to the wind farm, which is composed of five 1.5-MW wind turbines. During the hurricane, the site was required to shut down the wind turbines, which is a common practice during hurricane-level winds. Due to the constraints of the interconnection agreement with the local utility, Atlantic City Electric, the site was unable to reconnect the wind turbines directly after the hurricane to operate without grid electricity. If the ACUA had been able to operate in island mode directly after the hurricane, the water treatment facility would have been much better equipped to deal with sewage treatment demands at that time.
Another example where there is a potential for larger-scale collaboration is at Richard Stockton College in Galloway. This college is a good candidate for installing advanced controls on the 1.9 MW of PV on-site so that the energy generated by the PV system could be utilized during grid outages. The site is also very interested in CHP, implementing more ground-source heat-pump systems, installing more PV, and the potential to sell energy to the four nearby public elementary and high schools located across the highway to the southeast.
While the Atlantic County Office of Emergency Management requested that the sports center on campus be put on standby to receive evacuees from Atlantic City, the sports center was not utilized for this purpose during Hurricane Sandy. The school requested that campus residents leave the campus before the storm, which eased the burden of providing food and shelter under emergency conditions. The campus experienced minimal energy outages and damage during Hurricane Sandy and was out of electricity for approximately 13.5 hours.
The storm provided insight into the fact that the site needs to strengthen their emergency power generation systems because they were very low on fuel supplies even after only being out of
22 This report is available at no cost from the National Renewable Energy Laboratory (NREL) at www.nrel.gov/publications.
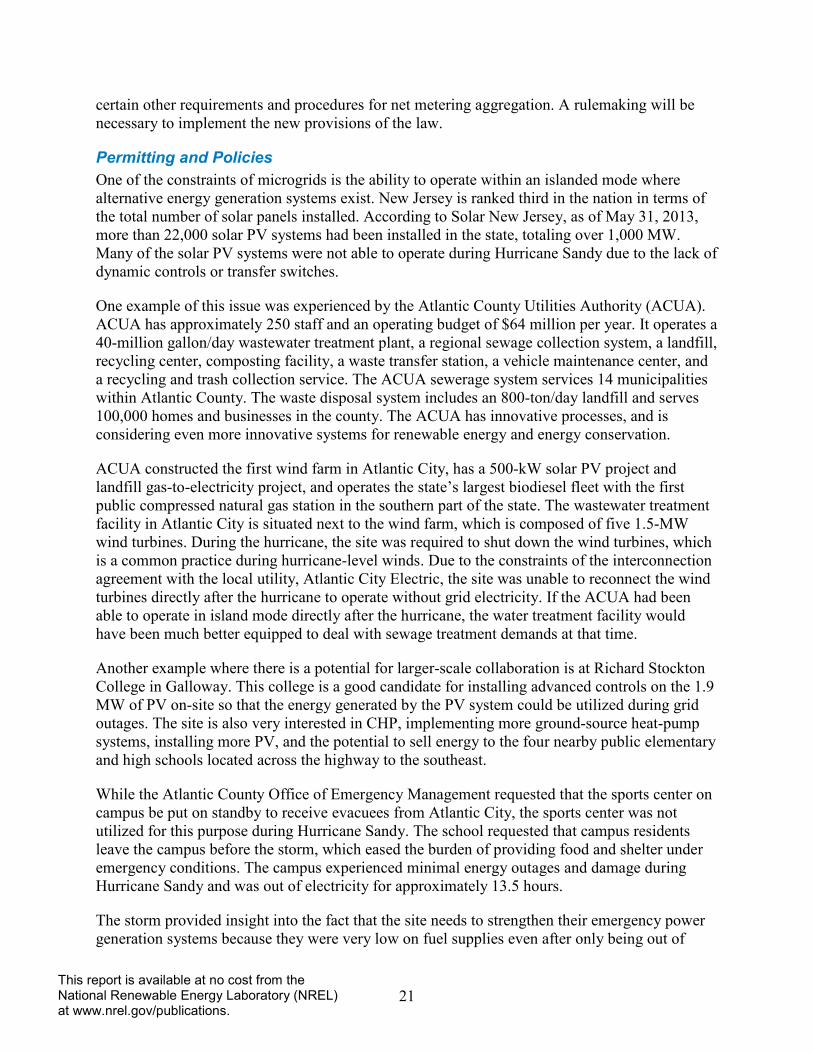
power for 13.5 hours. There have been other significant storms as recent as the derecho in June 2012 that have caused significant energy outages and damage. The campus currently houses approximately 2,500 students, and the school has a public AtlantiCare hospital on site, approximately one mile to the south of the main campus, as shown in Figure 19. Therefore, the site could potentially serve as a disaster relief center because of the housing facilities and hospital on-site. AtlantiCare is also installing a CHP system to service a new addition, as discussed below. This would be an ideal time for the college and the hospital to discuss sharing energy generation and consumption between the sites.
Figure 19. Richard Stockton College and surrounding AtlantiCare Hospital and schools
Source: Google Earth
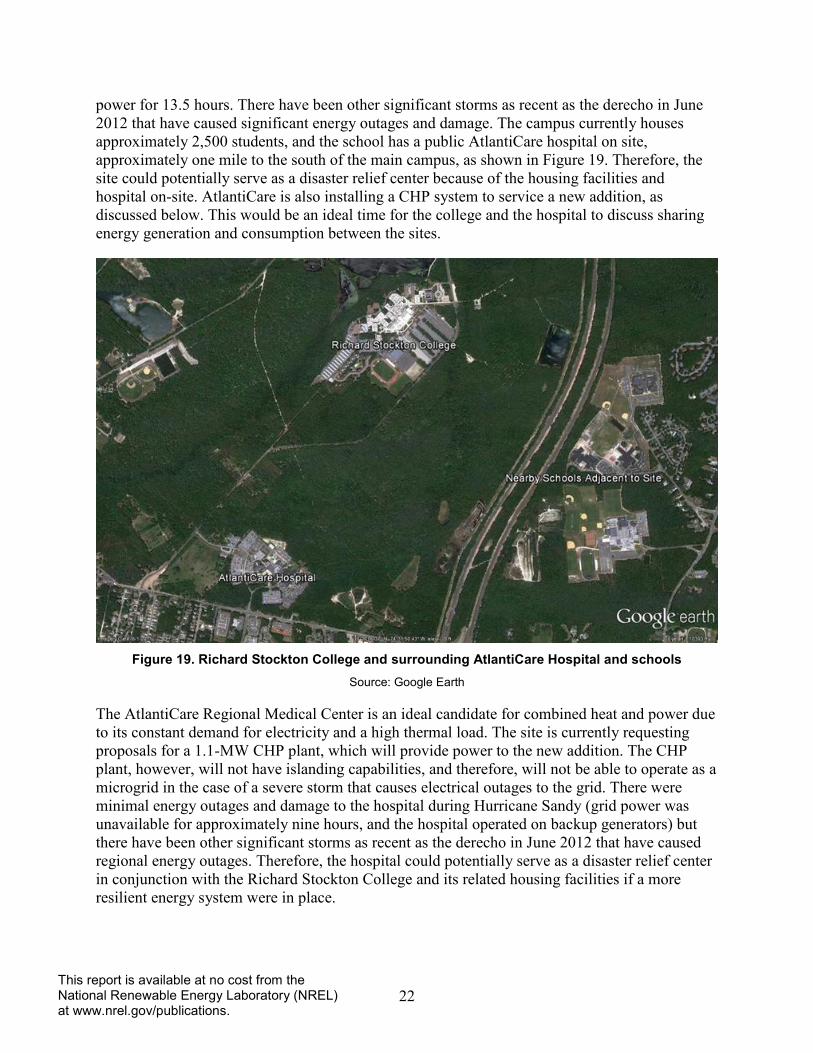
The AtlantiCare Regional Medical Center is an ideal candidate for combined heat and power due to its constant demand for electricity and a high thermal load. The site is currently requesting proposals for a 1.1-MW CHP plant, which will provide power to the new addition. The CHP plant, however, will not have islanding capabilities, and therefore, will not be able to operate as a microgrid in the case of a severe storm that causes electrical outages to the grid. There were minimal energy outages and damage to the hospital during Hurricane Sandy (grid power was unavailable for approximately nine hours, and the hospital operated on backup generators) but there have been other significant storms as recent as the derecho in June 2012 that have caused regional energy outages. Therefore, the hospital could potentially serve as a disaster relief center in conjunction with the Richard Stockton College and its related housing facilities if a more resilient energy system were in place.
23 This report is available at no cost from the National Renewable Energy Laboratory (NREL) at www.nrel.gov/publications.
Figure 20. AtlantiCare Hospital
Source: Google Earth
Financial Considerations of Distributed Generation Technologies The state of New Jersey may decide to provide funds through a green bank depending on the type of technology and the costs associated with the technology. The Open Energy Information (OpenEI) website4 is a valuable resource when comparing various distributed generation technologies, including renewables. The OpenEI website is set up to share information and provides the most current energy-related material and data provided by users and reviewed by energy experts.
Figures 21-25 are from OpenEI, and show economic metrics for distributed generation technology, including: levelized cost of energy, capital cost, fixed operating costs, variable operating costs, and capacity factor. It is important to note that a key component of using distributed generation, including renewable energy, in disaster situations is proper controls and islanding. These controls and equipment have added costs and will likely result in costs on the higher ends of the range presented below. In reviewing the following graphs, it is helpful to understand how costs are being defined:
• The levelized cost of energy (LCOE) is defined as the projected total electricity cost, including payback of initial investment and operating costs. It could also be defined as the price at which a plant must sell electricity in order to break even financially. Calculations in the charts below include assumptions for discount rate (7%) and tax rate (39.2%).
4 For more information, see http://en.openei.org/wiki/Main_Page.
24 This report is available at no cost from the National Renewable Energy Laboratory (NREL) at www.nrel.gov/publications.
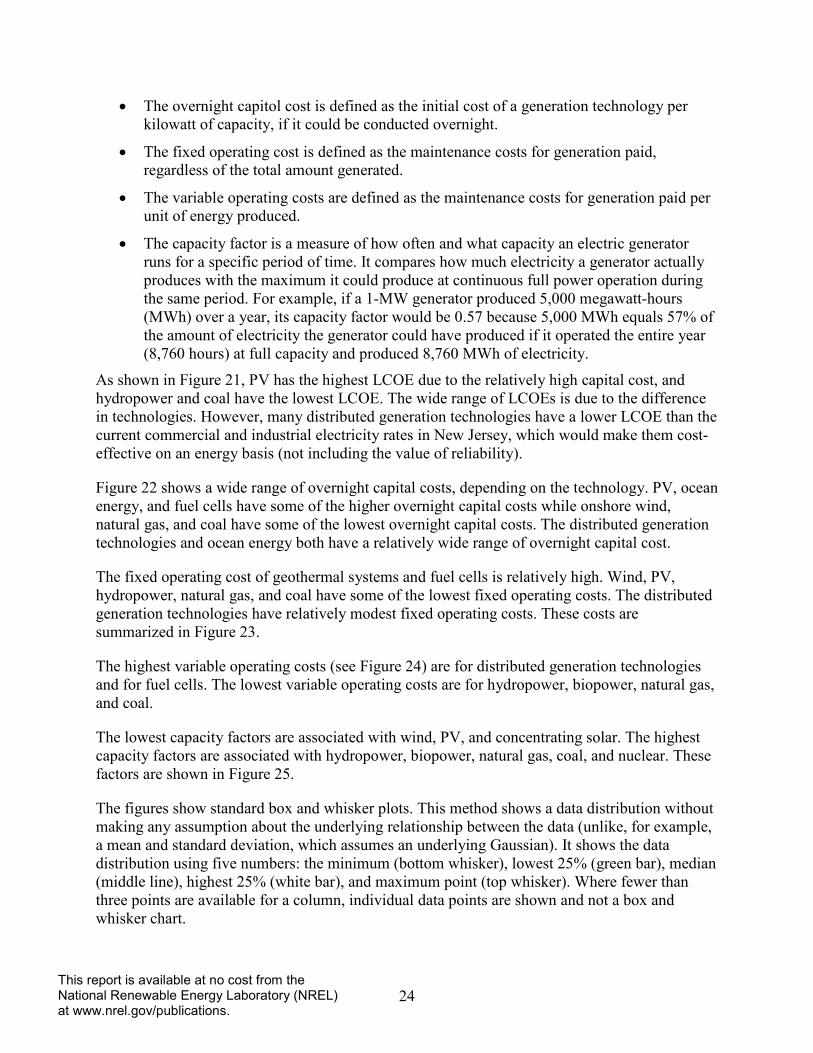
• The overnight capitol cost is defined as the initial cost of a generation technology per kilowatt of capacity, if it could be conducted overnight.
• The fixed operating cost is defined as the maintenance costs for generation paid, regardless of the total amount generated.
• The variable operating costs are defined as the maintenance costs for generation paid per unit of energy produced.
• The capacity factor is a measure of how often and what capacity an electric generator runs for a specific period of time. It compares how much electricity a generator actually produces with the maximum it could produce at continuous full power operation during the same period. For example, if a 1-MW generator produced 5,000 megawatt-hours (MWh) over a year, its capacity factor would be 0.57 because 5,000 MWh equals 57% of the amount of electricity the generator could have produced if it operated the entire year (8,760 hours) at full capacity and produced 8,760 MWh of electricity.
As shown in Figure 21, PV has the highest LCOE due to the relatively high capital cost, and hydropower and coal have the lowest LCOE. The wide range of LCOEs is due to the difference in technologies. However, many distributed generation technologies have a lower LCOE than the current commercial and industrial electricity rates in New Jersey, which would make them cost-effective on an energy basis (not including the value of reliability).
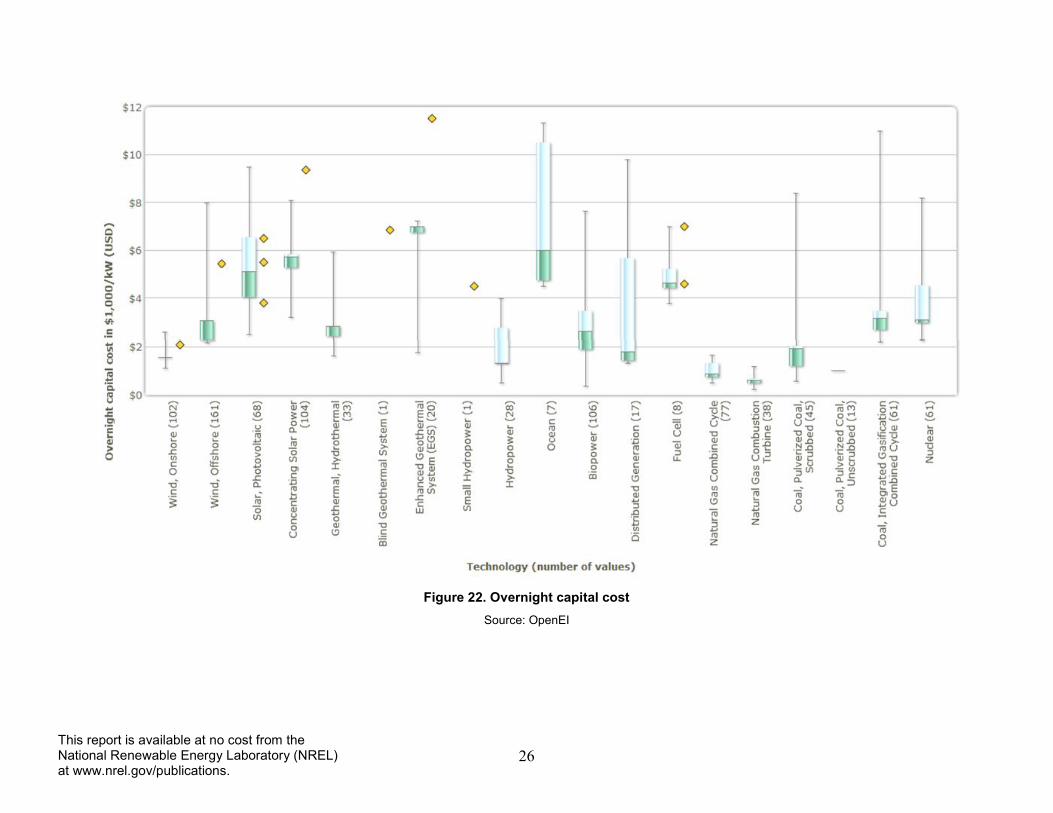
Figure 22 shows a wide range of overnight capital costs, depending on the technology. PV, ocean energy, and fuel cells have some of the higher overnight capital costs while onshore wind, natural gas, and coal have some of the lowest overnight capital costs. The distributed generation technologies and ocean energy both have a relatively wide range of overnight capital cost.
The fixed operating cost of geothermal systems and fuel cells is relatively high. Wind, PV, hydropower, natural gas, and coal have some of the lowest fixed operating costs. The distributed generation technologies have relatively modest fixed operating costs. These costs are summarized in Figure 23.
The highest variable operating costs (see Figure 24) are for distributed generation technologies and for fuel cells. The lowest variable operating costs are for hydropower, biopower, natural gas, and coal.
The lowest capacity factors are associated with wind, PV, and concentrating solar. The highest capacity factors are associated with hydropower, biopower, natural gas, coal, and nuclear. These factors are shown in Figure 25.
The figures show standard box and whisker plots. This method shows a data distribution without making any assumption about the underlying relationship between the data (unlike, for example, a mean and standard deviation, which assumes an underlying Gaussian). It shows the data distribution using five numbers: the minimum (bottom whisker), lowest 25% (green bar), median (middle line), highest 25% (white bar), and maximum point (top whisker). Where fewer than three points are available for a column, individual data points are shown and not a box and whisker chart.

25 This report is available at no cost from the National Renewable Energy Laboratory (NREL) at www.nrel.gov/publications.
Figure 21. Levelized cost of energy by technology type
Source: OpenEI
26 This report is available at no cost from the National Renewable Energy Laboratory (NREL) at www.nrel.gov/publications.
Figure 22. Overnight capital cost
Source: OpenEI

27 This report is available at no cost from the National Renewable Energy Laboratory (NREL) at www.nrel.gov/publications.
Figure 23. Fixed operating cost
Source: OpenEI

28 This report is available at no cost from the National Renewable Energy Laboratory (NREL) at www.nrel.gov/publications.
Figure 24. Variable operating cost
Source: OpenEI

29 This report is available at no cost from the National Renewable Energy Laboratory (NREL) at www.nrel.gov/publications.
Figure 25. Capacity factor
Source: OpenEI

30 This report is available at no cost from the National Renewable Energy Laboratory (NREL) at www.nrel.gov/publications.
Conclusions Hurricane Sandy had significant impacts on the state of New Jersey, leaving millions without power over the course of a two-week period. The number of applicants requesting energy generation systems through the HGMP indicates a need for backup energy generation to increase resiliency throughout the state.
The questionnaire conducted as part of this assessment reviewed the energy needs of critical infrastructure, and identified state-wide opportunities for more resilient distributed generation systems that can operate in parallel with the grid during normal operation and isolate (island) critical facilities with on-site energy generation during grid outages. In addition, several site visits indicated the potential for market uptake and applicability of technologies that will allow for independent operation in future disasters. It is evident that smart financing and design can assist New Jersey in utilizing funding from the Hurricane Sandy Relief Bill (H.R. 41, 2013) to create projects that will not only improve the resiliency of the energy system during disaster events and reduce critical facility energy demand and operating costs during normal operating conditions, but will also assist the state in achieving the goals established in the current New Jersey Energy Master Plan.
31 This report is available at no cost from the National Renewable Energy Laboratory (NREL) at www.nrel.gov/publications.
Bibliography A. Elgowainy, M. Wang. Fuel Cycle Comparison of Distributed Power Generation Technologies. ANL/ESD/08-4. Chicago, Illinois: Argonne National Laboratory, November, 2008.
B. Kroposki, R. Lasseter, T. Ise, S. Morozumi, S. Papathanassiou, and N. Hatziargyriou. “A Look at Microgrid Technologies and Testing Projects from Around the World.” IEEE Power and Energy Magazine, May 2008.
“Fuel Cells.” U.S. Department of Energy, Renewable Energy & Energy Efficiency, 2010. Accessed July 8, 2013: http://www1.eere.energy.gov/hydrogenandfuelcells/fuelcells/index.html.
J. Giraldez. Energy Security: Microgrid Planning and Design. NREL/PR 7A30-54985. Presented at the World Renewable Energy Forum, May 2012.
P. Garland, B. Slattery. “Combined Heat and Power for Energy Resource Optimization.” Washington, DC: Federal Energy Management Program, February 2013. Accessed July 15, 2013: http://www1.eere.energy.gov/femp/pdfs/fft_chp_handouts.pdf.
S. Ong, P. Denholm, and E. Doris. The Impacts of Commercial Electric Utility Rate Structure Elements on the Economics of Photovoltaic Systems. NREL/TP-6A2-46782. Golden, CO: National Renewable Energy Laboratory, June 2010.
Southern California Gas Company. “Absorption Chillers Guideline.” New Buildings Institute, November, 1998.
“Transparent Cost Database.” Open Energy Information, undated. Accessed July 8, 2013: http://en.openei.org/wiki/Transparent_Cost_Database.
Z. Ye, R. Walling, N. Miller, P. Du, K. Nelson. Facility Microgrids. NREL/SR-560-38019. Golden, CO: National Renewable Energy Laboratory, May 2005.

32 This report is available at no cost from the National Renewable Energy Laboratory (NREL) at www.nrel.gov/publications.
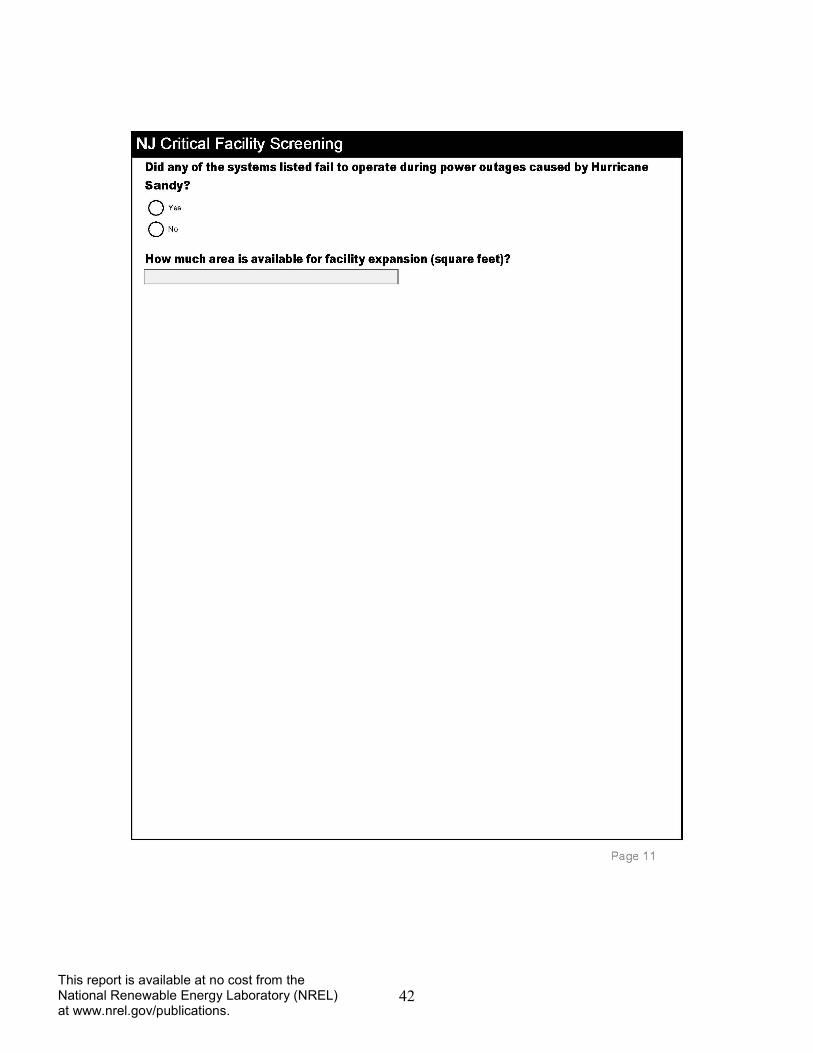
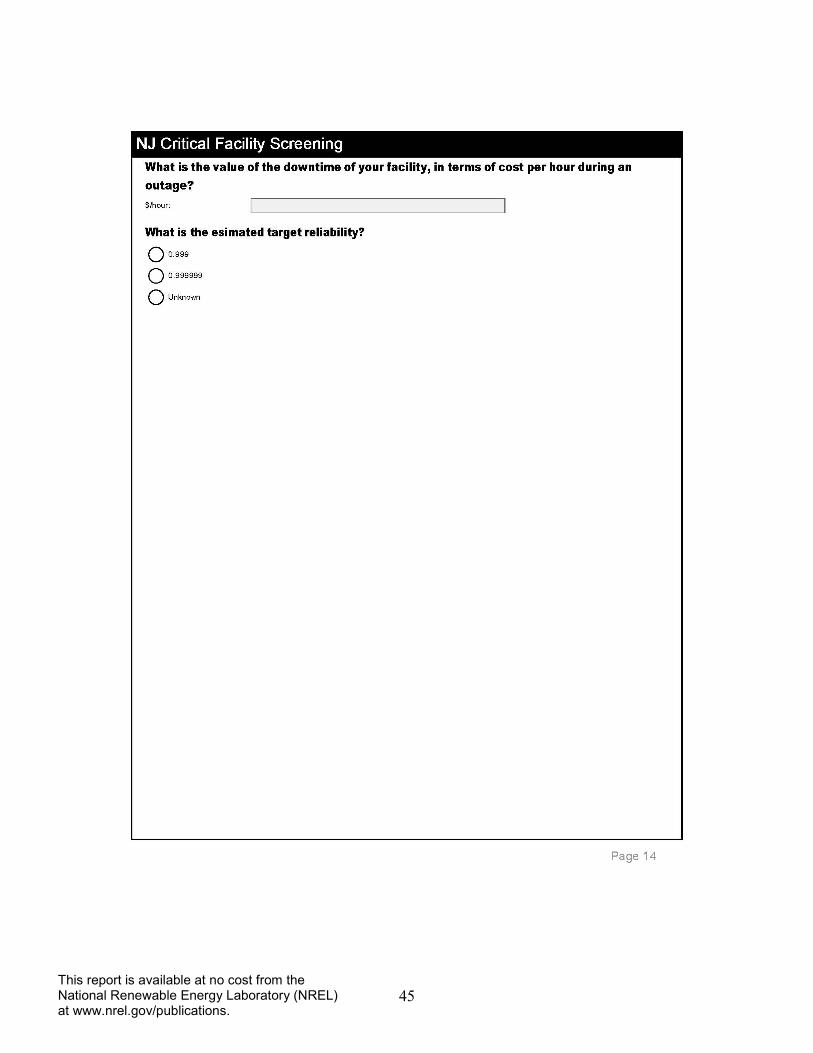
Appendix: Critical Infrastructure Questionnaire

33 This report is available at no cost from the National Renewable Energy Laboratory (NREL) at www.nrel.gov/publications.

34 This report is available at no cost from the National Renewable Energy Laboratory (NREL) at www.nrel.gov/publications.

35 This report is available at no cost from the National Renewable Energy Laboratory (NREL) at www.nrel.gov/publications.

36 This report is available at no cost from the National Renewable Energy Laboratory (NREL) at www.nrel.gov/publications.

37 This report is available at no cost from the National Renewable Energy Laboratory (NREL) at www.nrel.gov/publications.

38 This report is available at no cost from the National Renewable Energy Laboratory (NREL) at www.nrel.gov/publications.

39 This report is available at no cost from the National Renewable Energy Laboratory (NREL) at www.nrel.gov/publications.

40 This report is available at no cost from the National Renewable Energy Laboratory (NREL) at www.nrel.gov/publications.
41 This report is available at no cost from the National Renewable Energy Laboratory (NREL) at www.nrel.gov/publications.
42 This report is available at no cost from the National Renewable Energy Laboratory (NREL) at www.nrel.gov/publications.

43 This report is available at no cost from the National Renewable Energy Laboratory (NREL) at www.nrel.gov/publications.

44 This report is available at no cost from the National Renewable Energy Laboratory (NREL) at www.nrel.gov/publications.
45 This report is available at no cost from the National Renewable Energy Laboratory (NREL) at www.nrel.gov/publications.

46 This report is available at no cost from the National Renewable Energy Laboratory (NREL) at www.nrel.gov/publications.