alternative control technology document for bakery …infohouse.p2ric.org/ref/26/25044.pdf · -i...
TRANSCRIPT

United States Office ot Air Quelity EPA 45WR-92-01? Environmental Protection Planning end Stendards December 1992 Agency Research Tnangie Perk NG 2771 1
Air
Alternative Control Technology Document for Bakery Oven Emissions
4
J


- . TECHNICAL REPORT DATA
(Plcorc read lnstnrctlons on the reverse before cotnplettng) , REPORT NO. 12. 13. REC!PIENT'S ACCESSION NO.
El - . TI
AUTHORW 8. PERFORMING ORGANIL.ITION REPORT h(0
C. Wally Sanford
Research Triangle Institute Post Office Box 12194
- '10. PROGRAM E L C M E N T NO.
11. CONTRACTlGRANT NO.
PERPORMING O R G A N I Z A T I O N NAME A N D AOORESS
Research Triangle Park, NC 27709-2194 I
168-D1-011'8
I-NSORING AGENCY N A M E A N 0 AOORESS 113. TYPE OF REPORT A N D PERIOD COVERED Office of Air Quality Planning and Standards US Environmental Protection Agency Research Triangle Park, NC 27711
I 5. SUPPLEMENTARY NOTES
8. ABSTRACT
This document was produced in response to a request by the baking industry for Federal guidance to assist in providing a more uniform information base for State decision-making with regard to control of bakery oven emissions. The information in the document pertains to bakeries that produce yeast-leavened bread, rolls, buns, and similar products but not crackers, sweet goods, or baked foodstuffs that are not yeast leavened. Information on the baking processes , equipment , operating parameters potential emissions from baking, and potential emission control options are presented Catalytic and regenerative oxidation are identified as the most appropriate existing control technologies applicable to VOC emissions from bakery ovens. for catalytic and regenerative oxidation are included. A predictive formula for use in estimating oven emissions has been derived from source tests done in junction with the development of this document. Its use.and applicability are described.
Cost analyses
7. KEY WORDS A N 0 DOCUMENT ANALYSIS
DESCRIPTORS \b.lDENTIFIERS/OPEN E N O E O T E R M S IC. COSATI Field Group
Bakery catalytic oxidation oven regenerative oxidation emissions dough formula baker's percent predictive formula fermentation time VOC controls e thano 1 I
8. OISTR18UTION STATEMENT 19. SECURITY CLASS /T/trs Repurr, 2 1 NO OF ? A G E S
Unclassified I 105 L 20. SECURITY CLASS ~T/rrspoge/ 22. PRICE
Release Unlimited Unclassified CPA f.rCn 2220-1 (Rev. 4-77) P R C V I O U S C O I T I O N I S ODSOLCTF.


- I
EPA-453IR-92-017
Alternative Control Technology Document
~
Bakery for
Oven Emissions
Emission Standards Division
US. ENVIRONMENTAL PROTECTION AGENCY Office of Air and Radiation
Omce of Air Quality Planning and Standards Research Triangle Park, North Carolina 27711
December 1992

- .

- -
ALTERNATIVE CONTROL TECHNOLOGY DOCUMENTS
This report is issued by the Emission Standards Division, Office of Air Quality Planning and Standards, U . S . Environmental Protection Agency, to provide information to State and local air pollution control agencies. Mention of trade names or commercial products is not intended to constitute endorsement or recommendation for use. Copies of this report are available - as supplies permit - from the Library Services Office (MD-35), U . S . Environmental Protection Agency, Research Triangle Park, North Carolina 27711, or for a nominal fee, from the National Technical Information Service, 5285 Port Royal Road, Springfield, Virginia . 22161.
ii

e

. .
TABLE OF CONTENTS
Section 1.0 INTRODUCTION 1-1
1.1 Objectives 1-2 1.2 Overview of the Bakery Industry . . . . . . . . . . 1-2 1.3 Contents of this Document . . . . . . . . . . . . . 1-4 1.4 References . . . . . . . . . . . . . . . . . . . . . 1-6
. . . . . . . . . . . . . . . . . . . . .
2.0 INDUSTRY DESCRIPTION. PROCESSES. AND EMISSIONS . . . . . 2-1 2.1 Industry Description . . . . . . . . . . . . . . . . 2-1 - ~ . ~ ~ ~ i i i t Operations . . . . . . . . . . . . . . . . . . 2-2
2.2.1 Dough Processes . . . . . . . . . . . . . . . 2-2 2.2.2 Equipment . . . . . . . . . . . . . . . . . . 2-8' 2.2.3 Operating Parameters . . . . . . . . . . . . 2-14
2.3 Air Emissions . . . . . . . . . . . . . . . . . . . 2-15 2.3.1 Emission Sources . . . . . . . . . . . . . . 2-16 2.3.2 Emission Stream Characteristics . . . . . . . 2-16
2.4 Summary of Current Air Emission Regulations . . . . 2-21
2.4.3 New Jersey . . . . . . . . . . . . . . . . . 2-22 2.4.4 Other Areas . . . . . . . . . . . . . . . . . 2-22 2.4.5 Prevention of Significant Deterioration . . . 2-22 2.4.6 New Source Review . . . . . . . . . . . . . . 2-23 2 .4 .7 Monitoring and Enforceability . . . . . . . . 2-23
2.5 References 2-25
2.4.1BMQMD e 2-21 2.4.2 SCAQMD 0 . . 2-21
. . . . . . . . . . . . . . . . . . . . . 3.0 VOC EMISSION CONTROL DEVICES . . . . . . . . . . . . . . 3-1
3.1 Combustion Control Devices . . . . . . . . . . . . . 3-1 3.1.1 Direct Flame Thermal Oxidation . . . . . . . 3-1 3.1.2 Regenerative Oxidation . . . . . . . . . . . 3-2
3-4 3 . 2 Noncombustion Control Devices . . . . . . . . . . . 3-6
3.2.1 Carbon Adsorption . . . . . . . . . . . . . . 3-6 3.2.2 Scrubbing . . . . . . . . . . . . . . . . . . 3-7 3.2.3 Condensation 3-8 3.2 .4 Biofiltration . . . . . . . . . . . . . . . . 3-9 3.2.5 Process and Formulation Changes . . . . . . . 3-10
3.3 References 3-12 . . . . . . . . . . . . . . . . . . . . .
3 . 1 . 3 Catalytic Oxidation . . . . . . . . . . . . .
. . . . . . . . . . . . . . . .
4.0 IMPACT ANALYSIS OF ALTERNATIVE CONTROL TECHNIQUES . . . 4-1 4.1 Model Ovens and VOC Emissions . . . . . . . . . . . 4-1
4.1.1 VOC Emission Factors . . . . . . . . . . . . 4-3 4.1.2 Oven Type and Number of Stacks . . . . . . . . 4-3 4.1.3 Oven Heat Input . . . . . . . . . . . . . . . 4-4
iii

Section
4.2 4.3 4.4 4.5
TABLE OF CONTENTS
pasle
4.1.4 Oven Operating Time . 4.1.5 Control Devices . . 4.1.6 Flow Rates . . . . . . 4.1.7 Bread Production . . . 4.1.8 Destruction Efficiency
Costing Methodology General As Cost Analysis . . . . . Cost Effectiveness . . . . . . References . . . . . . . . . .
. . . - 0 .
- 0 . . . . . . . sumpti
0 . . . . . 0 . .
0 . 0 . . . . 4-4 . . . . . . 0 4-5 . . . . . . . 0 4-5 . 0 0 . . . . 4-5 . 0 . . . . 0 4-5 .ons . . . . 4-6 . 4-6
4-6 . . . . . . . 0 4 - 1 4
iv

LIST OF TABLES
2-1 Representative White Pan Bread Formula . . . . . 2-3
4-1 Modelovens . . . . . . . . . . . . . . . . . 4-2
4-2a Cost of Catalytic Oxidation . . . . . . . . . 4-7
4-2b Cost of Regenerative Oxidation . . . . . . . . . 4-8
- 4 4 a Cost Effectiveness of Catalytic Oxidation at BgkeryOvens. . . . . . . . . . . . . . . 4-9
Cost Effectiveness of Regenerative Oxidation at Bakery Ovens . . . . . . . . . . . . 4-10
4-3b
V


Numbez
2-1
2-2
2-3
3-1
3-2
4-1 - - - .
4-2
(03
LIST OF FIGURES
Tunnel Oven . . . . . . . . . . . . . . . . . . . 2-10
Single-Lap Oven . . . . . . . . . . . . . . . . . 2-12
spiral Oven . . . . . . . . . . . . . . . . . . . 2-13
Regenerative Oxidation . . . . . . . . . . . . . 3-3
Catalytic Oxidation . . . . . . . . . . . . . . . 3-5
Cost Effectiveness of Catalytic Oxidation on Bakery Ovens . . . . . . . . . . . . . . . . . . 4-11
Cost Effectiveness df Regenerative Oxidation on Bakery Ovens . . . . . . . . . . . . . . . . . . 4-12
vi

.

- -
APPENDICES
Bmendiy
A
B
-- - c ___
D
E
Tables Referenced in Section 2.1 Industry
A-1 Number of Bakeries by Product Category
A-2 Top 100 Regional Contribution To Sales . . . . A-3 Plants by Bakery Type , Region, and State
Description . . . . . . . . . . . . . . . . . . . A-1 and Number of Employees . . . . . . . . . . . A-3
A-5 A-11 . .
. . . . . . . . . . . B-l Bakery Oven Test Results’. . Example Calculations of Cost Analysis . . . . . . C-i OAQPS Control Cost Analysis for Catalytic
Incinerators C-2 . . . . . . . . . . . . . . . . . OAQPS Control Cost Analysis for Regenerative Incinerators . . . . . . . . . . . . . . . . . c-7
BAAQMD Regulation 8 Rule 42 D-1
E-1 . . . . . . . . . . .
SCAQMD Rule 1153 . . . . . . . . . . . . . . . . .
vii

1.0 INTRODUCTION
The Clean Air Act Amendments (CAAA) of 1990 established new requirements for State implementation plans (SIP) for many areas that have not attained the national ambient air quality standards (NAAQS) for ozone. These requirements include an expansion of the applicability of reasonably available control technology (RACT) to sources of volatile organic compounds (VOC) smaller than those previously covered by the U . S . Environmental Protection Agency (EPA). They also require that certain nonattainment areas reduce VOC emissions below the existing RACT
requirements to ensure continual progress toward attainment of the ozone NAAQS. In addition, certain areas require a demonstration through atmospheric dispersion modeling that VOC
emission reductions will produce ozone concentrations consistent with the ozone NAAQS.
could be used to help meet these and other requirements, the 1990 Amendments also require EPA to publish alternative control technology (ACT) documents for a variety of VOC sources. This document was produced in response to a request by the baking hdustry for Federal guidance to assist in providing a more uniform information base for State decision-making. information in this document pertains to bakeries that produce bread, rolls, buns, and similar products, but not those that produce crackers, pretzels, sweet goods, or baked foodstuffs that are not yeast-leavened. In this document, bread refers to yeast- leavened pan bread, rolls, buns, or similar yeast-leavened products unless otherwise noted.
*
~
To help the States identify the kinds of VOC control that
The
1-1

- -
1.1 OBJECTIVES
One objective of this document is to provide information on the baking process, potential emissions from baking, and potential emission control options for use by State and local air pollution control agencies in their analysis of new and existing bakeries. effectiveness of controls for each oven in their area and comparing to other facilities or industries to judge where money might be spent'most wisely to lower emissions in the air shed. Another important objective of this document is to provide a predictive equation similar to an existing industry-derived equation (described in Section 1.2), but for total VOC, using recently gathered emission test data.
This can be accomplished by identifying the cost
- __ __ - .-
1.2 OVERVIEW OF THE BAKERY INDUSTRY
About 600 large commercial bakeries produce breadstuffs in the United States.' Because bread is perishable and delays in distribution to retail outlets are undesirable, bakeries are usually located in or near population centers. Because population correlates with vehicular travel and other VOC emission sources, bakeries are frequently located in ozone nonattainment areas.
About 23 bakery ovens in the United States currently have emission control devices installed.' Some of these are located in States or districts that have rules specific to bakeries (such as California's Bay Area and South Coast). bakery ovens are located in ozone nonattainment areas where RACT
is required for major stationary sources, in ozone attainment areas subject to prevention of significant deterioration (PSD) review, or at bakeries electing to control VOC emissions for other reasons.
The other controlled
The primary VOC emitted from bakery operation is ethanol. In yeast-leavened breads, yeast metabolizes sugars in an
1-2

- -
anaerobic fermentation, producing carbon dioxide that is largely responsible for causing the bread to rise. dioxide, equimolar amounts of ethanol and small amounts of other alcohols, esters, and aldehydes are produced.
The primary emission source at a bakery is the oven. Because the ethanol produced by yeast metabolism is generally liquid at temperatures below 77OC (170OF) , it is not emitted in appreciable amounts until the dough is exposed to high temperatures in the oven. Although high concentrations of VOC
exist in the proof boxes that are often used to raise the panned dough, the low airflow through those boxes minimizes emissions.
recent development. Three major studies, detailed in Section 2.3.2, have been conducted to establish an emission factor for quantifying VOC emissions from bakeries.
Volatile Oreranic Gases, was conducted in 1977 under an EPA contract.' bread for straight dough and 11.2 lb/ton of bread for sponge dough.
Management District (BAAQMD) in San Francisco.' After early tests showed that ethanol was the primary VOC emitted, a total of 16 ovens were tested using aqueous impingers and gas chromatography/flame ionization. Ethanol emissions were calculated to range from 0.6 to 14.0 lb/ton of bread.'
Baking (AIB) .' of emission factors resulting from the BAAQMD study and to provide a mathematical model f o r predicting ethanol emissions from bakeries. Statistical analysis suggested that the factors correlating best with ethanol emissions were yeast concentration and total fermentation time, and that the relationship was described as:
Besides the carbon
-
____ -
The regulation of VOC emissions from bakery ovens is a
The first, A Commerci
Ethanol emissions were calculated as 1.0 lb/ton of
The second study was performed by the Bay Area Air Quality
The third study was performed by the American Institute of This study was intended to explain the wide range
1-3
k

EtOH = 0.40425 + 0.444585 (Yt)
EtOH = pounds ethanol per ton of baked bread Y = baker's percent yeast t = total time of fermentation
where
This formula includes a little known correction for the addition of spiking yeast where:
and ~ Yt = (Yi x ti) + (S x t,)
Yi = baker's percent yeast in sponge
___ - - - -- ti = total time of fermentation in hours S t, = proof time + floor time
= baker's percent yeast added to dough
The "percent yeast in sponge" and "percent yeast added to dough" are in terms of baker's percent of yeast to the nearest tenth of a percent. The "total time of fermentationt' and "proof time + floor time" are the fermentation times in hours to the nearest tenth of an hour.
1.3 CONTENTS OF THIS DOCUMENT
Typical bakery processes, equipment, operating parameters, emission sources, emission stream characteristics, emission estimates, techniques for determining emissions and regulations currently affecting VOC emissions from bakeries are described in Chapter 2.0. that are generally used, emission control techniques that may be effective but are not i r i general a5e, a ~ d emission control techniques that involve transfer of technology from other industries. controlling emissions for the control techniques identified as feasible in Chapter 3.0, guidance on methods of estimating the
Chapter 3.0 presents emission control techniques
Chapter 4.0 presents capital and annualized costs of
1-4

- -
costs of alternative control techniques, and environmental and energy impacts.
1-5


- -
1 - 4 REFERENCES 1. 1991 Baking/Snack Directory C Buyer's Guide. Kansas City,
Missouri, Sosland Publishing Co.
2. Telecon. Sanford W., Research Triangle Institute (RTI), with T. Otchy, CSM Environmental Systems, Inc. March 18, 1992. Oxidizers at bakeries.
3. Henderson, D.C. Commercial Bakeries as a Major Source of Reactive Volatile Organic Gases. U. S. Environmental Protection Agency. San Francisco. December 1977.
9
4. Cutino, J., and Owen, S. Technical Assessment Report for Regulation 8, Rule 42 - Organic Compounds - Large Commercial Bakeries. Bay Area Air Quality Management District. San Francisco. July 1989.
-
5. Ref. 4.
6. Stitley, J.W., K . E . Kemp, B.G. Kyle, and K . Kulp, Bakery Oven Ethanol Emissions - Experimental and Plant Survey Results. American Institute of Baking. Manhattan, Kansas. December 1987.
1-6

.

2.0 INDUSTRY DESCRIPTION, PROCESSES, AND EMISSIONS
This chapter presents a description of the baking industry, regulations currently affecting the industry, and information on typical bakery unit operations including processes, equipment, operating parameters, emission sources, and emission stream characteristics.
The baking industry in the United States is large and decentralized. In 1990 there were 2,636 commercial bakeries in the United States.' As shown in Table A-1, located in Appendix A, 854 bakeries produced white pan bread, 980 produced buns and soft rolls, 1,097 produced variety bread, and 713 produced hearth bread and rolls.* These four types of baked goods constitute the bulk of the baked goods considered in this document. As shown in Table A-Z3, of Appendix A, the top 100 bakery companies operated 618 plants with sales ranging from $30 million to $2.6 billion in 199OO4 Aggregate sales from these 618 bakeries was $89.5 billion.' Consumer expenditures for bakery food in 1990 ranged between 9 and 11 percent of all dollars spent on food consumed at home, with from $209 to $259 spent per year per household.6 capita bread consumption in 1990 was 49.93 lbs, and was predicted to increase 2.2 percent annually through 1996.' Table A-3, in Appendix A, presents the national distribution of bakeries by type, region, and State.' Because bread is perishable and distribution delays are undesirable, the location of bakeries tends to correlate with population and are in larger cities in all States:
.
Per
2-1

- -
2.2 UNIT OPERATIONS
The following descriptions are aggregate and composite, and not necessarily descriptive of a particular operation. Production volumes, for example, fluctuate by daily orders, holidays, and seasonal fluctuations.
* 2.2.1 poucrh Processes
Bread production at large commercial bakeries is a highly automated process. When operating at full capacity, a single
---lrrSgeW& bakery may produce up to 300,000 pounds of over 100 different varieties of bread and other bakery products per day. All physical mixing and blending of ingredients, as well as the working and dividing of the doughs, is performed mechanically. Most dough batches are conveyed through each step of the process, from the initial dividing through the final slicing and bagging, with minimal handling.
Four basic dough processes are used by commercial bread bakeries: sponge and dough, straight dough, liquid ferments, and
are used most often by large commercial bakeries. doughs are used for a few types of variety breads.
flour, water, yeast, and salt. Attributes such as loaf volume, crumb softness, grain uniformity, silkiness of texture, crust color, flavor and aroma, softness retention, shelf life, and, most important, nutritive value can all be improved by the addition of appropriate optional ingredients. The materials that are either required or may be optionally included in tne production of various standardized bread products are legally defined by the Food and Drug Administration (21 CFR Part 136) .9
A representative formula for white pan bread is shown in Table 2-1." Two terms used throughout the document which are
- nu-time dough. The sponge and dough and liquid ferment methods Straight .
Bread in its simplest form requires four ingredients:
c
2-2

Table 2-1. Representative White Pan Bread Formula'
Ingredients Sponge %* Dough (Remix) %* Total % in Formula
Essential Flour 65.00 35.00 1 00.00
64.00 Water 37.00 27.00 Yeast 2.75 2.75 Salt e 2.1 2.1
___ __- -~ ~ -
Optional Yeast food 0.50 0.50 Sweeteners (solids) 7.25 7.25 Shortening 2.3 2.3 Dairy blend 2.0 2.0 Protease enzyme 0.25 Emulsifier 0.50 0.50 Dough strengthener 0.50 0.50 Preservative 0.20 Q.20
182.35
Tteferenca 10
0.25
2-3

. -
unique to the "fermentation bread formula lbs. of flour
bakery industry are "baker s percent" and time". The baker's percent of an ingredient in a refers to the weight of that ingredient per 100 in the formula. For a given formula, the baker's
percent of all the ingredients will total to more than 100 percent as the flour alone equals 100 baker's percent. Table 2-1 presents a bread formula and the baker's percents (or weights) of each ingredient. The total weight of flour in the formula is 100 lbs., the total weight or baker's percent of yeast is 2.75. The baker's percents of all the ingredients in this formula totals to 182.35 baker's percent. of time the yeast is fermenting. The clock for fermentation time starts when the yeast comes in contact with water (whether it is in a brew or dough) which can supply it with nutrients needed for reproduction.
As about 50 percent of white pan bread produced in the United States is made by the sponge and dough process, the formula in Table 2-1 is shown in its adaptation to that procedure. In the straight dough method, a somewhat higher yeast level (about 3.0 percent or more) is generally used, and all of the listed ingredients are processed as a single batch. should also be kept in mind that individual bakers introduce minor quantitative variations in their formulations and that the values shown represent weighted averages.
In the sponge and dough method, the major fermentative action takes place in a preferment, called the sponge, in which normally from 50 to 70 percent of the total dough flour is subjected to the physical, chemical, and biological actions of fermenting yeast. rest of the dough ingredients to receive its final physical development during the dough mixing or remix stage."
The mixed sponge is discharged into a greased trough and set to ferment in a special fermentation room. The sponge fermentation time normally lasts 4.5 hours, but may vary from 3.5
Fermentation time refers to the period ____ - --__
The clock stops-when the bread enters the oven.
It
The sponge is subsequently combined with the
2-4

. -
hours for sponges incorporating 75 percent of the total flour to 5 hours for sponges with only 50 percent of the total flour. Increased yeast levels bring about a noticeable reduction in fermentation time . l2
The fully fermented sponge is returned to the mixer and mixed into the final dough, which receives additional fermentation for a short floor time (no more than 45 minutes under average conditions) . I 3
The straight dough method is a single-step process in which all the dough ingredients are mixed into a single batch. The W a U C y - o f the flour, the temperature of the mixed dough and the amount of yeast used will determine the fermentation time.14 The dough is fermented for periods of 2 to 4 hours, with the actual practice time being generally close to 3 hours.'' f ementation begins, the completion schedule is inflexible. l6
Once
About 70 years ago, efforts to simplify the sponge and dough method of breadmaking resulted in a stable ferment process that replaced the sponge with a liquid, flour-free ferment." The
- basic stable ferment was made of up to 70 percent water, and small amounts of yeast, yeast food, malt, sugar, nonfat dry milk, and salt.'* The resultant suspension was fermented at a constant temperature for 6 hours under gentle agitation. The mature ferment was then either used immediately in whole or in part for doughmaking, or it could be stored for about 48 hours, in a stable condition, by cooling. l9
Since the 1950's, the stable ferment process has been subjected to a number of modifications and the resultant ferments are variously referred to as liquid sponges, liquid ferments, preferments, brews or broths, and continuous mix."
exist, flour-free ferments are currently often made up of 82 percent water, and small amounts of sweeteners, yeast, salt, and buffer salts to control the pH.*l
Although many variations on the original list of ingredients
These ferments undergo
2-5

- -
fermentation for 1 to 1.5 hours while being mildly agitated; the mature ferment is used or cooled."
In general, the time required for the proper fermentation of liquid ferments depends primarily on the level of flour in the ferment. Flour-free ferments, given an appropriate set temperature, require about 1 hour of fermentation, whereas ferments containing 40 percent flour need 2 to 2.5 hours to reach the end point.=
have taken two directions: (1) mechanical dough development obtained by intensive high-speed mixing of dough for a short time, and (2) chemical dough development in which the dough is treated with appropriate reducing agents and oxidants and mixed at conventional speeds. Both approaches, in effect, eliminate the bulk fermentation stage that represents about 60 per cent of the total time in the traditional breadmaking processOu These doughs are often called no-time doughs.
The elimination of bulk fermentation time by mechanical dough development usually means that these doughs require an increase in the yeast level of 0.5 to 1.0 percent and a decrease of 1.0 to 2.0 percent in the amount of added sweeteners. The production time from the start of mixing to the end of baking may be reduced to less than 2 hours.25
Chemically developed doughs are generally referred to as short-time doughs if they are subjected to bulk fermentation for periods of 0.5 to 1 hour, and no-time doughs if they are taken directly from the mixer to the divider with no more than 15 minutes of floor time.26 These doughs require an increase in the yeast level of 0.5 to 1.0 per cent and a decrease of 1.0 per cent in the amount of added sweeteners. After an average fermentation time of 30 minutes, the yeast slurry may be cooled or mixed as a straight dough.= The production time from the start of mixing to the end of baking may be reduced to less than 3 hours.**
Attempts to reduce the time required before the final proof
2-6

?
Following fermentation, the dough produced by any of the above processes is divided, rounded and made up into pieces of proper weight for intermediate proofing, moulding, final proofing and baking. Dividing and rounding operations subject the dough to considerable physical abuseOs given a brief rest period in an intermediate or overhead proofer. Proofers are cabinet areas off the floor of the bakery which are protected from drafts. The actual proof time in practice can last anywhere from 30 seconds to 20 minutes, although it will usually fall within a range of 4 to 12 minutesOM intermediate proofer, the dough pieces enter a moulder in which they are shaped and moulded into a cylindrical loaf form and then deposited in the baking pan.31
for final proofing in a proof box. generally fall within a range of 55 to 65 minutes. part, panned dough is proofed to volume or height rather than for a fixed time.32
After final proofing, the dough is baked in an oven. Modern ovens are generally designed to convey the baking loaf through a series of zones in which it is exposed for definite time periods to different temperature and humidity conditions. The first stage of baking, -~ - at a temperature of about 240aC (400' F) lasts about 6.5 minutes. together last some 13 minutes at a constant temperature of about 238' C (460' F) The final zone is maintained at a constant temperature of 221 to 238' C (430 to 460' F) and the loaf baked for about 6.5 minutes."
The rounded dough balls are
on leaving the
After the dough is deposited in the baking pan, it is 'ready
For the most Proof times in practice
__
The second and third stages of baking
-
While these temperaturzs aiid dusations OS tne individual baking phases are representative of conventional baking practice, considerable deviations are encountered. Factors such as oven design, weight or volume of product, crust character and color, level of residual crumb moisture and others all have a bearing on
2-7

actual baking temperature and time. is an important determinant of baking time.%
These are only the basic processes. variations of these basic processes to suit its production equipment, which is further varied for each individual type of product .
Product size in particular
Each bakery employs
- 2.2.2 Emir, ment
2.2.2.1 Mixers. Various mixing devices are used to combine These devices vent inside the bakery and the dough ingredients.
are sources of minimal volatile organic compound emissions . 35
(VOC)
2.2.2.2 perm entation Vessels. These are typically vats in brew processes and tubs in sponge processes. reproduces here if under aerobic conditions; it generates carbon dioxide gas, liquid ethanol, and other products if under anaerobic conditions. warm, and are designed to have minimal air changes.
The yeast
The rooms housing these vats are humid and
2.2.2.3 Interm ediat * e Proofers. Intermediate proofers are used to relax dough pieces for 3 to 12 minutesM after dividing and raunding and before they are moulded into loaves. Intermediate proofers are generally operated under ambient conditions. 12 mi-nutes .
__
The intermediate proof time is usually between 4 and
~
2.2.2.4 Proof Boxes. Proof boxes are where some doughs are allowed to proof (risej after being panned. The proof box is a relatively large chamber, fabricated of well insulated panels and equipped with temperature and humidity controls. The three basic control factors in final proofing are temperature, humidity, and time. In practice, temperatures within the range of 32 to 54' C
2-8

i
(90 to 130' F) and relative humidities of 60 to 90 percent are encountered, with proofing temperatures of 41 to 43' C (105 to llOo F) being most prevalent for bread doughs.38 Under the influence of the elevated temperature, the yeast activity in the dough is accelerated and the loaves expand under the increasing pressure of carbon dioxide produced by the yeast until its thermal death in the oven.39 Care is taken to minimize exhausts from these rooms, thereby minimizing the cost of heating and humidifying them. been measured in proof boxes, the small flow of air through them indicates small VOC emissions.4
Although significant VOC concentrations have
2.2 .2 .5 Ovens. Large bakeries typically operate from one to four ovens of varying sizes, each one suited to produce certain types of breads, buns, rolls, and other bakery products. All known ovens burn natural gas, although some are equipped to burn propane as a standby fuel. Approximately 85 to 90 percent are directly fired'l by long ribbon burners across the width of the oven. Indirectly fired ovens use gun burners and separate burner and oven exhausts, allowing for the use of fuel such as distillate oil. Indirectly fired ovens tend to be found in areas where natural gas is not available, and often are adapted for higher heat input after natural gas becomes available by jetting (drilling) the fire tubes. This modified oven is sometimes referred to as a semi-indirect-fired oven.
Generally, large commercial bakeries operate one very large oven for baking high-volume products such as white and wheat breads. Most bakeries also have one or more smaller ovens for producing buns, rolls, and short-run specialty breads. There are three basic configurations of large ovens:
Tunnel Oven: Doughs are conveyed along the length of the oven from the front entrance to the rear exit. Generally, the oven has two or more exhaust stacks (see Figure 2-1).
2-9

Comfort A ---/
Comfort Hood
Rear r Exhaust Exhaust
Trays
Mid Exhaust # --
Figure 2-1. Tunnel oven.
2-10

. -
Lap Oven: Conveyor is "lapped" so that doughs are both loaded and removed at the front of the oven, after travelling the length of the oven and back. Usually the oven has two or three exhaust stacks (see Figure 2-2).
Spiral Oven: Conveyor path is spiraled so that doughs circle the oven latitudinally several times. The oven requires only a single exhaust stack (see Figure 2-3).
Ovens are often equipped with a purge stack for exhausting residual gases in the oven prior to burner ignition. for this stack is normally closed prior to baking. from these purge stacks should be very minor, and for the purposes of control devices and permitting, they will presumably be treated in the same way as other minor emission sources.
The damper Emissions
Many ovens are also equipped with comfort hoods on either end. These devices collect air emissions from the oven that might otherwise vent to the bakery interior. Comfort hoods that rely on fans rather than on convection to exhaust emissions have a greater potential for emissions.
weeks to adjust it4* and balance the airflows before it is ready for production. Turbulence in the exhaust airflow can cause unstable or extinguished burner flames and non-uniform lateral heat distribution throughout the zone. uneven, improperly baked bread with poor texture, crumb characteristics, and flavor, as well as other undesirable characteristics.
producing such miscellaneous items as muffins, croutons, and breadsticks. ovens and was not within the scope of this document.
When an oven is first installed, it takes approximately 2
.
This may result in
Some bakeries have additional baking equipment for
This equipment differs substantially from bread
2.2 .2 .6 Coolina B oxes. After baking, bread is conveyed to an area to cool. Cooling may take place either on a spiral
2-11

TI
Comfort Hood
Rear r ahaust Exhaust
c w Trays Out
Figure 2-2. Single-lap oven.
2-12

- -
Trays
Figure 2-3. Spiral oven.
2-13

- -
conveyor or on a multi-tier looped conveyor suspended from the ceiling. Cooling conveyors may or may not be enclosed.
2.2.2.7 Packaainq . After cooling, the bread is packaged for Some bread products are sliced before packaging. shipping.
These processes are highly mechanized.
2.2.3 OBeratina Parameters
The oven is separated into several temperature zones to control the baking process. the loaf rises to its final volume (oven spring) and the yeast is killed, halting the fermentation reactions. In the middle zones, excess moisture and ethanol are driven off. the crust is browned and the sides of the loaf become firm enough for slicing. The baking process is complete when the temperature at the center of the loaf reaches approximately 90 to 94OC (194 to 201'F) .43
The operator can adjust the oven temperature to compensate for differences between batches and bread varieties based on visual inspection and experience. The temperature in each zone is controlled by adjusting the burner heat output with temperature controllers and manually adjusting the exhaust dampers. must be maintained across the width of the oven.
The entire baking process is very sensitive to upset. law, white pan bread must weigh the amount stated on the package without exceeding 38 percent moisture."
All equipment must be extremely reliable to maintain high bread quality while maintaining a tight, continuous production schedule. For example, panned dough and bread are usually transported from one process to another, such as from baking to cooling, by mechanical conveyor belts. A conveyor shutdown may cause the bread in the oven to remain too long in the oven and to
In the initial zones of the oven,
In the final zones,
Constant temperature and laminar flow of exhaust gases
By
2-14

- -
overheat. If the loaves about to go into the oven are delayed, they may rise above the size that will fit in the bread bags,
Each process unit depends on the smooth operation of the preceding unit, and a breakdown in one process may affect dough not scheduled for baking for several hours. For example, even a minor malfunction of the bag twist-tie machine can result in the loss of dough in the proof box. stored or stored at temperatures low enough to retard proofing because there are rarely provisions for storage at any intermediate stage in processing. equipment on a bakery oven is the loss of production time while rebalancing the heat flow in the oven after installation of the control equipment.
required by health and safety regulations to maintain strict sanitary conditions. In addition to daily cleaning, most bakeries are shut down for cleaning and maintenance one or two days per week.
This dough cannot be baked and
One cost of installing control
As bread is produced for human consumption, bakeries are
2.3 AIR EMISSIONS
The major pollutants emitted from bread baking are VOC
emissions, chiefly the ethanol produced as a by-product of the leavening process, which are precursors to the formation of ambient ozone. Under aerobic conditions, yeast uses sugars added to the dough or converts starches in the dough to sugars for nutrients supporting the generation of new yeast cells. consumption during yeast reproduction produces an anaerobic environment, Under anaerobic ccnditiona, yeast ferments sugars, creating carbon dioxide, ethanol, and other by-products by the enzymatic conversion of sucrose to glucose to pyruvic acid to acetaldehyde to ethanol. The yeast fermentation of 100 lbs of sugar (from either added sugar or sugar converted from starch by the yeast) produces 49 lbs ethanol, 47 lbs carbon dioxide, and 4
lbs of glycerol, organic acids, aldehydes, and various minor
Oxygen
2-15

compound^.^^ characteristic flavors and aromas of bread. The ethanol formed in the dough is vaporized and emitted from the oven during the end of the baking process when the internal crumb temperature reaches the boiling point of ethanol. Emissions of criteria pollutants arising from combustion (oxides of nitrogen, oxides of sulfur, and carbon monoxide) are comparatively small from the
These compounds are responsible for the
. typically natural gas-fired ovens. A few types of bread, such as corn bread and soda bread, are
chemically leavened with baking powder. releases carbon dioxide, raising the dough without ethanol formation. However, since the trace organic flavoring agents are also not formed, the resulting bread products taste different from conventional breads.
An acid/base reaction
2.3.1 Emission Sources
The primary source of VOC emissions at a bakery is the oven. Screening measurements taken at mixers, fermentation vessels, comfort hoods, proof boxes, oven exhausts, cooling area e-xhausts, and packaging areas suggest that greater than 90 percent of VOC emissions are from the oven.&
2.3.2 mission Stream Characteristics
Most studies of emissions from dough and bread have been to investigate flavor constituents, rather than to evaluate air pollution concern^.^'*^* Several studies, however, have been conducted to characterize bakery air emissions. described belaw;
They are
2.3.2.1 Commercial Bakeries as a Mal 'or Source of Reactive Volatile Oraanic G ases. This study, performed under an EPA contract in 1977, represents the first attempt at estimating
2-16

- -
ethanol emission~.~~ fermented, and baked in a small electric oven under a tent to capture emissions from each stage of the breadmaking process. Emissions were measured at 0.5 lbs ethanol per 1000 lbs bread for the straight dough process and 5.6 lbs ethanol per 1000 lbs bread for the sponge dough process. Over 90 percent of the ethanol was emitted during the baking. ranging from 5 to 8 lbs ethanol per 1000 l b s bread, were also calculated from various theoretical considerations for comparison purposes.
industry recipes in both relative quantity and type of ingredients used. Sweetener and yeast concentrations were both relatively high, and a standard commercial baking grade of yeast was not used to make the test loaves.
Four loaves of bread were prepared,
Several other emission factors,
The dough formulas used differed considerably from standard
2.3.2.2 Bav Area Air Oualitv Manacrement District (BAAOMDI Study. This 1985-1986 study entailed source testing of bakery ovens.H) In its attempt to develop more realistic emission factors, the BAAQMD performed at least one source test using BAAQMD Method ST-32 on every bread, bun, and r o l l oven at each of the seven large commercial bakeries within the Bay Area. A total of 16 ovens were tested, with some tested several times under different operating conditions. expressed in pounds of ethanol per thousand pounds of bread, were calculated for each test performed. The results obtained ranged from 0.3 to 7.0 lbs of ethanol per 1000 lbs of bread baked. The reasons for this variation of ethanol emissions were not reportsd.
- -
Source emission factors,
2.3.2.3 &mer ican In stitute of Bakina (AIB) Study. This 1987
The purpose of this study was to explain the wide study examined the ethanol emissions data collected by the BAAQMD.” fluctuations in levels of ethanol measured during the BAAQMD
2-17

survey and to look for correlations in the levels measured. The AIB was requested to study the relationship between the test results and process parameters that.may affect emissions. The parameters studied included yeast and sweetener concentrations, fermentation time, type of process (sponge dough vs. straight dough vs. brew), type of product (white bread, buns, sourdough bread, variety), and baking conditions (time and temperature). A
linear relationship was found between emissions (lbs ethanol per 1000 lbs bread) and the product of the initial yeast concentration and total fermentation and proof time. process type (sponge, straight, and liquid brew) also had a small influence.
model based on the source test data. Using the formula developed based on this model (see page 1-4)t an ethanol emission factor can be estimated for each variety of bread, and ethanol emissions from an oven baking breads of the varieties for which the formula is applicable can be quantified by multiplying the product mix by the appropriate emission factors.
The dough
To confirm this relationship, AIB derived a mathematical
- 2.3.2.4 South Co ast Air Qualitv Manaa ement District I SCAOMD 1 studv. This 1988 survey was initiated by the SCAQMD's Rule
the number, types, and characteristics of bakery ovens operating in the questionnaire designed by SCAQMD and distributed to bakery operators by the newly formed Southern California Baker's Air Quality Association. Information on bakery operations was supplied by the major bakeries in the District. ethanol emissions reflected in answers to the questionnaire w a s
estimated by the bakery owners using the AIB formula. from the questionnaire indicate that there were 24 major bakeries operating 72 ovens in the District. the District was 446,700 tons per year and t o t a l ethanol
-- - - Development Office to quantify ethanol emissions and determine
The study was carried out using a
The quantity of
Results
Total bread production in
2-18

- -
emissions there were calculated as 4.1 tons per day. emission rates were calculated as 2.5 lbs ethanol per 1000 lbs bread produced,
The SCAQMD's Emissions Inventory Unit also attempted to quantify ethanol emissions generated by bread bakeries. their report, the total VOC emissions from bakeries in the South Coast Air Basin was 2442 tons per year or 9.4 tons per day.
Average
Based on
2.3.2.5 Current Studv. Because of increasing regulatory concern for certain constituents emitted in small quantities (such as acetaldehyde) from bakery oven exhausts and the need to predict total VOC emissions (rather than just ethanol emissions) from common baking parameters, emission data were gathered. Sampling and analysis was performed using EPA Test Methods 18 (to quantify total organic carbon) and 25A (to speciate the constituents of the exhaust gas) at four typical bakeries on 18 different products with varying yeast concentrations and fermentation times. range of yeast concentrations and fermentation times similar to the AIB study and representative of the baking industry. multiple step-wise linear regression was performed on the process parameters and emission rates. The resulting data is summarized in Appendix B, and indicates that total VOC from bakery ovens can best be described as:
Products sampled were selected to provide a
A
-
VOC E.F. = 0.95Yi + 0.195ti 0.51s 0.86t, + 1.90 where
VOC E.F. = pounds VOC per ton of baked bread Yi = i n i t i a l baker's percent of yeast to the nearest tenth
of a percent ti = total yeast action time in hours to the nearest tenth
of an hour S = final (spike) baker's percent of yeast to the nearest
c
tenth of a percent
2-19

- -
t, = spiking time in hours to the nearest tenth of an hour
Although it appears that by changing a bread formula and increasing the amount of final yeast (S), it would be possible to obtain low or even a negative value for VOC emission estimates, a product of high quality would not be produced.” Where no final yeast is added, the formula condenses to:
VOC E.F. 0 0.95Yi + 0.195ti + 1.90
This predictive equation can be used for quantifying VOC emissions from bakery ovens. A baker knows the yeast concentrations and yeast action times for each variety baked. Those values can be inserted into this equation and pounds of Voc per ton of bread baked can be calculated. This number is multiplied by the tons of bread baked during a given time period, and the product is pounds of VOC emitted from the oven for that particular product for the given time period (typically per year). The following equation demonstrates this calculation:
VOC Emissions tons/yr = VOC E.F. x BP x k
VOC E.F. = lbs VOC emissions/ton of bread produced BP = bread production in tons/yr k = conversion constant (ton/20001b)
where
2.3.2.6 Other Studieq. Numerous other studies of bread emissions or constituents have bean performed but are primarily qualitative. Hironaka,% El-Samahy,fl Makuljuk~w,~~ M a r k ~ v a , ~ ~ and others. works discuss the relative affekts of baking parameters such as proof temperature and baking time on ratios of aldehydes to alcohols and other similar relationships. While of interest in
These include Rothe,” Wiseblatt and Kahn," These
2-2 0

- -
efforts directed at narrowing the range of species for which to analyze and minimize emissions through process modification, these studies relate only slightly to the quantification and control of total VOC emissions from bakery ovens.
2.4 SUMMARY OF CURRENT AIR EMISSION REGULATIONS
2.4.1 BAAOMD
BAAQMD in 1989 adopted Regulation 8 Rule 42 (Appendix D), effective January 1, 1992, requiring 90 percent reduction of ethanol emissions from large commercial bakeries. exempts chemically leavened baked goods; miscellaneous baked goods such as croutons, muffing, crackers, and breadsticks; bakeries producing less than 100,000 lbs per day of bread, averaged monthly; and ovens emitting less than 150 lbs per day of ethanol. Ovens operating before January 1, 1988, are exempt if they emit no more than 250 lbs per day of ethanol. Emissions are estimated using the AIB formula and measured using BAAQMD Method
The regulation
ST-3 2.
2 .4 .2 SCAOMD
SCAQMD in 1990 adopted Rule 1153 - Commercial Bakery Ovens regulating VOC emissions from bakery ovens with a rated heat input capacity of 2 million BTU per hour or more (Appendix E). The rule requires 95 percent reduction of VOC emissions by July 1, 1992, from new ovens emitting more than 50 lbs per day of VOC, 95 percent rschuction of VOC emissions by July 1, 1994, from ovens operating before January 1, 1991, that emit 100 or more lbs of VOC per day, and 70 percent reduction of VOC emissions by July 1, 1993, from ovens operating before January 1, 1991, that emit between 50 and 100 lbs VOC per day. using the A I B formula and measured using EPA Test Method 25, or SCAQMD Test Method 25.1.
Emissions are estimated
2-2 1

2.4.3 New Jersey
The State of New Jersey regulates VOC emissions from bakeries according to the New Jersey Administrative Code Title 7
Chapter 27 Subchapter 16.6 "Source Operations other than Storage Tanks, Transfers, Open Top Tanks, Surface Cleaners, Surface Coaters and Graphic Arts Operations." This rule limits Voc emissions to between 3.5 and 15 lbs per hr. Emissions estimates and measurement are by approved methods.
2.4.4 Other Ar eas
Several other State and local agencies regulate one or more
In of the constituents of bakery oven emissions under a general approach such as the regulation of hazardous air pollutants. the State of Washington, The Puget Sound Air Pollution Control Agency limits ethanol emissions to levels that will not cause ambient concentrations greater than 6000 ~ g / m ~ . ~ determination is by ambient modeling. The State of North Carolina limits acetaldehyde emissions to levels that will not cause ambient concentrations greater than 27 mg/m3.61 This type of standard is not known to have been used to require emission reductions by a control device at a bakery.
Compliance
2.4.5 Prevention of Sianificant Deterioration
Areas in attainment with National Ambient Air Quality Standards (NAAQS) and subject to prevention of significant deterioration (PSD) regulations typically evaluate significant increases in emissions of VOC from a modification to an existing bakery or a new bakery (to the extent that either is considered a major PSD source, i . e . , 250 tons per year) by using either the AIB formula or a source test generated at a similar facility.
2-22

Under PSD, the level of significance is a 40 tons per year (tpy) increase.
2.4.6 New Source Review
Areas in nonattainment with ozone NAAQS and subject to new source review (NSR) regulations typically evaluate increased emissions of VOC from a significant modification to an existing bakery or a new bakery by using either the AIB formula or a source test generated at a similar facility. Under NSR, the level of significance is a 40 tpy increase in areas classified as marginal or moderate. Modifications in areas classified as serious, severe, or extreme are subject to more stringent levels for determining a significant emissions increase. While not the subject of this document, the EPA is developing guidance as to how this review will be implemented. new sources ranges from 100 tons per year in an area classified as marginal ozone nonattainment to 10 tons per year in an area classified as extreme ozone nonattainment- including an existing bakery in Atlanta, GA, and a new bakery in Denver, PA, have been required to install VOC emission control devices as a result of NSR regulations.
The major source cutoff for
Several bakeries,
2.4.7 Bonitor inu and Enforceabilitv
Careful record-keeping by any source of air emissions is essential to the determination of compliance for that source. This is particularly true of VOC sources since the ozone standard related to VOC emissions is of short duration compared to other criteria pollutants. Continuous emission monitoring (CEN) is one method used to record emission rates. However, other alternatives are available that may be less burdensome. include but are not limited to permit limits based on verifiable quantities, temperature increase across catalysts, hot wire
These
2-23

thermistors, and various flow-based alternatives to classical CEM.
2-24
. -
2.5 REFERENCES
1. Gorman Publishing. Gorman Red Book, 1991. Chicago. February 1992. p. 18.
2. Ref. 1, pp. 24-29.
3. Ref. 1, pp. 24-29.
4. Ref. 1, pp. 24-29.
5. Ref. 1, pp. 24-29.
6. Food Survey Pinpoints Consumer's Bakery Buying Habits. Bakery. p. 20. September, 1991. p. 20.
7. Anonymous. Per Capita Bread Consumption to Increase 2 Percent through '96. Milling and Baking News. January 15, 1991. p. 1.
8. Ref. 1, p. 30.
9. Pyler, E. J., Baking Science & Technology, Sosland Publishing Company. Volume 11, 1988. p. 590
10. Ref. 9, p. 591.
11.
12.
13.
15.
16. -
17.
18.
19.
20.
21.
22.
23.
Ref. 9, p. 595.
Ref. 9, p. 596.
Ref. 9, p. 651.
Ref. 9, p. 653. ~ ~ -.-.
Ref. 9, p. 592.
Ref. 9, p. 593.
Ref. 9, p. 683.
Ref. 9, p. 684.
Ref. 9, p. 683.
Ref. 9, p. 684.
Ref. 9, p. 687.
Ref. 9, p. 686.
Ref. 9, p. 687. . 2-25

2.5
24.
25.
26.
27 . 28.
29.
30.
31.
32.
33 . 34 .
References (Continued)
Ref. 9, p. 699.
Ref. 9, p. 700.
Ref. 9, p. 703.
Ref. 9, p. 704.
Ref. 9, p. 706.
Ref. 9, pp. 709-718.
Ref. 9, pp. 718-719.
Ref. 9, pp. 719-723.
Ref. 9, p. 733.
Ref. 9, p. 741.
Ref. 9, p. 742.
35. Parrish, C. Radian Corporation. Site survey at Fox/Holsum bakery. February 28, 1992.
36. Letter from Anne Giesecke, ABA to Martha Smith, EPA. October, 20, 1992.
37. Ref. 36.
38. Ref. 9, p. 731. - -
39.- Ref. --36.
40. Ref. 35.
41. Telecon. Sanford, W., RTI, with Lanham, W., Lanham Bakery
ovens . ~ Solutions. May 5, 1992. Direct and indirect firing of bakery
42. Ref. 36.
43. Ref. 36.
44. Ref. 36.
45. Sanderson, G . , G . Reed, B. Bruinsma, and E. J. Cooper. Yeast Fermentation in Bread Baking. American Institute of Baking Technical Bulletin. Manhattan, Kansas. 1983.
V.12:4. December
2-26 .

2.5
46.
47 . 48.
49.
50 .
51.
52.
53.
54.
5 5 .
56.
57.
58 .
59.
References (Continued)
Ref. 35.
Rothe, M. Aroma von Brot. Berlin, Akademie-Verlag. 1974. pp. 10-14 . Wiseblatt, I,., F. E. Kohn. Some Volatile Aromatic Compounds in Fresh Bread. Washington, D.C. Presented at 44th annual meeting of the Quartermaster Food and Container Institute for the Armed Forces. Washington, D.C. May 1959. pp. 55-66.
Henderson, D. Commercial Bakeries as a Major Source of Reactive Volatile Organic Gases. U . S . Environmental Protection Agency. San Francisco. December 1977; 18 pp.
Cutino, J., S. Owen. Technical Assessment Report for Regulation 8, Rule 42-Organic Compounds - Large Commercial Bakeries. Bay Area Air Quality Management District. San Francisco. July 27, 1989. 34 pp.
Stitley, J. W., K. E. Kemp, B. G. Kyle, and K. Kulp. Bakery Oven Ethanol Emissions - Experimental and Plant Survey Results. American Institute of Baking. Manhattan, Kansas. December 1987.
South Coast Air Quality Management District. Rule 1153 - Commercial Bakery Ovens. El Monte. November 26, 1990.
Doerry, Wulf T., American Institute of Baking, to Giesecke, A., American Bakers Association. October 8,1992. Proposed predictive formula.
Ref. 47.
~
Ref. 48.
Hironaka, Y . Effects of Fermentation Conditions on Flavour Substances in French Bread Produced by the Straight Dough Method. Journal of Japanese Society of Food Science and Technology (Yamaguchi, Japan) . 1985. El-Samahy, S. X. Aroma of Egyptian "Baladi" Bread. Getreide, Mehl-und-Brot. Zagazig, Egypt. 1981.
Maklyukov, V. I. Influence of Various Baking Methods on the Quality of Bread. Baecker-und-Konditor. Moscow. 1982.
Markova, J. Non-enzymic Browning Reaction in Cereal Products. Sbornik-Vysoke-Skoly-Chemcko-Techno1ogicke-V- Praze. Prague. 1972.
2-27

- -
2.5 References (Continued)
60. Telecon. Sanford, W., RTI, with Pait, J., Puget Sound Air Pollution Control Agency. February 7, 1992. Bakery regulations.
61. N o r t h Carolina Administrative Code Title 15A Chapter 2 Subchapter 2D.1104.
2-28
3.0 VOC EMISSION CONTROL DEVICES
Control technologies such as thermal oxidation, catalytic oxidation, carbon adsorption, scrubbing, condensation, biofiltration, and process changes were considered for reducing VOC emissions from commercial bakery ovens. Devices under development or not demonstrated were not considered, although some show promise for the future.
This chapter describes emission control techniques potentially applicable to VOC from bakeries and identifies the control techniques to be evaluated in Chapter 4.0. These control techniques are grouped into two broad categories: combustion control devices and noncombustion control devices,
3.1 COMBUSTION CONTROL DEVICES
3.1.1 Direct Flame Thermal Oxidation
3.1.1.1 Control Descrbtio n. Direct flame thermal oxidation, also called thermal oxidation, is the process of burning organic vapors in a separate combustion chamber. One type of thermal oxidizer consists of a refractory-lined chamber containing one or more discrete burners that premix the organic vapor gas stream with the combustion air and any required supplemental fuel. A second type of oxidizer uses a plate-type burner firing natural gas to produce a flame zone through which the organic vapor gas stream passes. generally natural gas, may be added to the bakery oven exhaust to make the mixture combustible if the oven exhaust has a heating value of less than 1.9 MJ/m3 (50 Btu/ft3),' as is usually the case in bakery ovens. Supplemental fuel consumption can be minimized
Supplemental fuel,
3-1

- -
by installing a heat exchanger to recover heat from the exhaust gas to preheat the incoming gas.
water. carbon monoxide emissions to very low levels. These design considerations include residence time, temperature, and turbulence in the oxidizer chamber.
Thermal oxidizer exhaust gas is mainly carbon dioxide and Good design and operation limit unburned hydrocarbons and
3.1.1.2 Effectiveness and A m 1 icab ilitv of Thermal Oxidation to Bakery Ovens. Oxidizers are most effective at controlling exhaust streams with relatively high concentrations of organics. When the oxidizer temperature is maintained at 870 O C (1600OF) and a residence time of 0.75 seconds, over 98 percent of the unhalogenated organic compounds in the waste stream can be converted to carbon dioxide and water.2d concentrations in bakery exhaust can fluctuate, a thermal oxidizer can be designed to achieve reduction efficiency greater than 98 percent.'
supplemental fuel for thermal oxidizers usually makes some form of heat recovery desirable in applications having gas exhaust with heating values similar to bakery ovens. Thermal oxidation is a technically feasible but relatively expensive technique for the control of VOC emissions from bakery ovens and was not evaluated in Chapter 4.
Although VOC
Although effective at VOC removal, the high cost of
3.1.2 peaenerative Oxidation
3.1.2.1 Control DescriDtion. Regenerative thermal oxidation is s variant of thema1 oxidation (see Figure 3-1). The inlet gas first passes through a hot ceramic bed thereby heating the stream (and cooling the bed) to its ignition temperature. desired temperature is not attainable, a small amount of
If the
auxiliary fuel is added in the combustion chamber. The hot gases
3-2

Mode A
Heat Transfer Bed
0 .
w w I
i
I i
[ Heat Transfer Bed 1 I
t
I I Cooling Gas - - - - -
Exhaust _I_ Gas
Exhaust Gas
1
I- Oven
Aux Air
I , '
Chamber Heat Transfer Bed
Heating Gas , I L
I
1
Mode B
Fuel
,Auw Fuel
I
e
Figure 3-1. Regenerative Oxidation

- -
then react (releasing energy) in the combustion chamber and while passing through another ceramic bed, thereby heating it to the combustion chamber outlet temperature. The process flows are then switched, now feeding the inlet stream to the hot bed. This cyclic process affords very high energy recovery (up to 95%).
Regenerative thermal oxidizers are available with either single or multiple beds. is used both as a combustion chamber and a regenerative heat- recovery exchanger. Combustion of the air pollutant occurs in the midsection of the single ceramic bed. are used, the combustion chamber is separate from the heat transfer beds and is equipped with a burner to provide supplemental heat when needed.
When a single bed is employed, the bed
When the multiple beds
3.1.2.2 Effectiveness and Amlicabilitv of Reaenerative Oxidizers to Bakery Ovens. than 98 percent are achievable.' feasible control technique for control of VOC from bakery ovens, and one is installed at a bakery in the United States. The cost effectiveness of a regenerative oxidizer is evaluated in Chapter 4.
VOC reduction efficiencies greater Regenerative oxidizers are a
3.1.3 Catalytic Oxidation
3.1.3.1 Control D escrbtion. A catalytic oxidizer is similar to a thermal oxidizer except that combustion of the exhaust gas takes place in the presence of a catalyst (see Figure 3-2). This allpws the oxidizer to be operated at lower temperatures, ranging from 320 to 650'C (600 to 1200 consequently reducing NO, formation; supplemental fuel consumption, and associated operating costs. Temperatures below this range slow the oxidation reactions resulting in lower destruction efficiencies. cause premature catalyst failure.
Temperatures above this range can Where catalytic oxidation of
3-4

Oven
Catalytic Oxidizer
Supplementary Fuel *
w cn I r
P t
Heat Exchanger
Catalyst Bed (Optional) L I
Figure 3-2. Catalytic Oxidation

- -
vapor streams with a high organic content can produce temperatures above 650 OC (1200 OF), catalytic oxidizers can be suitable after dilution of those streams with fresh air.
plated with metal alloy containing platinum, palladium, copper, chromium, or cobalt, and require an extremely clean exhaust stream. In early bakery applications, there was some concern that trace compounds and fine particulates may foul the catalyst, reducing the efficiency. However, a catalytic oxidizer installed in 1987 on a large bakery oven in the Bay Area has been running trouble-free for five years." Although no test results are available at this time, advances in catalyst technology may eliminate the need for a preburner, thereby lowering costs. At least one bakery is currently evaluating such a system."
Catalysts are typically composed of a porous inert substrate
3.1.3.2 Effectiveness and Amlicabilitv of Catalvtic
Catalytic oxidation is rs to Bakerv Ovens.
than 98 percent are a~hievable.'~~'~ considered to be technically and economically feasible. 23 known existing oxidizers on bakery ovens, 21 are of a catalytic design. l4
VOC reduction efficiencies greater
Of the
3.2 NONCOMBUSTION CONTROL DEVICES
3.2.1 Carbon Adsorption.
3.2.1.1 Control Descrhtion. A carbon adsorption unit consists of one or more beds of activated carbon, which adsorb organic compounds from the exhaust stream. The organic vapors adhere to the large surface area and when the bed becomes saturated, steam is passed through it to regenerate the carbon. The steam/organic vapor mix is then condensed and either sent for disposal or distilled to recover the organic compounds.
3-6

- -
3.2.1.2 Eff ectiveness and Amlicabilitv of Carbon Adsomtion Carbon adsorption is very effective in removing to B akerv Ovens.
low concentrations of VOC, with efficiencies greater than 95
percent. However, there are several problems with adapting this technology to a bakery oven. Ethanol, the primary organic gas in oven exhaust, has a high affinity for carbon and is difficult to strip from the carbon beds. Incomplete stripping lowers bed capacity and reduces abatement efficiency. Fats and oils in the exhaust may clog the carbon pores, reducing capacity and bed life. The resulting ethanol/water mixture would require further treatment and disposal. Because of these problems, carbon adsorption is not considered for reduction of VOC emissions from bakery ovens.
3.2.2 Scru bbinq
3.2.2.1 Control Description. Scrubbing is the absorption of gaseous pollutants by liquid. In a packed tower scrubber, a fine water mist is sprayed countercurrent to the exhaust flow in the presence of packing material with a large-surface area to maximize liquid/gas mixing. Soluble organic compounds are absorbed by the water and the water/organics mixture is either treated for recovery of the organics or sent for disposal.
- -
3.2.2.2 sffe ctiveness and Amlicabilitv of Scrubbina to Bakerv Ovens. scrubbers are technically feasible as a control device for VOC
removal in some applications. Substantial quantities of water would be required to handle the exhaust gas from bakery avens that would either present a massive wastewater disposal problem or require the installation of large-scale wastewater treatment that does not simply release the ethanol to the ambient air or cause other cross-media emissions transfer, or ethanol recovery equipment.
Since ethanol is readily soluble in water,
Due to the high costs of wastewater treatment and
. 3-7

ethanol recovery, scrubbing is not considered feasible as a technique for VOC reduction from bakery ovens.
3.2.3 cond ensation
3.2.3.1 Control Descrbtion. Condensation is the process by which pollutants are removed by cooling the gases below the dew point of the contaminants, causing them to condense. Two types of condensation devices are surface condensers and contact condensers.
in which the coolant (usually water) and vapor phases are separated by the tube wall and do not contact each other.
liquid into the gas stream. They are generally more efficient, inexpensive, and flexible than surface condensers, but typically produce large amounts of wastewater if the condensate cannot be recycled, and therefore, are not considered appropriate for bakeries.
Surface condensers are generally of a shell-and-tube design
Contact condensers cool vapors by spraying a relatively cold
of Condensation to 3.2-302 Eff ectiveness and A m 1 icabilitv Bake- Ovens. would require freon-chilled coils to cool a very wet gas stream from 120 to 10 OC (250 to 50 OF). Water would freeze on the coils, insulating them, thereby reducing the abatement efficiency of the system. Fats and oils would condense more readily, exacerbating any potential sanitation problems in the ductwork. However, the resulting condensed liquid would present a disposal problem. Condensers are usually ass~ciated with airflows less than 2,000 ft3/min,I5 and most older ovens are operated at substantially higher airflows. technically feasible option for controlling VOC emissions from bakeries because most ovens are operated at an airflow higher than desirable for condensers, the cost of refrigeration is high,
. . Condensing the VOC gas stream emitted by baking
Condensation is not considered a
. 3-8

- -
the value of the VOC recovered is low, and the potential for wastewater disposal problem is high. been demonstrated to be effective VOC control devices on bakery ovens
Condensers have been not
3.2.4 iofiltration
3.2.4.1 Con trol Descrintion. Biofilters are a relatively new, unproven technology, used in Europe for odor control and in the United States on processes (such as yeast production) which discharge gases at near ambient temperature.I6 is passed through a bed of soil, which absorbs the organic compounds. down the organics into carbon dioxide and water. The beds must be monitored and kept damp to prevent cracking or insult to the microorganisms. This system appears to have several advantages not offered by other control options. enough to permit the installation of separate beds for each stack of a multi-stack oven. This avoids any flow-balance problems and minimizes the expense of additional ducting. expenses are minimal, and include minor bed maintenance and electricity for the exhaust fan only.
The exhaust stream
Microorganisms naturally present in the soil break
The capital costs are low
Annual operating
3.2.4.2 Eff ectiveness and Amlicabilitv of Biofiltration to Because the gas stream temperature from a bakery Bakerv Ovens.
oven is higher than the temperature which soil microorganisms can tolerate, biofiltration has not been demonstrated to be a feasible control technique for bakery ovens. temperature problem were solved by cooling the gas stream (by scrubbing, for example), the wastewater and fats condensation problems associated with most cooling strategies are significant, and sufficient space for these soil beds is unavailable at many bakeries in the United States. The effectiveness of biofiltration as a technique for VOC reduction from bakery ovens
Even if this
”
3-9

- -
is not known. Therefore, biofiltration is not considered in Chapter 4 . 3.2.5 proc ess and Formulation Chancres
3.2.5.1 Control D escriDtioq. The AIB study demonstrated that shorter fermentation and lower yeast percentages do reduce the amount of ethanol emitted. However, these changes also affect the taste, texture, and quality of the finished product. It is not known if comparable products can be produced using low- ethanol formulations.
yeast, bakers can produce bread without any ethanol formation or emissions. Examples of such breads include corn bread and Irish soda bread. However, by eliminating the fermentation reactions, the chemical leavening process also prevents formation of the various agents responsible for the flavors and aromas of conventional yeast-leavened bread. have their own distinct flavor which may not be acceptable to consumers as a substitute.
flavor of bread prepared with short fermentation time," but none has been successful.'* testing an additive intended to shorten fermentation time and thereby lower VOC emissions," but initial tests have not provided consistently acceptable products.20
By substituting chemical leavening (baking powder) for the
Chemically leavened breads
- Much research has been done to find ways to enhance the
. A major yeast manufacturer is currently
3.2.5.2 Effe ctiveness and Amlicabilitv of Process and Pormulation Chanaes to Bakerv Ovens. Process and formulation changes can be effective Fn reducing er nearly sliminating VOC
emissions from bakery ovens. However, no modified yeast, additive, or enzyme that lowers VOC emissions has been demonstrated to provide taste acceptable to the baking industry and consumers in the United States. Although future prospects
3-10 -

- -
are promising, process and formulation changes are not currently feasible as a means of substantially reducing bakery VOC emissions.
3-11

. -
A,,

3.3
1.
2 .
3 .
4 .
5 .
6 .
7.
8.
9.
10.
REFERENCES
U. S. Environmental Protection Agency. Distillation Operations in Synthetic Organic Chemical Manufacturing- Background Information for Proposed Standards. Publication No. EPA-450/3-83/005a. December 1983. p. 4-21.
Memorandum and attachments from Farmer, J. R., U. S. Environmental Protection Agency, Office of Air Quality Planning and Standards. August 22, 1980. Thermal incinerators and flares.
Lee, K., J. L. Hansen, and D. C. McCauley, Union Carbide. Revised Model for the Prediction of Time-Temperature Requirements for Thermal Destruction of Dilute Organic Vapors and Its Use for Predicting Compound Destructibility. Presented at the 75th annual meeting of the Air Pollution Control Association. New Orleans, LA. June 1982.
Midwest Research Institute. Emission Test of Acrylic Acid and Ester Manufacturing Plant, Union Carbide, Taft, Louisiana. Prepared for the U. S. Environmental Protection Agency, Office of Air Quality Planning and Standards. Research Triangle.Park, NC. EMB Report 78-OCM8. September 1980.
Midwest Research Institute. Emission Test of Acrylic Acid and Ester Manufacturing Plant, Rohm and Haas, Deer Park, Texas. Prepared for the U. S. Environmental Protection Agency, Office of Air Quality Planning and Standards. Research Triangle Park, NC. EMB Report 78-OCM9. August 1980.
Midwest Research Institute. Stationary Source Testing of a Maleic Anhydride Plant at the Denka Chemical Corporation, Houston, TX. Prepared for the U. S. Environmental Protection Agency, Office of Air Quality Planning and Standards. Research Triangle Park, NC. EMB Report 78-OCM4. March 1978.
Cutino, J., S. Owen. Technical Assessment Report for Regulation 8, Rule 42-Organic Compounds - Large Commercial Bakeries. Bay Area Air Quality Management District. San Francisco. July 27, 1989. p. 11.
Ref. 3, p. 11.
Ref. 1, p. 4-31.
Telecon. Sanford, W., RTI, with Gyersvik, C:, Continental Baking Company. July 14, 1992. Catalytic oxidizers.
Ref. 10
3-12 ..... .--
3.3
- -
References (Continued)
12 .
13
14 . 15
16.
17 .
18.
19.
20 .
U. S. Environmental Protection Agency. Parametric Evaluation of VOC/HAP Destruction via Catalytic Incineration. Project Summary. Publication No. EPA/600/52-85/041. Research Triangle Park, NC. July 1985. 4 p.
U. S. Environmental Protection Agency. Destruction of Chlorinated Hydrocarbons by Catalytic Oxidation. Publication No. EPA-600/2-86-079. Washington, DC. September 1986. p. 9.
Telecon. Sanford, W., RTI, with Otchy, T., CSM Environmental Systems, Inc. March 18, 1992. Oxidizers at bakeries.
Purcell, R. Y., and G. S. Shareef. Evaluation of Control Technologies for Hazardous Air Pollutants. U. S. Environmental Protection Agency. Research Triangle Park, NC. Publication No. EPA/600/7-86/009a. February 1986. p, 3-3.
U. S. Environmental Protection Agency. Assessment of VOC Emissions and Their Contrd from Baker's Yeast Manufacturing Facilities. Research Triangle Park, NC. Publication No. EPA- 450-3-91-027. January 1992. p. 35-37.
Wiseblatt,.L., and F. E. Kohn. Some Volatile Aromatic Compounds in Fresh Bread. Washington, D.C. Presented at 44th annual meeting of the Quartermaster Food and Container Institute for the Armed Forces. Washington, D.C. May 1959.
Telacon. Sanford, W . , RTI, with Lanham, W., Lanham Bakery Solutions. May 5, 1992. Preferment additives.
Fleischmann's Yeast. Product Announcement. NPFC Significant Factor in Reducing Ethanol Output. January 10, 1992,
Talecon. Sanford, W . , RTI, with Franek, J., Northeast Foods, March 12, 1992. Emission tests using NPFC.
...
3-13
_.

- -
4.0 IMPACT ANALYSIS OF ALTERNATIVE CONTROL TECHNIQUES
This chapter presents the cost effectiveness of various control strategies based on a set of model baking lines. approach identifies a range of oven sizes and dough formulas typical for the industry and derives VOC emissions and the resulting costs of control for an oven. Of the control methods described in Chapter 3.0, oxidation is the most feasible and widely used, and the control devices selected for cost analysis are catalytic and regenerative oxidizers. The cost analysis was performed using the OAQPS Control Cost Manual, Fourth Edition.' .
Examgle calculations are in Appendix C. Because the parameters affecting bakery oven emissions vary,
a range of parameters such as yeast concentration, proofing time, oven heat input, and air flow were used, and the resulting values for cost per ton of VOC removed and oven heat input and air flow are displayed as summary graphs.
This
.
4.1 MODEL OVENS AND VOC EMISSIONS
~ - - - Due ta the number of bakery ovens and wide variation in
process parameters affecting emissions, models were used to represent typical baking lines. The models are not intended to represent all bakeries, nor any specific bakery, but rather to summarize the range of process parameters encountered at commercial bakeries in current operation. Nine different size Ovens and three different dough formulas were used in the modeling. This approach provides 27 different representative model baking lines for analysis (see Table 4-1). The parameters chosen are optimized in some respects and may not reflect the mode of operation of some bakeries. For instance, many bakeries do not operate 24 hours per day, their schedule being driven by
4-1

TABLE 4.1. MODEL OVENS
IO I I
12
I3 14
IS 16
17
I1
2 5,769
3 8.6%
4 11538
5 14423
6 17.308
7 24192 8 23.077
9 25962 IO ua46
2 5.769
3 8.6%
4 1lj38 5 14.423
6 17.308 7 24192 t 23.m 9 25362 10
2 5.769
3 8.6%
4 I IS38
5 14423
6 17.308 1 20.192
- - 8 23.m 9 25.962
2.25 0
225 0
225 0
225 0
225 0
225 0
225 0
22.5 0 225 0
4 0.5
4 0.5
4 0.5
4 0.5 4 0.5
4 0.5
4 0.5
4 0.5 4 0.5
425 0
4.2s 0 -
4.25 0
4.2s 0
425 0
4.25 0
4.25 0
4.13 0
1.63
1.63
1.63 1.63
1.63
I .63
I .63
1.63
1.63
5.67 5.67
5.67 5.67
5.67 567 . 5.67
5.67
5.67
5.15
3.19 - -
5.15
5. IS 5.15
5.1s
5.15
5.15
0
0
0
0
0
0
0
0
0
1.38
1.38
1.38 1.38 1.38
1.38
1.38
1.38
1.38
0
0 -
0
0
0
0
0 - 0
4.4
4.4
4.4
4.4
4.4
4.4
4.4
4.4
4.4
5.4
5.4
5.4
5.4
5.4
5.4
5.4
5.4
5.4
6.9
6.9
6.9
6.9
6.9
6.9
6.9
6.9
13 19
25
32 38
44
51
57 63
16
23
31
39
47
55
62 70
n
20
30
40
50
60
70
80
90
4- 2

- -
orders, holidays, and seasonal variations. In the case of bakeries operating less than 24 hours per day, the decrease in hours means a decrease in emissions, but since the control device need not be operated when the oven is not baking, fuel and other operating costs are also reduced. process parameters is discussed below.
Selection of the bakery
4.1.1 VOC Emission Factors
In the absence of specific source tests, the emission of Voc's from bakery ovens is best described by a formula relating yeast concentration and total yeast action times (mixing, proofing, floor, and fermentation times) to VOC emissions as described in Chapter 2.0. Accgrding to this study and the AIB study on bakery oven ethanol emissions,' parameters such as dough type (sponge, straight, brew), sugar concentration in the dough, oven type, and bread type do not appreciably affect VOC emissions. In this study four bakeries were tested. The bakeries were chosen to test a wide variety of products indicative of the range in the industry. In this model, values for initial yeast ( Y i ) , total yeast action time (ti), final yeast (S), and spiking time (t,) that are known to result in a marketable product were chosen. These values reflect the range of values found in the dough formulas that were tested in this study and, therefore, represent a reasonable range of the industry.
4.1.2 Oven T m e and Number of Stacks
Model ovens were assumed to be directly fired by natural gas and have only one stack. a small portion of the known ovens, they are not considered. Since the products of combustion would presumably not enter the control device in indirectly fired ovens, the flow rate to the
Because indirectly fired ovens make up

- -
control device for indirectly fired ovens would be lower and the control device may be smaller, lowering control costs. Oven design (spiral, tunnel, tray) is not thought to affect emission levels.
stack oven will change the air flow distribution and, therefore, the distribution of emissions from individual stacks, the need to treat the exhaust from one or more stacks must be examined on a case-by-case basisO4 Such a site-specific engineering analysis is beyond the scope of this document. chapter assumes that each control technology would require an exhaust system ducting sufficient stacks in multi-stack ovens through a single plenum to a control device, in order to achieve the required level of emission reduction. An estimate for the increased capital cost of additional stacks is $40,000 per stack.
Because adjustments to exhaust stack dampers in a multi-
The analysis in this
4.1.3 Oven He at IntJut
Oven heat inputs from 2 to 10 MBtu/hr were selected in increments of 1 MBtu/hr. heat inputs for commercial bakery ovens. linear relationship between heat input, oven airflow, and bread production, and uses heat input as the independent variable; however, the physical quantity actually most affecting control device cost is airflow.
This is representative of the range of This analysis assumes a
4.1.4 Qven One ratincr Time
All ovens were assumed to operate 24 hours per day, five days a week (6000 hours per year) and represents common practice in the commercial baking industry.
4-4

4.1.5 Control Devices
Of the approximately 23 ovens currently controlled, 21 use catalytic oxidizers, one uses a thermal oxidizer, and one uses a regenerative oxidizer.' generated for catalytic and regenerative oxidizers.
Cost effectiveness analyses were
4.1.6 plow Rates
Flow rates are estimated by the same mathematical model used by the SCAQMD.8 Flow rates are calculated as a function of heat input. Assuming 7.37 lb air used in combusting 10,000 Btu of natural gas, 110 percent theoretical air as supplied, 0.0808 lb air per cubic feet,g and adding the resulting value to the 10 percent moisture" potentially evaporated from the white bread dough, flow rates can be calculated." The percent moisture loss will vary for other products. The values so derived were doubled to compensate for the increase in temperature and moisture.l2
4.1.7 Bread Production -
- Bread production is assumed to be a linear function of heat
The common design value of 520 Btu per pound of bread is input. usedi3 (see Table 4-1).
4.1.8 Destruction Efficiency
A destruction efficiency of 98 per cent is assumed, consistent with EPA policy.14 percent destruction efficiency is reasonable for oxidation based on the results of emission tests at incinerators in several industries. Certain existing control devices may have been designed for a lower control efficiency, such as 95 per cent. State or local agencies considering control of bakery VOC
The EPA policy maintains that 98
4-5

- -
emissions should'consider allowing facilities to continue to use these devices rather than requiring immediate replacement.
4.2 COSTING METHODOLOGY GENERAL ASSUMPTIONS
costs: e e
0
0
e 0
e
e
The following assumptions were made in estimating control
All costs are presented in 1991 dollars; The factor method used is nominally accurate to within f 30 per cent; The site is readily accessible by rail or road; Control devices are dedicated to single ovens (one oxidizer per oven) ; Costs of combining multiple stacks are not included; There is no salvage value for the used control equipment at the end of its service life; No site preparation or Civil engineering cost other than the amount allowed by the OAQPS Control Cost Manual is included (site-specific costs such as roof reinforcement is not included); and Utilities are available at the site.
4.3 COST ANALYSIS
Tables 4-2a and 4-2b summarize the parameters, total capital investment, utility costs, and total annual cost used in the cost analyses for catalytic and regenerative oxidization.
.
4.4 COST EFFECTIVENESS
Tables 4-3a and 4-3b summarize the cost-effectiveness of catalytic and regenerative oxidation as control technologies for bakeries. As reflected in the tables, the technologies become m~re cost-effective as the size of the oven increases. The cost of control decreases per ton of VOC removed and per pound of bread produced as the oven size (and therefore, production capacity) increases.
effectiveness of catalytic and regenerative oxidation. Figures 4-1 and 4-2 graphically summarize the relative cost-
The
4-6

. -
TABLE 4-2a. COST OF CATALYTIC OXIDATION. Total Capital Total
Case Investment Natural Gas Usage Electricity Usage Annual Cost
No. ($1 (sch) 0cwy.r) GtYr) ($tvr>
10 11 12 13 14 1s 16 17 18
19 20 21 22 23 24 25 26
$84,000 $106,000 $ 1 24,000 $140,000 $155,000 d169,OOO $1 82,000 $ 1 94.000 $206,000
$84,000 $ 106,OOO 1s 124,000 $ 1 40,000 6 155,000 $ 1 69,000 $182,000 s 194,000 $206.000
$84,000 S 1 06,OOO $ 124,000 $ 140,000 $155,000 $ 169,000 $ 1 82,000 s 194;OoQ
1.5 2.3 3.0 3.8 4.6 5.3 6.1 6.8 7.6
1.2 1.8 2.3 2.9 3.5 4.1 4.7 5.3 5.9
0.7 0.9 1.2 1.5 1.9 2.2 2.5 2.8
$1,800 $2,700 $3,600 $4,500 $5,400 $6,300 $7,200 $8,100 $9,060
61,400 $2.100 $2,800 $3,500 $4.200 $4,!Joo $5,600 $6,300 u7,0oo
$800 $1,100 $ 1,500
$2,200 $2,600 $2,900 $3,300
$1,800
11,000 16.500 22,000 27,600 33,100 38,600 44,100 49.600 55,100
11,OOO 16,500 22,OoO 27,500 33,100 38.600 44,100 49,600 55,100
11,OOO 16,500 22,000 27,500 33,000 38,500 44,000 49,560
$700 $ 1,000 $ 1,300 $ 1,600 $2,000 $2,300 $2,600 $2,900 $3,300
$700 $1 ,Ooo $1,300 $1,600 $2,000 $2,300 $2,600 $2,900 $3,300
$600 $ 1,000 $1,300 $ 1,600 $1,900 $2,300 $2,600 $2,900
$36,000 $42,000 $47,000 $52,000 $56,000 $60,000 $65,000 $68,000 $72,000
$36,000 $4 1,000 $46,000 $5 1,000 $55,000 $59,000 $63,000 $67,000 $70,000
$35,000 $40,000 $45,000 $49,000 $53,000 $57,000 $60,000 $64,000
27 $205,000 3.1 $3,700 55,OOO $3,200 $67.000 (
For updatiug Total Annual Costs, current utility rates should be verified with utility companies and the appropriate correction applied. The additional cost for more than one stack has NOT been used in this calculation. Although this cost would be based on oven size and other site-specific characteristics, an increase jn capital cost of $40,000 per stack can be used. This would translate to an annual cost of $40,000 multiplied by a capital recovery factor (CRF) of 0.1628 and would equal S6.S 12.00.
4-7
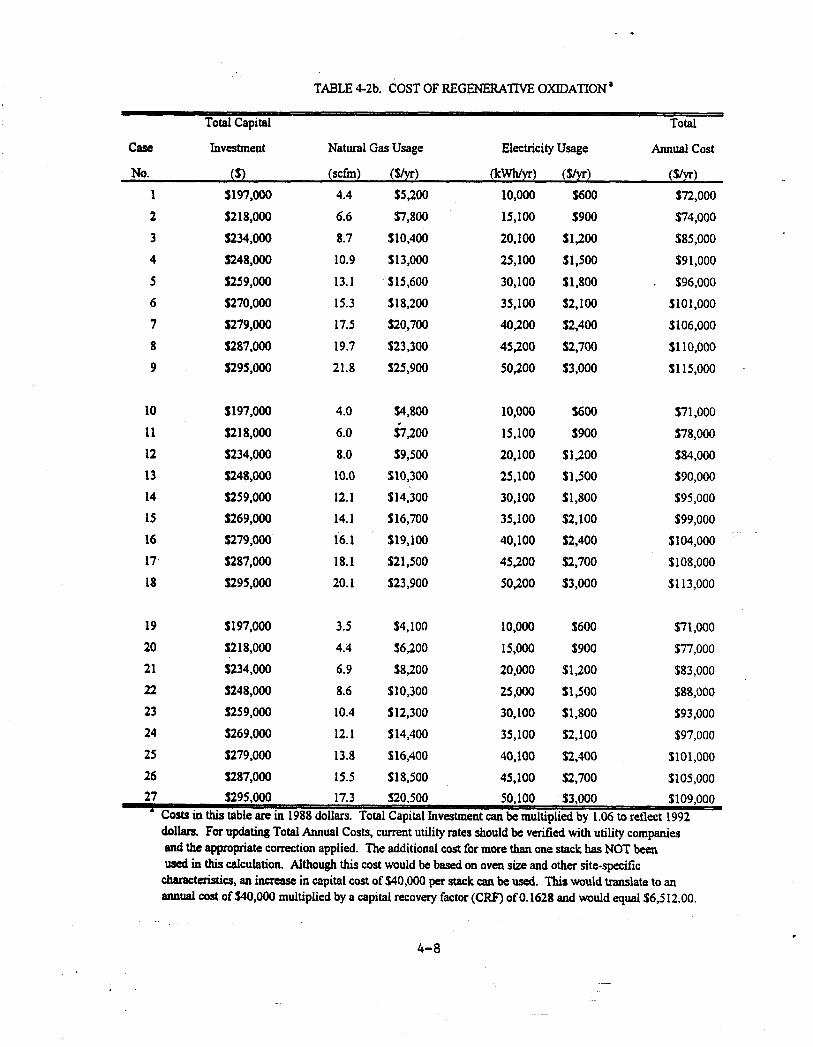
TABLE 4-2b. COST OF REGENERATIVE OXIDATION’
Total Capital Total
CaSe Investment Natural Gas Usage Electricity Usage Annual cost
No. ($1 (scfm) (Sly) ocWh/yr) (SlYr) (Sly) 1
2 3 4
5 6 7
8 9
10
11 12 13 14 15 16 17 18
19 20
21 22
23
24
25 26
$197,000 $2 1 8,000
$234,000 $248,000
$259,000 $270,000 $279,000
$287,000 $295.000
S 197.000
$2 1 8,000
$234,000
5248,000 $259.000 $269,000
$279,000 $287,000
$295.000
$ 1 97,000
$2 18,000 $234,000
$248,000 $259,000
$269,000
$279,000 5287,000
4.4
6.6
8.7 10.9
13.1 15.3 17.5
19.7
21.8
4.0
6.0 8.0 10.0
12.1 14.1 16.1
18.1
20.1
3.5 4.4
6.9
8.6 10.4
12.1 13.8
15.5
$5,200
$7,800 $10,400
0 13,000
$15,600 S 18,200 $20,700
$23,300 $25,900
54,800
$7,200
$9,500 $10,300
S 14,300 $16,700
$19,100 $2 1,500
$23,900
$4,100
$6,200
$8,200 $10,300 $12,300 $ 14,400
91 6,400 $18,500
10,000
15,100
20.100
25,100
30,100 35,100 40,200
45,200 50,200
10,000
15,100
20, 100 25,100 30,100
35,100 40,100
45,200 5OJOO
10,000
15,000 20,000
25,000 30,100
35,100
40,100
45,100
$600
$900
SlJOO s 1,500
$1,800
$2,100
$2,400
$2,700 $3,000
$600
$900
SlJOO $1,500 $1,800 $2,100 $2,400
$2,700 $3,000
$600
$900
s 1,200 $1,500
51,800
$2,100
$2,400 $2,700
$72,000 $74,000
$85,000
$9 1,000
$96,000
s1o1,ooo
$1 10,000 $1 15,000
$106,000
$71,000
$78,000 $84,000 $90,000
599,000 $ 104,000
$108,000
$1 13,000
$95,000
$71,000 $77,000
$83,000
$88,000
$93,000
$97,000
$1 0 1,000 $105,000 5109,000
1.06 to reflect 1992 dollan. For updating Total Annual Costs, current utility rates should be “ e k e d wi;h utility companies and the appropriate correction applied. The additional cost €or more than one stack has NOT been wd in this calculation. Although this cost would be based on oven size and other site-specific
characteristics, an increase in capital cost of $40,000 per stack can be used. This would translate to an annual cost of S40,000 multiplied by a capital recovery factor (CRF) of 0.1628 and would equal $6,5 12.00.
4-8

TABLE 43% COST EFFECTIVENESS OF CATALYTIC OXIDATION AT BAKERY OVENS
CaSe VOC Emissions VOC Reductions Bread Production Cost Effectiveness
No. (tondyr) a (todyear) (IWYr) ($/ton VOC) ($Ab bread)
11,538,000 $2.945 0.003 1
17,308,000 $2274 0.0024 13 12
25 25
19 18
23,076,000 $1,913 0.0020 --
lo 11 12
13
14
I5 16 17 la
19
20 21
22
23 24 25 26
52
38
44
5! 57 63 * 1$
* 2 f 31 39
47
55 62 70 78
20 30
40 50
60 -n
31 37
43
49 55 62
15 *
23 30
38
45
53
61 68
76
28,846,000
346 16,000
40384.000
46,154,000
51,924,000 57,692.000
* 11,538.000
17308,000
23.076.000 28,846,000
34.6 16.000
40384,000 46.154.000 5 1,924,000 57,692,000
S 1.684
S 1,524
$1,404
$1.311 $1236 $1.173 .
$2.364
si.ai9 S 1.526
$1,340
$1210
61,113
11,037 $976
$925
0.00 1 1
0.0016
0.0015
0.0014 0.00 13
0.00 13
0.003 1
0.0024
0.0020
0.0018
0.00 16
0.0015
0.0014
0.0013 0.0012
S 1,797 0.003 1 91.372 0.0023
20 11,538,000
29 17,308,000
39 23,076,000 49 28.846.000
59 34.6 16,000
31,145 0.0019
S1,OOl 0.0017
$90 1 0.0015
sa25 0.0014
79 46.154.000 $767 0.00 13
I V 69 40,384.000
90
a0
. 4- 9
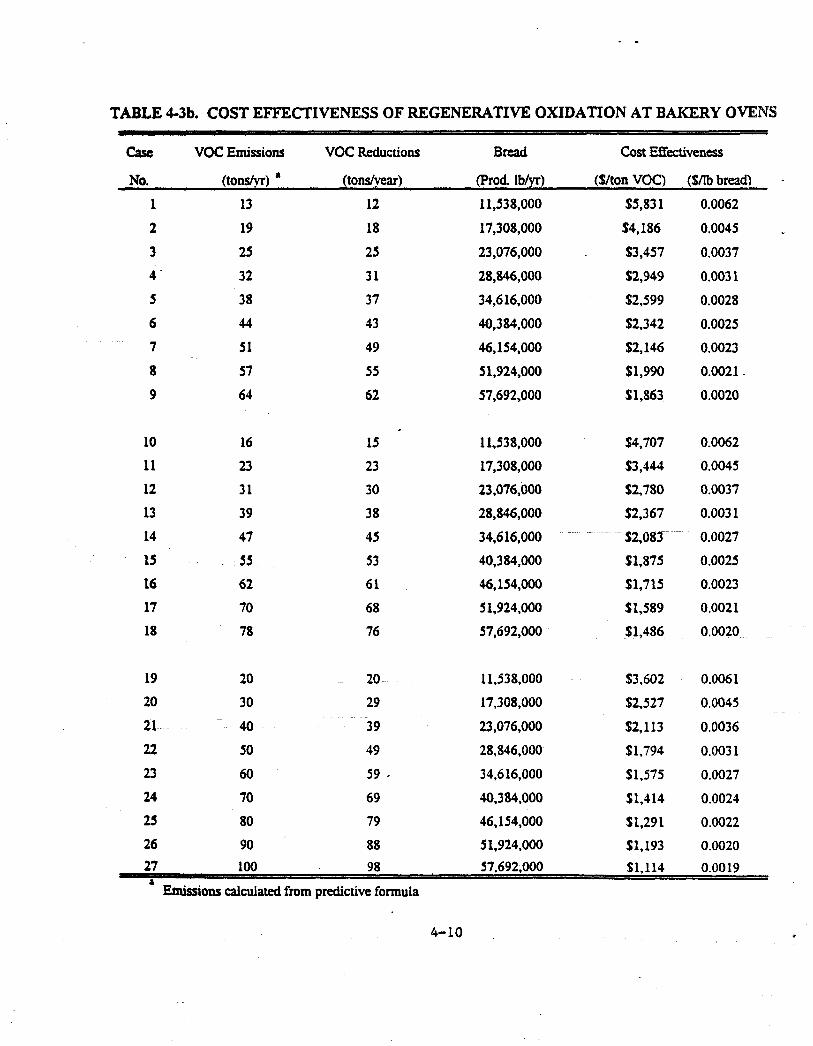
TABLE 4-3b. COST EFFECTIVENESS OF REGENERATIVE OXIDATION AT BAKERY OVENS ~ _ _ _ _ _ ~
case VOC Emissions voc Reductions B d Cost Effectiveness
No. (tons/yr) a (tondvear) (Prod. Ib/yr) ($/ton VOC) ($Ab bread) -
1 13 12 11,538,000 $5.83 1 0.0062
2 19 18 17,308,000 $4,186 0.0045
3 25 25 23,076,000 $3,457 0.0037
4 32 3 1 28,846,000 $2,949 0.003 1
5 38 37 34,616,000 $2.599 0.0028
6 44 43 40,384,000 $2,342 0.0025
7 51 49 46,154,000 $2,146 0.0023
8 57
9 64
10 16
11 23
12 3 1
13 39
14 47
15
16
17
18
55
62
70
78
55 5 1,924,000 $1,990 0.0021 -
62 57,692,000 $1,863 0.0020
I5 11,538,000 $4,707 0.0062
23 17,308,000 $3,444 0.0045
30 23,076,000 $2,780 0.0037
38 28,846,000 $2,367 0.003 1
45 34,616,000 32,083 0.0027
53
61
68
76
40,384,000 $1,875 0.0025
46,154,000 $1,715 0.0023
5 1,924,000 $1,589 0.0021
57,692,000 $1,486 0.0020
19 20 20 11,538,000 $3,602 0.0061
20 30 29 17,308,000 $2,527 0.0045
21 40 39 23,076,000 $2,113 0.0036
22 50 49 28,846,000 $1,794 0.003 1
23 60
24 70
59 ' 34,616,000 $ 1,575 0.0027
69 40,384,000 $1,414 0.0024
25 80 79 46,154,000 $1,291 0.0022
26 90 88 51,924,000 $1,193 0.0020 $1,114 0.0019
Emissions calculated from predictive formula
4-10

4.4 Ib VOC/ton bread
__c)__ 5.4 Ib VOC/ton bread - 7.0 Ib VOC/ton bread
e

Fc I N c
I
I
Figure 4-2 Cost Effectiveness of Regenerative Oxidation on Bakery Ovens
6,000
5,000
cc E 8 4,000 E - P E s 5 2,000
2 3,000
> 0 c
0
1,000
0
........ ._ ......
................. ___.
1 OM 3M 4M 5M 6M 7M 8M 9M 2M
Oven Heat Input (Btulhr)
_+_ 4.4 Ib VOChon bread
-u- 5.4 Ib VOCEton bread - 7.0 Ib VOCEton bread
,

minimum, average, and maximum cost per ton of VOC removed is labeled on each graph. These cost-effectiveness curves can be used to evaluate the cost of VOC removal for an individual oven.
Because it is rare that an oven is dedicated exclusively to the baking of one product, the VOC emissions for each product typically baked in an individual oven must be estimated. individual product estimates are multiplied by their annual production tonnage and then summed to reflect actual total emissions from the oven. sum of the individual annual production tonnages. is in pounds of VOC emissions per ton of bread.
These
This sum should then be divided by the This quotient
For example:
(4.4 lb/ton) (1000 tons/year) = 4400 lb/yr (5.4 lb/ton) (2000 tons/year) -= 10800 lb/yr (7.0 lb/ton) (5000 tons/veay) = 35000 lb/vr
(8000 tons/year) 50200 lb/yr = 25 tons/yr
(50200 lb/yr) / (8000 tons/yr) = 6.3 lb/ton
4-13 . -

.

- -
4.5 REFERENCES
1. Vatavuk, W. M. OAQPS Control Cost Manual, Fourth Edition. EPA 450/3-90-006. U. S. Environmental Protection Agency. Research Triangle Park, 1990.
2. Stitley, J. W., K. E. Kemp, B. G. Kyle, and K. Kulp. Bakery Oven Ethanol Emissions - Experimental and Plant Survey Results. American Institute of Baking. Manhattan, Kansas. December, 1987. p. 11.
3. Ref. 2, p. 11.
4. Fischer, H., APV Baker, to Giesecke, A. , American Bakers Association. April 22, 1991. Exhaust levels of a multi-stack oven.
5. American Institute of Baking. Draft: Control of Ethanol Emissions from Ovens. Manhattan, Kansas. August, 1988. p. 15.
6. Frederiksen Engineering. 'Study and Conceptual Cost Estimate- Bakery Oven Ethanol Abatement. Oakland, California. October, 1990. p. 11.
7. Telecon. W. Sanford, Research Triangle Institute (RTI), with T. Otchy, CSM Environmental Systems, Inc. March 18, 1992. Oxidation.
8. South Coast A i r Quality Management District. Rule 1153 - Commercial Bakery Ovens. El Monte, California, November, 1990. p. 32.
9. Perry, R. H. Perry's Chemical Engineer's Handbook. New York. McGraw-Hill. 1984. pp. 9-38.
10. Pyler, E. J., Baking Science & Technology, Sosland Publishing Company. Volume 11, 1988. P. 590.
11. Telecon. Sanford, W., RTI, with Doerry, W., American Institute of Baking. August 19, 1992. Flow rates in bread baking ovens.
12. 4ef. 8 .
13. Ref. 11, p.763.
14. Memorandum from Farmer, J.R., U . S . Environmental Protection Agency, to NSPS contractors. August 22, 1980. Thermal Incineration and Flares. p. 1.
4-14


- .
APPENDIX A
TABLES REFERENCED IN SECTION 2.1 - INDUSTRY DESCRIPTION
. .-
A-1

A-2

w
a
I '
1
Table A- I . Number of Bakeries by Product Category and Number of Employees' I
I Products Produced 1
I 1-19 I 20-49 I I
White pan bread I 75 289
Number of Employees
0

A-4

Table A-2 TOP leb Ret- To S a h (%)'
1 I I I I I I I
1. Nabiro Braad# USA. 2,600 9 9,500 1.600 20 1s 30 15 20 0 Biscuit Div?
I 2. Continental Baking C O ? ~ 1,836 37 22,400 7.000 13 12 45 5 25 0
3. Kccblcrco.' 1.495 10 9.757 NA 18 19 50 6 7 0
4. Campbell Taggatt, h.- 1,400 53 20,000 5,100 0 45 15 25 15 0 I I
5 . General Foods Baking 17 9,600 NA NA NA NA NA NA NA
1,079 29 14.800 4.000 0 36 29 10 25 0
7. Flower8 IndUJriClP 782 28 9,500 1.500 0 ' 100 0 0 0 0
8. Peppcridge Farm, lac.** 582 7 5 W J 1.500 52 18 18 7 5 0
9. Sunshine Bincuita, lac.' 540 5 3,800 NA NA NA NA NA NA NA
10. Sara Lee Bakery'* 502 6 1.550 NA 20 20 30 10 20 0
11. CPC Wemtioarl lac. & a ~ So0 I 1 4,800 2,000 30 20 10 15 20 5 Foods Baking Group* I I I I I I I
12. Lance, h. 446 2 5,911 2,442 20 59 8 13 0 0
13. Mck &king Co.* 434 22 6,500 1,443 0 0 96 0 4 0
14. Weston Bakcrier, Ltd.h 420 12 3.600 709 0 0 0 0 0 100
15. McKce Baking Co. 395 2 3,700 500' 12 42 26 16 4 0
5 26,000 10,OOO 15 25 25 15 20 0
17. Rich Roducts Cop.* 8 1,785 NA 26 13 30 12 19 0
18. SIrochmsnn Bror. Co.'* 10 4,500 600 100 0 0 0 0 0
9. Culiarr, Inc. 7 1,700 320 5 0 0 0 0 95
16. Fri~o-Lay, Inc?
I i; L

Table A-2 (continued)
22. M u k i - M ~ ~ j ~ r . b.' 268 19 3,750 1,280 0 0 0 0 0 100
23. Chef Picrrc' 229 2 1.200 0 20 20 25 20 I5 0
24. Safcway Stom, Bakery 225 7 900 0 0 20 0 8 72 0
25. Mn. Smilb'r Frozcn 218 6 1,357 0 25 10 45 10 10 0
26. Corpoatc Foob, Ltd.' 200 5 950 270 4 0 6 0 0 90
27. Interbake Foodr. krc. 195 4 2.000 20 20 10 30 0 40 0
28. Tasty W n g Co.* 191 1 1,200 500 80 15 5 0 0 0
29. Mn. Baid'r BakericE 175 11 3.000 650 0 0 0 100 0 0
30. Nodhear( FoodC 159 7 1 110 80 20 0 0 0 0
# 1. Country Homo Bakery, 157 5 1,600 40 31 14 34 6 15 0
I2. J.J. Niracn Baking Co.* 151 4 1,300 450 100 0 0 0 0 0
13. M W NicUcr Bakce 150 5 2.000 500 20 2 78 0 0 0
14. Archwry Cookicr 140 9 900 600 20 10 50 10 10 0
15. Gai'r Sea& Fmnch 140 2 2.200 350 0 0 0 0 85 I5
16. Huclwood Famu 140 3 800 NA 20 25 21 18 16 0
4 700 80 35 I5 40 0 20 0 17. Lender'r Bagel Bakery 140
8. MCGIYM Bakcricfl 140 3 1,500 NA 5 5 70 0 20 0
Div.'
F d r .
laf .'
Baking Co..
Bakeries. hc.*

Table A-2 (continued)
40. Chrirtie Brown Co. 129 5 1,450 0 0 0 0 0 0
0 100 41. Good Stuff Bakery 120 3 1.600 400 0 0 0
42. Drake Baktnefl I I5 3 1,521 503 97 3 0 0 0
43. Sin Francis0 Fmnch 1 IO 10 Is25 300 5 0 I5 5 75 Bread Co.9
C
E
C
C
44. Sourhem Baken:~, Inc.. 102 3 982 246 0 100 0 0 0 a a
46. Newly Wed Foodr, Inc.9 100 3 410 0 50 30 10 0 10 a 47. Schmidt Baking Co., Inc.9 , 100, 4 . 1.400, 400. 10. 0 . 0 . 0 . a
0 100 45. Mother'r Cake & Cookie 100 1 NA 0 0 0 0 CO.'
48. Mission Foodr 7 600 220 0 0 0 35 65 a 49. Lewir B m . Bakcrier, IncJ 1.600 280 0 30 70 0 0 a
5 1. Schwcbcl Baking Co.. 81 3 1,100 300 30 0 70 0 0 a 52. Smil 'r Bakery, Inc.. 81 2 610 128 0 100 0 0 0 0
13. The Bachnun Co. 80 3 525 339 96 1 1 0 1 I
54. Perfection Biscuit Co., Inc. 80 5 950 400 0 0 100 0 0 0
is. Kcm'r & Aseoc. Bakericfi 79 4 1,100 362 0 100 0 0 0 0
i6. Klostemn Baking Co.. 76 5 830 170 0 20 80 0 0 0 I
i7. United States (Franz) 76 4 980 235 0 0 0 0 100 B e k e v
0
I 130 2 I2 83 2 1 0 ;8. Alpha Baking Co.9 75 3 900

Table A-2 (continued)

Table A-2 (continued)
1990 Rink Conpiny M h
(mil$)
80. Cnckin'aood &ken Inc. 49'
81. Ben'r Limit& 46
82. Meycr'a Bakericr, Iac.' 44'
83. Schulzc & Bush Biruit 42 co.
Plintr
1
,. 4
4
I
370 0 0 100
500 100 0 0
48 I 70 10 30
7001 O I O I 25
I Swthwerl yi
0 75 I O 1
84. Mra. Alison% Cookie Co. 40 2 375 27 20 20 45 5 10 0
65. Edwad'r Baking Co. 38 I 200 0 15 40 10 20 I5 0
86. Fink Banking COT? 38 1 420 99 100 0 0 0 0 0
87. New Southweat Baking 35 1 200 0 0 . 4 0 0 60 0 0
320 0 0 100 0 0 0 0
I I50 0 70 20 10 0 0 0
PO. Gonaclli Baking CoJ 3 325 75 0 0 100 0 0 0
)I. Pan-o-Oold Holwm 33 2 500 100 0 0 100 0 0 0 Baking Co.*
b2. Sterling F d r , h.* 32 I NA NA NA NA NA NA NA NA
13. Bum Unlimited, Inc! 31 3 225 NA 0 30 35 0 25 0
14. Vcnice Bakery' 31 1 353 65 0 0 0 0 5 95
'5. Bridgford Food1 Cow. 30 4 200 0 I5 15 25 15 30 0
16. Intcmtional Baking 30 2 300 100 0 20 0 10 0
17. Lucerne Foods. Us.* 30 3 300 0 0 0 0 0 0 100
8. Modem Maid Food 3 375 NA 20 35 45 0 0 0
9. Pioneer Frrnch Baking 350 80 0 0 0 0 100 0
70
PrOdUCl8, Inc .'

Table A-2 (continued)
%ubridmy of RJR Nabirco, lac. 'Subsidimry of Il.lrtoa Purim. lac. 'Subridimry of Uniced Bircuiu PLC 'Subridmy of Anhcurcr-Busch, lac. 'Includer EJIICOIIL~M'S. lac., h w m t Foods Co.. Char. Freibofcr Baking Co. 'Subridiuy of Campbcll Soup. lac. 'Subridirry of 0. F. Induetrier, lac. 'Subsidmy of Sam Lcc Cop bubsidiary of Gcorgc Wceton Ltd. %bsidisry of Pepsi Co., Inc. 'Includcr only Twtykrkc Co. bakery nlcr ~Purchascd by Culilur, Dec. 31, 1990 sFormcdy with BSN G m p c 'Wholenlc bakery NICO only, pending NIC to Yimurki Baking *For~ncdy Empresr Foods Ltd. %imariIy producing bread and mUr ?
O I-

- - Table A-3. Plants By Bakery Type, Region and State.
Dist. of Columbia g l l 2 1 9
Maine I 17 I 0 I 0 I 1 18 Massachusetts I 5 4 1 2 1 1 2 1 17 I 85
New 7 0 1 1 9 - Hampshire
New Jersey 80 0 . 8 30 118
New York 169 1 19 29 21 8
Pennsylvania 123 1 16 36 176
Rhode Island 12 0 0 1 13
Vermont 5 0 0 - 2 7
Total 499 5 63 724 69 7
I I I I
Illinois 91 3 16 30 140
Indiana 31 3 4 18 56 Iowa 15 0 2 4 21
Minnesota 31 3
Missouri 27 2 2 7 38
Ohio 66 5 18 25 114
Wisconsin 38 5 10 10 63
Total 355 26 75 122 578
Michigan 56 -- 5 16 19 96
A-If

- - Table A-3 (continued)
- Cookie &
Grocery Multi-Unit Cracker/ Resion Wholesale Chain Retail Frozen Food Total
I .
South Carolina
West Virginia 5 0 1 2 8
Total 297 7 32 87 423 -~ -
Arizona 25 1 0 3 29
New Mexico 6 0 1 3 10
0 kia homa 13 0 2 3 18
Texas a7 5 6 25 123 Total 7 3 7 6 9 34 180
--,--
b
A-12

- . Table A-3 (continued)
A-13

.
- .

- .
APPENDIX B
BAKERY OVEN TEST RESULTS
B-1


J
Bakery Oven Test Reeulte
lnilidYcasl(YhB%)
Find Y W ( S hB%) YCUI A C I ~ Tim (ti in In)
B&c The (BI in min)
B&c Tanp (BF h d q F) WJcr (HN) in BH)
sp* T i (Is in hn)
sugu (SgI in E%) OvcnTypc
ROCClS
Sample Timc (min)
Bred Roduccd (Ib)
voc -4 (IMU)
Y *ti
Y *ti+S*Is
VOC m e w e d (IMon bed)
E1W-AI8 pedicled (Ibhon bred)
VOC-RTI @kkd (h bred)
Soldon 0ry-m ..+b
I
3.50
O M
5 om
18 a OW
409
49 ii 8 1!
1
1
sal
10898
40wo I7 192 I7 792 6 261 6 23 8 3 1
2
292 0.25 3.52 0.52 7. s 370
508
7 9 I 3
50
1681
30 499 IO 269 10 398 6613 4 80
5 03
3
2 92 0 25 3 58 0 58
110
405
s4 16 I 3
50
8438
30 068
IO 463 IO 609
5 939 4 75 5 12
4
2 37 0 25 3 53 0 53
22 0 410 60
0 3 I 3
50
922s 27 687 8 374 8 507 5 002
4 26 4 I9
5
292 0 25 3 58
0 58
200
410 61 0
I 3
50
8438 26 760
10 463 IO 609
5 286 4 75 s 12
6 7
231 425 025 0.00 353 5.15 053 000
200 190 370 390
635 55
9 8 I 2 3 I
50 so 9225 3527
8
2 80 000 272 ow 205
405
53 II 2 3
60
5465
9
300 000 5 67 ow 170 442 60 17
I I
50
6145
IO
260 0.00 2.8 OW 12.5 450 49 0
2 3
60 5116
25431 17.750 15473 14807 13038
8357 21818 7607 17000 7840
II
2.13 I .00
3.58 0.58
21.0 400 65 9.6
I 3
50
8438
12
2.80 0.00 2 97 000
II 0 450 49 0
2 3
60 4764
12618 12676 9.783 8307
849 21888 7607 17OOO 7840 10366 8307 4595 8388 5663 3659 4562 2504 5322 426 6 % 510 587 512 419 515 418 1014 379 7 % 389 501 4 1
I 3
4.00 0.50
5.67 1.38
203 410 61 0 I 3
85
6799
I4
1.50 0.00
-5.13 0.00
9.0
un, 53 14 2 I
50
4711 12548 11489 22.667 7.700
I5 . 16
2.80 2.50 3.00 1.25 3.17 3.92 1.43 1.67 18.0 20.5 409 403
93.5 104
4.7 I 5 2 2 3 1
6 0 5 0 4836 3609 7.475 6894
I 7
400 0.75 2.53 1.20 6.9 427 55.3 13.5
I 3
50
2818 4290
I 8 19 20
2 t o 350 225 1.00 000 000
3.6 163 163 1.23 000 000 I95 205 19.) 390 405 390 56 53 56
I2 I I I2 2 1 1 3 2 2
60 35 35 1997 513 718
3 . n ~ 2629 2047 I867 9792 10.133 10.060 5717 3615
23358 7700 13167 11875 11033 11313 5717 3615 5229 4065 3091 3184 2542 3788 5979 3326 5 3 8 433 244 298 480 370 5 % 436
IO79 313 626 568 531 543 295 204 623 480 475 426 475 426 6 % 510 5 8 1 512 419 515 5 3 8 4 3 3 244 298 480 370 5 % 4 %
e


- -
APPENDIX C
EXAMPLE CALCULATIONS OF COST ANALYSIS


OAQPS C ontrol Cost Analvsis for Catalvtic Incinerators
Section 3.4.1 - Steps Common to Regenerative and Catalytic Units
Step 1. Establish Design Specifications Enter the following data corresponding to the waste gas: Volumetric flow Rate, scfm (77 degrees f, 1 arm) Temperature, preheater inlet. Twi (Assume balance oxygen composition) Chemical Composition of Combustibles enter names here - > ethenol 1,939.00 ppmv please use two most combustible
447.00 scfm 100.00 deg. F
acetaldeh yde 19.39 ppmv compounds. If less than two, please enter 1's to avoid division by zero errors
Heating Value of Combustibles ethanol acetaldehyde
Enter hours per year of operation
Enter the following data specific to the incinerator: Desired Control Efficiency best to assume >0.901 Combustion Chamber Outlet Temperature Oesired Percent Energy Recovery, decimal
(choose: 0.0.35,0.50. or 0.70)
Step 2. Verify that the oxygen content of the waste gas exceeds 20%. Air Content = Oxygen Content =
Step 3. Calculate the LEL and the Percent of the LEL of the gas mixture Enter the LEL of the following compounds:
ethanol acetaldeh yde
sum of x sub i, i equals 1 m n-
Lower Explosive Limit of the mixture equals: Percent LEL of the mixture equals:
2,407.00 neg.de1.h sub c. BTUlscf 2.149.00 neg.de1.h sub c, BTUiscf
6,000.00 hoursiyear
0.98
0.7 700.00 deg. F
99.80 VOI. % 20.86 percent
3.25 vol. YO 32.500.00 ppmv 3.97 vol. % 39.700.00 ppmv - - - ---
1,958.39
34,997.41 ppmv 5.60 percent
if greater than 25%. dilution air should be added to avoid fire insurance regulettons
Step 4. Calculate the volumetric heat of combustion of the waste gas stream
heat of combustion, ethanol acetaldehyde
2.4G7.50 aTiisct 2,149.00 BTUlscf
Heat of combustion for the mixture is 4.71 BTUIscf
Assuming waste gas is principally air (molecular weight 28.97, dens& 0.0739 Iblscf), then
Heat of combustion per pound of incoming gas is 63.72 BTUilb
For catalytic applications the heat of combustion must normally be less than 10 BTUlscf (for VOC's in air).
c-2

Section 3.4.3 - Steps Specific to Catalytic Units
Step 5c. Establish desired outlet temperature of the catalyst bed, Tfi
b t e r catalyst bed outlet temp. assume 300-900 dog. F for 90-95% destruction efficiency maximum temp. of 1200 deg. F should not be exceeded
Step 6c. Calculate waste gas temperature at preheater exit
Define the following temperatures: Two. VOC stream leaving heet exchanger Twi. waste gas inlet temperature Tfo, flue temperature after heat exchanger Tfi, catalyst chamber outlet temperature
x = to be calculated thermal efficiency of heat exchanger -
Two is therefore calculated to be:
Tfo is therefore calculated to be:
Step 7c. Calculate the auxiliary fuel requirement. Qaf
bter the auxiliary fuel heat of combustion for methane, use 21,502 BTlJ/lb also for methane, rho = 0.0408 IbJscf
Qat is therefore calculated to be: this must be a positive number for burner flame stability
Summary of Variable Valuation Stream subscript j rho sub j
IN - Sensible Heat Auxiliary Air a nla Auxiliary Fuel af 0.0408 Waste Gas wo 0.0739
OUT_--Sensible Heat -
Waste stream fi 0.0739
Iblscf
Energy Balance around Combustor IN - Sensible Heat, rho*Q°Cpo(Ti-Tref)
Auxiliary Air Waste Gas
Wests Stream
ten percent of total enerev innut
OUT - Sensible Heat
OUT - Losses
Q sub j scfm
nla 0.70
447.00
447.70
subscript
a wo
fi
900.00 dog. F
x deg. F 100.00 dog. F x dog. F
900.00 deg. F
0.70
660.00 deg. F
340.00 dog. F
21,502.00 neg. del. h sub c sub of, BTUflb.
0.70 scfm
Cpm sub j T sub j BTUIX'F dag. F
nla nla not used 77 for methane 0.248 660.00 for air
0.248 900.00 assuming primarily air
Value, BTU/min I
0 4.776
6.753
675 -. . GENERATION -&at of Combustion, rho 'Q'(neg.de1.h sub c)
Waste Gas wo 2,105 Auxiliary Fuel af 617
Step 8c. Verify that auxiliary fuel requirement will stabilize burner flame
Five percent of Total Energy Input equals: Auxiliary Fuel Energy Input equals:
338 BTUlmin 617 BTU/min
c-3

If Aux. Fuel Energy Input is greater than 5% Total Energy Input, burner flame should be stable.
Step 9c. Estimate the inlet temperature to the catalyst bed, Tri
674.91 deg. F Tri is calculated to be:
225.09 deg. F Delta T (temperature rise across catalyst bed) equals:
Step 1Oc. Calculate total volumetric flow rate of gas through the incinerator, Qfi
Fiua Gas Flow Rate, Qfi. equals: 447.70 scfm
Step 1 IC. Calculate the volume of catalyst in the catalyst bed.
Given Qfi and nominal residence time, catalyst volume can be calculated.
First, adjust Qfi to petro-chemical industry Qfi(6O) = 433.53 cfm convention of 60 deg. F, 1 atm.
Input catalyst space velocity in per minute Precious metal catalysts vary: 166.67 to 1,000 /minute
Volume of catalyst bed therefore equals:
500 lmin
0.87 cubic feet
Section 3.5.1 - Estimating Total Capital Investment
Scope of Cost Correlations Total (flue)
Incinerator Type flow, scfm - Fixed-bed Catalytic 2.000-50.000 packaged fluid-bed Catalytic 2,000-25,000 packaged
If Qfi is outside these paremeters for the specific incinerator type, this costing formulation may not be used.
Section 3.5.1.1 - Equipment Costs, EC
Catalytic Incinerators
Total flue gas rate, Qfi heat recovery factor
Fixed-Bed and Monolithic Catalytic Incinerators Heat Recovery Equipment Cost , EC ipercenti I 988 dollars
0 $31,169 35 $46,727 50 936.518 70 s42. i ia
Fluid-Bed Catalytic Incinerators Heat Recovery (percent) 1988 dollars
Equipment Cost , EC
0 $90,710 35 $94.936 50 $93,674 70 $92,496
447.70 scfm 70 percent
delta P in. Water
0 4
15 a
delta P in. Water
0 4
15 a

- .
Section 3.5.1.2 - Installation Costs
Choose Equipment Cost based on Catalytic Incinarator type and Heat Recovery percent end enter bese equipment cost IEC) here - >
Section 3.5.2 - Estimating Total Annual Cost
Section 3.5.2.1 - Direct Annual Costs
Gtter the delta P, fixed-bed catalytic incinerato 161: Enter the delta P, fluid-bed catelytic incinerator 16- 101: Enter the delta P lbesed on heat recovery)
Number of hourslyear of operation: Enter the combined motorHan efficiency (decimal): Enter the cost per kilowatt hour of electricity: Enter natural gas unit cost in $/scf:
(from 3.5.1.1, above1
Fixed-Bed:Power (fan), in kilowatts, equals Fluid-Bed: Power (fan), in kilowatts, equals
Electricity Cost, Wyr, equals
Annual Fuel Cost: (Methane assumed to be combustor fuel) Rate of fuel usage
Annual Fuel Cost, in Wyr, equals
$44,410
6 in. Water 8 in. Water
15 in. Water
6000 hourslyear
0.059 $kWh 0.6
0.0033 Slscf
1.83 kW 2.01 kW
$649 per year Axed-bed $71 1 per year Fluid-bed
0.70 scfm $835 par year
Total Capital Investment Table 3-8. page 3-52, OAQPS Control Cost Manuel (EPA 45013-90-006, January 1990) Capital Cost Factors for Catalytic Incinerators
Direct Costa Purchased Equipment Costs
Incinerator (EC) + auxiliary equipment Instrumentation Sales Tax Freight Purchased Equipment Cost, PEC
Direct Installation Costs Foundation and supports Handling and erection Electrical Piping insuiation for auctwork Painting Direct Installation Cost
Gtter Site Reparetion Costs Gtter Buildings Costs
Total Direct Cost, DC
Indirect Costa (installation) Engineering Construction or field expenses
e-5
$44,410 as estimated,A $4.441 A 0.10 $1,332 A 0.03 $2,220 A 0.05
$52.404 B = 1.18 A
$4,192 B 0.08 $7,336 B 0.14 52,096 B 0.04 $ 1.048 B 0.02
$524 B 0.01 $524 B 0.01
$15.721 B 0.30
$0 As required, SP $0 As required, Bldg.
$68,125 B 1.30 + SP + Bldg.
$5,240 B 0.10 $2.620 B 0.05

- -
Contractor fees Start-up Performance test Contingencies Total Indirect Cost, IC
Total Capital Investment =DC + IC
$5,240 B 0.10
$524 B 0.01 $1,572 B 0.03
$16,245 B 0.31
si.04a B 0.02
$84,370 B 1.61 + SP + Bldg.
Total Annual Cost Table 3.10 page 3-54, OAQPS Control Cost Manual (EPA 450/3-90-006, January 19901 Annual Costs for Catalytic Incinerators
Total Capital Investment (from previous table) $84,370
Cost Item
Direct Annual Costs, DC Operating Labor
Operator Supervisor
Operating materials
Maintenance Labor Material
Catalyst Replacement
Utilities Natural Gas, Wscf Electricity, SlkWh
Total Direct Cost. DC -
Indirect Annual Costs, IC Overhead
Admin. charges Propew taxes Insurance Capital recovery
Total Indirect Costs, IC
Suggested Unit Cost Catalytic Factor fluid-Bed
0.5 hrs/shift S 12.96/hour $4,880 15% of operator $729
$0 - -
0.5 hrdshift S 14.26/hour $5,348 Equals Maint. Labor $5,348
Every 5 years S3500/cu.ft. (metal oxide) S 607
$ 0.0033 per scf $835 $ 0.059 per kWh $649 AXed-bd
$18,375
Sixty percent of sum of op., supv.. & maint. labor & maint. mat'l
TCl 0.02 TCI 0.01 TCI 0.01
CRF ITCl - 1.08 (Cat. Costll
S 14.340
s i ,687 $844 $844
$13.522
c,! S,89?*
Total Annual Cost TAC = DC + IC * $35,272 per year
based on user-provided hourslyear of operation CRF: The capital recovery factor, CRF, is a function of the catalyst or equipment life (typically, 5 and 10 years. respectively) and the opportunity cost of the capital (Le., interest rete). For example, for a 10 year equipment life and a 101 interest rate, CRF = 0.1028.
C-6


- -
OAQPS Control Cost Analvsis for Reaenerative Incinerators
Section 3.4.1 - Steps Common to Regenerative and Catalytic Units
Step 1. Establish Design Specifications Enter the following data corresponding to the waste gas: Volumetric Row R8te. scfm (77 degrees F, I atml Temperature, prehester inlet, Twi (Assume balanoe oxygen composition) Chemioal Composition of Combustibles enter names here -3 ethanol 1,939.00 ppmv please use two most combustible
447.00 scfm 100.00 deg. F
acetaldeh yde 19.39 ppmv compounds. if less than two, please enter 1's to avoid division by zero errors
Heating Value of Combustibles eth8noi acetaldeh yde
2,407.00 neg. del. h sub c, BTUlscf 2,149.00 neg. del. h sub c, EfUlscf
Enter the number of hours/year of operation: 6000 hourslyear
Enter the following data specific to the incinerator: Desired Control Efficienc y (best to assume > 0.901 Combustion Chamber Outlet Temperature Desired Percent Energy Recovery, decimai
0.98
0.70 1,600.00 deg. F
choose 0.0.35. 0.50, 0.70, or 0.95
Step 2. Verify that the oxygen content of the waste gas exceeds 20%. Air Content = 99.80 Vol. % Oxygen Content 20.86 percent
Step 3. Calculate the LEL and the Percent of the LEL of the gas mixture Gmr the LEL of the following compounds:
ethanol acet8/deh yde
sum of x sub i, i equals 1 to n
Lower Explosive Limit of the mixture equals: Percent LEL of the mixture equals:
if greater than 25%. dilution air should be added to avoid fire insurance regulations
3.25 vol. % 3.97 vol. %
1,958.39
34,997.41 ppmv 5.60 percent
Step 4. Calculate the volumetric heat of combustion of the waste gas stream
heat of combustion, ethanol acetaldehyde
2,407.00 BTUlscf 2,149.00 BTUlscf
Heat of combustion for the mixture is 4.71 BTUlscf
Assuming weste gas is principally air (molecular weight 28.97, density 0.0739 Iblscf), then
Heat of combustion per pound of incoming gas is
Section 3.4.2 - Steps Specific to Regenerative Units
63.72 BTUAb
1.600.00 deg. F
Step 5t. Establish incinerator operating temperature, Tfi
operating temperature (comb. chamber outlet temp.)
Step 6t. Calculate waste gas temperature at preheater exit
c-? _-
32500 ppmv 39700 ppmv

Define the following temperatures: Two, VOC stream leaving heat exchanger Twi, waste gas inlet temperature Tfo. flue temperature after heat exchanger Tfi, incinerator operating temperature
x = to be calculeted
thermal efficiency of heat exchanger =
Two is therefore calculated to be:
Tfo is therefore calculated to be:
x deg.F 100.00 dag. F
x deg.F 1,600.00 dog. F
0.7
1,150.00 dag. F
550.00 dag. F
Step 7t. Calculate the auxiliary fuel requirement, Qaf
Enter auxiliary fuel heat of combustion 21,502.00 neg. del. h sub c for methane, use 21,502 BTUAb also for methane, rho = 0.0408 Ib./scf
sub af, BTU/lb.
Qaf is therefore calculated to be: 3.45 scfm
Summary of Variable Valuation Stream subscript j rho sub j Q sub j Cpm sub j T sub j
Iblscf scfm BTUIX'F dag. F IN - Sensible Heat Auxiliary Air a nle nla nie nla Auxiliary Fuel af 0.0408 3.45 not used 77.00 for methane Waste Gas wo 0.0739 447.00 0.255 1,150.00 for air
OUT - Sensible Heat Waste stream fi 0.0739 450.45 0.255 1,600.00 assuming
primarily air
Energy Balance around Combwtor subscript IN - Sensible Heat, rho*Q*Cp*(Ti-Tref)
Auxiliary Air a Waste Gas wo
Waste Stream fi
ten percent of total energy input
Waste Gas wo Auxiliary Fuel af
OUT - Sensible Heat
OUT - Losses
GENERATION -Heat of Combustion. rho'Q*(neg.del.h sub c)
Step 8t. Verify that auxiliary fuel requirement will stabilize burner flame
Five percent of Total Energy Input equals: Auxilierg Fusl Energy Input equals:
If Aux. Fuel Energy Input is greeter than 5% Total Energy Input, burner flame should be stable.
Value, BTUImin
0 9,038
12.928
1.293
2.105 3,029
646 BTUImin 3.029 BTUlmin
Step 9t. Calculate Total Volumetric Flow Rate of gas through incinerator, Qfi
Flue Gas flow Rate, Qfi, equals: 450.45 scfm
Section 3.5.1 - Estimating Total Capital Investment - C-8 -
r . --

- -
Scope of Cost Correlations Total (flue)
Incinerator Type flow, scfm Thermal - regen. 500-50,000 field-erected Thermal - recup. 10.000-1 00,000 packaged
If Qfi is outside these parameters for the specific incinerator type, this costing formulation may not be used.
Section 3.5.1.1 - Equipment Costs, EC
Regenerative Incinerators
Total flue gas rata, Qfi heat recovery factor
Heat Racovery (percent)
0 35 50 7 0
95
Section 3.5.1.2 - Installation Costs
Equir”nt Cost, EC 1988 dollars
343,403 $64,749 $78,672 598,321
$225,612
Choose Equipment Cost based on Heat Recovery percent and Enter base equipment cost tEC) here ->
450.45 scfm 0.7
delta P in. Water
0 4 8
15
35
S 103,671
Section 3.5.2 - Estimating Total Annual Cost
Section 3.5.2.1 - Direct Annual Costs
4 in. Water 15 in. Water
Enter the delta P for a regenerative incinerator (4): h ter the delta P (based on heat recovew)
Number of hourslyear of operation: Enter the combined motorMan efficient y /decimal): Enter the cost per kilowatt hour of electricity: Enter natural gas unit cost in $/see
lfmm 3.5.7.7, above) 6000 hourslyear
0.6 0.059 SkWh
0.0033 Slscf
~ o w e r (fan), in kilowatts, equals
Electricity Cost, $/yr, equals
1.67 kW
$591 per year
Annual Fuel Cost: (Methane assumed to be combustor fuel) Rate of fuel usage 3.45 scfm
54,102 per year Annual Fuel Cost, in Slyr, equals
Total Capital Investment Table 3-8, page 3-52, OAQPS Control Cost Manual (EPA 45013-90-006, January 1990) Capital Cost Factors for Regenerative and Catalytic Incinerators
Diroct Coat8 Purchased Equipment Costs
c-9

- -
Incinerator (EC) + auxiliary equipment Instrumentation Sales Tax Freight Purchased Equipment Cost, PEC
5103,671 as estimated,A 510,367 A 0.10 53,110 A 0.03 55,184 A 0.05
5122,332 B = 1.18 A
Direct Installation Costs Foundation and supports Handling and erection Electrical Piping Insulation for ductwork Painting Direct Installation Cost
59,787 B 0.08 517,126 B 0.14
54.893 B 0.04 52,447 B 0.02 51,223 B 0.01 51,223 B 0.01
536,699 B 0.30
Enter Site Preparation Costs: €her Buildings Costs:
Total Direct Cost, DC
SO As required, SP SO As required, Bldg.
5159,031 B 1.30 + SP + Bldg.
Indirect Costs (in8tallation) Engineering Construction or field expenses Contractor fees Start-up Performance test Contingencies Total Indirect Cost, IC
Total Capital Investment = DC + IC
512,233 B 0.10 56.117 B 0.05
512.233 B 0.10 52,447 B 0.02 51,223 B 0.01 53.670 B 0.03
537,923 B 0.31
5196,954 B 1.61 + SP + Bldg.
Total Annual Coat Table 3.10 page 3-54, OAQPS Control Cost Manual (EPA 45013-90-006, January 1990) Annual Costs for Regenerative and Catalytic Incinerators
Total Capital Investment (from previous table) $1 96,954
Regenerative
54,800 5729
so
55,348 55,348
54,102 5591
520,976
59.770
Cost Item Suggested Factor
Unit Cost
Direct Annual Costs, DC Operating Labor
Operator Supervisor
0.5 hrdshift 15% of operator
Operating materials
Maintenance Labor Material
0.5 hrs/shift Equal to Maint. Labor
Utilities Natural Gas, Slscf Electricity, SkWh
S 0.0033 per scf 5 0.059 per kWh
Total Direct Cost. DC
Indiract Annual Costs. IC Overhead Sixty percent of sum of
c-10
. -

. -
operating, sup~., & maint. labor & maint. materials
Administrative charges TCI 0.02 Property taxes TCI ' 0.01 Insurance TCI 0.01 Capital recovery CRF 'TCI
Total Indiroct Costs, IC
Total Annual Cost, TAC TAC = DC + IC
$3,939 $1,970 $1,970
532.064
$49,713
$70,689
' based on user-provided hourslyear of operation CRF: The capital recovery factor, CRF, is a function of the equipment life (typically 10 years) and the opportunity cost of the capital (Le., interest rate). For example, for a 10 year equipment life and a 10% interest rete, CRF = 0.1 628.
7
4
c-11

4

- -
APPENDIX D
BAY AREA AIR QUALITY MANAGEMENT DISTRICT
REGULATION 8 RULE 42
LARGE COMMERCIAL BREAD BAKERIES
D-1

c
4

REGULATION 8
ORGANIC COMPOUNDS
RULE 42
LARGE COMMERCIAL BREAD BAKERIES
INDEX
842-100 GENERAL
842-1 01 Description 842-1 10 Exemption, Small Bakeries 8-42-1 11 8-42-1 12 Exemption, Existing Ovens 8-42-1 13 8-42-1 14
Exemption, Low Emitting Ovens
Exemption, Miscellaneous Bakery Products Exemption, Chemically Leavened Products
842-200 DEFINMONS
8-42-201 Approved Emission Control Sistem 842-202 Baseline Emissions
842-204 Fermentation Time 842-205 Large Commercial Bread Bakery 842-206 Leawn 842-207 Yeast Percentage
842-203 Bread
842-300 STANDARDS
842-301 8-42-302 842-303 842-304 Delayed Compliance, Existing Ovens
N e w and Modified Bakery Ovens Emission Control Requirements, New and Modified Ovens Emiion Control Requirements, Existing Ovens
842-400 ADMINISTRA’T’IM REQUIREMENTS
8-42401 Compliance Schedule 8-42-402 Delayed Compliance Schedule
842-500 MONITORING AND RECORDS (Not included)
842400 MANUAL O f PROCEDURES
842-601 Det8fminatiOn of Emissions 842-602 Emission Calculation Procedures
. .
.-
a
0-42-1 September 20, 1989

REGULATION 8
ORGANIC COMPOUNDS RULE 42
LARGE COMMERCIAL BREAD BAKERIES
- *
.-
(Adopted September 20, 1989)
8-42-100 GENERAL
8-42-101 Descrlptlon: The purpose of this rule is to limit the emission of precursor organic compounds from bread ovens at large commercial bread bakeries.
8-42-110 Exemptlon, Small Bakerler: This rule shall not apply to bakeries whose total produdion of bread, buns, and rolls per operating day is less than 45,450 kg (100,OOO pounds), averaged m r all operating days in any one month. Exemptlon, Low Emmlng Ownr: Ovens demonstrated to the satisfaction of the APCO to emit less than 68.2 kg (150 pounds) of ethanol per operating day averaged over a period of one year shall be exempt from the requirements of Section 8-42-301. Exemption, Exlatlng Ovens: The requirements of Section 842-303 shall not apply to ovens, which commenced operation prior to January 1, 1988 and which are demonstrated to the satisfaction of the APCO to emit less than 113.7 kg (250 pounds) of ethanol per operating day, averaged over a period of one year.
This rule does not apply to equipment used exclusively for the baking of bakery products other than bread, buns, and rolls. Such products include, but are not limited to, muffins, croutons, breadsticks, and crackers.
8-42-114 Exemptlon, Chemically brwned ProduW. This rule does not apply to equipment used exclusively for the baking of bakery products leavened chemically in the absence of yeast.
8-42-111
842-112
842-113 Exemptlon, Mlrcellaneour Bakery Produ-
842-200 DEFl NiTlONS
8-42-201 Approved Emisrion Control Sy8tam: A system for reducing emissions of precursor organic compounds to the atmosphere consisting of a control device, which has been approved by the APCO and which satisfies the following conditions: 201.1 The control device shall achieve the control efficiency specified in the
applicable standards section at all times during normal operation of the equipment being controlled.
201.2 The collection system shall vent all exhaust from the oven stack or stacks to the control device dUNq normal operation.
8-42-202 Ersellne Emlrrlon+: The average amount of precursor organic compounds emitted per operating day fiom an oven between January 1. 1988 and Oecember 31, 1988. Emissions shall be calculated in accordance with Section 8-42-602.
842-203 B r e d A perishable foodstuff prepared from a dough whose primary ingredients are flour, sugar, salt, water, and yeast and which is baked into loaves, buns, or rolls. Fermentatlon Time: Elapsed time between adding yeast to the dough or sponge and placing the loaves into the oven, expressed in hours.
842-204
8-42-3 September 20, 1989

8-42-205 Urge, Commercial Bread Bakey: Any bakery producing more than 45,454 kg (100,OOO pounds) of breads, buns, and rolls per day.
8-42-206 Lewen: To raise a dough by causing gas to thoroughly permeate it. 8-42-207 Y e a Percentage: Pounds of yeast per hundred pounds of total’rectpe flour,
expressed as a percentage.
842-300 STANDARDS
842-301 New and Modified 8rkory OWM: Effectiie January 1, 1989, a person subject to this rule shall not operate the followtng equipment unless the requirements of Section 842.302 are met: 301 .l Any newly constructed oven commencing operation after January 1, 1989. 3012 Any newly constructed own replacing an exrsting oven and commencing
operation after January 1 , 1989. 301.3 Any existing oven which has been modified, with modifications completed
after January 1, 1989, at a cost exceeding 50% of replacement cost of the oven.
301.4 Any oven with a change in production after January 1, 1989, resulting in an emission increase, averaged over a 30 day period, of 68.2 kg (1 50 pounds) per operating day above the baseline emissions.
Emittion Control Requlrementa, New and Modified Ovens: All new and modified wens shall be required to vent all emissions to an approved emission control system capable of reducing emissions of precursor organic compounds by 90% on a mass basis.
8-42-303 Emission Control Requiremsnta, Exldlng Owns: Effective January 1, 1992, all existing ovens which commenced operation prior to January 1, 1989, shall be required to vent emissions to a control system meeting the followng standards: 303.1 Emission collection system shall capture all emissions of precursor organic
compounds from all own stacks. 3032 Collected emissions shall be vented to an apprwed emission control device
which has a destruction efficiency of at least 90% on a mass basis. Oel8yd Compllanco, Exl8tlng Owns: In lieu of complying with the requirements of Section 842-303, an applicant may eled to replace those ovens subject to Section 8-42-303 with new ovens meeting the requirements of Section 8-42-302 by January 1, 1994. Such election must be made by January 1, 1991, subject to approval of the APCO. In approving such an election, the APCO may require the posting of a bond and may impose permit conditions on the existing subject ovens in order to assure compliance with the January 1.1994 installation of new ovens.
842402
842-304
8-42-400 ADMINISTRATIVE REQUIREMENTS
8-42-401 Complianco Schedule: Any person subject to the requirements of Section 8-42- 303 of this rule shall comply with the following increments of progress: 401 .l Sy January 1,1990: Submit a status report to the APCO stating the options
under consideration for rsarofitting or replacing exisfiitg ovens. 401 2 By January 1 , 1991 : Submrt a plan describing the methods proposed to be
used to comply with 842-303. 401.3 By March 31, 1991: Submit a completed application for any Authority to
Construct necessary to comply wtth these requirements. 401.4 By January 1, 1992 8e in full compliance Hnth all applicable requirements. Delayed Compllancr, Schedule: Any person seeking to comply wth this rule under Section 842-304 shall comply with the following increments of progress: 402.1 By January 1, 1991: Submit a plan describing the methods proposed to be
used to comply with 8-42-302.
8-42-402
8-424 September 20, 1989
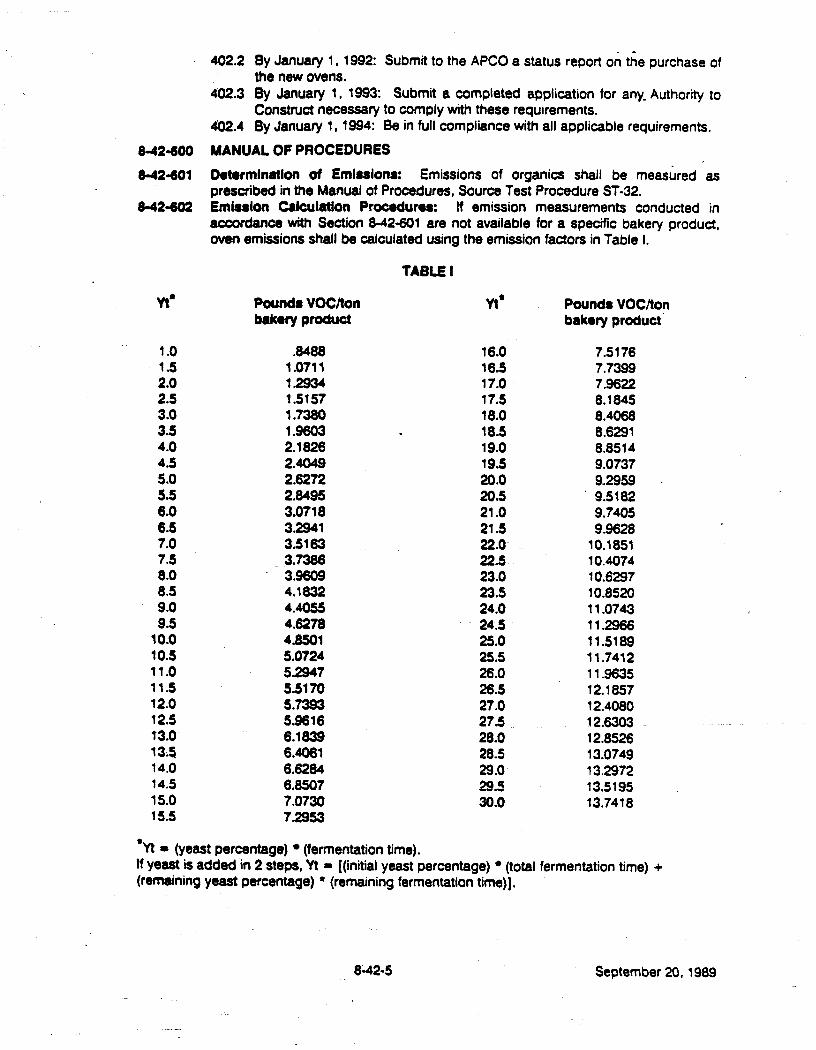
842600
842401
842602
Yt*
1 .o 1 .5 2.0 2.5 3.0 3.5 4 .O 4.5 5.0 5.5 6.0 6 .5 7.0 7.5 8.0 8.5 9.0 9.5
10.0 10.5 11.0 11 .5 12.0 12.5 73.0 13.3 14.0 14.5 15.0 15.5
402.2 8y January 1,1992: Submit to the APCO a status report on t i e purchase of the new ovens.
402.3 By January 1, 1993: Submit a completed application for any- Authority to Construct necessary to comply wth these requirements.
42.4 By January 1, 1994: Be in full compliance with all applicable requirements.
MANUAL OF PROCEDURES Debrmlnatlon of Emlsslons: Emissions of organics shall be measured as prescribed in the Manual of Procedures, Source Test Procedure ST-32. Emlrslon Calculation P r d u r e r : If emission measurements conducted in accordance with Section 842-601 are not available for a specific bakery product, oven emissions shall be calculated using the emission factors in Table I,
Pounds VOClton bakory product
.&I88 1.071 1 12934 1.5157 1.7380 1.9603 2.1626 2.4049 2.6272 2.8495 3.071 8 3.2941 351 63 3.7386 3.9609 4.1832 4.4055 4.6278 4.8501 5.0724 52947 5.5170 5.7393 5.9616 6.1839 6.4061 6.6284 6.8507 7.0730 72953
TABLE I
Yt*
16.0 16.5 17.0 17.5 18.0 18.5 19.0 19.5 20.0 20.5 21 .o 21 .5 22.0 22.5 23.0 23 .S 24.0 24.5 25.0 25.5 26.0 26.5 27.0 27.5 28.0 28.5 29.0 29.5 30.0
Pounds VOC/ton bakery product
7.5176 7.7399 7.9622 8.1845 8.4068 8.6291 8.8514 9.0737 9.2959 .
' 9.5182 9.7405
10.1851 10.4074 10.6297 10.8520 1 1.0743 11.2966 11.5189 11.7412 1 1.9635 12.1857 12.4080 12.6303 12.8526 13.0749 13.2972 j3.5195 13.7418
9.9628
*Yt .I (yeast percentage) (fermentation time). If yeast is added in 2 steps, Yt - [(initial yeast percentage) (total fermentation time) + (remning yeast percentage) * (remaining fermentation time)],
842-5 September 20,1989

- .
APPENDIX E
SOUTH COAST AIR QUALITY MANAGEMENT DISTRICT
RULE 1153
COMMERCIAL BAKERY OVENS
E-1
.-
I

- .

- -
(Adopted Janua~y 4,1991) RULE 1153. COMMERCIAL BAKERY OVENS
Applicability This rule controls volatile organic compound (VOC) emissions from commercial bakery ovens with a rated heat input capacity of 2 million BTU per hour or more and with an average daily emission of 50 pounds or more of VOC.
Definitions . For the purpose of this rule the following definitions shall apply
AVERAGE DAILY EMISSIONS is the product of the total calendar year emissions (in tons/year) divided by the number of days the oven was employed for production during that year. BAKERY OVEN is an oven for baking bread or any other yeast leavened products by convection. BASE YEAR is the calendar 1989 or any subsequent calendar year in which the average daily emissions are 50 pounds or more per day. EMISSIONS are any VOC formed-and released from the oven as a result of the fermentation and baking processes of yeast leavened products. EXEMPT COMPOUNDS are any of the following compounds which have been determined to be non-precursors of ozone: (A) Group I (General)
chlorodinuoromethane (HCFC-22) dichlorotrifluoroethane (HCFC-123) tetrafluoroethane (HFC- ma) dichlorofluoroethane (HCFC-14lb) chlorodifluoroethane (HCFC-142b)
methylene chloride 1, 1,l-trichloroethane (methyl chloroform) tzifluoromethane (FC-23) trichlorotrifluoroethane (CFC-113) dichlorodifluoromethane (CFC-12) trichloronuoromethane (CFC-11) dkblorotetralfuoroethane (CFC-114) chloropentafluoroethane (CFC-115)
(B) Group II (Under Review)
1153 - 1

Rule 1153 (Cont.) (Adopted January 4,1991)
The Group II compounds may have restrictions on their use because they are toxic or potentially toxic, or upper-atmosphere ozone depleters, or cause other environmental impacts. The District Board has adopted a policy which states that chlorofluorocarboxk (CFC) will be phased out at the earliest practicable date on or before 1997. EXISTING OVEN is an oven that was constructed and commenced operation prior to January 1,1991. FERMENTATION TIME is the elapsed time between adding yeast to the dough or sponge and placing it into the oven, expressed in hours. LEAVEN is to raise a dough by causing gas to permeate it. VOLATIE ORGANIC COMPOUNDS (VOC) is any volatile chemical compound that contains the element of carbon compound, excluding carbon monoxide, carbon dioxide, carbonic acid, metallic carbides or carbonates, methane, and exempt compounds. YEAST PERCENTAGE is the pounds of yeast per hundred pounds of total recipe flour, expressed as a percentage.
(c) Requirements (1) No person shall operate an existing bakery oven unless VOC emissions
are reduced by at least (A) 70 percent (by weight) for an oven with a base year average daily
VOC emissions of 50 pounds or more, but less than 100 pounds. (B) 95 percent by weight for an oven with a base year average daily
VOC emissions of 100 pounds or more. No person shall operate a new bakery oven unless VOC emissions are reduced by at least 95 percent by weight if the uncontrolled average daily VOC emissions are 50 pounds or more.
(2)
(d) Compliance Schedule No person shall operate a bakery oven subject to this rule unless the following increments of progress are met (1) For bakery ovens subject to subparagraph (c)( l)(A):
(A) By Januq 1, 1992, submit required applications for permits to construct and operate.
- 1153 - 2

(Adoptd January 4,1991) Rule 1153 (Conti)
(B)
For bakery ovens subject to subparagraph (c)(l)(B): (A) By Januq 1, 1993, submit reqbired applications for permits to
construct and operate. (B) By July 1, 1994, demonstrate compliance with subparagraph
For bakery ovens subject to subparagraph (c)(2) be in compliance by July 1,1992 or by the date of installation, whichever is later.
By July 1, 1993, demonstrate compliance with subparagraph (c)( 1 )(A)*
(2)
(c)(l)(B)- (3)
Alternate Compliance Schedule The subparagraph (d)(l) and (d)(2) compliance deadlines may be postponed by one year if the owner of a bakery oven elects to replace the existing oven with a new one. Such election must be-made by Januaq 1,1992 via a compliance plan submitted to, and subject to approval of, the Executive Officer or his designee. In approving such an election, the Executive Officer may impose interim conditions or control measures on the existing oven in order to assure compliance pending the installation or construction of the new, replacement oven
Exemptions The provisions of paragraphs (c) and (d) do not apply to any existing bakery oven that emits less than SO pounds of VOC per operating day on an uncontrolled basis. Daily VOC emissions shall be determined according to the calculation procedures of Attachment A, or according to any test methods specified in paragraph (h).
Recordkeeping Requirements Any person operating a bakery oven subject to this rule and daiming an exemption under paragraph (0 shall maintain a daily record of operations, including, but not limited to, the amount of raw material processed, yeast percentage, fermentation time, and the type of product baked. Such records shall be retained in the owner's or operator's files for a period of not less than two years.
1153-3

Rule 1153 (Conk)
'@) TestMethods EPA Test Method 25, or SCAQMD Test Method 25.1, or any other method determined to be equivalent and approved by the Executive Officer or his designee, may be used to determine compliance 4th this rule.
1153 - 4

Rule 1153 (Cont.) (Adopted January 4,1991)
ATTACHMENT A
Yt* Y t * - - 1.0 15 2.0 2 5 . 3.0 3 5 4.0 4 5 5.0 55 6.0 65 7.0 75 8.0 85 9.0
- 95 10.0 105 11.0 115 12.0 125 13.0 135 14.0 145 15.0 155
0.8488 1.0711 12934 15157 1.7380 1.9603 2.1826 2.4049 2.6272 2.8495 3.0718 32941 35163 3.7386 3.9609 4.1832 4.4055 4.6278 4.8501 5.0724 52947 55170 5.7393 5.96 16 6.1839 6.4061 6.6284 6.8507 7.0730 72953
16.0 165 17.0 175 18.0 185 19.0 195 20.0 205 21.0 215 22.0 225 23.0 235 24.0 245 25.0 255 26.0 265 27.0 275 28.0 285 29.0 295 30.0
Pt = (yeast percentage) x (fermentation time) If yeast is added in 2 ste s, Yt = (initial east percentage) 4 total fermentation time + (remaining east percentage) remaining fermentation P time)
'7.5 176 7.7399 7.9622 8.1845 8.4068 8.629 1 8.85 14 9.0737 92959 95182 9.7405 9.9628
10.1851 10.4074 10.6297 10.8520 11.0743 112966 115 189 11.74 12 11.9635 12.1857 12.4080 12.6303 12.8526 13.0749 132972 135195 13.7418
c
1153 - 5