alteration in soil fauna due to soil management …
TRANSCRIPT
REVISTA SCIENTIA AGRARIA Versão On-line ISSN 1983-2443 Versão Impressa ISSN 1519-1125 SA vol. 18 n°. 1 Curitiba Jan/Mar. 2017 p. 50-63
50
ALTERATION IN SOIL FAUNA DUE TO SOIL MANAGEMENT AND CROP ROTATION IN A LONG-TERM EXPERIMENT
Modificações na fauna edáfica do solo decorrentes do manejo do solo e rotação de culturas em experimento de longa duração
Daniela da Rocha Vitória Krolow1; Ivan Renato Cardoso Krolow.2; Danilo Rheinheimer dos Santos3; Tânia Beatriz
Gamboa Araújo Morselli4; Ademir Calegari5
1Pós-Doctor; Department of Soil; Federal University of Santa Maria-UFSM; [email protected] 2Pós-Doctor; Department of Soil; Federal University of Santa Maria-UFSM; [email protected] 3Teacher; Department of Soil-Laboratory of Soil Biology; Federal University of Santa Maria-UFSM
4Teacher; Department of Soil-Laboratory of Soil Biology; Federal University of Pelotas-UFPel 5Researcher; Agronomic Institute of Paraná-IAPAR
Article submitted in 21/12/2016, accepted 27/03/2017 and published in 11/04/2017
RESUMO: O presente estudo teve como objetivo avaliar a população da fauna edáfica em uma área experimental instalada há 26 anos em Pato Branco / PR. Entre os tratamentos existentes na área experimental, foram selecionados seis manejados sob sistema de cultivo convencional, e seis manejados sob plantio direto, ambos cultivados com seis diferentes plantas de cobertura. O método empregado para a extração de organismos edáficos (camada 0-10 cm) foi o do Funil de Tüllgren. A execução das coletas se deu em blocos e repetições (156 amostras de solo para quantificar a fauna edáfica; 156 para avaliar a umidade do solo e 156 leituras de temperatura do solo). Em abril/2013, foram estimados 60.138 indivíduos m-2 e em janeiro/2014 foram 28.348 indivíduos m-2. A adoção do plantio direto por longo período favorece a biodiversidade da fauna do solo em relação ao solo que vem sendo feito revolvimento com duas lavrações e quatro gradagens anuais desde 1976. Os táxons edáficos mais representativos em abril/2013 foram Acari, Collembola e Diptera, e em janeiro/2014 foram Acari, Collembola, Hymenoptera e Larva de Lepidoptera. O manejo fitossanitário das áreas influencia na diversidade da fauna edáfica. O fator abiótico umidade do solo atua de forma severa sob a fauna edáfica, sendo mais evidente no sistema de cultivo convencional. A época de coleta influencia na densidade de indivíduos, na riqueza de espécies e nos índices de Shannon e Pielou. Palavras-chave – macrofauna, mesofauna, plantas de cobertura de inverno. ABSTRACT – The present study had as objective to evaluate the soil fauna population, in an experimental sites installed for 26 years in Pato Branco / PR. Among the treatments existent in the experimental site, were selected six managed under Conventional Farming System, and six managed under No-tillage, both cultivated with six different cover plants. The method used for the extraction of edaphic organisms (0-10 cm depth) was Tüllgren funnel. The collection was done in blocks and replicates (156 soil samples to quantify the soil fauna; 156 to evaluate soil moisture, and 156 soil temperature readings). In the April/2013, 60,138 m-2 individuals were estimated, and in the January/2014 they were 28,348 m-2 individuals. The adoption of the long-term No-tillage favors the biodiversity of the soil fauna in relation to the soil that has been undergoing two years of cultivation and four annual harrows since 1976. The most representative edaphic taxon in the April/2013 were Acari, Collembola and Diptera, and in the January/2014 they were Acari, Collembola, Hymenoptera and Larva of Lepidoptera. The phytosanitary management of the areas influence the diversity indexes of the edaphic fauna. The soil moisture abiotic factor acts severely under the edaphic fauna, being more evident in the conventional cropping system. The collection season conditioned to the abiotic factors - soil moisture and temperature - influences the density of individuals, species richness and the Shannon and Pielou indexes. Keywords – macrofauna, mesofauna, winter cover plants.
REVISTA SCIENTIA AGRARIA Versão On-line ISSN 1983-2443 Versão Impressa ISSN 1519-1125 SA vol. 18 n°. 1 Curitiba Jan/Mar. 2017 p. 50-63
51
INTRODUTION
Edaphic fauna is the set of animals that live or have one of their life stages directly in the soil. These organisms may receive different classifications; one of them refers to the body size, in which the macrofauna corresponds to organisms larger than 4 mm, such as annelids, termites and ants, including mollusks, crustaceans and arachnids (LAVELLE et al. 1994). On a smaller scale, we find representatives of mesofauna that present body size between 0.2 and 4 mm, moving in spaces as cracks and pores created by actions and reactions of the environment, such as wetting and drying, heating and cooling the soil as well as of anthropic action through agricultural practices used. At this edaphic interface, mites and colloids are found, including Protura, Diplura e Thysanura and small insects.
The representatives of the edaphic fauna act directly and indirectly on important processes that occur in the soil, such as the cycling of nutrients (CARRILLO et al., 2011; FRASSON et al. 2016), as well as the redistribution of these and the organic matter contribute to the aggregation of the soil (Siddiky et al. 2012; Tiemann et al. 2015), porosity, infiltration and also participate in the biological functioning of the soil. Freire et al. (2015) and Tessaro et al. (2016) emphasize that variations in soil composition and management directly influence soil organisms, which in turn are directly influenced by abiotic factors. There are several works what considering the temperature and soil moisture in studies of synecology, prioritizing the composition, frequency and distribution of soil fauna, however, little is known about their interrelationships (PONGE, 1993; PAKHOMOV et al. 2013). There are still few works involving the study of edaphic fauna from the perspective of production systems, given the changes caused by anthropic action, such as the disorganization of the food chain of edaphic taxon. Among them the Conventional Farming System that, by revolving the soil layer with the highest faunistic activity, exposes the photosensitive taxon, amplifies the temperature oscillations and reduces water availability.
In this sense, Marín et al. (2015) and Alcantara et al. (2016) considered that mites and spiders respond directly to the management practices employed under the soil, and are directly related to soil moisture content and pH, and to practices such as use of insecticides (TESSARO et al. 2013; FILSER et al. 2014; ZORTÉA et al. 2015). Amid the production systems used in the
last decades that attract more attention from researchers, stand out conventional planting and No-tillage and their relationships with soil health. Systems that favor the permanence of biomass under the ground, such as tillage, as well as the use of good cultural practices that aim increasing organic carbon in the soil, and the life maintenance of invertebrates have been boosted in recent decades (BARETTA et al. 2014; BEDANO et al. 2016). Although there are still many questions regarding soil fauna, little is known about the intra and interspecific complexity of invertebrates in the soil and thus the constant reorganizations and reconfigurations influenced by anthropic action need further studies (KROLOW, 2011; SANTOS et al. 2015).
Considering the above, the present study aimed to carry out the monitoring of the of fauna of soil, as a biological indicator of quality in a long-term cultivated soil, with winter cover crops under No-tillage and conventional cropping system.
MATERIAL AND METHODS
Spatial location and management of the area under investigation
Soil fauna monitoring was done in a long-term experiment involving soil management and crop rotation. The experiment was carried out at the Agronomic Institute of Paraná (IAPAR), in Pato Branco, southwest of Paraná (52° 39'10.23 "W and 26° 07'23.89" S). The local altitude is 700 m, with smooth undulating relief and declivity with slopes between 4 and 7%. The local climate is characterized as subtropical humid, type Cfb (Köppen). The soil is classified as a Rhodic Hapludox (Latossolo Vermelho Aluminoferrico típico), (Embrapa, 2013), very clayey, whose source material is igneous rocks of the Serra Geral formation.
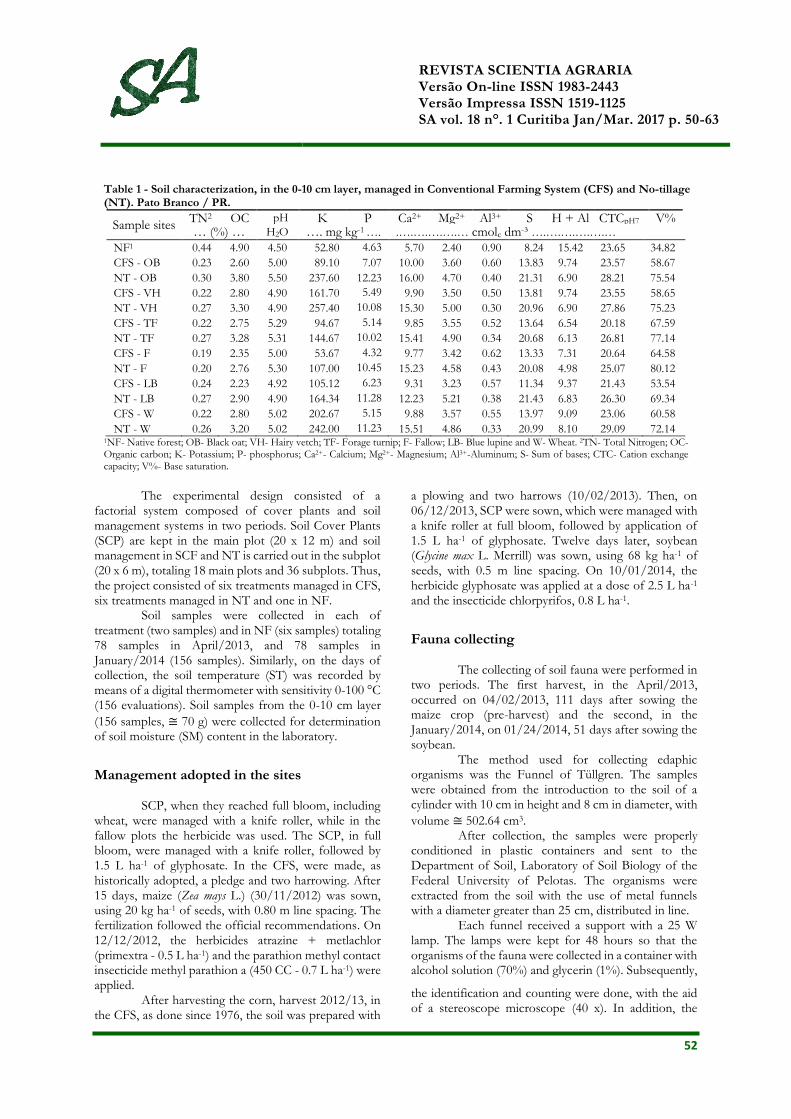
The soil texture (0-10 cm) in experimental area presented values of clay, silt and sand what corresponded the 720; 140 e 140 g kg-1, respectively. The soil density (0-10 cm) of the areas included in this study, managed in Conventional Farming System (CFS) and No-tillage (NT presented values equal to 1,13 and 1,17 g cm-3 (Black oat); 1,13 and 1,23 g cm-3 (Hairy vetch); 1,07 and 1,07 g cm-3 (Forage turnip); 1,03 e 1,13 g cm-3 (Fallow); 1,00 and 1,20 g cm-3 (Blue lupine); 1,07 e 1,10 g cm-3 (Wheat), respectively, and 0,7 g cm-3 in Native forest (NF), used as reference.
The soil chemical characteristics of each area that compose this survey were described in Table 1.
REVISTA SCIENTIA AGRARIA Versão On-line ISSN 1983-2443 Versão Impressa ISSN 1519-1125 SA vol. 18 n°. 1 Curitiba Jan/Mar. 2017 p. 50-63
52
Table 1 - Soil characterization, in the 0-10 cm layer, managed in Conventional Farming System (CFS) and No-tillage (NT). Pato Branco / PR.
Sample sites TN2 OC pH K P Ca2+ Mg2+ Al3+ S H + Al CTCpH7 V% … (%) … H2O …. mg kg-1 …. .….….….….… cmolc dm-³ ….….….….….…
NF1 0.44 4.90 4.50 52.80 4.63 5.70 2.40 0.90 8.24 15.42 23.65 34.82
CFS - OB 0.23 2.60 5.00 89.10 7.07 10.00 3.60 0.60 13.83 9.74 23.57 58.67
NT - OB 0.30 3.80 5.50 237.60 12.23 16.00 4.70 0.40 21.31 6.90 28.21 75.54
CFS - VH 0.22 2.80 4.90 161.70 5.49 9.90 3.50 0.50 13.81 9.74 23.55 58.65
NT - VH 0.27 3.30 4.90 257.40 10.08 15.30 5.00 0.30 20.96 6.90 27.86 75.23
CFS - TF 0.22 2.75 5.29 94.67 5.14 9.85 3.55 0.52 13.64 6.54 20.18 67.59
NT - TF 0.27 3.28 5.31 144.67 10.02 15.41 4.90 0.34 20.68 6.13 26.81 77.14
CFS - F 0.19 2.35 5.00 53.67 4.32 9.77 3.42 0.62 13.33 7.31 20.64 64.58
NT - F 0.20 2.76 5.30 107.00 10.45 15.23 4.58 0.43 20.08 4.98 25.07 80.12
CFS - LB 0.24 2.23 4.92 105.12 6.23 9.31 3.23 0.57 11.34 9.37 21.43 53.54
NT - LB 0.27 2.90 4.90 164.34 11.28 12.23 5.21 0.38 21.43 6.83 26.30 69.34
CFS - W 0.22 2.80 5.02 202.67 5.15 9.88 3.57 0.55 13.97 9.09 23.06 60.58
NT - W 0.26 3.20 5.02 242.00 11.23 15.51 4.86 0.33 20.99 8.10 29.09 72.14 1NF- Native forest; OB- Black oat; VH- Hairy vetch; TF- Forage turnip; F- Fallow; LB- Blue lupine and W- Wheat. 2TN- Total Nitrogen; OC- Organic carbon; K- Potassium; P- phosphorus; Ca2+- Calcium; Mg2+- Magnesium; Al3+-Aluminum; S- Sum of bases; CTC- Cation exchange capacity; V%- Base saturation.
The experimental design consisted of a factorial system composed of cover plants and soil management systems in two periods. Soil Cover Plants (SCP) are kept in the main plot (20 x 12 m) and soil management in SCF and NT is carried out in the subplot (20 x 6 m), totaling 18 main plots and 36 subplots. Thus, the project consisted of six treatments managed in CFS, six treatments managed in NT and one in NF.
Soil samples were collected in each of treatment (two samples) and in NF (six samples) totaling 78 samples in April/2013, and 78 samples in January/2014 (156 samples). Similarly, on the days of collection, the soil temperature (ST) was recorded by means of a digital thermometer with sensitivity 0-100 °C (156 evaluations). Soil samples from the 0-10 cm layer
(156 samples, ≅ 70 g) were collected for determination of soil moisture (SM) content in the laboratory.
Management adopted in the sites SCP, when they reached full bloom, including
wheat, were managed with a knife roller, while in the fallow plots the herbicide was used. The SCP, in full bloom, were managed with a knife roller, followed by 1.5 L ha-1 of glyphosate. In the CFS, were made, as historically adopted, a pledge and two harrowing. After 15 days, maize (Zea mays L.) (30/11/2012) was sown, using 20 kg ha-1 of seeds, with 0.80 m line spacing. The fertilization followed the official recommendations. On 12/12/2012, the herbicides atrazine + metlachlor (primextra - 0.5 L ha-1) and the parathion methyl contact insecticide methyl parathion a (450 CC - 0.7 L ha-1) were applied.
After harvesting the corn, harvest 2012/13, in the CFS, as done since 1976, the soil was prepared with
a plowing and two harrows (10/02/2013). Then, on 06/12/2013, SCP were sown, which were managed with a knife roller at full bloom, followed by application of 1.5 L ha-1 of glyphosate. Twelve days later, soybean (Glycine max L. Merrill) was sown, using 68 kg ha-1 of seeds, with 0.5 m line spacing. On 10/01/2014, the herbicide glyphosate was applied at a dose of 2.5 L ha-1 and the insecticide chlorpyrifos, 0.8 L ha-1.
Fauna collecting The collecting of soil fauna were performed in
two periods. The first harvest, in the April/2013, occurred on 04/02/2013, 111 days after sowing the maize crop (pre-harvest) and the second, in the January/2014, on 01/24/2014, 51 days after sowing the soybean.
The method used for collecting edaphic organisms was the Funnel of Tüllgren. The samples were obtained from the introduction to the soil of a cylinder with 10 cm in height and 8 cm in diameter, with
volume ≅ 502.64 cm3. After collection, the samples were properly
conditioned in plastic containers and sent to the Department of Soil, Laboratory of Soil Biology of the Federal University of Pelotas. The organisms were extracted from the soil with the use of metal funnels with a diameter greater than 25 cm, distributed in line.
Each funnel received a support with a 25 W lamp. The lamps were kept for 48 hours so that the organisms of the fauna were collected in a container with alcohol solution (70%) and glycerin (1%). Subsequently,
the identification and counting were done, with the aid of a stereoscope microscope (40 x). In addition, the
REVISTA SCIENTIA AGRARIA Versão On-line ISSN 1983-2443 Versão Impressa ISSN 1519-1125 SA vol. 18 n°. 1 Curitiba Jan/Mar. 2017 p. 50-63
53
values of air temperature and precipitation during the monitoring period of the soil fauna (Agro-meteorology Sector of IAPAR) were evaluated.
Data analysis
In order to evaluate the ecological behavior of the edaphic fauna, it was calculated: the density [(number of individuals per m2, (So = π*r2), in the layer of 10 cm] and the relative frequency (%), a sampling units in relation to the total number sampled; total richness of fauna, (number of taxon identified); average richness of fauna; the diversity index of Shannon - Wiener (1949), and the equitability or uniformity index advocated by Pielou (1977).
The descriptive analysis was based on indicators of average, standard deviation (σ) and standard error (±). The values of each taxon and the abiotic factors were transformed, by using the expression Ln (x+1) and in the sequence, submitted to the multivariate analysis of principal components (STATSOFT, 2004). Normality was verified by the Kolmogorov-Smirnov test (p<0.05), the homogeneity of variance by the Levene's test (p<0.05). The one-way analysis of variance (ANOVA) test was used to analyze parametric data, using the software, Statistical Package for the Social Sciences (SPSS v. 20). When answering the necessary assumptions, we investigated the differences between the values of the sites sampled, and between the periods. The average values of the ecological attributes (Temperature e Moisture of soil, Density, Wealth, Diversity and Equitability) were compared by the t test (LSD p<0.05).
RESULTS
Accessory variables
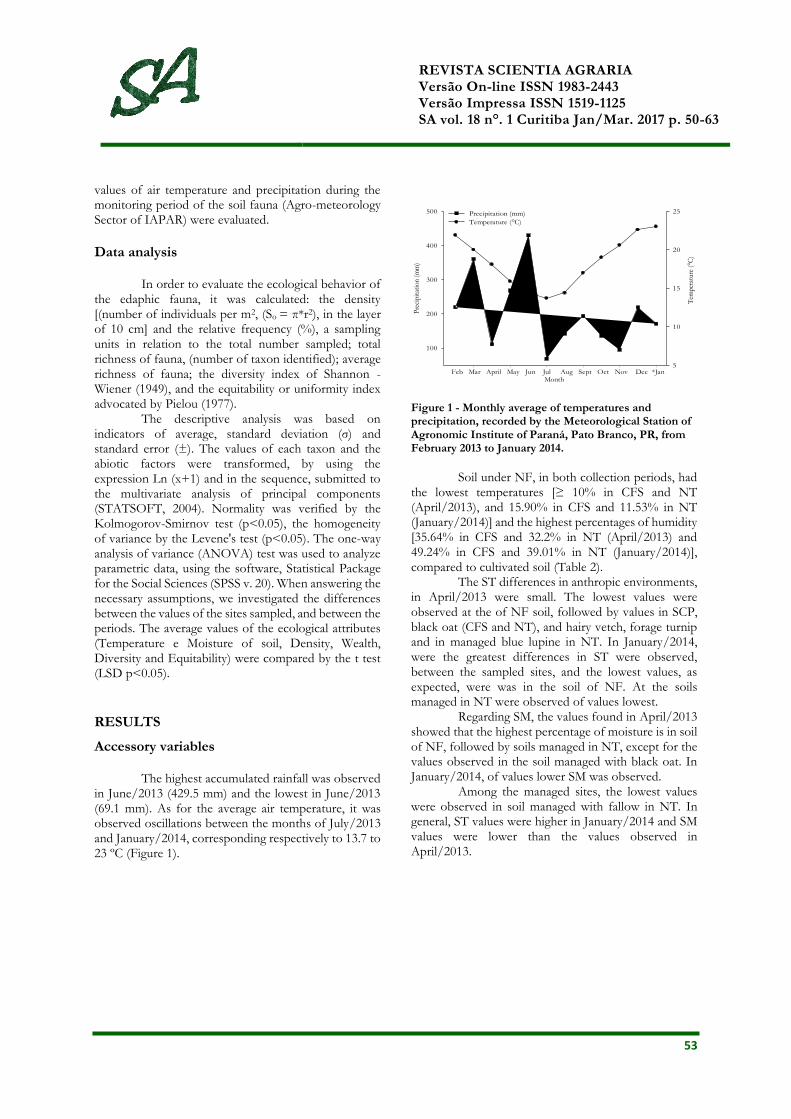
The highest accumulated rainfall was observed in June/2013 (429.5 mm) and the lowest in June/2013 (69.1 mm). As for the average air temperature, it was observed oscillations between the months of July/2013 and January/2014, corresponding respectively to 13.7 to 23 ºC (Figure 1).
Month
Pre
cipi
tati
on (
mm
)
100
200
300
400
500
Tem
pera
ture
(°C
)
5
10
15
20
25Precipitation (mm)
Temperature (°C)
Feb Mar April May Jun Jul Aug Sept Oct Nov Dec *Jan
Figure 1 - Monthly average of temperatures and precipitation, recorded by the Meteorological Station of Agronomic Institute of Paraná, Pato Branco, PR, from February 2013 to January 2014.
Soil under NF, in both collection periods, had
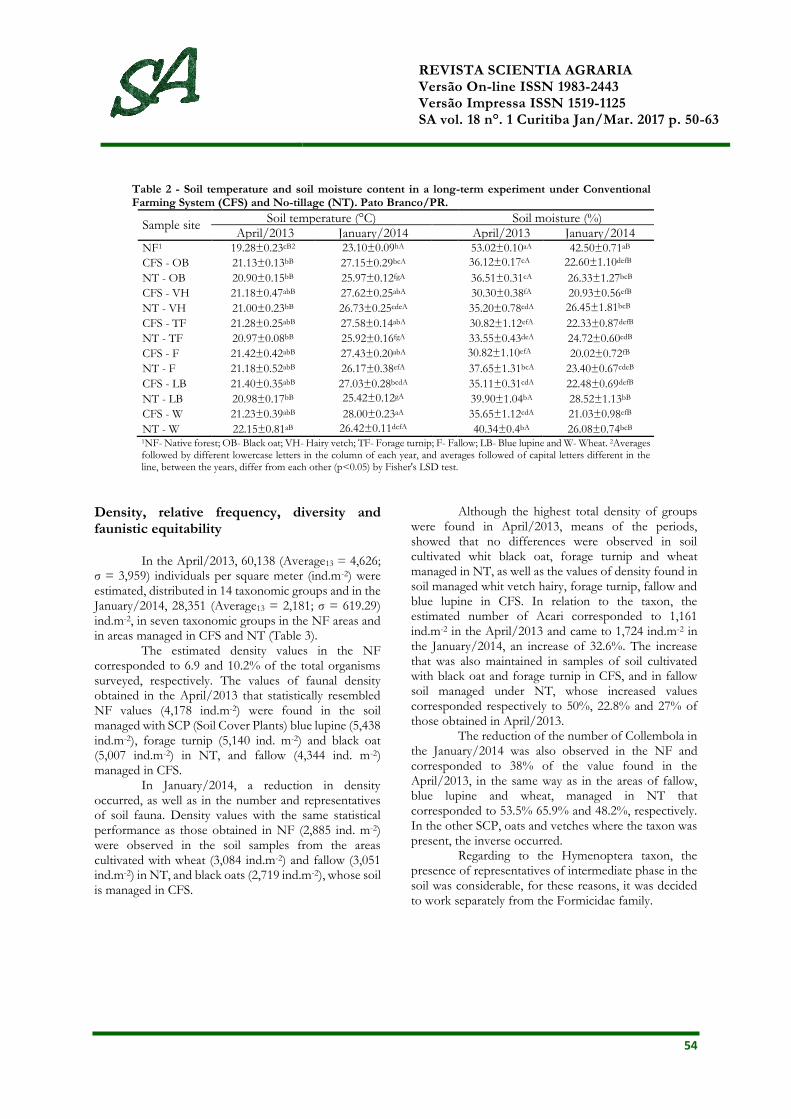
the lowest temperatures [≥ 10% in CFS and NT (April/2013), and 15.90% in CFS and 11.53% in NT (January/2014)] and the highest percentages of humidity [35.64% in CFS and 32.2% in NT (April/2013) and 49.24% in CFS and 39.01% in NT (January/2014)], compared to cultivated soil (Table 2).
The ST differences in anthropic environments, in April/2013 were small. The lowest values were observed at the of NF soil, followed by values in SCP, black oat (CFS and NT), and hairy vetch, forage turnip and in managed blue lupine in NT. In January/2014, were the greatest differences in ST were observed, between the sampled sites, and the lowest values, as expected, were was in the soil of NF. At the soils managed in NT were observed of values lowest.
Regarding SM, the values found in April/2013 showed that the highest percentage of moisture is in soil of NF, followed by soils managed in NT, except for the values observed in the soil managed with black oat. In January/2014, of values lower SM was observed.
Among the managed sites, the lowest values were observed in soil managed with fallow in NT. In general, ST values were higher in January/2014 and SM values were lower than the values observed in April/2013.
REVISTA SCIENTIA AGRARIA Versão On-line ISSN 1983-2443 Versão Impressa ISSN 1519-1125 SA vol. 18 n°. 1 Curitiba Jan/Mar. 2017 p. 50-63
54
Table 2 - Soil temperature and soil moisture content in a long-term experiment under Conventional Farming System (CFS) and No-tillage (NT). Pato Branco/PR.
Sample site Soil temperature (°C) Soil moisture (%)
April/2013 January/2014 April/2013 January/2014 NF1 19.28±0.23cB2 23.10±0.09hA 53.02±0.10aA 42.50±0.71aB
CFS - OB 21.13±0.13bB 27.15±0.29bcA 36.12±0.17cA 22.60±1.10defB
NT - OB 20.90±0.15bB 25.97±0.12fgA 36.51±0.31cA 26.33±1.27bcB
CFS - VH 21.18±0.47abB 27.62±0.25abA 30.30±0.38fA 20.93±0.56efB
NT - VH 21.00±0.23bB 26.73±0.25cdeA 35.20±0.78cdA 26.45±1.81bcB
CFS - TF 21.28±0.25abB 27.58±0.14abA 30.82±1.12efA 22.33±0.87defB
NT - TF 20.97±0.08bB 25.92±0.16fgA 33.55±0.43deA 24.72±0.60cdB
CFS - F 21.42±0.42abB 27.43±0.20abA 30.82±1.10efA 20.02±0.72fB
NT - F 21.18±0.52abB 26.17±0.38efA 37.65±1.31bcA 23.40±0.67cdeB
CFS - LB 21.40±0.35abB 27.03±0.28bcdA 35.11±0.31cdA 22.48±0.69defB
NT - LB 20.98±0.17bB 25.42±0.12gA 39.90±1.04bA 28.52±1.13bB
CFS - W 21.23±0.39abB 28.00±0.23aA 35.65±1.12cdA 21.03±0.98efB
NT - W 22.15±0.81aB 26.42±0.11defA 40.34±0.4bA 26.08±0.74bcB 1NF- Native forest; OB- Black oat; VH- Hairy vetch; TF- Forage turnip; F- Fallow; LB- Blue lupine and W- Wheat. 2Averages followed by different lowercase letters in the column of each year, and averages followed of capital letters different in the line, between the years, differ from each other (p<0.05) by Fisher's LSD test.
Density, relative frequency, diversity and faunistic equitability
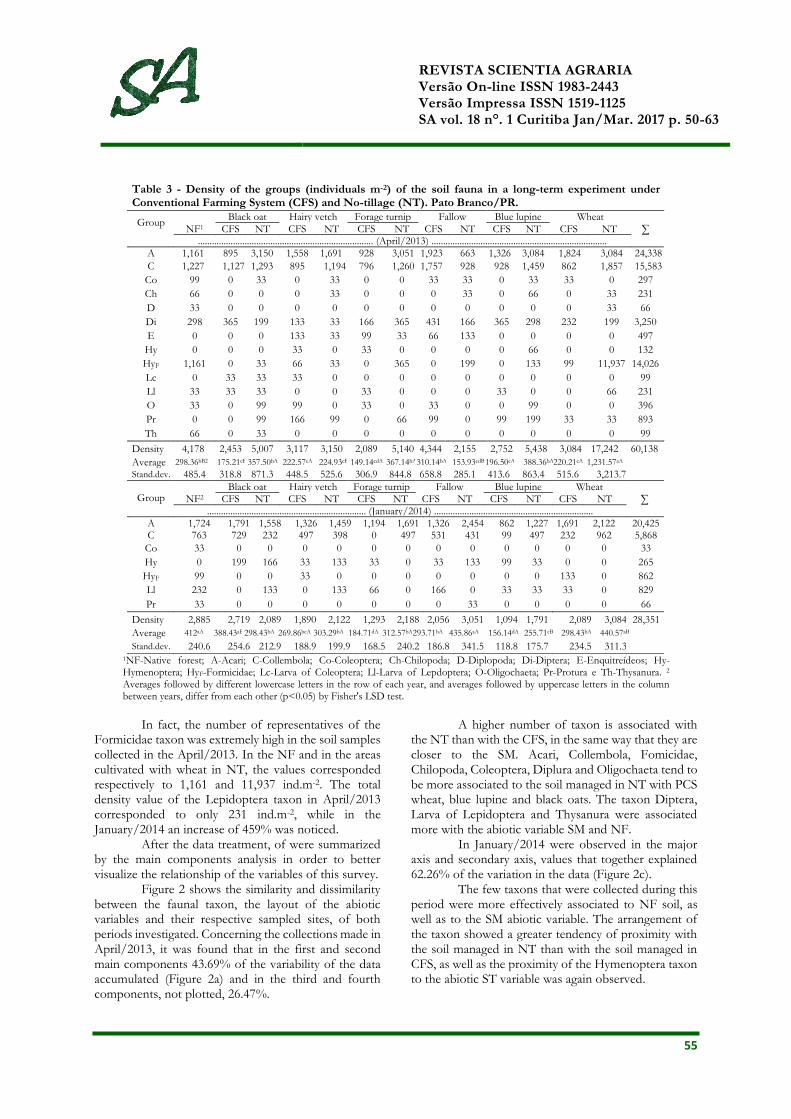
In the April/2013, 60,138 (Average13 = 4,626; σ = 3,959) individuals per square meter (ind.m-2) were estimated, distributed in 14 taxonomic groups and in the January/2014, 28,351 (Average13 = 2,181; σ = 619.29) ind.m-2, in seven taxonomic groups in the NF areas and in areas managed in CFS and NT (Table 3).
The estimated density values in the NF corresponded to 6.9 and 10.2% of the total organisms surveyed, respectively. The values of faunal density obtained in the April/2013 that statistically resembled NF values (4,178 ind.m-2) were found in the soil managed with SCP (Soil Cover Plants) blue lupine (5,438 ind.m-2), forage turnip (5,140 ind. m-2) and black oat (5,007 ind.m-2) in NT, and fallow (4,344 ind. m-2) managed in CFS.
In January/2014, a reduction in density occurred, as well as in the number and representatives of soil fauna. Density values with the same statistical performance as those obtained in NF (2,885 ind. m-2) were observed in the soil samples from the areas cultivated with wheat (3,084 ind.m-2) and fallow (3,051 ind.m-2) in NT, and black oats (2,719 ind.m-2), whose soil is managed in CFS.
Although the highest total density of groups were found in April/2013, means of the periods, showed that no differences were observed in soil cultivated whit black oat, forage turnip and wheat managed in NT, as well as the values of density found in soil managed whit vetch hairy, forage turnip, fallow and blue lupine in CFS. In relation to the taxon, the estimated number of Acari corresponded to 1,161 ind.m-2 in the April/2013 and came to 1,724 ind.m-2 in the January/2014, an increase of 32.6%. The increase that was also maintained in samples of soil cultivated with black oat and forage turnip in CFS, and in fallow soil managed under NT, whose increased values corresponded respectively to 50%, 22.8% and 27% of those obtained in April/2013.
The reduction of the number of Collembola in the January/2014 was also observed in the NF and corresponded to 38% of the value found in the April/2013, in the same way as in the areas of fallow, blue lupine and wheat, managed in NT that corresponded to 53.5% 65.9% and 48.2%, respectively. In the other SCP, oats and vetches where the taxon was present, the inverse occurred.
Regarding to the Hymenoptera taxon, the presence of representatives of intermediate phase in the soil was considerable, for these reasons, it was decided to work separately from the Formicidae family.
REVISTA SCIENTIA AGRARIA Versão On-line ISSN 1983-2443 Versão Impressa ISSN 1519-1125 SA vol. 18 n°. 1 Curitiba Jan/Mar. 2017 p. 50-63
55
Table 3 - Density of the groups (individuals m-2) of the soil fauna in a long-term experiment under Conventional Farming System (CFS) and No-tillage (NT). Pato Branco/PR.
1NF-Native forest; A-Acari; C-Collembola; Co-Coleoptera; Ch-Chilopoda; D-Diplopoda; Di-Diptera; E-Enquitreídeos; Hy-Hymenoptera; HyF-Formicidae; Lc-Larva of Coleoptera; Ll-Larva of Lepdoptera; O-Oligochaeta; Pr-Protura e Th-Thysanura. 2 Averages followed by different lowercase letters in the row of each year, and averages followed by uppercase letters in the column between years, differ from each other (p<0.05) by Fisher's LSD test.
In fact, the number of representatives of the Formicidae taxon was extremely high in the soil samples collected in the April/2013. In the NF and in the areas cultivated with wheat in NT, the values corresponded respectively to 1,161 and 11,937 ind.m-2. The total density value of the Lepidoptera taxon in April/2013 corresponded to only 231 ind.m-2, while in the January/2014 an increase of 459% was noticed.
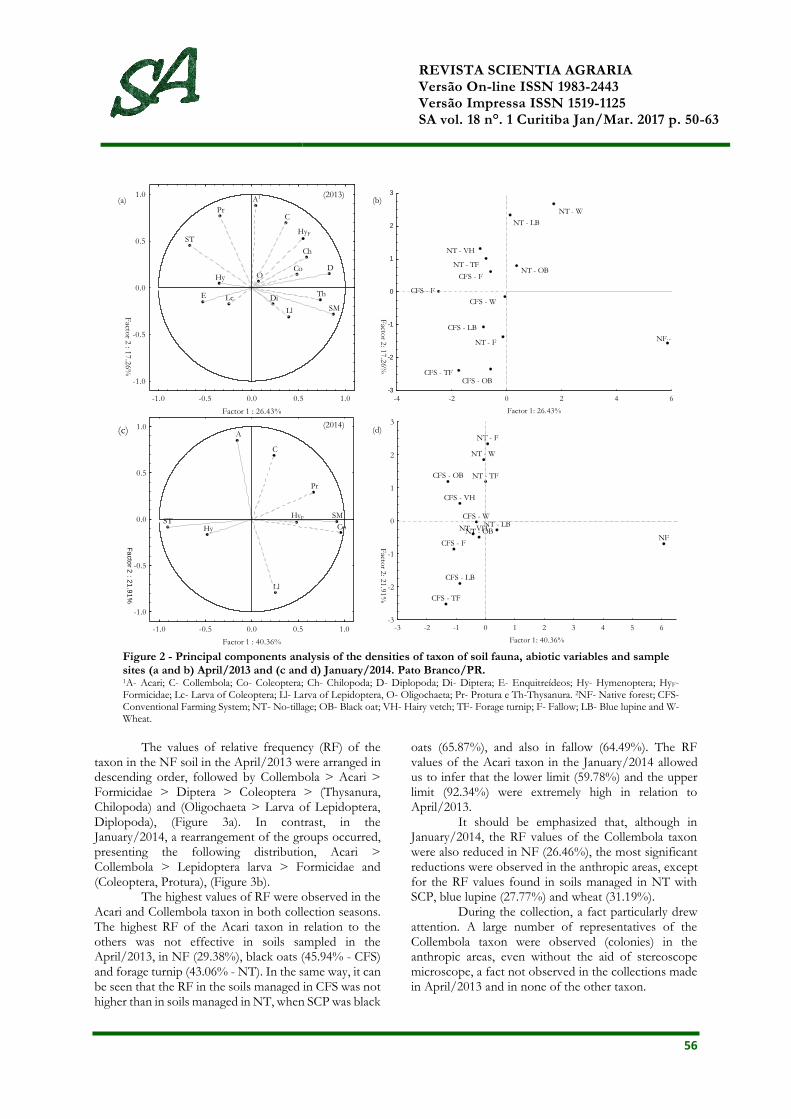
After the data treatment, of were summarized by the main components analysis in order to better visualize the relationship of the variables of this survey.
Figure 2 shows the similarity and dissimilarity between the faunal taxon, the layout of the abiotic variables and their respective sampled sites, of both periods investigated. Concerning the collections made in April/2013, it was found that in the first and second main components 43.69% of the variability of the data accumulated (Figure 2a) and in the third and fourth components, not plotted, 26.47%.
A higher number of taxon is associated with the NT than with the CFS, in the same way that they are closer to the SM. Acari, Collembola, Fomicidae, Chilopoda, Coleoptera, Diplura and Oligochaeta tend to be more associated to the soil managed in NT with PCS wheat, blue lupine and black oats. The taxon Diptera, Larva of Lepidoptera and Thysanura were associated more with the abiotic variable SM and NF.
In January/2014 were observed in the major axis and secondary axis, values that together explained 62.26% of the variation in the data (Figure 2c).
The few taxons that were collected during this period were more effectively associated to NF soil, as well as to the SM abiotic variable. The arrangement of the taxon showed a greater tendency of proximity with the soil managed in NT than with the soil managed in CFS, as well as the proximity of the Hymenoptera taxon to the abiotic ST variable was again observed.
Group
Black oat Hairy vetch Forage turnip Fallow Blue lupine Wheat
∑ NF1 CFS NT CFS NT CFS NT CFS NT CFS NT CFS NT ........................................................................... (April/2013) ........................................................................... A 1,161 895 3,150 1,558 1,691 928 3,051 1,923 663 1,326 3,084 1,824 3,084 24,338 C 1,227 1,127 1,293 895 1,194 796 1,260 1,757 928 928 1,459 862 1,857 15,583
Co 99 0 33 0 33 0 0 33 33 0 33 33 0 297
Ch 66 0 0 0 33 0 0 0 33 0 66 0 33 231
D 33 0 0 0 0 0 0 0 0 0 0 0 33 66
Di 298 365 199 133 33 166 365 431 166 365 298 232 199 3,250
E 0 0 0 133 33 99 33 66 133 0 0 0 0 497
Hy 0 0 0 33 0 33 0 0 0 0 66 0 0 132
HyF 1,161 0 33 66 33 0 365 0 199 0 133 99 11,937 14,026
Lc 0 33 33 33 0 0 0 0 0 0 0 0 0 99
Ll 33 33 33 0 0 33 0 0 0 33 0 0 66 231
O 33 0 99 99 0 33 0 33 0 0 99 0 0 396
Pr 0 0 99 166 99 0 66 99 0 99 199 33 33 893
Th 66 0 33 0 0 0 0 0 0 0 0 0 0 99
Density 4,178 2,453 5,007 3,117 3,150 2,089 5,140 4,344 2,155 2,752 5,438 3,084 17,242 60,138
Average 298.36bB2 175.21cB 357.50bA 222.57cA 224.93cB 149.14cdA 367.14bA 310.14bA 153.93cdB 196.50cA 388.36bA 220.21cA 1,231.57aA
Stand.dev. 485.4 318.8 871.3 448.5 525.6 306.9 844.8 658.8 285.1 413.6 863.4 515.6 3,213.7
Group
Black oat Hairy vetch Forage turnip Fallow Blue lupine Wheat ∑ NF2 CFS NT CFS NT CFS NT CFS NT CFS NT CFS NT
.................................................................... (January/2014) ....................................................................
A 1,724 1,791 1,558 1,326 1,459 1,194 1,691 1,326 2,454 862 1,227 1,691 2,122 20,425 C 763 729 232 497 398 0 497 531 431 99 497 232 962 5,868 Co 33 0 0 0 0 0 0 0 0 0 0 0 0 33
Hy 0 199 166 33 133 33 0 33 133 99 33 0 0 265
HyF 99 0 0 33 0 0 0 0 0 0 0 133 0 862
Ll 232 0 133 0 133 66 0 166 0 33 33 33 0 829
Pr 33 0 0 0 0 0 0 0 33 0 0 0 0 66
Density 2,885 2,719 2,089 1,890 2,122 1,293 2,188 2,056 3,051 1,094 1,791 2,089 3,084 28,351
Average 412aA 388.43aB 298.43bA 269.86bcA 303.29bA 184.71dA 312.57bA 293.71bA 435.86aA 156.14dA 255.71cB 298.43bA 440.57aB Stand.dev. 240.6 254.6 212.9 188.9 199.9 168.5 240.2 186.8 341.5 118.8 175.7 234.5 311.3
REVISTA SCIENTIA AGRARIA Versão On-line ISSN 1983-2443 Versão Impressa ISSN 1519-1125 SA vol. 18 n°. 1 Curitiba Jan/Mar. 2017 p. 50-63
56
Figure 2 - Principal components analysis of the densities of taxon of soil fauna, abiotic variables and sample sites (a and b) April/2013 and (c and d) January/2014. Pato Branco/PR. 1A- Acari; C- Collembola; Co- Coleoptera; Ch- Chilopoda; D- Diplopoda; Di- Diptera; E- Enquitreídeos; Hy- Hymenoptera; HyF-Formicidae; Lc- Larva of Coleoptera; Ll- Larva of Lepidoptera, O- Oligochaeta; Pr- Protura e Th-Thysanura. 2NF- Native forest; CFS- Conventional Farming System; NT- No-tillage; OB- Black oat; VH- Hairy vetch; TF- Forage turnip; F- Fallow; LB- Blue lupine and W- Wheat.
The values of relative frequency (RF) of the
taxon in the NF soil in the April/2013 were arranged in descending order, followed by Collembola > Acari > Formicidae > Diptera > Coleoptera > (Thysanura, Chilopoda) and (Oligochaeta > Larva of Lepidoptera, Diplopoda), (Figure 3a). In contrast, in the January/2014, a rearrangement of the groups occurred, presenting the following distribution, Acari > Collembola > Lepidoptera larva > Formicidae and (Coleoptera, Protura), (Figure 3b).
The highest values of RF were observed in the Acari and Collembola taxon in both collection seasons. The highest RF of the Acari taxon in relation to the others was not effective in soils sampled in the April/2013, in NF (29.38%), black oats (45.94% - CFS) and forage turnip (43.06% - NT). In the same way, it can be seen that the RF in the soils managed in CFS was not higher than in soils managed in NT, when SCP was black
oats (65.87%), and also in fallow (64.49%). The RF values of the Acari taxon in the January/2014 allowed us to infer that the lower limit (59.78%) and the upper limit (92.34%) were extremely high in relation to April/2013.
It should be emphasized that, although in January/2014, the RF values of the Collembola taxon were also reduced in NF (26.46%), the most significant reductions were observed in the anthropic areas, except for the RF values found in soils managed in NT with SCP, blue lupine (27.77%) and wheat (31.19%).
During the collection, a fact particularly drew attention. A large number of representatives of the Collembola taxon were observed (colonies) in the anthropic areas, even without the aid of stereoscope microscope, a fact not observed in the collections made in April/2013 and in none of the other taxon.
-4 -2 0 2 4 6
Factor 1: 26.43%
-3
-2
-1
0
1
2
3
Facto
r 2: 1
7.2
6%
NT - W
NT - LB
NT - OB
NT - VH
NT - FNF
CFS - F
CFS - F
CFS - LB
CFS - TFCFS - OB
CFS - W
NT - TF
ST
SM
A1
C
Co
Ch
D
Di E
HyF
Hy
Lc
Ll
O
Pr
Th
-1.0 -0.5 0.0 0.5 1.0
Factor 1 : 26.43%
-1.0
-0.5
0.0
0.5
1.0
Facto
r 2 : 1
7.2
6%
CFS - OB
NT - OB
CFS - VH
NT - VH
CFS - TF
NT - TF
CFS - F
NT - F
CFS - LB
NT - LBCFS - W
NT - W
NF
-3 -2 -1 0 1 2 3 4 5 6
Factor 1: 40.36%
-3
-2
-1
0
1
2
3
Facto
r 2: 2
1.9
1%
ST SM
A
C
Co
HyF
Hy
Ll
Pr
-1.0 -0.5 0.0 0.5 1.0
Factor 1 : 40.36%
-1.0
-0.5
0.0
0.5
1.0
Fa
cto
r 2 : 2
1.9
1%
(a) (b)
(c) (d)(2014)
(2013) -4 -2 0 2 4 6
Factor 1: 26.43%
-3
-2
-1
0
1
2
3
Facto
r 2: 1
7.2
6%
NT - W
NT - LB
NT - OB
NT - VH
NT - FNF
CFS - F
CFS - F
CFS - LB
CFS - TFCFS - OB
CFS - W
NT - TF
ST
SM
A1
C
Co
Ch
D
Di E
HyF
Hy
Lc
Ll
O
Pr
Th
-1.0 -0.5 0.0 0.5 1.0
Factor 1 : 26.43%
-1.0
-0.5
0.0
0.5
1.0
Facto
r 2 : 1
7.2
6%
CFS - OB
NT - OB
CFS - VH
NT - VH
CFS - TF
NT - TF
CFS - F
NT - F
CFS - LB
NT - LBCFS - W
NT - W
NF
-3 -2 -1 0 1 2 3 4 5 6
Factor 1: 40.36%
-3
-2
-1
0
1
2
3
Facto
r 2: 2
1.9
1%
ST SM
A
C
Co
HyF
Hy
Ll
Pr
-1.0 -0.5 0.0 0.5 1.0
Factor 1 : 40.36%
-1.0
-0.5
0.0
0.5
1.0
Fa
cto
r 2 : 2
1.9
1%
(a) (b)
(c) (d)(2014)
(2013)

REVISTA SCIENTIA AGRARIA Versão On-line ISSN 1983-2443 Versão Impressa ISSN 1519-1125 SA vol. 18 n°. 1 Curitiba Jan/Mar. 2017 p. 50-63
57
Figure 3 - Relative frequency (%) of the soil fauna in a long-term experiment with cover crops under Conventional Farming System (CFS) and No-tillage (NT), sampling held in April/2013 (a); sampling held in January/2014 (b). Pato Branco/PR.
1NF- Native forest; OB- Black oat; VH- Hairy vetch; TF- Forage turnip; F- Fallow; LB- Blue lupine and W- Wheat;. 2A- Acari; C- Collembola; Co- Coleoptera; Ch- Chilopoda; D- Diplopoda; Di- Diptera; E- Enquitreídeos; Hy- Hymenoptera; HyF-Formicidae; Lc- Larva of Coleoptera; Ll- Larva of Lepidoptera, O- Oligochaeta; Pr- Protura e Th-Thysanura.3Richness. Average of six observations.
Given this, it could not be ignored the
hypothesis that the high number of Collembola of a single species could be overlapping the others, just as it could be contributing more significantly to the values of RF observed in January/2014. Although in the design of this investigation, the classification of taxon captured by species has not been defined as an objective, such action was necessary. Thus, soil samples were investigated, separating the distinct groups of Collembola. At the end of this stage, 63.12% (3,223 ind.m-2) of the representatives of the Collembola taxon belonged to the order Entomobryomorpha and the Isostomidae family. Of these, 67.49% (2,175 ind.m-2) were identified as of the specie Folsomia candida.
Dominance (RF ≥ 50%) of the Acari taxon in the January/2014 occurred in all sites sampled. Otherwise, the density of Collembola was reduced considerably in the January/2014, as in most taxon. The taxon were considered in almost all of the soils sampled as abundant (RF >10< 50%), except in soils handled with SCP forage turnip and blue lupine in CFS, which were classified as rare (RF≤2%) and occasional (RF>2<10%). Taxon representative of soil fauna (Chilopoda, Diplopoda, Larva of Coleoptera, Oligochaeta and Tysanura) were not captured in soil samples collected in the January/2014.
In general, the total richness (Richnesstotal) values of the fauna were higher in April/2013 (Figure 4).
Sample sites
Ric
hnes
s
0
2
4
6
8
10 Richnesstotal
(April/2013)
Richnesstotal
(January/2014)
Richnessaverages
(April/2013)
Richnessaverages
(January/2014)
NF1 CFS-OB NT-OB CFS-VH NT -VH CFS-TF NT-TF CFS-F NT-F CFS-LB NT-LB CFS-W NT-W
aA2
aB
bA
aA
aA
aA
aA
aB
bA
aA
bA
bB
abA
bB
aA
aB
bA
aB
bA
bB
aA
bB
abA
bB
aA
bB
Figure 4 - Total richness (Richnesstotal) and Averages richness (Richnessaverages) of the edaphic fauna in a long-term experiment, managed in Conventional Farming System (CFS) and No-tillage (NT), in April/2013 and January/2014. Pato Branco / PR. 1NF- Native forest; OB- Black oat; VH- Hairy vetch; TF- Forage turnip; F- Fallow; LB- Blue lupine and W- Wheat. 2Averages followed by different lowercase letters in the row of each year, and averages followed by uppercase letters in the column between years, differ from each other (p<0.05) by Fisher's LSD test.
Soil fauna
0
20
40
60
80
100(b)
Soil fauna
Rel
ativ
e fr
equen
cy (
%)
0
20
40
60
80
100
NF1
CFS - OB
NT - OB
CFS - VH
NT - VH
CFS - TF
NT - TF
CFS - F
NT - F
CFS - LB
NT - LB
CFS - W
NT - W
(a)
A2 C Co Ch D Di E Hy HyF Lc Ll O Pr Th A C Co HyF Hy Ll Pr
REVISTA SCIENTIA AGRARIA Versão On-line ISSN 1983-2443 Versão Impressa ISSN 1519-1125 SA vol. 18 n°. 1 Curitiba Jan/Mar. 2017 p. 50-63
58
The lowest value of Richnesstotal difference between the periods was observed in the soil managed in the CFS with blue lupine (20%) and the highest in the soil in NT with wheat (75%). Regarding NF, the values that distanced the most were observed in the CFS of black oats (50%) and in the CFS of blue lupine (50%) in April / 2013, while in January/2014 they were in the turnip CFS (33.33%) and wheat NT (33.33%).
In relation to the Averages richness (Richnessaverages), the highest values observed in April/2013 were in soil of NF and in the soils managed in NT whit SCP black oats, forage turnip, blue lupine and wheat, in the same period, in the soils managed in CFS with hairy vetch, in fallow, and wheat. In January/2014 the highest values of Richnessaverages were observed in the soil of NF, and in soil management in CFS and NT with forage turnip, in CFS and NT with blue lupine, and in CFS and NT with wheat.
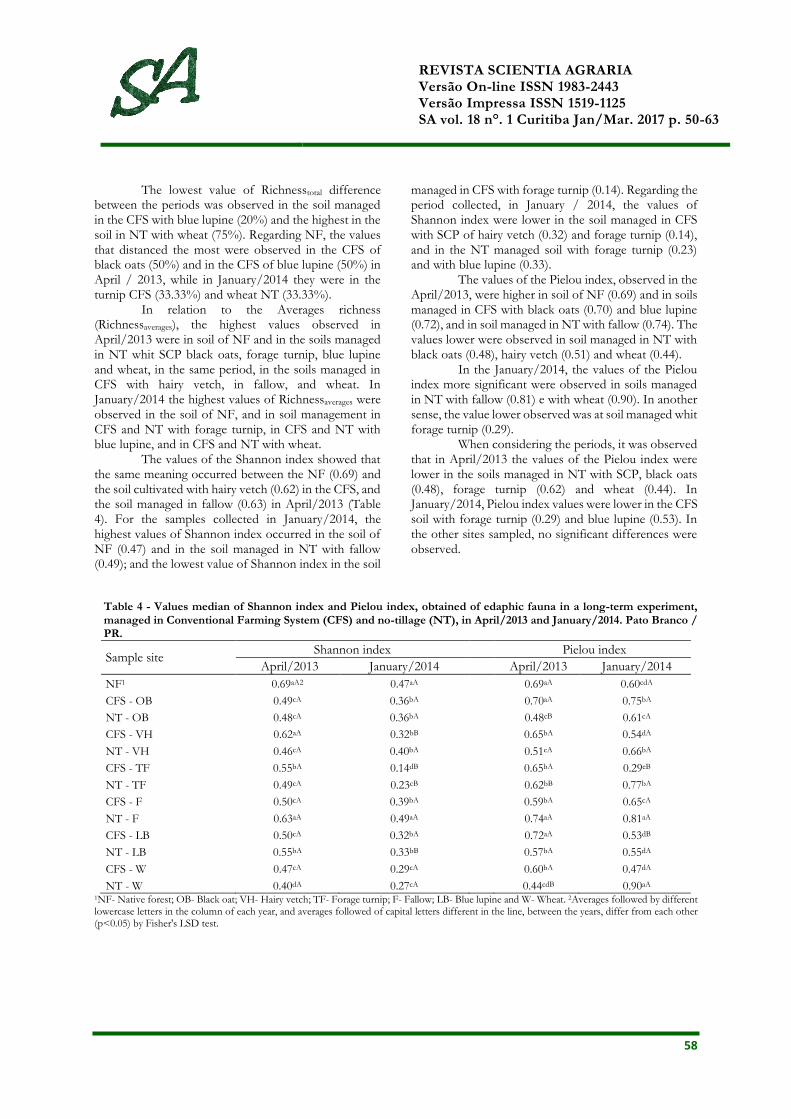
The values of the Shannon index showed that the same meaning occurred between the NF (0.69) and the soil cultivated with hairy vetch (0.62) in the CFS, and the soil managed in fallow (0.63) in April/2013 (Table 4). For the samples collected in January/2014, the highest values of Shannon index occurred in the soil of NF (0.47) and in the soil managed in NT with fallow (0.49); and the lowest value of Shannon index in the soil
managed in CFS with forage turnip (0.14). Regarding the period collected, in January / 2014, the values of Shannon index were lower in the soil managed in CFS with SCP of hairy vetch (0.32) and forage turnip (0.14), and in the NT managed soil with forage turnip (0.23) and with blue lupine (0.33).
The values of the Pielou index, observed in the April/2013, were higher in soil of NF (0.69) and in soils managed in CFS with black oats (0.70) and blue lupine (0.72), and in soil managed in NT with fallow (0.74). The values lower were observed in soil managed in NT with black oats (0.48), hairy vetch (0.51) and wheat (0.44).
In the January/2014, the values of the Pielou index more significant were observed in soils managed in NT with fallow (0.81) e with wheat (0.90). In another sense, the value lower observed was at soil managed whit forage turnip (0.29).
When considering the periods, it was observed that in April/2013 the values of the Pielou index were lower in the soils managed in NT with SCP, black oats (0.48), forage turnip (0.62) and wheat (0.44). In January/2014, Pielou index values were lower in the CFS soil with forage turnip (0.29) and blue lupine (0.53). In the other sites sampled, no significant differences were observed.
Table 4 - Values median of Shannon index and Pielou index, obtained of edaphic fauna in a long-term experiment, managed in Conventional Farming System (CFS) and no-tillage (NT), in April/2013 and January/2014. Pato Branco / PR.
Sample site Shannon index Pielou index
April/2013 January/2014 April/2013 January/2014
NF1 0.69aA2 0.47aA 0.69aA 0.60cdA
CFS - OB 0.49cA 0.36bA 0.70aA 0.75bA
NT - OB 0.48cA 0.36bA 0.48cB 0.61cA
CFS - VH 0.62aA 0.32bB 0.65bA 0.54dA
NT - VH 0.46cA 0.40bA 0.51cA 0.66bA
CFS - TF 0.55bA 0.14dB 0.65bA 0.29eB
NT - TF 0.49cA 0.23cB 0.62bB 0.77bA
CFS - F 0.50cA 0.39bA 0.59bA 0.65cA
NT - F 0.63aA 0.49aA 0.74aA 0.81aA
CFS - LB 0.50cA 0.32bA 0.72aA 0.53dB
NT - LB 0.55bA 0.33bB 0.57bA 0.55dA
CFS - W 0.47cA 0.29cA 0.60bA 0.47dA
NT - W 0.40dA 0.27cA 0.44cdB 0.90aA 1NF- Native forest; OB- Black oat; VH- Hairy vetch; TF- Forage turnip; F- Fallow; LB- Blue lupine and W- Wheat. 2Averages followed by different lowercase letters in the column of each year, and averages followed of capital letters different in the line, between the years, differ from each other (p<0.05) by Fisher's LSD test.
REVISTA SCIENTIA AGRARIA Versão On-line ISSN 1983-2443 Versão Impressa ISSN 1519-1125 SA vol. 18 n°. 1 Curitiba Jan/Mar. 2017 p. 50-63
59
DISCUSSION
Accessory variables Considering the values of ST and SM (Table 2),
it is possible to infer that in the NT already consolidated for 26 years, there are lower ST oscillations, and SM maintenance becomes more efficient when compared to the constantly revolved system. In this sense, the greater and lesser density of edaphic fauna found in April/2013 and January/2014 (Table 3), respectively, is justified in part. A number of researchers have reported on the relationship of SM to the diversity and density of the fauna (CUNHA-NETO et al. 2012; ABREU et al. 2014; GARLET et al. 2015). Machado et al. (2015) reported the highest number of organisms during periods of higher rainfall, but when they investigated the edaphic fauna in a fragment of the Semideciduous Seasonal Forest in Rio de Janeiro, they found fewer faunal representatives in the dry season, as it also was found in this inquire. In fact, in March/2013 that preceded the collections, the second highest rainfall value was recorded in Pato Branco / PR (Figure 1), which effectively contributed to the highest values of fauna obtained. On the SCP and the investigated systems, the values of density of the edaphic fauna in the April/2013, which obtained the same statistical significance of the NF, occurred in the soil maintained with SCP, black oat, forage turnip and blue lupine, managed in NT, and in the Fallow in CFS. In the January/2014, the highest densities to be counted by NF were on soil cultivated with black oats (CFS), fallow and wheat, managed in NT (Table 3).
Density, relative frequency, diversity and faunistic equitability
Considering these observations, the most represented taxon in this inquire were Acari, Collembola, Diptera, Enquitreídeos, Formicidae and Protura. These organisms live in the interface, fresh or dry phytomass and soil. Being directly influenced by the management of the areas, in this case, the NT is applied properly to justify the largest number of organisms in relation to the CFS of the areas studied. In this sense, Silva et al. (2012) considered that during the soil preparation process, several factors act against soil fauna, including direct damage, abrasion and crushing, and indirect as litter removal, as well as changes in the microclimate close to the soil.
The collected and plotted data allowed us to verify, the lesser proximity of the taxon was observed in the sites managed in CFS, also distancing themselves from the abiotic variable ST (Figure 2a). At the main axis, as can be seen, 10 of the 14 taxon were placed closer to NT-treated soils with SCP wheat, blue lupine
and black oats, which in turn were more significantly associated with the SM variable than with ST (Figure 2b). Even with the significant reduction of taxon in January/2014, the soil fauna disposition remained in greater numbers in the main axis (Figure 2c) associated with the NT managed soil with the SCP Forage turnip, black oats and follow (Figure 2d).
In the same way that they were associated more significantly to the accessory variable SM. In both collections, the association of soil fauna in a more significant way to the accessory variable SM, and less significantly to the variable ST, is noticed. Undoubtedly, the fauna of the soil was closer to NF, in both collection periods. As described by Pompeo et al. (2016) in NF, the vegetation cover remains unchanged, which consequently guarantees lower temperature variations, providing an environment more favorable to the soil groups.
The values of RF showed that in three distinct taxon (Acari, Collembola and Formicidae) values were higher than 80%, both in the April/2013 (Figure 3a) and in January/2014 (Figure 3b). Silva et al. (2013) investigating the soil fauna in an Latosol cultivated with six SCP, similar to the present one, verified that the highest RF was attributed to the Collembola, Acarina and Hymenoptera, among the 10 taxon collected, together they represented a total of 86% of the organisms surveyed.
The greatest RF of the Acari taxon in almost all the investigated sites is even more evident in the January/2014, given the great capacity of this taxon to live in diverse niches edafoclimatic, in the same way that they can act as parasites, predators, herbivores and detritivores of the litter (TRIPLEHORN; JONNSON, 2011).
With the reduction of SM in the CFS soil, as observed in this inquire, there is usually a reorganization of the edaphic fauna, increasing the density of the Acari taxon in production areas, and the reducing of the taxon Collembola, Coleoptera, Oligochaeta, among others. Reduction of Collembola RF values occurs concomitantly with reducing SM, reducing feed availability and increasing photosynthetic intensity on the soil surface.
These observations support the understanding of lower values of RF observed in January/2014 in soil samples of the areas cultivated with SCP, forage turnip, blue lupine and wheat in CFS (Figure 3b). Results that corroborate with the observations of Siddiky et al. (2012), where the authors stated that in poorer soil cover systems changes occur in the abundance and diversity of the edaphic fauna.
The values found in the Formicidae taxon justified the values of the mean and standard deviation very high in relation to the values obtained in the other sites, especially those verified in the NF (Table 3).
REVISTA SCIENTIA AGRARIA Versão On-line ISSN 1983-2443 Versão Impressa ISSN 1519-1125 SA vol. 18 n°. 1 Curitiba Jan/Mar. 2017 p. 50-63
60
Likewise, Portilho et al. (2011) investigating soil fauna in different integrated production systems in Dourados – MS, found in a rotational system (corn/soybean/forage/black oat) in NT, 316 organisms, of which 128 belonged to the Formicidae family.
Colonization by ants in harsh environments has been reported by several authors as Figueiredo et al. (2013); Crepaldi et al. (2014). However, what was noticed in the April/2013 is that in areas managed in NT, with the exception of SCP hairy vetch managed in CFS, the number of Formicidae representatives was always higher; whereas in the January/2014 there was a reduction of population in all places sampled, except in the soil samples of the area cultivated with wheat in CFS. This way, it may be speculated that a trophic instability was provoked in the studied places.
The soil samples collected in April/2013 occurred 111 days after the application of the phytosanitary products to the corn crop (maturation stage), which seems to have been enough time for the fauna to reorganize and find a new homeostasis. Thus, impacts caused by the toxicity of the applied products, mainly under the edaphic taxon, Collembola, Acari, Larva of edaphic insects, Protura, Enquitreídeos and Oligochaeta would already have been inactivated or would be less active in the studied environmental niches. These observations associated with abiotic issues contribute to the justification of the highest density values observed in the April/2013 (Table 3).
The interference of the applied products showed to be more concise in the January/2014, during the cultivation of soybean. In all taxon, there was reduction of density and Richness, contributing to obtain higher values of RF of the few taxon captured. Among them, the Acari taxon, which came to be considered dominant in all investigated sites.
In relation to the Collembola taxon, as already discussed, the values of density and RF decreased considerably in the January/2014. In this context, it was postulated that the reduction and inhibition of Collembola, influenced by SM contents (Table 1), were possibly potentiated by the use of agrochemicals used in preparation and conduction of soybean cultivation 14 days before the soil collection. In addition, and especially to the Collembola taxon, a population elevation of the Folsomia Candida species was evidenced during the January/2014 collections - a specie widely used in ecotoxicological studies, that formed colonies of young animals perceived in greater numbers in the SCP in NT of forage turnip, blue and wheat lupine even without the using of magnifying glasses. In this sense, the results are aligned with the considerations of Scoriza et al. (2015). The authors, when studying the effect of herbicides on the biota in a sandy-loam soil in Rio de Janeiro in 2014, found values more favorable to the increase of the reproduction of the species Folsomia candida. Although
adult lethality did not exceed 20%, reproduction was increased and the number of juveniles per recipient was higher than the number of representatives of the species
Enchytraeus crypticus. As reported by Zortéa et al. (2015),
pyrethroids have a clear toxic effect on organisms of the species Folsomia candida, but the toxicity values are different among the studies.
The increase of one species of Collembola in relation to others was also discussed by Fountain et al. (2007) when investigating the effect of organophosphate insecticide (Chlorpyrifos) in spider and collembola communities. However, the authors observed an increase in the total number of the Collembola Ceratophysella denticulate and the reduction of seven other species.
Bohm et al. (2010) found results that diverge from those found here in this study, when they identified population increase of Collembola in relation to Acari taxon when applied glyphosate. Results that corroborate in part with Glaeser (2008) when discussing the population increase of edaphic mites in conventional and NT after the application of glyphosate and glyphosate + 2,4D, being observed by the author, greater increase in soils managed in NT.
In April/2013, Richnesstotal were higher (reference in percentage values) than the values observed in January/2014 (Figure 4). The lowest value of Richnesstotal occurred in soil managed in NT with wheat. The lowest values of Richnessaverages, April/2013, were observed in CFS soils with SCP, black oat, forage turnip and fallow, whereas in NT soils only in the areas cultivated with hairy vetch and fallow were observed values of the same meaningfulness.
As in the previous surveys, in January/2014, the values of Richnessaverages observed in the NF soil were among the most significant sites, while the lowest values were observed in the soil managed with SCP forage turnip, blue lupine and wheat. As with Richnesstotal, a Richnessaverage was lower in January/2014. Only in the soil managed with black oats (NT and CFS) and NT managed soil with hairy vetch no significant differences were observed.
In general, with the reduction of Richness, associated with the reduction of the diversity of taxon in January/2014, the differences between the handling adopted in the anthropic areas were not completely dissimilar, on the contrary, in some cases, it was even. These observations are aligned with the considerations of Portilho et al. (2011) and Pasqualin et al. (2012), in spite of the soil coverage offering greater shelter and food for faunistic species. In fact, Richness tends to decrease when the density of one or the other taxon increases, and dominion of one or more taxon over the others often occurs. In this sense, the densities of the Acari taxon, found in April/2013 and January/2014, have been observed.

REVISTA SCIENTIA AGRARIA Versão On-line ISSN 1983-2443 Versão Impressa ISSN 1519-1125 SA vol. 18 n°. 1 Curitiba Jan/Mar. 2017 p. 50-63
61
Related to Shannon index, a mosaic of microclimatic conditions is usually created in areas managed under NT, especially when crop rotation and consortium is practiced, and such observations provide favorable conditions for greater faunistic diversity. When there is no crop rotation and the practice of single cultivation is evidenced, species of the Fabaceae family tend to contribute more effectively to diversity. Such observations help to understand the values of Shannon index found in soil cultivated with hairy vetch in CFS. On the other hand, in the soil managed in NT with the hairy vetch, the value of Shannon index was lower, as can be observed in the value of Pielou index in April/2013 (Table 4).
Other important information is due to the Richness values found in fallow managed areas, specifically NT, where there was no increasing in the number of representation. However, the values of the Shannon index and Pielou index were or were among the most significant ones (Figure 4). Typically, a higher species Richness significantly influences the value of Shannon index. However, an increase in this index may be due to an isolated increasing in a specie Richness, and / or in its uniformity of composition, and even in function of the two conceptions, as can be speculated against the values of Richnesstotal, Richnessaverage and Shannon index obtained from soil samples managed in NT and CFS in fallow.
Given this, the evaluation of the fauna of the soil indicated a little diversified taxocenosis in places investigated and in periods of greater environmental disturbance, represented by the reduction of the availability of water in the soil and temperature increase there is dominance of the Acari and Collembola groups over the others, which ends up contributing to lower values of Shannon index and Pielou index. Machado et al. (2015) considered that the variability of the equity values can be due to the values of wealth and dominance of groups, that is, the index will be higher when richness is high and the dominance of few groups is low. In fact, in the April/2013, it was observed that in CFS, the Pielou index values were higher than the values found in the sites managed by NT. This performance aligns with the lowest Richness observed in places where the soil is constant. The values of Shannon index obtained in soil samples from NT managed areas were similar to those found by Cherubin et al. (2015), who - when evaluating soil fauna in different production systems and in succession black oats/corn, wheat/soybean - found values between 0.4 and 0.58.
In view of the above, the influence of SM and ST caused the Richness values to be reduced in the January/2014 (Figure 4). Results similar to those found in this inquire were reported by Abreu et al. (2014), when investigating different rates of phytomass deposition on the soil and the relationship with the
edaphic fauna. The researchers found a value of Richness in the period of less water availability and temperature similar to those of this survey, which corresponded to values between 3 and 5, as well as Pielou index values that corresponded to the range 0.34 and 0.55. In view of the e values, it is possible to consider that the edaphic environment provided by the SCP already discussed, was not more favorable to the equitability of the taxon, which reinforces the evidence of the dominance of Acari and Collembola taxon. Therefore, the results obtained in general, are more favorable to most sites cultivated in NT.
CONCLUSION The adoption of the No-tillage for a long period
favors the biodiversity of the fauna of the soil in relation to the soil that has been done with two seasons and four annual harrows since 1976. The soil of the native forest is more biodiverse than the cultivated soil. The most representative edaphic taxon in the April/2013 were Acari, Collembola and Diptera, and in the January/2014 they were Acari, Collembola, Hymenoptera and Larva of Lepidoptera. The phytosanitary management of the areas can influence the diversity indexes of the edaphic fauna. The soil moisture abiotic factor acts severely under the edaphic fauna in the January/2014, being more evident in the conventional cropping system. The time of collection conditioned to the abiotic factors humidity and temperature of the soil influences the density of individuals, species richness and the Shannon and Pielou indexes.
ACKNOWLEDGEMENTS
The authors would like to thank CAPES and CNPq for their financial support of this work.
REFERÊNCIAS BIBLIOGRÁFICAS ALCANTARA, E. A.; PÉREZ, Y. M.; ARBOLÁEZ, H. P. H.; GONZÁLEZ, Y. R. Efecto del uso del suelo sobre su calidad en áreas de la Finca “Baños de Marrero”. Centro Agrícola, v. 43, n. 2, p. 14-22. 2016. ABREU, R. R. L. de, LIMA, S. S. de, OLIVEIRA, N. C. R. de; LEITE, L. F. C. Fauna edáfica sob diferentes níveis de palhada em cultivo de cana-de-açúcar. Pesquisa Agropecuária Tropical, Goiânia, v. 44, n. 4, p. 409-416. 2014. BARETTA, D.; BARTZ, M. L. C.; FACHINI, I.; ANSELMI, R.; ZORTÉA, T.; BARETTA, C. R. D. Soil
REVISTA SCIENTIA AGRARIA Versão On-line ISSN 1983-2443 Versão Impressa ISSN 1519-1125 SA vol. 18 n°. 1 Curitiba Jan/Mar. 2017 p. 50-63
62
fauna and its relation with environmental variables in soil management systems. Revista Ciência Agronômica, v. 45, p. 871-879, 2014. BOHM, G. M. B.; CASTILHOS, D. D.; ROMBALDI. C. V. Manejo de soja transgênica com glifosato e imazetapir: efeito sobre a mesofauna e microbiota do solo. Revista Thema, v. 7, n. 2, p. 1-10. 2010. CARRILLO, Y.; BALL, B. A.; BRADFORD, M. A.; JORDAN, C. F.; MOLINA, M. Soil fauna alter the effects of litter composition on nitrogen cycling in a mineral soil. Soil Biology and Biochemistry, v. 43, n. 7, p. 1440-1449. 2011. CUNHA-NETO, F. V. da; CORREIA, M. E. F., PEREIRA, G. H. A.; PEREIRA, M. G.; LELES, P. S. dos. Soil fauna as an indicator of soil quality in forest stands, pasture and secondary forest. Revista Brasileira de Ciência do Solo, v. 36, n. 5, p. 1407-1417. 2012. CHERUBIN, R. M.; EITELWEIN, M. T.; FABBRIS, C., WEIRICH, S. W.; da SILVA, R. F.; da SILVA, V. R.; BASSO, C. J. Qualidade física, química e biológica de um latossolo com diferentes manejos e fertilizantes. Revista Brasileira de Ciência do Solo, v. 39, n. 2, p. 615-625. 2015. CREPALDI, R. A.; PORTILHO, I. I. R.; SILVESTRE, R.; MERCANTE, F. M. Formigas como bioindicadores da qualidade do solo em sistema integrado lavoura-pecuária. Ciência Rural, Santa Maria, v. 44, n. 5, p.781-787. 2014. FIGUEIREDO, C. J.; SILVA, R. R.; MUNHAE, C. B.; MORINI, M. S. C. Ant fauna (Hymenoptera: Formicidae) attracted to underground traps in Atlantic Forest. Biota Neotropical, Campinas, v. 13, n. 1, p. 176-182. 2013. EMPRESA BRASILEIRA DE PESQUISA AGROPECUÁRIA - EMBRAPA. Sistema brasileiro de classificação de solos. 3.ed. Brasília, 353p. 2013. FOUNTAIN, M. T.; BROWN, V. K.; GANGEB, A. C.; SYMONDSONC, W. O. C.; MURRAY, P. J. The effects of the insecticide chlorpyrifos on spider and Collembola communities. Pedobiologia, v. 51, p. 147-158. 2007. FREIRE, L. R.; ARAÚJO, E. da S.; BERBARA, R. L. L. Tempo de Captura de Organismos da Mesofauna do Solo e seus Reflexos na Interpretação de Índices da Comunidade Edáfica. Revista Brasileira de Ciência do Solo, v. 39, p. 1282-1291. 2015.
FRASSON, J. M. de F.; ROSADO, J. L. O. R.; ELIAS, S. G.; MARQUES, B. H. Litter Decomposition of Two Pioneer Tree Species and Associated Soil Fauna in Areas Reclaimed after Surface Coal Mining in Southern Brazil. Revista Brasileira de Ciência do Solo, v. 40, p. 1-14. 2016. GARLET, J.; COSTA, E. C.; BOSCARDIN, J.; MACHADO, D. N.; PEDRON, L. Fauna de Coleoptera Edáfica em Eucalipto sob Diferentes Sistemas de Controle Químico da Matocompetição. Floresta e Ambiente, v. 22, n. 2. p. 239-248. 2015. GLAESER, D. F. Influência dos herbicidas glifosato e glifosato+2,4-D sobre a população de ácaros (Aracnhida: Acari) edáficos em sistemas de plantio direto e plantio convencional. 2008, 34 p. (Mestrado, em Agronomia) Universidade Federal da Grande Dourados, Dourados-Brasil. KROLOW, I. R. C. Efeito de fertilizantes mineral, organo-mineral e orgânico sobre a macrofauna e mesofauna do solo. Tese (Doutorado em Agronomia, Área de Concentração em Solos). 2011. 162f.: FAEM/UFPEL, Pelotas-RS, 2011. LAVELLE, P.; DANGERFIELD, M.; FRAGOSO, C.; ESCHENBRENNER. V.; LOPEZ-HERNANDEZ, D.; PASHANASI, B.; BRUSSARD, L. The relationship between soil macrofauna and tropical soil fertility. In: WOOMER, P. L.; SWIFT, M. J., eds. The Biological Management of Tropical Soil Fertility. New York: Wiley-Sayce Publication, p.137-169. 1994. MACHADO, D. L.; PEREIRA, P. G.; CORREIA, M. E. F.; DINIZ, A. R.; MENEZES, C. E. G. Fauna edáfica na dinâmica sucessional da MATA ATLÂNTICA em floresta estacional semidecidual na bacia do RIO PARAÍBA DO SUL – RJ. Ciência Florestal, Santa Maria, v. 25, n. 1, p. 91-106. 2015. MARÍN, E. P.; PRAGER, M. S. de; MONRROY, A. S.; PARADA, M. R. P. Poblaciones de Ácaros, Colémbolos y otra Mesofauna en un Inceptisol bajo Diferentes Manejos. Revista Facultad Nacional de Agronomía. n. 68, v. 1, p. 7411-7422. 2015. PASQUALIN, L. A.; DIONÍSIO, J. A.; ZAWADNEAK, M. A. C.; MARÇAL, C. T. Macrofauna edáfica em lavouras de cana-de-açúcar e mata no noroeste do Paraná - Brasil. Semina: Ciências Agrárias, Londrina, v. 33, n. 1, p. 7-18. 2012. PAKHOMOV, A.E, KUNAKH, O.N., ZHUKOV, A.V., BALJUK, YU. A. Spatial organization of the ecological niche of macrofauna of industrial soils.
REVISTA SCIENTIA AGRARIA Versão On-line ISSN 1983-2443 Versão Impressa ISSN 1519-1125 SA vol. 18 n°. 1 Curitiba Jan/Mar. 2017 p. 50-63
63
Bulletin of Dnipropetrovsk University. Biology. Ecology. v. 21, n.1, p. 51-57. 2013. PORTILHO, I. I. R.; CREPALDI, R. A.; BORGES, C. D.; SILVA, R. F. da; SALTON, J. C.; MERCANTE, F. M. Resíduos da cultura da cana-de açúcar e seus efeitos sobre a fauna invertebrada epigeia. Semina: Ciências Agrárias, Londrina, v. 32, n. 3, p. 959-970. 2011. PONGE, J-F. Biocenoses of Collembola in atlantic temperate grass-woodland ecosystems. Pedobiologia, v. 37,n. 4, July. 223-244, 1993. POMPEO, P.N.; SANTOS, M.A.B.dos; BIASI, J.P.; SIQUEIRA, S.de F.; ROSA, M.G.da; BARETTA, C.R.D.M.; BARETTA, D. Fauna e sua relação com atributos edáficos em Lages, Santa Catarina – Brasil. Revista Scientia Agraria. v.17, n.1. Curitiba, jan/mar. p. 42-51. 2016. SIDDIKY, R. K.; KOHLER, J.; COSME, M.; RILLIG, M. C. Soil biota effects on soil structure: Interactions between arbuscular mycorrizal fungal mycelium and collembolan. (Repost). Soil Biology & Biochemistry, v. 50, p. 33-39. 2012. SILVA, J.; JUCKSCH, I.; TAVARES, R. C. Invertebrados edáficos em diferentes sistemas de manejo do cafeeiro na Zona da Mata de Minas Gerais.
Revista Brasileira de Agroecologia, v. 7, p. 112‑125. 2012. SILVA, R. F. da; CORASSA, G. M.; BERTOLLO, G. M.; SANTI, A. L.; STEFFEN, R. B. Fauna edáfica influenciada pelo uso de culturas e consórcios de cobertura do solo. Pesquisa Agropecuária Tropical, v. 43, p. 130-137. 2013. SCORIZA, R. N.; SILVA, A. de P.; CORREIA, M.E.F.; SANTOS, P.S.dos; RESENDE, A.S.de. Efeito de Herbicidas sobre a Biota de Invertebrados do Solo em Área de Restauração Florestal. Revista Brasileira de Ciência do solo.v.39, p.1576-1584, 2015. TESSARO, D.; SAMPAIO, S. C.; ALVES, L. F. A.; DIETER, J.; CORDOVIL, C. S. C. M. S.; VARENNES, A.; PANSERA, W. A. Macrofauna of soil cultivated with babycorn treated with Swine wastewater combined with chemical fertilization. African Journal of Agricultural Research, Nairobi, v. 8, p. 86-92. 2013. TESSARO, D.; SAMPAIO, S. C.; CASTALDELLI, A. P. A. Utilização de efluentes na agricultura e potenciais efeitos na meso e macrofauna do solo. Ciência Rural, Santa Maria, v. 46, n. 6, p. 976-983. 2016.
TIEMANN, L. K.; GRANDY, A. S.; ATKINSON, E. E.; MARIN-SPIOTTA E.; MCDANIEL, M. D. Crop rotational diversity enhances belowground communities and functions in an agroecosystem. Ecology Letters, v. 18, p. 761-771. 2015. TRIPLEHORN, C. A.; JONNSON, N. F. Estudo dos
insetos. 7a ed. São Paulo: Cengage Learning. 2011.