altair avionics corporation monitor link program user guide rev f1.pdfmlp quick start guide welcome...
TRANSCRIPT

Altair Avionics CorporationMonitor Link Program

Altair Avionics Monitor Link Program MLP User’s Guide By Tyler Dawbin Approved By: Doug Thompson, General Manager David L. Fetherston, Manager Engineering Steven T. Sackos, Manufacturing & Quality Manager David Monasterio, Quality Manager

Altair Avionics Monitor Link Program MLP User’s Guide Manual Part No. GSS-T-301-1 Manual Revision: F Revision Date: April 17, 2006 Altair Avionics 63 Nahatan Street Suite 300 Norwood, MA 02062 (781) 762-8600 Located on the World Wide Web at: http://www.altairavionics.com OR http://www.altairavionics.aero AND http://www.turbinetracker.com OR http://www.turbinetracker.aero Rights © 2001, 2002, 2003, 2004, 2005, 2006 by Altair Avionics Corporation All rights reserved. No part of this manual may be reproduced or transmitted in any form by any means, electronic, mechanical, photo process, recording, or otherwise, without written permission from Altair Avionics Corporation. Trademarks The following are trademarks (™ ) of Altair Avionics Corporation: ADAS™ IntelliStart+™ MLP™ Monitor Link Program™ SmartCycle™ SmartCycle+™ TrendCheck™ TrendCheck+TM ADAS+TM ADAS+ UpgradeTM TurbineTracker™. DTUTM ADASd™
Windows™, ActiveSync™ and Microsoft ExcelTM are trademarks of Microsoft Corporation.

MLP Quick Start Guide
Welcome to Altair Avionics Corporation’s Monitor Link Program! This program will allow you to communicate with your Altair Engine Monitor and/or Data Transmission Unit. The following guide will help you get started with using this program effectively to set up your monitor and begin to use the many features of the Monitor Link Program, referred to as MLP.
⇒ For information on obtaining MLP, refer to page 4.
⇒ To establish communication with your monitor, see page 6.
⇒ If you would like to configure your monitor, start on page 9.
⇒ To calibrate your monitor on your aircraft, proceed to page 13.
⇒ For instructions retrieving data, page 22 is the place to begin.
⇒ Synchronizing to TurbineTracker™ is explained starting on page 19.
⇒ If you wish to view retrieved data from your aircraft, see page 23.
⇒ Live data can be viewed in real time! Get started on page 25.
⇒ Starting on page 27, you can learn other methods to view your data.
⇒ MLP settings are customizable to your preferences. See page 31.
⇒ Instructions for troubleshooting MLP begin on page 34.
⇒ Appendix A, on pages 40-42, will help you with additional troubleshooting information.
⇒ If you are using a PDA device, you can get started on page 43.

1
TABLE OF CONTENTS
MONITOR TYPES BY GENERATION ..................................................................................................................3 1. THE MONITOR LINK PROGRAM.....................................................................................................................4 2. OBTAINING AND INSTALLING MLP ...............................................................................................................5
To Download the Monitor Link Program on a Single-User PC* ...............................................................6 To Install the Monitor Link Program..........................................................................................................6 To Enable Communication with Your Monitor..........................................................................................7
3. CONFIGURING YOUR ALTAIR MONITOR SYSTEM ....................................................................................10 To Obtain a Configuration File from TurbineTrackerTM .........................................................................11 To Transfer a Configuration File to Your Monitor ..................................................................................12
4. CALIBRATING YOUR ALTAIR MONITOR SYSTEM .....................................................................................14 To Calibrate Your Monitor ........................................................................................................................15
5. RETRIEVING YOUR DATA.............................................................................................................................18 To Retrieve Logged Data ..........................................................................................................................19
6. SYNCHRONIZING TURBINE TRACKER TO YOUR AIRCRAFT ...................................................................20 To Synchronize to TurbineTracker ..........................................................................................................21 To Synchronize Your Aircraft...................................................................................................................22 To Synchronize Your PDA........................................................................................................................23
7. VIEWING YOUR DATA ...................................................................................................................................24 To View a Data Log File ............................................................................................................................25
8. VIEWING DATA IN REAL TIME......................................................................................................................26 To View Live Data......................................................................................................................................27
9. SPECIAL VIEWS.............................................................................................................................................28 To View Graphed Live Data ......................................................................................................................29 To View Live Data with Large Text ..........................................................................................................30
10. CUSTOMIZING YOUR MLP SETTINGS.......................................................................................................32 To Change the Monitor Type....................................................................................................................33 To Change the Date Format of MLP.........................................................................................................33 To Change the Communication Settings ................................................................................................33 To Change the MLP Options Information................................................................................................34
11. TROUBLESHOOTING MLP..........................................................................................................................35 To Troubleshoot Communication Problems...........................................................................................36 To View a Configuration File ....................................................................................................................38 To View MLP Session History ..................................................................................................................39
APPENDIX A.......................................................................................................................................................40 Table of Errors and Messages .................................................................................................................40 User Entry Requirements for CALIBRATION (Input Validation) ............................................................42
APPENDIX B.......................................................................................................................................................43 Installing MLP Onto Your PDA.................................................................................................................43
INSTALL ACTIVESYNC™ SOFTWARE.....................................................................................................43 COPY MLP SOFTWARE TO PC.................................................................................................................44 CONNECT THE PDA TO THE ENGINE MONITOR....................................................................................45 RUNNING MLP............................................................................................................................................46 FEATURES..................................................................................................................................................48 MLP USER INTERFACE.............................................................................................................................50 PDA SYSTEM REQUIREMENTS................................................................................................................50 APPENDIX C.......................................................................................................................................................51
Installing USB Drivers Onto Your Computer ..........................................................................................51 INDEX..................................................................................................................................................................54
FIGURE 1B - ACTIVESYNC INSTALL .......................................................................................................................... 43 FIGURE 2B - USB CABLE......................................................................................................................................... 44 FIGURE 3B CONNECTED STATUS.............................................................................................................................. 44 FIGURE 4B EXPLORE MENU .................................................................................................................................... 45 FIGURE 5B PROGRAMS FOLDER .............................................................................................................................. 45 FIGURE 6B – CABLES .............................................................................................................................................. 46

2
FIGURE 7B - SIMPLIFIED MENU................................................................................................................................. 47 FIGURE 8B - STORAGE PATH .................................................................................................................................... 48 FIGURE 9B - LOW MEMORY WARNING ...................................................................................................................... 49 FIGURE 10B - LAMP ON CONDITIONS......................................................................................................................... 49 TABLE 1B MENU OPTIONS ....................................................................................................................................... 47 TABLE 2B SYSTEM REQUIREMENTS .......................................................................................................................... 50

3
MONITOR TYPES BY GENERATION (With communication Baud rates)
Generation I (G1) Generation II (G2) Generation III (G3) DTU & ADASd(G3)
CrossCheck
HUMS 1022
HUMS 1122
Fixed Baud Rate
9600
TrendCheck
ADAS
SmartCycle
SmartCycle Twin
Fixed Baud Rate
19,200
IntelliStart+
SmartCycle+
IntelliStart+ BA
TrendCheck+
ADAS+
ADAS+ Upgrade
Configurable Baud Rate 19,200 On Reset 57,600 Maximum
DTU
ADASd
Configurable Baud Rate 57,600 On Reset 57,600 Maximum

4
1 1. THE MONITOR LINK PROGRAM
Altair’s Monitor Link Program (or MLP) is a multipurpose communication tool designed to allow you to quickly retrieve and transfer engine operational data, and to configure, calibrate and troubleshoot your Altair monitoring system. Designed as an easy-to-use companion to Altair’s Internet-based TurbineTrackerTM trend analysis and fleet management system, MLP runs on a laptop PC with a simple Windows™ interface. There is also a version of MLP available for use with a PDA. Customer checklists are conveniently located on the TurbineTracker™ website under the Support tab. Go to Support→Documents→Checklists→MLP to locate these documents. They will be referred to throughout this manual, and are intended as a quick-reference item. As a configuration tool, MLP will enable you to set up your monitor for the particular aircraft, engine, and system you have.
As a calibration and troubleshooting tool, MLP is an invaluable resource. It will allow you to view live data from your engine and aircraft sensors as it is collected. If a cockpit-mounted communication port has been installed you can even observe your live data in flight. MLP will also allow a connection to your engine monitor through an Altair DTU (Data Transmission Unit). Provision for quickly making one and two point sensor calibrations is built in so that you can optimize your system, and check your calibration against test equipment standards or actual aircraft instruments under real operating conditions.
THE ALTAIR DTU – Data Transmission Unit
The Altair DTU can be permanently connected to your engine monitor through a serial port. The DTU will allow you to automatically retrieve data when your aircraft lands on the ground, using GSM wireless. It serves as the gateway between your engine monitor and TurbineTracker and performs many of the functions of MLP automatically – which enables you to spend more time analyzing data and less time retrieving it!

5
2 2. OBTAINING AND INSTALLING MLP
The Altair Monitor Link Program™ installs quickly with a minimum of steps. It is very important to obtain the current version of MLP and most recent revision of this manual. Altair maintains the latest versions for download at the TurbineTracker™ Internet website
www.turbinetracker.com OR www.turbinetracker.aero
If you do not have a registered TurbineTrackerTM account please contact Altair Customer Service.
Altair Avionics Corporation Customer Service Department 63 Nahatan Street Suite 300 Norwood, MA 02062
(781) 762-8600 To install your system, you will follow three basic steps. First you’ll download the MLP installation program. Second you will run the program. Finally, you will establish communication between the MLP computer and your monitor system using a serial cable. Windows 95® users may need to contact Altair Customer Service for a patch which will enable MLP to run in that environment.
MINIMUM SYSTEM REQUIREMENTS
• Windows™ operating system 98 or higher • Internet Access • RS232 or USB port o Refer to Appendix C for USB Driver
Installation

Obtaining and Installing MLP
6
Figure 2.1 Open the Support Folder and click on System Updates button.
Figure 2.2 Double click the program shortcut on your desktop.
To Download the Monitor Link Program on a Single-User PC*
Note If this is the first installation of MLP you will need to create the folder c:\mlp then create the sub folder c:\mlp\bin 1. Log onto the TurbineTrackerTM website. 2. Navigate to the Support folder tab (Figure 2.1). 3. Click on the System Updates button. 4. Select the mlp.exe file and when asked, download it to your computers’s c:\mlp\bin folder. 5. Create a shortcut to the mlp.exe and place it on your desktop.
• This will allow the desktop shortcut to get automatically updated during future releases.
Note It is not recommended to save the mlp.exe on your desktop.
To Install the Monitor Link Program 1. Double click the mlp.exe program shortcut icon on your Desktop (Figure 2.2). The program will automatically set up your computer to serve as an MLP workstation.
2. When the MLP program has been successfully installed it will indicate that it currently is set to work and communicate with a generic Intellistart Plus + monitor system. In the next section you will change this to suit the specifics of your own monitor system.
*MULTI-USER PC/WIN 95™ USERS 1. Create the folder c:\mlp 2. Create the folder c:\mlp\bin 3. Retrieve the MLP from TurbineTracker™ and
save it in the c:\mlp\bin folder. 4. Create a shortcut to the MLP on your
desktop.

7
Figure 2.3 Select ‘Autodetect’ from the MLP dropdown menu.
Figure 2.4 Align the connector properly.
Figure 2.5 Set the Run / Configure switch to CONF.
To Enable Communication with Your Monitor You will need to create an MLP settings file (.mlu file) to enable communication between the MLP computer and your aircraft monitoring system. The MLP laptop computer uses the contents of this file to determine communication rate, monitor type, and other necessary information. The contents of this file are created by the MLP itself through an “Autodetect” feature (Figure 2.3). 1. For new installations, make sure that your laptop’s time and date are correctly set, since you will be transferring them to your monitor system. 2. Power up your monitoring system. Some Altair monitors have multiple power sources – make sure that all the necessary sources are on, including the master battery switch, and system breakers, if any. Be sure that the aircraft battery is connected, since a direct battery power connection is used in some monitor units. See your Installation Manual for specific power requirements. If your system includes a cockpit display lamp, check that it goes through the correct power up display sequence. See your manual for the appropriate lamp display. 3. Connect the Communication Cable between your laptop computer’s USB or RS-232 serial port and the Altair DTU or monitor’s Communication Port (Figure 2.4). The port is usually mounted either in the cockpit or on the processor itself. The cable connectors are keyed to fit only one way, so be sure to align the connectors properly before inserting them. Don’t use excessive force. Check the orientation if a connector seems hard to insert.
CUSTOMER CHECKLIST Refer to the checklist “Establish MLP Connection”, CUST-T-002-1, under the “Support” tab in TurbineTracker™.

8
Figure 2.6 MLP will automatically detect the type of monitor being connected to.
Note Step 4 does not apply to units using a DTU. The run/config switch has no DTU function and can be used in either position. 4. Set the Run/Configure switch in the cable to CONF (Figure 2.5). Your monitor’s lamp should indicate that the Configure mode has been set, as specified in your Installation Manual—generally a continuous lamp on. 5. Click Edit 6. Select Communication Port from the dropdown menu. 7. Select Autodetect from the dropdown menu (Figure 2.3). This function will automatically determine the current serial communication rate of your monitor system. 8. Autodetect will automatically select the monitor type (Figure 2.6). If it cannot establish the type without help, MLP will prompt you to check the power, communication, and cable connections. If you are still experiencing problems connecting to your monitor, refer to the ICA for troubleshooting assistance. 9. MLP now has the information it needs to create a new install settings (.mlu) file with the communication and monitor specifics of your onboard system. MLP will generate a new MLU file and save it with a .mlu extension. MLP can now connect and communicate easily with your monitor. For new installations, the next step is to configure and calibrate the monitor system. Note: For new monitors that have not been configured, the Autodetect feature may assume that the monitor is an Intellistart+.
CONNECTING THROUGH A DTU Refer to section 10, Customizing Your MLP Settings, to enable DTU connection. MLP will display a message that it needs to restart for the changes to take place. An Altair DTU provides a wireless connection to TurbineTracker from your Altair Monitor. To connect to your monitor through the DTU, click on the red DTU button on the top of the screen. When the button is green, you are connected to your monitor through the DTU interface. To disconnect the monitor and communicate with the DTU, click on the button again. The button will be red again to indicate that you are connected to the DTU.

9
This will be corrected to the actual monitor type once the monitor is configured.
3

10
3. CONFIGURING YOUR ALTAIR MONITOR SYSTEM
Every Altair engine monitoring system is a combination of hardware and software. Each system must be initialized through software commands to work with a particular aircraft and engine combination. You initialize your monitor system by creating a configuration file on TurbineTracker™ and then using MLP to transfer the contents of the file to your Altair monitor.. You can rely on the MLP synch features described in section 6, to load and maintain the monitor’s configuration. In addition expert users can also manually load the configuration file to set up the monitor. The configuration file contains the special information needed by the monitor to work with that particular aircraft. We will learn to calibrate the monitor in section 4. You can also use TurbineTrackerTM to adjust your configuration files to fine tune the data recording trigger and duration settings of your monitoring system. These advanced topics are covered in the TurbineTrackerTM manual. Note for DTU operators You must manually load the configuration file the first time you set up your DTU.

11
Figure 3.1 Open the File Transfer Folder and click the Download Config button.
Figure 3.2 Save the configuration file to the C:\mlp\cfg\ directory. Note: The preferred method to download a configuration file is to use the MLP Synchronize to TurbineTracker feature.
To Obtain a Configuration File from TurbineTrackerTM If new configuration files were created specifically for your new application by Altair, they will be located on the TurbineTrackerTM website. To download configuration files from TurbineTrackerTM to MLP: 1. Open MLP and select Synchronize to TurbineTracker or Log onto the TurbineTrackerTM website and navigate to the File Transfer folder (Figure 3.1) or the DTU tab for a DTU configuration. 2. Click on the Download Config button. Your configuration files will appear in list form. If there are no configuration files, you will need to create a new one for the monitor. See the TurbineTrackerTM Manual for specific information on creating new configuration files using TurbineTrackerTM. 3. Choose the configuration file you want to install by clicking on its highlighted (colored) version number. 4. You will be asked whether you want to open or save the file to your laptop’s hard disk. Choose save the file to disk. 5. The configuration file name downloaded from TurbineTrackerTM is defaulted to <install_desc>.cfg, where install_desc refers to the installation description. Do not change the file name when downloading this file. 6. Set the file destination to the C:\mlp\cfg\ directory (Figure 3.2). 7. Click Save. The file is now on your laptop MLP computer.
CUSTOMER CHECKLIST Refer to the checklist “Load Configuration File onto Processor”, CUST-T-003-1, under the “Support” tab in TurbineTracker™.

12
Figure 3.3 Select a configuration file to transfer.
Note: The preferred method to load a configuration file is to use the MLP Synchronize to Aircraft feature.
To Transfer a Configuration File to Your Monitor With communication parameters set, we’re ready to send a configuration file from MLP. We will first make sure communication is established. An easy way to do this is to perform an MLU Status display. This is a handy way to initiate and verify communications, and it’s a good practice to do it as the first step whenever you first connect the laptop and monitoring system. 1. Click MLU and select MLU Status from the dropdown list or click on the icon. You should see a screen of the monitor’s current settings. If not, you will see an error message asking you to make sure that the monitor is in Configuration Mode. If you get the error message and you are not using a DTU, check that your Run/Configure switch is set to CONF. For all units check that the system is powered up correctly, check your communication cable and connectors, and make sure that if you have several different monitor systems and several .mlu files on your laptop, that you’ve selected the correct file. 2. With communication verified, click Synchronize to Aircraft or click MLU and select Configure Unit or click on the icon. If it is necessary to clear the log, refer to the instructions in Section 5. Note DTU must be loaded manually 3. Follow MLP prompts for synchronizing or choose the configuration file that you want to send to the monitor (Figure 3.3). In a new installation this will be the configuration file that you just synchronized or downloaded from TurbineTrackerTM. 4. Click Open.
Introduction to Configuration Files The configuration file contains information specific to your airframe and engine combination. This file will set up which sensors are enabled, the sensor names, digital status inputs, system fault information, events related to system health, along with a variety of other parameters specific to your installation. Configurations are first created on TurbineTracker™, generally with the help of qualified Altair technicians, and can be tuned to your specific needs. New installations will require their own specific configuration file, which will be loaded into the newly installed system. Once the monitor is set up, Altair recommends updating your configuration using the sync functions of MLP. These functions are described in more detail in Section 6.

13
Note: If the monitor contains any log data, the MLP will alert you that this data must be retrieved before you can configure the unit. This data can be deleted after retrieval. See section 5, Retrieving Your Data, starting on page 16. After retrieving your data, you can begin the process of configuring your monitor again. MLP will clear out old monitor settings and then load in the new configuration. The process may take a few minutes. A status display at the top of the screen will indicate the monitor’s progress. Since the new configuration will set the processor to its fastest communication rate, (which may be different from the initial rate) MLP will automatically save the new .mlu file. 5. In a new installation, set the clock in the unit by following the prompt. This setting is taken from the MLP laptop’s operating time and date. 6. Your new configuration is complete. Check that the completion message is shown on your screen.
As a final check that communication is established, you can run the MLU Status (Step 1).
With communication established and a correct configuration, your new monitor is ready to be calibrated.
FILE TYPES AND BAUD RATES A .mlu file sets the communication parameters that your MLP laptop computer uses. A .cfg (or Configuration File) sets the parameters that your aircraft monitoring system uses.
Both the monitor and the laptop parameters must match for communication to occur. Earlier Altair monitors had only one speed. For Generation I monitors this was 9600 Baud. For Generation II monitors the fixed speed was 19.2K. For Generation III monitors, the rate is configurable. The processor initially communicates at 19.2K, but may be set through software command as high as 57.6K. To establish initial communication with all models, the MLU Autodetect function is used. To increase its communication speed, a Gen III monitor is first configured (via 19.2K) with a .cfg file which contains the higher rate. A new .mlu file is then created to adjust the laptop to match the monitor system’s new rate

14
4 4. CALIBRATING YOUR ALTAIR MONITOR SYSTEM
Now that your monitoring system is configured, it needs to be calibrated to correctly interpret the signal levels onboard your aircraft. Calibration is required for analog sensors in order to compensate for variations in cable resistance and transducer variability. Altair monitor calibration is similar to the kind of calibration performed for cockpit instruments. Generally you may use the same kinds of calibration equipment. It is also possible to calibrate a system without equipment by using cockpit flight instrument readings. This does require flying the aircraft while calibrating, and requires accurate calibrated cockpit instruments. Use of calibration test equipment is the preferred method. The particular requirements for sensor calibration are given in your Altair monitor’s Installation Manual. See your installation manual for the actual calibration steps. Calibration information is saved in a .cal file unique to the installation for the aircraft being calibrated.

Calibrating Your Altair Monitor System
15
Figure 4.1 Select a sensor to calibrate.
To Calibrate Your Monitor Your installation manual may recommend that sensors be calibrated from signals generated either through use of standard test equipment, or from cockpit instrument readings of ground and flight tests. Refer to your manual for specific calibration instructions for your Altair monitor. The following instructions provide an example calibration of one sensor using test equipment: 1. Establish communication between the MLP computer and your monitor. (enter transparent mode if using a DTU) Verify communication by performing an MLU Status command or click on the icon. 2. Click MLU and select Sensor Calibration from the dropdown list or click on the icon. 3. Pick the sensor that you want to calibrate from the dropdown list (Figure 4.1). If this is a new installation, you should calibrate only those sensors called for in your monitor’s Installation Manual. In the following example the Engine 1 - ITT temperature sensor has been selected. It will be calibrated with a Barfield tester. 4. Select the method of calibration. The listed types are: Two Point One Point Offset (P2) One Point Slope (P1) Use the recommended calibration type for each sensor specified in your installation manual. In our example we will choose Two Point Calibration.
CALIBRATION TYPES Two Point calibration is the recommended choice for most sensors (the OAT and Altitude sensors may be exceptions). It means that you will enter two different calibration readings preferably with a wide difference between them. The Two Point procedure will normally yield the most accurate calibrations. However, if you enter readings that are too close together, your calibration will be inaccurate. And if you enter the same reading for both points the MLP will reject the calibration. The MLP has built-in checks to ensure minimally acceptable values are supplied during calibration. The One Point Offset (P2) method is more frequently used than the One Point Slope (P1) described on the following page. It is similar except that the single calibration reading should preferably be at the low end of the instrument range. The One Point Offset method is often called for in calibrating Altair’s OAT, open air Static, and Altitude sensors on the ground, using calibration set points of ambient temperature and pressure.
Calibrating Your Altair Monitor System
16
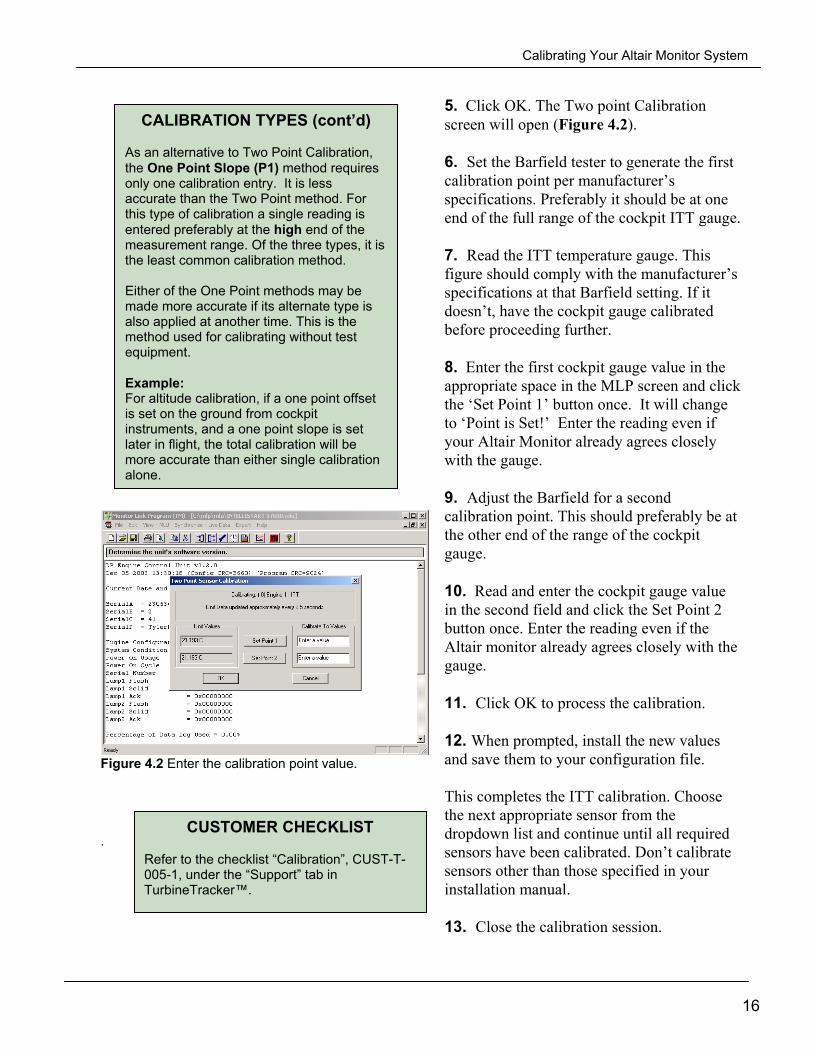
Figure 4.2 Enter the calibration point value. .
5. Click OK. The Two point Calibration screen will open (Figure 4.2). 6. Set the Barfield tester to generate the first calibration point per manufacturer’s specifications. Preferably it should be at one end of the full range of the cockpit ITT gauge. 7. Read the ITT temperature gauge. This figure should comply with the manufacturer’s specifications at that Barfield setting. If it doesn’t, have the cockpit gauge calibrated before proceeding further. 8. Enter the first cockpit gauge value in the appropriate space in the MLP screen and click the ‘Set Point 1’ button once. It will change to ‘Point is Set!’ Enter the reading even if your Altair Monitor already agrees closely with the gauge. 9. Adjust the Barfield for a second calibration point. This should preferably be at the other end of the range of the cockpit gauge. 10. Read and enter the cockpit gauge value in the second field and click the Set Point 2 button once. Enter the reading even if the Altair monitor already agrees closely with the gauge. 11. Click OK to process the calibration. 12. When prompted, install the new values and save them to your configuration file. This completes the ITT calibration. Choose the next appropriate sensor from the dropdown list and continue until all required sensors have been calibrated. Don’t calibrate sensors other than those specified in your installation manual. 13. Close the calibration session.
CALIBRATION TYPES (cont’d) As an alternative to Two Point Calibration, the One Point Slope (P1) method requires only one calibration entry. It is less accurate than the Two Point method. For this type of calibration a single reading is entered preferably at the high end of the measurement range. Of the three types, it is the least common calibration method. Either of the One Point methods may be made more accurate if its alternate type is also applied at another time. This is the method used for calibrating without test equipment. Example: For altitude calibration, if a one point offset is set on the ground from cockpit instruments, and a one point slope is set later in flight, the total calibration will be more accurate than either single calibration alone.
CUSTOMER CHECKLIST Refer to the checklist “Calibration”, CUST-T-005-1, under the “Support” tab in TurbineTracker™.

Calibrating Your Altair Monitor System
17
14. Synchronize to TurbineTracker™ This is to upload your new calibration data or you can manually upload your .cal file to TurbineTrackerTM (Figure 4.3). It is important to maintain the same configuration file version in both the Altair Monitor and TurbineTrackerTM.
MLP no longer saves the entire configuration (.cfg) file when doing Calibration; it only saves the
calibration (.cal) file which contains only the installation ID and the calibrated sensors information.
This reduces the required file transfer time
considerably.
The Calibration (.cal) file is stored in the MLP sync sub-directory tx folder (C:\MLP\SYNC\CFG\TX).

18
5 5. RETRIEVING YOUR DATA
Note: The preferred method for retrieving your data is with the Synchronize to Aircraft function.
It’s likely you will want to retrieve data right away after the first test flight of your system. Data retrieval is easy with MLP. Like the logbook that a pilot might fill in with cockpit instrument readings, your Altair monitoring system maintains a log of operational readings in electronic form. These are stored in the processor’s data log. In order to read the data log, you simply transfer its contents to your laptop computer via MLP and save it as a file. In MLP you can view your saved data log file immediately and see the information in relatively raw form (handy for troubleshooting), Lamp on status is displayed at the end of the data retrieval process or you can transfer it to TurbineTrackerTM for further refinement, trend analysis, report generation, and long term storage. After saving the data, you can clear the monitor to begin a new data log. Or you can leave it intact to continue recording at the end of the existing log. Usually you will clear the log in order to provide maximum memory space for collecting new data.

19
Figure 5.1 Click MLU and select Retrieve Unit’s Data Log.
Figure 5.2 Enter the name of your Data Log File and click Save.
To Retrieve Logged Data
1. Establish communication between the MLP computer and your monitoring system. Verify communication by performing an MLU Status command or click on the icon. 2. The preferred method is to synchronize to the aircraft which will retrieve your log and prompt you to reset it automatically. Click MLU and select Retrieve Unit’s Data Log from the dropdown list or click on the icon. You will be asked for a filename to save the file to (Figure 5.1). 3. Name the data log file and click Save (Figure 5.2). The data will be transferred and saved to your MLP computer. 4. You will be asked if you want to reset the log. This will clear the monitor unit of all logged data. Generally you will answer “Yes” because you have just saved the data as a file on your MLP laptop. Clearing the monitor will give it full memory space for recording new data. If your monitor system’s clock and the MLP time setting don’t match closely enough, you may be asked if you want to synchronize the monitor’s clock. If there is some reason to maintain a different time setting on the aircraft monitor, or if the laptop’s time is not accurate, answer No, otherwise you may synchronize the two clocks by clicking Yes. Data retrieval is now complete and you can view it in MLP along with your Lamp on status displayed. Don’t forget to transfer the log to TurbineTrackerTM preferably using synchronize to TurbineTracker.
TIP Naming Log Files: You may want to choose a filename that includes the aircraft tail number, and date, and maybe even the time of retrieval. If you do, it will be easier to find a particular log file later. And, you won’t risk overwriting an existing file by using the same name. Note: All log files must have the .log extension.
CUSTOMER CHECKLIST Refer to the checklist “Retrieve Log File from Processor”, CUST-T-006-1, under the “Support” tab in TurbineTracker™.

20
6 6. SYNCHRONIZING TURBINE TRACKER TO YOUR AIRCRAFT
MLP Auto-update MLP will auto-update if a newer version is available when synchronizing to TurbineTracker. MLP will download the new version during TTS sync and then create a batch file and launch it before shutting itself down. The batch file will move the current version of MLP to the c:\mlp\archive folder as mlp<version>.exe and move the new version of MLP to the c:\mlp\bin folder along with any dependencies.
Figure 6.0 Drop down list with synchronize options
MLP includes a feature for synchronizing your aircraft to TurbineTracker™, and then synchronizing TurbineTracker™ to your aircraft. Synchronization to your aircraft retrieves your monitor’s data log and saves that data for an upload to TurbineTracker™. It also determines if the configuration has changed, and updates the configuration file stored in the monitor. Synchronizing your system to TurbineTracker™ transfers configuration files and data log files from MLP to your TurbineTracker™ account, and determines if any new configuration files or MLP auto-updates exist. MLP can synchronize with the PDA. This feature fetches all the data files from the PDA to the PC and then automatically synchronizes the log and cal files with TurbineTracker™. It also downloads any new config files and copies them to the PDA. This feature simplifies many of the steps that were previously required to implement the full functionality of an Altair Avionics monitoring system, by fully automating the process of transferring configurations to your monitor, uploading data to TurbineTracker™, and synchronizing your aircraft configuration to the latest configuration available for your monitoring system. Note for DTU operators: These features can only be used when the initial setup of the DTU is complete. Refer to Section 3, Configuring Your Altair Monitor System.

21
Figure 6.1 Login to synchronize to TurbineTracker
To Synchronize to TurbineTracker
1. Click Synchronize and select TurbineTrackerTM from
the dropdown list (Figure 6.0). 2. The MLP now performs user authentication while
synchronizing with the TurbineTracker® system. The user has to login using the TurbineTracker® user ID and password before synchronization begins.(Figure 6.1)
3. Customers who connect to the internet via proxy servers may be required to set their proxies to allow connection to the TurbineTracker® site.
Firewall address and port settings that MLP uses IP 66.203.67.163 Port 20 & 21 4. MLP automatically performs the functions of
connecting to TurbineTracker™, uploading the calibration files, uploading the log files, determining if there are any new configurations or MLP updates, and downloading the new files to the local computer when found.
5. When MLP is done, the display will show “TTS
Synchronization Process Complete”. Copies of any log files sent to TurbineTracker™ are available in the c:\mlp\log directory for viewing with the MLP (See Section 7, Viewing Your Data). The naming convention is <tail number>_<time>.log, where the tail number is taken from the installation description in TurbineTracker™, and can be determined with an MLU status by looking at Serial D
TIP The proper method of using the SYNC function is this:
1. Sync to TurbineTrackerTM 2. Sync to Aircraft. 3. Sync to TurbineTrackerTM

22
Figure 6.3 Click Synchronize and select Aircraft.
Figure 6.4 Aircraft Synchronization done.
CAUTION: If you do not reset the Log for a long period of time, the processor’s memory may become full. If the processor’s memory fills up, the processor will stop recording data.
To Synchronize Your Aircraft
Note for DTU operators: You must set up the
DTU first before performing any of these steps. See Section 3, Configuring Your Altair Monitor System.
1. Click Synchronize and select Aircraft from
the dropdown list (Figure 6.3) MLP will prompt you with a box asking you to select sync options.
. DTU users select “All” for your Sync Option from the pop-up window. 2. MLP will automatically retrieve the unit’s
data log (Figure 6.4) and display the current lamp on condition status.
Note for DTU operators: If you wish to review the lamp on condition status page you must do so before selecting your LOG RESET option. 3. While retrieving the data log, click “Yes”
if you wish to reset the data log. Generally, this is the option to select since your data has already been retrieved and will be loaded into TurbineTracker™ in the next step (Figure 6.5).
4. The MLP will now load any newer version
of the configuration file into the monitor. This is why you should synchronize to TurbineTracker™ first prior to synchronizing to the aircraft. This will ensure that you have the latest configuration file when you go to your aircraft.

23
Figure 6.5 Click “Yes” if you wish to clear the data log.
Figure 6.6 Prompt for Flash memory path.
Figure 6.7 MLP completion message.
5. Repeat these steps for all of your aircraft.
NOTE: Once the computer has completed the Synchronization process the following message will appear:
“TTS Synchronization Process Complete”
To Synchronize Your PDA You have the ability to Synchronize MLP on your laptop or desktop computer to the MLP on your PDA. This will allow you to overcome the synchronize to TurbineTracker issues associated with the limited Internet connectivity of PDA operating systems. 1. Click Synchronize and select PDA from the dropdown list (Figure 6.0). PDA sync will ask the user to enter the path to the storage card the first time the user syncs with the PDA. This allows users to store their PDA data in any external flash and does not restrict them to the in-built flash.
Altair Avionics NOTE: Once the computer has completed
the Synchronization to PDA process the following message will appear:
“Synchronize with PDA Complete” (Figure
6.7)

24
7 7. VIEWING YOUR DATA
When you want to see actual logged data quickly without TurbineTrackerTM analysis, you can use MLP’s file view function. Typically, you might use the view function to find the possible cause of a lamp indication for an engine Exceedence or Event. Where a lot of raw data has been recorded and it’s hard to locate a reading, or for trend data analysis, TurbineTrackerTM is the tool to use. MLP also offers a categorized view of your log data that allows you to quickly find events of interest or general statistics about your log retrieval. For quick answers and a reading-by-reading history of the monitor system, MLP’s log file viewing function gives you the data, right now.
25
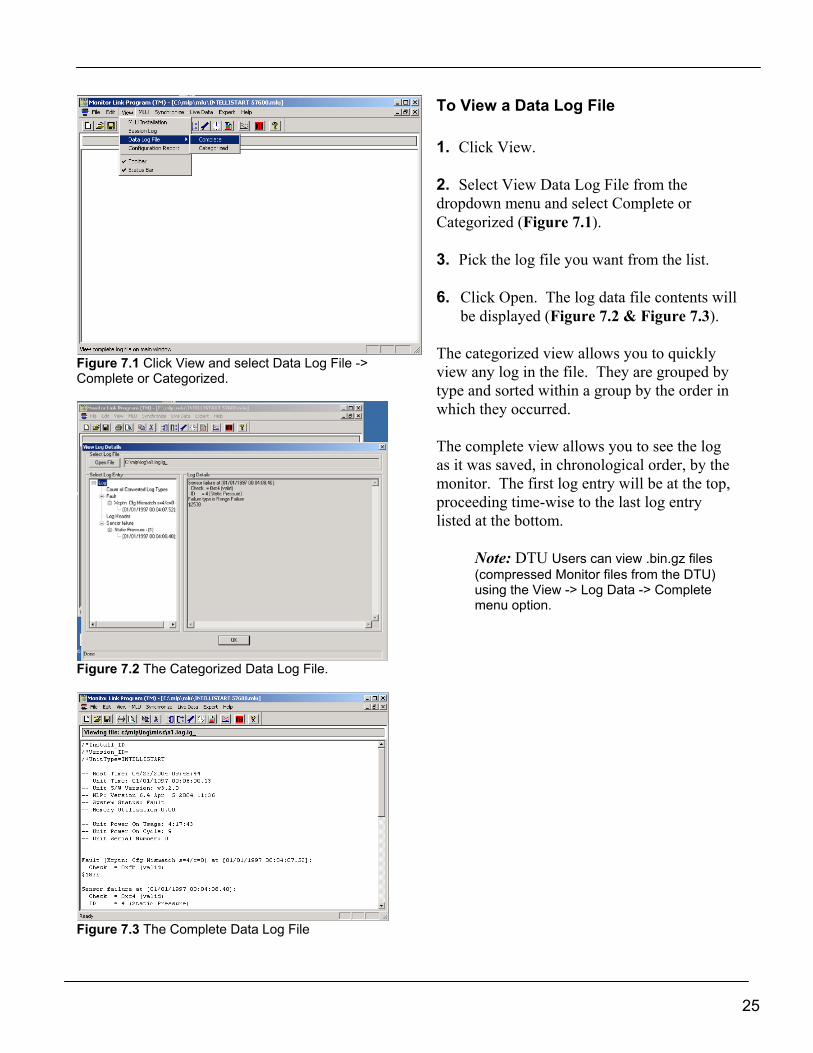
Figure 7.1 Click View and select Data Log File -> Complete or Categorized.
Figure 7.2 The Categorized Data Log File.
To View a Data Log File
1. Click View.
2. Select View Data Log File from the dropdown menu and select Complete or Categorized (Figure 7.1).
3. Pick the log file you want from the list.
6. Click Open. The log data file contents will be displayed (Figure 7.2 & Figure 7.3).
The categorized view allows you to quickly view any log in the file. They are grouped by type and sorted within a group by the order in which they occurred. The complete view allows you to see the log as it was saved, in chronological order, by the monitor. The first log entry will be at the top, proceeding time-wise to the last log entry listed at the bottom.
Note: DTU Users can view .bin.gz files (compressed Monitor files from the DTU) using the View -> Log Data -> Complete menu option.
Figure 7.3 The Complete Data Log File

26
8 8. VIEWING DATA IN REAL TIME
The MLP can show you a picture of your system as it is working and collecting data in real time. This feature, called Live Data Display is especially useful during initial installation and testing, or for troubleshooting your system. A typical use for Live Data Display would be for checking a sensor’s calibration by comparing its current reading against the corresponding cockpit instrument’s current reading. Or for checking to see if a sensor channel has been faulted by the system. (Faulted sensors are flagged during live data display with a reading of 9999.999).
CUSTOMER CHECKLIST Refer to the checklist “View Live Data”, CUST-T-004-1, under the “Support” tab in TurbineTracker™.

27
Figure 8.1 Choose a filename for the Live Data Log.
Figure 8.2 Switch the Run/Configure switch to RUN.
Figure 8.3 Click Stop Live Data when finished.
To View Live Data
1. Establish communication between the MLP computer and your monitor. Verify communication by performing an MLU Status command or click the icon.
2. Click Live Data. 3. Select Text View from the dropdown
menu. 4. Enter a filename for the live data display
log file (Figure 8.1). The file must have a .tab extension.
5. Click Save. 6. The MLP will communicate with the
monitor and determine its current configuration.
7. When asked to, switch the Run/Configure
switch on the Communication Cable to RUN (Figure 8.2).
8. When finished viewing live data, click the
Stop Live Data button near the top of the MLP screen (Figure 8.3).
9. When asked to, switch the Run/Configure
switch back to CONF. A “Live Data Display Processing is Complete” message will appear on the status line of the screen. You may open and view a .tab Live data file in Microsoft Excel™ if desired, where you can graph the data. Data is updated once a second in Live Data mode. VIEWING TIP
Viewing Live Data Files: You can view .tab files with Microsoft Excel™.

28
9 9. SPECIAL VIEWS
The graphing function presents displays of up to four graphs at a time of up to 9 sensors each. Features include zooming and scale setting, and the collected information is saved as a .tab file. The large text view presents characters big enough to read quickly at a glance, view at a distance, or read in dim light. It is especially helpful during in-flight testing, or in the hangar when viewing your MLP laptop from a remote sensor location.

Special Views
29
Figure 9.1 The Live Data Graphing Setup Window.
To View Graphed Live Data 1. Establish communication between the
MLP computer and your monitor. Verify communication by performing an MLU Status command or click the icon.
2. Click Live Data. 3. Select Graph View from the dropdown
menu or click the icon. 4. Enter a filename for the live data display
Log file. The file must have a .tab extension.
5. Click Save. 6. The MLP will communicate with the
monitor and determine its current configuration.
7. Select a signal to add from the dropdown
list and a graph to place it on using one of the four radio buttons (Figure 9.1). Click ‘Add Sensor’ to place that signal on the graph. You can simultaneously view up to four graphs.
8. The graph and sensor will show up in the
display window on the left of the screen. 9. You can add more sensors by choosing
them and clicking the ‘Add Sensor’ for each. To remove a sensor from the graph, highlight the sensor in the display window on the left and click ‘Delete Sensor’.
10. If you want to specify a graph’s range, use
the scaling function at the bottom of the window to specify minimum and maximum values.
11. When asked to, switch the Run/Configure
GRAPHING TIP If you display multiple sensors on a single graph, the sensor with the largest range of readings will force the graph scale to accommodate it. If other sensors have a relatively small range, they will appear as flat lines on such a large-scale graph. To display small range sensors more clearly, move them to their own graph. You can plot up to 4 graphs

Special Views
30
Figure 9.2 A graphed view of multiple sensors.
Figure 9.3 Set the graph scale.
Figure 9.4 Set the zoom level. The new graph will be displayed.
switch on the Communication Cable to RUN.
12. Click OK. Your graphs will be displayed.
(Figure 9.2) If you have listed more than one sensor in a single graph, each sensor will be displayed in a different color.
13. During the graphing session, you can
change the scale of the graphs manually. Click the Scaling button near the top of the MLP window. Check the box for the desired graph and enter your settings in the scaling window (Figure 9.3). Then click OK. Your graphs will be plotted against the new scale.
14. You can also zoom in on a graph by
selecting a zoom ratio with the arrows in the upper right corner of the screen (Figure 9.4). The solid vertical lines on the graph represent one minute while the dashed lines represent 15 seconds.
15. When finished viewing your graphs, click
the Stop Live Data button near the top of the MLP screen.
16. When asked to, switch the Run/Configure
switch back to CONF. A “Live Data Display Processing is Complete” message will appear on the status line of the screen. To View Live Data with Large Text

Special Views
31
Figure 9.5 A large text data display.
1. Establish communication between the
MLP computer and your monitor. Verify communication by performing an MLU Status command or click on the icon.
2. Click Live Data.
3. Select Large Text View from the dropdown menu.
4. Enter a filename for the live data display log file. The file must have a .tab extension.
5. Click Save.
6. The MLP will communicate with the monitor and determine its current configuration.
7. When asked to, switch the Run/Configure switch on the communication cable to RUN.
8. Data will be displayed in the large text format (Figure 9.5). You can choose to display two different sensors types in the window. For twin engine applications you can display the engine one and engine two readings for a single sensor type.
9. To change the sensors displayed, click the dropdown arrows and select the desired channel. To change the number of decimal places displayed, enter it in the lower right portion of the window (between 1&4).
10. When asked to, switch the Run/Configure switch back to CONF.
When finished viewing your graphs, click the Done button in the upper right corner of the window.
SYNC SCROLL OPTION The Sync Scroll allows you to change both sensors displayed by selecting a different sensor in either drop-down list. This is useful for twin engine applications where sensors 0-15 are engine one and sensors 16-31 are engine two sensors.

32
10 10. CUSTOMIZING YOUR MLP SETTINGS
!
While most users will want to set up their system using MLP’s automatic features and default settings, the program has several manual functions with which you can alter individual program settings. You can change the date format for display purposes, set the time and date, set the monitor system type, and communication parameters individually. Changing these permanently will require saving a new .mlu settings file. You can also change MLP program options such as your company name, the number of days to retain history files, and allow for connection to a DTU. These features should only be used by experienced, knowledgeable users. MLP has been designed such that you should not be required to use most of these following features.

Configuring Your System Manually
33
Figure 10.1 Choose the monitor type and click OK.
Figure 10.2 Choose the date format and click OK.
Figure 10.3 Choose the communication parameters and click OK.
To Change the Monitor Type
1. Click Edit. 2. Select MLU Type from the dropdown
menu. 3. Choose a new monitor type from the list
(Figure 10.1). 4. Click OK and save the altered .mlu file if
you want to keep the changes. To Change the Date Format of MLP 1. Click Edit. 2. Select Date Format from the dropdown
menu. 3. Choose the format from the list (Figure
10.2). 4. Click OK and save the altered .mlu file if
you want to keep the changes. To Change the Communication Settings
1. Click Edit. 2. Select Communication Port from the
dropdown menu. 3. Select Manual from the dropdown menu. 4. Choose new communication parameters
from the table (Figure 10.3). 5. Click OK and save the altered .mlu file if
you want to keep the changes.

34
Expert
Expert functions are beyond the scope of this manual and recommended only to be used by the advanced user under direction of Altair Avionics Corporation.
Figure 10.4 Enter the option information and click OK.
To Change the MLP Options Information 1. Click Edit. 2. Select Options from the dropdown menu
(Figure 10.4). 3. Enter any changed option information. 4. Click OK and save the altered .mlu file if
you want to keep the changes.
OPTIONS You should enter your company name, if applicable and you can change the history file save period. The time variance sets the allowable difference between your monitor’s clock and the MLP before issuing a warning. Max ASCII upload time should usually stay at about 300 seconds. Don’t check the ‘Allow calibration of all sensors’ box unless specifically instructed to by Altair Support. You should normally only calibrate the sensors specifically called for in your manual and allowed in MLP by default. Select the ‘DTU Connect’ box only if you are interfacing to your monitor through an Altair DTU.

35
11 11. TROUBLESHOOTING MLP
This chapter covers methods used to solve problems with operation of MLP. Communication problems are the most frequent type encountered by new users. They are easy to solve if you just look for the three basic requirements: a properly powered up and functioning monitor system, a correct physical connection, and correct settings (.mlu file). A test connection procedure covered in this chapter will help you to establish the cause by eliminating in turn each of the potential blocks to monitor communication. To examine a configuration file you can view the file with MLP using the steps provided in this chapter. Other problems frequently encountered are caused by incorrect user settings and procedures during calibration or configuration. These result in what are sometimes mistaken for hardware problems. To locate and resolve these setup issues you can use MLP’s session history files to review the user sessions and input. Session history files and views are described in this chapter. Finally, system errors, error messages, and action required are presented in Appendix A.
CUSTOMER CHECKLIST
Refer to the checklist “MLP Troubleshooting”, CUST-T-016-1, under the “Support” tab in TurbineTracker™.
Troubleshooting MLP
36
To Troubleshoot Communication Problems
1. Ensure that your monitoring system is correctly connected to power For systems that have three power connections, this means that any fuses must be intact, that any system breakers and the master battery switch are set to on, and that a battery is present and connected in the aircraft. Note: Use of an auxiliary power unit during ground tests without the battery connected may not be adequate as it may not tie in at the proper feed location to supply the battery power circuit of some Altair monitors. The aircraft battery must be present and connected for these monitors to power up properly.
2. Check that your monitoring system
indicates the proper power up display sequence according to your Installation Manual.
3. Ensure that the communication cable is
correctly connected to the monitor and laptop MLP computer. Ensure that it is plugged into the correct laptop serial port connector, and that the port is configured properly. Ensure that there are no bent pins in the connectors.
4. Set the Run/Configure switch to CONF. 5. Ensure that your monitor’s cockpit display
lamp (if present) is indicating configuration mode according to your Installation Manual (usually solid on).
6. Click Edit in MLP.

Troubleshooting MLP
37
7. Choose Communication Port from the dropdown list.
8. Choose Autodetect from the dropdown list. 9. The MLP will communicate with the
monitor and determine the correct configuration.
10. Save the configuration file under the
default name. 11. Click MLU. 12. Click MLU Status. You should see a display of the monitor’s status. This indicates correct communication between the monitor and MLP computer. As a further check of your connection, you should be able to open live data display at this point and observe the current monitor sensor readings. If during any of the steps listed here you cannot proceed to the next step, check for error messages and compare them with those shown in Appendix A. Use the step that fails to determine at what particular point communication isn’t initializing to pinpoint the cause and correct the problem.

Troubleshooting MLP
38
Figure 11.1 Choose the configuration file.
Figure 11.2 The configuration report.
To View a Configuration File 1. In MLP, Click View. 2. Select Configuration Report. 3. Choose the configuration file (.cfg) you
want to view (Figure 11.1) The configuration report will be listed (Figure 11.2).

Troubleshooting MLP
39
Figure 11.3 Enter the filter type desired and click OK.
Figure 11.4 The session history log.
To View MLP Session History 1. In MLP, Click View. 2. Select Session Log. A session log keeps
track of all of the activities performed by MLP, the user, and the monitor. It also tracks the commands and responses in communicating with the monitor.
MLP automatically defaults to work with the current open MLP session. To view a different MLP session, click the browse button in the upper right corner of the options window and select the session history file (.hst) that you want to see.
3. To view the entire current MLP session
history, choose the Select All filter from the options window and click OK (Figure 11.3). To view a list of the user actions in the current MLP session, choose the User Actions filter from the options window and click OK. To view system activity after one particular user action in the current MLP session:
a.) Choose Action Group filter from the options window.
b.) Click the down arrow at the right of the field entry space and select a user action group to view.
c.) Click OK. To view a list of the errors in the current MLP session, choose Errors from the options window and click OK.
4. The session history will be displayed (Figure 11.4).
SESSION LOGS AND USER ACTION GROUPS
In a session log view, a user action group is a list of all of the activities that occur in the system as a result of your performing a single action in MLP. Each user action is prefaced by a “---“. System activity is prefaced by a “-v-” or a “>>>”. Each detected error is prefaced by a “***”. An action group includes everything after single user action, and before the next user action (graphically, between one “---“ and the next “---“). There may be several lines of system activity (-v- or blank), or an error (***) between them. Action groups make it easier to find information of interest in a long history session. First view the list of user actions available, and then view the specific action group you want to see in detail.

40
A APPENDIX A
Table of Errors and Messages
Error or Message Possible Causes Action to take
‘Configuration file loaded w/ errors’ message
Checksum test failed after file transfer. –or- Invalid Configuration (.cfg) file.
Retry loading the Configuration File
‘Unable to verify that log is reset’ message
Communication interrupted.
Retrieve the log data
‘.dll file error’ message
Mismatched Windows™ system .dll files.
Write down error circumstance and contact Altair Avionics.
‘Must retrieve the log’ message
The log must be cleared prior to calibration, configuration, or setting the clock.
Retrieve, save, and clear the log before performing calibration, configuration, or setting the clock.

Appendix B
41
Table of Errors and Messages, cont’d.
Error or Message Cause Action to take Sensor displays 9999.999
Sensor values do not match predetermined normal profile. Sensor is faulted by system yielding a 9999.999 flag value.
Troubleshoot monitor’s sensor channel using steps in your Instructions For Continued Airworthiness manual.
During calibration, MLP will not accept a calibration value entry
One of MLP’s entry validation tests indicates that the user input is likely to be an error. -or- User attempted to enter a one point slope value for OAT in a Generation II monitor
See the table and find the test that is failing. Re-calibrate using acceptable entry values. Generation II monitors must use the One Point Offset or Two Point Calibration method for OAT calibration.

42
User Entry Requirements for CALIBRATION (Input Validation)
Note: For Generation II (G2) processors, OAT can no longer be calibrated by the One Point Slope method.

43
B APPENDIX B Installing MLP Onto Your PDA
SCOPE AND INTRODUCTION The purpose of this Appendix is to describe how to install MLP (Monitor Link
Program) onto a PDA (Personal Digital Assistant) and to connect it to an Altair Avionics Corporation EMS (Engine Monitoring System). The PDA shall interface to Altair Avionics Monitors through a hardwire connection allowing the user to configure and calibrate the EMS, and download engine data. Engine data may then be transferred to TurbineTrackerTM via the PDA cradle connection to a PC or Laptop.
When future software updates are available the PDA will support multiple
communication modes to allow data and control information transfer to TurbineTrackerTM. These may include one or multiple interfaces of, hardwired, removable media, WLAN and cellular.
1) INSTALL ACTIVESYNC™ SOFTWARE Following the instructions provided by the PDA vendor, install ActiveSync™ onto
your PC or Laptop Computer. During installation of the ActiveSync™ software, you will be prompted to connect the PDA Docking Station to your computer using either the serial cable or the USB cable (Figure 1B). Use the USB cable indicated in Figure 2B.
Figure 1-1B - ActiveSync Install

44
Figure 1-2B - USB Cable Once the USB cable is connected to your computer put the PDA into the docking station and continue with the installation of the software.
2) COPY MLP SOFTWARE TO PC a) Retrieve “PDA_MLP_6.6.EXE” directly from the Altair Avionics Corporation.
b) Open ActiveSync. The status of the iPAQ should be “connected” as indicated below.
Figure 2-1B Connected Status

45
Figure 2-2B Explore Menu
c) Click on “File/Explore” d) Open the “My Pocket PC” folder
e) Open the “Windows” folder
f) Open the “Start Menu” folder
g) Open the “Programs” folder
Figure 2-3B Programs Folder
h) Copy the “PDA_MLP_6.6.EXE” file (from the location of step a) to the “My Pocket PC/Windows/Start Menu/Programs” folder.
3) CONNECT THE PDA TO THE ENGINE MONITOR (REFER TO FIGURE 6B)
a) Connect the Download cable (A) provided with the Altair System to either side of the Male-Male Null Modem Adapter (B).
b) Connect Adapter (B) to the Serial cable (C) provided with your PDA.

46
Figure 3-1B – Cables
4) RUNNING MLP
a) Turn on PDA
b) On PDA, click on “Start”
c) Click on “Programs”
(B) Adapter
(A) Download
cable
(C) PDA Serial
Cable

47
Table 1B Menu Options
d) Click on the MLP program, MLP with a simplified menu structure with only 2 menu options (Synchronize and Tools) will open. See Figure 7B
Figure 4-1B - Simplified Menu Under ‘Synchronize’, the only option is ‘Aircraft’. Under ‘Tools’ most of the other options available in PC based MLP is available. See Table 1B
Synchronize Tools
Aircraft MLU --> Unit Options --> New
Open
Save
Save As
Configure Unit
Retrieve Unit's Data Log
Sensor Calibration
Date/Time Synchronize
MLU Status
Synchronize --> TurbineTracker™
Edit --> MLU Type
Date Format
Communication Port --> Autodetect
Manual
User Account
Flash Storage Info
Options
View --> MLU Installation
Session Log
Data Log File
Configuration Report
Live Data --> Text View
Text View Large
Graph View
Expert --> Expert Command Mode
Manual Sensor Calibration
FTP Address Change
Persistent Cycles
Generate Config File
Help --> About MLP
Contact Info

48
Figure 4-2B - Storage path
NOTE: The first time you open MLP it will prompt the user to enter the path to the
storage flash. This path is stored in the registry for future usage. If the user wishes to change the path, the user can go to Tools -> Edit -> Flash Storage Info and change the path. See Figure 8B
5) FEATURES
MLP on the PDA operates the same as MLP on a laptop with a few exceptions (see below). Refer to the MLP Manual for detailed operating instructions. LOG RETREIVAL MLP now checks for available storage space both in the RAM and in the flash and warns the user if sufficient space is not available, then it aborts data retrieval allowing the user to free up more storage space. See Figure 9B Note: If the user can not free-up the required amount of PDA memory the only other option is to use MLP on a laptop for log retrieval.

49
Figure 5-1B - Low Memory Warning At the end of the data retrieval process the MLP automatically displays in text form the lamp status to alert the user of any events, faults or system conditions that might have caused the lamps to go on. See Figure 10B
Figure 5-2B - Lamp on conditions Data from G3 units with version 3.2 and higher software will be retrieved and stored only in binary format. This saves a lot of storage memory space. Data from G3 units with versions older than 3.2 will still be retrieved in binary format but stored in ASCII format and hence could consume a lot of storage memory space.

50
Functions Not Available on PDA (Organized by MLP Operation)
• File/Print
• Edit/Copy Display
• Edit/Cut Display
• View Session Log
• View/Tool Bar
• Expert/File Operations – none of these operations are available
• Expert/Connect to MLU
• Expert/Disconnect from MLU
6. MLP USER INTERFACE Table 1B illustrates the MLP Menu options on the PDA.
For assistance, please contact Altair Customer Support at 781-762-8600 x113.
7.PDA SYSTEM REQUIREMENTS The following Table 2B lists the required and optional components of the Altair
Avionics Corp supported PDA. In addition to this supported hardware, MLP-PDA software Version 6.6 or greater is required. The optional equipment lists alternative interface methods to access TurbineTrackerTM and expanded memory for local PDA data storage.
Table 2B System Requirements
Required Optional Equipment Vendor Model Part Number Vendor Description Part
Number PDA HP iPAQ hx2100 FA296A USB/Serial Cable
HP USB/Serial Cable
FA122A#AC3
SD Memory HP Removable 128Mbyte SD Memory card
FA135A#AC3
Extended Service
HP 3yr Extended Service
U4998A
56K Modem HP Compact Flash 56K baud Modem
FA132A#ABA
WLAN Linksys CF Type I IEEE802.11B
WCF12
Protective Cover
User preferred

51
C
APPENDIX C
Installing USB Drivers on Your Computer
USB Download Cable Adapter Driver Installation Note: There are two stages to installing the USB adapter on your PC. • First, the USB Converter will be installed. • Second, the Communications Port will be installed. The installation is not complete until both pieces are in place on your computer! • Start by downloading the <ADAS-C-053 USB.exe> file from TurbineTracker™ and save to the desktop folder on your computer. This compressed file contains the required drivers. NOTE: The Drivers are available free of charge for TurbineTracker™ users under the Support Tab by selecting “System Updates” and following the on screen instructions. • Double click on the file to extract the contents to c:\mlp\bin\usb\. Click on “Unzip”, and then click “OK” when the files are done extracting. Click on “Close” to close the window. • Insert the USB cable into your PC’s USB port. The computer should detect the hardware automatically. This first step will install the USB Converter on your PC. • The “Found New Hardware Wizard” screen will pop up on your computer. Select “Install from a list or specific location (advanced)” in the wizard and then
52
select “Next”. • Select “Include this location in the search” and also de-select “Search removable media”. Browse to c:\mlp\bin\usb and click OK, then click “Next”. • Click “Finish” to close the wizard after it completes. • The Wizard re-appears to install the driver for the communications port itself. Select “Install from a list or specific location (advanced)” in the wizard and then select “Next”. • Make sure that the selections are the same as those you made when installing the USB driver. If they are not, repeat those steps from above, and then click “Next”. • Click “Finish” to close the wizard after it completes. You have now installed the USB driver and the new communications port on your PC/Laptop. The port will be a high number (typically greater than 10), however MLP will auto-detect this port when you run MLP and follow the standard procedure for connecting to your monitor, as described in the MLP Manual.
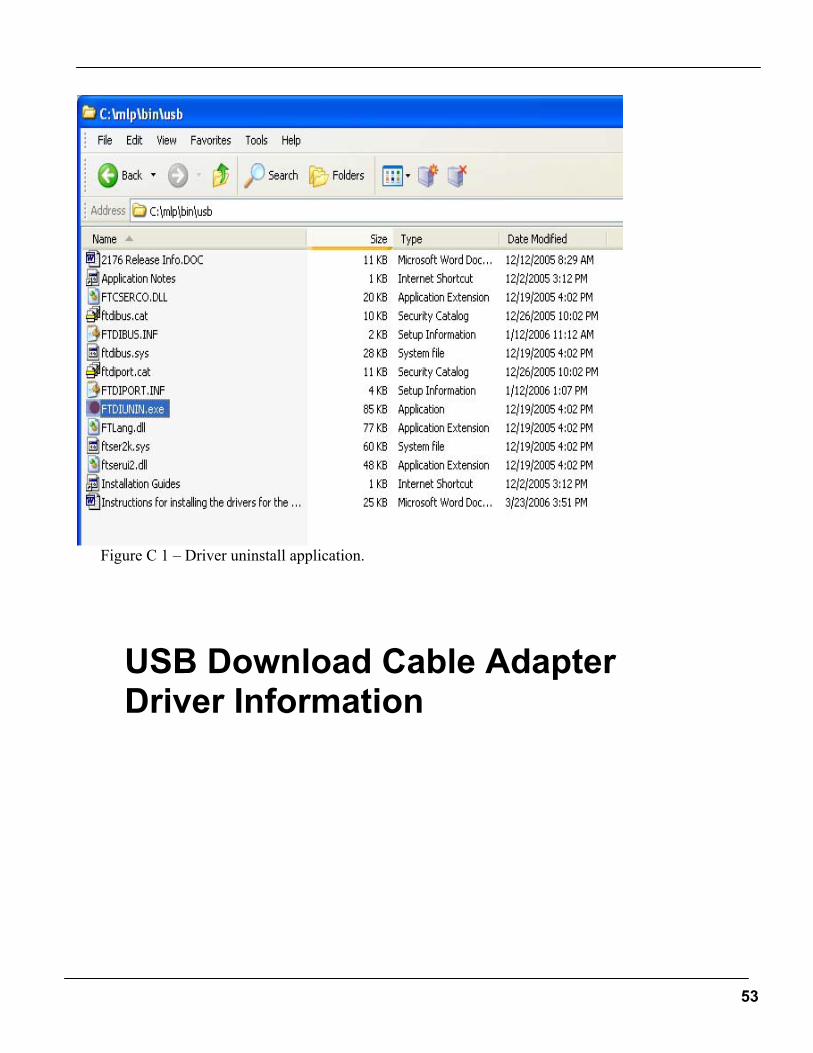
Uninstall the Altair USB Download Cable Adapter Drivers
Users have the option to remove the Download Cables Drivers automatically by using the vendors uninstall application FTDIUNIN.exe. The application is included with the driver download and stored in the in the MLP directory (C:\mlp\bin\usb) See Figure C1. Run the application and follow the on screen instructions.
53
Figure C 1 – Driver uninstall application.
USB Download Cable Adapter Driver Information

54
INDEX .
.dll file, 37
.log file, 17, 19
.mlu file, 5, 9, 29, 30, 31, 32
.tab file, 24, 25, 26
A
Altair Avionics address, 3 customer support, 4 website, 3
autodetect, 5, 33
C
calibrate, 3, 5, 8, 9, 12, 13, 40 all sensors, checkbox, 31
calibration, 3, 9, 12 aircraft requirements, 12 by cockpit instruments, 12, 13,
23 by test equipment, 12, 13 example, 13 information, configuration file,
12 one point offset, 13 one point slope, 13 set point, 13 troubleshooting, 32 two point, 13
clock setting, 9, 17
communication cable, 5, 9, 24, 26, 33 port, 3, 5, 30, 33 settings, 30 speed, 2, 5, 9
configuration file, 8, 9, 12, 13, 18, 19, 32, 33, 35 download, 9 version, 13 view, 35
D
data analysis, MLP, 21 analysis, TurbineTracker, 21 graph with Excel(TM), 24
graph with MLP, 26 log, 16, 17, 18, 19, 24 retrieve, 3, 9, 16, 17, 19 transfer with PDA, 40 uploading, 18 view, 3, 19, 21, 22, 24, 33 view large text, 26
date format, 29, 30 set, 5, 9
download configuration file, 9 MLP, 4, 5
E
error message, 9, 32, 33, 37 errors
MLP Session, 36
F
faulted by system, 38
G
graph view, 25
H
history files, 26, 29, 32, 36
I
installation, 4, 5, 9, 13, 23
L
large text view, 25, 26 Live Data Display, 23, 24
M
MLU Status, 9, 13, 17, 19, 24, 26, 33
monitor type, 2, 5, 19, 30
O
options history file, 36 MLP, 29, 31 MLP for PDA, 44
P
PDA, 40 connecting to computer, 41 connecting to monitor, 42 functions not available, 43 Installing MLP, 40 interface to monitor, 40 MLP, 41, 42, 43 system requirements, 44
R
Run/Configure switch, 5, 9, 24, 26, 33
S
sensor faulted, 23, 38 value
9999.999, 23, 38 session history, 26, 29, 32, 36 settings
communication, 5, 30 date format, 30 graph view, 26 monitor type, 8, 9, 19, 29, 30,
32
T
troubleshooting, 3, 5, 16, 18, 23, 26, 32, 33, 35, 36
TurbineTracker, 3, 4, 5, 8, 9, 13, 16, 17, 18, 19, 21, 40, 41, 44 manual, 8, 9 website, 3, 4, 9, 41
V
validation user, 39
view data log file, 16, 21, 22 graph, 25, 26 large text, 26 live data, 3, 24, 26, 33 Live Data, 23, 24 session history, 26, 36