alpha foundation for the improvement of mine safety … · 2020. 6. 7. · alpha foundation for the...
TRANSCRIPT
ALPHA FOUNDATION FOR THE IMPROVEMENT OF MINE SAFETY AND HEALTH
Final Technical Report
1.0 Cover Page Project title: Assessing Noise Exposures, Hearing, and Risk of Injuries Among Miners Grant number and title: AFC719-20 Organization Name: Regents of the University of Michigan Principle Investigator: Richard Neitzel, PhD, CIH Contributing research staff: Lauren Smith, MPH; Abas Shkembi, BS (in progress); Elon Ullman, MS; Sandar Bregg, MS (in progress); Joshua Perez, MPH; Linyan Wang, MS; Chengyao Li, MEng. Contact Information: [email protected] 734-763-2870 Period of Performance: September 1, 2018 – May 31, 2020 Acknowledgement/Disclaimer: This study was sponsored by the Alpha Foundation for the Improvement of Mine Safety and Health, Inc. (ALPHA FOUNDATION). The views, opinions and recommendations express herein are solely those of the authors and do not imply any endorsement by the ALPHA FOUNDATION, its Directors and staff.

2
2.0 Executive Summary According to the Bureau of Labor statistics in 2018, the injury rate across all private industries was 2.8 per 100 FTE and the fatality rate was 3.5 per 100,000 FTE. Compared to all private industries, the fatality rate in the mining, quarrying, and oil and gas extraction industry was almost 400% higher and the injury rate 50% lower (https://www.bls.gov/iif/oshcfoi1.htm#rates). Many factors may play a role in injury and fatality risk and they may vary substantially by industry. Mining has been labeled one of the noisiest industries, where 76% of miners are regularly exposed to hazardous noise [1]. Noise-induced hearing loss (NIHL) is highly prevalent in mining, with a prevalence of 27% in the industry [2,3]. Mining has one of the highest rates of usage of hearing protection devices (HPDs) with a rate of over 80% [1]. HPD use is necessary to protect hearing in high noise, but can hinder a worker’s ability to communicate and hear directions and warning sounds and therefore may impact occupational nonfatal and fatal injury risk. NIHL may have a similar impact. Uniquely among industries, mining combines high noise exposure, high NIHL prevalence, high HPD use, and high fatality risk; therefore, it is important to understand how these characteristics interact and impact one another in mining in order to develop specific and contextually appropriate interventions. To assess the role that noise exposure, NIHL, and HPD use have on nonfatal and fatal injury rates among miners we explored two specific aims. The first specific aim involved a retrospective analysis of injury and fatality rates among mines nation-wide and their association over time with noise exposure by Standard Industrial Classification (SIC) codes and Standard Occupational Classification (SOC) codes. Noise measurements from the research team’s national quantitative Job Exposure Matrix (JEM) for noise (http://noisejem.sph.umich.edu/) were integrated with MSHA accident, injury, and fatality datasets (https://www.cdc.gov/niosh/mining/data/default.html) to test these relationships. The second specific aim was a prospective study that involved field visits to ten surface mines (e.g., lime, limestone, and sand/silica) in three Midwestern states to investigate the role of noise exposure, NIHL, and HPD use on reported and historical accidents, near-misses, and injuries in a current population. The results of our national-level specific aim 1 activities indicated that occupational noise exposures were significantly associated with increased risk of nonfatal injuries in US mines, controlling for year, industry (via SIC code), and broad mine type (e.g., coal, metal, and nonmetal). Occupational noise exposures were also significantly associated with increased risk of fatal injury in US mines in a model controlling for year and mine type, as well as in a separate model controlling for year and occupation (via SOC code). The results of our efforts related to specific aim 2 indicated that miners at the ten participating Midwest mining sites had high rates of hearing loss and HPD use, and high

3
exposures to occupational noise. The vast majority of miners reported using earplugs, all workers achieved sufficient attenuation given their full-shift noise exposures, and most workers were overprotected (i.e., had personal attenuation ratings [PARs] in excess of what was required to reduce them below the relevant exposure limit). Reports of injuries and near-misses were rare within the past year, but nearly half of all workers had been injured during their career. While we developed a number of novel noise metrics, none were determined to be significantly associated with injury risk. We observed interactive effects of hearing loss and HPD use on achieved PAR, where workers with tinnitus and no hearing loss had significantly higher PARs, and workers with tinnitus and hearing loss had significantly lower PARs. We also found that age and speech reception threshold were significant factors for increased risk of hearing loss, and PAR was a significant protective factor for hearing loss. We identified a 3-way interaction of noise, hearing loss, and HPD use on near miss risk, where workers with no hearing loss, workshift noise >85 dBA, and reported use of HPDs had a significantly increased risk of reporting a work injury in the past year; Fatigue Severity Score, previous serious work injury, and safety perception were also associated with significantly higher risk of near miss in the past year. Finally, we identified an interactive effect between hearing loss and HPD use, wherein workers with no hearing loss and reported use of HPDs had a significantly increased risk of work injury in the past year; Fatigue Severity Score, previous serious injury at work, and safety perception were again associated with a significantly increased risk of work injury in the past year. Together these results suggest that noise may be a significant independent risk factor for nonfatal and fatal occupational injuries when considered in conjunction with occupation, industry, and year, but that after controlling for use of HPDs, hearing status, fatigue, sleepiness, work experience, and perceived stress, the independent risk of noise on nonfatal injuries is no longer significant. The results also highlight the importance of ensuring that workers receive appropriate attenuation from their HPDs for their experienced noise exposure, and that this attenuation needs to be considered in light of their hearing status. We have already begun dissemination of these results through conference presentations and manuscript preparation. We anticipate that our findings may have a large impact on hearing conservation and injury prevention programs in the mining industry, as they highlight the need to tailor HPD use to specific worker characteristics, including hearing ability and tinnitus, in order to reduce near-miss and injury risk.

4
2.1 Lay language summary Workers in the mining industry face high rates of fatal injuries, high exposures to noise, and high rates of noise-induced hearing loss. They also have high rates of use of hearing protection devices (i.e., earplugs or earmuffs). Use of hearing protection is necessary to protect hearing in high noise, but can hinder a worker’s ability to communicate and hear directions and warning sounds, and therefore may impact occupational nonfatal and fatal injury risk. Noise-induced hearing loss may have a similar impact. The aim of this study was to understand how noise exposure, noise-induced hearing loss, and use of hearing protection might influence the risk of workplace injuries among mining workers. To achieve this goal, we used two different approaches. First, we used publicly-available information from the Mine Safety and Health Administration (MSHA), the National Institute for Occupational Safety and Health, the Bureau of Labor Statistics, and a national Job Exposure Matrix for noise to explore the effects of noise on fatal and nonfatal workplace injuries among all US miners between 1983 and 2018. Second, we completed field visits to ten surface mines in three Midwestern states in 2019 to investigate the role of noise exposure, noise-induced hearing loss, and hearing protector use on reported and historical accidents, near-misses, and injuries. The results of our first research approach using publicly-available data showed that workplace noise was associated with increased risk of nonfatal injuries in US mines, accounting for calendar year, mining industry, and mine type (e.g., coal, metal, and nonmetal). Workplace noise was also associated with increased risk of fatal injury, accounting for year, mine type, and occupation. The results of our second research approach, using data collected from ten Midwestern mines, found that workers with tinnitus (ringing or buzzing in their ears) and no hearing loss received substantially more protection from their hearing protectors, and workers with tinnitus and hearing loss received substantially less protection. Workers with no hearing loss, noise exposures higher than the recommended 8-hour limit of 85 dBA, and who used hearing protectors had a substantially higher risk of reporting a work injury in the past year. Fatigue, having experienced an injury previously, and perceptions of safety on the job were also associated with substantially higher risk of almost experiencing an accident or injury in the past year. The results of our study suggest that noise may be a significant risk factor for nonfatal and fatal occupational injuries, but that the risk of injury associated with noise is modified by use of hearing protection, hearing ability, fatigue, sleepiness, work experience, and perceived stress. The results also highlight the importance of ensuring that workers receive appropriate protection from their hearing protectors, and that the workers’ hearing ability needs to be considered when assigning them hearing protection.
5
2.2 Glossary of terms
Abbreviation Term Definition
AI Accident/illness/injury Abbreviation for the accident, illness, and injury
datasets compiled by NIOSH
(https://www.cdc.gov/niosh/mining/data/default.html)
and used for Specific Aim 1 to determine annual injury
and fatality counts among mines
AIC Akaike information
criteria
Estimator of relative quality of statistical models for a
given set of data. Lower numbers represent better
model fit.
AL Action level Generally, an exposure level associated with a health
or physical hazard. Specifically defined by MSHA and
thus regulated as an 8-hour shift average of 85 dBA or
greater that prompts the requirements for inclusion in
a Hearing Conservation Program among regulated
industries.
BLS Bureau of Labor
Statistics
A unit inside of the US Department of Labor and the
primary agency to report on labor economics and
statistics which was a resource for Specific Aim 1.
BMI Body mass index A measure of body fat based on height and weight
(lbs/in2).
CFOI Census of Fatal
Occupational Injuries
Annual reports developed by the BLS with data
collected through the administration of the survey of
Occupational Injuries and Illnesses (SOII). The report is
generated by many different groupings and published
on their website
(https://www.bls.gov/iif/oshcfoi1.htm) and was used
as a reference for Specific Aim 1.
CI Confidence interval The range of plausible values that applies to the
associated effect estimate (OR, IR, IRR, etc.) and the
confidence of 95% that the true effect lies within that
range.
dB decibels The logarithmic presentation of measured sound
pressure.
6
Abbreviation Term Definition
dBA A-weighted decibels The logarithmic presentation of measured sound
pressure weighted to mimic how different frequencies
are perceived by the human ear.
DI Dispersion index A measure of how varied the predicted probability is by
different groupings (or within categorical variables) in a
model.
ESS Epworth Sleepiness
Scale
A standardized scale to assess excessive daytime
sleepiness.
FTE Full time equivalent The hours worked by one employee who is considered
to be working full-time. For example, an annual FTE is
considered to be 2,080 hours for 8 hours per day 5
days per week.
FSS Fatigue Severity Scale Standardized questionnaire used to evaluate fatigue
differentially from clinical depression.
HL Hearing loss Generally, an increase in the hearing threshold level at
any frequency compared to sometime prior. Mild
hearing loss is generally recognized to be present when
hearing threshold levels are ≥25 dB.
HPD Hearing protection
device
Personal protective equipment used to protect one’s
ears from noise exposure. They come in a variety of
types but can be generally categorized as earplugs
(e.g., foam or pre-molded) and earmuffs.
HTL Hearing threshold
level
The dB level at which one can hear a given frequency
of noise. Typically determined by an Audiogram.
ID Identifier Specific number given to a mine to uniquely identify it.
IR Incident rate The rate at which an occurrence happens over a given
unit, often time.
IRR Incident rate ratio The relative rate at which an occurrence happens over
a given unit.
IQR Interquartile range A statistical measure of spread of a distribution. More
specifically, the difference between the maximum and
minimum values of the middle 50% of data.
7
Abbreviation Term Definition
JEM Job Exposure Matrix A collected set of data that estimates exposures for
various job titles. Useful in research where measured
noise is not obtainable.
JSS Job Safety Score The job safety section of the work safety scale used to
evaluate various aspects of overall perceived work
safety.
kHz Kilohertz A measure of the frequency of sound.
LL Lower limit The lower end of the confidence interval at 5%.
LAVG Average noise level The average sound level measured over time using a 5
dB time-intensity exchange rate. For this study, LAVG
was measured according to the MSHA Permissible
Exposure Limit (PEL), with a 5 dB exchange rate, a
threshold of 80 dBA, a criterion level of 90 dBA, slow
response time, an upper limit of 140 dBA, and an
allowable dose of 50%. This was used to determine the
TWAMSHA.
LEQ Equivalent noise level The average sound level measured over time using a 3
dB time-intensity exchange rate. For this study, LAVG
was measured according to the NIOSH Recommended
Exposure Limit (REL), with a 3 dB exchange rate, a
threshold of 80 dBA, a criterion level of 85 dBA, slow
response time, an upper limit of 140 dBA, and an
allowable dose of 100%. This was used to determine
the TWANIOSH.
MDRS MSHA Mine Data
Retrieval System
Data system managed by MSHA that contains various
items of mine related data, https://www.msha.gov/mine-
data-retrieval-system.
MSHA Mine Safety and
Health Administration
Agency of the US Department of Labor that administers
the Federal Mine Safety and Health Act of 1977 (Mine
Act).
MV Mines visited This represents the historical data from the 10
Midwestern mines that were also visited for the
prospective study in Specific Aim 2
N Number The number of observations used in each model.

8
Abbreviation Term Definition
NASA TLX National Aeronautics
and Space
Administration task
load index
A scale developed by NASA to quantify perceived
workload.
NFDL Nonfatal day lost Nonfatal occupational injuries reported to MSHA that
resulted in the loss of at least one day from the
employee’s scheduled work.
NIHL Noise induced hearing
loss
Generally, an increase in the hearing threshold level at
any frequency of noise exposure compared to
sometime prior. Specifically for this report, an average
hearing threshold level ≥25 dB among the high
frequency noise levels as measured by Fitcheck and/or
an App based audiogram.
NIOSH National Institute of
Occupational Safety
and Health
A non-regulatory agency within the US Centers for
Disease Control and Prevention focused on research
and recommendations for the prevention of work-
related injuries and illnesses.
NM Near miss A self-reported incident in the last year that could have
under slightly different circumstances resulted in injury
ranging from mild to severe or even fatal.
NR Not reported A metric not reported by participants.
OR Odds ratio Measure of association between exposure and
outcome in logistic regression.
PAR Personal attenuation
rating
The real-world individual measure of earplug
attenuation (i.e., fit) using the Fitcheck Solo system.
PEL Permissible Exposure
Limit
Generally, a level exposure to a health or physical
hazard that legally cannot be exceeded. Specifically
defined by MSHA and thus regulated as an 8-hour shift
average of 90 dBA or greater. Exposure must be
reduced to at or below that level.
PSS Perceived Stress Scale A standardized scale used to quantify typical perceived
stress over the past month.

9
Abbreviation Term Definition
REL Recommended
Exposure Limit
A non-regulatory recommendation of the level to
health or physical hazard as defined by NIOSH.
Specifically defined by NIOSH as an 8-hour shift
average of 85 dBA or greater. Exposure should be
reduced to at or below that level.
S&S Significant and
Substantial
Defined by MSHA as a violation that contributes a
hazard that is reasonably likely to result in a serious
injury or illness.
SD Standard deviation Statistical metric, often associated with a mean value
that gives a measure of the deviation from the mean
within a group.
SE Standard error A statistical measure of the accuracy of an estimate.
SIC Standard Industrial
Classification
A coding system used by federal agencies to classify
industry areas in a consistent manner.
SNR Signal to noise ratio Generally, the ratio of the desired response to the stuff
in the background. Specifically, this refers to the
speech in noise test and represents the exact ratio of
decibels of the spoken sentence to the decibels in the
background noise.
SOC Standard
Occupational
Classification
A coding system used by federal agencies to classify
occupational areas in a consistent manner.
SRT Speech recognition
threshold
Metric quantified by the speech in noise test defined as
the signal to noise ratio (SNR) where 50% of the words
are correctly repeated by the participant.
TWA Time weighted
average
The average workplace exposure to a hazard
normalized to 8 hours per day.
UL Upper limit The upper end of the confidence interval at 95%.
WI Work injury Self-reported injury in the last year. This is included
minor cuts, scrapes, and bruises.
10
3.0 Problem Statement and Objective Occupational Injuries
Fatal and non-fatal occupational injuries have a huge personal, medical, and economic burden in the US [4]. Even though fatal injuries are catastrophic, non-fatal injuries have an even greater impact when considered in terms of occurrence and cost [5]. Fatal and nonfatal occupational injuries were estimated to have an economic cost of $192 billion in 2007, greater than the economic cost of coronary heart disease ($151.6 billion), diabetes ($174 billion), or stroke ($62.7 billion) [5]. Across all private industries in 2018 the non-fatal injury rate was 2.8 per 100 FTE and the fatal injury rate was 3.5 per 100,000 FTE (https://www.bls.gov/web/osh/summ1_00.htm) and (https://www.bls.gov/news.release/pdf/cfoi.pdf). The mining, quarrying, and oil and gas extraction industry non-fatal injury rate was 1.4 per 100 FTE in 2018, lower than the all-industry rate (https://www.bls.gov/web/osh/summ1_00.htm), while the fatality rate was 14.1 per 100,000 FTE, significantly higher than the all-industry rate in 2018 (https://www.bls.gov/iif/oshcfoi1.htm#rates and https://www.bls.gov/web/osh/summ1_00.htm). The differences between non-fatal and fatal injuries in the mining industry compared to the overall private sector may indicate that unique factors impact occupational injury and/or fatality risk in the mining sector. Among miners, several injury risk factors have been identified by a handful of publications; gender, type of mine, work environment [6,7], smoking status [8], work activity [9,10], equipment used [11], and seniority [12]. Further research on occupational injury and fatality risk factors specific to the mining industry is necessary to develop targeted interventions aimed at reducing this risk. Noise exposure is common in mining Daily average noise exposures over 85 A-weighted decibels (dBA) has been shown to have auditory and non-auditory health effects, including noise induced hearing loss (NIHL) [13,14], sleep disturbance [15], hypertension [16–18], and heart disease [19–21]. In the US, mining is the industry with the highest prevalence of hazardous noise exposure, with one in four miners at risk [1]. Given the ubiquity of noise among miners and the range of negative health effects associated with this exposure, research is needed to guide future interventions in this industry. Noise exposure may be a pathway to occupational injury Studies in several industries have identified noise as a risk factor for occupational injuries [22–31] and a single study observed increased injuries among US coal miners with greater noise exposure [32]. The pathway(s) through which noise exposure effects injury risk are unclear. In other industrial settings, noise has been shown to increase stress [33], cause distraction or impede situational awareness [34,35], degrade performance [36], increase fatigue [37], and reduce the ability to hear critical sounds [38]. Two studies have associated long work hours and irregular/interrupted shifts with injury risk among miners [39,40]. Long, irregular hours likely increase fatigue, stress, and disruptions to performance and therefore may represent one
11
pathway to injury. Much about this relationship remains understudied, particularly among miners. Hearing loss may predispose to occupational injury The mining industry has the highest prevalence of NIHL of any US industry (16.7% compared to 12.9% for all industries) [3]. A large proportion of miners have impaired communication and hearing due to both noise and NIHL or other types of hearing loss (HL) [38]. Associations between HL and injuries have been seen in various industries [22–30]. This association is unclear for the mining industry; one case-control study showed no effect of HL on injury risk [41]. Further research to understand how HL impacts injury risk in mining is needed given that HL is so prevalent in this industry. Hearing protection devices (HPD) and occupational injuries The rate of HPD use among miners is more than 80%, making it the US industry with the highest use proportion [1]. Although the use of HPDs in noisy environments is necessary to prevent NIHL, HPDs by design mimic or worsen high-frequency HL, and disrupt the user’s ability to localize and understand speech [42]. This is particularly true when the noise exposure is high but not extreme and the HPD fit is good; this is referred to as “overprotection,” wherein the wearer achieves more noise attenuation than is necessary or desirable. The hearing difficulty that results from overprotection may be a pathway for injuries [23,43]. Overprotected workers have reduced ability to hear or interpret speech and warning signals [44,45], especially during communication with other workers using HPDs [46]. Workers who wear HPDs and experience either temporary or permanent audiometric threshold shifts from noise (i.e., NIHL) may be further affected because of reduced signal detection ability [47]. Given the prevalence of noise and the propensity of miners to wear HPDs, it is important to better understand whether overprotection is common and if so, how it connects to injury risk. Combined effects of noise exposure, HL, and HPD use on occupational injuries A number of studies have demonstrated elevated risk of occupational injury in groups with high noise and HL [22,27,30,31,48], or found increased injury rates [31] among workers with HL who are using HPDs compared to those using HPDs with normal hearing. Hearing-impaired workers using HPDs may be at higher risk of injury in noise due to their doubly-reduced auditory abilities [45]. Unfortunately, none of the above studies were conducted among miners, and three-way interactions between noise, HL, and HPD use have yet to be explored in any industry. Given HL in the aging US mining workforce, the more than 16% of US miners who have NIHL [2,3], and the 76% of miners exposed to high noise [1] who utilize HPDs, research on these interactions in the mining industry is critical. Therefore, the objective of our study is to evaluate the relationship between injuries and noise, HL, and HPD use among miners after adjusting for hazardous work as well as individual,

12
organizational, and psychosocial factors known to be associated with injury and fatality risk. We have illustrated our conceptual framework of these relationships in Figure 1.
To achieve this objective, our study has two specific aims and two sub-aims: Specific Aim 1: To retrospectively evaluate the risk of recordable injuries and fatalities associated with noise estimates made from a job-exposure matrix (JEM) by mine industry sector (as defined by the Standard Industrial Classification, SIC) and job title (as defined by the Standard Occupational Classification, SOC) from 1983 to current.
Sub-aim 1A: To retrospectively evaluate the risk of recordable injuries, fatalities, and Significant and Substantial (S&S) violation rates per 100 inspection hour associated with noise measurements made by the Mine Safety and Health Administration (MSHA) for a subset of mines in Michigan, Illinois, and Ohio from 2000 to current.
Specific Aim 2: To prospectively evaluate the risk of nonfatal injuries, accidents, and near misses associated with measured noise, measured and self-reported NIHL, and robust and validated measures of HPD use.
Sub-aim 2A: To explore novel noise metrics for application to injury risk assessment.
Figure 1. Conceptual framework of how hazardous work, noise exposure, organizational
influences, individual factors, and psychosocial factors impact near-miss risk and ultimately
injury risk among workers in general.

13
We proposed a number of activities to fulfill the objectives and specific aims. The methods and results of these activities are described below. 4.0 Research Approach Due to challenges experienced early during the grant period the research approach changed substantially (as outlined in previous progress reports and approved by the Alpha Foundation) and subsequently some of the specific aims changed slightly as well. 4.1 Research Approach for Specific Aim 1 Data collection
Multiple resources were utilized to compile the most comprehensive datasets possible to
address specific aim 1. We have illustrated our approaches to develop datasets focused on SIC
data, SOC data, and data for the mines visited (MV) in this study. Figure 2 shows how
compilations were performed for each objective (i.e., each arrow in the flowchart), and the
individual objectives and approaches used are described in Table 1. The detailed methods used
to compile these comprehensive datasets are described below.
To assess national injuries and fatalities, we started with the publicly-available
accident/illness/injury (AI) datasets among mines compiled by NIOSH
(https://www.cdc.gov/niosh/mining/data/default.html). This resource yielded detailed
information about each reported injury and/or fatalities for all mines, by mine ID number, in
the US from 1983 to 2018. The data also included mine type (i.e., coal, metal, and nonmetal),
mine industry (i.e., SIC), injury type and descriptive job titles. Five incident types were reported:
NA (accident, no personal injury), NDL (injury with no days lost), NFDL (Non-fatal injuries with
days lost), non-occupational fatality, and occupational fatality. We mirrored MSHA’s own
evaluation methods, and included only NFDL injuries and occupational fatalities reported
among operators (i.e., excluding contractors) in our analyses. Job title was not standardized by
any widely recognized method in this dataset; therefore, all unique job titles were manually
assigned to the most specific 2010 SOC code possible. Given that the dataset was specific for
the mining industry, any job title that was unclear or difficult to assign to a SOC code was
assigned to miscellaneous extraction workers (i.e., SOC code 47-5090). From this dataset,
annual NFDL injury and occupational fatality counts among operators were calculated by mine
ID, mine type, SIC code, and minor SOC code group.

14
In order to standardize NFDL injury and occupational fatality counts data (the only measures
available for some years), a complementary dataset with total employees or employee hours
was needed. We developed this using two separate datasets for the mine ID-level data and the
job title category data, respectively.
Figure 2. Flow-chart of data sources used to generate tables and datasets used for analysis of Aim 1.
AI - accident/illness/injury; CFOI – Census of Fatal Occupational Injuries; NFDL – nonfatal injuries
with days lost; JEM – Job Exposure Matrix; NIOSH – National Institute for Occupational Safety and
Health; MSHA – Mine Safety and Health Administration; BLS – Bureau of Labor Statistics

Table 1. Objectives and approaches to data compilation in the development of the SIC, SOC, and MV datasets
Objective Approach
SIC
dat
aset
Get annual NFDL injury and occupational
fatality counts by SIC code from 1983-
2018
Filtered NIOSH’s AI dataset for NFDL injuries and occupational fatalities only.
Generated annual counts by each mine ID. Annual counts per SIC code were also
generated.
Match annual total production hours by
SIC code to calculate NFDL injury and
occupational fatality rates from 1983-
2018
Filtered the Quarterly Mining Production Report for mines contained within the AI
dataset and generated annual total hours worked at each mine and annual total hours
worked by SIC code. Matched the production hours with the NFDL injury and
occupational fatality counts to calculate rates per 100 FTE. The absence of a reported
NFDL injury or occupational fatality within a year was filled as 0 per 100 FTE by mine
ID.
Merge noise measurements with incident
rate data from 1983-2014
Subset the Noise JEM annually by SIC code to match it with the merged AI dataset and
Quarterly Mining Production Report.
SOC
dat
aset
Get annual NFDL injury and occupational
fatality counts per job title from 1983-
2018
Filtered NIOSH’s AI dataset for NFDL injuries and occupational fatalities only.
Generated annual counts by unique job title.
Assign a minor SOC code to each unique
job title from within the AI dataset
Manually cross-matched each unique job title with minor SOC codes from the 2010
SOC Structure
Merge annual total hours worked for
each minor SOC code
Assigned minor SOC codes to job titles from 2003-2016 within the CFOI dataset using
SOC codes from 2017 and 2018 already in the CFOI. Any job title matches which were
not exact were then matched with the 2010 SOC Structure; the remaining were
randomly assigned a minor SOC code. As a result, annual total employee populations
(2003-2005) and annual total hours worked (in millions, 2006-2018) were summed by
each unique minor SOC code.

16
Objective Approach
SOC
dat
aset
(co
nt.
)
Calculate annual NFDL injury and
occupational fatality rates from 2003-
2018
From 1983-2002, annual NFDL injury and occupational fatality counts were used for
each minor SOC code. From 2003-2005, annual NFDL injury and occupational fatality
rates were calculated using the annual total employee population within a minor SOC
code. From 2006-2018, annual NFDL injury and occupational fatality rates were
calculated using annual total hours worked (in millions) by minor SOC code,
normalized to 100,000 FTE. The absence of a reported NFDL injury or occupational
fatality within a year was filled as 0 per 100,000 FTE by minor SOC code.
Merge annual noise measurements from
Noise JEM with each incident rate from
1983-2014 by minor SOC code
Subset the Noise JEM by each minor SOC code and year and matched with the
incident rates calculated from the merged AI and CFOI datasets.
MV
dat
aset
Get annual NFDL injury and occupational
fatality counts for the 10 mines (visited
for Aim 2) from 1983-2018
Filtered NIOSH’s AI dataset for NFDL injuries and occupational fatalities only.
Generated annual counts by unique mine ID.
Match annual total production hours for
each mine ID to calculate annual NFDL
injury and occupational fatality rates from
1983-2018
Filtered the Quarterly Mining Production Report for the 10 mines (visited for Aim 2)
and generated annual total hours worked at each mine. Merged the annual
production hours with the annual NFDL injury and occupational fatality counts to
calculate rates per 100 FTE. The absence of a reported NFDL injury or occupational
fatality within a year was filled as 0 per 100 FTE by mine ID.
Merge annual noise measurements of 80
and 90 dBA threshold dose for each mine
ID from 2000-2018
Calculated the annual average dose at each noise level for each mine ID from MSHA’s
Health Samples dataset. These were then converted to annual TWAMSHA, respectively,
and matched to the annual incident rates by mine ID.
Merge annual S&S rates of each mine ID
from 2000-2018
Calculated annual S&S rates from MSHA’s Violation dataset by summing S&S violation
counts and dividing by total inspection hours by mine ID. This rate was then matched
to the respective annual incident rates and noise measurements by mine ID.

Employee hours at the mine ID-level were based on data from the quarterly mining production
reports from 1983 to 2018 which were downloaded from the MSHA Open Government Data
site in January 2020 (https://arlweb.msha.gov/OpenGovernmentData/OGIMSHA.asp). These
data are no longer available at that website as of May 2020, but can now be found at a
Department of Labor developer website (https://developer.dol.gov/health-and-safety/) as .json
files. This MSHA dataset lists the quarterly total hours worked by operators (i.e., excluding
contractors) by mine ID. Total yearly hours for each mine ID were calculated and linked to the
AI dataset by mine ID. Any mine ID that existed in the MSHA quarterly mining production
reports was kept so as to include their hours worked in the overall calculations since the NIOSH
AI dataset only included incident reports of injuries or fatalities. Annual NFDL injury and
occupational fatality rates were then calculated by mine ID, SIC code, and mine type.
Total yearly hours by SOC code were difficult to determine for all included years because job
classifications and reporting methods have changed substantially over time. For the years 1992
to 2018 we downloaded the Census of Fatal Occupational Injuries (CFOI) fatality rates created
by the Bureau of Labor Statistics (https://www.bls.gov/iif/oshcfoi1.htm). For each year, total
fatalities and fatality rates within each occupation were reported. Prior to 2006, these reports
used total number of employees (in thousands) to create fatality rates. Beginning in 2006, rates
were reported as counts per total hours worked in millions by occupation category. Only CFOI
tables from 2017 and 2018 list occupation category with corresponding SOC codes; therefore,
each occupation category from years prior to 2017 with identical string matches was linked to
the SOC code presented in 2017 and 2018. For those that were not identically matched to the
SOC code within the CFOI for 2017 and 2018, we applied the 2010 SOC code structure
(https://www.bls.gov/soc/2010/#materials). Remaining unmatched occupation categories for
CFOI post-2003 were manual assigned to 2010 SOC codes. Once the match was complete we
used the reported total employee count or total employee hours worked to calculate NFDL
injury and occupational fatality rates for each SOC code in the NIOSH AI dataset. However,
these structured matching methods were not always feasible (i.e. multiple minor SOC codes
were classified together) for CFOI data prior to 2003; therefore, only counts could be achieved
for each SOC code in the NIOSH AI dataset prior to 2003.
To determine if there was an association between NFDL injuries and/or occupational fatalities
and noise exposures by mine type, SIC code, and/or SOC code, we then connected the
calculated rates with a Job Exposure Matrix (JEM) for occupational noise in the US
(http://noisejem.sph.umich.edu/) [49,50]. The JEM is subset into mine data and other industry
data and is structured such that each entry has a SIC code and a broad SOC code which allowed
for a swift connection to the rate and count datasets created from combining the NIOSH AI and
BLS CFOI datasets. Mine type was derived from the reported SIC codes. The most current
version of the noise JEM contains noise measurements from 1979 to 2014.
When the NIOSH AI dataset was joined with the MSHA quarterly mining production reports,
there were many mine IDs that existed in the MSHA quarterly mining production reports but
18
not in the NIOSH AI dataset because the NIOSH AI dataset is based solely on reported incidents.
Therefore, only mines which reported either a NFDL injury or an occupational fatality in the
years 1983 to 2018 were kept for the subsequent analysis. This excluded 37,069 mine-years
because they never reported (or have listed) a NFDL injury or an occupational fatality in the
NIOSH AI dataset. An important caveat to note is that according to MSHA, only coal mines are
legally required to report to this dataset and therefore all other mines reporting are doing so
voluntarily (https://arlweb.msha.gov/OpenGovernmentData/OGIMSHA.asp). This resulted in a
dataset for analysis that contains 23,004 mines and 353,042 mine-years. Unfortunately, the
MSHA quarterly mining production report did not include SIC codes; however, we were able to
fill in this information for mines that never changed SIC code over the years. There were 899
mines that changed their SIC code at least once between 1983 and 2018; therefore, 12,022
mine-years were not included in the analysis. Mine-years with a SIC code and without a
reported NFDL injury or an occupational fatality were assumed to have a null report for that
year and were filled in accordingly.
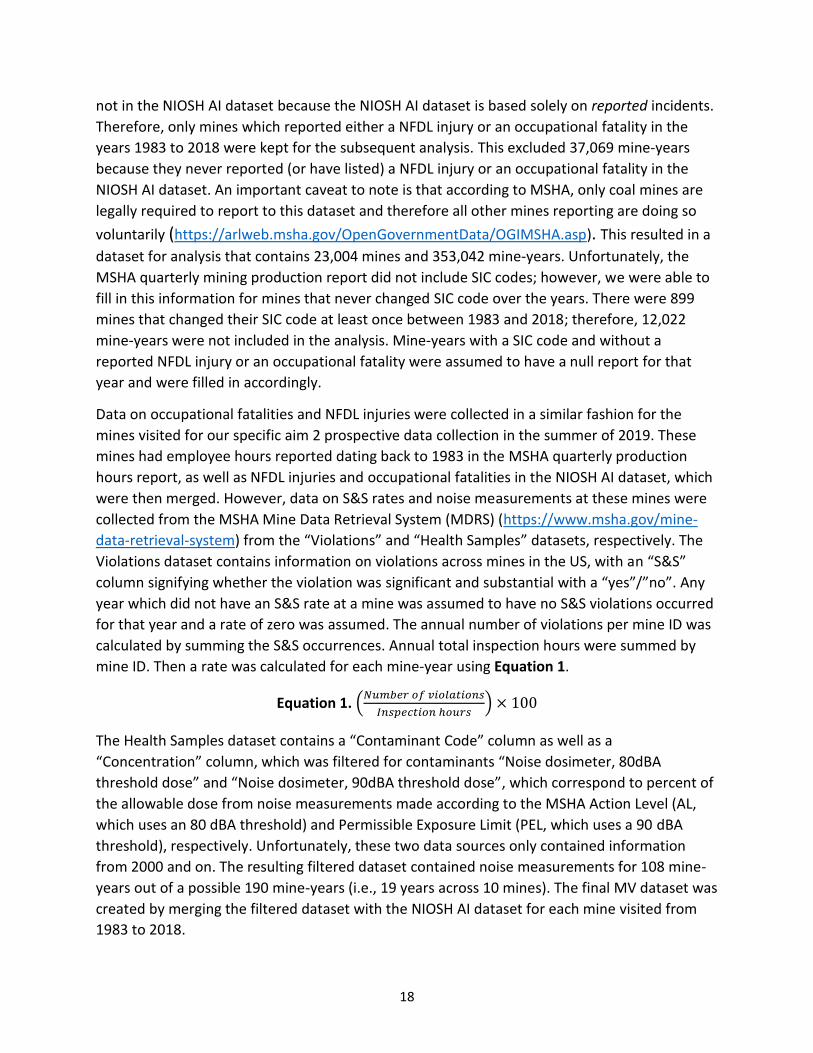
Data on occupational fatalities and NFDL injuries were collected in a similar fashion for the
mines visited for our specific aim 2 prospective data collection in the summer of 2019. These
mines had employee hours reported dating back to 1983 in the MSHA quarterly production
hours report, as well as NFDL injuries and occupational fatalities in the NIOSH AI dataset, which
were then merged. However, data on S&S rates and noise measurements at these mines were
collected from the MSHA Mine Data Retrieval System (MDRS) (https://www.msha.gov/mine-
data-retrieval-system) from the “Violations” and “Health Samples” datasets, respectively. The
Violations dataset contains information on violations across mines in the US, with an “S&S”
column signifying whether the violation was significant and substantial with a “yes”/”no”. Any
year which did not have an S&S rate at a mine was assumed to have no S&S violations occurred
for that year and a rate of zero was assumed. The annual number of violations per mine ID was
calculated by summing the S&S occurrences. Annual total inspection hours were summed by
mine ID. Then a rate was calculated for each mine-year using Equation 1.
Equation 1. (𝑁𝑢𝑚𝑏𝑒𝑟 𝑜𝑓 𝑣𝑖𝑜𝑙𝑎𝑡𝑖𝑜𝑛𝑠
𝐼𝑛𝑠𝑝𝑒𝑐𝑡𝑖𝑜𝑛 ℎ𝑜𝑢𝑟𝑠) × 100
The Health Samples dataset contains a “Contaminant Code” column as well as a
“Concentration” column, which was filtered for contaminants “Noise dosimeter, 80dBA
threshold dose” and “Noise dosimeter, 90dBA threshold dose”, which correspond to percent of
the allowable dose from noise measurements made according to the MSHA Action Level (AL,
which uses an 80 dBA threshold) and Permissible Exposure Limit (PEL, which uses a 90 dBA
threshold), respectively. Unfortunately, these two data sources only contained information
from 2000 and on. The resulting filtered dataset contained noise measurements for 108 mine-
years out of a possible 190 mine-years (i.e., 19 years across 10 mines). The final MV dataset was
created by merging the filtered dataset with the NIOSH AI dataset for each mine visited from
1983 to 2018.
19
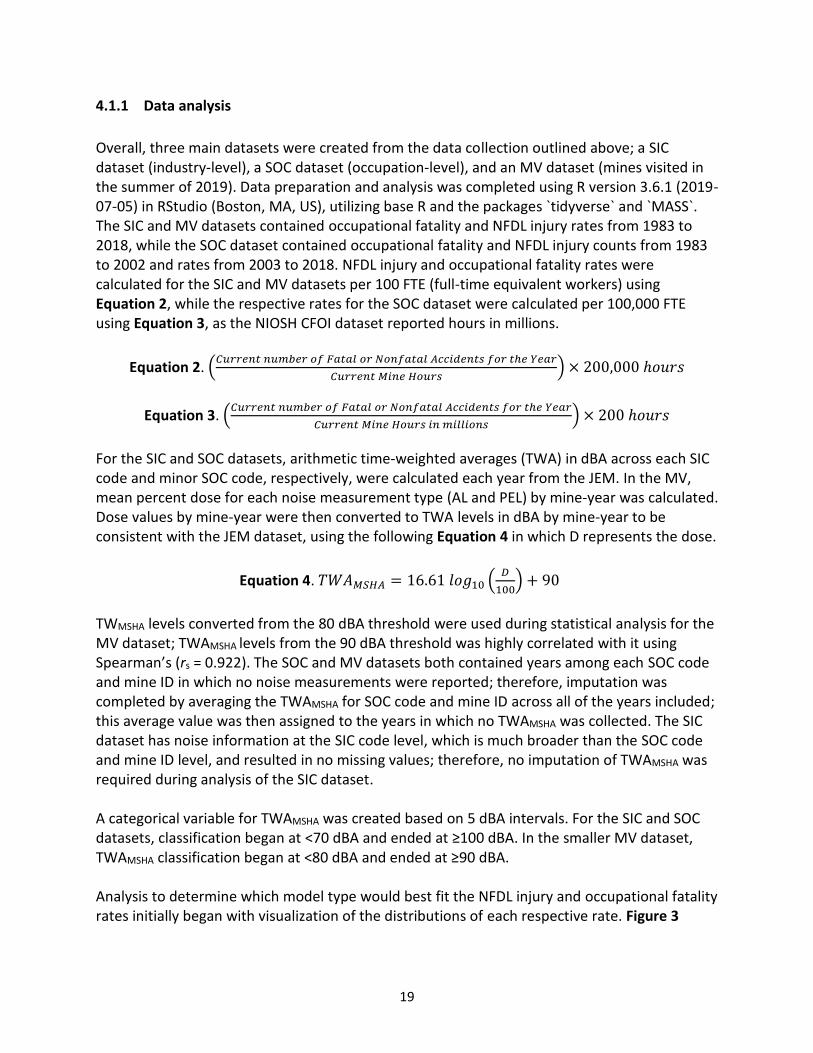
4.1.1 Data analysis Overall, three main datasets were created from the data collection outlined above; a SIC dataset (industry-level), a SOC dataset (occupation-level), and an MV dataset (mines visited in the summer of 2019). Data preparation and analysis was completed using R version 3.6.1 (2019-07-05) in RStudio (Boston, MA, US), utilizing base R and the packages `tidyverse` and `MASS`. The SIC and MV datasets contained occupational fatality and NFDL injury rates from 1983 to 2018, while the SOC dataset contained occupational fatality and NFDL injury counts from 1983 to 2002 and rates from 2003 to 2018. NFDL injury and occupational fatality rates were calculated for the SIC and MV datasets per 100 FTE (full-time equivalent workers) using Equation 2, while the respective rates for the SOC dataset were calculated per 100,000 FTE using Equation 3, as the NIOSH CFOI dataset reported hours in millions.
Equation 2. (𝐶𝑢𝑟𝑟𝑒𝑛𝑡 𝑛𝑢𝑚𝑏𝑒𝑟 𝑜𝑓 𝐹𝑎𝑡𝑎𝑙 𝑜𝑟 𝑁𝑜𝑛𝑓𝑎𝑡𝑎𝑙 𝐴𝑐𝑐𝑖𝑑𝑒𝑛𝑡𝑠 𝑓𝑜𝑟 𝑡ℎ𝑒 𝑌𝑒𝑎𝑟
𝐶𝑢𝑟𝑟𝑒𝑛𝑡 𝑀𝑖𝑛𝑒 𝐻𝑜𝑢𝑟𝑠) × 200,000 ℎ𝑜𝑢𝑟𝑠
Equation 3. (𝐶𝑢𝑟𝑟𝑒𝑛𝑡 𝑛𝑢𝑚𝑏𝑒𝑟 𝑜𝑓 𝐹𝑎𝑡𝑎𝑙 𝑜𝑟 𝑁𝑜𝑛𝑓𝑎𝑡𝑎𝑙 𝐴𝑐𝑐𝑖𝑑𝑒𝑛𝑡𝑠 𝑓𝑜𝑟 𝑡ℎ𝑒 𝑌𝑒𝑎𝑟
𝐶𝑢𝑟𝑟𝑒𝑛𝑡 𝑀𝑖𝑛𝑒 𝐻𝑜𝑢𝑟𝑠 𝑖𝑛 𝑚𝑖𝑙𝑙𝑖𝑜𝑛𝑠) × 200 ℎ𝑜𝑢𝑟𝑠
For the SIC and SOC datasets, arithmetic time-weighted averages (TWA) in dBA across each SIC code and minor SOC code, respectively, were calculated each year from the JEM. In the MV, mean percent dose for each noise measurement type (AL and PEL) by mine-year was calculated. Dose values by mine-year were then converted to TWA levels in dBA by mine-year to be consistent with the JEM dataset, using the following Equation 4 in which D represents the dose.
Equation 4. 𝑇𝑊𝐴𝑀𝑆𝐻𝐴 = 16.61 𝑙𝑜𝑔10 (𝐷
100) + 90
TWMSHA levels converted from the 80 dBA threshold were used during statistical analysis for the MV dataset; TWAMSHA levels from the 90 dBA threshold was highly correlated with it using Spearman’s (rs = 0.922). The SOC and MV datasets both contained years among each SOC code and mine ID in which no noise measurements were reported; therefore, imputation was completed by averaging the TWAMSHA for SOC code and mine ID across all of the years included; this average value was then assigned to the years in which no TWAMSHA was collected. The SIC dataset has noise information at the SIC code level, which is much broader than the SOC code and mine ID level, and resulted in no missing values; therefore, no imputation of TWAMSHA was required during analysis of the SIC dataset. A categorical variable for TWAMSHA was created based on 5 dBA intervals. For the SIC and SOC datasets, classification began at <70 dBA and ended at ≥100 dBA. In the smaller MV dataset, TWAMSHA classification began at <80 dBA and ended at ≥90 dBA. Analysis to determine which model type would best fit the NFDL injury and occupational fatality rates initially began with visualization of the distributions of each respective rate. Figure 3
20
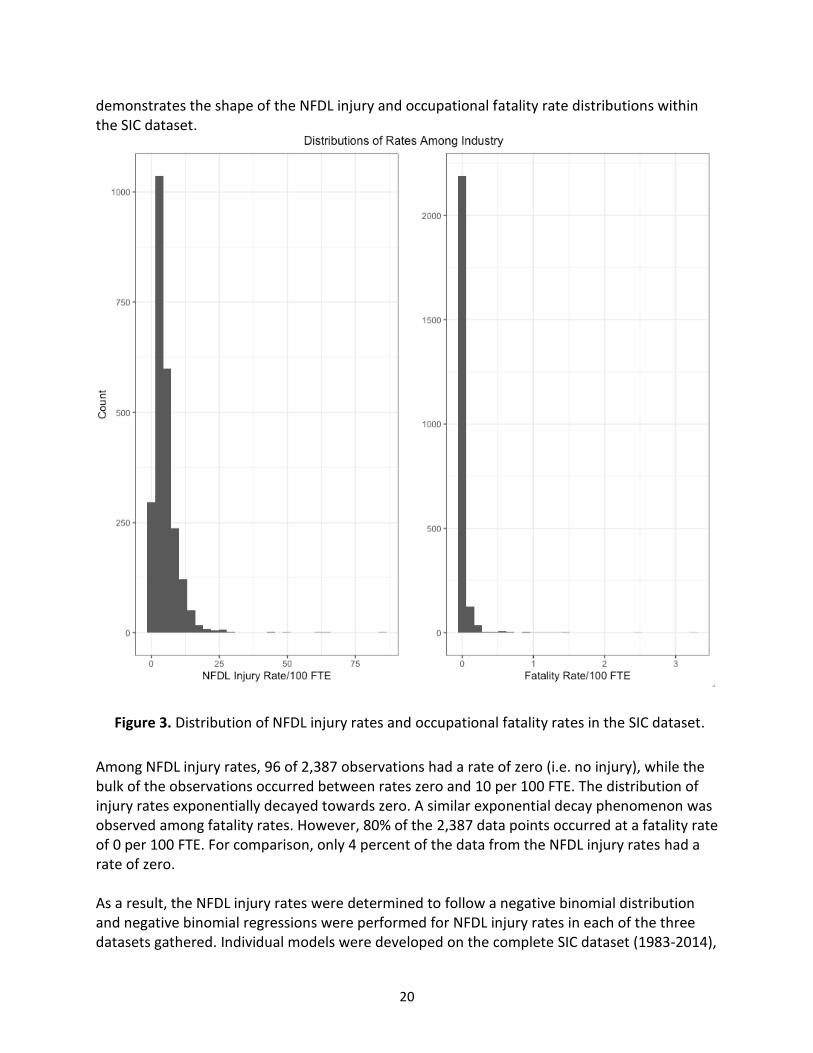
demonstrates the shape of the NFDL injury and occupational fatality rate distributions within the SIC dataset.
Among NFDL injury rates, 96 of 2,387 observations had a rate of zero (i.e. no injury), while the bulk of the observations occurred between rates zero and 10 per 100 FTE. The distribution of injury rates exponentially decayed towards zero. A similar exponential decay phenomenon was observed among fatality rates. However, 80% of the 2,387 data points occurred at a fatality rate of 0 per 100 FTE. For comparison, only 4 percent of the data from the NFDL injury rates had a rate of zero. As a result, the NFDL injury rates were determined to follow a negative binomial distribution and negative binomial regressions were performed for NFDL injury rates in each of the three datasets gathered. Individual models were developed on the complete SIC dataset (1983-2014),
Figure 3. Distribution of NFDL injury rates and occupational fatality rates in the SIC dataset.
21
the complete MV dataset (2000-2018), and subsets of the SOC dataset for counts and rates (i.e. 1983-2002 and 2003-2014, respectively). All NFDL injury counts or rates of zero were dropped from each dataset to better fit the negative binomial distribution and achieve more accurate modelling of the data. Therefore, the relationship between noise and injury risk was assessed only among reported NFDL injuries. All regressions were run in R using the function `glm()` with the argument `family = negative.binomial()`. The `negative.binomial()` function requires a theta input, which was calculated using a quasi-poisson regression on the same model to determine the dispersion index (DI) which was then put into the negative binomial for theta. Due to the very large over-inflation of zeros in the occupational fatality rate data, fatality rates were categorized into a binary outcome of “no fatality occurred” and “fatality occurred”; logistic regression was performed to model this binary outcome. Use of logistic regression allowed all years of the SOC dataset to be included in a single model, as “no fatality occurring” is equivalent to both a rate of zero and a count of zero. Logistic regression for occupational fatalities was also applied to the SIC dataset for all the years available. Modelling could not be performed on the MV dataset because only one occupational fatality occurred between 2000 and 2018. Logistic regression was run in R using the function `glm()`, specifying `family = binomial()`. Using the datasets created through the processes described above we sought to answer two main questions relevant to specific aim 1. First, among NFDL injuries, is noise exposure is associated with higher injury risk among reported injuries at mines? Second, is there is an association between noise exposure and the occurrence of occupational fatalities among miners? 4.2 Research Approach for Specific Aim 2
4.2.1 Sites We originally proposed to visit a large mining facility located in Alpena, Michigan to perform repeated prospective measures on a cohort of miners in summer 2019. Unfortunately, this facility ultimately withdrew their agreement to participate due to business circumstances beyond our control. Therefore, we spent the majority of the late fall and early winter months of 2018-9 identifying contacts within the mining industry and reaching out to mines across the Midwest to identify an alternative site or sites for the research. We had success with two large mining conglomerates. Although these companies did not give us access to all of their mines in the Midwest region, they connected us with regional safety management teams, which in turn facilitated access to specific mine sites. These connections resulted in access to ten mine sites for the collection of data related to specific aim 2. Six sites were operated by one conglomerate and four by a second conglomerate. These sites were located in three different states; four sites were in Michigan, three in Ohio, and three in Illinois. All mines were surface mining operations. Two sites were limestone kiln operations, 4 were limestone aggregate operations, and 4 were sand/silica operations.

22
4.2.2 Participants Participants were recruited from any aspect of the mining operation at each site; only contracted workers and non-mining workers were excluded. All aspects of the research were reviewed and approached by the University of Michigan Institutional Review Board – Health Sciences/Behavioral Sciences (approval number HUM00152393). Recruitment was primarily done during safety meetings and briefings at the start of a shift. However, some recruitment was done by word-of-mouth within the mine. Potential volunteers were clearly (and repeatedly) told that participation was completely voluntary and could be terminated at any time. Each interested individual signed a paper copy of the Informed Consent Form (see Appendix A). Participants were asked to participate for three consecutive workdays for the length of each of their shifts. 4.2.3 Data collection and analysis Each site was visited at least once for a period of three days. During each visit our recruitment target was 15 miners per shift. Table 2 provides an overview of the types of data that were collected, and at what cadence. Schedules were incredibly fluid and dynamic in this setting therefore, no standardized order or time of tests was possible. Through discussions with each participant about their availability over the sampled dates, times were determined for completion of all other tasks associated with the study (i.e., survey, audiometry, speech-in-noise, and Fitcheck). Research personnel and equipment limitations as well as available quiet space further necessitated this flexibility.
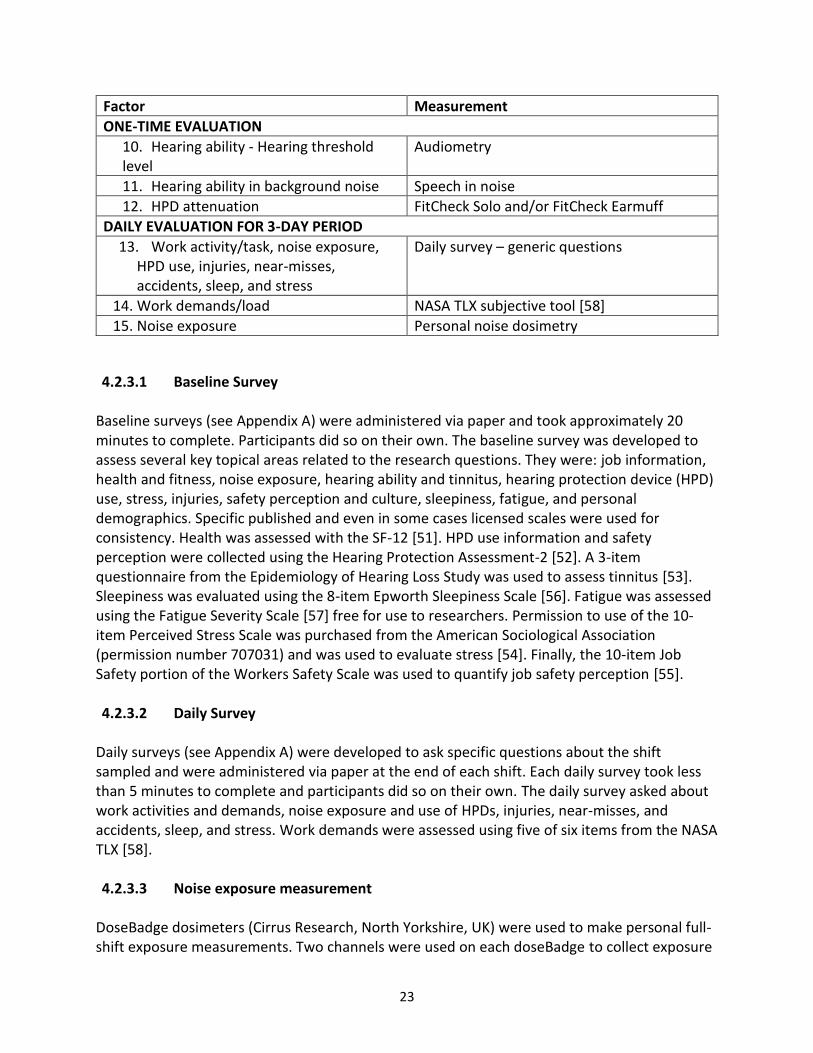
Table 2. Overview of data types collected during the study
Factor Measurement
ONE-TIME EVALUATION
1. Employment information, fitness, noise exposure history, hearing ability, injury history, and demographics
Survey – generic questions
2. Health Survey - SF-12 [51]
3. Hearing protection device (HPD) use Survey – part of the Hearing Protection Assessment-2 [52]
4. Safety perception Survey – part of the Hearing Protection Assessment-2 [52]
5. Tinnitus history Survey – 3-item questionnaire from the Epidemiology of Hearing Loss Study [53]
6. Stress Survey – Perceived stress scale (PSS) [54]
7. Work safety culture Survey – Job safety section of the Work Safety Scale (JSS) [55]
8. Sleepiness Survey – Epworth Sleep Scale (ESS) [56]
9. Fatigue Survey – Fatigue Severity Scale (FSS) [57]
23
Factor Measurement
ONE-TIME EVALUATION
10. Hearing ability - Hearing threshold level
Audiometry
11. Hearing ability in background noise Speech in noise
12. HPD attenuation FitCheck Solo and/or FitCheck Earmuff
DAILY EVALUATION FOR 3-DAY PERIOD
13. Work activity/task, noise exposure, HPD use, injuries, near-misses, accidents, sleep, and stress
Daily survey – generic questions
14. Work demands/load NASA TLX subjective tool [58]
15. Noise exposure Personal noise dosimetry
4.2.3.1 Baseline Survey Baseline surveys (see Appendix A) were administered via paper and took approximately 20 minutes to complete. Participants did so on their own. The baseline survey was developed to assess several key topical areas related to the research questions. They were: job information, health and fitness, noise exposure, hearing ability and tinnitus, hearing protection device (HPD) use, stress, injuries, safety perception and culture, sleepiness, fatigue, and personal demographics. Specific published and even in some cases licensed scales were used for consistency. Health was assessed with the SF-12 [51]. HPD use information and safety perception were collected using the Hearing Protection Assessment-2 [52]. A 3-item questionnaire from the Epidemiology of Hearing Loss Study was used to assess tinnitus [53]. Sleepiness was evaluated using the 8-item Epworth Sleepiness Scale [56]. Fatigue was assessed using the Fatigue Severity Scale [57] free for use to researchers. Permission to use of the 10-item Perceived Stress Scale was purchased from the American Sociological Association (permission number 707031) and was used to evaluate stress [54]. Finally, the 10-item Job Safety portion of the Workers Safety Scale was used to quantify job safety perception [55]. 4.2.3.2 Daily Survey
Daily surveys (see Appendix A) were developed to ask specific questions about the shift sampled and were administered via paper at the end of each shift. Each daily survey took less than 5 minutes to complete and participants did so on their own. The daily survey asked about work activities and demands, noise exposure and use of HPDs, injuries, near-misses, and accidents, sleep, and stress. Work demands were assessed using five of six items from the NASA TLX [58]. 4.2.3.3 Noise exposure measurement
DoseBadge dosimeters (Cirrus Research, North Yorkshire, UK) were used to make personal full-shift exposure measurements. Two channels were used on each doseBadge to collect exposure

24
data according to two exposure standards simultaneously (Table 3). The first channel was set according to the MSHA Permissible Exposure Limit (PEL) of 90 dBA TWA, and the other channel was set according to the NIOSH Recommended Exposure Limit (REL) of 85 dBA. The two channel setting allowed the minute-by-minute collection of average levels (LAVG for channel 1, LEQ for channel 2) and LMAX over the course of a shift as well as overall for the length of the shift. Following recruitment, the dosimeter was placed on the participants’ chosen shoulder for the length of their shift (i.e., most often between 8 and 12 hours). Some participants needed to remove and replace the dosimeter themselves during their shifts as a result of donning and doffing safety gear. All participants were instructed for proper placement and advised that the dosimeter must remain on the outside layer of clothing. Table 3. Dosimeter channel settings used for shift-level noise measurements
Channel and
standard Weight Exchange Rate (dB)
Threshold (dBA)
Criterion Level (dBA)
Response time
Upper limit (dBA)
Calculated Metrics
1 MSHA PEL A 5 80 85 Slow 140
Shift LAVG TWAMSHA
2 NIOSH REL A 3 80 85 Disabled 140
Shift LEQ TWANIOSH
Several calculations had to be performed to convert the minute-level noise measurements into shift-level LAVG (Equation 5) and LEQ (Equation 6) values and then into normalized 8-hour time-weighted averages, TWAMSHA (Equation 7) and TWANIOSH (Equation 8), respectively. Person- level TWAMSHA and TWANIOSH were calculated using Equation 9 and 10, respectively, to allow models at the person level to be run.
Equation 5. 𝐿𝐴𝑉𝐺 = 16.61 × log10 (1
𝑁 ∑ 10
1 min 𝐿𝐴𝑉𝐺𝑖16.61𝑁
𝑖=1 )
Equation 6. 𝐿𝐸𝑄 = 10 × log10 (1
𝑁 ∑ 10
1 min 𝐿𝐸𝑄𝑖10𝑁
𝑖=1 )
Equation 7. 𝑠ℎ𝑖𝑓𝑡 𝑙𝑒𝑣𝑒𝑙 𝑇𝑊𝐴𝑀𝑆𝐻𝐴 = 16.61 × log10 (1
480 ∑ 10
1 min 𝐿𝐴𝑉𝐺𝑖16.61480
𝑖=1 )
Equation 8. 𝑠ℎ𝑖𝑓𝑡 𝑙𝑒𝑣𝑒𝑙 𝑇𝑊𝐴𝑁𝐼𝑂𝑆𝐻 = 10 × log10 (1
480 ∑ 10
1 min 𝐿𝐸𝑄𝑖10
480𝑖=1 )
Equation 9. 𝑝𝑒𝑟𝑠𝑜𝑛 𝑙𝑒𝑣𝑒𝑙 𝑇𝑊𝐴𝑀𝑆𝐻𝐴 = 10 × log10 (1
𝑁 ∑ 10
𝑇𝑊𝐴𝑀𝑆𝐻𝐴𝑖10𝑁
𝑖=1 )
Equation 10. 𝑝𝑒𝑟𝑠𝑜𝑛 𝑙𝑒𝑣𝑒𝑙 𝑇𝑊𝐴𝑁𝐼𝑂𝑆𝐻 = 10 × log10 (1
𝑁 ∑ 10
𝑇𝑊𝐴𝑁𝐼𝑂𝑆𝐻𝑖10𝑁
𝑖=1 )

25
Novel noise metrics were calculated to investigate whether they had different relationships with accident, near-miss, or injury risk than average levels. The first metric was the crest factor for each channel measured as shown in Equations 11 and 12 [59] or a measure of the average noise measured to the peak noise measure. Variability of LEQ to LAVG was also calculated following Equation 13 to assess fluctuations in noise levels, as the LEQ is more sensitive to fluctuations than the LAVG [60]. Finally, statistical kurtosis across minutes measured in a shift were calculated to assess the weight of the tails of distribution of noise exposures experienced by an individual across a shift.
Equation 11. 𝐿𝐸𝑄 𝑐𝑟𝑒𝑠𝑡 𝑓𝑎𝑐𝑡𝑜𝑟 = 10 × log10 (10𝐿𝑝𝑒𝑎𝑘
10 − 10𝐿𝐸𝑄
10 )
Equation 12. 𝐿𝐴𝑉𝐺 𝑐𝑟𝑒𝑠𝑡 𝑓𝑎𝑐𝑡𝑜𝑟 = 10 × log10 (10𝐿𝑝𝑒𝑎𝑘
10 − 10𝐿𝐴𝑉𝐺
10 )
Equation 13. 𝑉𝑎𝑟𝑖𝑎𝑏𝑖𝑙𝑖𝑡𝑦 = 10 × log10 (10
𝐿𝐸𝑄10
10𝐿𝐴𝑉𝐺
10
)
4.2.3.4 Hearing ability evaluation
Due to logistic, monetary, and time restraints imposed by the last-minute withdrawal of the original research site, we used a smart-phone based application to perform hearing tests. App based hearing tests are relatively new but have been used in other resource constrained research settings [61]. Specifically, we used the Apple Research Kit (Apple Inc, Cupertino, CA) pure-tone audiometry and speech in noise tests. Using iPhone 6S with iOS 13.2 installed and Shure (Shure, Niles, IL) SE215 sound isolating earphones, these tests were self-performed by each participant under researcher supervision onsite. Many of the sites that were visited did not have extra space that could be used for our research activities. Often, small closets were used to perform hearing evaluations, and these spaces often had poor attenuation and audible ventilation systems. Therefore, to block as much background noise as possible, we adapted the test protocol for the hearing tests to require the participant to wear DD52 audiometric sound isolating headphones (Tungtech Industrial Limited, Xiamen, China) from our Fitcheck Solo system (described in section 4.2.3.5) over the Shure earphones.
Each hearing test took approximately 10 minutes. Hearing loss was quantified in a variety of ways. The pure-tone audiometry test in the Apple Research Kit App measured hearing threshold levels (HTLs) in dB HL at 0.25, 0.5, 1, 2, 4, 6, and 8 kHz, and was performed on each ear separately. The speech in noise task in the Apple Research Kit App tested participants’ ability to hear and understand spoken words with various levels of background noise. Specifically, the test generated a speech reception threshold (SRT), defined as the signal to noise ratio (SNR) where

26
50% of the words are correctly repeated by the subject. The SRT was calculated using the Tillman Olsen formula [62] as commonly used by the QuickSINTM (Etymotic, Elk Grove Village, IL) and shown in Equation 14:
Equation 14. 𝑆𝑅𝑇 = 𝐼 + 𝐷
2−
𝐷 ×𝑅
𝑁
Where I is the initial SNR, D is the SNR step size, R is the total number of correctly repeated words (from a total number of 35 words) and N is the number of keywords in each sentence. The speech in noise test used I = 18 dB, D = 3 dB, and N = 5 as parameters, simplifying Equation 14 to Equation 15.
Equation 15. 𝑆𝑅𝑇 = 19.5 − (𝑅 × 0.6)
Each worker completed two sets of 7-sentence wordlists. The first set (SRT0) was used as a training set to familiarize participants with the test, while the results of second set (SRT1) was used for analysis.
Extraction of the audiometry and the in noise data from the .json files output by the Apple Research Kit App on each iPhone was done by downloading them locally using iTunes and then developing code to extract relevant data from each file and generate summary spreadsheets. All code was written using Python 3 (Python Software Foundation, Beaverton, OR) in Jupyter Notebook (Project Jupyter, US). A very small subset of audiometric HTL data was corrected to address a bug in the Apple Research kit App. Specifically, the application did not correctly detect threshold levels for certain frequencies if thresholds were variable. However, data for attempted threshold identification were stored, and allowed us to identify the lowest threshold that occurred at least twice on a down-step. This identified HTL was reassigned for each frequency.
4.2.3.5 Hearing protection device fit and use Direct measurement of HPD attenuation (commonly referred to as “fit”) for earplugs and earmuffs was performed in the field by research staff using FitCheck Solo and FitCheck Earmuff systems (both from Michael and Associates, Inc.), respectively. These systems allow for the measurement of a real-world individual Personal Attenuation Rating (PAR) [63]. The FitCheck Solo system measured attenuation at the frequencies 0.25, 0.5, 1, 2, 4, and 8 kHz. This test is considered robust even in the presence of moderate noise; nevertheless, fit testing was performed in the quietest available environments in the field. To allow the inclusion of data for the small subset of tests with missing values at higher frequencies (resulting from substantial high-frequency hearing loss in a few participants), PARs were calculated using Equation 16.
Equation 16. 𝑃𝐴𝑅𝑛 = 10 × log10 ( ∑ 10
𝐿𝐴𝑓
10𝑁𝑓 ) − 10 × log10 ( ∑ 10
𝐿𝐴𝑓− 𝐴𝑓
10𝑁𝑓 )
27
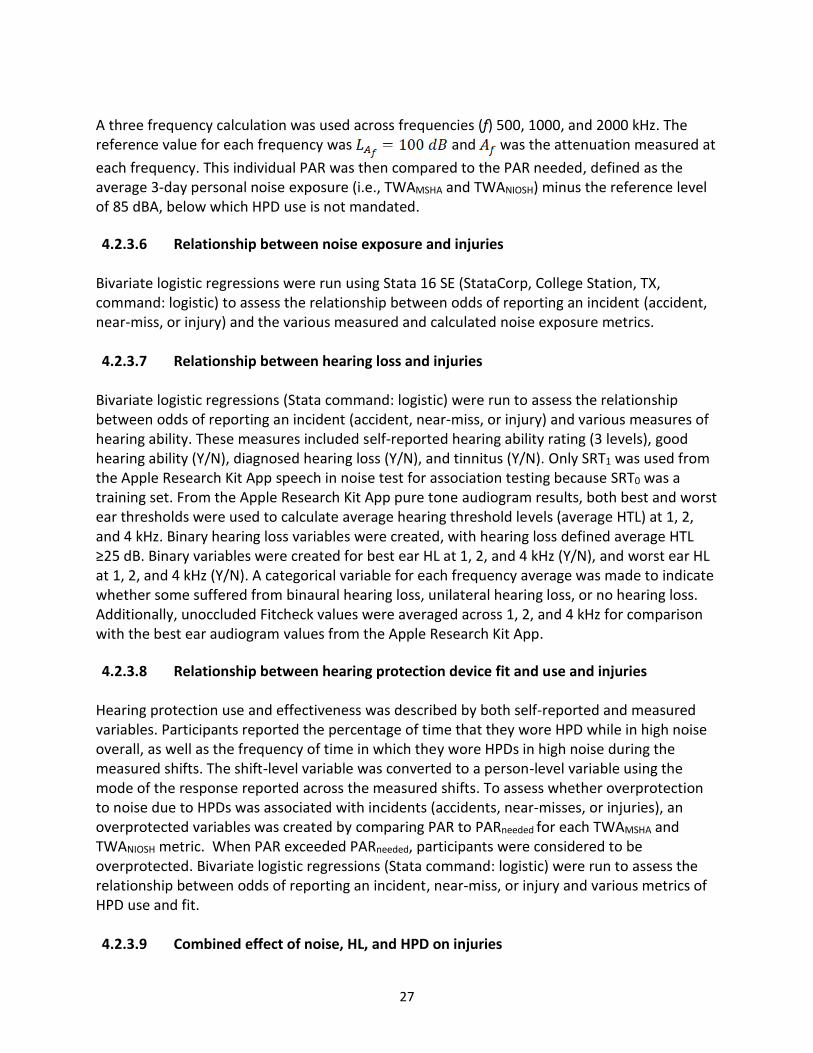
A three frequency calculation was used across frequencies (f) 500, 1000, and 2000 kHz. The reference value for each frequency was and was the attenuation measured at
each frequency. This individual PAR was then compared to the PAR needed, defined as the average 3-day personal noise exposure (i.e., TWAMSHA and TWANIOSH) minus the reference level of 85 dBA, below which HPD use is not mandated.
4.2.3.6 Relationship between noise exposure and injuries Bivariate logistic regressions were run using Stata 16 SE (StataCorp, College Station, TX, command: logistic) to assess the relationship between odds of reporting an incident (accident, near-miss, or injury) and the various measured and calculated noise exposure metrics. 4.2.3.7 Relationship between hearing loss and injuries
Bivariate logistic regressions (Stata command: logistic) were run to assess the relationship between odds of reporting an incident (accident, near-miss, or injury) and various measures of hearing ability. These measures included self-reported hearing ability rating (3 levels), good hearing ability (Y/N), diagnosed hearing loss (Y/N), and tinnitus (Y/N). Only SRT1 was used from the Apple Research Kit App speech in noise test for association testing because SRT0 was a training set. From the Apple Research Kit App pure tone audiogram results, both best and worst ear thresholds were used to calculate average hearing threshold levels (average HTL) at 1, 2, and 4 kHz. Binary hearing loss variables were created, with hearing loss defined average HTL ≥25 dB. Binary variables were created for best ear HL at 1, 2, and 4 kHz (Y/N), and worst ear HL at 1, 2, and 4 kHz (Y/N). A categorical variable for each frequency average was made to indicate whether some suffered from binaural hearing loss, unilateral hearing loss, or no hearing loss. Additionally, unoccluded Fitcheck values were averaged across 1, 2, and 4 kHz for comparison with the best ear audiogram values from the Apple Research Kit App.
4.2.3.8 Relationship between hearing protection device fit and use and injuries Hearing protection use and effectiveness was described by both self-reported and measured variables. Participants reported the percentage of time that they wore HPD while in high noise overall, as well as the frequency of time in which they wore HPDs in high noise during the measured shifts. The shift-level variable was converted to a person-level variable using the mode of the response reported across the measured shifts. To assess whether overprotection to noise due to HPDs was associated with incidents (accidents, near-misses, or injuries), an overprotected variables was created by comparing PAR to PARneeded for each TWAMSHA and TWANIOSH metric. When PAR exceeded PARneeded, participants were considered to be overprotected. Bivariate logistic regressions (Stata command: logistic) were run to assess the relationship between odds of reporting an incident, near-miss, or injury and various metrics of HPD use and fit. 4.2.3.9 Combined effect of noise, HL, and HPD on injuries

28
Logistic regression models (Stata command: logistic) were developed to study the relationship
between noise exposure, hearing ability, and HPD use and the risk of injury/near miss event.
Important psychosocial (i.e., sleepiness, stress, fatigue, health) and work environment (i.e.,
work demands, safety culture and perception) factors were also considered to control for
potential confounding.
Purposeful selection of potential risk factors and covariates for injury was conducted by
bivariate analysis of each variable and the outcome independently. Potential candidates for a
multivariable model were selected if their univariate test, a simple logistic regression, reported
a significance of p < 0.25 [64]. The standard 0.05 significance was not used for screening
potential covariates as it may not identify all important covariates required to develop the best
fitting multivariable [65]. Variables related to age, work experience, hearing ability, and hearing
protection use were kept for further analysis regardless of their significance level due to their
established relationship with occupational injuries.
5.0 Summary of Accomplishments
5.1 Summary of Accomplishments for Aim 1
NFDL injury and occupational fatality rates were connected to noise estimates from 1983 to 2014 by SIC code to generate the SIC dataset. NFDL injury and occupational fatality counts were connected to noise estimates from 1983 to 2002 by SOC code while NFDL injury and occupational fatality rates were connected to noise estimates from 2003 to 2014 by SOC code to generate the SOC dataset. NFDL injury and occupational fatality rates for the mines visited during Aim 2 were compiled from 1983 to 2018 and connected to MSHA noise measures and S&S rates from 2000 to 2018 to generate the MV dataset. 5.1.1 Dataset
A total of 374,998 recorded non-fatal day lost (NFDL) injuries and 2,334 recorded occupational fatalities in the mining industry from 1983 to 2018 were included in the SIC and SOC datasets. These data included measurements from all three mine types (i.e., coal, metal, and nonmetal). For minor SOC code analysis, six NFDL injuries had to be dropped because they did not have any job title information. Five of these six removed observations occurred in 2016 among four different mines and the sixth removed observation occurred in 2017. After removing these observations, a total of 374,992 NFDL injuries were included in the SOC dataset analyses. NFDL injury rates by year and by SIC code are included in the appendices in tables separated at year 2002 to accommodate their size (Appendix B. Table 1.1.1. and Appendix B. Table 1.1.2). Similarly, occupational fatality rates by year and by SIC code are also included in the appendices, again split at the year 2002 (Appendix B. Table 1.2.1 and Appendix B. Table 1.2.2).

29
NFDL injury and occupational fatality counts by year and by SOC code for 1983-2002 (Appendix B. Table 2.1.1 and Table 2.2.1, respectively) and NFDL injury and occupational fatality rates by year and by SOC code for 2003 to 2018 (Appendix B. Table 2.1.2 and Table 2.2.2, respectively) are included in Appendix B. Noise measurements (TWAMSHA) collected from the JEM are presented by year and by SIC code in Appendix B. (Table 1.3.1 and Table 1.3.2) divided at 2002 to accommodate their size. TWAMSHA is similarly presented by year and by SOC code in Appendix B (Table 2.3.1 and Table 2.3.2). Compiled data of NFDL injury and occupational fatality rates, MSHA noise measurements, and S&S rates by year from 1983 to 2018 is also presented in Appendix B for the mines visited in specific aim 2, but is separated first by company and industry (e.g., Company 1 – Limestone mines, Company 1 – Lime Mines, and Company 2 – Sand mines) in Tables 3.1.1, 3.1.2, and 3.2.1, respectively.
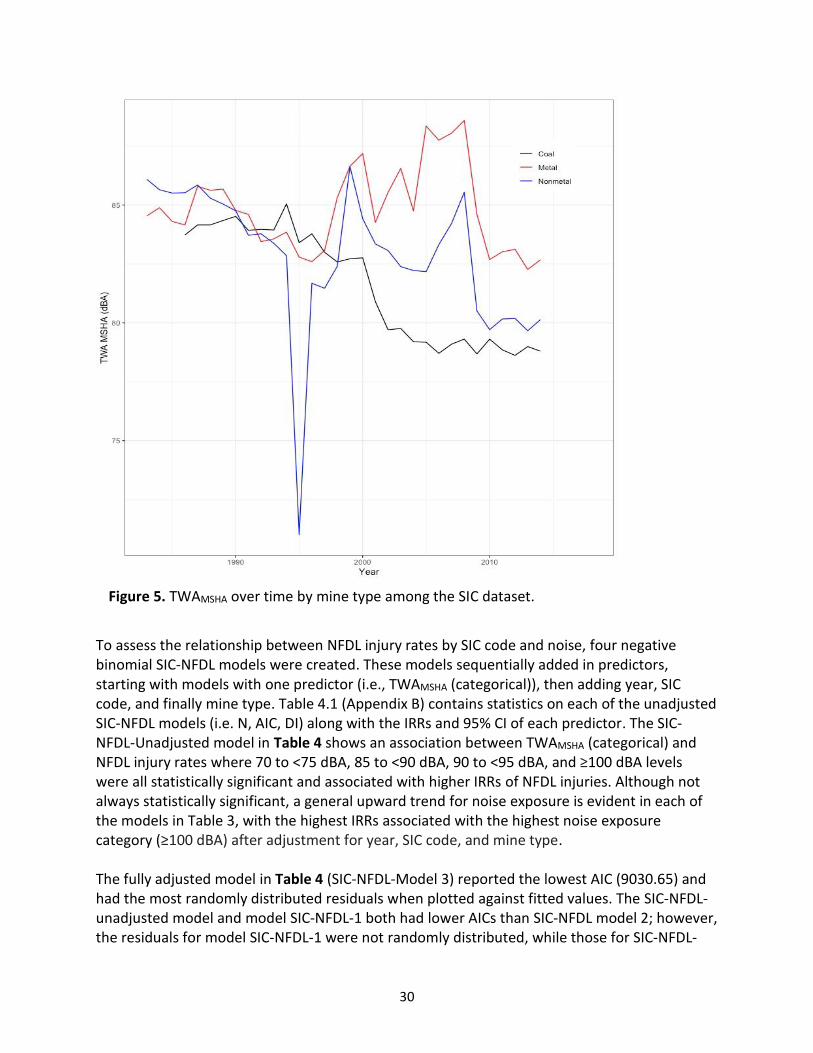
5.1.2 Noise and NFDL injury rates by SIC Data among SIC codes shows a clear trend of decreasing NFDL injuries among mine types (Figure 4); however, the same clear trend for noise exposure over time is only evident among coal mines and is not as clear in metal and nonmetal mines (Figure 5).
Figure 4. NFDL injury rates over time by mine type among the
SIC dataset.
30
To assess the relationship between NFDL injury rates by SIC code and noise, four negative binomial SIC-NFDL models were created. These models sequentially added in predictors, starting with models with one predictor (i.e., TWAMSHA (categorical)), then adding year, SIC code, and finally mine type. Table 4.1 (Appendix B) contains statistics on each of the unadjusted SIC-NFDL models (i.e. N, AIC, DI) along with the IRRs and 95% CI of each predictor. The SIC-NFDL-Unadjusted model in Table 4 shows an association between TWAMSHA (categorical) and NFDL injury rates where 70 to <75 dBA, 85 to <90 dBA, 90 to <95 dBA, and ≥100 dBA levels were all statistically significant and associated with higher IRRs of NFDL injuries. Although not always statistically significant, a general upward trend for noise exposure is evident in each of the models in Table 3, with the highest IRRs associated with the highest noise exposure category (≥100 dBA) after adjustment for year, SIC code, and mine type. The fully adjusted model in Table 4 (SIC-NFDL-Model 3) reported the lowest AIC (9030.65) and had the most randomly distributed residuals when plotted against fitted values. The SIC-NFDL- unadjusted model and model SIC-NFDL-1 both had lower AICs than SIC-NFDL model 2; however, the residuals for model SIC-NFDL-1 were not randomly distributed, while those for SIC-NFDL-
Figure 5. TWAMSHA over time by mine type among the SIC dataset.

31
Models 2 and 3 were. Controlling for industry SIC code (n=83 categories) overfit the data (i.e., resulted in higher variance within the model measured by mean-square error); therefore, mine type was introduced into the model instead, which resulted in higher bias but minimized variance. A Kruskal-Wallis rank sum test run on TWAMSHA(continuous) by each mine type found that the median noise level of each mine type was statistically significantly different (
). This further validated the improvement of the models in Table 3 with the addition of mine type.

32
Table 4. Negative binomial models for NFDL injury rates among the SIC dataset
Statistic SIC-NFDL-Unadjusted Model SIC-NFDL-1 Model SIC-NFDL-2 Model SIC-NFDL-3
N 1779 1779 1779 1779 DI* 3.64 3.48 1.27 3.49 AIC 9200.52 9117.63 9291.64 9030.65 Variable IRR LL UL IRR LL UL IRR LL UL IRR LL UL
TWAMSHA <70 dBA (ref) 1.00 - - 1.00 - - 1.00 - - 1.00 - - 70 to <75 dBA 2.10 1.06 4.21 2.03 1.04 4.00 1.51 1.02 2.23 1.83 0.92 3.66 75 to <80 dBA 1.88 0.99 3.57 1.95 1.05 3.65 1.51 1.05 2.15 1.59 0.84 3.03 80 to <85 dBA 1.82 0.97 3.45 1.79 0.97 3.35 1.58 1.10 2.24 1.51 0.81 2.87 85 to <90 dBA 1.99 1.06 3.79 1.90 1.03 3.55 1.53 1.07 2.17 1.68 0.90 3.20 90 to <95 dBA 2.00 1.05 3.89 1.91 1.04 3.64 1.34 0.92 1.93 1.82 0.95 3.53 95 to <100 dBA 1.97 0.96 4.11 1.89 0.93 3.88 1.42 0.94 2.14 1.89 0.23 3.94 ≥100 dBA 2.56 1.10 6.09 2.46 1.08 5.73 1.53 0.93 2.52 2.54 1.09 6.02 Year 0.98 0.97 0.99 0.98 0.97 0.98 0.98 0.97 0.99 SIC code** ** ** ** Mine type Coal (ref) 1.00 - - Metal 0.46 0.37 0.57 Nonmetal 0.63 0.52 0.78
*The dispersion index (DI) was derived from each respective quasi-poisson model **IRRs and 95% CIs for each SIC code (n=83) can be found in Appendix B Table 4.2
33
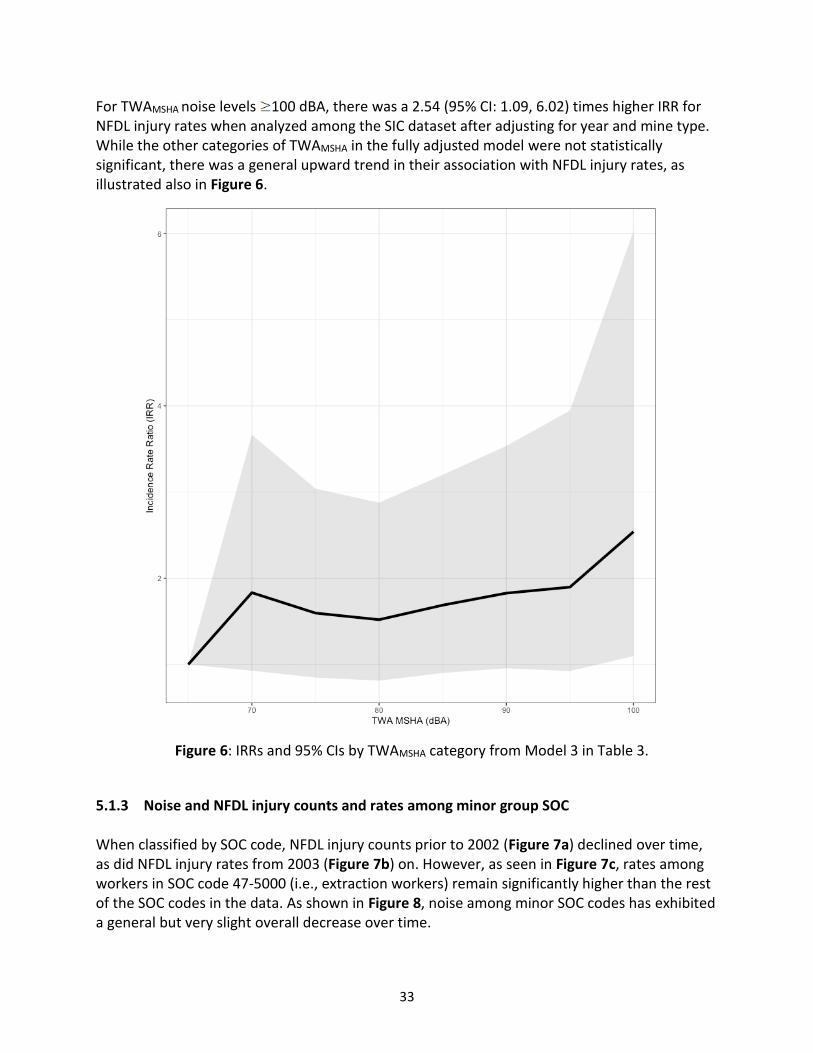
For TWAMSHA noise levels 100 dBA, there was a 2.54 (95% CI: 1.09, 6.02) times higher IRR for NFDL injury rates when analyzed among the SIC dataset after adjusting for year and mine type. While the other categories of TWAMSHA in the fully adjusted model were not statistically significant, there was a general upward trend in their association with NFDL injury rates, as illustrated also in Figure 6.
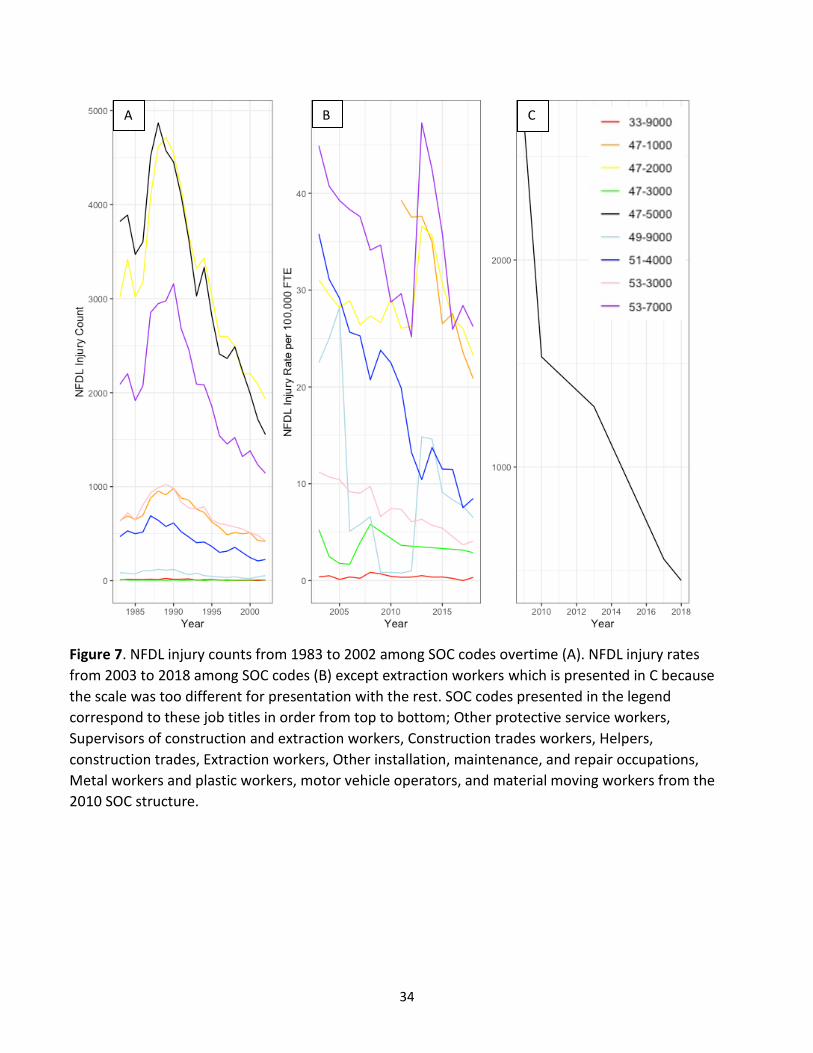
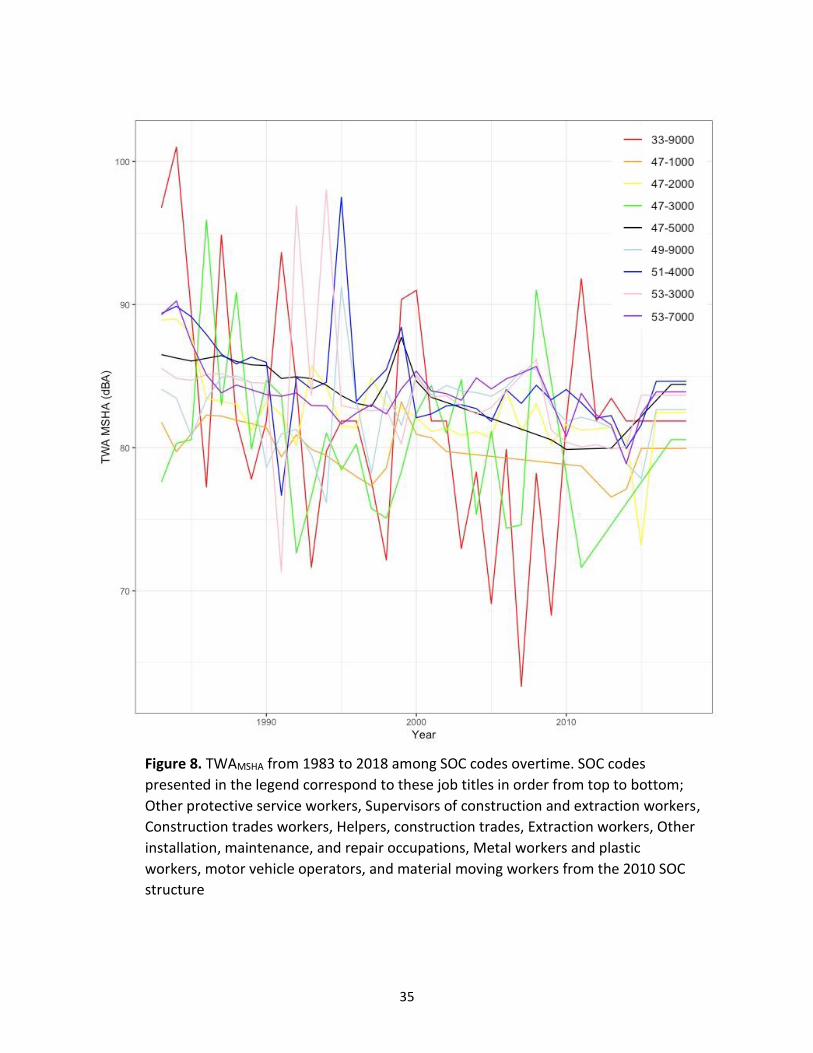
5.1.3 Noise and NFDL injury counts and rates among minor group SOC When classified by SOC code, NFDL injury counts prior to 2002 (Figure 7a) declined over time, as did NFDL injury rates from 2003 (Figure 7b) on. However, as seen in Figure 7c, rates among workers in SOC code 47-5000 (i.e., extraction workers) remain significantly higher than the rest of the SOC codes in the data. As shown in Figure 8, noise among minor SOC codes has exhibited a general but very slight overall decrease over time.
Figure 6: IRRs and 95% CIs by TWAMSHA category from Model 3 in Table 3.
34
A B C
Figure 7. NFDL injury counts from 1983 to 2002 among SOC codes overtime (A). NFDL injury rates
from 2003 to 2018 among SOC codes (B) except extraction workers which is presented in C because
the scale was too different for presentation with the rest. SOC codes presented in the legend
correspond to these job titles in order from top to bottom; Other protective service workers,
Supervisors of construction and extraction workers, Construction trades workers, Helpers,
construction trades, Extraction workers, Other installation, maintenance, and repair occupations,
Metal workers and plastic workers, motor vehicle operators, and material moving workers from the
2010 SOC structure.
35
Figure 8. TWAMSHA from 1983 to 2018 among SOC codes overtime. SOC codes
presented in the legend correspond to these job titles in order from top to bottom;
Other protective service workers, Supervisors of construction and extraction workers,
Construction trades workers, Helpers, construction trades, Extraction workers, Other
installation, maintenance, and repair occupations, Metal workers and plastic
workers, motor vehicle operators, and material moving workers from the 2010 SOC
structure

36
To assess the relationship between NFDL injury counts by SOC code and noise, three sequential negative binomial SOC-NFDL models were built using TWAMSHA (categorical or continuous), year, and minor SOC code. Table 4.1 (see Appendix B) contains all unadjusted models for counts from 1983 to 2002 and then for rates from 2003-2014. From 1983 to 2002 (Table 5), within the SOC-NFDL Unadjusted-83-02 model of TWAMSHA (categorical) levels of from 80 to <85 and ≥85 to <90 dBA were statistically significant and associated with substantially higher IRs, 6.39 (95% CI: 1.41, 60.64) and 9.03 (95% CI: 1.95, 86.4), respectively. From 2003 to 2014, the SOC-NFDL-Unadjusted-03-14 model of TWAMSHA (continuous) did not reach statistical significance.

37
Table 5. Negative binomial models for NFDL injury counts (1983-2002) among the SOC dataset
Statistic Model SOC-NFDL-Unadjusted-83-02
Model SOC-NFDL-1-83-02 Model SOC-NFDL-2-83-02
N 173 173 173 DI 567.47 515.51 1.73 AIC 105761.64 101503.84 2056.95 Variable IR LL UL IR LL UL IR LL UL
TWAMSHA <75 dBA (ref) 1.00 - - 1.00 - - 1.00 - - 75 to <80 dBA 1.23 0.23 12.46 1.24 0.25 10.09 1.14 0.80 1.59 80 to <85 dBA 6.39 1.41 60.64 6.49 1.51 54.03 1.07 0.77 1.47 85 to <90 dBA 9.03 1.95 86.42 7.63 1.72 64.35 0.97 0.69 1.35 90 to <95 dBA 1.53 0.22 17.58 1.39 0.21 14.01 0.84 0.55 1.27 95 to <100 dBA 1.82 0.23 21.72 1.69 0.23 17.72 1.06 0.72 1.54 ≥100 dBA 0.07 - 17.29 5.32 - 11.09 0.96 0.38 2.19 Year 0.96 0.94 0.99 0.95 0.94 0.96 Occupation
Construction Trade (ref) 1.00 - - Extraction 1.01 0.89 1.15 Helpers, Construction <0.01 <0.01 <0.01 Material Moving 0.63 0.56 0.71 Metal and Plastic 0.13 0.11 0.15 Motor Vehicle 0.22 0.19 0.25
Other Installers, Maintenance, and Repair
0.02 0.01 0.02
Other Protective Service <0.01 <0.01 <0.01 Supervisors of Construction and Extraction
0.20 0.17 0.23
*The dispersion index (DI) was derived from each respective quasi-poisson model
38
The fully adjusted SOC models (Model SOC-NFDL-2-83-0 and Model SOC-NFDL-2-03-14) performed best for NFDL injury counts or rates over the time period modelled, and had substantially lower AICs compared to the other models in their year groups (2056.95 and 739.13, respectively), highlighting the importance of controlling for occupation. However, none of the predictors in model SOC-NFDL-2-83-02 were statistically significant predictors of NFDL injury counts among the SOC dataset (Table 5). Analysis of the residual versus fitted values plot from the fully adjusted model SOC-NFDL-2-83-02 indicated that, while the residuals were randomly distributed about zero, there were clear gaps in the distribution, possibly due to the relatively low sample size (n = 173) in this model.
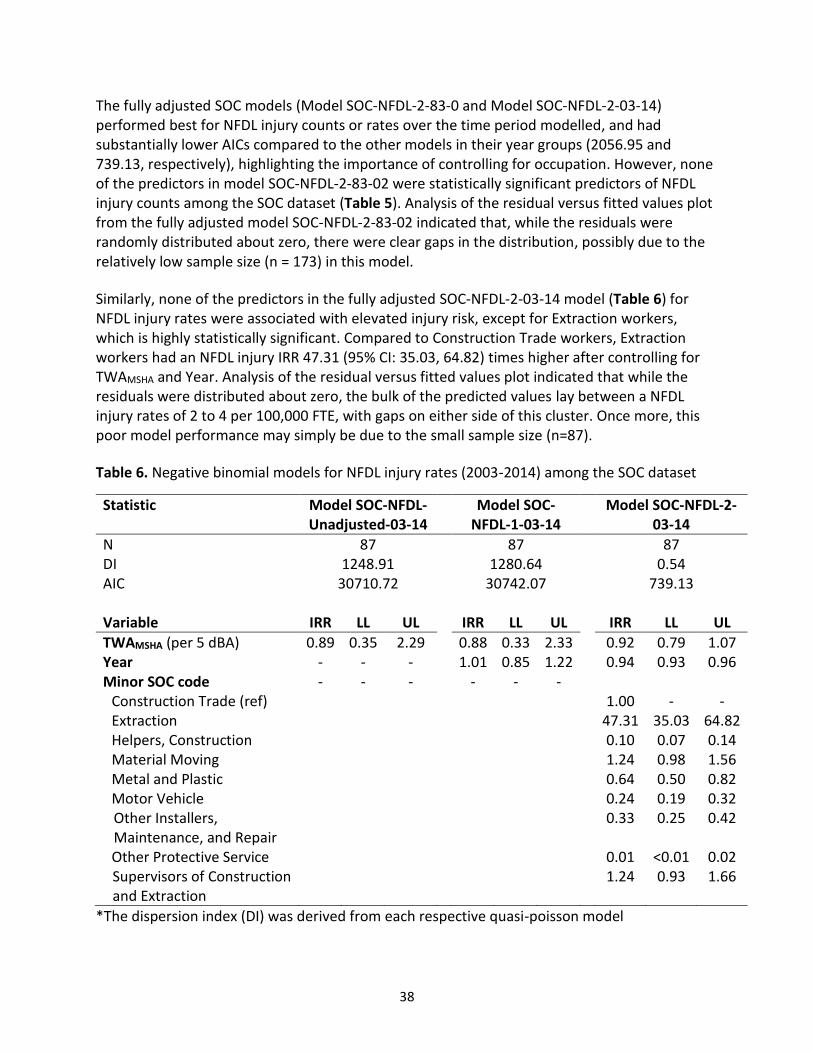
Similarly, none of the predictors in the fully adjusted SOC-NFDL-2-03-14 model (Table 6) for NFDL injury rates were associated with elevated injury risk, except for Extraction workers, which is highly statistically significant. Compared to Construction Trade workers, Extraction workers had an NFDL injury IRR 47.31 (95% CI: 35.03, 64.82) times higher after controlling for TWAMSHA and Year. Analysis of the residual versus fitted values plot indicated that while the residuals were distributed about zero, the bulk of the predicted values lay between a NFDL injury rates of 2 to 4 per 100,000 FTE, with gaps on either side of this cluster. Once more, this poor model performance may simply be due to the small sample size (n=87).
Table 6. Negative binomial models for NFDL injury rates (2003-2014) among the SOC dataset
Statistic Model SOC-NFDL- Unadjusted-03-14
Model SOC-NFDL-1-03-14
Model SOC-NFDL-2-03-14
N 87 87 87 DI 1248.91 1280.64 0.54 AIC 30710.72 30742.07 739.13 Variable IRR LL UL IRR LL UL IRR LL UL
TWAMSHA (per 5 dBA) 0.89 0.35 2.29 0.88 0.33 2.33 0.92 0.79 1.07 Year - - - 1.01 0.85 1.22 0.94 0.93 0.96 Minor SOC code - - - - - -
Construction Trade (ref) 1.00 - - Extraction 47.31 35.03 64.82 Helpers, Construction 0.10 0.07 0.14 Material Moving 1.24 0.98 1.56 Metal and Plastic 0.64 0.50 0.82 Motor Vehicle 0.24 0.19 0.32
Other Installers, Maintenance, and Repair
0.33 0.25 0.42
Other Protective Service 0.01 <0.01 0.02 Supervisors of Construction and Extraction
1.24 0.93 1.66
*The dispersion index (DI) was derived from each respective quasi-poisson model
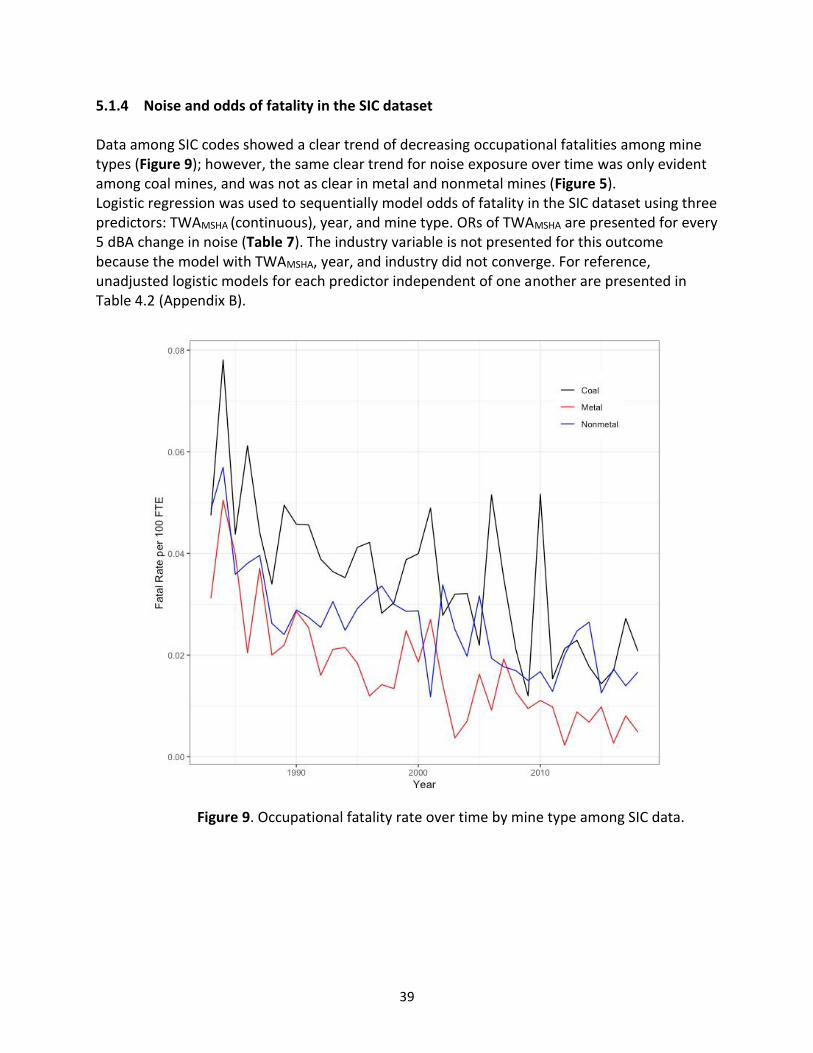
39
5.1.4 Noise and odds of fatality in the SIC dataset Data among SIC codes showed a clear trend of decreasing occupational fatalities among mine types (Figure 9); however, the same clear trend for noise exposure over time was only evident among coal mines, and was not as clear in metal and nonmetal mines (Figure 5). Logistic regression was used to sequentially model odds of fatality in the SIC dataset using three predictors: TWAMSHA (continuous), year, and mine type. ORs of TWAMSHA are presented for every 5 dBA change in noise (Table 7). The industry variable is not presented for this outcome because the model with TWAMSHA, year, and industry did not converge. For reference, unadjusted logistic models for each predictor independent of one another are presented in Table 4.2 (Appendix B).
Figure 9. Occupational fatality rate over time by mine type among SIC data.
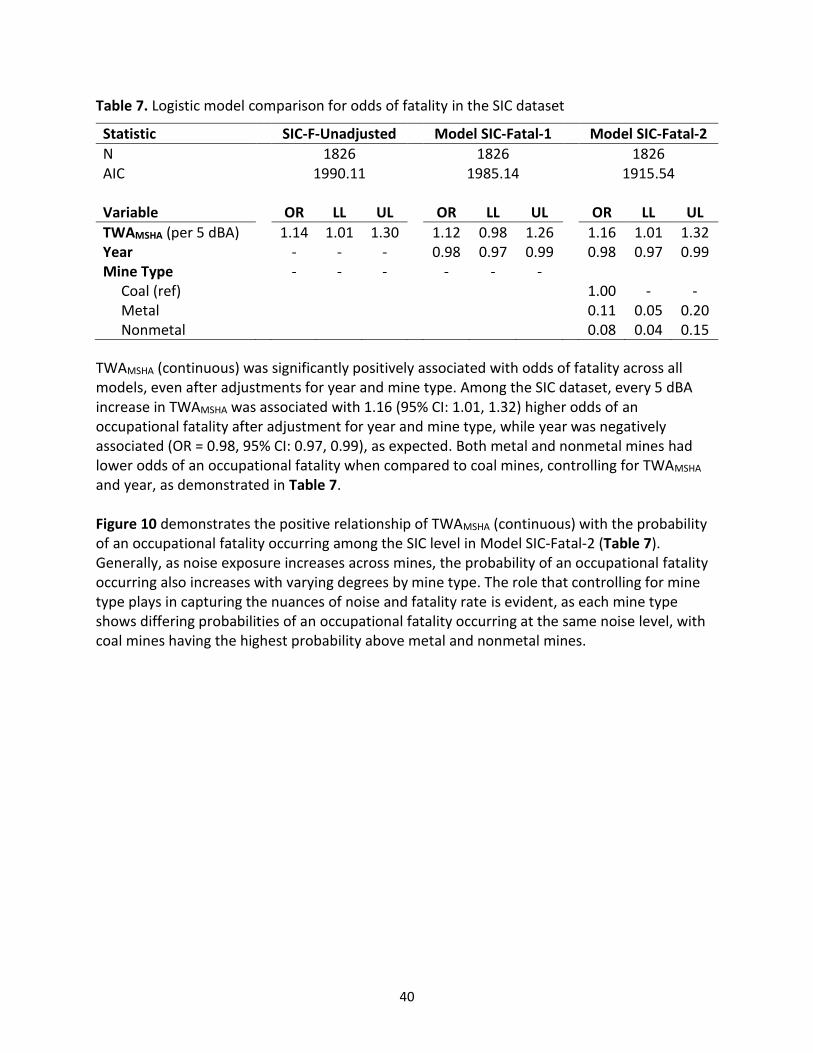
40
Table 7. Logistic model comparison for odds of fatality in the SIC dataset
Statistic SIC-F-Unadjusted Model SIC-Fatal-1 Model SIC-Fatal-2
N 1826 1826 1826 AIC 1990.11 1985.14 1915.54 Variable OR LL UL OR LL UL OR LL UL
TWAMSHA (per 5 dBA) 1.14 1.01 1.30 1.12 0.98 1.26 1.16 1.01 1.32 Year - - - 0.98 0.97 0.99 0.98 0.97 0.99 Mine Type - - - - - - Coal (ref) 1.00 - - Metal 0.11 0.05 0.20 Nonmetal 0.08 0.04 0.15
TWAMSHA (continuous) was significantly positively associated with odds of fatality across all models, even after adjustments for year and mine type. Among the SIC dataset, every 5 dBA increase in TWAMSHA was associated with 1.16 (95% CI: 1.01, 1.32) higher odds of an occupational fatality after adjustment for year and mine type, while year was negatively associated (OR = 0.98, 95% CI: 0.97, 0.99), as expected. Both metal and nonmetal mines had lower odds of an occupational fatality when compared to coal mines, controlling for TWAMSHA and year, as demonstrated in Table 7. Figure 10 demonstrates the positive relationship of TWAMSHA (continuous) with the probability of an occupational fatality occurring among the SIC level in Model SIC-Fatal-2 (Table 7). Generally, as noise exposure increases across mines, the probability of an occupational fatality occurring also increases with varying degrees by mine type. The role that controlling for mine type plays in capturing the nuances of noise and fatality rate is evident, as each mine type shows differing probabilities of an occupational fatality occurring at the same noise level, with coal mines having the highest probability above metal and nonmetal mines.

41
5.1.5 Noise and odds of fatality in the SOC dataset There was a clear decrease in occupational fatality counts over time by SOC code prior to 2002 (Figure 11a), and this trend continued from 2003 forward (Figure 11b). However, as seen in Figure 11c, rates among SOC code 47-5000 (i.e., extraction workers) remain significantly higher than the other SOC codes. As shown previously in Figure 8, noise among minor SOC codes exhibited a general but very slight decrease over time.
Figure 10: Scatterplot of TWAMSHA levels (dBA) to predicted probability of an occupational fatality derived from Model SIC-Fatal-2 (Table 6), stratified by mine type.

42
Odds of an occupational fatality in the SOC dataset were modelled using three predictors: TWAMSHA (continuous), year, and major SOC groupings, as the inclusion of minor SOC groups prevented convergence in the fully adjusted model. ORs of TWAMSHA are presented for every 5 dBA change in noise levels. Since a count of zero occupational fatalities in a year is equivalent to a fatality rate of zero, the entirety of the SOC dataset was utilized for the logistic regression, rather than sub-setting years after 2003. For reference, unadjusted logistic models for each predictor independent of one another are presented in Table 4.3 (Appendix B).
A B C
Figure 11. Occupational fatality counts from 1983 to 2002 among SOC codes overtime (A). Occupational
fatality rates from 2003 to 2018 among SOC codes (B) except extraction workers which is presented in C
due to significant scale differences from the rest. SOC codes presented in the legend correspond to these
job titles in order from top to bottom; Other protective service workers, Supervisors of construction and
extraction workers, Construction trades workers, Helpers, construction trades, Extraction workers, Other
installation, maintenance, and repair occupations, Metal workers and plastic workers, motor vehicle
operators, and material moving workers from the 2010 SOC structure.
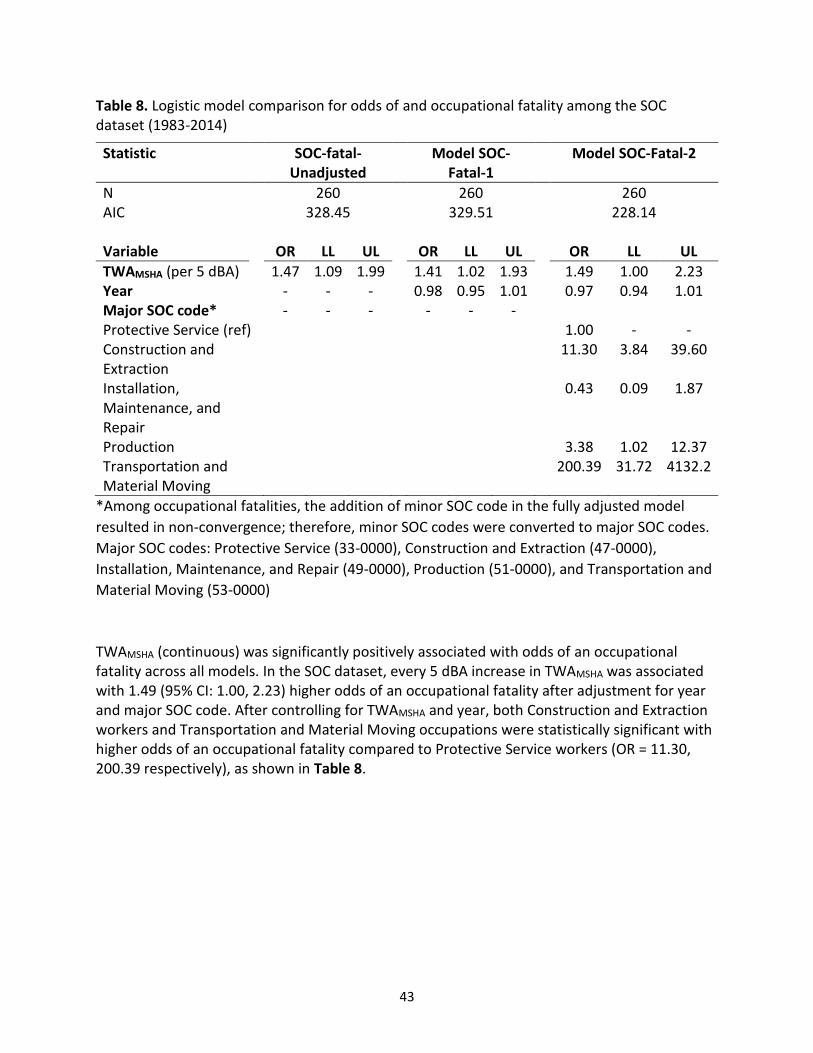
43
Table 8. Logistic model comparison for odds of and occupational fatality among the SOC dataset (1983-2014)
Statistic SOC-fatal-Unadjusted
Model SOC-Fatal-1
Model SOC-Fatal-2
N 260 260 260 AIC 328.45 329.51 228.14 Variable OR LL UL OR LL UL OR LL UL
TWAMSHA (per 5 dBA) 1.47 1.09 1.99 1.41 1.02 1.93 1.49 1.00 2.23 Year - - - 0.98 0.95 1.01 0.97 0.94 1.01 Major SOC code* - - - - - - Protective Service (ref) 1.00 - - Construction and Extraction
11.30 3.84 39.60
Installation, Maintenance, and Repair
0.43 0.09 1.87
Production 3.38 1.02 12.37 Transportation and Material Moving
200.39 31.72 4132.2
*Among occupational fatalities, the addition of minor SOC code in the fully adjusted model
resulted in non-convergence; therefore, minor SOC codes were converted to major SOC codes.
Major SOC codes: Protective Service (33-0000), Construction and Extraction (47-0000),
Installation, Maintenance, and Repair (49-0000), Production (51-0000), and Transportation and
Material Moving (53-0000)
TWAMSHA (continuous) was significantly positively associated with odds of an occupational fatality across all models. In the SOC dataset, every 5 dBA increase in TWAMSHA was associated with 1.49 (95% CI: 1.00, 2.23) higher odds of an occupational fatality after adjustment for year and major SOC code. After controlling for TWAMSHA and year, both Construction and Extraction workers and Transportation and Material Moving occupations were statistically significant with higher odds of an occupational fatality compared to Protective Service workers (OR = 11.30, 200.39 respectively), as shown in Table 8.

44
Figure 12 illustrates the positive relationship between TWAMSHA (continuous) and the probability of an occupational fatality occurring for the major SOC level from model SOC-Fatal-2. Consistent with the model in Table 7, Transportation and Material Moving workers (SOC: 53-0000) have the highest probability of an occupational fatality across all occupations. Overall, higher noise exposure for in the SOC dataset was associated with increased probability of an occupational fatality occurring for each of the major SOC codes.
Figure 12. Scatterplot of predicted probability of an occupational fatality derived
from Model SOC-Fatal-2 (Table 7) to TWAMSHA levels (dBA), stratified by mine type.
Major SOC codes presented in the legend are the following job title groups from
top to bottom: Protective Service, Construction and Extraction, Installation,
Maintenance, and Repair, Production, and Transportation and Material Moving.
45
5.1.6 Historic noise, injury, and fatality analysis at 10 Midwestern mines Measured TWAMSHA from 10 Midwestern mines (described in more detail under Specific Aim 2) are presented in Table 9 as means with standard deviations. Noise measurements collected previously by MSHA at each of the mines visited are also presented as means from all years 1983 to 2018 by mine. All reported noise measurements from MSHA are presented by year by mine visited in separate tables by industry in Appendix B (Tables 3.1.1, 3.1.2 and 3.2.1). Mean differences and SE are reported from pairwise, two-sided t-tests between our measured TWAMSHA and MSHA AL and PEL measurements are presented in Table 9. On average, noise measured across the ten mines visited during the summer of 2019 was lower than MSHA’s 1983-2018 noise measurements using both the AL and PEL standards (by -3.4 and -0.5 dBA, respectively). These differences are consistent with the notion that MSHA measures worst-case scenario noise rather than typical noise exposures at a mine, as were captured in our study.

46
Table 9. Mean differences in TWAMSHA noise levels (dBA) noise measured for 10 Midwestern mines and MSHA AL and PEL noise measurements collected between 1983 and 2018 by MSHA inspectors at the same mines
TWAMSHA (dBA) (measured 2019)
MSHA AL (dBA, measured 1983-2018) MSHA PEL (dBA, measured 1983-2018)
N Mean SD N Mean SD Mean Diff
SE p-value N Mean SD Mean Diff
SE p-value
Total 205 80.2 6.0 96 83.6 5.0 -3.4 0.5 <0.001 96 80.7 6.5 -0.5 0.7 0.279 Company 1 97 83.4 5.7 49 87.0 4.1 -3.6 0.8 <0.001 49 84.7 5.3 -1.3 1.0 0.196
Lime 1 9 81.9 5.4 14 85.8 3.4 -3.9 2.0 0.076 14 83.0 4.3 -1.1 2.1 0.609 Lime 2 16 80.9 4.1 8 85.0 2.5 -4.1 1.4 0.007 8 82.0 2.9 -1.1 1.4 0.461 Limestone 1 29 86.8 6.1 6 85.9 5.8 0.9 2.6 0.732 6 82.7 8.3 4.1 3.6 0.298 Limestone 2 9 84.2 5.9 6 89.4 2.6 -5.2 2.2 0.039 6 87.7 3.6 -3.5 2.5 0.172 Limestone 3 14 84.4 3.3 7 86.2 4 -1.8 1.8 0.335 7 84.8 3.7 -0.4 1.7 0.830 Limestone 4 20 80.1 5.1 8 90.9 3.5 -10.8 1.7 <0.001 8 89.2 5.8 -9.1 2.3 0.002
Company 2 108 77.4 4.6 47 80.8 3.8 -3.4 0.7 <0.001 47 77.3 5.4 0.1 0.9 0.976 Sand 1 24 79.5 4 13 82.2 3.1 -2.7 1.2 0.031 13 78.0 4.6 1.5 1.5 0.345 Sand 2 37 75.6 5.2 12 81.3 3.4 -5.7 1.3 <0.001 12 77.2 5.4 -1.6 1.8 0.384 Sand 3 44 77.9 3.9 13 79.5 4.6 -1.6 1.4 0.257 13 78.1 4.8 -0.2 1.5 0.910 Sand 4 3 76.2 1.8 9 78.9 3.9 -2.7 1.7 0.147 9 75.7 7.3 0.5 2.6 0.844
*Two-sided t-test
MSHA AL noise measurements were used as TWAMSHA for all of the models run on the MV dataset. Once more, NFDL injury rates were modelled to see if there was an association between noise exposure and injury risk among miners at the mines visited. For NFDL injury rates among the mines visited, four predictors were used to build MV-NFDL negative binomial models: TWAMSHA (categorical), year, S&S rate, and mine industry (i.e. Lime, Limestone, and Sand). Appendix B Table 4.1 contains statistics on each of the unadjusted models (i.e. N, AIC, DI) along with the IRRs and 95% CI of each predictor. Within the unadjusted model of TWAMSHA (categorical) as the predictor of NFDL injury rates, no classes were statistically significantly associated with higher IRRs. Table 10 below contains statistics of the model comparisons from the bivariate model TWAMSHA (categorical) to the fully adjusted model, Model MV-NFDL-3.
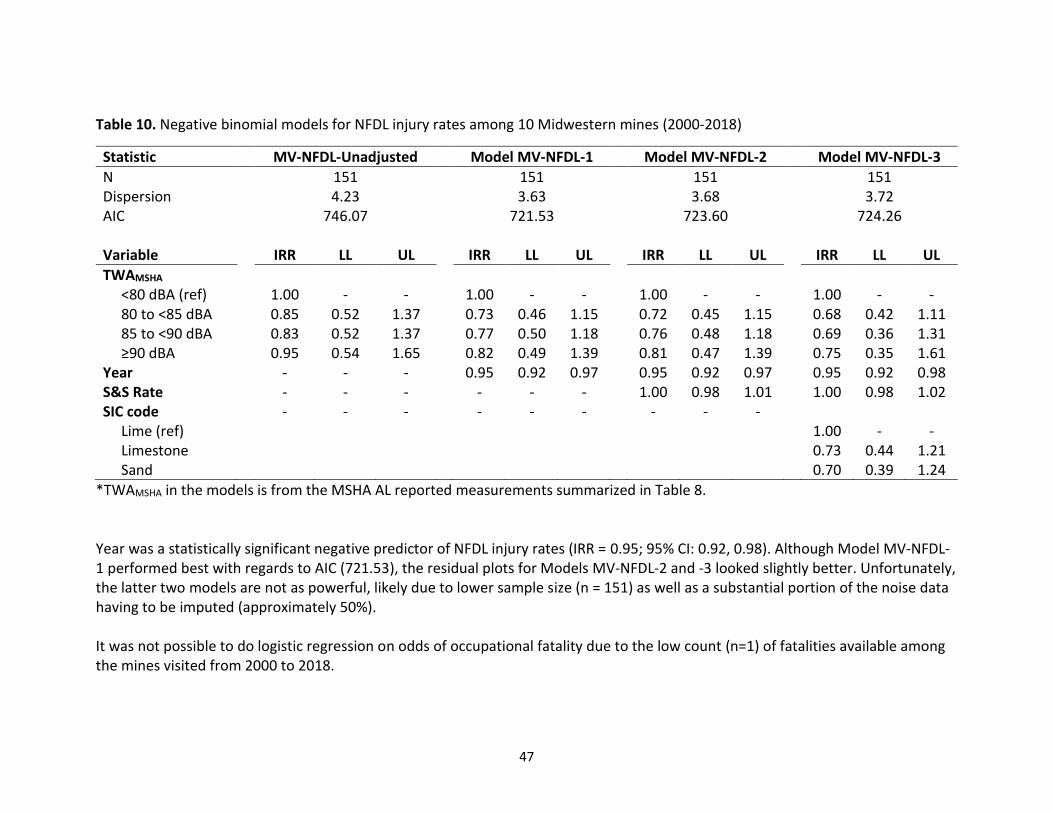
47
Table 10. Negative binomial models for NFDL injury rates among 10 Midwestern mines (2000-2018)
Statistic MV-NFDL-Unadjusted Model MV-NFDL-1 Model MV-NFDL-2 Model MV-NFDL-3
N 151 151 151 151 Dispersion 4.23 3.63 3.68 3.72 AIC 746.07 721.53 723.60 724.26 Variable IRR LL UL IRR LL UL IRR LL UL IRR LL UL
TWAMSHA <80 dBA (ref) 1.00 - - 1.00 - - 1.00 - - 1.00 - - 80 to <85 dBA 0.85 0.52 1.37 0.73 0.46 1.15 0.72 0.45 1.15 0.68 0.42 1.11 85 to <90 dBA 0.83 0.52 1.37 0.77 0.50 1.18 0.76 0.48 1.18 0.69 0.36 1.31 ≥90 dBA 0.95 0.54 1.65 0.82 0.49 1.39 0.81 0.47 1.39 0.75 0.35 1.61 Year - - - 0.95 0.92 0.97 0.95 0.92 0.97 0.95 0.92 0.98 S&S Rate - - - - - - 1.00 0.98 1.01 1.00 0.98 1.02 SIC code - - - - - - - - - Lime (ref) 1.00 - - Limestone 0.73 0.44 1.21 Sand 0.70 0.39 1.24
*TWAMSHA in the models is from the MSHA AL reported measurements summarized in Table 8. Year was a statistically significant negative predictor of NFDL injury rates (IRR = 0.95; 95% CI: 0.92, 0.98). Although Model MV-NFDL-1 performed best with regards to AIC (721.53), the residual plots for Models MV-NFDL-2 and -3 looked slightly better. Unfortunately, the latter two models are not as powerful, likely due to lower sample size (n = 151) as well as a substantial portion of the noise data having to be imputed (approximately 50%). It was not possible to do logistic regression on odds of occupational fatality due to the low count (n=1) of fatalities available among the mines visited from 2000 to 2018.
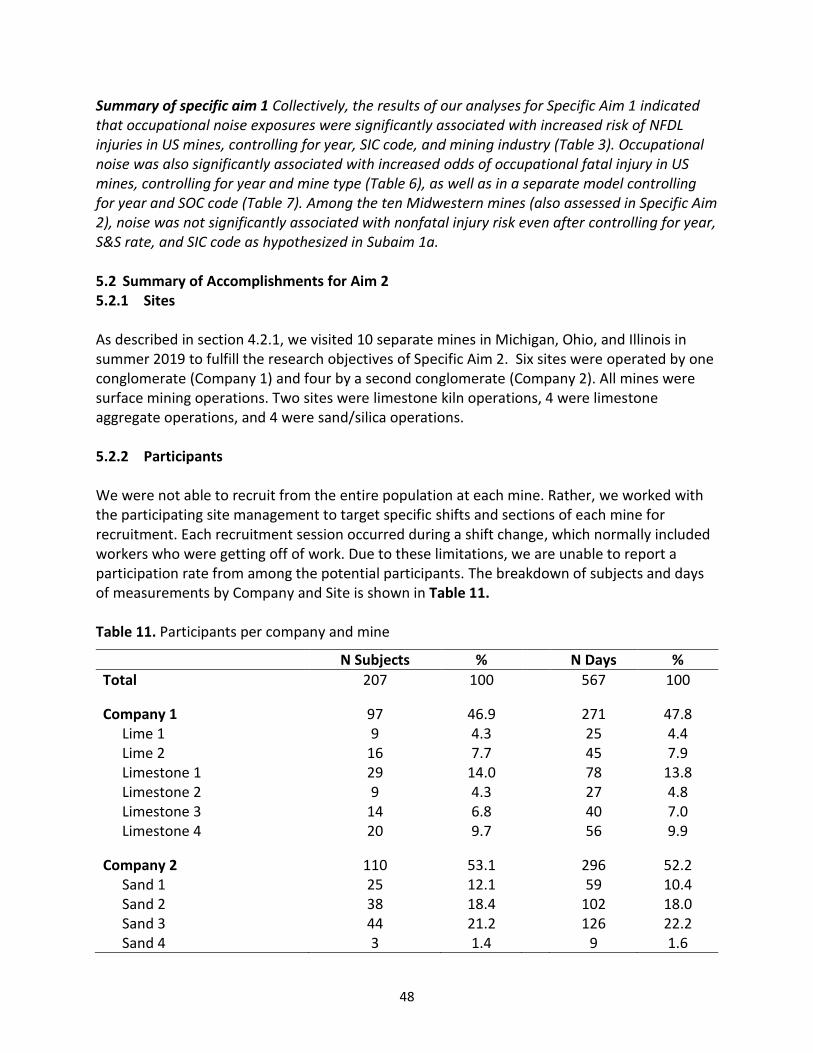
48
Summary of specific aim 1 Collectively, the results of our analyses for Specific Aim 1 indicated that occupational noise exposures were significantly associated with increased risk of NFDL injuries in US mines, controlling for year, SIC code, and mining industry (Table 3). Occupational noise was also significantly associated with increased odds of occupational fatal injury in US mines, controlling for year and mine type (Table 6), as well as in a separate model controlling for year and SOC code (Table 7). Among the ten Midwestern mines (also assessed in Specific Aim 2), noise was not significantly associated with nonfatal injury risk even after controlling for year, S&S rate, and SIC code as hypothesized in Subaim 1a. 5.2 Summary of Accomplishments for Aim 2 5.2.1 Sites As described in section 4.2.1, we visited 10 separate mines in Michigan, Ohio, and Illinois in summer 2019 to fulfill the research objectives of Specific Aim 2. Six sites were operated by one conglomerate (Company 1) and four by a second conglomerate (Company 2). All mines were surface mining operations. Two sites were limestone kiln operations, 4 were limestone aggregate operations, and 4 were sand/silica operations. 5.2.2 Participants We were not able to recruit from the entire population at each mine. Rather, we worked with the participating site management to target specific shifts and sections of each mine for recruitment. Each recruitment session occurred during a shift change, which normally included workers who were getting off of work. Due to these limitations, we are unable to report a participation rate from among the potential participants. The breakdown of subjects and days of measurements by Company and Site is shown in Table 11. Table 11. Participants per company and mine
N Subjects % N Days %
Total 207 100 567 100
Company 1 97 46.9 271 47.8 Lime 1 9 4.3 25 4.4 Lime 2 16 7.7 45 7.9 Limestone 1 29 14.0 78 13.8 Limestone 2 9 4.3 27 4.8 Limestone 3 14 6.8 40 7.0 Limestone 4 20 9.7 56 9.9
Company 2 110 53.1 296 52.2 Sand 1 25 12.1 59 10.4 Sand 2 38 18.4 102 18.0 Sand 3 44 21.2 126 22.2 Sand 4 3 1.4 9 1.6

49
Data collection and analysis 5.2.2.1 Baseline demographics and work history
Our baseline survey was at least partially completed by 200 of the 207 participants. Five of the participants participated twice, contributing data for 3 shifts each time; these participants were not given the survey the second time that they participated. On average participants in our prospective Specific Aim 2 data collection were 40.5 (±12.2) years old, worked 48.6 hours per week, were at least overweight (BMI ≥25), had been in their current job for 7.5 (±7.9) years, and in the industry for 11.6 (±9.7) years as reported in Table 12. Age, years in current job, and years in industry were significantly correlated (Spearman correlations >0.6, p<0.0001). Table 12. Participant demographics from baseline survey (N = 202 participants)
Variable N Mean SD Median IQR Min - Max
Age (years) 197 40.5 12.2 39 18 18 - 66 Weight (lbs) 193 205.8 38.3 200 50 100 - 325 Height (inches) 195 70.4 2.6 70 3 62 - 78 BMI (lbs/in2) 193 29.2 5.0 28.3 6.2 17.7- 46.6 Current job time (years) 200 7.5 7.9 4.4 8 0.04 - 43 Worked per week (hours) 198 48.6 9.6 48 13 20 - 84 Industry time (years) 199 11.6 9.7 8.2 13.2 0.08 - 43
5.2.2.2 Reported accidents, near-misses, and injuries
Among the 202 unique participants, 567 workshifts were measured for a total of 4,432 measured hours of noise exposure. Across these 567 shifts, five incidents on five shifts (0.88% of total shifts) occurred across the ten mines. These incidents consisted of one injury, two narrow misses, and two accidents. The injury occurred during a night shift, in which the participant’s TWAMSHA was measured above the PEL of 90 dBA. Unfortunately, none of the NASA TLX demands were reported for that particular shift, although a little stress and moderate sleep was reported. Across the other incidents, two TWANIOSH noise exposures were above the NIOSH REL of 85 dBA and one near miss was associated with a moderate level of frustration (9.6). Further description of the incidents along with noise measurements, HPD use, and other factors are reported Table 13.
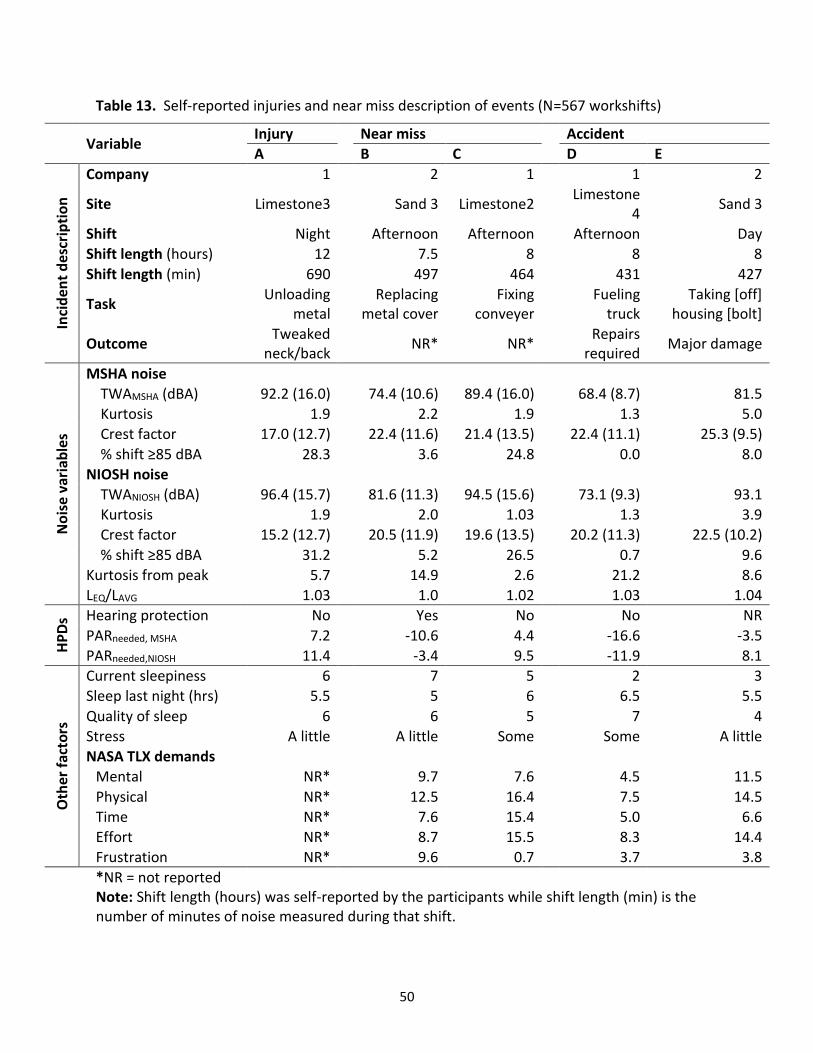
50
Table 13. Self-reported injuries and near miss description of events (N=567 workshifts)
Variable
Injury Near miss Accident
A B C D E
Inci
den
t d
escr
ipti
on
Company 1 2 1 1 2
Site Limestone3 Sand 3 Limestone2 Limestone
4 Sand 3
Shift Night Afternoon Afternoon Afternoon Day
Shift length (hours) 12 7.5 8 8 8
Shift length (min) 690 497 464 431 427
Task Unloading
metal
Replacing metal cover
Fixing conveyer
Fueling
truck Taking [off]
housing [bolt]
Outcome Tweaked
neck/back NR* NR*
Repairs required
Major damage
No
ise
var
iab
les
MSHA noise
TWAMSHA (dBA) 92.2 (16.0) 74.4 (10.6) 89.4 (16.0) 68.4 (8.7) 81.5
Kurtosis 1.9 2.2 1.9 1.3 5.0
Crest factor 17.0 (12.7) 22.4 (11.6) 21.4 (13.5) 22.4 (11.1) 25.3 (9.5)
% shift ≥85 dBA 28.3 3.6 24.8 0.0 8.0
NIOSH noise
TWANIOSH (dBA) 96.4 (15.7) 81.6 (11.3) 94.5 (15.6) 73.1 (9.3) 93.1
Kurtosis 1.9 2.0 1.03 1.3 3.9
Crest factor 15.2 (12.7) 20.5 (11.9) 19.6 (13.5) 20.2 (11.3) 22.5 (10.2)
% shift ≥85 dBA 31.2 5.2 26.5 0.7 9.6
Kurtosis from peak 5.7 14.9 2.6 21.2 8.6
LEQ/LAVG 1.03 1.0 1.02 1.03 1.04
HP
Ds Hearing protection No Yes No No NR
PARneeded, MSHA 7.2 -10.6 4.4 -16.6 -3.5
PARneeded,NIOSH 11.4 -3.4 9.5 -11.9 8.1
Oth
er f
acto
rs
Current sleepiness 6 7 5 2 3
Sleep last night (hrs) 5.5 5 6 6.5 5.5
Quality of sleep 6 6 5 7 4
Stress A little A little Some Some A little
NASA TLX demands
Mental NR* 9.7 7.6 4.5 11.5
Physical NR* 12.5 16.4 7.5 14.5
Time NR* 7.6 15.4 5.0 6.6
Effort NR* 8.7 15.5 8.3 14.4
Frustration NR* 9.6 0.7 3.7 3.8
*NR = not reported Note: Shift length (hours) was self-reported by the participants while shift length (min) is the number of minutes of noise measured during that shift.
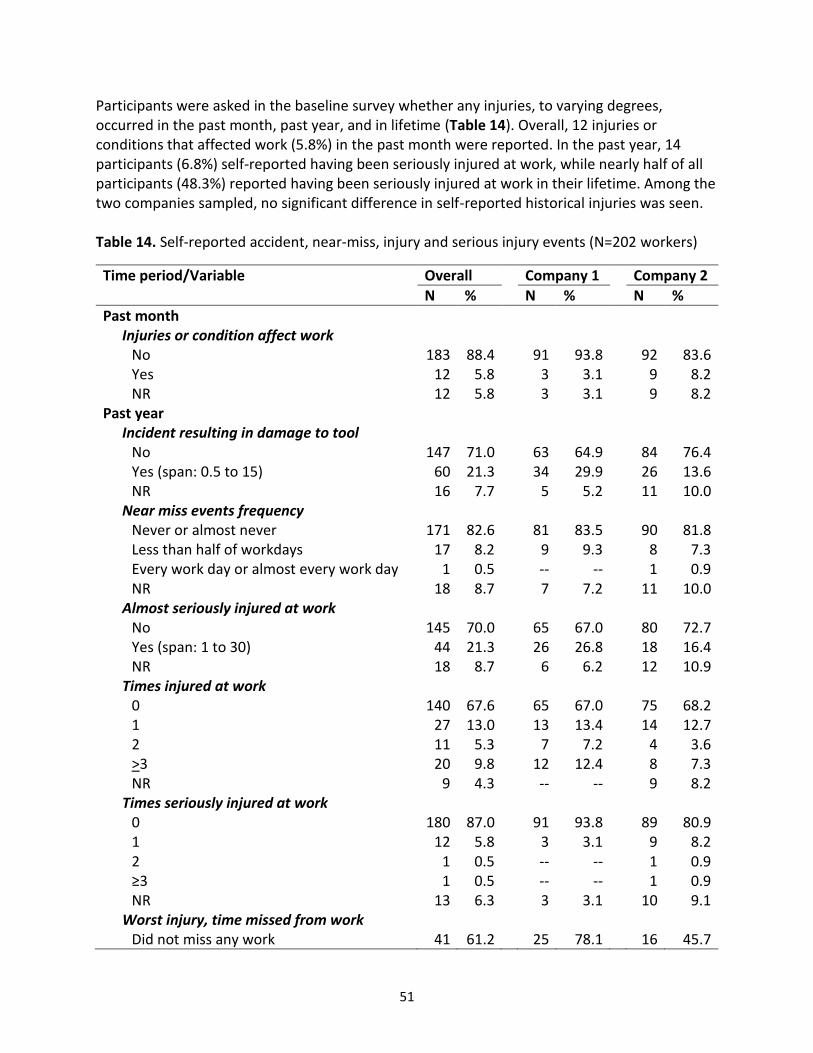
51
Participants were asked in the baseline survey whether any injuries, to varying degrees, occurred in the past month, past year, and in lifetime (Table 14). Overall, 12 injuries or conditions that affected work (5.8%) in the past month were reported. In the past year, 14 participants (6.8%) self-reported having been seriously injured at work, while nearly half of all participants (48.3%) reported having been seriously injured at work in their lifetime. Among the two companies sampled, no significant difference in self-reported historical injuries was seen. Table 14. Self-reported accident, near-miss, injury and serious injury events (N=202 workers)
Time period/Variable Overall Company 1 Company 2
N % N % N %
Past month Injuries or condition affect work
No 183 88.4 91 93.8 92 83.6 Yes 12 5.8 3 3.1 9 8.2 NR 12 5.8 3 3.1 9 8.2
Past year Incident resulting in damage to tool
No 147 71.0 63 64.9 84 76.4 Yes (span: 0.5 to 15) 60 21.3 34 29.9 26 13.6 NR 16 7.7 5 5.2 11 10.0
Near miss events frequency Never or almost never 171 82.6 81 83.5 90 81.8 Less than half of workdays 17 8.2 9 9.3 8 7.3 Every work day or almost every work day 1 0.5 -- -- 1 0.9 NR 18 8.7 7 7.2 11 10.0
Almost seriously injured at work No 145 70.0 65 67.0 80 72.7 Yes (span: 1 to 30) 44 21.3 26 26.8 18 16.4 NR 18 8.7 6 6.2 12 10.9
Times injured at work 0 140 67.6 65 67.0 75 68.2 1 27 13.0 13 13.4 14 12.7 2 11 5.3 7 7.2 4 3.6 >3 20 9.8 12 12.4 8 7.3 NR 9 4.3 -- -- 9 8.2
Times seriously injured at work 0 180 87.0 91 93.8 89 80.9 1 12 5.8 3 3.1 9 8.2 2 1 0.5 -- -- 1 0.9 ≥3 1 0.5 -- -- 1 0.9 NR 13 6.3 3 3.1 10 9.1
Worst injury, time missed from work Did not miss any work 41 61.2 25 78.1 16 45.7

52
Time period/Variable Overall Company 1 Company 2
N % N % N % Could not perform regular duties 1 1.5 -- -- 1 2.9 Missed some work 5 7.5 -- -- 5 14.3 NR 20 29.8 7 21.9 13 37.1
Lifetime Times seriously injured at work
0 93 44.9 51 52.6 42 38.2 1 35 16.9 14 14.4 21 19.1 2 29 14.0 11 11.3 18 16.4 >3 36 17.4 17 17.5 19 17.3 NR 14 6.8 4 4.1 10 9.1
*NR = not reported
5.2.2.3 Self-reported and measured noise exposure metrics and their relationship with accidents, near-misses, and injuries
Due to equipment and software malfunctions as well as shifts terminating early the number of valid noise measurements is lower than the number of shift measurements attempted, hence the variable numbers in Table 15. Overexposures to noise were noted; based on TWAMSHA,
16.5% of measured shifts were ≥85 dBA, while 4.8% were ≥90 dBA. These percentages were higher using the TWANIOSH standard, with 44.4% of shifts ≥85 dBA and 18.3% ≥90 dBA. At the person level, 1 in 5 miners sampled experienced average TWAMSHA noise levels ≥85 dBA and 1 in 20 experienced average noise levels ≥90 dBA on average when measured using MSHA criteria (data not shown). Using the NIOSH criteria, 1 in 2 participants experienced average TWANIOSH noise levels ≥85 dBA and more than 1 in 5 experienced them ≥90 dBA (data not shown). On average, minutes in a shift spent above ≥85 dBA and ≥90 dBA were higher among participants at Company 1 than at Company 2. Notably, Company 2 had no persons nor shifts that experienced a TWAMSHA ≥90 dBA while Company 2 has 12 such measurements. These differences in noise exposure levels could be industry dependent, as all mines in Company 1 were either lime or limestone and all Company 2 mines were sand mines. However, these differences could be due to other structural differences.

53
Table 15. Personal noise exposure metrics (N=202 participants, 567 shifts, 265,918 minutes)
By shift Overall Company 1 Company 2
N Mean SD N Mean SD N Mean SD
TWA MSHA Crest factor 539 17.7 4.2 261 17.6 3.5 278 17.8 4.8 Kurtosis 539 2.5 1.4 261 2.3 0.9 278 2.6 1.7 LAVG (dBA) 539 79.4 6.3 261 82.4 6.2 278 76.6 4.9 TWA (dBA) 539 79.4 6.3 261 82.2 6.3 278 76.7 5.1
TWA NIOSH Crest factor 547 15.7 4.2 261 15.8 3.5 286 15.7 4.7 Kurtosis 547 2.6 1.3 261 2.4 1.0 286 2.7 1.6 LEQ (dBA) 547 84.6 6.3 261 87.8 6.2 286 81.7 4.8 TWA (dBA) 547 84.6 6.3 261 87.7 6.2 286 81.7 4.8
Peak kurtosis 546 28.2 56.5 261 14.1 24.1 285 41.1 72.5 Variability (LEQ/LAVG) 547 1.01 0.12 261 1.03 0.01 286 1.00 0.17 By person N Mean SD N Mean SD N Mean SD
TWA MSHA Crest factor 205 17.7 3.8 97 17.7 2.9 108 17.6 4.6 Kurtosis 205 2.5 1.1 97 2.3 0.6 108 2.7 1.4 LAVG (dBA) 205 79.3 5.4 97 82.3 5.0 108 76.7 4.3 TWA (dBA) 205 80.2 5.9 97 83.4 5.7 108 77.4 4.6
% min >85 dBA 196 14.8 14.8 90 21.0 16.0 106 9.6 11.4 % min >90 dBA 196 6.8 10.1 90 11.7 12.7 106 2.6 3.6
TWA NIOSH Crest factor 206 15.8 3.7 97 15.8 2.8 109 15.7 4.4 Kurtosis 206 2.6 1.1 97 2.4 0.7 109 2.7 1.3 LEQ (dBA) 206 84.5 5.4 97 87.7 5.0 109 81.7 4.1 TWA (dBA) 206 85.5 6.0 97 89.9 5.7 109 82.4 4.3
% min >85 dBA 196 18.9 15.8 90 25.1 16.8 106 13.7 12.8 % min >90 dBA 196 8.9 10.8 90 14.2 13.4 106 4.4 4.7
Peak kurtosis 206 30.2 60.0 97 14.3 19.3 109 44.3 78.0 Variability (LEQ/LAVG) 205 1.07 0.02 97 1.07 0.02 108 1.06 0.02
Bivariate logistic regression was performed to model self-reported accident, near-miss, and
injury outcomes using two predictors: years worked in high noise and self-reported frequency
of high noise exposure at work (Table 16). Participants who reported spending most of their
time in high noise had 3.89 higher odds of a self-reported accident occurring in the past year
compared to those who were exposed to high noise a little of the time, controlling for the years
worked in high noise, and 4.27 higher odds of a self-reported near-miss occurring in the past
year compared to those who spend a little of their time in high noise.
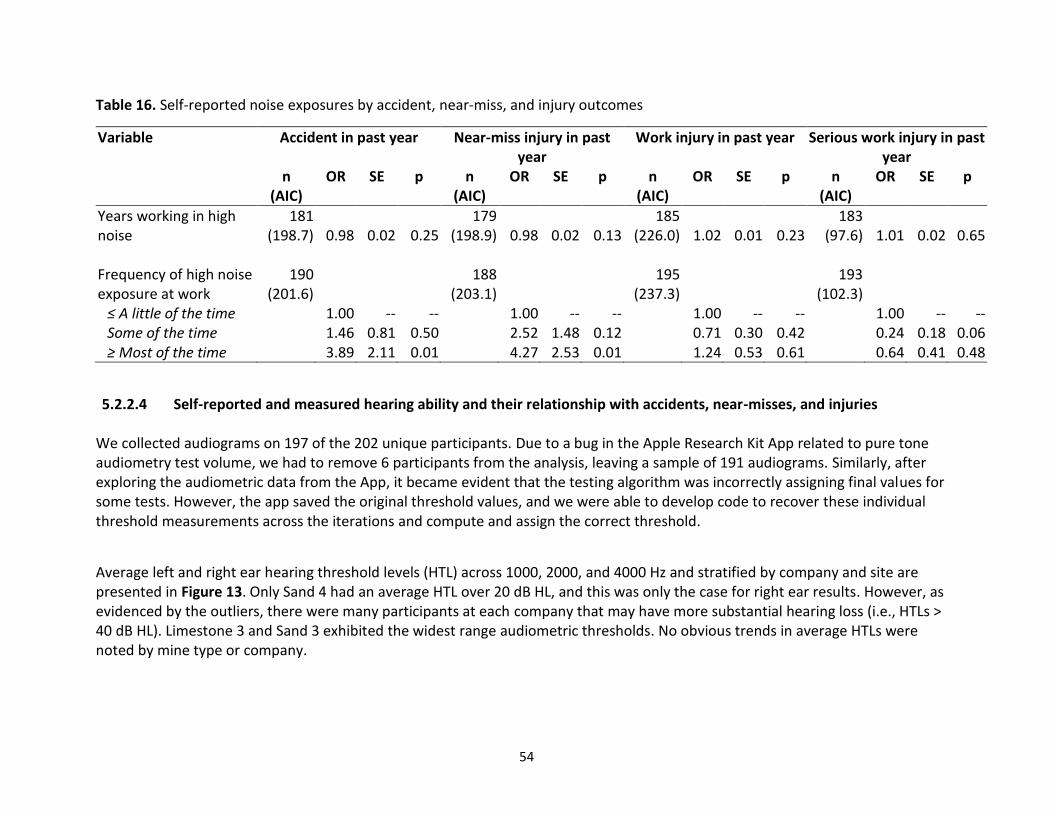
54
Table 16. Self-reported noise exposures by accident, near-miss, and injury outcomes
Variable Accident in past year Near-miss injury in past year
Work injury in past year Serious work injury in past year
n (AIC)
OR SE p n (AIC)
OR SE p n (AIC)
OR SE p n (AIC)
OR SE p
Years working in high noise
181 (198.7) 0.98 0.02 0.25
179 (198.9) 0.98 0.02 0.13
185 (226.0) 1.02 0.01 0.23
183 (97.6) 1.01 0.02 0.65
Frequency of high noise exposure at work
190 (201.6)
188 (203.1)
195 (237.3)
193 (102.3)
≤ A little of the time 1.00 -- -- 1.00 -- -- 1.00 -- -- 1.00 -- -- Some of the time 1.46 0.81 0.50 2.52 1.48 0.12 0.71 0.30 0.42 0.24 0.18 0.06 ≥ Most of the time 3.89 2.11 0.01 4.27 2.53 0.01 1.24 0.53 0.61 0.64 0.41 0.48
5.2.2.4 Self-reported and measured hearing ability and their relationship with accidents, near-misses, and injuries We collected audiograms on 197 of the 202 unique participants. Due to a bug in the Apple Research Kit App related to pure tone audiometry test volume, we had to remove 6 participants from the analysis, leaving a sample of 191 audiograms. Similarly, after exploring the audiometric data from the App, it became evident that the testing algorithm was incorrectly assigning final values for some tests. However, the app saved the original threshold values, and we were able to develop code to recover these individual threshold measurements across the iterations and compute and assign the correct threshold.
Average left and right ear hearing threshold levels (HTL) across 1000, 2000, and 4000 Hz and stratified by company and site are presented in Figure 13. Only Sand 4 had an average HTL over 20 dB HL, and this was only the case for right ear results. However, as evidenced by the outliers, there were many participants at each company that may have more substantial hearing loss (i.e., HTLs > 40 dB HL). Limestone 3 and Sand 3 exhibited the widest range audiometric thresholds. No obvious trends in average HTLs were noted by mine type or company.
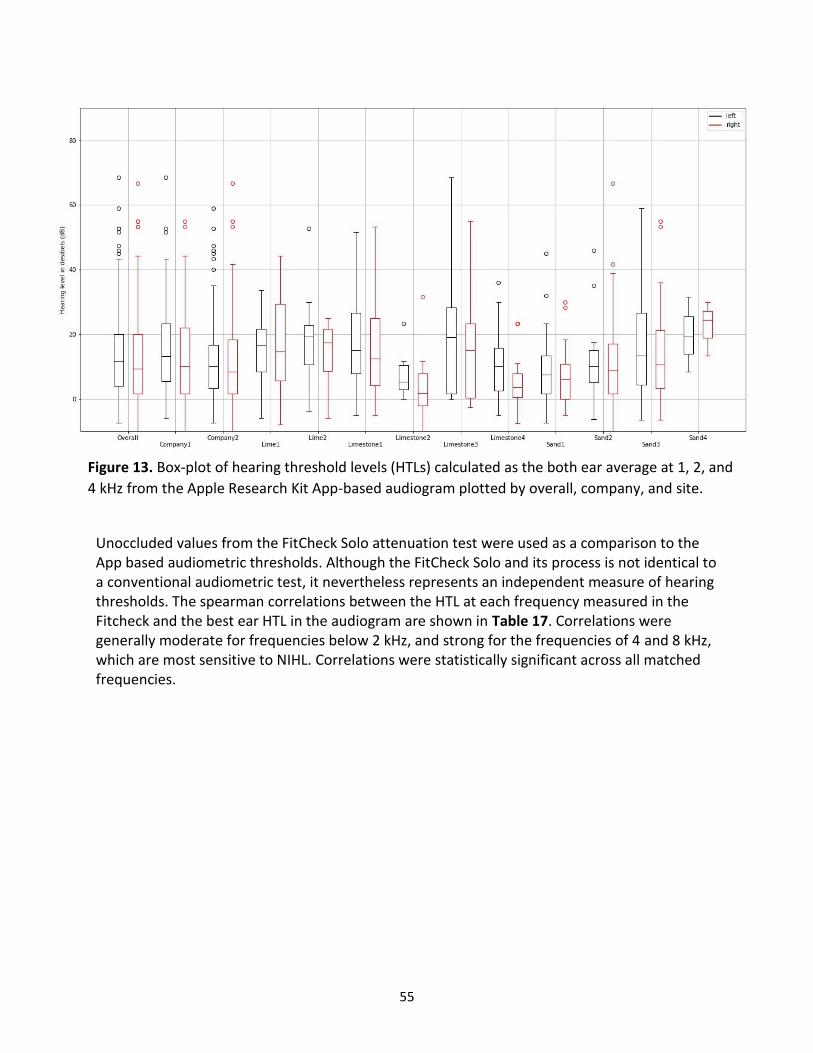
55
Unoccluded values from the FitCheck Solo attenuation test were used as a comparison to the App based audiometric thresholds. Although the FitCheck Solo and its process is not identical to a conventional audiometric test, it nevertheless represents an independent measure of hearing thresholds. The spearman correlations between the HTL at each frequency measured in the Fitcheck and the best ear HTL in the audiogram are shown in Table 17. Correlations were generally moderate for frequencies below 2 kHz, and strong for the frequencies of 4 and 8 kHz, which are most sensitive to NIHL. Correlations were statistically significant across all matched frequencies.
Figure 13. Box-plot of hearing threshold levels (HTLs) calculated as the both ear average at 1, 2, and
4 kHz from the Apple Research Kit App-based audiogram plotted by overall, company, and site.

56
Table 17. Spearman correlations between unoccluded thresholds from FitCheck and best ear thresholds from App based Audiogram
(n = 119 - 189)
Fitcheck Solo Unoccluded Best ear - based on Audiogram
Variables 0.25 kHz 0.5 kHz 1 kHz 2 kHz 4 kHz 8 kHz 0.25 kHz .5 kHz 1 kHz 2 kHz 3 kHz 4 kHz 8 kHz
Fitc
hec
kSo
lo
Un
occ
lud
ed
0.25 kHz 1.00 0.5kHz 0.77* 1.00 1 kHz 0.66* 0.83* 1.00 2 kHz 0.45* 0.61* 0.79* 1.00 4 kHz 0.37* 0.12 0.28* 0.41* 1.00 8 kHz 0.42* 0.37* 0.39* 0.40* 0.52* 1.00
Bes
t ea
r -
bas
ed
o
n A
ud
iogr
am
0.25 kHz 0.38* 0.36* 0.21* 0.09 0.03 0.06 1.00 0.5 kHz 0.43* 0.54* 0.38* 0.23* 0.15 0.18* 0.76* 1.00 1 kHz 0.49* 0.45* 0.55* 0.42* 0.33* 0.35* 0.31* 0.63* 1.00 2 kHz 0.33* 0.27* 0.39* 0.63* 0.46* 0.35* 0.09* 0.32* 0.59* 1.00 3 kHz 0.37* 0.18 0.37* 0.51* 0.60* 0.37* 0.16* 0.29* 0.46* 0.73* 1.00 4 kHz 0.20* 0.08 0.27* 0.43* 0.75* 0.44* 0.12 0.18* 0.36* 0.59* 0.69* 1.00 8 kHz 0.39* 0.24* 0.34* 0.40* 0.57* 0.73* 0.26* 0.36* 0.50* 0.49* 0.57* 0.61* 1.00
*p≤0.05 Table 18 shows bivariate logistic regression models for four injury-related outcomes (accident in past year, near miss in past year, work injury in past year, and serious work injury in past year). In these unadjusted models, significantly elevated odds ratios were seen for at least one hearing measure within each of the four outcomes. The significant associations noted were between: worst ear HL ≥25 dB HL at 1-2-4 kHz and accident in past year (OR = 3.04, p=0.04); HL in both ears at 1-2-4 kHz and accident in past year (OR = 2.97, p=0.05); A lot of trouble hearing and near-miss in past year (OR=4.29, p=0.03); experienced tinnitus and work injury in past year (OR = 1.93, p=0.04); and A lot of trouble hearing and serious work injury in past year (OR = 6.52, p=0.02). These results suggest that certain measures of hearing ability may be associated with increased risk of accident, near-miss, or injury.
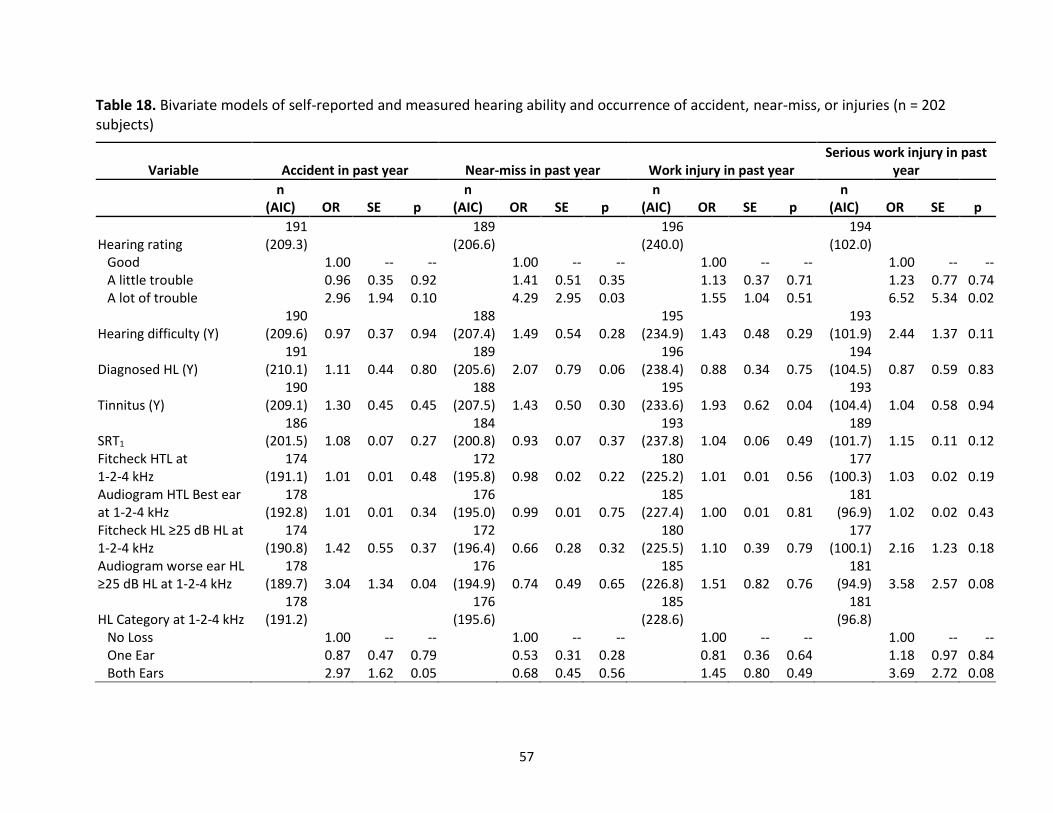
57
Table 18. Bivariate models of self-reported and measured hearing ability and occurrence of accident, near-miss, or injuries (n = 202 subjects)
Variable Accident in past year Near-miss in past year Work injury in past year Serious work injury in past
year
n
(AIC) OR SE p n
(AIC) OR SE p n
(AIC) OR SE p n
(AIC) OR SE p
Hearing rating 191
(209.3) 189
(206.6) 196
(240.0) 194
(102.0) Good 1.00 -- -- 1.00 -- -- 1.00 -- -- 1.00 -- -- A little trouble 0.96 0.35 0.92 1.41 0.51 0.35 1.13 0.37 0.71 1.23 0.77 0.74 A lot of trouble 2.96 1.94 0.10 4.29 2.95 0.03 1.55 1.04 0.51 6.52 5.34 0.02
Hearing difficulty (Y) 190
(209.6) 0.97 0.37 0.94 188
(207.4) 1.49 0.54 0.28 195
(234.9) 1.43 0.48 0.29 193
(101.9) 2.44 1.37 0.11
Diagnosed HL (Y) 191
(210.1) 1.11 0.44 0.80 189
(205.6) 2.07 0.79 0.06 196
(238.4) 0.88 0.34 0.75 194
(104.5) 0.87 0.59 0.83
Tinnitus (Y) 190
(209.1) 1.30 0.45 0.45 188
(207.5) 1.43 0.50 0.30 195
(233.6) 1.93 0.62 0.04 193
(104.4) 1.04 0.58 0.94
SRT1 186
(201.5) 1.08 0.07 0.27 184
(200.8) 0.93 0.07 0.37 193
(237.8) 1.04 0.06 0.49 189
(101.7) 1.15 0.11 0.12 Fitcheck HTL at 1-2-4 kHz
174 (191.1) 1.01 0.01 0.48
172 (195.8) 0.98 0.02 0.22
180 (225.2) 1.01 0.01 0.56
177 (100.3) 1.03 0.02 0.19
Audiogram HTL Best ear at 1-2-4 kHz
178 (192.8) 1.01 0.01 0.34
176 (195.0) 0.99 0.01 0.75
185 (227.4) 1.00 0.01 0.81
181 (96.9) 1.02 0.02 0.43
Fitcheck HL ≥25 dB HL at 1-2-4 kHz
174 (190.8) 1.42 0.55 0.37
172 (196.4) 0.66 0.28 0.32
180 (225.5) 1.10 0.39 0.79
177 (100.1) 2.16 1.23 0.18
Audiogram worse ear HL ≥25 dB HL at 1-2-4 kHz
178 (189.7) 3.04 1.34 0.04
176 (194.9) 0.74 0.49 0.65
185 (226.8) 1.51 0.82 0.76
181 (94.9) 3.58 2.57 0.08
HL Category at 1-2-4 kHz 178
(191.2) 176
(195.6) 185
(228.6) 181
(96.8) No Loss 1.00 -- -- 1.00 -- -- 1.00 -- -- 1.00 -- -- One Ear 0.87 0.47 0.79 0.53 0.31 0.28 0.81 0.36 0.64 1.18 0.97 0.84 Both Ears 2.97 1.62 0.05 0.68 0.45 0.56 1.45 0.80 0.49 3.69 2.72 0.08
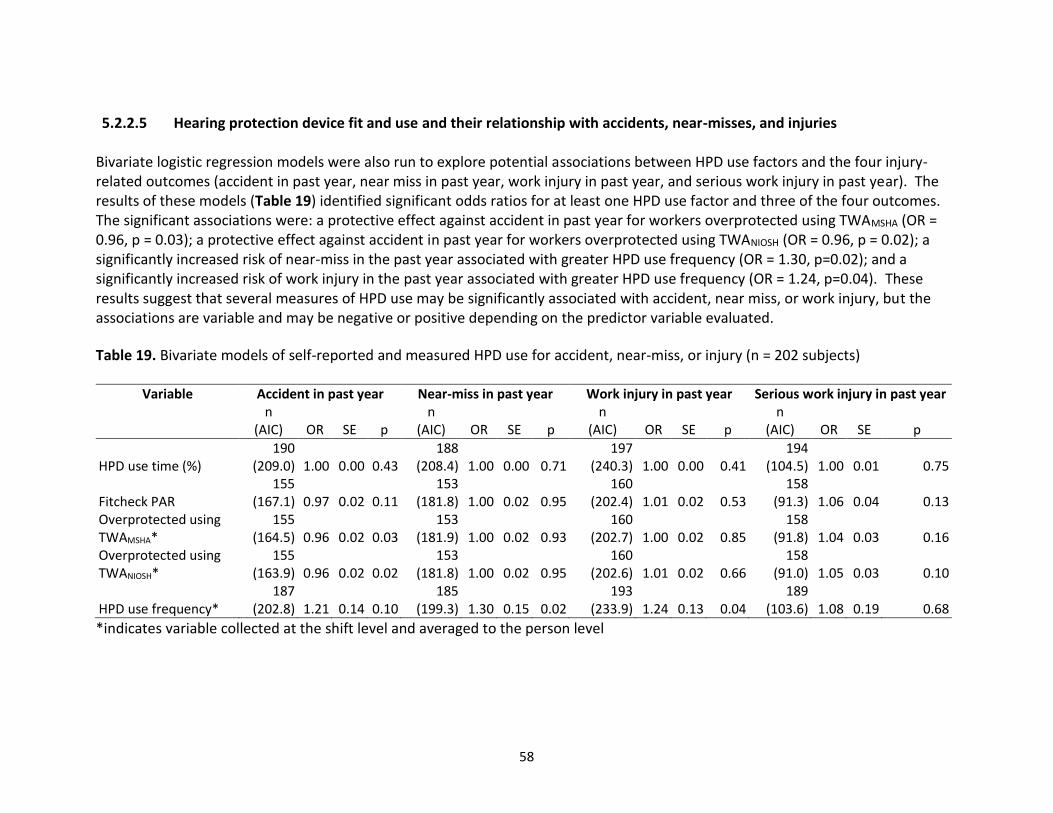
58
5.2.2.5 Hearing protection device fit and use and their relationship with accidents, near-misses, and injuries Bivariate logistic regression models were also run to explore potential associations between HPD use factors and the four injury-related outcomes (accident in past year, near miss in past year, work injury in past year, and serious work injury in past year). The results of these models (Table 19) identified significant odds ratios for at least one HPD use factor and three of the four outcomes. The significant associations were: a protective effect against accident in past year for workers overprotected using TWAMSHA (OR = 0.96, p = 0.03); a protective effect against accident in past year for workers overprotected using TWANIOSH (OR = 0.96, p = 0.02); a significantly increased risk of near-miss in the past year associated with greater HPD use frequency (OR = 1.30, p=0.02); and a significantly increased risk of work injury in the past year associated with greater HPD use frequency (OR = 1.24, p=0.04). These results suggest that several measures of HPD use may be significantly associated with accident, near miss, or work injury, but the associations are variable and may be negative or positive depending on the predictor variable evaluated.
Table 19. Bivariate models of self-reported and measured HPD use for accident, near-miss, or injury (n = 202 subjects)
Variable Accident in past year Near-miss in past year Work injury in past year Serious work injury in past year
n
(AIC) OR SE p n
(AIC) OR SE p n
(AIC) OR SE p n
(AIC) OR SE p
HPD use time (%) 190
(209.0) 1.00 0.00 0.43 188
(208.4) 1.00 0.00 0.71 197
(240.3) 1.00 0.00 0.41 194
(104.5) 1.00 0.01 0.75
Fitcheck PAR 155
(167.1) 0.97 0.02 0.11 153
(181.8) 1.00 0.02 0.95 160
(202.4) 1.01 0.02 0.53 158
(91.3) 1.06 0.04 0.13 Overprotected using TWAMSHA*
155 (164.5) 0.96 0.02 0.03
153 (181.9) 1.00 0.02 0.93
160 (202.7) 1.00 0.02 0.85
158 (91.8) 1.04 0.03 0.16
Overprotected using TWANIOSH*
155 (163.9) 0.96 0.02 0.02
153 (181.8) 1.00 0.02 0.95
160 (202.6) 1.01 0.02 0.66
158 (91.0) 1.05 0.03 0.10
HPD use frequency* 187
(202.8) 1.21 0.14 0.10 185
(199.3) 1.30 0.15 0.02 193
(233.9) 1.24 0.13 0.04 189
(103.6) 1.08 0.19 0.68
*indicates variable collected at the shift level and averaged to the person level

59
The majority of the HPD types used among 200 workers sampled was foam earplugs (79.4%), while 8.8 percent used earmuffs (Table 20). Only 5.2 percent use both earplugs and earmuffs (i.e., double protection) while at work. Of those who wore earplugs, the average PAR achieved from the Fitcheck Solo was 24.2 dB (±9.4 dB), while an average of 13.7 dB (±7.9 dB) was achieved among those who wore earmuffs. In other words, earplug users achieved nearly twice the attenuation of earmuff users on average. As shown in Figure 14, no workers were found to have inadequate PAR values (i.e., none were under-protected, or receiving insufficient attenuation from their HPDs).
Table 20. Hearing protection device usage and attenuation (n = 200 workers)
Variable N Mean SD Median IQR Span
PAR earplugs (dB) 176 24.2 9.4 24.9 12.7 0.0 – 43.1 PAR earmuffs (dB) 32 13.7 7.9 11.2 9.4 -5.6 – 28.0 HPD use time (%) 199 74.9 31.8 90.0 39 0.0 – 100.0
Variable N % HPD type
Foam 154 79.4 Muff 17 8.8 None 9 4.6 Pre-mold 4 2.1 Double Protection (Earplugs + Muffs) 10 5.2
Figure 14. Scatterplot of PAR needed (dB) vs Fitcheck PAR
earplugs (dB) (n=199 workers)

60
5.2.2.6 Potentially important covariates related to stress, work culture, overall health, and sleepiness and their relationship with accidents, near-misses, and injuries
Bivariate logistic regression models were run to evaluated potential associations between stress, work culture, overall health, sleepiness, fatigue, and work demands and the four injury-related outcomes (accident in past year, near miss in past year, work injury in past year, and serious work injury in past year). The results of these models (Table 21) did not identify any statistically significant associations between the predictors and odds of having an accident in the past year or work injury in past year. Two predictors were associated with significantly increased risk of near-miss in the past year: job safety score (OR = 1.09, SE = 0.03, p<0.01) and NASA-TLX Frustration demand (OR = 1.09, SE = 0.05, p=0.05). A single predictor, NASA-TLX Time demand, was associated with significantly increased risk of a serious work injury in the past year (OR = 1.16, SE = 0.08, p=0.04). These results indicate that specific work factors may influence risk of near-miss or serious work injury.

61
Table 21. Bivariate models of self-reported and measured covariates related to stress, work culture, overall health, sleepiness, and work demands by odds of accident, near-miss, or injuries (n = 202 subjects)
Variable Accident in past year Near-miss in past year Work injury in past year Serious work injury in past
year
n
(AIC) OR SE p n
(AIC) OR SE p n
(AIC) OR SE p n
(AIC) OR SE p
Health 191 (211.3)
189 (208.4)
196 (238.3)
194 (105.3)
≤ Good 1.00 -- -- 1.00 -- -- 1.00 -- -- 1.00 -- -- Very good 0.62 0.35 0.40 0.45 0.26 0.17 1.33 0.82 0.64 1.04 1.19 0.97 Excellent 0.61 0.33 0.36 0.77 0.42 0.64 1.97 1.18 0.26 1.94 2.11 0.54
Fitness 189 (209.4)
187 (207.9)
194 (237.5)
192 (103.8)
≤ Good 1.00 -- -- 1.00 -- -- 1.00 -- -- 1.00 -- -- Very good 0.72 0.27 0.37 1.51 0.59 0.29 1.57 0.58 0.22 3.07 2.43 0.16 Excellent 0.48 0.30 0.24 0.76 0.48 0.67 1.21 0.65 0.72 2.56 2.64 0.36
Perceived Stress Scale (PSS)
184 (203.6) 1.02 0.03 0.48
182 (200.6) 1.00 0.03 0.97
188 (223.7) 0.99 0.03 0.73
188 (93.2) 1.01 0.05 0.85
Safety A** 189 (205.0)
187 (202.4)
190 (224.8)
189 (93.0)
Response A 1.00 -- -- 1.00 -- -- 1.00 -- -- 1.00 -- -- Response B 1.75 0.72 0.18 2.15 0.88 0.06 1.23 0.52 0.62 1.51 1.05 0.55
Safety B*** 187 (198.4)
185 (202.0)
187 (220.9)
187 (91.3)
Response A 1.00 -- -- 1.00 -- -- 1.00 -- -- 1.00 -- -- Response B 1.71 0.61 0.13 1.14 0.40 0.71 0.86 0.29 0.64 0.41 0.28 0.20
Job Safety Score (JSS)
189 (206.7) 1.00 0.02 0.93
187 (194.7) 1.09 0.03 <0.01
189 (220.6) 1.05 0.02 0.06
189 (93.4) 1.01 0.04 0.87
Epworth Sleep Scale (ESS)
186 (202.8) 1.07 0.04 0.13
184 (199.4) 1.07 0.05 0.13
186 (220.0) 1.03 0.04 0.47
186 (92.7) 0.96 0.07 0.57

62
Variable Accident in past year Near-miss in past year Work injury in past year Serious work injury in past
year
n
(AIC) OR SE p n
(AIC) OR SE p n
(AIC) OR SE p n
(AIC) OR SE p Fatigue Severity Scale (FSS)
174 (186.1) 1.04 0.02 0.08
172 (187.4) 1.04 0.02 0.08
174 (201.1) 1.06 0.02 <0.01
175 (91.5) 1.00 0.04 0.96
Sleepiness* 191 (206.7) 1.24 0.14 0.06
189 (208.5) 1.09 0.13 0.45
198 (238.9 1.25 0.13 0.03
194 (103.7) 1.19 0.21 0.34
Stress* Did not converge
187 (210.5)
196 (243.6) Did not converge
None 1.00 -- -- 1.00 -- -- Very little 1.36 0.96 0.66 2.20 1.51 0.25 A little 1.30 0.91 0.71 2.67 1.80 0.15 Some to much 2.07 1.50 0.31 2.28 1.64 0.25
NASA TLX demands*
Mental* 191 (207.7) 1.07 0.05 0.12
189 (208.1) 1.04 0.4 0.30
198 (240.8) 1.07 0.04 0.10
194 (103.2) 1.08 0.07 0.24
Physical* 191 (207.3) 1.08 0.05 0.09
189 (208.1) 1.05 0.05 0.31
198 (242.3) 1.05 0.04 0.29
194 (103.5) 1.08 0.08 0.31
Time* 191 (208.8) 1.05 0.05 0.24
189 (208.0) 1.05 0.05 0.30
198 (241.4) 1.06 0.04 0.15
194 (100.3) 1.16 0.08 0.04
Effort* 191 (208.9) 1.05 0.05 0.27
189 (208.2) 1.04 0.05 0.35
198 (239.8) 1.08 0.04 0.06
194 (100.9) 1.15 0.09 0.06
Frustration* 191 (210.1) 0.99 0.05 0.81
189 (205.4) 1.09 0.05 0.05
198 (242.6) 1.04 0.04 0.36
194 (104.6) 1.01 0.07 0.94
*Indicates variable collected at the shift level and averaged to the person level **Safety A was a question with two response choices; A (i.e., Safety is at the forefront of my mind when working) and B (i.e., Safety is important, but other factors sometimes limit my ability to work safely) ***Safety B was a question with two response choices; A (i.e., Injuries occur at work because people don’t take enough interest in safety) and B (i.e., Injuries at work will always occur, no matter how hard people try to prevent them)

63
5.2.2.7 Predictors of Personal Attenuation Ratings
Bivariate and multivariate linear regression models were used to explore potential predictors of PARs achieved by participants who
wore earplugs (Table 22). In the PAR-unadjusted models, hearing loss ≥25 dB HL at 1-2-4- kHz, age, and perceived hearing health
were found to be significantly and negatively associated with PARs (β values -0.11 to -5.08, p values 0.006-0.03). Additionally, an
interaction was noted in the PAR-unadjusted model that evaluated combination of tinnitus and hearing loss; workers with tinnitus
and hearing loss had significantly lower PAR values (β = -6.33, SE = 2.30, p=0.007) than those with no tinnitus and hearing loss (the
reference group). In fully adjusted PAR model 1, which included main effects for hearing loss and tinnitus, hearing loss ≥25 dB HL at
1-2-4- kHz was again significantly associated with a reduced PAR (β = -5.67, SE = 1.99, p=0.005). In fully adjusted PAR model 2, which
included the interaction term for hearing loss and tinnitus, two categories were significant: workers with tinnitus and no hearing loss
had significantly higher PARs (β =3.64, SE = 1.74, p=0.04), and workers with tinnitus and hearing loss had significantly lower PARs (β
= -6.05, SE = 2.45, p=0.02). These results indicate that both hearing loss and tinnitus influence workers’ PARs.
Table 22. Linear regression models for predictors of personal attenuation ratings (PARs)
PAR-Unadjusted (n = 148 – 150)
PAR-Model-1 (n = 143, R2
Adj. = 0.04) PAR-Model-2
(n = 143, R2Adj. = 0.07)
Predictors R2 SE p SE p SE p
Hearing loss ≥25 dB HL at 1-2-4 kHz 0.05 -5.08 1.83 0.006 -5.67 1.99 0.005 Age (years) 0.02 -0.11 0.06 0.07 0.05 0.07 0.44 -0.65 0.07 0.33 SRT1 <0.01 0.27 0.36 0.45 0.38 0.38 0.33 0.41 0.38 0.28 % Time earplug worn <0.01 <0.01 0.02 0.73 <-0.01 0.02 0.89 <-0.01 0.02 0.95 TWANIOSH (dBA) <0.01 0.07 0.12 0.56 <-0.01 0.13 0.95 <-0.01 0.14 0.63 Tinnitus (Y) <0.01 0.63 1.50 0.68 1.62 1.57 0.31 Hearing rating 0.03 -2.70 1.23 0.03 Frequency of high noise exposure at work
<0.01 0.98 0.85 0.25
Tinnitus & hearing loss interaction 0.09
No Tinnitus & HL 1.00 1.00 Tinnitus & No HL 3.28 1.63 0.05 3.64 1.74 0.04 No Tinnitus & HL -0.54 2.77 0.84 -0.24 2.93 0.93 Tinnitus & HL -6.33 2.30 0.007 -6.05 2.45 0.02
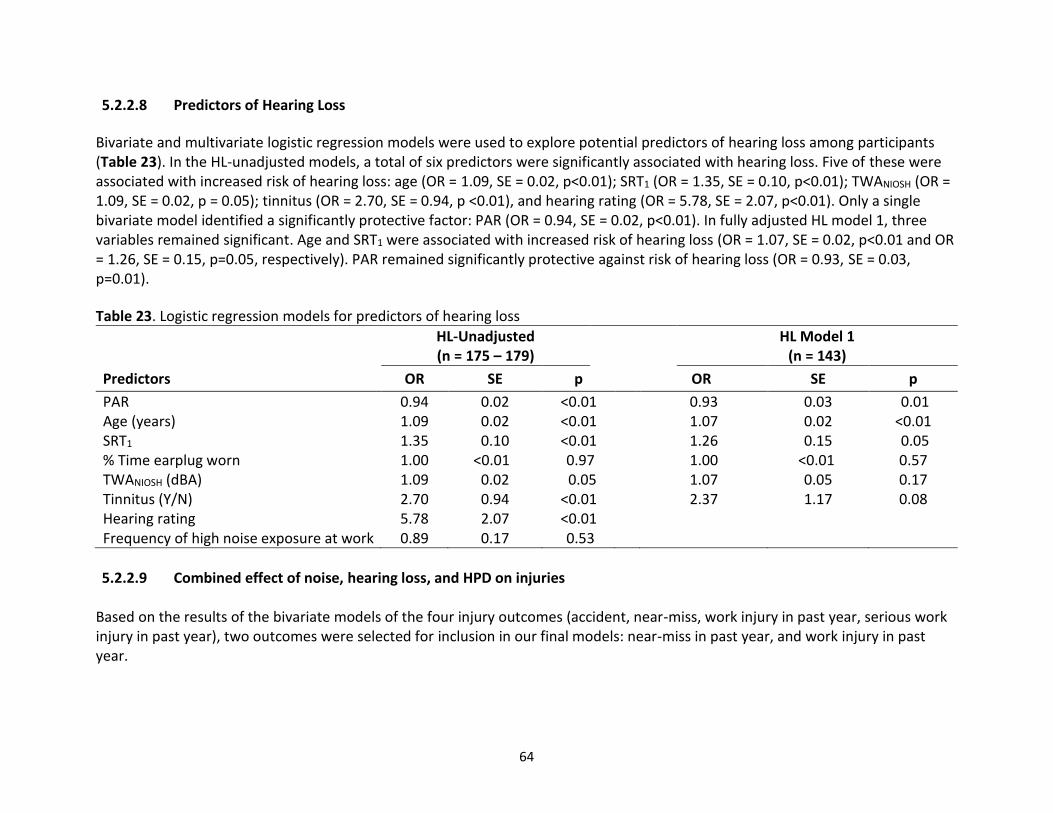
64
5.2.2.8 Predictors of Hearing Loss
Bivariate and multivariate logistic regression models were used to explore potential predictors of hearing loss among participants (Table 23). In the HL-unadjusted models, a total of six predictors were significantly associated with hearing loss. Five of these were associated with increased risk of hearing loss: age (OR = 1.09, SE = 0.02, p<0.01); SRT1 (OR = 1.35, SE = 0.10, p<0.01); TWANIOSH (OR = 1.09, SE = 0.02, p = 0.05); tinnitus (OR = 2.70, SE = 0.94, p <0.01), and hearing rating (OR = 5.78, SE = 2.07, p<0.01). Only a single bivariate model identified a significantly protective factor: PAR (OR = 0.94, SE = 0.02, p<0.01). In fully adjusted HL model 1, three variables remained significant. Age and SRT1 were associated with increased risk of hearing loss (OR = 1.07, SE = 0.02, p<0.01 and OR = 1.26, SE = 0.15, p=0.05, respectively). PAR remained significantly protective against risk of hearing loss (OR = 0.93, SE = 0.03, p=0.01).
Table 23. Logistic regression models for predictors of hearing loss
HL-Unadjusted (n = 175 – 179)
HL Model 1 (n = 143)
Predictors OR SE p OR SE p
PAR 0.94 0.02 <0.01 0.93 0.03 0.01 Age (years) 1.09 0.02 <0.01 1.07 0.02 <0.01 SRT1 1.35 0.10 <0.01 1.26 0.15 0.05 % Time earplug worn 1.00 <0.01 0.97 1.00 <0.01 0.57 TWANIOSH (dBA) 1.09 0.02 0.05 1.07 0.05 0.17 Tinnitus (Y/N) 2.70 0.94 <0.01 2.37 1.17 0.08 Hearing rating 5.78 2.07 <0.01
Frequency of high noise exposure at work 0.89 0.17 0.53
5.2.2.9 Combined effect of noise, hearing loss, and HPD on injuries
Based on the results of the bivariate models of the four injury outcomes (accident, near-miss, work injury in past year, serious work injury in past year), two outcomes were selected for inclusion in our final models: near-miss in past year, and work injury in past year.
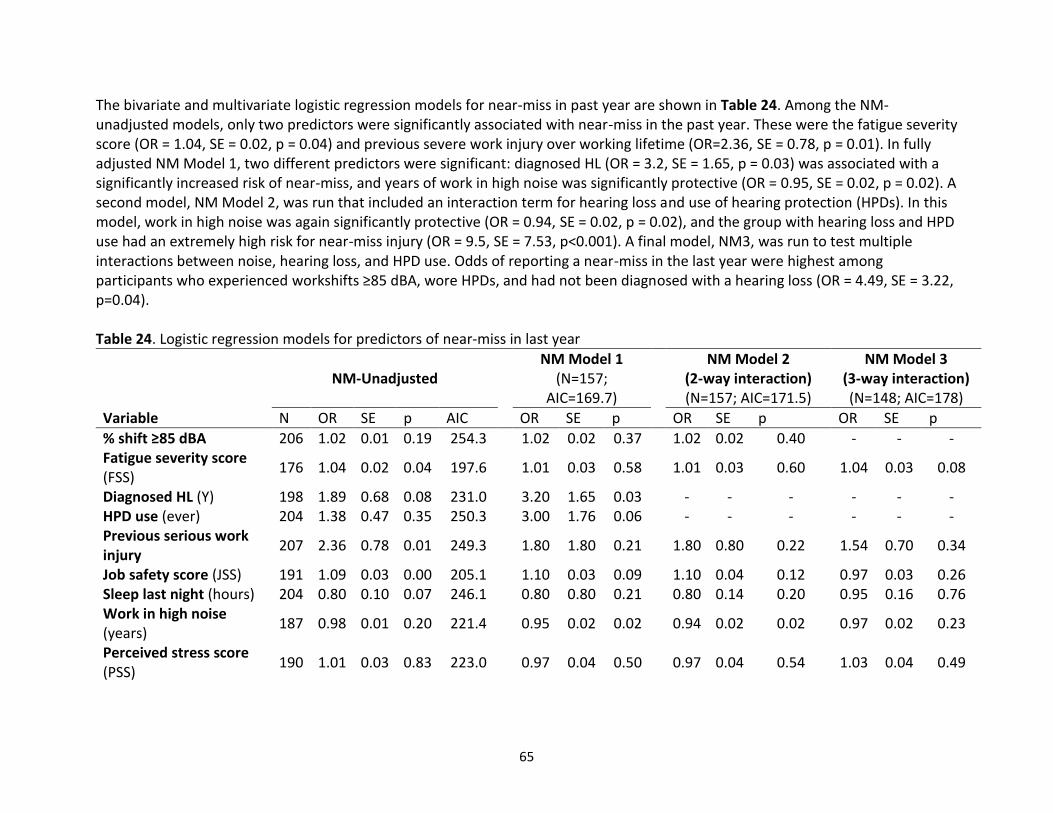
65
The bivariate and multivariate logistic regression models for near-miss in past year are shown in Table 24. Among the NM-unadjusted models, only two predictors were significantly associated with near-miss in the past year. These were the fatigue severity score (OR = 1.04, SE = 0.02, p = 0.04) and previous severe work injury over working lifetime (OR=2.36, SE = 0.78, p = 0.01). In fully adjusted NM Model 1, two different predictors were significant: diagnosed HL (OR = 3.2, SE = 1.65, p = 0.03) was associated with a significantly increased risk of near-miss, and years of work in high noise was significantly protective (OR = 0.95, SE = 0.02, p = 0.02). A second model, NM Model 2, was run that included an interaction term for hearing loss and use of hearing protection (HPDs). In this model, work in high noise was again significantly protective (OR = 0.94, SE = 0.02, p = 0.02), and the group with hearing loss and HPD use had an extremely high risk for near-miss injury (OR = 9.5, SE = 7.53, p<0.001). A final model, NM3, was run to test multiple interactions between noise, hearing loss, and HPD use. Odds of reporting a near-miss in the last year were highest among participants who experienced workshifts ≥85 dBA, wore HPDs, and had not been diagnosed with a hearing loss (OR = 4.49, SE = 3.22, p=0.04). Table 24. Logistic regression models for predictors of near-miss in last year
NM-Unadjusted NM Model 1
(N=157; AIC=169.7)
NM Model 2
(2-way interaction) (N=157; AIC=171.5)
NM Model 3 (3-way interaction) (N=148; AIC=178)
Variable N OR SE p AIC OR SE p OR SE p OR SE p
% shift ≥85 dBA 206 1.02 0.01 0.19 254.3 1.02 0.02 0.37 1.02 0.02 0.40 - - - Fatigue severity score (FSS)
176 1.04 0.02 0.04 197.6 1.01 0.03 0.58 1.01 0.03 0.60 1.04 0.03 0.08
Diagnosed HL (Y) 198 1.89 0.68 0.08 231.0 3.20 1.65 0.03 - - - - - - HPD use (ever) 204 1.38 0.47 0.35 250.3 3.00 1.76 0.06 - - - - - - Previous serious work injury
207 2.36 0.78 0.01 249.3 1.80 1.80 0.21 1.80 0.80 0.22 1.54 0.70 0.34
Job safety score (JSS) 191 1.09 0.03 0.00 205.1 1.10 0.03 0.09 1.10 0.04 0.12 0.97 0.03 0.26 Sleep last night (hours) 204 0.80 0.10 0.07 246.1 0.80 0.80 0.21 0.80 0.14 0.20 0.95 0.16 0.76 Work in high noise (years)
187 0.98 0.01 0.20 221.4 0.95 0.02 0.02 0.94 0.02 0.02 0.97 0.02 0.23
Perceived stress score (PSS)
190 1.01 0.03 0.83 223.0 0.97 0.04 0.50 0.97 0.04 0.54 1.03 0.04 0.49

66
NM-Unadjusted NM Model 1
(N=157; AIC=169.7)
NM Model 2
(2-way interaction) (N=157; AIC=171.5)
NM Model 3 (3-way interaction) (N=148; AIC=178)
Variable N OR SE p AIC OR SE p OR SE p OR SE p 2-way Interaction No HL, No HPD - - - - - - - 1.00 - - No HL, Yes HPD - - - - - - - 1.92 2.40 0.60 Yes HL, No HPD - - - - - - - 2.69 1.69 0.12 Yes HL, Yes HPD - - - - - - - 9.50 7.53 <0.001 3-way interaction <85dBA, No HPD, No HL - - - - - - - - - - 1.00 - - <85dBA, No HPD, Yes HL - - - - - - - - - - - - - <85dBA, Yes HPD, No HL - - - - - - - - - - 3.71 2.89 0.09 <85dBA, Yes HPD, Yes HL - - - - - - - - - - 4.82 4.68 0.11 ≥85dBA, No HPD, No HL - - - - - - - - - - 3.77 4.16 0.23 ≥85dBA, No HPD, Yes HL - - - - - - - - - - - - - ≥85dBA, Yes HPD, No HL - - - - - - - - - - 4.49 3.22 0.04 ≥85dBA, Yes HPD, Yes HL - - - - - - - - - - 5.20 5.12 0.09
Table 25 shows the results of bivariate and multivariate logistic regression models with the outcome work injury in the past year. In the WI-unadjusted models, three variables were significantly associated with increased risk of a work injury in the past year. These were the Fatigue Severity Score (OR = 1.10, SE = 0.02, p=0.01), previous serious work injury (OR = 3.5, SE = 1.15, p <0.001), and sleepiness (OR = 1.23, SE = 0.12, p = 0.04). Fully adjusted WI model 2 includes main effects for hearing loss (HTLs ≥25 dB HL at 1-2-4 kHz) and HPD use; in this model four predictors were significantly associated with work injury in the past year. These variables, all of which were associated with increased risk of injury, were: HPD use (OR = 3.6, SE = 1.82, p = 0.01); Fatigue Severity Score (OR = 1.1, SE = 0.03, p<0.001); previous serious work injury (OR 3.1, SE = 1.35, p = 0.01) and safety A (OR = 3.2, SE = 1.66, p=0.03). Finally, WI Model 3 included an interaction term for hearing loss and HPD use. In this model, three predictors reached statistical significance: Fatigue Severity Score (OR = 1.10, SE = 0.03, p<0.001); previous serious injury at work (OR = 2.96, SE = 1.32, p = 0.02); and safety A (OR = 3.25, SE = 1.73, p = 0.03). Additionally, the group of workers with no hearing loss and reporting use of HPD had a significantly increased risk of work injury in the past year (OR = 3.02, SE = 1.69, p=0.05).

67
Table 25. Logistic regression models for predictors of work injury in last year
Variables WI-Unadjusted
WI Model 2 (N=157; AIC=174.3)
WI Model 3 (Interaction)
(N=157; AIC=175.8)
N OR SE p AIC OR SE p OR SE p
TWAMSHA≥95 206 0.95 0.04 0.15 261.3 0.93 0.05 0.19 0.93 0.05 0.19 HPD use (ever) 204 1.44 0.48 0.27 258.1 3.60 1.82 0.01 - - - Fatigue Severity Score (FSS) 176 1.10 0.02 0.01 205.7 1.10 0.03 <0.001 1.10 0.03 <0.001 HTL ≥25 dB 198 0.94 0.35 0.86 243.5 0.73 0.35 0.51 - - - Previous serious work injury in lifetime
193 3.50 1.15 <0.001 248.8 3.10 1.35 0.01 2.96 1.32 0.02
Safety A (response A=ref) 192 1.48 0.59 0.33 229.3 3.20 1.66 0.03 3.25 1.73 0.03 Sleepiness 205 1.23 0.12 0.04 255.7 1.23 0.18 0.14 1.23 0.17 0.15 Time in industry (years) 187 1.01 0.01 0.28 231.1 1.01 0.02 0.44 1.02 0.02 0.39 Perceived stress score (PSS) 190 1.00 0.03 0.90 228.9 0.98 0.04 0.73 0.99 0.04 0.72 Interaction
No HL, No HPD - - - - - - - 1.00 - - No HL, Yes HPD - - - - - - - 3.02 1.69 0.05 Yes HL, No HPD - - - - - - - 0.36 0.44 0.40 Yes HL, Yes HPD - - - - - - - 2.50 1.65 0.17

68
Summary of specific aim 2 Collectively, the results of our specific aim 2 assessments of risk of injuries associated with noise, HPD use, and hearing loss indicated that miners at the ten participating sites showed high rates of hearing loss and HPD use, and had high exposures to occupational noise. The vast majority of users reported using earplugs, all workers achieved sufficient attenuation given their full-shift noise exposures, and most workers were overprotected (i.e., had PAR in excess of what was required to reduce them below the relevant exposure limit, Figure 12). The results of our app-based audiometric test showed moderate to strong correlations with Fitcheck-based measures of hearing thresholds (Table 16). Reports of injuries and near-misses were rare within the past year, but nearly half of all workers had been injured during their career (Table 13). While we developed a number of novel noise metrics in pursuit of Subaim 2a, none was determined to be associated with injury risk. Linear regression models suggest interactive effects of hearing loss and HPD use on achieved PAR, with workers with tinnitus and no hearing loss having significantly higher PARs, and workers with tinnitus and hearing loss had significantly lower PARs (Table 21). Logistic regression modeling identified age and speech reception threshold as significant factors for increased risk of hearing loss, and PAR as a significantly protective factor for hearing loss (Table 22). Logistic regression models indicated that Fatigue Severity Score, previous serious work injury, and safety perception were associated with significantly higher risk of near miss in the past year, and also identified an interaction of workshift noise ≥85 dBA, hearing loss, and HPD use on near miss risk, with workers with no hearing loss, workshift noise ≥85 dBA, and reporting use of HPD having a significantly increased risk of work injury in the past year (Table 23). Finally, logistic regression models showed that Fatigue Severity Score, previous serious injury at work, and safety perception were associated with a significantly increased risk of work injury in the past year, and also identified an interactive effect between hearing loss and HPD use, wherein workers with no hearing loss and reporting use of HPD had a significantly increased risk of work injury in the past year (Table 24). These results are directly relevant to Specific Aim 2 and suggest that noise is not a significant risk factor for occupational near miss or nonfatal injury when controlling for use of HPDs, hearing status, fatigue, sleepiness, work experience, and perceived stress. The results also highlight the importance of ensuring that workers receive appropriate attenuation from their HPDs, and that this attenuation needs to be considered in light of their hearing status. 6.0 Dissemination Efforts and Highlights
6.1 Dissemination of Data collected for Aim 1 A single publication is planned for the data collected in Aim 1. The focus is to describe NFDL injury and occupational fatality rates for 1983 to 2018 for all mines nation-wide by SIC and SOC and how noise from a Job Exposure Matrix (JEM) is associated with NFDL injury and occupational fatality rates among mines and miners. These collected counts and rates will be added to our JEM website to start the development of an injury and fatality risk database. This dataset, like our JEM, will be open source and free for use through the website we host (http://noisejem.sph.umich.edu/).

69
6.2 Dissemination of Data collected for Aim 2 Individual, personalized reports were developed for each of the 202 participants using RMarkdown (Boston, MA, US). These letters were mailed to the safety directors at each mine in sealed envelopes in early March. The safety directors were instructed to return the letters to each miner while keeping in mind that all data contained is confidential and up to the participant him/herself to share. In addition to the participant letters, we generated 11 personalized site reports that allowed comparison of the site specific results to those of their parent company and the overall study averages. Parts of this data have been presented by a graduate student at the National Hearing and Conservation Conference in February. Two master’s students have utilized the data collected during the summer of 2019 for Aim 2 for their thesis. One has been successfully defended and the other is pending defense summer of 2020. We plan to publish three manuscripts describing Specific Aim 2, each of them currently at various points in the development process. The first manuscript, a result of the defended thesis, will focus on how what factors are associated with hearing loss and personal attenuation rating (PAR) among miners. The second, a result of the pending thesis, will focus on the association between noise exposure using novel and traditional metrics and injury risk among miners. The third manuscript will bring all of these factors together while taking into consideration hearing protection device fit and use. 7.0 Conclusions and Impact Assessment The personalized letters developed for each participant as a result of this research provided specific guidance to the individual about their noise exposure, hearing ability, work demands and stress, and how their hearing protection fit. This represents direct feedback to a subpopulation at risk, and provided a direct benefit to participating workers. The manuscripts that we are preparing will convey the results of our work to professional and academic readers, and may motivate changes in corporate policies related to noise and injury risks in US mines. Overall, our results suggest that noise may be a significant risk factor for nonfatal and fatal occupational injuries, but that after controlling for use of HPDs, hearing status, fatigue, sleepiness, work experience, and perceived stress, the independent risk of noise on nonfatal injuries is no longer significant. The results also highlight the importance of ensuring that workers receive appropriate attenuation from their HPDs, and that this attenuation needs to be considered in light of their hearing status. We have already begun dissemination of these results through conference presentations and manuscript preparation. We anticipate that our findings may have a large impact on hearing conservation and injury prevention programs in the mining industry, as they highlight the need
70
to tailor HPD use to specific worker characteristics, including hearing ability and tinnitus, in order to reduce near-miss and injury risk. 8.0 Recommendations for Future Work A logical extension of our findings involves the development and evaluation of a refined hearing conservation program designed to tailor HPDs to the needs of specific workers. Such a program would incorporate information about workers’ noise exposures, hearing ability, achieved PAR, and tinnitus. In the event that the Alpha Foundation submits another request for proposals, we would plan to submit a proposal along these lines. A secondary area of future research would involve the development of novel types of HPDs that can be better tuned or tailored to individual workers’ needs, and to pilot test the efficacy and effectiveness of such devices among mining workers.
71
9.0 References: 1. Tak, S.W.; Davis, R.R.; Calvert, G.M. Exposure to hazardous workplace noise and use of
hearing protection devices among us workers-NHANES, 1999-2004. Am. J. Ind. Med. 2009, 52, 358–371, doi:10.1002/ajim.20690.
2. Masterson, E.A.; Tak, S.; Themann, C.L.; Wall, D.K.; Groenewold, M.R.; Deddens, J.A.; Calvert, G.M. Prevalence of hearing loss in the United States by industry. Am. J. Ind. Med. 2013, doi:10.1002/ajim.22082.
3. Masterson, E.A.; Timothy Bushnell, P.; Themann, C.L.; Morata, T.C. Hearing impairment among noise-exposed workers — United States, 2003-2012. Morb. Mortal. Wkly. Rep. 2016, doi:10.15585/mmwr.mm6515a2.
4. Leigh, J.P.; Waehrer, G.; Miller, T.R.; Keenan, C. Costs of occupational injury and illness across industries. Scand. J. Work. Environ. Heal. 2004, doi:10.5271/sjweh.780.
5. Leigh, J.P. Economic burden of occupational injury and illness in the United States. Milbank Q. 2011, doi:10.1111/j.1468-0009.2011.00648.x.
6. Cui, Y.; Tian, S.S.; Qiao, N.; Wang, C.; Wang, T.; Huang, J.J.; Sun, C.M.; Liang, J.; Liu, X.M. Associations of Individual-Related and Job-Related Risk Factors with Nonfatal Occupational Injury in the Coal Workers of Shanxi Province: A Cross-Sectional Study. PLoS One 2015, doi:10.1371/journal.pone.0134367.
7. Kecojevic, V.; Nor, Z.M. Hazard identification for equipment-related fatal incidents in the u.s. underground coal mining. J. Coal Sci. Eng. 2009, doi:10.1007/s12404-009-0101-1.
8. Long, R.N.; Sun, K.; Neitzel, R.L. Injury risk factors in a small-scale gold mining community in Ghana’s upper east region. Int. J. Environ. Res. Public Health 2015, doi:10.3390/ijerph120808744.
9. Mitchell, R.J.; Driscoll, T.R.; Harrison, J.E. Traumatic work-related fatalities involving mining in Australia. Saf. Sci. 1998, doi:10.1016/S0925-7535(98)00012-5.
10. Sammarco, J.J.; Podlesny, A.; Rubinstein, E.N.; Demich, B. An analysis of roof bolter fatalities and injuries in U.S. mining. Transactions 2016, doi:10.19150/trans.7322.
11. Groves, W.A.; Kecojevic, V.J.; Komljenovic, D. Analysis of fatalities and injuries involving mining equipment. J. Safety Res. 2007, doi:10.1016/j.jsr.2007.03.011.
12. Dindarloo, S.R.; Pollard, J.P.; Siami-Irdemoos, E. Off-road truck-related accidents in U.S. mines. J. Safety Res. 2016, doi:10.1016/j.jsr.2016.07.002.
13. Rosenstock, L. Criteria for a recommended standard: Occupational noise exposure. Natl. Inst. Occup. Saf. Heal. 1998.
14. Passchier-Vermeer, W.; Passchier, W.F. Noise exposure and public health. Environ. Health Perspect. 2000.
72
15. Gitanjali, B.; Ananth, R. Effect of acute exposure to loud occupational noise during daytime on the nocturnal sleep architecture, heart rate, and cortisol secretion in healthy volunteers. J. Occup. Health 2003, doi:10.1539/joh.45.146.
16. Attarchi, M.; Dehghan, F.; Safakhah, F.; Nojomi, M.; Mohammadi, S. Effect of exposure to occupational noise and shift working on blood pressure in rubber manufacturing company workers. Ind. Health 2012, doi:10.2486/indhealth.MS1321.
17. Shrestha, A.; Shiqi, M. Occupational Noise Exposure in Relation to Hypertension: A Cross-sectional Study in the Steel Factory. Occup. Med. Heal. Aff. 2017, doi:10.4172/2329-6879.1000266.
18. Chang, T.Y.; wang, H.; Liu; sieh, H.; Bao; Lai 369 Acute effects of occupational noise exposure on 24-hour ambulatory blood pressure in workers with hypertension. Occup. Environ. Med. 2013, doi:10.1136/oemed-2013-101717.369.
19. Bortkiewicz, A.; Gadzicka, E.; Siedlecka, J.; Szyjkowska, A.; Viebig, P.; Wranicz, J.K.; Kurpesa, M.; Dziuba, M.; Trzos, E.; Makowiec-Dabrowska, T. Work-related risk factors of myocardial infarction. Int. J. Occup. Med. Environ. Health 2010, doi:10.2478/v10001-010-0030-7.
20. Skogstad, M.; Johannessen, H.A.; Tynes, T.; Mehlum, I.S.; Nordby, K.C.; Lie, A. Systematic review of the cardiovascular effects of occupational noise. Occup. Med. (Chic. Ill). 2016, 66, 10–16.
21. Gan, W.Q.; Davies, H.W.; Demers, P.A. Exposure to occupational noise and cardiovascular disease in the United States: The National Health and Nutrition Examination Survey 1999-2004. Occup. Environ. Med. 2011, doi:10.1136/oem.2010.055269.
22. Barreto, S.M.; Swerdlow, A.J.; Smith, P.G.; Higgins, C.D. A nested case-control study of fatal work related injuries among Brazilian steel workers. Occup. Environ. Med. 1997.
23. Choi, S.W.; Peek-Asa, C.; Sprince, N.L.; Rautiainen, R.H.; Donham, K.J.; Flamme, G.A.; Whitten, P.S.; Zwerling, C. Hearing loss as a risk factor for agricultural injuries. Am. J. Ind. Med. 2005, doi:10.1002/ajim.20214.
24. Sprince, N.L.; Zwerling, C.; Lynch, C.F.; Whitten, P.S.; Thu, K.; Gillette, P.P.; Burmeister, L.F.; Alavanja, M.C.R. Risk factors for falls among Iowa farmers: A case-control study nested in the Agricultural Health Study. Am. J. Ind. Med. 2003, doi:10.1002/ajim.10267.
25. Chau, N.; Mur, J.M.; Benamghar, L.; Siegfried, C.; Dangelzer, J.L.; Français, M.; Jacquin, R.; Sourdot, A. Relationships between Certain Individual Characteristics and Occupational Injuries for Various Jobs in the Construction Industry: A Case-Control Study. Am. J. Ind. Med. 2004, doi:10.1002/ajim.10319.
26. Jeong, B.Y. Occupational deaths and injuries in the construction industry. Appl. Ergon. 1998, doi:10.1016/S0003-6870(97)00077-X.
27. Amjad-Sardrudi, H.; Dormohammadi, A.; Golmohammadi, R.; Poorolajal, J. Effect of noise

73
exposure on occupational injuries: A cross-sectional study. J. Res. Health Sci. 2012.
28. Kisner, S.M.; Fosbroke, D.E. Injury hazards in the construction industry. J. Occup. Med. 1994, doi:10.1097/00043764-199402000-00008.
29. Zwerling, C.; Sprince, N.L.; Davis, C.S.; Whitten, P.S.; Wallace, R.R.; Heeringa, S.G. Occupational injuries among older workers with disabilities: A prospective cohort study of the health and retirement survey, 1992 to 1994. Am. J. Public Health 1998, doi:10.2105/AJPH.88.11.1691.
30. Picard, M.; Girard, S.A.; Courteau, M.; Leroux, T.; Larocque, R.; Turcotte, F.; Lavoie, M.; Simard, M. Could driving safety be compromised by noise exposure at work and noise-induced hearing loss? Traffic Inj. Prev. 2008, doi:10.1080/15389580802271478.
31. Van Charante, A.W.M.; Mulder, P.G.H. Perceptual acuity and the risk of industrial accidents. Am. J. Epidemiol. 1990, doi:10.1093/oxfordjournals.aje.a115549.
32. Volk, L.; Harris, G.; Cohen, R.; Almberg, K.; Graber, J.M. O36-1 Higher noise levels are associated with increased injury rates in us coal miners.; 2016.
33. Leather, P.; Beale, D.; Sullivan, L. Noise, psychosocial stress and their interaction in the workplace. J. Environ. Psychol. 2003, doi:10.1016/S0272-4944(02)00082-8.
34. Smith, A. Noise, performance efficiency and safety. Int. Arch. Occup. Environ. Health 1990.
35. Lichenstein Dr., R.; Smith, D.C.; Ambrose, J.L.; Moody, L.A. Headphone use and pedestrian injury and death in the United States: 2004e2011. Inj. Prev. 2012, doi:10.1136/injuryprev-2011-040161.
36. Jahncke, H.; Halin, N. Performance, fatigue and stress in open-plan offices: The effects of noise and restoration on hearing impaired and normal hearing individuals. Noise Heal. 2012, doi:10.4103/1463-1741.102966.
37. Kjellberg, A.; Muhr, P.; Sköldström, B. Fatigue after work in noise - an epidemiological survey study and three quasi-experimental field studies. Noise Health 1998.
38. Morata, T.C.; Themann, C.L.; Randolph, R.F.; Verbsky, B.L.; Byrne, D.C.; Reeves, E.R. Working in noise with a hearing loss: Perceptions from workers, supervisors, and hearing conservation program managers. Ear Hear. 2005, doi:10.1097/01.aud.0000188148.97046.b8.
39. Chimamise, C.; Gombe, N.T.; Tshimanga, M.; Chadambuka, A.; Shambira, G.; Chimusoro, A. Factors associated with severe occupational injuries at mining company in Zimbabwe, 2010: A cross-sectional study. Pan Afr. Med. J. 2013, doi:10.11604/pamj.2013.14.5.1148.
40. Friedman, L.S.; Almberg, K.S.; Cohen, R.A. Injuries associated with long working hours among employees in the US mining industry: Risk factors and adverse outcomes. Occup. Environ. Med. 2019, doi:10.1136/oemed-2018-105558.
74
41. Viljoen, D.A.; Nie, V.; Guest, M. Is there a risk to safety when working in the New South Wales underground coal-mining industry while having binaural noise-induced hearing loss? Intern. Med. J. 2006, doi:10.1111/j.1445-5994.2006.01034.x.
42. Toppila, E.; Pyykkö, I.; Pääkkönen, R. Evaluation of the increased accident risk from workplace noise. Int. J. Occup. Saf. Ergon. 2009, doi:10.1080/10803548.2009.11076796.
43. Melamed, S.; Fried, Y.; Froom, P. The joint effect of noise exposure and job complexity on distress and injury risk among men and women: The cardiovascular occupational risk factors determination in Israel study. J. Occup. Environ. Med. 2004, doi:10.1097/01.jom.0000141661.66655.a5.
44. Acton, W.L. Problems associated with the use of hearing protection. Ann. Occup. Hyg. 1977, doi:10.1093/annhyg/20.4.387.
45. Wilkins, P.A.; Acton, W.I. Noise and accidents-a review. Ann. Occup. Hyg. 1982.
46. Howell, K.; Martin, A.M. An investigation of the effects of hearing protectors on vocal communication in noise. J. Sound Vib. 1975, doi:10.1016/S0022-460X(75)80096-4.
47. Wilkins, P.; Martin, A.M. Hearing protection and warning sounds in industry-a review. Appl. Acoust. 1987, doi:10.1016/0003-682X(87)90050-8.
48. Girard, S.A.; Picard, M.; Davis, A.C.; Simard, M.; Larocque, R.; Leroux, T.; Turcotte, F. Multiple work-related accidents: tracing the role of hearing status and noise exposure. Occup. Environ. Med. 2009, doi:10.1136/oem.2007.037713.
49. Roberts, B.; Cheng, W.; Mukherjee, B.; Neitzel, R.L. Imputation of missing values in a large job exposure matrix using hierarchical information. J. Expo. Sci. Environ. Epidemiol. 2018, doi:10.1038/s41370-018-0037-x.
50. Cheng, W.; Roberts, B.; Mukherjee, B.; Neitzel, R.L. Meta-analysis of job-exposure matrix data from multiple sources. J. Expo. Sci. Environ. Epidemiol. 2018, doi:10.1038/jes.2017.19.
51. Ware, J.E.; Kosinski, M.; Keller, S.D. A 12-Item Short-Form Health Survey: Construction of Scales and Preliminary Tests of Reliability and Validity. Med. Care 1996, doi:10.1097/00005650-199603000-00003.
52. Reddy, R.; Welch, D.; Ameratunga, S.; Thorne, P. Development of the hearing protection assessment (HPA-2) questionnaire. Occup. Med. (Chic. Ill). 2014, doi:10.1093/occmed/kqt178.
53. Nondahl, D.M.; Cruickshanks, K.J.; Dalton, D.S.; Klein, B.E.K.; Klein, R.; Schubert, C.R.; Tweed, T.S.; Wiley, T.L. The impact of tinnitus quality of life in older adults. J. Am. Acad. Audiol. 2007, doi:10.3766/jaaa.18.3.7.
54. Cohen, S.; Kamarck, T.; Mermelstein, R. A global measure of perceived stress. J. Health Soc. Behav. 1983, doi:10.2307/2136404.
75
55. Hayes, B.E.; Perander, J.; Smecko, T.; Trask, J. Measuring Perceptions of Workplace Safety: Development and Validation of the Work Safety Scale. J. Safety Res. 1998, doi:10.1016/S0022-4375(98)00011-5.
56. Johns, M.W. A new method for measuring daytime sleepiness: The Epworth sleepiness scale. Sleep 1991, doi:10.1093/sleep/14.6.540.
57. Krupp, L.B.; Larocca, N.G.; Muir Nash, J.; Steinberg, A.D. The fatigue severity scale: Application to patients with multiple sclerosis and systemic lupus erythematosus. Arch. Neurol. 1989, doi:10.1001/archneur.1989.00520460115022.
58. Hart, S.G.; Staveland, L.E. Development of NASA-TLX (Task Load Index): Results of Empirical and Therortical Research. Adv. Psychol. 1988, 52, 139–183, doi:https://doi.org/10.1016/S0166-4115(08)62386-9.
59. Earshen, J.J. Sound measurement: Instrumentation and noise descriptors. In The Noise Manual; American Industrial Hygiene Association, 2000; pp. 41–100.
60. Seixas, N.; Neitzel, R.; Sheppard, L.; Goldman, B. Alternative metrics for noise exposure among construction workers. Ann. Occup. Hyg. 2005, doi:10.1093/annhyg/mei009.
61. Corry, M.; Sanders, M.; Searchfield, G.D. The accuracy and reliability of an app-based audiometer using consumer headphones: pure tone audiometry in a normal hearing group. Int. J. Audiol. 2017, doi:10.1080/14992027.2017.1321791.
62. Tillman, T.W.; Olsen, W.O. Speech audiometry. Mod. Dev. Audiol. 1973, 2, 37–74.
63. Neitzel, R.; Somers, S.; Seixas, N. Variability of real-world hearing protector attenuation measurements. Ann. Occup. Hyg. 2006, doi:10.1093/annhyg/mel025.
64. Bendel, R.B.; Afifi, A.A. Comparison of stopping rules in forward “stepwise” regression. J. Am. Stat. Assoc. 1977, doi:10.1080/01621459.1977.10479905.
65. Greenland, S. Modeling and variable selection in epidemiologic analysis. Am. J. Public Health 1989, doi:10.2105/AJPH.79.3.340.

76
10.0 Appendices:
Table of Contents Appendix A 1.0 Baseline Survey 2.0 Daily Survey 3.0 Informed Consent Form
Appendix B 1.0 SIC Dataset Tables
1.1 Industry NFDL Injuries 1.1.1 Industry NFDL Injury Rates 1983-2002 1.1.2 Industry NFDL Injury Rates 2003-2018
1.2 Industry Fatalities 1.2.1 Industry Fatality Rates 1983-2002 1.2.2 Industry Fatality Rates 2003-2018
1.3 Industry Noise Measurements 1.3.1 Industry Noise Measurements 1983-2002 1.3.2 Industry Noise Measurements 2003-2018
2.0 SOC Dataset Tables 2.1 Occupational NFDL Injuries
2.1.1 Occupational NFDL Injury Counts 1983-2002 2.1.2 Occupational NFDL Injury Rates 2003-2018
2.2 Occupational Fatalities 2.2.1 Occupational Fatal Counts 1983-2002 2.2.2 Occupational Fatal Rates 2003-2018
2.3 Occupational Noise Measurements 2.3.1 Occupational Noise Measurements 1983-2002 2.3.2 Occupational Noise Measurements 2003-2018
3.0 Mines Visited Tables 3.1 Company 1
3.1.1 Summary Data on Company 1 – Limestone Mines 3.1.2 Summary Data on Company 1 – Lime Mines
3.2 Company 2 3.2.1 Summary Data on Company 2 – Sand Mines
4.0 Analysis Tables 4.1 Bivariate Negative Binomial Analysis for NFDL Injuries
4.1.1 Supplement to Table 4.1 4.2 Supplement to Table 3 4.3 Bivariate Logistic Regression Analysis of Fatalities

1.0 Baseline Survey
BASELINE NOISE, HEARING LOSS, HEARING PROTECTION,
AND INJURY SURVEY
SUBJECT ID:
______________________________________________________________________
__________
DATE: ___________________________ MM/DD/YYYY
PLEASE PROCEED TO PAGE 2

Pt. 1: YOU AND YOUR EMPLOYMENT
1. What is your current job title? ______________________________________________________
2. How long have you worked in your current job for your current employer? _______ years ________ months
3. How many hours per week do you usually work in your current job?
________hours/week
4. What is the total amount of time you have worked in this industry? _______ years ________ months
Pt. 2: HEALTH AND FITNESS (Ware, 1996)
5. In general, would you say your health is:
[ ]1 Excellent [ ]2 Very Good [ ]4 Good [ ]4 Fair [ ]5 Poor
The following questions are about activities you might do during a typical day. Does your health now limit you in these activities? If so, how much?
YES, limited a
lot
YES, limited a
little
NO, not limited at
all 6. Moderate activities such as moving a table,
pushing a vacuum cleaner, bowling, or playing golf. [ ]1 [ ]2 [ ]3
7. Climbing several flights of stairs. [ ]1 [ ]2 [ ]3
During the past 4 weeks, have you had any of the following problems with your work or other regular daily activities as a result of your physical health?
YES NO 8. Accomplished less than you would like. [ ]1 [ ]2 9. Were limited in the kind of work or other activities. [ ]1 [ ]2
During the past 4 weeks, have you had any of the following problems with your work or other regular daily activities as a result of any emotional problems (such as feeling depressed or anxious)?
YES NO 10. Accomplished less than you would like. [ ]1 [ ]2 11. Were limited in the kind of work or other activities. [ ]1 [ ]2
12. During the past 4 weeks, how much did pain interfere with your normal work (including work outside the home and housework)?
[ ]1 Not at all [ ]2 A bit [ ]4 Moderately [ ]4 Quite a bit [ ]5 Extremely

These questions are about how you have been feeling during the past 4 weeks.
For each question, please give the one answer that comes closest to the way you have been feeling.
How much of the time during the past 4 weeks…
All of the time
Most of the time
A good bit of the time
Some of the time
A little of the time
None of the time
13. Have you felt calm and peaceful? [ ]1 [ ]2 [ ]3 [ ]4 [ ]5 [ ]6 14. Did you have a lot of energy [ ]1 [ ]2 [ ]3 [ ]4 [ ]5 [ ]6 15. Have you felt down-hearted and blue? [ ]1 [ ]2 [ ]3 [ ]4 [ ]5 [ ]6
16. During the past 4 weeks, how much of the time has your physical health or emotional problems interfered with your social activities (like visiting friends, relatives, etc.)?
[ ]1 All of the time [ ]2 Most of the time [ ]4 Some of the time [ ]4 A little of the time [ ]5
None of the time
17. How would you describe your overall fitness?
[ ]0 Poor [ ]1 Fair [ ]2 Good [ ]3 Very Good [ ]4 Excellent
Pt. 3: NOISE EXPOSURE AND HEARING (Nondahl, 2002)
18. How often are you exposed to high noise at work? “High noise” means or loud
enough that person has to raise their voice to talk to someone about 3 feet away.
[ ]1 None of the time [ ]2 A little of the time [ ]3 Some of the time [ ]4 Most of the time [ ]5 All of the time
19. For how many years have you worked in high noise? ________ years
20. How would you rate your hearing?
[ ]1 Good [ ]2 A little trouble [ ]3 A lot of trouble [ ]4 Deaf or nearly deaf
21. Do you have any difficulties with your hearing?
[ ]1 Yes [ ]0 No
22. Have you ever seen a doctor about problems with your ears?
[ ]1 Yes [ ]0 No
If yes, please explain:____________________________________________________________________
23. Have you ever been told by a doctor that you had a hearing loss?
[ ]1 Yes [ ]0 No
24. In the past year have you had buzzing, ringing, or noise in your ears?
[ ]1 Yes [ ]2 No
25. How severe is this noise in your ears in its worst form?
[ ]1 Mild [ ]2 Moderate [ ]3 Severe
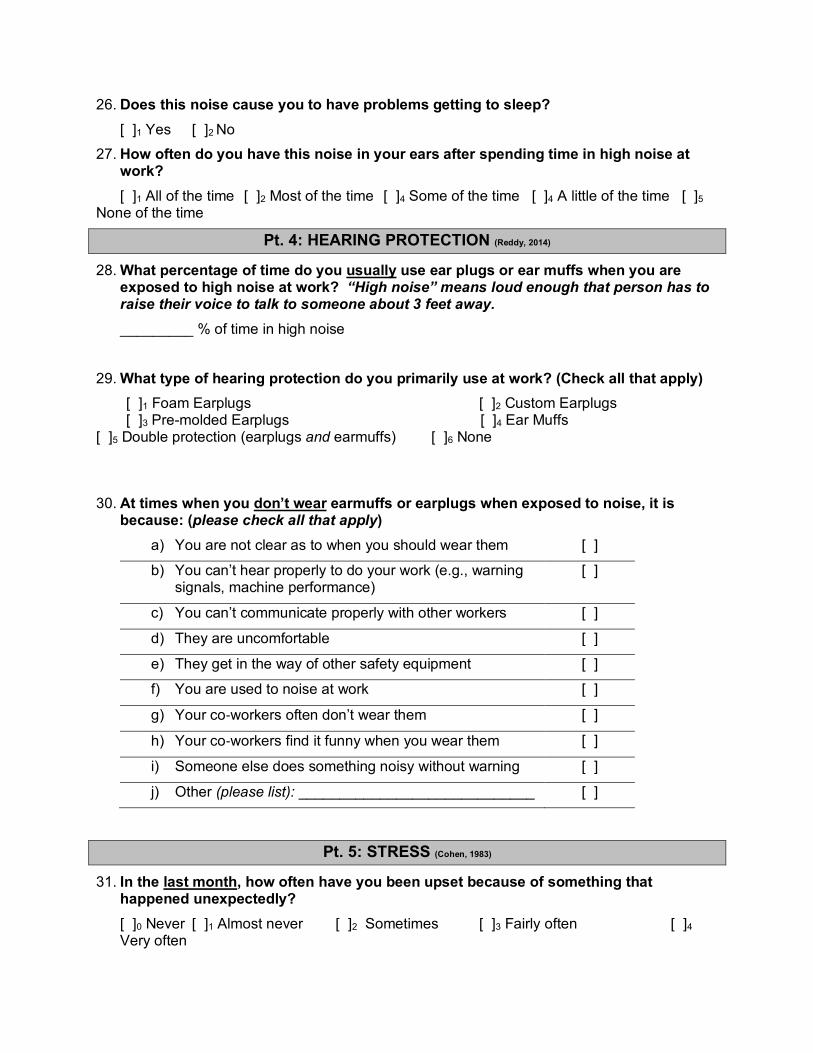
26. Does this noise cause you to have problems getting to sleep?
[ ]1 Yes [ ]2 No
27. How often do you have this noise in your ears after spending time in high noise at work?
[ ]1 All of the time [ ]2 Most of the time [ ]4 Some of the time [ ]4 A little of the time [ ]5
None of the time
Pt. 4: HEARING PROTECTION (Reddy, 2014)
28. What percentage of time do you usually use ear plugs or ear muffs when you are exposed to high noise at work? “High noise” means loud enough that person has to
raise their voice to talk to someone about 3 feet away.
_________ % of time in high noise
29. What type of hearing protection do you primarily use at work? (Check all that apply)
[ ]1 Foam Earplugs [ ]2 Custom Earplugs [ ]3 Pre-molded Earplugs [ ]4 Ear Muffs
[ ]5 Double protection (earplugs and earmuffs) [ ]6 None
30. At times when you don’t wear earmuffs or earplugs when exposed to noise, it is because: (please check all that apply)
a) You are not clear as to when you should wear them [ ]
b) You can’t hear properly to do your work (e.g., warning signals, machine performance)
[ ]
c) You can’t communicate properly with other workers [ ]
d) They are uncomfortable [ ]
e) They get in the way of other safety equipment [ ]
f) You are used to noise at work [ ]
g) Your co-workers often don’t wear them [ ]
h) Your co-workers find it funny when you wear them [ ]
i) Someone else does something noisy without warning [ ]
j) Other (please list): _____________________________ [ ]
Pt. 5: STRESS (Cohen, 1983)
31. In the last month, how often have you been upset because of something that happened unexpectedly?
[ ]0 Never [ ]1 Almost never [ ]2 Sometimes [ ]3 Fairly often [ ]4
Very often

32. In the last month, how often have you felt that you were unable to control the important things in your life?
[ ]0 Never [ ]1 Almost never [ ]2 Sometimes [ ]3 Fairly often [ ]4
Very often
33. In the last month, how often have you felt nervous and "stressed"?
[ ]0 Never [ ]1 Almost never [ ]2 Sometimes [ ]3 Fairly often [ ]4
Very often
34. In the last month, how often have you felt confident about your ability to handle your personal problems?
[ ]0 Never [ ]1 Almost never [ ]2 Sometimes [ ]3 Fairly often [ ]4
Very often
35. In the last month, how often have you felt that things were going your way?
[ ]0 Never [ ]1 Almost never [ ]2 Sometimes [ ]3 Fairly often [ ]4
Very often
36. In the last month, how often have you found that you could not cope with all the things that you had to do?
[ ]0 Never [ ]1 Almost never [ ]2 Sometimes [ ]3 Fairly often [ ]4
Very often
37. In the last month, how often have you been able to control irritations in your life?
[ ]0 Never [ ]1 Almost never [ ]2 Sometimes [ ]3 Fairly often [ ]4
Very often
38. In the last month, how often have you felt that you were on top of things?
[ ]0 Never [ ]1 Almost never [ ]2 Sometimes [ ]3 Fairly often [ ]4
Very often
39. In the last month, how often have you been angered because of things that happened that were outside of your control?
[ ]0 Never [ ]1 Almost never [ ]2 Sometimes [ ]3 Fairly often [ ]4
Very often
40. In the last month, how often have you felt difficulties were piling up so high that you could not overcome them?
[ ]0 Never [ ]1 Almost never [ ]2 Sometimes [ ]3 Fairly often [ ]4
Very often
Pt. 6: INJURIES
41. In the last month have you had any injuries, health conditions, or medical treatments that affected your ability to balance or walk?
[ ]1 Yes [ ]0 No
If yes, please explain:____________________________________________________________________
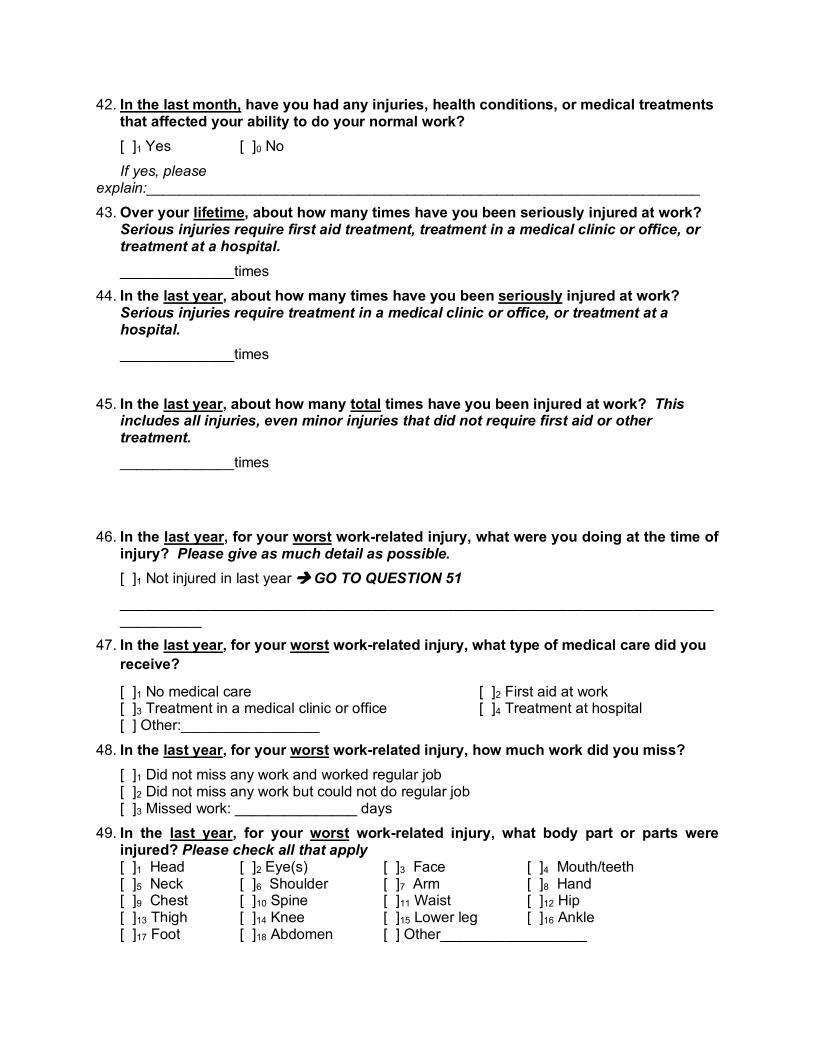
42. In the last month, have you had any injuries, health conditions, or medical treatments that affected your ability to do your normal work?
[ ]1 Yes [ ]0 No
If yes, please explain:____________________________________________________________________
43. Over your lifetime, about how many times have you been seriously injured at work? Serious injuries require first aid treatment, treatment in a medical clinic or office, or
treatment at a hospital.
______________times
44. In the last year, about how many times have you been seriously injured at work? Serious injuries require treatment in a medical clinic or office, or treatment at a
hospital.
______________times
45. In the last year, about how many total times have you been injured at work? This
includes all injuries, even minor injuries that did not require first aid or other
treatment.
______________times
46. In the last year, for your worst work-related injury, what were you doing at the time of injury? Please give as much detail as possible.
[ ]1 Not injured in last year à GO TO QUESTION 51
___________________________________________________________________________________
47. In the last year, for your worst work-related injury, what type of medical care did you receive?
[ ]1 No medical care [ ]2 First aid at work [ ]3 Treatment in a medical clinic or office [ ]4 Treatment at hospital [ ] Other:_________________
48. In the last year, for your worst work-related injury, how much work did you miss?
[ ]1 Did not miss any work and worked regular job [ ]2 Did not miss any work but could not do regular job [ ]3 Missed work: _______________ days
49. In the last year, for your worst work-related injury, what body part or parts were injured? Please check all that apply [ ]1 Head [ ]2 Eye(s) [ ]3 Face [ ]4 Mouth/teeth [ ]5 Neck [ ]6 Shoulder [ ]7 Arm [ ]8 Hand [ ]9 Chest [ ]10 Spine [ ]11 Waist [ ]12 Hip [ ]13 Thigh [ ]14 Knee [ ]15 Lower leg [ ]16 Ankle [ ]17 Foot [ ]18 Abdomen [ ] Other__________________
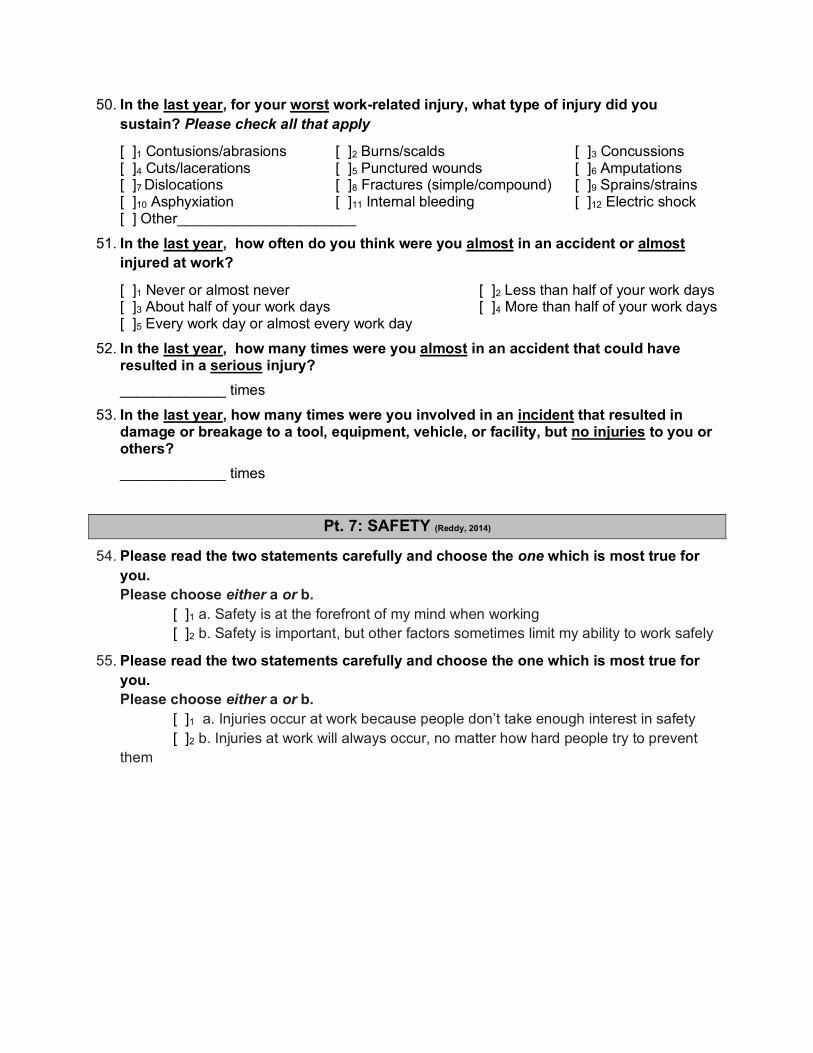
50. In the last year, for your worst work-related injury, what type of injury did you
sustain? Please check all that apply
[ ]1 Contusions/abrasions [ ]2 Burns/scalds [ ]3 Concussions [ ]4 Cuts/lacerations [ ]5 Punctured wounds [ ]6 Amputations [ ]7 Dislocations [ ]8 Fractures (simple/compound) [ ]9 Sprains/strains [ ]10 Asphyxiation [ ]11 Internal bleeding [ ]12 Electric shock [ ] Other______________________
51. In the last year, how often do you think were you almost in an accident or almost injured at work?
[ ]1 Never or almost never [ ]2 Less than half of your work days [ ]3 About half of your work days [ ]4 More than half of your work days [ ]5 Every work day or almost every work day
52. In the last year, how many times were you almost in an accident that could have resulted in a serious injury?
_____________ times
53. In the last year, how many times were you involved in an incident that resulted in damage or breakage to a tool, equipment, vehicle, or facility, but no injuries to you or others?
_____________ times
Pt. 7: SAFETY (Reddy, 2014)
54. Please read the two statements carefully and choose the one which is most true for
you. Please choose either a or b.
[ ]1 a. Safety is at the forefront of my mind when working [ ]2 b. Safety is important, but other factors sometimes limit my ability to work safely
55. Please read the two statements carefully and choose the one which is most true for
you. Please choose either a or b. [ ]1 a. Injuries occur at work because people don’t take enough interest in safety [ ]2 b. Injuries at work will always occur, no matter how hard people try to prevent them

Think about your current job. Do you agree or disagree that each of the following words or phrases describes your job? Place an r or ü mark in the appropriate box for each statement.
Strongly disagree
Disagree Neither agree nor disagree
Agree Strongly agree
56. Dangerous c1 c2 c3 c4 c5 57. Safe c1 c2 c3 c4 c5 58. Hazardous c1 c2 c3 c4 c5 59. Risky c1 c2 c3 c4 c5 60. Unhealthy c1 c2 c3 c4 c5 61. Could get hurt easily c1 c2 c3 c4 c5 62. Unsafe c1 c2 c3 c4 c5 63. Fear for health c1 c2 c3 c4 c5 64. Chance of death c1 c2 c3 c4 c5 65. Scary c1 c2 c3 c4 c5
Pt. 8: SLEEPINESS
On any given day, how likely are you to doze off or fall asleep in the following situations?
No chance of nodding off
Slight chance of nodding off
Moderate chance of sleeping
High chance of falling asleep
66. Sitting inactive in a public place c1 c2 c3 c4 67. Sitting and reading c1 c2 c3 c4 68. Watching TV c1 c2 c3 c4 69. As a passenger in a car for an hour without a break c1 c2 c3 c4 70. Lying down in the afternoon when time permits c1 c2 c3 c4 71. Sitting and talking to someone c1 c2 c3 c4 72. Sitting quietly after lunch without alcohol c1 c2 c3 c4 73. In a car, while stopped for a few minutes in traffic c1 c2 c3 c4
Pt. 9: FATIGUE (Chalder, 1993)
During the last week, I have found that:
Disagree Agree
74. My motivation is lower when I am fatigued. 1 2 3 4 5 6 7 75. Exercise brings on my fatigue. 1 2 3 4 5 6 7 76. I am easily fatigued. 1 2 3 4 5 6 7 77. Fatigue interferes with my physical functioning. 1 2 3 4 5 6 7 78. Fatigue causes frequent problems for me. 1 2 3 4 5 6 7 79. My fatigue prevents sustained physical functioning. 1 2 3 4 5 6 7 80. Fatigue interferes with carrying out certain duties and
responsibilities. 1 2 3 4 5 6 7
81. Fatigue is among my three most disabling symptoms. 1 2 3 4 5 6 7 82. Fatigue interferes with my work, family or social life. 1 2 3 4 5 6 7

Pt. 10: ABOUT YOU
Date of Birth:________/_________/____________mm/dd/yyyy
Age:______________ years Sex: [ ]1 Male [ ]2 Female[ ]3 Other/Prefer not to say
Height:______________ feet and inches
Weight:___________ pounds
Thank you for your participation!

2.0 Daily Survey NOISE, HEARING LOSS, HEARING PROTECTION, AND INJURY SURVEY
SUBJECT ID:________ Date___________
DAILY ACTIVITIES
1. What time did you begin work today? _____:_____ [ ]1 AM [ ]2 PM
2. What time did you finish work today?_____:_____ [ ]1 AM [ ]2 PM
3. What work activity did you do for the longest amount of time today?
__________________________
_____________________________________________________________________________________
NOISE AND HEARING PROTECTION
4. How often did you use ear plugs or ear muffs when you were exposed to high noise at work today? “High noise” means loud enough that a person has to raise their voice
to talk to someone 3 ft away. (Check one.)
[ ]1 None of the time [ ]2 A little of the time [ ]3 Some of the time [ ]4 Most of the time [ ]5 All of the time
5. What type of hearing protection did you use at work today? (Check all that apply)
[ ]1 Foam Earplugs [ ]2 Custom Earplugs [ ]3 Pre-molded Earplugs [ ]4 Ear Muffs [ ]5 Double protection (earplugs and earmuffs) [ ]6 None
Normal speaking voice or quieter
As loud as a vacuum
As loud as a motorcycle
As loud as a chainsaw
As loud as a siren or louder
6. Please circle the noise level you spent the most time in at work today
1 2 3 4 5
SAFETY AND NEAR-MISSES
7. Did you experience a narrow escape from injury at work today? [ ]1 Yes [ ]0 No IF
NO à GO TO 8
a. What time did this narrow escape happen? ______:______ [ ]1 AM [ ]2 PM
b. Where did this narrow escape happen?_____________________________________________
c. What were you doing when this narrow escape happened? _____________________________
___________________________________________________________________
____________
d. Were you wearing hearing protection at the time the narrow escape happened? [ ]1Yes [ ]0No
e. What treatment do you think you would have needed if you had not escaped?
[ ]1 No treatment [ ]2 First aid treatment only [ ]1 Non-emergency medical treatment [ ]2 Emergency medical treatment

8. Did you have an incident at work today that resulted in damage to a tool, equipment, vehicle, or the facility, but no injuries to you or others? [ ]1 Yes [ ]0 No IF NO à GO
TO 9
a. What time did this incident happen? ______:______ [ ]1 AM [ ]2 PM
b. Where did this incident happen? ___________________________________________________
c. What were you doing when this incident happened? ________________________________
______________________________________________________________________
___________
d. Were you wearing hearing protection at the time the incident happened? [ ]1Yes [ ]0No
e. How much damage would you say the incident caused?
[ ]1 Almost no damage, hardly noticeable [ ]2 Slight damage, but no repair required [ ]3 Some damage, repair required [ ]4 Major damage - large repair or replacement
9. Were you injured at work today? Include any injury, even if you did not need first aid
or medical treatment [ ]1 Yes [ ]0 No IF NO à GO TO 10
a. What time did this injury happen? ______:______ [ ]1 AM [ ]2 PM
b. Where did this injury happen?_____________________________________________________
c. What type of injury did you get?______________________________ ___ ____________________
__________________________________________________________________________________
f. Were you wearing hearing protection at the time the injury happened? [ ]1Yes [ ]0No
g. What body part was injured? ________ _____________________________________________
h. What were you doing when this injury happened? ___________________________________ ___
________________________________________________________________________________
i. What treatment did your injury require, if any?
[ ]1 No treatment [ ]2 First aid treatment only [ ]3 Non-emergency medical treatment [ ]4 Emergency medical treatment

SLEEP
10. Circle the number from 1 to 9 that best reflects your current level of sleepiness:
Extremely alert Alert
Neither alert nor sleepy
Sleepy – but no difficulty remaining awake
Extremely sleepy – fighting sleep
1 2 3 4 5 6 7 8 9
11. How many hours did you sleep last night (not number of hours spent in bed)?
________ hours
12. How well did you sleep last night?
Worst sleep Possible
Neither good nor bad Best sleep possible
1 2 3 4 5 6 7 8 9 10
STRESS
13. Please rate the overall level of stress you experienced today:
Not very stressful
Very little stress A little stress Some stress Much stress
Very much stress Caused panic
1 2 3 4 5 6 7
DEMANDS
14. Please place an ‘X’ on the scales below to rate the demands that were placed on you at work today:
a. MENTAL DEMAND How mentally demanding was your work?
Very low Very high
b. PHYSICAL DEMAND How physically demanding was your work?
Very low Very high
c. TIME DEMAND How hurried or rushed was the pace of your work? Very low Very high
d. EFFORT How hard did you have to work today to accomplish your level of performance? Very low Very high
e. FRUSTRATION How insecure, discouraged, irritated, stressed, and annoyed were you at work?
Very low Very high

3.0 Informed Consent Form
Assessing Noise Exposures, Hearing, and Risk of Injuries among Miners Written Consent Form
1) Background Information
Dr. Rick Neitzel of the University of Michigan (UM) invites you to participate in a study of the influence of noise exposures, hearing loss, and use of hearing protectors on injury risk . We are studying workers at your worksite. We are asking you to participate.
We want you to know that being in this study is entirely voluntary. You may choose not to be in the study, or may pull out of the study at any time. You will receive some benefits from taking part, and the research will provide information that might be used to help people in the future. Before you agree to participate to be in the study, please take as much time as you need to have your questions answered.
2) What is the purpose of the study? The purpose of this study is to learn about injury risks among miners that result from exposure to high noise, use of hearing protectors like earmuffs and earplugs, and hearing loss.
3) What will I be asked to do? At the start of the study, we will ask you to complete a survey about you, your work, and your health. The survey will take about 15 minutes of your time. After the survey, we will ask you to complete a standard hearing test (called an audiometric test), as well as a similar test that measures how much noise your hearing protectors block. We will ask you to wear a noise meter (dosimeter) for 3 consecutive workdays. On each of these days, we will ask you to complete an activity log to detail your work activities, health, and any accidents or injuries you experienced during the day. We will share with you the results of your own noise measurements, hearing tests, and hearing protector tests after you complete the tests.
Your picture may be taken as part of our research. However, you do not have to have your picture taken to participate.
4) Are there any benefits or risks associated with my participation? Benefits: This research will benefit you by giving you information about your noise levels, your hearing, and the amount of noise your hearing protectors block.
Risks: We believe our study presents no foreseeable risks to you. The study involves trained research staff using standard occupational health and research practices.
5) Will I receive any payment for participating in the study?
You will receive $50 as a thank-you for each 3 consecutive day period of participation up to twice.
6) What are my participation alternatives? In order for you to be in the study, you must agree to be in the study. You may withdraw your
permission and discontinue participation at any time. You can skip any survey or activity diary questions that you are not comfortable answering.
7) Will my information and study results be kept confidential? We plan to publish the results of this study. However, we will not include any information that would identify you. To keep your information safe, all study data will be kept in secure locations at UM. Only study personnel at these locations will have access to your data. All study data will be stored at UM for 10 years, and may be used in the future for further analysis. However, analyses will be of coded data not linked to your actual identity. We may share your research data with other investigators without asking for your consent again, but it will not contain information that could directly identify you.
8) What if I have further questions? If you have any questions during this study, you may contact Dr. Rick Neitzel at 734-763-2870.
If you have questions regarding your rights as a participant in research, please contact the University of Michigan Health Sciences and Behavioral Sciences Institutional Review Board, 2800 Plymouth Rd. Building 520, Suite 1169, Ann Arbor, MI 48109-2800, +1 734 936 0933, [email protected].
Consent
By signing this paper, you are agreeing that the purpose and details of the study have been explained to you. You are agreeing to participate. You will be given a copy of this paper for your records and a signed copy will be kept with the study records.
[ ] Yes [ ] No I consent to completing the study survey.
[ ] Yes [ ] No I consent to a hearing test and test of how much noise my hearing protectors block.
[ ] Yes [ ] No I consent to having my noise exposures measured and to completing a daily activity, accident, and injury diary.
[ ] Yes [ ] No I consent to the de-identified retention of my study data.
Signed_______________________________________ Date: ___/___/___
[ ] Yes [ ] No I consent to having my picture taken.
Signed_______________________________________ Date: ___/___/___
Print name: ___________________________________

FOR STUDY USE ONLY Investigator: ___________________________________Date: ___/___/___

Table 1.1.1 Industry NFDL Injury Rates 1983-2002 Canvass Industry Year
1983 1984 1985 1986 1987 1988 1989 1990 1991 1992 1993 1994 1995 1996 1997 1998 1999 2000 2001 2002
Coal
Anthracite 10.04 10.88 11.58 10.9 12.84 12.61 17.65 14.97 14.49 13.94 14.24 14.05 16.47 12.77 10.22 11.05 8.61 12.21 10.16 9.54 Bituminous 6.57 6.6 6.05 6.63 9.16 9.61 9.24 9.13 9.12 8.56 8.21 8.18 7.39 6.33 6.19 6.42 5.97 5.96 5.29 5.37 Total 6.61 6.64 6.11 6.68 9.19 9.64 9.31 9.18 9.17 8.61 8.28 8.24 7.49 6.41 6.24 6.47 6.00 6.03 5.32 5.40
Met
al
Alumina (Mill) 1.47 1.48 1.74 2.11 2.93 3.76 3.49 2.59 3.51 3.06 2.92 2.35 2.35 3.61 3.3 2.42 2.23 1.46 1.79 1.76 Aluminum Ore 2.89 2.97 2.33 3.31 1.35 1.75 0 2.47 1.72 4.73 1.61 5.43 0 - 1.48 1.18 4.43 1.66 2.67 3.81 Antimony - 44.42 - - - - - - - - - - - - - - - - - - Beryl 2.94 1.84 3.84 1.02 2.78 0 0.94 - 3.72 2.96 2.39 3.33 1.17 1.18 3.08 2.16 3.22 0 1.15 1.49 Chromite - - - - - - - - - - - - - - - - - - - 6.3 Cobalt - - - - 21.59 - - 62.81 - - 14.17 0 - - - - - - - - Copper Ore 2.17 2.72 2.69 3.28 3.41 3.56 3.04 2.64 2.56 2.14 2.28 2.89 1.92 1.39 2.27 2.46 1.93 1.68 1.24 1.42 Gold (lode and placer) 5.55 4.36 4.05 4.56 5.37 5.23 4.92 4.22 3.55 3.29 3.16 2.87 3.17 3.84 2.74 2.15 2.48 2.64 2.19 1.97 Iron ore 3 3.31 2.56 3.19 5.97 6.76 5.71 5.77 6.54 4.67 4.44 3.57 3.44 3.34 3.48 2.98 2.96 2.34 2.61 2.28 Lead/Zinc Ore 6.97 5.2 4.58 4.42 5.33 4.76 5.74 4.48 3.55 2.7 3.46 4.4 2.57 3.34 2.17 2.94 2.16 3.72 3.11 3.03 Manganese 2.33 7.23 22.92 5.46 5.54 7.7 9.34 4.93 7.38 3.08 5 2.27 2.42 2.95 6.66 4.88 8.08 5.31 4.26 8.11 Mercury 3.53 3.82 2.17 3.13 12.59 4.35 4.85 - - - - - - - - - - - - - Metal ores, NEC 4.03 1.38 10.52 9.11 12.52 384.62 - 2.19 - 0 - - - - 0 1.96 0 - 2.71 5.33 Molybdenum 4.54 3.56 4.08 3.01 2.2 2.47 4.2 3.63 4 2.97 3.2 3.08 4.07 2.4 3.04 5.21 3.49 2.63 1.11 2.19 Nickel - 5.08 10.84 16.44 - - - 7.22 4.92 0.83 - - - 4.36 - - - - - - Platinum group 22 11.2 - - 3.3 5.04 2.63 3 5.21 13.83 11.91 9.53 11.26 10.6 8.44 11.06 12.84 8.38 5.08 4.6 Rare earths 3.39 2.26 1.87 3.85 5.67 2.5 4 0 1.5 1.34 2.34 0.77 1.18 0.28 0.29 25.04 1.25 0 1.95 2.1 Silver ores 5.89 6.51 4.06 5.1 5.94 8.82 9.17 8.21 7.92 4.71 5.23 5.44 4.73 3.03 3.51 3.03 5.12 4.58 3.21 3.07 Titanium 3.84 0.66 2.98 2.05 2.14 1.31 2.96 1.66 2.02 1.35 2.61 0.53 2.07 1.24 0.94 3.23 1.26 2.25 1.45 2.89 Tungsten 9.28 6.92 5.88 2.43 1.36 3.65 3.76 1.14 3.42 - 5.59 - 5.79 1.5 4.71 2.25 - - - - Uranium 3.23 4.03 4.2 5.28 4.32 5.23 4.4 3.05 6.71 3.82 2.95 2.76 7.06 6.83 6.67 9.99 10.92 5.27 6.94 8.3 Uranium - vanadium ores 9.42 12.82 8.05 13.17 9.4 12.17 3.79 6.72 4.37 6.77 - - - 4.52 - 9.74 9.46 5.31 7.62 - Vanadium 1.99 8.22 1.2 0 1.76 0.92 2.53 2.49 - 1.59 4.63 4.12 2.46 3.28 1.95 1.71 1.02 0 13.13 5.76 Zircon - 7.81 3.72 3.73 7.91 10.28 8.95 11.5 4.06 - - - - 4.07 - 3.87 - 3.64 - 8.32 Total 3.47 3.53 3.21 3.66 4.53 4.99 4.67 4.07 3.97 3.24 3.23 3.12 2.89 3.01 2.89 2.82 2.81 2.51 2.22 2.28
Nonmetal Aplite 2.76 3 0 5.33 0 - 5.63 2.66 5.78 2.79 - 2.87 - 3.13 0 0 3.13 3.16 0 -
Asbestos 2.67 3.75 3.12 2.59 4.69 13.03 2.64 6.61 5.01 12.56 11.16 9.27 7 7.52 7.41 14 11.54 11.57 - 27.89 Barite 6.18 7.63 5.95 6.19 4.98 7.44 7.82 9.37 4.76 4.91 7.65 5.13 9.46 7.46 5.25 6.25 4.94 6.09 7.3 7.49 Boron Materials 4.75 2.88 1.9 2.97 2.18 1.99 1.33 1.55 1.72 1.49 2.67 2.99 1.76 3.12 2.05 1.32 1.85 2.44 1.89 1.2 Brucite - - - - - - - - - - - - - - - - - - 0 - Cement 3.32 4.44 5.14 4.6 4.95 5.98 4.88 5.23 4.45 4.76 4.78 4.6 3.84 3.81 3.84 4.15 4.17 4.57 4.66 4.32 Chemical and
fertilizer, NEC - - - - - - 6.57 4.22 3.36 3.74 0 3.56 3.05 2.02 1.47 4.4 24.49 3.41 4.41 8.15 Clay (common) 2.91 2.99 2.32 1.98 3.24 3.95 3.77 3.38 3.74 3.74 3.07 3.01 2.99 2.33 2.69 2.43 2.73 2.3 2.56 2.26 Clay (fire) 6.12 5.2 3.92 3.11 6.29 6.31 6.06 6.62 7.39 7.12 7.32 8.15 7.58 3.8 7.03 4.94 4.26 6.27 4.15 6.11 Clay, Ceramic and
refractory, NEC 4.59 1.21 7.68 0 7.1 7.67 1.78 2.76 28 5.47 5.54 0 4.87 10.58 2.57 4.12 5.07 6.72 4.73 3.02

Canvass Industry Year 1983 1984 1985 1986 1987 1988 1989 1990 1991 1992 1993 1994 1995 1996 1997 1998 1999 2000 2001 2002 Construction S&G;
Sand, common - - - - - - - - - - - - - - - - - - - - Feldspar 3.95 5.49 4.69 5.34 4.54 5.15 6.15 3.59 4.41 7.13 1.49 4.25 2.77 3.23 2.81 2.19 2.91 5.86 2.91 5.13 Fluorspar 3.78 3.46 3.79 2.99 8.59 5.14 6.92 4.38 5.04 5.47 6 1.77 7.24 0 - 17.26 - - - - Gemstones - - - - - 220.99 9.05 17.55 11.35 9.12 6.69 8.43 9.1 6.11 8.62 3.85 5.3 5.11 7.96 9.88 Gilsonite 5.08 12.27 15.2 4.99 5.66 10.77 7.35 10.5 13.11 5.27 12.14 9.28 7.23 4.49 3.48 3.29 4.9 5.05 3.3 9.41 Granite (crushed
and broken) 4.64 3.3 3.2 3.16 3.81 3.94 3.71 4.39 4.44 4.08 3.39 3.17 3.34 3.35 3.52 3.38 2.98 3.28 3.47 3.36 Granite
(dimension) 12.39 14.02 10.72 10.16 14.58 15.4 14.73 12.91 15.38 14.6 14.76 18.52 9.97 10.12 10.56 14.76 9.01 12.28 8.92 6.93 Gypsum 3.32 2.03 2.29 3.14 3.01 3.03 2.45 2.27 4.05 1.9 2.23 2.36 2.41 3.04 2 2.11 3.01 2.79 2.9 1.19 Kyanite 4.69 3.02 4.34 3.67 4.72 4.61 5.89 5.35 2.88 2.33 6.19 3.48 4.98 4.64 3.6 9.27 6.66 3.84 3.66 2.24 Leonardite 6.41 5.83 6.73 0 0 11.1 21.82 6.47 9.48 0 6.2 12.38 49.7 5.32 20.89 17.06 8.54 5.95 12.36 27.44 Lime 5.2 4.71 3.93 4.06 4.39 5.69 5.91 4.82 4.99 5.25 5.2 5.76 4.62 5.34 3.49 4.29 4.21 5.03 4.65 4.47 Limestone
(crushed and broken) 4.33 4.45 4.49 4.98 5.28 5.62 5.88 5.67 6.06 5.52 5.45 5.26 4.88 4.64 4.48 4.55 4.56 4.61 4.52 4.48
Limestone (dimension) 5.83 7.82 5.76 10.21 9.78 11.32 11.68 11.56 9.99 13.88 8.75 10.12 7.07 9.04 8.54 8.11 8.67 10.59 10.29 8.15
Lithium 1.42 3.63 2.13 0.65 1.67 0.86 0.95 6.78 1.4 2.73 0 0 1.28 0 0 - - - - - Magnesite 5.44 7.08 5.39 10.56 11.99 13.59 7.71 4.29 5.91 4.32 0 1.39 2.22 5.35 2.35 2.64 3.99 10.07 7.29 5.16 Marble (crushed
& broken) 1.99 2.44 2.8 2.16 2.37 3.42 2.63 3.42 1.37 2.01 1.74 1.83 0.93 1.29 2.67 2.29 2.11 3.94 3.2 5.62 Marble
(dimension) 7.37 13.41 10.5 13.19 9.5 9.5 6.83 6.26 7.87 10.2 6.33 13.08 10.7 6.87 17.28 12.98 17.44 11.82 11.27 4.32 Mica 5.61 3.55 4.48 4.77 3.97 7.31 5.84 5.65 3.35 3.84 6.18 4.02 3.36 4.2 1.07 3.95 2.93 1.84 4.85 4.57 Nonmetallic
minerals, NEC 7.48 9.36 5.92 5.39 6.86 10.2 7.63 8.76 7.84 7.03 7.09 7.01 5.77 5.39 6.19 5.77 7.28 6.23 5.39 4.32 Oil mining - - - - - - - - - - - - - - - - - - - - Oil sand - - 15.24 - - 5.73 6.02 0 63.9 0 - - 0 25.97 0 - - - - - Oil shale 2.41 2.34 2.09 4.55 4.98 10.49 3.66 4.82 3.55 - - - - 0 - - - - - - Perlite 10.84 4.67 10.83 10.9 10.17 10.25 17.14 15.59 6.36 6.68 8.39 5.73 5.07 6.65 6.79 6.39 5.38 6.57 5.85 7.9 Phosphate rock 1.65 1.2 1.07 1.3 1.84 2.34 2.73 2.8 2.22 2.27 1.83 1.3 1.22 1.32 1.39 1.68 2.48 2.46 2.53 2.37 Pigment mineral - - - - - 4.91 20.9 13.78 5.06 3.52 2.42 7.53 5.48 - 5.64 2.33 3.54 1.97 4.08 11.14 Potash 2.26 2.12 2.45 2.47 3.74 2.4 3.16 3.78 4.5 3.21 4.13 1.57 2.38 1.99 3.08 2.36 1.27 1.86 2.82 1.76 Potash, soda, &
borate minerals, NEC 2.93 4.65 3.88 6.01 3.02 2.21 3.75 5.83 4.51 5.17 12.7 - - - 14.46 9.48 - - - 0
Pumice 12.5 7.92 4.38 11.18 12.06 9.38 15.81 11.4 18.8 10.82 9.5 10.31 12.37 4.11 11.66 8.68 10.38 8.54 14.19 5.17 Pyrites - - - - 15.41 - - - - - - - - - - - - - - - Salt (evaporated) 5.04 3.47 5.64 7.5 6.13 6.75 7.73 11.35 8.12 6.67 4.4 4.62 2.66 4.41 3.51 4.88 4.25 1.7 2.77 3.41 Salt (rock) 4.56 4.4 4.63 5.22 4.43 4.35 4.87 6.03 4.14 2.1 3.26 3.15 2.17 2.42 2.14 2.38 3.16 2.19 2.53 1.94 Sand & gravel 7.53 8.19 8.03 8.61 8.31 8.51 9.67 9.37 9.2 8.83 8.41 8.46 7.62 7.47 7.34 7.66 7.21 7.52 6.73 6.85

Canvass Industry Year 1983 1984 1985 1986 1987 1988 1989 1990 1991 1992 1993 1994 1995 1996 1997 1998 1999 2000 2001 2002 Sand, Industrial;
Ground silica/quartz - - - - - - - - - - - - - - - - - - - -
Sandstone (crushed & broken) 5.26 5.9 6.04 4.56 5.65 5.88 6.38 6.79 6.9 5.81 7.48 6.34 4.92 5.24 6.46 5.28 5.54 4.61 4.56 4.27
Sandstone (dimension) 23.03 5.66 6.48 10.91 7.03 9.78 7.17 6.84 12.92 12.87 14.48 15.93 12.71 11.08 11.86 11.14 10.81 11.14 8.87 7.89
Shale (common) 7.47 9.29 12.46 9.79 9.29 7.73 7.12 6.42 3.98 5.72 6.67 7.47 6.7 7.11 4.54 5.96 4.99 3.35 4.93 6.23 Slate (crushed &
broken) 6.4 3.87 3.93 3.68 6.64 7.18 12.08 8.86 6.04 8.45 6.86 2.95 5.73 5.87 4.97 5.92 7.74 7.14 2.24 13.23 Slate (dimension) 5.42 6.02 6.64 10.1 8.75 12.9 8.66 10.37 13.05 10.62 11.68 11.02 13.31 8.23 10.64 10.54 12.02 12.01 11.01 8.44 Sodium
compounds 2.58 2.61 2.58 2.38 2.39 2.94 3.69 3.8 2.79 2.41 1.68 2.24 - - - - - - - 4 Stone, crushed &
broken, NEC 7.31 8.53 10.18 7.62 8.21 9.36 9.18 9.36 7.48 10.72 10.52 8.73 8.4 7.92 9.63 7.42 7.63 7.95 8.03 7.17 Stone, dimension,
NEC 12.93 14.22 18.56 19.36 9.63 16.65 8.32 16.87 8.83 7.61 9.8 15.02 12.17 7.73 9.18 8.73 9.26 14.5 10.95 8.27 Talc, soapstone, &
pyrophylite 7.95 4.86 5.4 5.31 5.92 6.02 5.73 6.89 4.85 4.25 5.48 3.83 4.51 4.46 2.36 3.24 4.39 3.56 1.85 3.67 Traprock (crushed
& broken) 5.6 5.8 4.67 4.53 6.31 5.98 7.02 6 5.19 4.41 4.62 5.72 4.74 5.2 4.64 4.41 3.83 3.18 3.42 4.2 Traprock
(dimension) 3.21 0 0 0 7.34 - 0 2.5 6.26 10.02 3.32 2.34 2.07 2.53 2.18 2.73 1.6 - 0 11.18 Trona 6.48 2.48 3.26 2.6 3.03 2.27 3.51 3.83 3.62 2.58 2.15 4.55 3.48 2.54 2.47 2.98 2.38 3.34 3.64 4.23 Vermiculite 2.7 5.52 6.69 4.47 2.34 3.73 3.43 4.67 5.72 4.11 2.12 3.47 3.71 3.14 1.75 4.16 1.75 2.76 1.66 5.24 Total 4.57 4.63 4.54 4.81 5.27 5.72 5.96 5.90 5.74 5.38 5.34 5.26 4.72 4.49 4.46 4.61 4.58 4.78 4.64 4.60

Table 1.1.2 Industry NFDL Injury Rates 2003-2018 Canvass Industry Year
2003 2004 2005 2006 2007 2008 2009 2010 2011 2012 2013 2014 2015 2016 2017 2018
Coal
Anthracite 10.94 8.24 7.04 9.53 7.06 10.13 8.97 8.78 8.58 7.21 7.3 8.45 4.89 6.4 6.34 4.65 Bituminous 4.8 4.35 3.94 3.68 3.67 3.32 3.19 2.89 2.8 2.71 2.67 2.77 2.61 2.72 2.88 2.5 Total 4.84 4.38 3.96 3.71 3.69 3.36 3.23 2.92 2.84 2.74 2.71 2.81 2.63 2.77 2.92 2.53
Met
al
Alumina (Mill) 1.64 1.59 3.27 2.98 2.79 2.65 3.02 3.07 3.53 3.85 2.76 5.12 2.92 2.21 2.63 1.54 Aluminum Ore 5.25 - 5.63 6.22 1.72 3.68 4.47 0 - 1.62 1.56 2.26 0 5 2.69 2.58 Antimony - - - - - - - - - - - - - - - - Beryl 3.05 - 1.6 6.72 1.45 0 0 - 2.89 0 0 0 0 0 - 1.27 Chromite - - - - - - - - 1.79 3.49 - 15.65 - - - - Cobalt - - - - - - - - - - - - - - - - Copper Ore 1.68 1.75 2.25 2.27 2.65 2.58 1.84 1.57 1.31 1.14 1.35 1.1 1.4 1.47 1.36 1.4 Gold (lode and placer) 2.2 1.95 2.09 1.55 1.62 1.48 1.13 1.22 1.37 1.5 1.66 1.33 1.07 0.89 0.97 0.73 Iron ore 1.57 1.44 1.35 1.12 1.29 1.34 1.66 1.08 0.92 1.14 2.08 1.97 1.51 1.63 1.31 1.34 Lead/Zinc Ore 2.41 2.63 2.16 1.95 3.7 2.63 1.88 2.57 2.08 2.03 2.18 2.38 1.88 2.89 2.48 1.53 Manganese 6.96 2.8 8.61 4.15 4.44 9.92 5.37 25.6 4.72 3.5 2.48 - - - - - Mercury - - - - - - - - - - - - - - - - Metal ores, NEC 3.58 8.32 1.1 6.3 5.85 3.35 3.25 4.37 5.84 3.95 0 1.93 2.77 5.3 - 2.58 Molybdenum 1.87 1.8 1.61 3.45 2.81 2.7 3.06 1.96 1.65 1.41 1.41 1.09 0.88 1.45 0.82 2.03 Nickel - - - - - - - - - - - - 0 0.48 0 0.41 Platinum group 5.83 3.07 1.99 2.19 1.94 1.83 2.51 2.86 1.97 2.63 2.37 2.75 2.21 2.06 1.97 2.15 Rare earths 1.45 - 1.37 - - 0 0 0.74 0 0.28 1.56 0.86 1.14 - - 2.9 Silver ores 3.04 2.62 4.66 4.45 3.32 3.74 2.86 5.09 4.09 3.3 3.13 2.69 2.9 2.38 1.6 1.18 Titanium 1.91 2.91 1.19 1.26 0.99 0.57 2.96 1.58 3.25 1.36 0.53 0 0 0.88 0 0.74 Tungsten - - - - - - - - - - - - - - - 0 Uranium 4.78 6.97 7.14 3.67 0 4.14 7.38 2.74 1.66 0.98 1.02 2.81 0 1.69 0 0 Uranium - vanadium ores - 15.56 11.89 - - 26.59 0 - - - - - - - - - Vanadium 1.18 6.76 2.08 - 1.62 0.88 1.17 1.02 0 - 3.13 5.25 4.4 - 7.69 9.25 Zircon 5.03 - 0 - - - - - - - - - - - - - Total 2.16 1.98 2.22 2.05 2.20 2.10 1.76 1.68 1.58 1.58 1.76 1.71 1.49 1.43 1.32 1.20
Nonmetal Aplite 0 2.87 2.73 0 - - - 10.27 15.14 - 4.58 - 4.44 4.65 - 5.26
Asbestos 84.91 - - - - - - - - - - - - - - - Barite 6.18 7.02 7.64 4.72 5.43 4.22 3.07 3.57 2.66 2.96 3.25 2.76 3.97 1.32 4.27 2.69 Boron Materials 0.82 0.46 0.66 0.88 0.68 0.5 0.32 0.17 0.4 0.12 0.99 0.28 0.14 0.31 0.15 0.66 Brucite - - - - - - - - - - - - - - - - Cement 4.27 3.73 3.58 3.04 2.77 2.56 2.99 2.64 2.33 2.63 2.25 2.3 2.18 2.21 1.79 1.7 Chemical and
fertilizer, NEC 22.96 8.87 8.36 1.84 1.95 3.59 5.61 5.25 5.46 1.73 3.49 13.21 4.2 6.16 8.91 3.15 Clay (common) 1.77 2.03 2.1 1.55 2.14 2.45 3.17 1.92 1.85 1.85 1.72 1.3 1.26 1.1 1.4 1.41 Clay (fire) 1.9 2.3 2.31 3.12 1.93 2.66 4.1 2.34 3.86 1.11 3.19 3.41 2.87 3.14 2.73 7.45 Clay, Ceramic and
refractory, NEC 2.77 3.74 2.48 2.15 1.91 2.55 2.11 1.94 1.94 2.12 3.75 2.55 3.67 1.36 2.8 2.16

Canvass Industry Year 2003 2004 2005 2006 2007 2008 2009 2010 2011 2012 2013 2014 2015 2016 2017 2018 Construction S&G;
Sand, common - - - - - - - - - - 6.15 4.17 3.69 3.74 4.67 2.54 Feldspar 6.33 4.02 1.53 1.53 4.36 2.88 2.88 1.72 3.32 2.26 2.53 0 2.53 - 2.24 3.11 Fluorspar 9.62 - - - - 0 - - - - - - - - - - Gemstones 3.77 0 3.93 1.44 2.99 2.06 4.06 2.5 3.03 4.48 9.92 2.79 3.86 0.39 0.61 4.15 Gilsonite 13.15 3.8 4.83 5.69 8.22 15.64 5.47 6.06 4.67 6.63 1.31 0.67 0.93 1.43 0 0 Granite (crushed
and broken) 3.24 3.25 3.04 2.82 2.79 2.68 1.98 2.57 2.9 2.64 2.5 2.92 2.63 2.42 2.25 2.32 Granite
(dimension) 5.98 6.93 7.41 7.37 3.74 6.86 8.04 5.72 6.85 16.73 13.21 11.85 5.91 8.54 6.26 10.32 Gypsum 2.86 1.87 2.77 0.82 1.66 2.17 1.47 2.42 1.28 2.57 2.86 1.81 2.48 2.12 2.48 1.74 Kyanite 6.69 3.35 6.2 4.73 3.18 4.49 1.57 3.64 4.15 3.16 6.8 3.52 6.41 1.5 2.23 2.99 Leonardite 18.65 15.78 11.85 6.88 14.39 26.38 16.09 0 13.55 5.11 7.02 9.07 4.95 20.71 6.08 4.65 Lime 3.97 3.31 4.13 3.19 3.61 3.68 3.1 3.52 2.4 2.45 2.35 2.73 2.5 2.5 1.97 2.31 Limestone
(crushed and broken) 4.41 4.05 3.74 3.57 3.38 3.35 3.52 3.49 3.38 3.43 3.34 3.44 3.44 2.75 2.81 3.02
Limestone (dimension) 8.3 7.33 8.55 8.44 7.06 8.29 4.31 5.6 4.42 5.1 5.85 6.12 4.71 4.78 5.7 4.11
Lithium - - - - - - - - - - - - - - - - Magnesite 1.33 0 2.58 3.29 1.24 1.12 4.99 5.84 3.32 3.32 9.64 3.08 4.46 3.63 0.87 4.03 Marble (crushed &
broken) 5.71 6.62 6.77 3.5 4.86 3.57 3.11 2.38 1.75 1.55 1.27 1.25 2.84 2.63 3.07 2.12 Marble
(dimension) 12.82 6.39 9.33 14.31 14.36 14.38 6.25 2.99 3.51 8.08 5.82 10.82 14.36 4.08 3.93 3.6 Mica 2.22 2.23 2.01 1.83 0 4.84 1.71 3.31 - 1.23 - 8.16 1.83 - 4.28 11.96 Nonmetallic
minerals, NEC 4.36 5.05 5.12 3.61 5.99 5.46 3.85 3.65 2.96 3.78 4.17 3.14 2.57 2.08 2.96 2.86 Oil mining - - - - - - - - - - - 7.02 0 0 0 - Oil sand - - - - 0 1.16 - - - - 5.78 0 0 - - 0 Oil shale - - - 2.12 - 0 - - - - - - - - - - Perlite 2.32 4.99 4.54 3.37 3.59 3.57 10.7 4.03 1.58 1.16 2.29 3.49 7.08 0 6.88 6.24 Phosphate rock 1.94 2.79 1.94 1.38 1.85 1.14 1.28 1.03 1.05 1.25 0.97 1.07 0.66 0.57 0.85 0.61 Pigment mineral 6.4 6.93 10.72 12.72 2.71 3.94 3.04 - 2.39 1.1 2.13 - 1.47 2.21 4.11 2.45 Potash 1.9 1.48 1.61 3.38 4.12 4.69 3.33 2.33 2.24 0.9 0.79 0.92 1.41 0.9 0.58 0.33 Potash, soda, &
borate minerals, NEC - - - 20.79 17.93 - - - - - - - - - - -
Pumice 6.95 6.64 5.88 6.24 7.45 8.79 0 5 3.89 19.66 4.71 - 7.98 15.79 - 5.82 Pyrites - - - - - - - - - - - - - - - - Salt (evaporated) 1.33 - 4.58 - 3.24 3.35 3.61 4.11 3.02 - 0 1.62 0.81 1.61 5.52 2.44 Salt (rock) 2.17 1.67 1.61 1.7 1.66 1.85 1.75 2.17 1.57 1.84 1.42 1.44 1.13 0.99 1.15 1.2 Sand & gravel 7.18 6.37 6.29 6.44 6.04 6.23 6 6.32 5.24 5.65 6.08 5.41 5.45 5.7 5.16 4.62
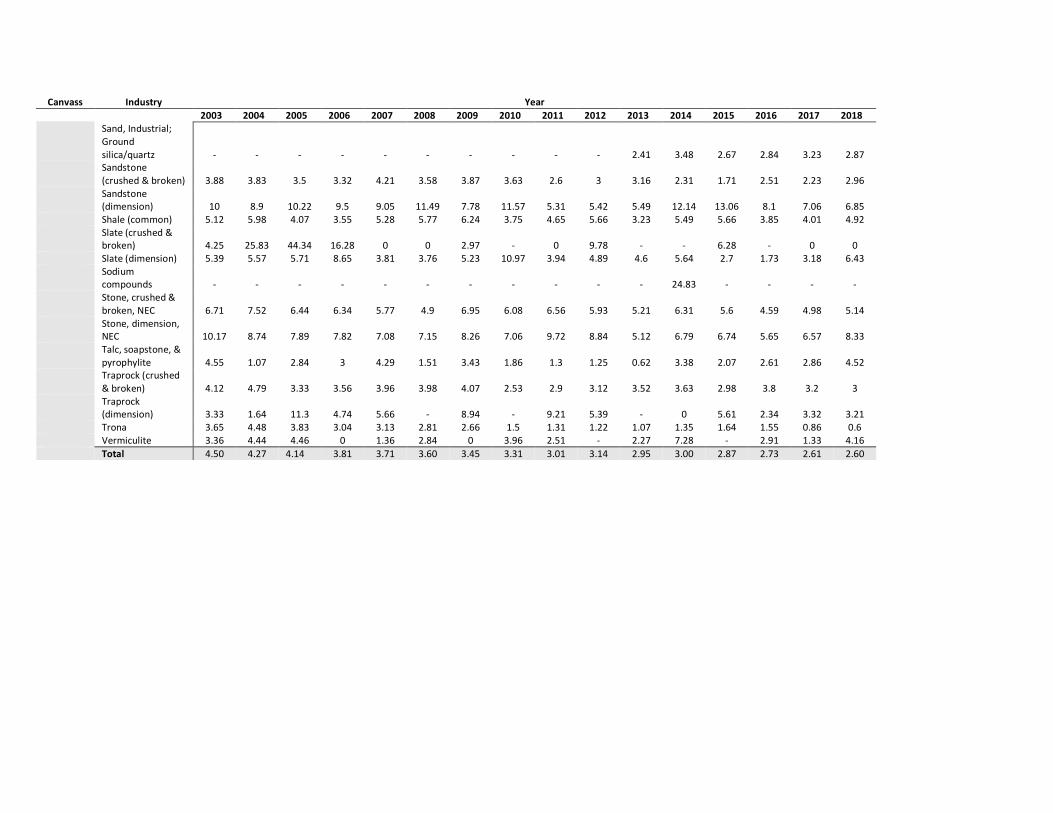
Canvass Industry Year 2003 2004 2005 2006 2007 2008 2009 2010 2011 2012 2013 2014 2015 2016 2017 2018 Sand, Industrial;
Ground silica/quartz - - - - - - - - - - 2.41 3.48 2.67 2.84 3.23 2.87
Sandstone (crushed & broken) 3.88 3.83 3.5 3.32 4.21 3.58 3.87 3.63 2.6 3 3.16 2.31 1.71 2.51 2.23 2.96
Sandstone (dimension) 10 8.9 10.22 9.5 9.05 11.49 7.78 11.57 5.31 5.42 5.49 12.14 13.06 8.1 7.06 6.85
Shale (common) 5.12 5.98 4.07 3.55 5.28 5.77 6.24 3.75 4.65 5.66 3.23 5.49 5.66 3.85 4.01 4.92 Slate (crushed &
broken) 4.25 25.83 44.34 16.28 0 0 2.97 - 0 9.78 - - 6.28 - 0 0 Slate (dimension) 5.39 5.57 5.71 8.65 3.81 3.76 5.23 10.97 3.94 4.89 4.6 5.64 2.7 1.73 3.18 6.43 Sodium
compounds - - - - - - - - - - - 24.83 - - - - Stone, crushed &
broken, NEC 6.71 7.52 6.44 6.34 5.77 4.9 6.95 6.08 6.56 5.93 5.21 6.31 5.6 4.59 4.98 5.14 Stone, dimension,
NEC 10.17 8.74 7.89 7.82 7.08 7.15 8.26 7.06 9.72 8.84 5.12 6.79 6.74 5.65 6.57 8.33 Talc, soapstone, &
pyrophylite 4.55 1.07 2.84 3 4.29 1.51 3.43 1.86 1.3 1.25 0.62 3.38 2.07 2.61 2.86 4.52 Traprock (crushed
& broken) 4.12 4.79 3.33 3.56 3.96 3.98 4.07 2.53 2.9 3.12 3.52 3.63 2.98 3.8 3.2 3 Traprock
(dimension) 3.33 1.64 11.3 4.74 5.66 - 8.94 - 9.21 5.39 - 0 5.61 2.34 3.32 3.21 Trona 3.65 4.48 3.83 3.04 3.13 2.81 2.66 1.5 1.31 1.22 1.07 1.35 1.64 1.55 0.86 0.6 Vermiculite 3.36 4.44 4.46 0 1.36 2.84 0 3.96 2.51 - 2.27 7.28 - 2.91 1.33 4.16 Total 4.50 4.27 4.14 3.81 3.71 3.60 3.45 3.31 3.01 3.14 2.95 3.00 2.87 2.73 2.61 2.60

Table 1.2.1 Industry Fatality Rates 1983-2002 Canvass Industry Year
1983 1984 1985 1986 1987 1988 1989 1990 1991 1992 1993 1994 1995 1996 1997 1998 1999 2000 2001 2002
Coal
Anthracite 0.07 0 0.58 0.26 0 0.09 0.1 0.16 0 0 0.09 0.27 0.39 0 0 0.11 0.11 0 0 0 Bituminous 0.05 0.08 0.04 0.06 0.04 0.03 0.05 0.04 0.05 0.04 0.04 0.03 0.04 0.04 0.03 0.03 0.04 0.04 0.05 0.03 Total 0.05 0.08 0.04 0.06 0.04 0.03 0.05 0.05 0.05 0.04 0.04 0.04 0.04 0.04 0.03 0.03 0.04 0.04 0.05 0.03
Met
al
Alumina (Mill) 0.02 0 0 0 0.03 0 0.03 0 0 0 0 0 0 0 0 0 0 0 0 0.04 Aluminum Ore 0 0 0 0 0 0 0 0 0 0 0 0 0 - 0 0 0 0 0 0 Antimony - 0 - - - - - - - - - - - - - - - - - - Beryl 0 0 0 0 0 0 0 - 0 0 0 0 0 0 0 0 0 0 0 0 Chromite - - - - - - - - - - - - - - - - - - - 0 Cobalt - - - - 0 - - 0 - - 0 0 - - - - - - - - Copper Ore 0.01 0.05 0.03 0.01 0.04 0.01 0 0.05 0.03 0 0.04 0 0.03 0.01 0.02 0.02 0 0.01 0.01 0.02 Gold (lode and placer) 0.04 0.09 0.04 0.01 0.06 0.02 0.03 0.01 0.04 0.02 0.02 0.05 0.02 0.01 0.02 0 0.06 0.04 0.04 0.02 Iron ore 0.04 0 0 0.02 0.02 0.01 0.02 0.01 0 0 0.01 0.01 0 0 0 0.01 0.01 0.01 0 0 Lead/Zinc Ore 0.06 0.15 0.18 0 0 0.14 0.04 0.1 0 0.08 0 0.04 0.04 0.04 0.04 0.05 0.05 0 0 0 Manganese 0 0 0 0 0 0 0 0 0 0 0 0 0 0 0 0 0 0 0 0 Mercury 0 0 0 0 0 0 0 - - - - - - - - - - - - - Metal ores, NEC 0 0 0 0 0 0 - 0 - 0 - - - - 0 0 0 - 0 0 Molybdenum 0.09 0.03 0.07 0.06 0 0 0 0.06 0 0 0 0 0 0 0 0 0 0 0 0 Nickel - 0 0 0 - - - 0 0 0 - - - 0 - - - - - - Platinum group 0 0 - - 0 0 0.24 0.21 0.55 0.29 0 0 0.23 0 0 0 0 0.11 0.15 0 Rare earths 0 0 0 0 0 0 0 0 0 0 0 0 0 0 0 0 0 0 0 0 Silver ores 0.08 0.13 0.12 0.06 0.06 0.04 0.08 0.04 0 0.06 0 0.11 0 0.05 0 0.05 0 0 0.18 0 Titanium 0 0 0 0 0 0 0 0 0 0 0 0 0 0 0 0 0.21 0 0 0 Tungsten 0 0 0 0 0 0 0 0 0 - 0 - 0 0 0 0 - - - - Uranium 0 0.08 0.06 0.19 0 0 0 0 0 0 0 0 0 0 0 0 0 0 0 0 Uranium - vanadium ores 0 0 0 0 0 0 0 0 0 0 - - - 0 - 3.25 0 0 0 - Vanadium 0 0 0 0 0 0 0 0 - 0 0 0 0 0 0 0 0 0 0 0 Zircon - 0 0 0 0 0 0 0 0 - - - - 0 - 0 - 0 - 0 Total 0.03 0.05 0.04 0.02 0.04 0.02 0.02 0.03 0.03 0.02 0.02 0.02 0.02 0.01 0.01 0.01 0.02 0.02 0.03 0.01
Nonmetal Aplite 0 0 0 0 0 - 0 0 0 0 - 0 - 0 0 0 0 0 0 -
Asbestos 0 0 0 0 0 0 0 0 0 0 0 0 0 0 0 0 0 0 - 0 Barite 0 0 0 0 0 0 0 0 0 0.55 0 0 0 0 0 0 0 0 0 0 Boron Materials 0.08 0 0 0 0 0 0 0 0.12 0 0 0 0.23 0 0 0 0 0 0 0 Brucite - - - - - - - - - - - - - - - - - - 0 - Cement 0.01 0.04 0.02 0.01 0.01 0 0.02 0 0 0.02 0.02 0.02 0.02 0.02 0.02 0.01 0.01 0.01 0 0.03 Chemical and
fertilizer, NEC - - - - - - 0 0 0 0 0 0 0 0 0 0 0 0 0 0 Clay (common) 0.02 0.02 0 0.01 0.01 0 0 0 0 0.02 0 0 0.02 0 0.01 0.01 0 0 0 0 Clay (fire) 0 0 0 0 0 0 0 0 0 0 0 0 0 0 0 0 0 0 0 0 Clay, Ceramic and
refractory, NEC 0 0 0 2.44 0 0 0 0 0 0 0 0 0 0 0 0 0 0 0 0
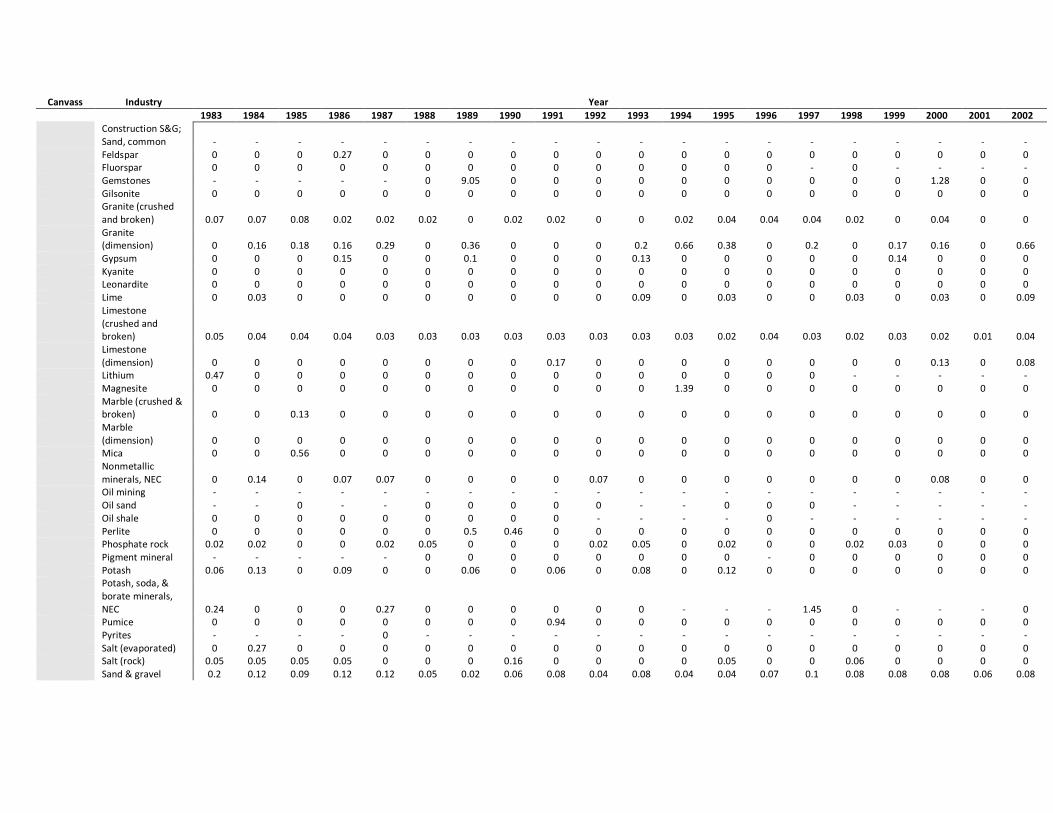
Canvass Industry Year 1983 1984 1985 1986 1987 1988 1989 1990 1991 1992 1993 1994 1995 1996 1997 1998 1999 2000 2001 2002 Construction S&G;
Sand, common - - - - - - - - - - - - - - - - - - - - Feldspar 0 0 0 0.27 0 0 0 0 0 0 0 0 0 0 0 0 0 0 0 0 Fluorspar 0 0 0 0 0 0 0 0 0 0 0 0 0 0 - 0 - - - - Gemstones - - - - - 0 9.05 0 0 0 0 0 0 0 0 0 0 1.28 0 0 Gilsonite 0 0 0 0 0 0 0 0 0 0 0 0 0 0 0 0 0 0 0 0 Granite (crushed
and broken) 0.07 0.07 0.08 0.02 0.02 0.02 0 0.02 0.02 0 0 0.02 0.04 0.04 0.04 0.02 0 0.04 0 0 Granite
(dimension) 0 0.16 0.18 0.16 0.29 0 0.36 0 0 0 0.2 0.66 0.38 0 0.2 0 0.17 0.16 0 0.66 Gypsum 0 0 0 0.15 0 0 0.1 0 0 0 0.13 0 0 0 0 0 0.14 0 0 0 Kyanite 0 0 0 0 0 0 0 0 0 0 0 0 0 0 0 0 0 0 0 0 Leonardite 0 0 0 0 0 0 0 0 0 0 0 0 0 0 0 0 0 0 0 0 Lime 0 0.03 0 0 0 0 0 0 0 0 0.09 0 0.03 0 0 0.03 0 0.03 0 0.09 Limestone
(crushed and broken) 0.05 0.04 0.04 0.04 0.03 0.03 0.03 0.03 0.03 0.03 0.03 0.03 0.02 0.04 0.03 0.02 0.03 0.02 0.01 0.04
Limestone (dimension) 0 0 0 0 0 0 0 0 0.17 0 0 0 0 0 0 0 0 0.13 0 0.08
Lithium 0.47 0 0 0 0 0 0 0 0 0 0 0 0 0 0 - - - - - Magnesite 0 0 0 0 0 0 0 0 0 0 0 1.39 0 0 0 0 0 0 0 0 Marble (crushed &
broken) 0 0 0.13 0 0 0 0 0 0 0 0 0 0 0 0 0 0 0 0 0 Marble
(dimension) 0 0 0 0 0 0 0 0 0 0 0 0 0 0 0 0 0 0 0 0 Mica 0 0 0.56 0 0 0 0 0 0 0 0 0 0 0 0 0 0 0 0 0 Nonmetallic
minerals, NEC 0 0.14 0 0.07 0.07 0 0 0 0 0.07 0 0 0 0 0 0 0 0.08 0 0 Oil mining - - - - - - - - - - - - - - - - - - - - Oil sand - - 0 - - 0 0 0 0 0 - - 0 0 0 - - - - - Oil shale 0 0 0 0 0 0 0 0 0 - - - - 0 - - - - - - Perlite 0 0 0 0 0 0 0.5 0.46 0 0 0 0 0 0 0 0 0 0 0 0 Phosphate rock 0.02 0.02 0 0 0.02 0.05 0 0 0 0.02 0.05 0 0.02 0 0 0.02 0.03 0 0 0 Pigment mineral - - - - - 0 0 0 0 0 0 0 0 - 0 0 0 0 0 0 Potash 0.06 0.13 0 0.09 0 0 0.06 0 0.06 0 0.08 0 0.12 0 0 0 0 0 0 0 Potash, soda, &
borate minerals, NEC 0.24 0 0 0 0.27 0 0 0 0 0 0 - - - 1.45 0 - - - 0
Pumice 0 0 0 0 0 0 0 0 0.94 0 0 0 0 0 0 0 0 0 0 0 Pyrites - - - - 0 - - - - - - - - - - - - - - - Salt (evaporated) 0 0.27 0 0 0 0 0 0 0 0 0 0 0 0 0 0 0 0 0 0 Salt (rock) 0.05 0.05 0.05 0.05 0 0 0 0.16 0 0 0 0 0.05 0 0 0.06 0 0 0 0 Sand & gravel 0.2 0.12 0.09 0.12 0.12 0.05 0.02 0.06 0.08 0.04 0.08 0.04 0.04 0.07 0.1 0.08 0.08 0.08 0.06 0.08
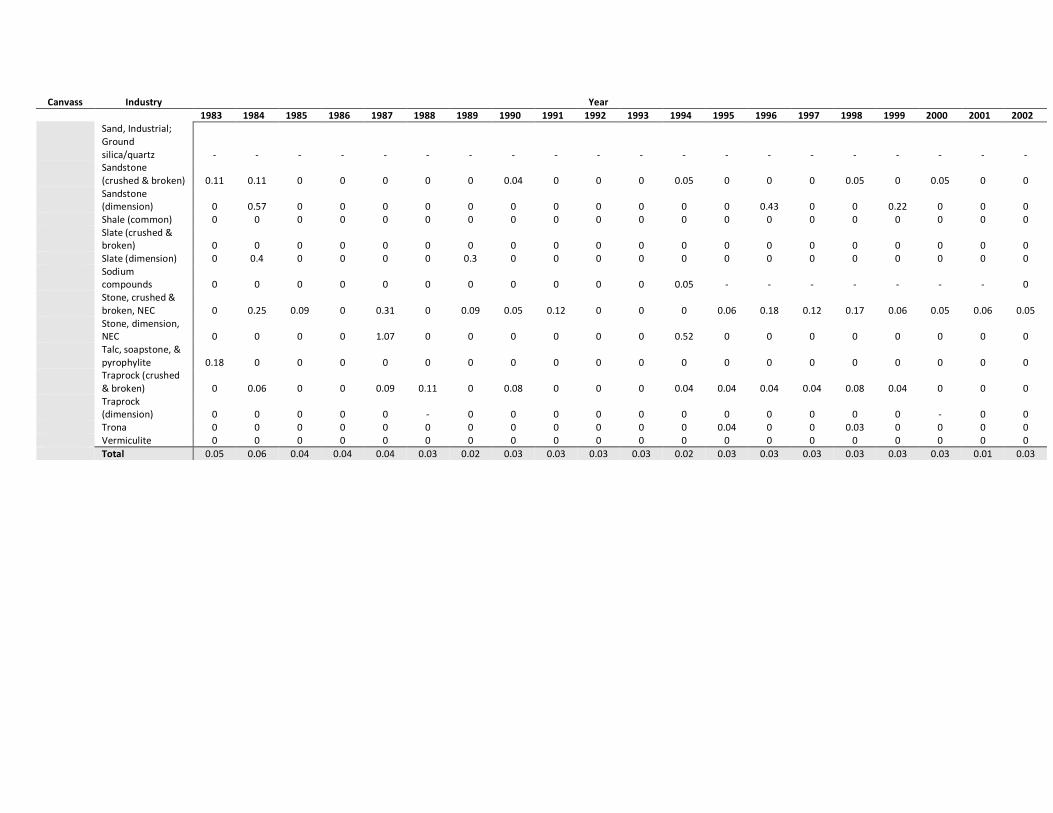
Canvass Industry Year 1983 1984 1985 1986 1987 1988 1989 1990 1991 1992 1993 1994 1995 1996 1997 1998 1999 2000 2001 2002 Sand, Industrial;
Ground silica/quartz - - - - - - - - - - - - - - - - - - - -
Sandstone (crushed & broken) 0.11 0.11 0 0 0 0 0 0.04 0 0 0 0.05 0 0 0 0.05 0 0.05 0 0
Sandstone (dimension) 0 0.57 0 0 0 0 0 0 0 0 0 0 0 0.43 0 0 0.22 0 0 0
Shale (common) 0 0 0 0 0 0 0 0 0 0 0 0 0 0 0 0 0 0 0 0 Slate (crushed &
broken) 0 0 0 0 0 0 0 0 0 0 0 0 0 0 0 0 0 0 0 0 Slate (dimension) 0 0.4 0 0 0 0 0.3 0 0 0 0 0 0 0 0 0 0 0 0 0 Sodium
compounds 0 0 0 0 0 0 0 0 0 0 0 0.05 - - - - - - - 0 Stone, crushed &
broken, NEC 0 0.25 0.09 0 0.31 0 0.09 0.05 0.12 0 0 0 0.06 0.18 0.12 0.17 0.06 0.05 0.06 0.05 Stone, dimension,
NEC 0 0 0 0 1.07 0 0 0 0 0 0 0.52 0 0 0 0 0 0 0 0 Talc, soapstone, &
pyrophylite 0.18 0 0 0 0 0 0 0 0 0 0 0 0 0 0 0 0 0 0 0 Traprock (crushed
& broken) 0 0.06 0 0 0.09 0.11 0 0.08 0 0 0 0.04 0.04 0.04 0.04 0.08 0.04 0 0 0 Traprock
(dimension) 0 0 0 0 0 - 0 0 0 0 0 0 0 0 0 0 0 - 0 0 Trona 0 0 0 0 0 0 0 0 0 0 0 0 0.04 0 0 0.03 0 0 0 0 Vermiculite 0 0 0 0 0 0 0 0 0 0 0 0 0 0 0 0 0 0 0 0 Total 0.05 0.06 0.04 0.04 0.04 0.03 0.02 0.03 0.03 0.03 0.03 0.02 0.03 0.03 0.03 0.03 0.03 0.03 0.01 0.03
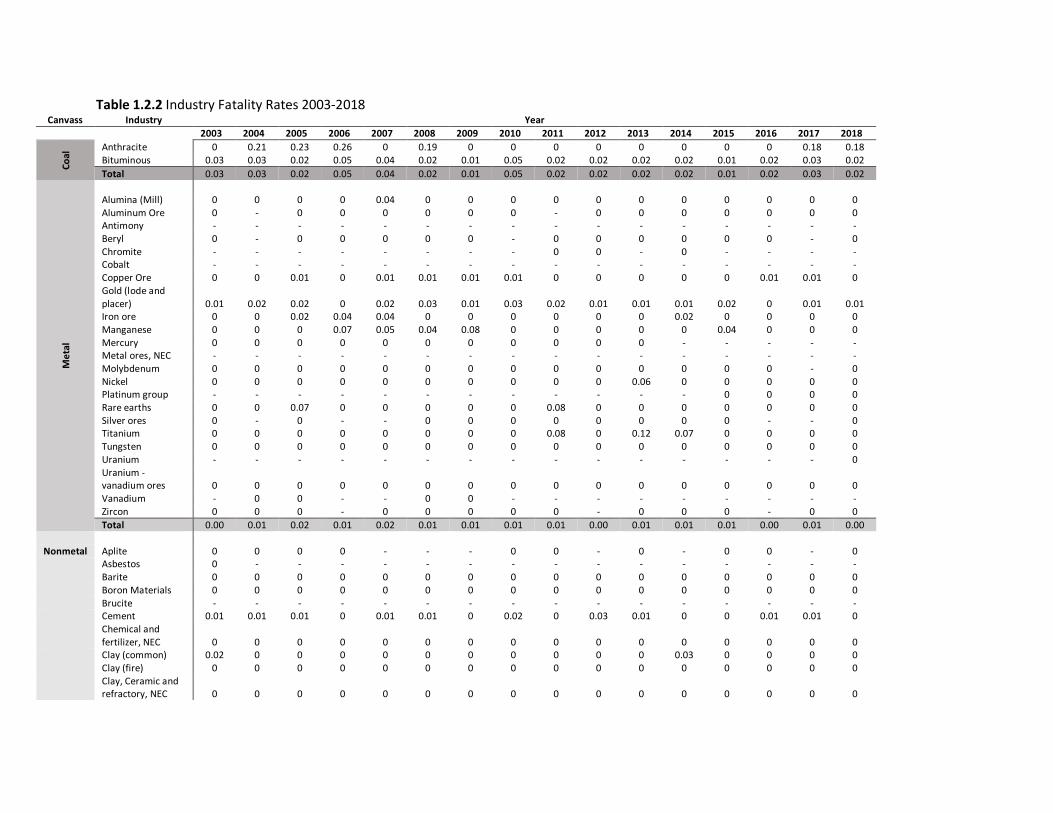
Table 1.2.2 Industry Fatality Rates 2003-2018 Canvass Industry Year
2003 2004 2005 2006 2007 2008 2009 2010 2011 2012 2013 2014 2015 2016 2017 2018
Coal
Anthracite 0 0.21 0.23 0.26 0 0.19 0 0 0 0 0 0 0 0 0.18 0.18 Bituminous 0.03 0.03 0.02 0.05 0.04 0.02 0.01 0.05 0.02 0.02 0.02 0.02 0.01 0.02 0.03 0.02 Total 0.03 0.03 0.02 0.05 0.04 0.02 0.01 0.05 0.02 0.02 0.02 0.02 0.01 0.02 0.03 0.02
Met
al
Alumina (Mill) 0 0 0 0 0.04 0 0 0 0 0 0 0 0 0 0 0 Aluminum Ore 0 - 0 0 0 0 0 0 - 0 0 0 0 0 0 0 Antimony - - - - - - - - - - - - - - - - Beryl 0 - 0 0 0 0 0 - 0 0 0 0 0 0 - 0 Chromite - - - - - - - - 0 0 - 0 - - - - Cobalt - - - - - - - - - - - - - - - - Copper Ore 0 0 0.01 0 0.01 0.01 0.01 0.01 0 0 0 0 0 0.01 0.01 0 Gold (lode and placer) 0.01 0.02 0.02 0 0.02 0.03 0.01 0.03 0.02 0.01 0.01 0.01 0.02 0 0.01 0.01 Iron ore 0 0 0.02 0.04 0.04 0 0 0 0 0 0 0.02 0 0 0 0 Manganese 0 0 0 0.07 0.05 0.04 0.08 0 0 0 0 0 0.04 0 0 0 Mercury 0 0 0 0 0 0 0 0 0 0 0 - - - - - Metal ores, NEC - - - - - - - - - - - - - - - - Molybdenum 0 0 0 0 0 0 0 0 0 0 0 0 0 0 - 0 Nickel 0 0 0 0 0 0 0 0 0 0 0.06 0 0 0 0 0 Platinum group - - - - - - - - - - - - 0 0 0 0 Rare earths 0 0 0.07 0 0 0 0 0 0.08 0 0 0 0 0 0 0 Silver ores 0 - 0 - - 0 0 0 0 0 0 0 0 - - 0 Titanium 0 0 0 0 0 0 0 0 0.08 0 0.12 0.07 0 0 0 0 Tungsten 0 0 0 0 0 0 0 0 0 0 0 0 0 0 0 0 Uranium - - - - - - - - - - - - - - - 0 Uranium - vanadium ores 0 0 0 0 0 0 0 0 0 0 0 0 0 0 0 0 Vanadium - 0 0 - - 0 0 - - - - - - - - - Zircon 0 0 0 - 0 0 0 0 0 - 0 0 0 - 0 0 Total 0.00 0.01 0.02 0.01 0.02 0.01 0.01 0.01 0.01 0.00 0.01 0.01 0.01 0.00 0.01 0.00
Nonmetal Aplite 0 0 0 0 - - - 0 0 - 0 - 0 0 - 0
Asbestos 0 - - - - - - - - - - - - - - - Barite 0 0 0 0 0 0 0 0 0 0 0 0 0 0 0 0 Boron Materials 0 0 0 0 0 0 0 0 0 0 0 0 0 0 0 0 Brucite - - - - - - - - - - - - - - - - Cement 0.01 0.01 0.01 0 0.01 0.01 0 0.02 0 0.03 0.01 0 0 0.01 0.01 0 Chemical and
fertilizer, NEC 0 0 0 0 0 0 0 0 0 0 0 0 0 0 0 0 Clay (common) 0.02 0 0 0 0 0 0 0 0 0 0 0.03 0 0 0 0 Clay (fire) 0 0 0 0 0 0 0 0 0 0 0 0 0 0 0 0 Clay, Ceramic and
refractory, NEC 0 0 0 0 0 0 0 0 0 0 0 0 0 0 0 0

Canvass Industry Year 2003 2004 2005 2006 2007 2008 2009 2010 2011 2012 2013 2014 2015 2016 2017 2018 Construction S&G;
Sand, common - - - - - - - - - - 0 0 0 0.22 0 0.09 Feldspar 0 0 0 0 0 0 0 0 0 0 0 0 0 - 0 0 Fluorspar 0 - - - - 0 - - - - - - - - - - Gemstones 0 0 0 0 0 0 0 0 0 1.49 0 0 0 0 0 0 Gilsonite 0 0 0 0 0 0 0 0 0 0 0 0 0 0 0 0 Granite (crushed
and broken) 0.02 0 0.02 0 0.04 0 0 0 0 0 0.05 0.04 0.04 0.04 0 0 Granite
(dimension) 0 0 0 0 0 0 0 0 0 0 0 0 0 0 0.89 1.03 Gypsum 0 0 0 0 0 0 0 0 0 0 0.24 0.45 0 0 0 0 Kyanite 0 0 0 0 0 0 0 0 0 0 0 0 0 0 0 0 Lead and/or Zinc
Ore 0 0 0 0 0 0 0 0 0 0 0 0 0 0 0 0 Leonardite 0 0 0.04 0 0 0.03 0 0.03 0 0 0.03 0.05 0 0 0 0.03 Lime 0.01 0.03 0.04 0.02 0.02 0.02 0.02 0.02 0.02 0.03 0.05 0.01 0 0.02 0.02 0.01 Limestone
(crushed and broken) 0 0 0 0.05 0 0 0 0 0 0 0 0 0 0 0 0
Limestone (dimension) - - - - - - - - - - - - - - - -
Lithium 0 0 0 0 0 0 0 0 0 0 0 0 0 0.91 0 0 Magnesite 0 0 0 0 0 0.13 0 0 0 0 0 0 0 0 0 0 Marble (crushed &
broken) 0 0 0 0 0 0 0 0 0 0 0 0 0 0 0 0 Marble
(dimension) 0 0 0 0 0 0 0 0 - 0 - 0 0 - 0 0 Mica 0.1 0 0 0 0 0.08 0 0 0 0 0 0 0 0 0.11 0 Nonmetallic
minerals, NEC - - - - - - - - - - - 0 0 0 0 - Oil mining - - - - 0 0 - - - - 0 0 0 - - 0 Oil sand - - - 0 - 0 - - - - - - - - - - Oil shale 0 0 0 0 0 0 0 0 0 0 0 0 0 0 0 0 Perlite 0 0 0.03 0 0 0 0 0 0 0 0 0 0.05 0 0 0 Phosphate rock 0 0 0 0 0 0 0 - 0 0 0 - 0 0 0 0 Pigment mineral 0 0 0.11 0 0 0.1 0 0 0 0 0 0 0 0 0 0 Potash - - - 0 0 - - - - - - - - - - - Potash, soda, &
borate minerals, NEC 0 0 0.65 0 0 0 0 0 0 0 0 - 0 0 - 0
Pumice - - - - - - - - - - - - - - - - Pyrites 0 - 0 - 0 0 0 0 0 - 0 0 0 0 0 0 Salt (evaporated) 0 0 0 0 0 0 0.05 0 0 0 0.06 0.04 0 0 0 0 Salt (rock) 0.08 0.07 0.07 0.05 0.05 0.03 0.05 0.02 0.04 0.06 0.02 0.12 0.08 0.07 0.05 0.07 Sand & gravel - - - - - - - - - - 0.04 0.03 0 0 0 0
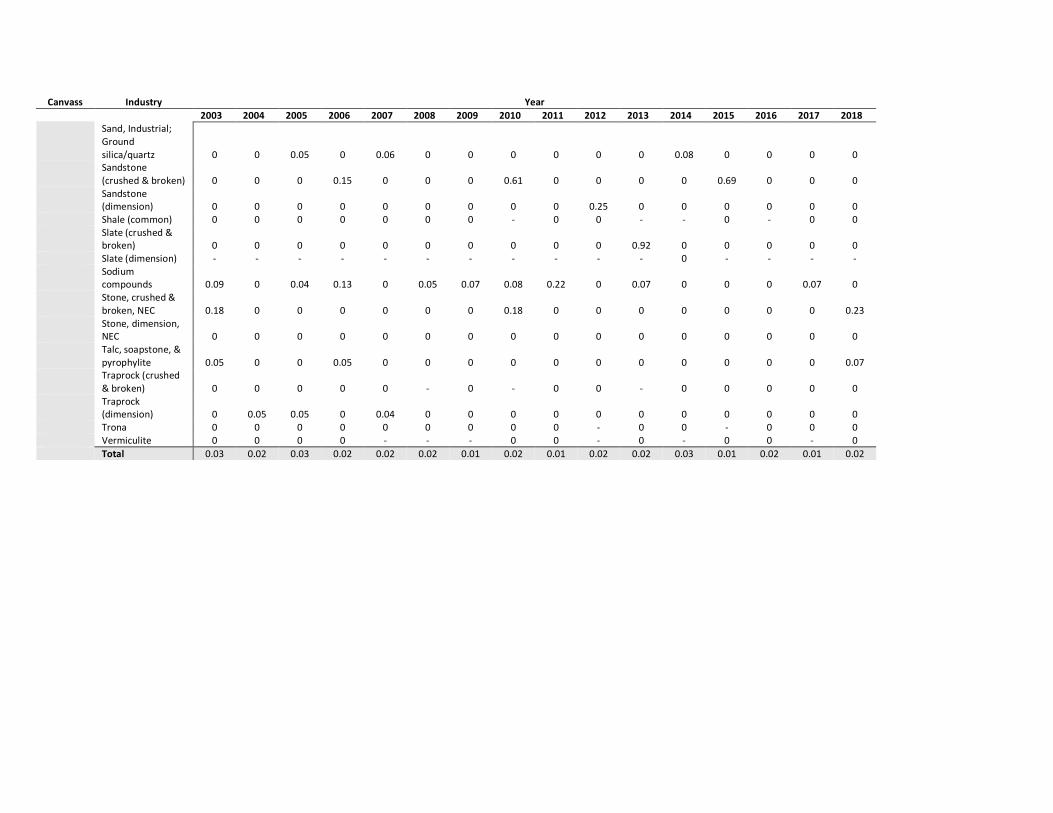
Canvass Industry Year 2003 2004 2005 2006 2007 2008 2009 2010 2011 2012 2013 2014 2015 2016 2017 2018 Sand, Industrial;
Ground silica/quartz 0 0 0.05 0 0.06 0 0 0 0 0 0 0.08 0 0 0 0
Sandstone (crushed & broken) 0 0 0 0.15 0 0 0 0.61 0 0 0 0 0.69 0 0 0
Sandstone (dimension) 0 0 0 0 0 0 0 0 0 0.25 0 0 0 0 0 0
Shale (common) 0 0 0 0 0 0 0 - 0 0 - - 0 - 0 0 Slate (crushed &
broken) 0 0 0 0 0 0 0 0 0 0 0.92 0 0 0 0 0 Slate (dimension) - - - - - - - - - - - 0 - - - - Sodium
compounds 0.09 0 0.04 0.13 0 0.05 0.07 0.08 0.22 0 0.07 0 0 0 0.07 0 Stone, crushed &
broken, NEC 0.18 0 0 0 0 0 0 0.18 0 0 0 0 0 0 0 0.23 Stone, dimension,
NEC 0 0 0 0 0 0 0 0 0 0 0 0 0 0 0 0 Talc, soapstone, &
pyrophylite 0.05 0 0 0.05 0 0 0 0 0 0 0 0 0 0 0 0.07 Traprock (crushed
& broken) 0 0 0 0 0 - 0 - 0 0 - 0 0 0 0 0 Traprock
(dimension) 0 0.05 0.05 0 0.04 0 0 0 0 0 0 0 0 0 0 0 Trona 0 0 0 0 0 0 0 0 0 - 0 0 - 0 0 0 Vermiculite 0 0 0 0 - - - 0 0 - 0 - 0 0 - 0 Total 0.03 0.02 0.03 0.02 0.02 0.02 0.01 0.02 0.01 0.02 0.02 0.03 0.01 0.02 0.01 0.02

Table 1.3.1 Industry Noise Measurements 1983-2002 Canvass Industry Year
1983 1984 1985 1986 1987 1988 1989 1990 1991 1992 1993 1994 1995 1996 1997 1998 1999 2000 2001 2002
Coal
Anthracite - - - 83.7 (8.0)
84.2 (7.0)
84.2 (7.1)
84.3 (7.1)
84.5 (6.9)
83.9 (7.4)
84.0 (7.7)
83.9 (7.0)
85.0 (7.5)
83.4 (8.3)
83.8 (8.1)
83.0 (8.0)
82.6 (8.4)
82.7 (11.1)
82.8 (12.4)
80.9 (12.0)
79.7 (11.4)
Bituminous - - - 83.7 (8.0)
84.2 (7.0)
84.2 (7.1)
84.3 (7.1)
84.5 (6.9)
83.9 (7.4)
84.0 (7.7)
83.9 (7.0)
85.0 (7.5)
83.4 (8.3)
83.8 (8.1)
83.0 (8.0)
82.6 (8.4)
82.7 (11.1)
82.8 (12.4)
80.9 (12.0)
79.7 (11.4)
Total† - - - 83.7 (8.0)
84.2 (7.0)
84.2 (7.1)
84.3 (7.0)
84.5 (6.9)
83.9 (7.3)
84.0 (7.7)
83.9 (7.0)
85.0 (7.4)
83.4 (8.3)
83.8 (8.1)
83.0 (8.0)
82.6 (8.4)
82.7 (11.1)
82.8 (12.4)
80.9 (12.0)
79.7 (11.4)
Met
al
Alumina (Mill)
82.8 (6.6)
82.7 (6.7)
83.6 (7.0)
86.9 (5.3)
89.5 (4.0)
79.9 (10.1)
84.0 (8.3)
87.6 (5.5)
82.6 (8.0)
81.8 (7.7)
81.2 (9.7)
80.0 (7.1)
80.7 (4.9)
77.9 (8.2)
90.9 (5.4)
88.0 (3.3) 93.4
87.3 (4.1)
80.2 (7.9)
85.0 (5.2)
Aluminum Ore
87.2 (6.5)
78.5 (9.3) - - -
80.5 (3.1)
77.8 (5.3)
80.1 (6.3)
77.7 (5.1)
81.7 (8.0) 73.4
85.5 (4.5) -
78.9 (5.9)
74.1 (7.1) - - - - -
Antimony - - - - - - - - - - - - - - - - - - - -
Beryl 91.8 (3.7)
85.7 (3.6)
80.2 (10.8)
86.9 (9.5)
83.9 (10.4)
80.6 (11.5)
84.6 (6.0)
84.2 (4.0)
91.2 (5.5) -
86.9 (1.8)
76.2 (5.5)
80.6 (6.0)
78.7 (9.8)
75.8 (10.2) - -
81.6 (6.0) - -
Chromite - - - - 84.3 (7.2)
87.2 (6.2) 90.0
77.0 (0.5) - 77.1 - 69.7 - - - - -
79.0 (7.3)
68.7 (1.7) -
Cobalt - - 81.4 (3.9)
71.3 (5.8) 74.1 - - 84.6 - - -
71.8 (11.2)
72.1 (10.0) - - - - - - -
Copper Ore 83.9 (8.4)
83.0 (9.2)
83.9 (7.3)
85.4 (9.8)
83.3 (7.7)
88.4 (8.1)
84.8 (8.8)
83.7 (8.4)
84.8 (8.1)
84.8 (9.8)
83.2 (8.9)
84.3 (9.4)
82.5 (7.5)
81.8 (8.1)
81.5 (10.1)
79.0 (8.3)
83.0 (6.9)
86.2 (8.7)
85.6 (5.5)
86.2 (7.8)
Gold (lode and placer)
85.4 (8.8)
86.3 (10.2)
84.8 (9.8)
84.8 (9.4)
86.8 (8.9)
84.4 (9.2)
85.3 (7.9)
86.1 (8.9)
86.3 (9.1)
85.3 (8.7)
84.8 (8.7)
85.8 (9.6)
84.8 (9.6)
83.7 (10.4)
83.8 (10.6)
86.3 (9.8)
87.7 (1.7)
89.2 (9.1)
84.3 (8.0)
84.0 (9.5)
Iron ore 82.2 (9.1)
81.9 (8.6)
79.6 (8.5)
81.1 (8.4)
81.6 (7.8)
85.6 (8.1)
83.8 (7.0)
82.8 (6.8)
81.5 (7.8)
80.4 (7.5)
82.4 (7.2)
80.7 (8.2)
81.2 (7.6)
80.7 (7.1)
82.2 (7.6)
83.7 (7.1)
88.4 (0.5)
86.2 (6.7)
83.8 (6.3)
83.5 (5.3)
Lead/Zinc Ore
89.6 (7.6)
87.9 (8.7)
89.5 (7.1)
88.4 (9.0)
86.6 (9.0)
87.1 (9.6)
89.8 (8.9)
88.9 (7.1)
87.3 (9.9)
88.5 (8.8)
85.3 (9.7)
83.6 (8.8)
85.1 (8.8)
84.6 (10.1)
82.5 (9.9)
84.6 (10.2)
83.1 (5.8)
87.6 (5.8)
86.9 (8.8)
83.0 (3.3)
Manganese 85.9 (4.3)
80.9 (6.7)
74.1 (6.3)
80.6 (10.3)
85.1 (4.9)
84.3 (4.3) 82.7
78.1 (6.0)
83.0 (6.5)
85.0 (5.8)
80.4 (9.0)
79.5 (7.8)
79.4 (8.1)
79.6 (5.8)
84.4 (4.1)
87.4 (1.7) 95.1 79.8
85.0 (4.5)
86.5 (4.7)
Mercury 88.9 (3.3) - - - - - - - - - - - - - - - - - - -
Metal ores, NEC
85.7 (8.7)
90.7 (6.2)
89.4 (9.9)
86.0 (6.3)
88.6 (3.5)
84.6 (6.9)
89.0 (0.5)
91.9 (11.4)
83.6 (7.2)
84.5 (14.2)
87.9 (2.1) 82.7
77.4 (8.2)
84.0 (9.5)
77.7 (8.9)
86.4 (10.1)
84.0 (4.3)
83.1 (2.5)
83.6 (2.2)
80.2 (6.0)
Molybdenum 84.6 (6.3)
82.1 (7.8)
81.5 (9.9)
80.8 (10.1)
91.7 (13.8)
80.3 (8.1)
87.1 (10.2)
79.9 (7.5)
80.0 (9.6)
86.2 (2.4) 99.0
82.1 (7.6)
83.9 (5.6)
84.9 (6.1)
82.6 (6.3)
88.7 (8.0)
85.4 (8.7)
84.4 (6.8) 80.8
87.6 (6.0)
Nickel - 84.5
(11.1) 89.6 84.0 (1.5) - - - - -
87.3 (1.4)
75.2 (1.7) -
77.6 (6.3) - - - - - - -
Platinum group -
96.8 (5.5) -
100.8 (2.0)
90.2 (9.4)
92.0 (4.1) 99.4
86.4 (7.5)
93.5 (8.7)
89.0 (11.2)
103.2 (6.0)
95.0 (12.9)
91.7 (11.7)
86.0 (8.6)
97.1 (11.7) -
89.1 (2.6)
93.7 (10.4)
102.5 (6.7)
97.4 (4.8)
Rare earths 84.1 (2.0)
82.6 (11.7)
77.9 (7.3)
79.8 (7.8)
76.7 (4.8)
80.9 (10.2)
85.2 (7.4)
80.6 (8.8) -
86.4 (4.1)
82.3 (19.6)
101.0 (0.3) - - -
86.2 (4.6) -
85.5 (1.4)
83.5 (1.1) 86.6
Silver ores 84.6 (9.4)
85.5 (9.0)
87.9 (10.4)
86.5 (10.6)
86.3 (10.6)
82.3 (10.1)
89.3 (10.3)
85.4 (11.6)
87.4 (8.7)
86.6 (7.8)
83.6 (8.0)
85.7 (5.9)
78.6 (9.3)
87.3 (9.0)
83.8 (3.1)
85.9 (11.9)
89.3 (9.3)
88.8 (8.5)
95.1 (6.6)
85.2 (3.1)
Titanium - - 95.6 (2.6) -
88.1 (1.6) -
84.2 (5.2) -
84.8 (3.0) -
69.3 (5.1)
84.6 (7.9)
80.0 (4.6)
80.7 (6.2)
76.1 (3.9)
81.6 (5.1) -
86.1 (4.4)
66.1 (4.3) -

Canvass Industry Year 1983 1984 1985 1986 1987 1988 1989 1990 1991 1992 1993 1994 1995 1996 1997 1998 1999 2000 2001 2002
Tungsten 91.4 (5.8)
85.9 (7.1)
83.2 (0.2) - - - - - -
86.5 (0.9) - - - - - - - - - -
Uranium 86.3 (9.6)
87.2 (11.1)
93.1 (8.6)
89.9 (9.5)
88.6 (9.3)
94.4 (9.6)
89.7 (12.6)
88.9 (10.2)
76.2 (7.5)
85.8 (5.1) 67.2
83.7 (4.3)
75.3 (9.1)
78.3 (10.6)
75.9 (3.0)
90.6 (1.2) - -
76.5 (6.0) -
Uranium - vanadium ores
86.2 (12.4)
91.6 (8.5)
87.9 (10.1)
90.6 (9.5)
95.1 (6.3)
93.9 (10.7)
95.2 (11.1)
94.6 (10.8)
103.0 (5.2) - -
65.4 (4.2)
73.6 (6.5) 66.2
91.0 (7.3) - - - - -
Vanadium - 77.4 (9.2) - - -
89.9 (1.2)
93.4 (11.1) - - - -
74.1 (5.8) -
77.3 (5.7) - -
88.1 (0.8) - - -
Zircon - - 84.7 - 89.5 84.3 (3.7)
88.0 (1.2)
85.9 (0.4)
91.7 (4.5)
86.6 (2.7) 86.8 -
80.8 (2.3)
79.0 (7.9) 77.3 -
73.7 (7.7) - -
85.2 (5.0)
Total 84.5 (9.0)
84.9 (9.6)
84.3 (9.9)
84.2 (9.7)
85.8 (9.2)
85.6 (9.5)
85.7 (8.8)
84.8 (8.7)
84.6 (8.9)
83.4 (8.6)
83.6 (8.6)
83.8 (9.5)
82.8 (8.6)
82.6 (9.1)
83.1 (10.3)
85.3 (8.8)
86.6 (3.3)
87.2 (8.1)
84.3 (8.4)
85.5 (7.8)
Nonmetal Aplite 90.1 - - - - - -
88.0 (0.5)
89.2 (0.6) - -
83.8 (8.8)
85.2 (4.1)
73.9 (4.9) - - -
82.2 (7.8)
83.3 (3.5)
84.4 (2.6)
Asbestos 87.2 (4.1)
82.5 (3.0)
87.7 (4.3)
81.2 (14.9)
84.0 (9.1)
83.4 (5.7)
88.9 (3.9)
81.3 (6.9)
84.7 (3.3)
83.7 (4.7) -
81.0 (7.2) -
79.3 (5.9)
89.8 (0.0) - -
80.2 (8.0)
87.8 (2.6)
78.7 (7.4)
Barite 82.5 (6.5)
82.2 (8.0)
82.1 (8.2)
81.5 (6.8)
81.4 (6.8)
85.6 (8.4)
82.4 (7.2)
82.6 (6.3)
82.2 (7.3)
85.3 (5.1)
85.5 (3.7)
82.2 (8.1)
81.3 (7.8)
80.6 (7.7)
80.1 (6.7)
82.5 (7.9)
78.0 (6.0)
86.6 (4.8)
80.5 (7.6)
82.6 (5.4)
Boron Materials
83.6 (7.1)
76.3 (5.1)
82.5 (3.5)
78.9 (8.3)
82.4 (9.3)
79.7 (11.2)
75.5 (7.5)
78.0 (4.8)
90.8 (7.9)
90.8 (5.1)
84.0 (6.8)
84.9 (9.4)
78.5 (7.7)
82.4 (8.9) -
74.1 (4.6) -
89.1 (6.8)
80.1 (5.1)
82.7 (0.6)
Brucite - - - - - - - - - - - - - - - - - 93.3 (2.6) 66.8 -
Cement 84.3 (7.4)
82.2 (7.9)
83.8 (8.1)
83.5 (7.7)
83.8 (8.0)
83.4 (7.8)
82.8 (7.6)
82.7 (7.6)
83.5 (7.4)
81.5 (7.9)
81.8 (7.8)
82.9 (7.7) 71
81.7 (7.7)
80.7 (8.6)
81.7 (7.9)
83.6 (5.1)
84.9 (6.4)
85.1 (5.7)
84.4 (5.7)
Chemical and fertilizer, NEC - - - - - -
88.3 (1.0) - - - -
73.0 (4.7) -
77.6 (2.3) - - - - -
79.4 (2.7)
Clay (common)
84.9 (6.5)
84.5 (6.6)
84.4 (7.0)
84.2 (6.9)
84.7 (6.7)
83.4 (7.3)
82.4 (7.3)
84.0 (7.1)
81.9 (8.6)
83.2 (7.5)
83.0 (7.2)
81.6 (8.1)
82.2 (7.3)
81.8 (7.8)
82.0 (8.1)
81.5 (6.7)
82.5 (7.5)
81.7 (7.1)
83.9 (5.9)
83.2 (6.5)
Clay (fire) 84.9 (6.1)
86.5 (7.5)
88.7 (3.2)
88.3 (9.4)
84.1 (6.8)
83.7 (9.1)
84.9 (7.9)
87.3 (6.2)
83.1 (8.6)
82.6 (8.1)
81.1 (8.7)
83.7 (8.1)
80.6 (7.4)
82.3 (8.3)
80.6 (9.3)
83.9 (5.8)
85.3 (4.2)
85.2 (6.1)
82.8 (4.9)
79.5 (8.4)
Clay, Ceramic and refractory, NEC
79.6 (9.1)
82.3 (5.3)
86.3 (5.2)
82.4 (9.7)
87.0 (8.7)
84.7 (5.5)
86.3 (8.9)
84.3 (7.2)
79.9 (9.1)
84.8 (6.6)
82.7 (7.9)
81.2 (8.9)
81.7 (7.0)
81.3 (7.2)
80.4 (7.4)
80.7 (5.6)
83.5 (5.2)
82.4 (5.5)
85.3 (6.3)
83.9 (9.1)
Construction S&G; Sand, common
86.3 (7.2)
86.2 (7.5)
85.8 (7.6)
85.7 (7.8)
86.4 (7.5)
85.7 (7.5)
85.6 (7.2)
85.0 (7.7)
83.5 (8.2)
83.6 (8.2)
83.4 (8.0)
82.6 (8.2)
81.9 (8.2)
81.5 (8.3)
81.0 (8.3)
82.1 (8.7)
85.4 (6.6)
84.1 (6.8)
82.9 (6.9)
82.7 (6.7)
Feldspar 88.2 (4.4)
82.5 (9.5)
81.8 (8.8)
85.5 (7.1)
83.0 (3.8)
85.7 (4.9)
84.4 (5.5)
86.9 (4.3)
82.4 (8.4)
82.5 (6.9)
82.3 (7.1)
83.7 (7.6)
82.3 (8.1)
81.9 (8.1)
82.1 (4.9)
79.5 (6.5)
78.9 (7.1)
84.4 (7.7)
82.2 (4.9)
77.0 (10.1)
Fluorspar 87.8 (2.1) 79.1 -
84.4 (7.0)
96.5 (8.4)
87.6 (8.1)
85.9 (1.4)
93.5 (5.4) 67.1
92.2 (10.3)
97.1 (7.5)
85.2 (10.3)
87.8 (11.5) 86.0
83.7 (3.2) -
72.5 (11.5) - -
84.2 (0.4)
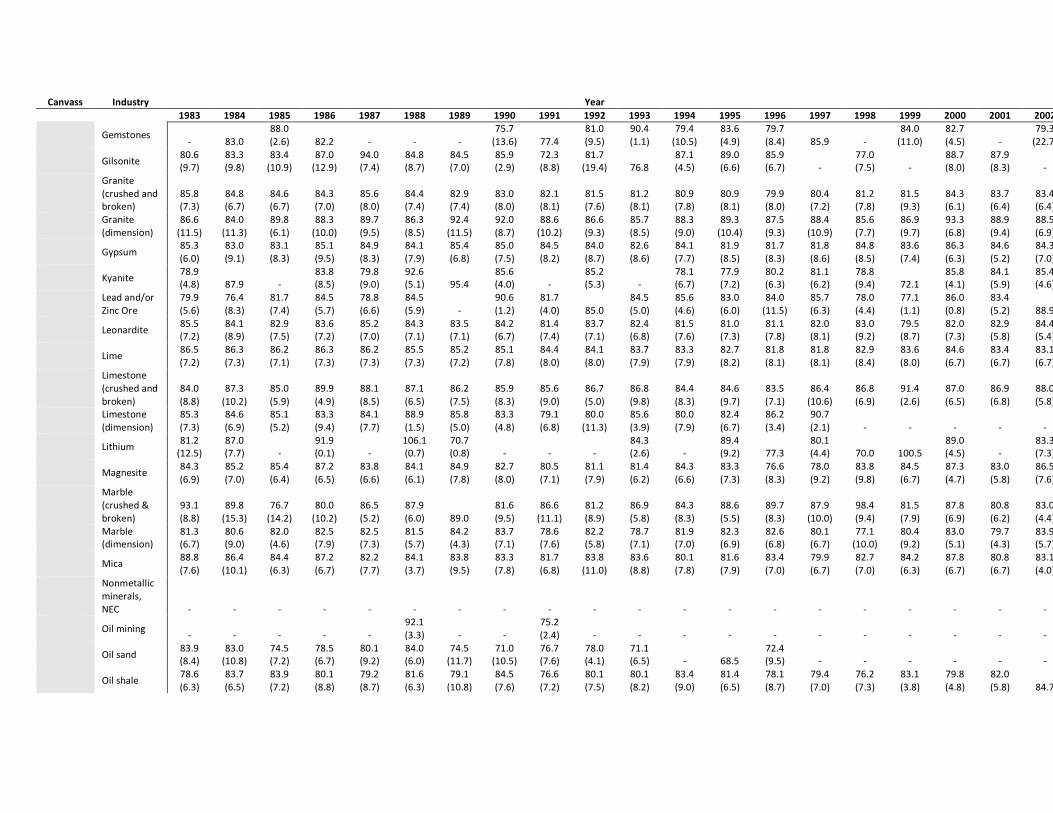
Canvass Industry Year 1983 1984 1985 1986 1987 1988 1989 1990 1991 1992 1993 1994 1995 1996 1997 1998 1999 2000 2001 2002 Gemstones - 83.0
88.0 (2.6) 82.2 - - -
75.7 (13.6) 77.4
81.0 (9.5)
90.4 (1.1)
79.4 (10.5)
83.6 (4.9)
79.7 (8.4) 85.9 -
84.0 (11.0)
82.7 (4.5) -
79.3 (22.7)
Gilsonite 80.6 (9.7)
83.3 (9.8)
83.4 (10.9)
87.0 (12.9)
94.0 (7.4)
84.8 (8.7)
84.5 (7.0)
85.9 (2.9)
72.3 (8.8)
81.7 (19.4) 76.8
87.1 (4.5)
89.0 (6.6)
85.9 (6.7) -
77.0 (7.5) -
88.7 (8.0)
87.9 (8.3) -
Granite (crushed and broken)
85.8 (7.3)
84.8 (6.7)
84.6 (6.7)
84.3 (7.0)
85.6 (8.0)
84.4 (7.4)
82.9 (7.4)
83.0 (8.0)
82.1 (8.1)
81.5 (7.6)
81.2 (8.1)
80.9 (7.8)
80.9 (8.1)
79.9 (8.0)
80.4 (7.2)
81.2 (7.8)
81.5 (9.3)
84.3 (6.1)
83.7 (6.4)
83.4 (6.4)
Granite (dimension)
86.6 (11.5)
84.0 (11.3)
89.8 (6.1)
88.3 (10.0)
89.7 (9.5)
86.3 (8.5)
92.4 (11.5)
92.0 (8.7)
88.6 (10.2)
86.6 (9.3)
85.7 (8.5)
88.3 (9.0)
89.3 (10.4)
87.5 (9.3)
88.4 (10.9)
85.6 (7.7)
86.9 (9.7)
93.3 (6.8)
88.9 (9.4)
88.5 (6.9)
Gypsum 85.3 (6.0)
83.0 (9.1)
83.1 (8.3)
85.1 (9.5)
84.9 (8.3)
84.1 (7.9)
85.4 (6.8)
85.0 (7.5)
84.5 (8.2)
84.0 (8.7)
82.6 (8.6)
84.1 (7.7)
81.9 (8.5)
81.7 (8.3)
81.8 (8.6)
84.8 (8.5)
83.6 (7.4)
86.3 (6.3)
84.6 (5.2)
84.3 (7.0)
Kyanite 78.9 (4.8) 87.9 -
83.8 (8.5)
79.8 (9.0)
92.6 (5.1) 95.4
85.6 (4.0) -
85.2 (5.3) -
78.1 (6.7)
77.9 (7.2)
80.2 (6.3)
81.1 (6.2)
78.8 (9.4) 72.1
85.8 (4.1)
84.1 (5.9)
85.4 (4.6)
Lead and/or Zinc Ore
79.9 (5.6)
76.4 (8.3)
81.7 (7.4)
84.5 (5.7)
78.8 (6.6)
84.5 (5.9) -
90.6 (1.2)
81.7 (4.0) 85.0
84.5 (5.0)
85.6 (4.6)
83.0 (6.0)
84.0 (11.5)
85.7 (6.3)
78.0 (4.4)
77.1 (1.1)
86.0 (0.8)
83.4 (5.2) 88.9
Leonardite 85.5 (7.2)
84.1 (8.9)
82.9 (7.5)
83.6 (7.2)
85.2 (7.0)
84.3 (7.1)
83.5 (7.1)
84.2 (6.7)
81.4 (7.4)
83.7 (7.1)
82.4 (6.8)
81.5 (7.6)
81.0 (7.3)
81.1 (7.8)
82.0 (8.1)
83.0 (9.2)
79.5 (8.7)
82.0 (7.3)
82.9 (5.8)
84.4 (5.4)
Lime 86.5 (7.2)
86.3 (7.3)
86.2 (7.1)
86.3 (7.3)
86.2 (7.3)
85.5 (7.3)
85.2 (7.2)
85.1 (7.8)
84.4 (8.0)
84.1 (8.0)
83.7 (7.9)
83.3 (7.9)
82.7 (8.2)
81.8 (8.1)
81.8 (8.1)
82.9 (8.4)
83.6 (8.0)
84.6 (6.7)
83.4 (6.7)
83.1 (6.7)
Limestone (crushed and broken)
84.0 (8.8)
87.3 (10.2)
85.0 (5.9)
89.9 (4.9)
88.1 (8.5)
87.1 (6.5)
86.2 (7.5)
85.9 (8.3)
85.6 (9.0)
86.7 (5.0)
86.8 (9.8)
84.4 (8.3)
84.6 (9.7)
83.5 (7.1)
86.4 (10.6)
86.8 (6.9)
91.4 (2.6)
87.0 (6.5)
86.9 (6.8)
88.0 (5.8)
Limestone (dimension)
85.3 (7.3)
84.6 (6.9)
85.1 (5.2)
83.3 (9.4)
84.1 (7.7)
88.9 (1.5)
85.8 (5.0)
83.3 (4.8)
79.1 (6.8)
80.0 (11.3)
85.6 (3.9)
80.0 (7.9)
82.4 (6.7)
86.2 (3.4)
90.7 (2.1) - - - - -
Lithium 81.2 (12.5)
87.0 (7.7) -
91.9 (0.1) -
106.1 (0.7)
70.7 (0.8) - - -
84.3 (2.6) -
89.4 (9.2) 77.3
80.1 (4.4) 70.0 100.5
89.0 (4.5) -
83.3 (7.3)
Magnesite 84.3 (6.9)
85.2 (7.0)
85.4 (6.4)
87.2 (6.5)
83.8 (6.6)
84.1 (6.1)
84.9 (7.8)
82.7 (8.0)
80.5 (7.1)
81.1 (7.9)
81.4 (6.2)
84.3 (6.6)
83.3 (7.3)
76.6 (8.3)
78.0 (9.2)
83.8 (9.8)
84.5 (6.7)
87.3 (4.7)
83.0 (5.8)
86.5 (7.6)
Marble (crushed & broken)
93.1 (8.8)
89.8 (15.3)
76.7 (14.2)
80.0 (10.2)
86.5 (5.2)
87.9 (6.0) 89.0
81.6 (9.5)
86.6 (11.1)
81.2 (8.9)
86.9 (5.8)
84.3 (8.3)
88.6 (5.5)
89.7 (8.3)
87.9 (10.0)
98.4 (9.4)
81.5 (7.9)
87.8 (6.9)
80.8 (6.2)
83.0 (4.4)
Marble (dimension)
81.3 (6.7)
80.6 (9.0)
82.0 (4.6)
82.5 (7.9)
82.5 (7.3)
81.5 (5.7)
84.2 (4.3)
83.7 (7.1)
78.6 (7.6)
82.2 (5.8)
78.7 (7.1)
81.9 (7.0)
82.3 (6.9)
82.6 (6.8)
80.1 (6.7)
77.1 (10.0)
80.4 (9.2)
83.0 (5.1)
79.7 (4.3)
83.9 (5.7)
Mica 88.8 (7.6)
86.4 (10.1)
84.4 (6.3)
87.2 (6.7)
82.2 (7.7)
84.1 (3.7)
83.8 (9.5)
83.3 (7.8)
81.7 (6.8)
83.8 (11.0)
83.6 (8.8)
80.1 (7.8)
81.6 (7.9)
83.4 (7.0)
79.9 (6.7)
82.7 (7.0)
84.2 (6.3)
87.8 (6.7)
80.8 (6.7)
83.1 (4.0)
Nonmetallic minerals, NEC - - - - - - - - - - - - - - - - - - - -
Oil mining - - - - - 92.1 (3.3) - -
75.2 (2.4) - - - - - - - - - - -
Oil sand 83.9 (8.4)
83.0 (10.8)
74.5 (7.2)
78.5 (6.7)
80.1 (9.2)
84.0 (6.0)
74.5 (11.7)
71.0 (10.5)
76.7 (7.6)
78.0 (4.1)
71.1 (6.5) - 68.5
72.4 (9.5) - - - - - -
Oil shale 78.6 (6.3)
83.7 (6.5)
83.9 (7.2)
80.1 (8.8)
79.2 (8.7)
81.6 (6.3)
79.1 (10.8)
84.5 (7.6)
76.6 (7.2)
80.1 (7.5)
80.1 (8.2)
83.4 (9.0)
81.4 (6.5)
78.1 (8.7)
79.4 (7.0)
76.2 (7.3)
83.1 (3.8)
79.8 (4.8)
82.0 (5.8) 84.7
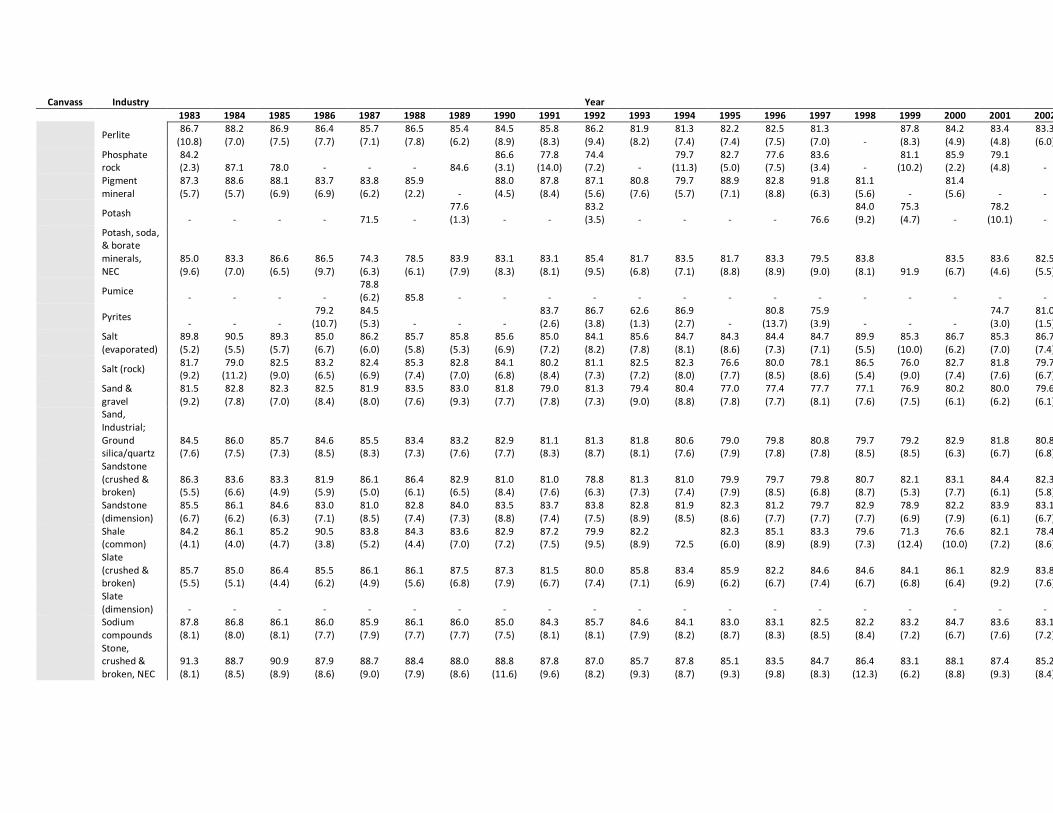
Canvass Industry Year 1983 1984 1985 1986 1987 1988 1989 1990 1991 1992 1993 1994 1995 1996 1997 1998 1999 2000 2001 2002 Perlite 86.7
(10.8) 88.2 (7.0)
86.9 (7.5)
86.4 (7.7)
85.7 (7.1)
86.5 (7.8)
85.4 (6.2)
84.5 (8.9)
85.8 (8.3)
86.2 (9.4)
81.9 (8.2)
81.3 (7.4)
82.2 (7.4)
82.5 (7.5)
81.3 (7.0) -
87.8 (8.3)
84.2 (4.9)
83.4 (4.8)
83.3 (6.0)
Phosphate rock
84.2 (2.3) 87.1 78.0 - - - 84.6
86.6 (3.1)
77.8 (14.0)
74.4 (7.2) -
79.7 (11.3)
82.7 (5.0)
77.6 (7.5)
83.6 (3.4) -
81.1 (10.2)
85.9 (2.2)
79.1 (4.8) -
Pigment mineral
87.3 (5.7)
88.6 (5.7)
88.1 (6.9)
83.7 (6.9)
83.8 (6.2)
85.9 (2.2) -
88.0 (4.5)
87.8 (8.4)
87.1 (5.6)
80.8 (7.6)
79.7 (5.7)
88.9 (7.1)
82.8 (8.8)
91.8 (6.3)
81.1 (5.6) -
81.4 (5.6) - -
Potash - - - - 71.5 - 77.6 (1.3) - -
83.2 (3.5) - - - - 76.6
84.0 (9.2)
75.3 (4.7) -
78.2 (10.1) -
Potash, soda, & borate minerals, NEC
85.0 (9.6)
83.3 (7.0)
86.6 (6.5)
86.5 (9.7)
74.3 (6.3)
78.5 (6.1)
83.9 (7.9)
83.1 (8.3)
83.1 (8.1)
85.4 (9.5)
81.7 (6.8)
83.5 (7.1)
81.7 (8.8)
83.3 (8.9)
79.5 (9.0)
83.8 (8.1) 91.9
83.5 (6.7)
83.6 (4.6)
82.5 (5.5)
Pumice - - - - 78.8 (6.2) 85.8 - - - - - - - - - - - - - -
Pyrites - - - 79.2
(10.7) 84.5 (5.3) - - -
83.7 (2.6)
86.7 (3.8)
62.6 (1.3)
86.9 (2.7) -
80.8 (13.7)
75.9 (3.9) - - -
74.7 (3.0)
81.0 (1.5)
Salt (evaporated)
89.8 (5.2)
90.5 (5.5)
89.3 (5.7)
85.0 (6.7)
86.2 (6.0)
85.7 (5.8)
85.8 (5.3)
85.6 (6.9)
85.0 (7.2)
84.1 (8.2)
85.6 (7.8)
84.7 (8.1)
84.3 (8.6)
84.4 (7.3)
84.7 (7.1)
89.9 (5.5)
85.3 (10.0)
86.7 (6.2)
85.3 (7.0)
86.7 (7.4)
Salt (rock) 81.7 (9.2)
79.0 (11.2)
82.5 (9.0)
83.2 (6.5)
82.4 (6.9)
85.3 (7.4)
82.8 (7.0)
84.1 (6.8)
80.2 (8.4)
81.1 (7.3)
82.5 (7.2)
82.3 (8.0)
76.6 (7.7)
80.0 (8.5)
78.1 (8.6)
86.5 (5.4)
76.0 (9.0)
82.7 (7.4)
81.8 (7.6)
79.7 (6.7)
Sand & gravel
81.5 (9.2)
82.8 (7.8)
82.3 (7.0)
82.5 (8.4)
81.9 (8.0)
83.5 (7.6)
83.0 (9.3)
81.8 (7.7)
79.0 (7.8)
81.3 (7.3)
79.4 (9.0)
80.4 (8.8)
77.0 (7.8)
77.4 (7.7)
77.7 (8.1)
77.1 (7.6)
76.9 (7.5)
80.2 (6.1)
80.0 (6.2)
79.6 (6.1)
Sand, Industrial; Ground silica/quartz
84.5 (7.6)
86.0 (7.5)
85.7 (7.3)
84.6 (8.5)
85.5 (8.3)
83.4 (7.3)
83.2 (7.6)
82.9 (7.7)
81.1 (8.3)
81.3 (8.7)
81.8 (8.1)
80.6 (7.6)
79.0 (7.9)
79.8 (7.8)
80.8 (7.8)
79.7 (8.5)
79.2 (8.5)
82.9 (6.3)
81.8 (6.7)
80.8 (6.8)
Sandstone (crushed & broken)
86.3 (5.5)
83.6 (6.6)
83.3 (4.9)
81.9 (5.9)
86.1 (5.0)
86.4 (6.1)
82.9 (6.5)
81.0 (8.4)
81.0 (7.6)
78.8 (6.3)
81.3 (7.3)
81.0 (7.4)
79.9 (7.9)
79.7 (8.5)
79.8 (6.8)
80.7 (8.7)
82.1 (5.3)
83.1 (7.7)
84.4 (6.1)
82.3 (5.8)
Sandstone (dimension)
85.5 (6.7)
86.1 (6.2)
84.6 (6.3)
83.0 (7.1)
81.0 (8.5)
82.8 (7.4)
84.0 (7.3)
83.5 (8.8)
83.7 (7.4)
83.8 (7.5)
82.8 (8.9)
81.9 (8.5)
82.3 (8.6)
81.2 (7.7)
79.7 (7.7)
82.9 (7.7)
78.9 (6.9)
82.2 (7.9)
83.9 (6.1)
83.1 (6.7)
Shale (common)
84.2 (4.1)
86.1 (4.0)
85.2 (4.7)
90.5 (3.8)
83.8 (5.2)
84.3 (4.4)
83.6 (7.0)
82.9 (7.2)
87.2 (7.5)
79.9 (9.5)
82.2 (8.9) 72.5
82.3 (6.0)
85.1 (8.9)
83.3 (8.9)
79.6 (7.3)
71.3 (12.4)
76.6 (10.0)
82.1 (7.2)
78.4 (8.6)
Slate (crushed & broken)
85.7 (5.5)
85.0 (5.1)
86.4 (4.4)
85.5 (6.2)
86.1 (4.9)
86.1 (5.6)
87.5 (6.8)
87.3 (7.9)
81.5 (6.7)
80.0 (7.4)
85.8 (7.1)
83.4 (6.9)
85.9 (6.2)
82.2 (6.7)
84.6 (7.4)
84.6 (6.7)
84.1 (6.8)
86.1 (6.4)
82.9 (9.2)
83.8 (7.6)
Slate (dimension) - - - - - - - - - - - - - - - - - - - -
Sodium compounds
87.8 (8.1)
86.8 (8.0)
86.1 (8.1)
86.0 (7.7)
85.9 (7.9)
86.1 (7.7)
86.0 (7.7)
85.0 (7.5)
84.3 (8.1)
85.7 (8.1)
84.6 (7.9)
84.1 (8.2)
83.0 (8.7)
83.1 (8.3)
82.5 (8.5)
82.2 (8.4)
83.2 (7.2)
84.7 (6.7)
83.6 (7.6)
83.1 (7.2)
Stone, crushed & broken, NEC
91.3 (8.1)
88.7 (8.5)
90.9 (8.9)
87.9 (8.6)
88.7 (9.0)
88.4 (7.9)
88.0 (8.6)
88.8 (11.6)
87.8 (9.6)
87.0 (8.2)
85.7 (9.3)
87.8 (8.7)
85.1 (9.3)
83.5 (9.8)
84.7 (8.3)
86.4 (12.3)
83.1 (6.2)
88.1 (8.8)
87.4 (9.3)
85.2 (8.4)

Canvass Industry Year 1983 1984 1985 1986 1987 1988 1989 1990 1991 1992 1993 1994 1995 1996 1997 1998 1999 2000 2001 2002 Stone,
dimension, NEC
83.8 (7.9)
83.2 (8.4)
79.3 (8.0)
83.2 (7.7)
80.9 (8.4)
84.0 (6.6)
84.6 (7.7)
82.8 (6.6)
84.1 (9.2)
84.0 (7.9)
81.0 (8.7)
82.4 (7.5)
79.6 (8.9)
81.5 (8.9)
81.8 (10.3)
82.3 (9.4)
81.5 (5.9)
82.9 (6.3)
81.2 (6.2)
79.8 (6.5)
Talc, soapstone, & pyrophylite
83.8 (7.9)
83.2 (8.4)
79.3 (8.0)
83.2 (7.7)
80.9 (8.4)
84.0 (6.6)
84.6 (7.7)
82.8 (6.6)
84.1 (9.2)
84.0 (7.9)
81.0 (8.7)
82.4 (7.5)
79.6 (8.9)
81.5 (8.9)
81.8 (10.3)
82.3 (9.4)
81.5 (5.9)
82.9 (6.3)
81.2 (6.2)
79.8 (6.5)
Traprock (crushed & broken)
86.6 (7.4)
86.6 (6.8)
86.4 (6.7)
86.8 (6.4)
86.8 (7.6)
86.0 (7.6)
85.9 (6.7)
87.1 (7.2)
84.1 (8.4)
85.4 (8.5)
83.9 (8.6)
83.5 (7.8)
83.3 (8.0)
82.8 (8.2)
81.7 (8.0)
81.8 (7.5)
83.7 (7.7)
84.6 (5.5)
83.6 (6.2)
83.5 (6.3)
Traprock (dimension)
90.3 (7.5)
88.5 (5.4) 70.8
85.4 (4.5) -
74.6 (13.9)
86.4 (5.4)
79.2 (8.8)
91.2 (2.1)
84.1 (11.9)
90.5 (12.7)
86.0 (3.5)
81.5 (5.1) -
79.6 (8.0) -
82.5 (7.1)
83.8 (3.2) -
81.0 (6.6)
Trona 87.2 (3.8) -
85.2 (7.0)
84.2 (9.7)
82.8 (8.6)
86.0 (7.3)
81.1 (1.5)
79.6 (11.2)
88.2 (6.8)
76.6 (4.8)
84.7 (9.9)
82.3 (8.2)
84.3 (8.9)
82.1 (10.4)
84.0 (10.6)
86.9 (10.1)
79.5 (9.3)
85.6 (4.3) - -
Vermiculite 82.6 (10.1)
78.9 (7.5)
84.7 (6.0)
78.3 (10.1)
83.7 (7.0)
80.3 (8.7)
75.2 (8.6)
83.0 (8.8)
77.1 (6.4)
83.6 (6.8)
86.2 (4.9)
85.4 (5.9)
85.1 (8.8)
87.7 (12.7)
84.8 (5.6) -
86.1 (2.9)
84.4 (2.2)
84.2 (3.4)
83.3 (3.5)
Total 86.1 (7.5)
85.6 (7.7)
85.5 (7.5)
85.5 (7.7)
85.9 (7.6)
85.3 (7.5)
85.0 (7.4)
84.8 (7.8)
83.7 (8.3)
83.8 (8.2)
83.4 (8.1)
82.9 (8.1) 71
81.7 (8.2)
81.5 (8.2)
82.4 (8.6)
86.6 (6.3)
84.4 (6.8)
83.3 (6.9)
83.1 (6.7)
Note: Prior to 1999, the Mine Safety and Health Administration (MSHA) set the permissible exposure limit (PEL) for noise at 90 dBA as an 8-hour time-weighted average (TWA) with an exchange rate of 5 dB and a sound level range from 90 to at least 140 dBA. Beginning in 1999, synchronized with the requirements of Hearing Conservation Programs (HCPs) outlined by 30 CFR Part 62, MSHA set an action limit (AL) for noise at 85 dBA with an exchange rate of 5 dB and a new sound level range from 80 to 130 dBA.
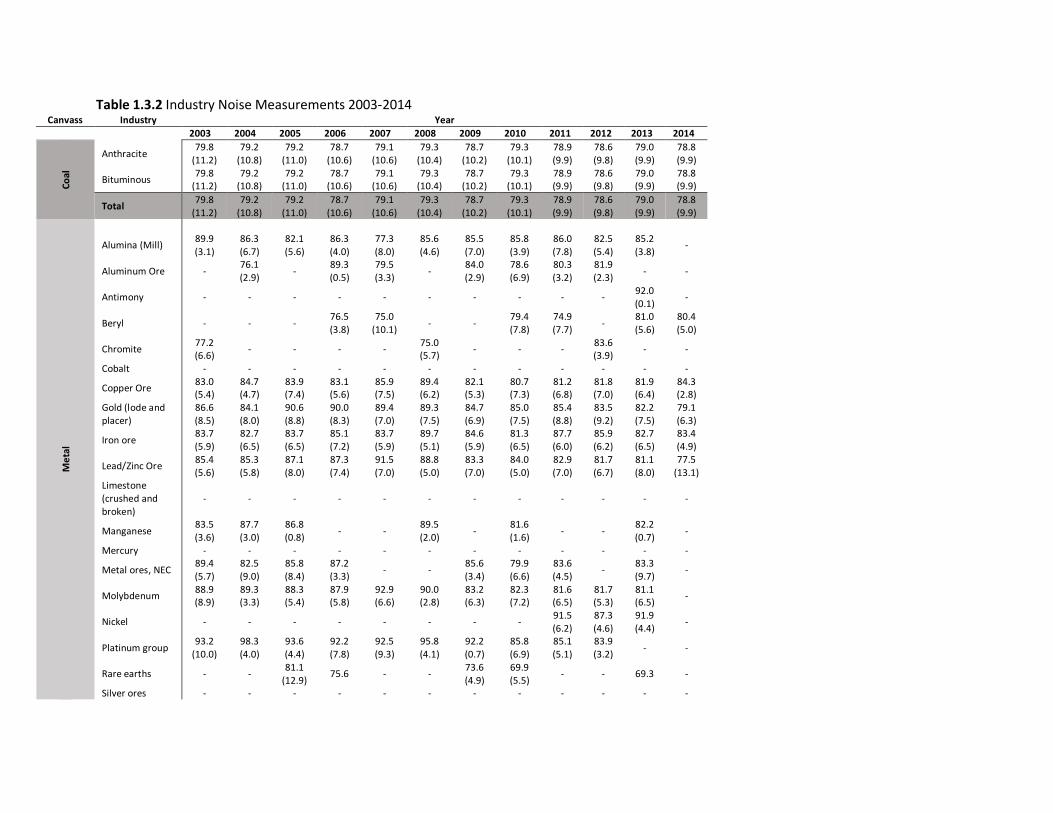
Table 1.3.2 Industry Noise Measurements 2003-2014 Canvass Industry Year
2003 2004 2005 2006 2007 2008 2009 2010 2011 2012 2013 2014
Coal
Anthracite 79.8 (11.2)
79.2 (10.8)
79.2 (11.0)
78.7 (10.6)
79.1 (10.6)
79.3 (10.4)
78.7 (10.2)
79.3 (10.1)
78.9 (9.9)
78.6 (9.8)
79.0 (9.9)
78.8 (9.9)
Bituminous 79.8 (11.2)
79.2 (10.8)
79.2 (11.0)
78.7 (10.6)
79.1 (10.6)
79.3 (10.4)
78.7 (10.2)
79.3 (10.1)
78.9 (9.9)
78.6 (9.8)
79.0 (9.9)
78.8 (9.9)
Total 79.8 (11.2)
79.2 (10.8)
79.2 (11.0)
78.7 (10.6)
79.1 (10.6)
79.3 (10.4)
78.7 (10.2)
79.3 (10.1)
78.9 (9.9)
78.6 (9.8)
79.0 (9.9)
78.8 (9.9)
Met
al
Alumina (Mill) 89.9 (3.1)
86.3 (6.7)
82.1 (5.6)
86.3 (4.0)
77.3 (8.0)
85.6 (4.6)
85.5 (7.0)
85.8 (3.9)
86.0 (7.8)
82.5 (5.4)
85.2 (3.8) -
Aluminum Ore - 76.1 (2.9) - 89.3
(0.5) 79.5 (3.3) - 84.0
(2.9) 78.6 (6.9)
80.3 (3.2)
81.9 (2.3) - -
Antimony - - - - - - - - - - 92.0 (0.1) -
Beryl - - - 76.5 (3.8)
75.0 (10.1) - - 79.4
(7.8) 74.9 (7.7) - 81.0
(5.6) 80.4 (5.0)
Chromite 77.2 (6.6) - - - - 75.0
(5.7) - - - 83.6 (3.9) - -
Cobalt - - - - - - - - - - - -
Copper Ore 83.0 (5.4)
84.7 (4.7)
83.9 (7.4)
83.1 (5.6)
85.9 (7.5)
89.4 (6.2)
82.1 (5.3)
80.7 (7.3)
81.2 (6.8)
81.8 (7.0)
81.9 (6.4)
84.3 (2.8)
Gold (lode and placer)
86.6 (8.5)
84.1 (8.0)
90.6 (8.8)
90.0 (8.3)
89.4 (7.0)
89.3 (7.5)
84.7 (6.9)
85.0 (7.5)
85.4 (8.8)
83.5 (9.2)
82.2 (7.5)
79.1 (6.3)
Iron ore 83.7 (5.9)
82.7 (6.5)
83.7 (6.5)
85.1 (7.2)
83.7 (5.9)
89.7 (5.1)
84.6 (5.9)
81.3 (6.5)
87.7 (6.0)
85.9 (6.2)
82.7 (6.5)
83.4 (4.9)
Lead/Zinc Ore 85.4 (5.6)
85.3 (5.8)
87.1 (8.0)
87.3 (7.4)
91.5 (7.0)
88.8 (5.0)
83.3 (7.0)
84.0 (5.0)
82.9 (7.0)
81.7 (6.7)
81.1 (8.0)
77.5 (13.1)
Limestone (crushed and broken)
- - - - - - - - - - - -
Manganese 83.5 (3.6)
87.7 (3.0)
86.8 (0.8) - - 89.5
(2.0) - 81.6 (1.6) - - 82.2
(0.7) -
Mercury - - - - - - - - - - - -
Metal ores, NEC 89.4 (5.7)
82.5 (9.0)
85.8 (8.4)
87.2 (3.3) - - 85.6
(3.4) 79.9 (6.6)
83.6 (4.5) - 83.3
(9.7) -
Molybdenum 88.9 (8.9)
89.3 (3.3)
88.3 (5.4)
87.9 (5.8)
92.9 (6.6)
90.0 (2.8)
83.2 (6.3)
82.3 (7.2)
81.6 (6.5)
81.7 (5.3)
81.1 (6.5) -
Nickel - - - - - - - - 91.5 (6.2)
87.3 (4.6)
91.9 (4.4) -
Platinum group 93.2 (10.0)
98.3 (4.0)
93.6 (4.4)
92.2 (7.8)
92.5 (9.3)
95.8 (4.1)
92.2 (0.7)
85.8 (6.9)
85.1 (5.1)
83.9 (3.2) - -
Rare earths - - 81.1 (12.9) 75.6 - - 73.6
(4.9) 69.9 (5.5) - - 69.3 -
Silver ores - - - - - - - - - - - -

Canvass Industry Year 2003 2004 2005 2006 2007 2008 2009 2010 2011 2012 2013 2014
Titanium 81.2 (2.0)
85.3 (5.5) - 83.3 - - 85.6
(1.8) 80.7 (2.9) - 80.1
(3.2) - -
Tungsten - - - - - - - - - - - -
Uranium - 75.9 (8.6)
91.3 (7.7) - 79.6
(7.4) 89.6 (6.4)
88.9 (4.6)
85.1 (6.4)
83.1 (7.2)
84.3 (9.3)
80.1 (8.2) -
Uranium - vanadium ores - 91.5
(5.5) 101.9 (5.6) - - 84.7
(2.6) 86.2 (3.8) - - - - -
Vanadium - - - - - - - - - - - -
Zircon 73.9 (6.1) - 82.2
(3.3) - - - - - - - - -
Total 86.6 (8.2)
84.7 (7.3)
88.4 (8.6)
87.8 (7.7)
88.1 (7.9)
88.6 (6.2)
84.6 (6.5)
82.7 (7.4)
83.0 (7.5)
83.1 (7.2)
82.3 (6.8)
82.7 (4.4)
Nonmetal Aplite - 82.2
(2.1) 84.0 (2.6)
87.4 (1.3)
83.3 (2.2) - - - 84.7
(1.7) 83.6 (0.7) - -
Asbestos - - - - - - - - - - - - Barite 85.0
(7.1) 83.1 (6.1)
84.7 (4.9)
86.9 (6.2)
80.7 (6.5)
86.2 (4.1)
82.9 (4.4)
81.6 (4.9)
85.4 (3.5)
82.4 (4.5)
84.1 (8.5)
84.4 (4.8)
Boron Materials 77.1 (8.3)
82.5 (1.8) - 81.1
(0.8) 77.7 (0.7) - 77.1
(8.3) - 80.2 (0.4) - 81.1
(5.6) -
Brucite - 78.5 (1.7) - 76.2
(7.0) - - 70.8 (7.1) - - - - -
Cement 83.1 (6.3)
84.4 (6.6)
84.3 (6.2)
85.6 (5.9)
85.9 (6.9)
85.8 (5.5)
83.6 (6.0)
81.8 (6.3)
82.4 (7.2)
83.8 (6.0)
80.9 (7.0)
83.4 (7.6)
Chemical and fertilizer, NEC
74.5 (4.6) - - 79.9
(1.9) 73.6 (4.8)
84.3 (2.5)
82.3 (0.6)
79.8 (5.2)
83.1 (2.5) - 70.2 -
Clay (common) 82.5 (5.9)
82.4 (6.4)
83.2 (6.9)
83.6 (6.1)
84.5 (7.4)
87.0 (6.5)
81.4 (6.6)
80.2 (6.0)
81.9 (6.2)
80.9 (6.6)
81.8 (6.4)
82.7 (2.9)
Clay (fire) 85.3 (5.8)
83.4 (5.3)
82.8 (5.7)
77.9 (3.5)
87.2 (3.7)
80.1 (9.2)
76.5 (6.5)
77.6 (9.8)
77.0 (7.9)
80.2 (3.7)
78.5 (5.2) -
Clay, Ceramic and refractory, NEC
84.7 (4.4)
81.0 (8.7)
79.6 (6.6)
83.7 (7.1)
82.2 (5.7)
86.8 (2.6)
82.1 (7.2)
81.2 (7.2)
81.6 (5.2)
77.6 (7.8)
80.2 (4.6) -
Construction S&G; Sand, common
81.9 (6.5)
81.8 (6.6)
81.5 (6.8)
82.5 (6.7)
83.3 (6.8)
83.8 (6.7)
79.5 (7.0)
78.3 (6.7)
79.0 (6.9)
78.9 (6.7)
78.7 (6.8)
77.2 (7.2)
Feldspar 81.2 (9.8)
83.1 (7.8)
82.3 (9.3)
82.6 (6.2)
81.3 (7.3)
85.8 (3.7)
81.0 (4.5)
82.6 (3.4)
84.3 (4.8)
79.7 (7.8)
77.5 (6.0) -
Fluorspar - - - - - 87.2 (4.3)
80.7 (2.8) - 80.2
(3.0) 79.8 (4.2)
86.2 (2.7) -
Gemstones - 91.8 (11.9) - - 78.6
(10.4) - 75.6 (5.4)
78.0 (5.5)
87.8 (2.8)
91.8 (0.8)
81.2 (14.2) 99.1
Gilsonite - - - - - - 82.1 (5.1)
83.1 (4.0)
82.2 (4.2)
88.7 (2.6) - -

Canvass Industry Year 2003 2004 2005 2006 2007 2008 2009 2010 2011 2012 2013 2014 Granite (crushed
and broken) 83.3 (6.4)
82.1 (6.3)
81.7 (6.2)
83.6 (6.3)
83.8 (6.0)
86.5 (7.0)
79.5 (6.6)
79.9 (6.7)
79.5 (7.1)
79.6 (6.3)
78.9 (6.5)
78.2 (3.7)
Granite (dimension)
90.7 (10.9)
88.3 (8.8)
90.7 (8.3)
83.9 (9.7)
90.0 (9.2)
93.2 (7.0)
85.9 (7.6)
86.8 (11.2)
86.2 (8.6)
87.1 (7.6)
84.1 (7.2)
85.8 (1.6)
Gypsum 84.0 (8.5)
83.4 (8.3)
84.8 (6.8)
84.6 (6.3)
86.6 (6.5)
88.5 (5.6)
79.8 (6.5)
81.2 (6.7)
81.5 (6.8)
81.4 (5.7)
82.3 (7.7)
81.8 (9.5)
Kyanite 86.9 (5.9)
82.6 (5.8)
79.0 (2.2) - 85.5
(4.4) 93.9 (3.6)
84.3 (2.4)
80.0 (0.1)
82.3 (4.7)
83.4 (3.1)
83.7 (2.9) -
Lead and/or Zinc Ore
85.4 (5.6)
85.3 (5.9)
87.1 (8.0)
87.3 (7.5)
91.5 (7.0)
88.8 (5.0)
83.3 (7.0)
84.0 (5.0)
82.9 (7.0)
81.7 (6.7)
81.1 (8.0)
77.5 (14.1)
Leonardite 81.3 (5.3) - 88.9
(1.5) 86.6 (2.5)
86.2 (2.4) - 82.7
(6.2) 80.7 (8.4)
79.6 (5.0)
83.2 (3.2) 81.1 -
Lime 83.5 (5.4)
83.5 (5.8)
83.1 (5.5)
86.1 (4.2)
84.8 (4.4)
87.6 (4.6)
83.1 (6.0)
81.3 (7.2)
81.8 (5.9)
81.7 (6.7)
82.4 (5.4)
82.5 (5.7)
Limestone (crushed and broken)
82.2 (6.8)
82.0 (6.7)
81.9 (6.8)
83.2 (7.1)
84.5 (6.3)
85.3 (5.7)
80.8 (6.7)
80.1 (6.7)
80.1 (6.5)
80.1 (6.7)
79.5 (6.8)
79.5 (7.3)
Limestone (dimension)
84.8 (6.4)
86.2 (7.3)
87.2 (9.3)
87.0 (6.3)
88.2 (7.3)
89.5 (4.6)
83.5 (6.7)
84.5 (5.5)
85.9 (6.3)
84.2 (7.3)
83.9 (6.5)
79.3 (7.2)
Lithium - - - - - - - - - - - - Magnesite - - 65.9
(5.1) - - - 87.4 (3.2) - - - 74.4
(5.1) -
Marble (crushed & broken)
86.8 (5.8)
84.8 (5.5)
89.5 (7.0)
83.2 (3.4)
82.8 (7.5)
90.1 (7.3)
81.1 (6.4)
75.7 (7.0)
76.5 (2.7)
78.5 (5.8)
82.8 (4.7) -
Marble (dimension)
81.3 (4.7)
83.4 (6.0)
83.0 (4.9)
82.5 (9.5)
88.2 (7.1)
86.8 (1.3)
85.6 (8.4)
83.4 (7.8)
86.7 (0.4)
78.7 (4.4)
83.4 (4.3) -
Mica 83.1 (4.0)
82.4 (5.6)
91.2 (0.4)
85.8 (4.3)
82.9 (4.7) - 79.4
(7.9) 81.5 (3.1)
81.7 (7.9) - 82.0
(5.6) -
Nonmetallic minerals, NEC
82.3 (5.3)
83.6 (5.2)
84.1 (5.0)
84.9 (4.7)
83.7 (5.6)
87.7 (4.9)
79.8 (6.3)
79.5 (6.3)
83.4 (3.1)
81.5 (6.6)
84.1 (5.2) -
Oil mining - - - - - 93.1 (4.7) - - - - - -
Oil sand - - - - 72.4 (1.9) - - - 70.7
(4.1) - - -
Oil shale 72.4 - 84.8 (11.2)
77.5 (10.2) - - - - - 70.5 73.1
(8.4) -
Perlite 79.9 (6.8)
75.7 (5.3)
72.5 (9.2)
78.4 (5.0)
82.4 (4.8)
79.0 (7.9)
81.7 (5.8)
80.2 (5.5)
81.2 (2.8)
82.0 (2.1)
77.1 (8.5) -
Phosphate rock 85.1 (6.7)
81.1 (6.5)
82.3 (6.9)
87.6 (8.1)
90.2 (10.0)
89.6 (5.9)
84.2 (6.1)
80.7 (7.3)
82.6 (9.0)
82.6 (5.9)
79.9 (4.7)
84.2 (4.7)
Pigment mineral 89.1 (2.3)
89.0 (1.2) - - 89.1
(3.0) - 88.0 (2.4) - - 89.4
(3.3) - -
Potash 79.9 (6.6)
79.8 (6.7)
84.9 (7.5) 98.2 76.0
(6.3) 89.3 (2.3)
80.8 (4.6)
85.1 (2.5)
81.0 (0.8) - - -
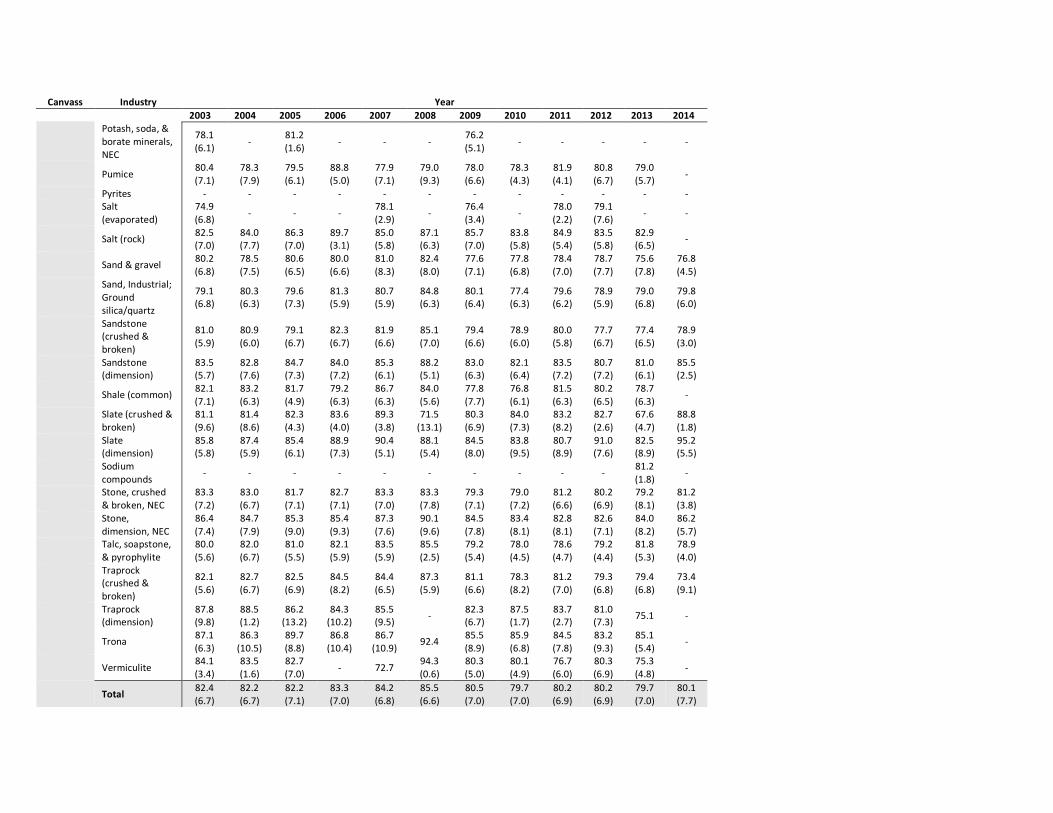
Canvass Industry Year 2003 2004 2005 2006 2007 2008 2009 2010 2011 2012 2013 2014 Potash, soda, &
borate minerals, NEC
78.1 (6.1) - 81.2
(1.6) - - - 76.2 (5.1) - - - - -
Pumice 80.4 (7.1)
78.3 (7.9)
79.5 (6.1)
88.8 (5.0)
77.9 (7.1)
79.0 (9.3)
78.0 (6.6)
78.3 (4.3)
81.9 (4.1)
80.8 (6.7)
79.0 (5.7) -
Pyrites - - - - - - - - - - - - Salt
(evaporated) 74.9 (6.8) - - - 78.1
(2.9) - 76.4 (3.4) - 78.0
(2.2) 79.1 (7.6) - -
Salt (rock) 82.5 (7.0)
84.0 (7.7)
86.3 (7.0)
89.7 (3.1)
85.0 (5.8)
87.1 (6.3)
85.7 (7.0)
83.8 (5.8)
84.9 (5.4)
83.5 (5.8)
82.9 (6.5) -
Sand & gravel 80.2 (6.8)
78.5 (7.5)
80.6 (6.5)
80.0 (6.6)
81.0 (8.3)
82.4 (8.0)
77.6 (7.1)
77.8 (6.8)
78.4 (7.0)
78.7 (7.7)
75.6 (7.8)
76.8 (4.5)
Sand, Industrial; Ground silica/quartz
79.1 (6.8)
80.3 (6.3)
79.6 (7.3)
81.3 (5.9)
80.7 (5.9)
84.8 (6.3)
80.1 (6.4)
77.4 (6.3)
79.6 (6.2)
78.9 (5.9)
79.0 (6.8)
79.8 (6.0)
Sandstone (crushed & broken)
81.0 (5.9)
80.9 (6.0)
79.1 (6.7)
82.3 (6.7)
81.9 (6.6)
85.1 (7.0)
79.4 (6.6)
78.9 (6.0)
80.0 (5.8)
77.7 (6.7)
77.4 (6.5)
78.9 (3.0)
Sandstone (dimension)
83.5 (5.7)
82.8 (7.6)
84.7 (7.3)
84.0 (7.2)
85.3 (6.1)
88.2 (5.1)
83.0 (6.3)
82.1 (6.4)
83.5 (7.2)
80.7 (7.2)
81.0 (6.1)
85.5 (2.5)
Shale (common) 82.1 (7.1)
83.2 (6.3)
81.7 (4.9)
79.2 (6.3)
86.7 (6.3)
84.0 (5.6)
77.8 (7.7)
76.8 (6.1)
81.5 (6.3)
80.2 (6.5)
78.7 (6.3) -
Slate (crushed & broken)
81.1 (9.6)
81.4 (8.6)
82.3 (4.3)
83.6 (4.0)
89.3 (3.8)
71.5 (13.1)
80.3 (6.9)
84.0 (7.3)
83.2 (8.2)
82.7 (2.6)
67.6 (4.7)
88.8 (1.8)
Slate (dimension)
85.8 (5.8)
87.4 (5.9)
85.4 (6.1)
88.9 (7.3)
90.4 (5.1)
88.1 (5.4)
84.5 (8.0)
83.8 (9.5)
80.7 (8.9)
91.0 (7.6)
82.5 (8.9)
95.2 (5.5)
Sodium compounds - - - - - - - - - - 81.2
(1.8) -
Stone, crushed & broken, NEC
83.3 (7.2)
83.0 (6.7)
81.7 (7.1)
82.7 (7.1)
83.3 (7.0)
83.3 (7.8)
79.3 (7.1)
79.0 (7.2)
81.2 (6.6)
80.2 (6.9)
79.2 (8.1)
81.2 (3.8)
Stone, dimension, NEC
86.4 (7.4)
84.7 (7.9)
85.3 (9.0)
85.4 (9.3)
87.3 (7.6)
90.1 (9.6)
84.5 (7.8)
83.4 (8.1)
82.8 (8.1)
82.6 (7.1)
84.0 (8.2)
86.2 (5.7)
Talc, soapstone, & pyrophylite
80.0 (5.6)
82.0 (6.7)
81.0 (5.5)
82.1 (5.9)
83.5 (5.9)
85.5 (2.5)
79.2 (5.4)
78.0 (4.5)
78.6 (4.7)
79.2 (4.4)
81.8 (5.3)
78.9 (4.0)
Traprock (crushed & broken)
82.1 (5.6)
82.7 (6.7)
82.5 (6.9)
84.5 (8.2)
84.4 (6.5)
87.3 (5.9)
81.1 (6.6)
78.3 (8.2)
81.2 (7.0)
79.3 (6.8)
79.4 (6.8)
73.4 (9.1)
Traprock (dimension)
87.8 (9.8)
88.5 (1.2)
86.2 (13.2)
84.3 (10.2)
85.5 (9.5) - 82.3
(6.7) 87.5 (1.7)
83.7 (2.7)
81.0 (7.3) 75.1 -
Trona 87.1 (6.3)
86.3 (10.5)
89.7 (8.8)
86.8 (10.4)
86.7 (10.9) 92.4 85.5
(8.9) 85.9 (6.8)
84.5 (7.8)
83.2 (9.3)
85.1 (5.4) -
Vermiculite 84.1 (3.4)
83.5 (1.6)
82.7 (7.0) - 72.7 94.3
(0.6) 80.3 (5.0)
80.1 (4.9)
76.7 (6.0)
80.3 (6.9)
75.3 (4.8) -
Total 82.4 (6.7)
82.2 (6.7)
82.2 (7.1)
83.3 (7.0)
84.2 (6.8)
85.5 (6.6)
80.5 (7.0)
79.7 (7.0)
80.2 (6.9)
80.2 (6.9)
79.7 (7.0)
80.1 (7.7)
Note: Prior to 1999, the Mine Safety and Health Administration (MSHA) set the permissible exposure limit (PEL) for noise at 90 dBA as an 8-hour time-weighted average (TWA) with an exchange rate of 5 dB and a sound level range from 90 to at least 140 dBA. Beginning in 1999, synchronized with the requirements of Hearing Conservation Programs (HCPs) outlined by 30 CFR Part 62, MSHA set an action limit (AL) for noise at 85 dBA with an exchange rate of 5 dB and a new sound level range from 80 to 130 dBA.
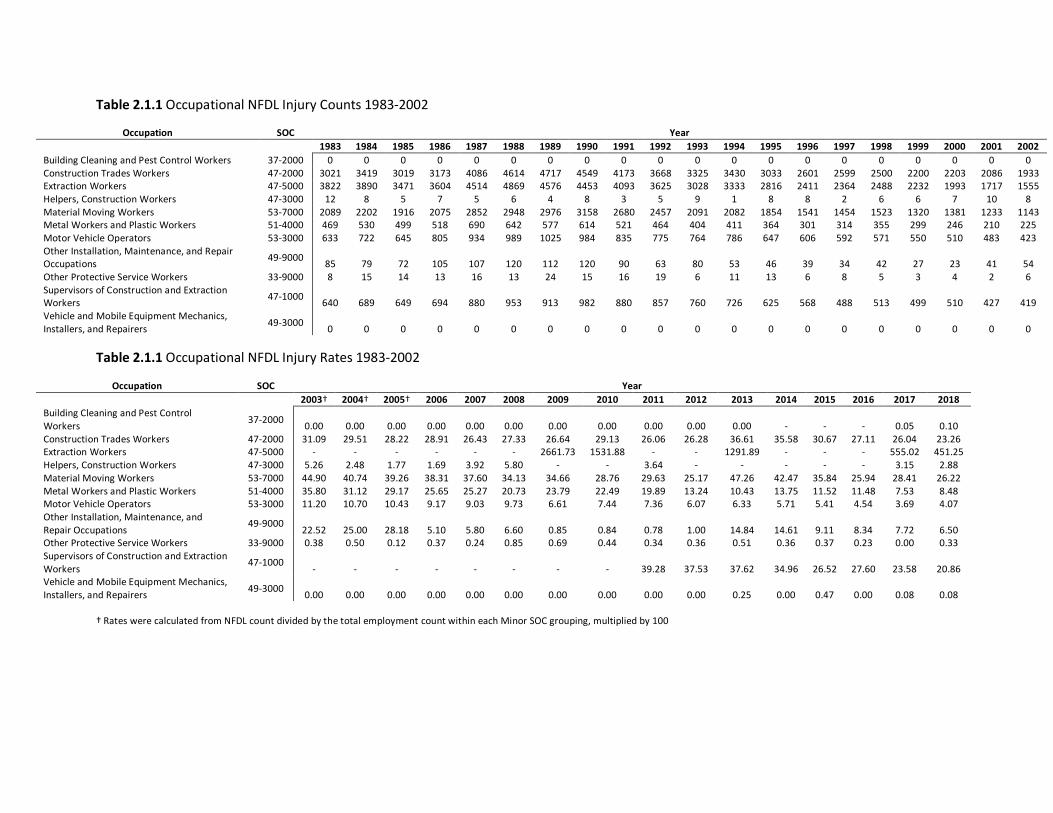
Table 2.1.1 Occupational NFDL Injury Counts 1983-2002
Occupation SOC Year 1983 1984 1985 1986 1987 1988 1989 1990 1991 1992 1993 1994 1995 1996 1997 1998 1999 2000 2001 2002 Building Cleaning and Pest Control Workers 37-2000 0 0 0 0 0 0 0 0 0 0 0 0 0 0 0 0 0 0 0 0 Construction Trades Workers 47-2000 3021 3419 3019 3173 4086 4614 4717 4549 4173 3668 3325 3430 3033 2601 2599 2500 2200 2203 2086 1933 Extraction Workers 47-5000 3822 3890 3471 3604 4514 4869 4576 4453 4093 3625 3028 3333 2816 2411 2364 2488 2232 1993 1717 1555 Helpers, Construction Workers 47-3000 12 8 5 7 5 6 4 8 3 5 9 1 8 8 2 6 6 7 10 8 Material Moving Workers 53-7000 2089 2202 1916 2075 2852 2948 2976 3158 2680 2457 2091 2082 1854 1541 1454 1523 1320 1381 1233 1143 Metal Workers and Plastic Workers 51-4000 469 530 499 518 690 642 577 614 521 464 404 411 364 301 314 355 299 246 210 225 Motor Vehicle Operators 53-3000 633 722 645 805 934 989 1025 984 835 775 764 786 647 606 592 571 550 510 483 423 Other Installation, Maintenance, and Repair Occupations 49-9000 85 79 72 105 107 120 112 120 90 63 80 53 46 39 34 42 27 23 41 54 Other Protective Service Workers 33-9000 8 15 14 13 16 13 24 15 16 19 6 11 13 6 8 5 3 4 2 6 Supervisors of Construction and Extraction Workers 47-1000 640 689 649 694 880 953 913 982 880 857 760 726 625 568 488 513 499 510 427 419 Vehicle and Mobile Equipment Mechanics, Installers, and Repairers 49-3000 0 0 0 0 0 0 0 0 0 0 0 0 0 0 0 0 0 0 0 0
Table 2.1.1 Occupational NFDL Injury Rates 1983-2002
Occupation SOC Year 2003† 2004† 2005† 2006 2007 2008 2009 2010 2011 2012 2013 2014 2015 2016 2017 2018 Building Cleaning and Pest Control Workers 37-2000 0.00 0.00 0.00 0.00 0.00 0.00 0.00 0.00 0.00 0.00 0.00 - - - 0.05 0.10 Construction Trades Workers 47-2000 31.09 29.51 28.22 28.91 26.43 27.33 26.64 29.13 26.06 26.28 36.61 35.58 30.67 27.11 26.04 23.26 Extraction Workers 47-5000 - - - - - - 2661.73 1531.88 - - 1291.89 - - - 555.02 451.25 Helpers, Construction Workers 47-3000 5.26 2.48 1.77 1.69 3.92 5.80 - - 3.64 - - - - - 3.15 2.88 Material Moving Workers 53-7000 44.90 40.74 39.26 38.31 37.60 34.13 34.66 28.76 29.63 25.17 47.26 42.47 35.84 25.94 28.41 26.22 Metal Workers and Plastic Workers 51-4000 35.80 31.12 29.17 25.65 25.27 20.73 23.79 22.49 19.89 13.24 10.43 13.75 11.52 11.48 7.53 8.48 Motor Vehicle Operators 53-3000 11.20 10.70 10.43 9.17 9.03 9.73 6.61 7.44 7.36 6.07 6.33 5.71 5.41 4.54 3.69 4.07 Other Installation, Maintenance, and Repair Occupations 49-9000 22.52 25.00 28.18 5.10 5.80 6.60 0.85 0.84 0.78 1.00 14.84 14.61 9.11 8.34 7.72 6.50 Other Protective Service Workers 33-9000 0.38 0.50 0.12 0.37 0.24 0.85 0.69 0.44 0.34 0.36 0.51 0.36 0.37 0.23 0.00 0.33 Supervisors of Construction and Extraction Workers 47-1000 - - - - - - - - 39.28 37.53 37.62 34.96 26.52 27.60 23.58 20.86 Vehicle and Mobile Equipment Mechanics, Installers, and Repairers 49-3000 0.00 0.00 0.00 0.00 0.00 0.00 0.00 0.00 0.00 0.00 0.25 0.00 0.47 0.00 0.08 0.08
† Rates were calculated from NFDL count divided by the total employment count within each Minor SOC grouping, multiplied by 100

Table 2.2.1 Occupational Fatality Counts 1983-2002 Occupation SOC Year
1983 1984 1985 1986 1987 1988 1989 1990 1991 1992 1993 1994 1995 1996 1997 1998 1999 2000 2001 2002 Construction Trades Workers 47-2000 27 36 18 25 23 19 18 26 15 13 11 14 19 11 10 8 15 11 12 11 Extraction Workers 47-5000 22 55 28 31 27 19 37 26 21 25 20 21 16 16 10 17 21 14 20 8 Helpers, Construction Workers 47-3000 0 0 0 0 0 0 0 0 0 0 0 0 0 0 0 0 0 0 0 0 Material Moving Workers 53-7000 24 22 16 22 19 9 6 14 17 10 9 9 14 14 6 5 7 13 6 11 Metal Workers and Plastic Workers 51-4000 2 0 0 2 3 0 1 3 3 2 1 2 1 2 3 1 0 0 0 2 Motor Vehicle Operators 53-3000 7 16 4 12 7 8 10 9 9 5 5 5 7 4 8 3 5 5 1 5 Other Installation, Maintenance, and Repair Occupations 49-9000 0 0 0 0 0 0 0 0 1 0 0 0 0 1 0 0 0 1 0 0 Other Protective Service Workers 33-9000 0 0 3 1 1 1 1 0 1 0 0 1 0 0 0 0 0 0 0 0 Supervisors of Construction and Extraction Workers 47-1000 18 31 18 21 17 10 14 12 14 7 15 5 5 8 9 11 9 8 7 5
Table 2.2.2 Occupational Fatlity Rates 2003-2018
Occupation SOC Year 2003† 2004† 2005† 2006 2007 2008 2009 2010 2011 2012 2013 2014 2015 2016 2017 2018 Construction Trades Workers 47-2000 0.13 0.17 0.24 0.18 0.11 0.11 0.07 0.16 0.13 0.20 0.15 0.15 0.15 0.09 0.11 0.07 Extraction Workers 47-5000 - - - - - - 7.41 34.78 - - 14.86 - - - 4.82 2.85 Helpers, Construction Workers 47-3000 0.00 0.00 0.00 0.00 0.00 0.97 0.00 0.00 0.00 0.00 0.00 0.00 0.00 0.00 0.00 0.00 Material Moving Workers 53-7000 0.26 0.08 0.25 0.42 0.39 0.22 0.20 0.30 0.19 0.13 0.36 0.26 0.04 0.21 0.08 0.19 Metal Workers and Plastic Workers
51-4000 0.19 0.00 0.35 0.17 0.00 0.16 0.00 0.00 0.00 0.00 0.00 0.00 0.00 0.00 0.00 0.00
Motor Vehicle Operators 53-3000 0.11 0.08 0.11 0.05 0.10 0.08 0.08 0.09 0.00 0.08 0.05 0.13 0.07 0.05 0.09 0.07 Other Installation, Maintenance, and Repair Occupations 49-9000 0.00 0.00 0.00 0.00 0.00 0.00 0.00 0.00 0.00 0.00 0.08 0.00 0.00 0.00 0.00 0.11 Other Protective Service Workers 33-9000 0.00 0.00 0.00 0.00 0.00 0.00 0.00 0.00 0.00 0.00 0.00 0.00 0.00 0.00 0.00 0.00 Supervisors of Construction and Extraction Workers 47-1000 - - - - - - - - 0.30 1.18 1.04 0.80 0.52 0.41 0.43 0.58
†Rates were calculated from fatality count divided by the total employment count within each Minor SOC grouping, multiplied by 100

Table 2.3.1 Occupational Noise Measurements 1983-2002
Occupation SOC Year 1983 1984 1985 1986 1987 1988 1989 1990 1991 1992 1993 1994 1995 1996 1997 1998 1999 2000 2001 2002 Building Cleaning and Pest Control Workers 37-2000 - 76.2
(16.3) 80.0 79.1 (6.2)
87.2 (8.1) 88.3 64.4 76.6 82.2
(9.8) 81.4 (9.4) - 68.9
(5.3) 83.3 (3.2)
82.5 (7.8)
62.8 (2.0) - 90.7 - 94.6 -
Construction Trades Workers 47-2000 84.5 (7.4)
81.0 (10.1)
79.8 (8.5)
79.8 (8.6)
80.4 (7.6)
81.2 (7.1)
81.8 (7.0)
82.0 (6.2)
80.3 (7.7)
82.0 (8.1)
83.4 (8.2)
81.5 (8.2)
80.1 (7.2)
79.9 (7.2)
79.0 (8.1)
82.0 (8.4)
87.9 (1.1)
82.1 (7.1)
81.8 (5.3)
81.4 (7.2)
Extraction Workers 47-5000 86.4 (7.9)
86.2 (8.1)
86.0 (7.8)
86.1 (7.7)
86.4 (7.4)
86.0 (7.1)
85.8 (7.2)
85.7 (7.3)
84.8 (8.0)
84.9 (7.9)
84.8 (7.9)
84.3 (8.0)
83.6 (8.1)
83.1 (8.2)
82.8 (8.4)
84.7 (8.2)
87.7 (6.5)
84.6 (7.0)
83.5 (7.0)
83.2 (6.8)
Helpers, Construction Workers 47-3000 77.6 - - 95.9 83.0 (0.6) 97.2 - 83.6
(5.2) 83.7 (5.9)
70.6 (2.9) - 85.2 80.4
(9.9) 82.0 (3.0)
71.2 (17.7) 72.3 - 82.4
(3.7) - -
Material Moving Workers 53-7000 84.7 (7.8)
83.6 (8.4)
83.6 (8.5)
82.1 (8.8)
81.5 (9.0)
82.7 (8.8)
81.8 (8.2)
81.9 (8.1)
81.4 (8.7)
81.8 (8.3)
80.9 (8.4)
81.5 (8.0)
79.9 (8.1)
80.8 (9.3)
80.9 (8.5)
79.9 (9.3)
84.1 (4.9)
85.3 (6.5)
84.0 (6.8)
83.8 (7.1)
Metal Workers and Plastic Workers 51-4000 80.3
(9.8) 80.1 (8.9)
80.6 (8.4)
79.8 (8.5)
81.0 (7.8)
81.0 (7.2)
80.0 (8.0)
82.0 (8.2)
80.2 (7.6)
79.8 (8.0)
79.5 (8.1)
80.5 (7.7)
78.7 (8.0)
79.5 (6.5)
80.8 (7.3)
80.0 (7.6)
88.1 (0.2)
82.1 (6.5)
82.4 (6.0)
83.3 (3.8)
Motor Vehicle Operators 53-3000 85.5 (6.0)
84.7 (6.7)
84.5 (6.6)
84.6 (7.1)
84.7 (6.9)
84.4 (6.6)
84.2 (6.9)
84.3 (6.9)
83.7 (7.1)
83.7 (7.3)
83.5 (7.1)
83.4 (7.3)
82.9 (7.4)
82.6 (7.5)
82.5 (7.7)
82.5 (7.9)
80.2 (0.9)
85.0 (6.2)
83.6 (6.1)
83.6 (6.1)
Other Installation, Maintenance, and Repair Occupations
49-9000 85.0 (6.5)
85.1 (7.0)
84.2 (7.5)
85.3 (7.3)
85.5 (8.4)
85.0 (6.7)
85.3 (7.1)
85.3 (7.3)
83.8 (7.8)
82.9 (7.6)
83.7 (7.8)
83.2 (7.4) 71 83.4
(7.3) 82.4 (8.4)
84.1 (8.8)
81.6 (7.3)
85.0 (6.0)
84.1 (6.5)
84.4 (6.6)
Other Protective Service Workers 33-9000 - - - 77.2
(6.4) 90.0 - - - - - 68.1 (8.8)
79.8 (18.3) - - - 81.4
(7.3) - - - -
Supervisors of Construction and Extraction Workers 47-1000 81.8
(7.5) 79.8 (8.1)
80.6 (7.6)
82.3 (8.4)
82.3 (7.6)
81.9 (8.4)
81.8 (7.6)
81.4 (8.4)
79.3 (8.9)
80.9 (8.4)
80.2 (8.1)
79.3 (8.2)
78.8 (7.8)
77.9 (8.1)
77.2 (7.9)
78.5 (8.1)
83.2 (2.6)
80.9 (6.4)
80.6 (7.2)
79.7 (6.7)
Vehicle and Mobile Equipment Mechanics, Installers, and Repairers
49-3000 81.0 (7.2)
81.7 (7.5)
81.0 (8.4)
81.0 (8.4)
80.9 (8.0)
80.8 (7.6)
81.5 (7.6)
81.4 (7.5)
80.1 (8.3)
82.0 (7.0)
81.5 (7.9)
80.0 (7.5)
80.2 (7.9)
79.6 (7.3)
79.8 (7.8)
80.4 (7.7) 87.9 83.2
(7.0) 82.1 (6.5)
81.0 (5.9)
Note: Prior to 1999, the Mine Safety and Health Administration (MSHA) set the permissible exposure limit (PEL) for noise at 90 dBA as an 8-hour time-weighted average (TWA) with an exchange rate of 5 dB and a sound level range from 90 to at least 140 dBA. Beginning in 1999, synchronized with the requirements of Hearing Conservation Programs (HCPs) outlined by 30 CFR Part 62, MSHA set an action limit (AL) for noise at 85 dBA with an exchange rate of 5 dB and a new sound level range from 80 to 130 dBA.

Table 2.3.2 Occupational Noise Measurements 2003-2014 Occupation SOC
2003 2004 2005 2006 2007 2008 2009 2010 2011 2012 2013 2014
Building Cleaning and Pest Control Workers 37-2000 - - 79.6 (18.0) - - 84.8 - - 73.7 81.3 88.3 -
Construction Trades Workers 47-2000 80.9 (6.4)
82.4 (4.8)
81.3 (7.1)
83.6 (5.2)
80.3 (6.1)
84.6 (6.0)
80.8 (6.0)
80.6 (7.0)
80.8 (6.9)
81.4 (6.9)
80.0 (6.8)
80.4 (8.6)
Extraction Workers 47-5000 82.4 (6.9)
82.3 (6.8)
82.4 (7.3)
83.6 (7.2)
84.5 (7.1)
85.9 (6.9)
80.5 (7.1)
79.9 (7.2)
80.4 (7.1)
80.3 (7.2)
80.0 (7.2)
80.6 (7.8)
Helpers, Construction Workers 47-3000 - 75.3 (8.0)
81.2 (3.9) - - 91 79.2 - 71.6
(12.1) - 60.5 -
Material Moving Workers 53-7000 83.3 (7.0)
84.6 (6.8)
84.2 (7.0)
84.0 (7.3)
84.6 (8.0)
86.6 (5.4)
82.7 (7.3)
80.4 (6.7)
83.0 (7.5)
82.2 (7.5)
81.1 (6.9)
78.9 (8.0)
Metal Workers and Plastic Workers 51-4000 83.0 (7.5)
81.9 (6.4)
82.4 (6.3)
83.2 (6.3)
83.5 (5.8)
84.6 (6.0)
81.9 (5.6)
80.7 (6.2)
79.1 (5.8)
80.0 (5.1)
78.5 (5.8)
83.6 (6.1)
Motor Vehicle Operators 53-3000 82.9 (6.2)
82.3 (5.9)
82.8 (6.8)
83.9 (7.0)
85.0 (6.3)
86.2 (5.8)
81.2 (6.6)
80.4 (6.6)
80.1 (6.4)
80.2 (6.1)
79.9 (6.4)
80.1 (7.0)
Other Installation, Maintenance, and Repair Occupations 49-9000 84.0
(6.1) 83.8 (5.9)
83.6 (6.1)
84.4 (6.2)
85.5 (5.2)
85.8 (5.3)
82.9 (5.8)
81.9 (6.0)
82.1 (6.3)
82.0 (5.9)
81.4 (6.2)
82.5 (5.8)
Other Protective Service Workers 33-9000 - - - - - - - - - - - -
Supervisors of Construction and Extraction Workers 47-1000 80.8 (6.9)
79.2 (6.3)
79.2 (6.2)
79.0 (6.6)
81.0 (6.5)
82.5 (6.8)
77.6 (6.9)
77.7 (6.8)
78.7 (7.2)
77.6 (7.0)
76.5 (7.6)
77.1 (7.1)
Vehicle and Mobile Equipment Mechanics, Installers, and Repairers 49-3000 80.9
(5.7) 81.2 (6.3)
80.5 (6.5)
81.1 (6.2)
82.7 (5.0)
84.8 (5.2)
79.6 (6.4)
78.9 (6.6)
79.1 (6.8)
79.9 (6.2)
79.1 (6.7)
80.0 (5.6)
Note: Prior to 1999, the Mine Safety and Health Administration (MSHA) set the permissible exposure limit (PEL) for noise at 90 dBA as an 8-hour time-weighted average (TWA) with an exchange rate of 5 dB and a sound level range from 90 to at least 140 dBA. Beginning in 1999, synchronized with the requirements of Hearing Conservation Programs (HCPs) outlined by 30 CFR Part 62, MSHA set an action limit (AL) for noise at 85 dBA with an exchange rate of 5 dB and a new sound level range from 80 to 130 dBA.
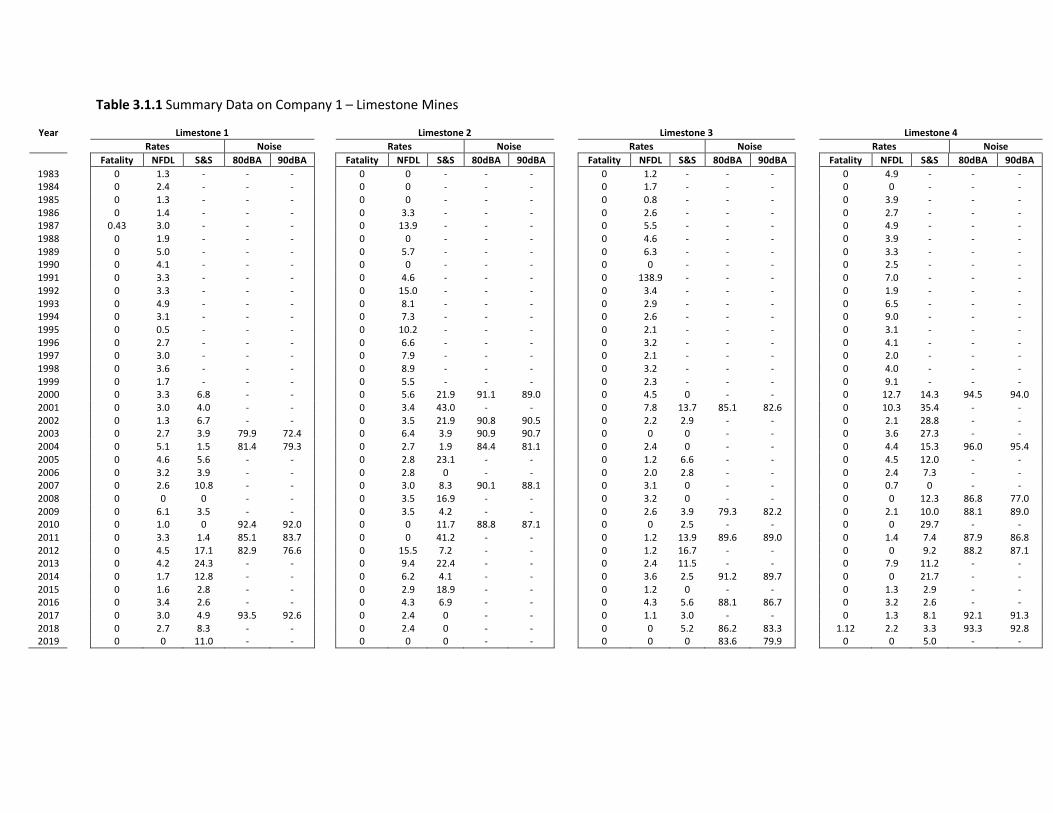
Table 3.1.1 Summary Data on Company 1 – Limestone Mines
Year Limestone 1 Limestone 2 Limestone 3 Limestone 4 Rates Noise Rates Noise Rates Noise Rates Noise Fatality NFDL S&S 80dBA 90dBA Fatality NFDL S&S 80dBA 90dBA Fatality NFDL S&S 80dBA 90dBA Fatality NFDL S&S 80dBA 90dBA
1983 0 1.3 - - - 0 0 - - - 0 1.2 - - - 0 4.9 - - - 1984 0 2.4 - - - 0 0 - - - 0 1.7 - - - 0 0 - - - 1985 0 1.3 - - - 0 0 - - - 0 0.8 - - - 0 3.9 - - - 1986 0 1.4 - - - 0 3.3 - - - 0 2.6 - - - 0 2.7 - - - 1987 0.43 3.0 - - - 0 13.9 - - - 0 5.5 - - - 0 4.9 - - - 1988 0 1.9 - - - 0 0 - - - 0 4.6 - - - 0 3.9 - - - 1989 0 5.0 - - - 0 5.7 - - - 0 6.3 - - - 0 3.3 - - - 1990 0 4.1 - - - 0 0 - - - 0 0 - - - 0 2.5 - - - 1991 0 3.3 - - - 0 4.6 - - - 0 138.9 - - - 0 7.0 - - - 1992 0 3.3 - - - 0 15.0 - - - 0 3.4 - - - 0 1.9 - - - 1993 0 4.9 - - - 0 8.1 - - - 0 2.9 - - - 0 6.5 - - - 1994 0 3.1 - - - 0 7.3 - - - 0 2.6 - - - 0 9.0 - - - 1995 0 0.5 - - - 0 10.2 - - - 0 2.1 - - - 0 3.1 - - - 1996 0 2.7 - - - 0 6.6 - - - 0 3.2 - - - 0 4.1 - - - 1997 0 3.0 - - - 0 7.9 - - - 0 2.1 - - - 0 2.0 - - - 1998 0 3.6 - - - 0 8.9 - - - 0 3.2 - - - 0 4.0 - - - 1999 0 1.7 - - - 0 5.5 - - - 0 2.3 - - - 0 9.1 - - - 2000 0 3.3 6.8 - - 0 5.6 21.9 91.1 89.0 0 4.5 0 - - 0 12.7 14.3 94.5 94.0 2001 0 3.0 4.0 - - 0 3.4 43.0 - - 0 7.8 13.7 85.1 82.6 0 10.3 35.4 - - 2002 0 1.3 6.7 - - 0 3.5 21.9 90.8 90.5 0 2.2 2.9 - - 0 2.1 28.8 - - 2003 0 2.7 3.9 79.9 72.4 0 6.4 3.9 90.9 90.7 0 0 0 - - 0 3.6 27.3 - - 2004 0 5.1 1.5 81.4 79.3 0 2.7 1.9 84.4 81.1 0 2.4 0 - - 0 4.4 15.3 96.0 95.4 2005 0 4.6 5.6 - - 0 2.8 23.1 - - 0 1.2 6.6 - - 0 4.5 12.0 - - 2006 0 3.2 3.9 - - 0 2.8 0 - - 0 2.0 2.8 - - 0 2.4 7.3 - - 2007 0 2.6 10.8 - - 0 3.0 8.3 90.1 88.1 0 3.1 0 - - 0 0.7 0 - - 2008 0 0 0 - - 0 3.5 16.9 - - 0 3.2 0 - - 0 0 12.3 86.8 77.0 2009 0 6.1 3.5 - - 0 3.5 4.2 - - 0 2.6 3.9 79.3 82.2 0 2.1 10.0 88.1 89.0 2010 0 1.0 0 92.4 92.0 0 0 11.7 88.8 87.1 0 0 2.5 - - 0 0 29.7 - - 2011 0 3.3 1.4 85.1 83.7 0 0 41.2 - - 0 1.2 13.9 89.6 89.0 0 1.4 7.4 87.9 86.8 2012 0 4.5 17.1 82.9 76.6 0 15.5 7.2 - - 0 1.2 16.7 - - 0 0 9.2 88.2 87.1 2013 0 4.2 24.3 - - 0 9.4 22.4 - - 0 2.4 11.5 - - 0 7.9 11.2 - - 2014 0 1.7 12.8 - - 0 6.2 4.1 - - 0 3.6 2.5 91.2 89.7 0 0 21.7 - - 2015 0 1.6 2.8 - - 0 2.9 18.9 - - 0 1.2 0 - - 0 1.3 2.9 - - 2016 0 3.4 2.6 - - 0 4.3 6.9 - - 0 4.3 5.6 88.1 86.7 0 3.2 2.6 - - 2017 0 3.0 4.9 93.5 92.6 0 2.4 0 - - 0 1.1 3.0 - - 0 1.3 8.1 92.1 91.3 2018 0 2.7 8.3 - - 0 2.4 0 - - 0 0 5.2 86.2 83.3 1.12 2.2 3.3 93.3 92.8 2019 0 0 11.0 - - 0 0 0 - - 0 0 0 83.6 79.9 0 0 5.0 - -

Table 3.1.2 Summary Data on Company 1 – Lime Mines
Year Lime 1 Lime 2 Rates Noise Rates Noise Fatality NFDL S&S 80dBA 90dBA Fatality NFDL S&S 80dBA 90dBA
1983 0 0 0 - - 0 0 0 - - 1984 0 0 0 - - 0 0 0 - - 1985 0 0 0 - - 0 0 0 - - 1986 0 0 0 - - 0 0 0 - - 1987 0 0 0 - - 0 0 0 - - 1988 0 0 0 - - 0 0 0 - - 1989 0 0 0 - - 0 0 0 - - 1990 0 0 0 - - 0 0 0 - - 1991 0 0 0 - - 0 0 0 - - 1992 0 0 0 - - 0 0 0 - - 1993 0 0 0 - - 0 0 0 - - 1994 0 0 0 - - 0 0 0 - - 1995 0 0 0 - - 0 0 0 - - 1996 0 0 0 - - 0 0 0 - - 1997 0 0 0 - - 0 0 0 - - 1998 0 0 0 - - 0 0 0 - - 1999 0 0 0 - - 0 0 0 - - 2000 0 5.4 10.5 87.4 85.4 0 0 0 - - 2001 0 10.5 36.4 - - 0 0 5.0 83.7 79.5 2002 0 6.1 0 88.4 86.2 0 0 0 - - 2003 0 8.7 26.7 85.6 82.4 0 0 48.5 - - 2004 0 1.4 7.5 85.5 81.7 0 0 0 - - 2005 0 2.9 0 - - 0 0 10.2 83.0 79.9 2006 0 13.0 14.1 90.9 89.0 0 0 0 - - 2007 0 7.9 20.3 - - 0 0 0 - - 2008 0 3.2 6.9 90.0 88.3 0 0 0 - - 2009 0 0 4.4 88.3 87.0 0 0 0 - - 2010 0 1.7 12.8 89.6 87.8 0 0 24.1 88.8 84.8 2011 0 3.5 8.2 - - 0 0 3.5 - - 2012 0 0 5.4 - - 0 0 13.2 - - 2013 0 7.9 8.1 83.4 78.5 0 0 4.9 85.2 81.6 2014 0 1.9 10.5 80.7 77.1 0 0 0 - - 2015 0 5.7 12.9 85.9 83.6 0 0 3.7 83.5 80.6 2016 0 0 7.1 - - 0 0 2.7 81.8 79.0 2017 0 3.8 10.5 82.8 80.2 0 0 2.8 88.0 87.3 2018 0 1.8 2.9 81.9 78.1 0 0 0 - - 2019 0 0 6.4 81.4 77.1 0 0 9.4 85.6 83.4

Table 3.2.1 Summary Data on Company 2 – Sand Mines Year Sand 1 Sand 2 Sand 3 Sand 4
Rates Noise Rates Noise Rates Noise Rates Noise Fatality NFDL S&S 80dBA 90dBA Fatality NFDL S&S 80dBA 90dBA Fatality NFDL S&S 80dBA 90dBA Fatality NFDL S&S 80dBA 90dBA
1983 0 1.9 - - - 0 4.2 - - - 0 0 - - - 0 0 - - - 1984 0 7.1 - - - 0 3.0 - - - 2.73 0 - - - 0 38.6 - - - 1985 0 1.7 - - - 0 0 - - - 0 4.4 - - - 0 28.1 - - - 1986 0 0 - - - 0 2.2 - - - 0 0 - - - 0 0 - - - 1987 0 5.1 - - - 0 0 - - - 0 0 - - - 0 26.5 - - - 1988 0 1.8 - - - 0 6.1 - - - 0 3.0 - - - 0 0 - - - 1989 0 1.8 - - - 0 6.6 - - - 0 8.5 - - - 0 7.3 - - - 1990 0 1.8 - - - 0 9.3 - - - 0 3.0 - - - 0 11.4 - - - 1991 0 1.7 - - - 0 7.6 - - - 0 10.3 - - - 0 7.7 - - - 1992 0 3.4 - - - 0 5.2 - - - 0 6.4 - - - 0 25.6 - - - 1993 0 12.1 - - - 0 3.7 - - - 0 0 - - - 0 14.7 - - - 1994 0 0 - - - 0 6.7 - - - 0 9.1 - - - 0 0 - - - 1995 0 0 - - - 0 10.1 - - - 0 2.4 - - - 0 4.2 - - - 1996 0 1.7 - - - 0 1.5 - - - 0 8.7 - - - 0 0 - - - 1997 0 3.5 - - - 0 3.0 - - - 0 0 - - - 0 0 - - - 1998 0 6.2 - - - 0 2.9 - - - 0 4.4 - - - 0 0 - - - 1999 0 1.5 - - - 0 5.0 - - - 0 16.9 - - - 0 0 - - - 2000 0 2.9 6.1 83.5 78.1 0 1.7 15.4 84.9 80.1 0 4.7 5.4 85.6 84.1 0 22.2 0 81.3 79.5 2001 0 1.5 0 - - 0 8.7 26.9 - - 0 12.9 4.7 84.6 83.7 0 0 0 - - 2002 0 0 14.8 81.1 80.0 0 3.7 6.5 78.6 72.6 0 14.9 2.6 - - 0 24.1 0 82.1 79.3 2003 0 1.9 0 78.8 71.5 0 4.3 5.3 85.3 84.4 0 7.3 0 - - 0 0 0 - - 2004 0 3.7 5.9 83.1 80.4 0 1.8 8.8 - - 0 0 0 84.3 82.8 0 0 0 84.5 83.1 2005 1.86 1.9 15.2 - - 0 1.4 10.8 - - 0 2.4 0 80.1 78.7 0 0 0 - - 2006 0 0 0 - - 0 0.9 4.0 - - 0 2.5 0 - - 0 0 0 - - 2007 0 1.4 17.4 - - 0 1.0 14.1 87.7 88.2 0 2.5 0 - - 0 0 0 - - 2008 0 1.2 14.4 90.6 89.1 0 3.1 18.2 - - 0 4.9 8.6 77.7 74.2 0 0 0 - - 2009 0 0 0 - - 0 2.4 24.2 - - 0 10.3 19.3 69.8 75.3 0 0 0 81.1 84.4 2010 0 1.8 18.9 84.7 82.4 0 3.4 14.2 79.9 75.4 0 6.3 69.2 85.1 82.0 0 28.0 0 79.6 78.2 2011 0 0 12.0 78.8 74.5 0 1.1 6.2 81.3 76.9 0 2.1 4.5 77.6 71.8 0 0 5.5 73.4 67.4 2012 0 0 10.5 83.3 79.5 0 0 20.4 79.3 74.7 0 6.3 4.4 78.6 74.3 0 0 0 - - 2013 0 0 10.5 80.0 75.8 0 1.7 1.9 79.1 76.1 0 2.1 10.2 78.7 82.4 0 0 0 75.8 69.5 2014 0 0 7.8 - - 0 1.6 14.1 81.3 76.7 0 0 0 80.5 74.7 0 0 0 - - 2015 0 4.2 0 80.1 75.7 0 0.8 8.0 78.3 70.2 0 0 0 - - 0 0 0 73.6 63.4 2016 0 2.2 5.0 80.2 72.6 0 1.2 45.4 - - 0 3.6 13.8 75.0 70.3 0 0 0 - - 2017 0 0 3.4 82.4 77.8 0 0.5 3.4 76.0 69.6 0 1.2 8.9 76.4 80.5 0 0 0 78.9 76.5 2018 0 0 39.7 81.4 76.7 0 1.7 9.7 - - 0 2.2 4.0 - - 0 8.5 0 - - 2019 0 0 1.7 - - 0 0 22.8 84.2 81.5 0 0 2.1 - - 0 0 0 - -

Table 4.1 Bivariate Negative Binomial Analysis for NFDL Injuries Variable Dispersion IRR 95% CI AIC N LL UL SIC 1779 TWAMSHA 3.65 9200.5 < 70 dBA (ref) 1 - - 70 to < 75 dBA 2.10 1.06 4.21 75 to < 80 dBA 1.88 0.99 3.57 80 to < 85 dBA 1.82 0.97 3.45 85 to < 90 dBA 1.99 1.06 3.79 90 to < 95 dBA 2.00 1.05 3.89 95 to < 100 dBA 1.97 0.96 4.11 ≥ 100 dBA 2.56 1.10 6.09 Year 3.49 0.98 0.97 0.99 9114.8 SIC code* 1.37 * * * 9229.9 SOC (1983-2002) 173 TWAMSHA 567.47 105761.6 < 75 dBA (ref) 1 - - 75 to < 80 dBA 1.23 0.23 12.46 80 to < 85 dBA 6.39 1.41 60.64 85 to < 90 dBA 9.03 1.95 86.42 90 to < 95 dBA 1.53 0.22 17.58 95 to < 100 dBA 1.82 0.23 21.72 ≥ 100 dBA 0.07 - 17.29 Year 763.09 0.96 0.93 0.99 145228.84 Minor SOC code 6.85 2844.02 Construction Trade (ref) 1 - - Extraction 1.01 0.85 1.18 Helpers, Construction 0.00 0.00 0.00 Material Moving 0.63 0.54 0.74 Metal and Plastic 0.13 0.11 0.15 Motor Vehicle 0.22 0.18 0.26 Other Installers, Maintenance, and Repair 0.02 0.01 0.26 Other Protective Service 0.00 0.00 0.01
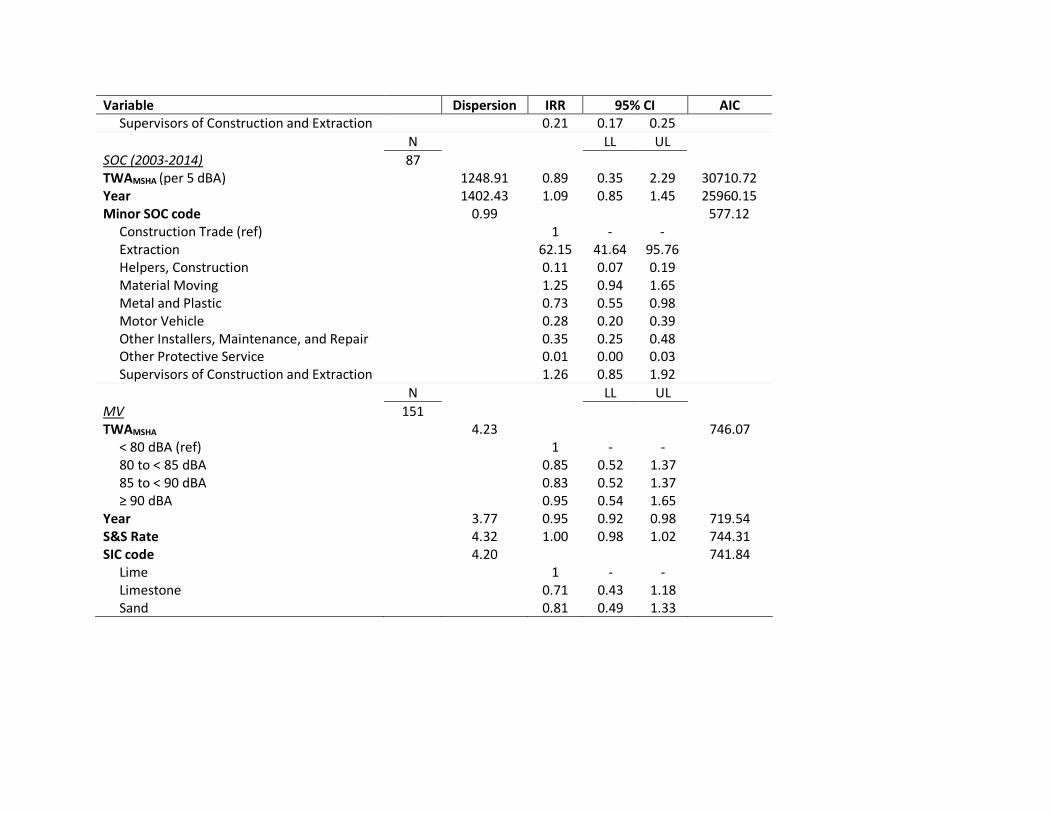
Variable Dispersion IRR 95% CI AIC Supervisors of Construction and Extraction 0.21 0.17 0.25 N LL UL SOC (2003-2014) 87 TWAMSHA (per 5 dBA) 1248.91 0.89 0.35 2.29 30710.72 Year 1402.43 1.09 0.85 1.45 25960.15 Minor SOC code 0.99 577.12 Construction Trade (ref) 1 - - Extraction 62.15 41.64 95.76 Helpers, Construction 0.11 0.07 0.19 Material Moving 1.25 0.94 1.65 Metal and Plastic 0.73 0.55 0.98 Motor Vehicle 0.28 0.20 0.39 Other Installers, Maintenance, and Repair 0.35 0.25 0.48 Other Protective Service 0.01 0.00 0.03 Supervisors of Construction and Extraction 1.26 0.85 1.92 N LL UL MV 151 TWAMSHA 4.23 746.07 < 80 dBA (ref) 1 - - 80 to < 85 dBA 0.85 0.52 1.37 85 to < 90 dBA 0.83 0.52 1.37 ≥ 90 dBA 0.95 0.54 1.65 Year 3.77 0.95 0.92 0.98 719.54 S&S Rate 4.32 1.00 0.98 1.02 744.31 SIC code 4.20 741.84 Lime 1 - - Limestone 0.71 0.43 1.18 Sand 0.81 0.49 1.33

Table 4.1.1 Supplement to Table 4.1 SIC code IRR LL UL Alumina (Mill) 1.00 - - Aluminum Ore 1.14 0.81 1.61 Aplite 1.74 1.20 2.54 Asbestos 3.05 2.26 4.15 Barite 2.21 1.72 2.84 Beryl 1.00 0.72 1.39 Boron Materials 0.68 0.51 0.91 Cement 1.49 1.15 1.93 Chemical and fertilizer, NEC 2.23 1.61 3.13 Chromite 1.33 0.50 4.05 Clay (common) 0.98 0.75 1.27 Clay (fire) 1.80 1.39 2.32 Clay, Ceramic and refractory, NEC 1.85 1.43 2.40 Coal, Anthracite 4.18 3.25 5.39 Coal, Bituminous 2.20 1.70 2.85 Cobalt 16.06 8.89 32.30 Construction S&G; Sand, common 1.96 1.01 4.16 Copper Ore 0.82 0.63 1.08 Feldspar 1.44 1.11 1.87 Fluorspar 1.93 1.38 2.71 Gemstones 2.69 2.02 3.59 Gilsonite 2.86 2.17 3.77 Gold (lode and placer) 1.09 0.84 1.41 Granite (crushed and broken) 1.25 0.96 1.62 Granite (dimension) 4.18 3.26 5.35 Gypsum 0.90 0.69 1.18 Iron ore 1.14 0.88 1.48 Kyanite 1.69 1.30 2.21 Lead and/or Zinc Ore 1.27 0.98 1.65

SIC code IRR LL UL Leonardite 4.84 3.73 6.30 Lime 1.60 1.24 2.07 Limestone (crushed and broken) 1.70 1.32 2.19 Limestone (dimension) 3.17 2.47 4.07 Lithium 0.81 0.56 1.19 Magnesite 2.37 1.75 3.23 Manganese 2.67 2.05 3.47 Marble (crushed & broken) 1.12 0.86 1.46 Marble (dimension) 3.74 2.92 4.80 Mercury 1.34 0.51 4.10 Metal ores, NEC 1.96 1.45 2.67 Mica 1.44 1.10 1.89 Molybdenum 1.09 0.84 1.42 Nickel 3.16 1.96 5.31 Nonmetallic minerals, NEC 2.27 1.76 2.92 Oil sand 13.25 7.31 26.69 Oil shale 1.56 1.09 2.26 Perlite 2.58 2.01 3.32 Phosphate rock 0.66 0.50 0.87 Pigment mineral 2.33 1.71 3.17 Platinum group 2.25 1.73 2.93 Potash 1.06 0.80 1.40 Potash, soda, & borate minerals, NEC 2.73 1.76 4.38 Pumice 3.61 2.81 4.64 Pyrites 5.86 2.59 16.45 Rare earths 1.44 1.06 1.98 Salt (evaporated) 1.70 1.24 2.36 Salt (rock) 1.10 0.84 1.43 Sand & gravel 2.79 2.17 3.58 Sand, Industrial; Ground silica/quartz 1.12 0.54 2.47

SIC code IRR LL UL Sandstone (crushed & broken) 1.84 1.43 2.37 Sandstone (dimension) 3.87 3.02 4.96 Shale (common) 2.34 1.82 3.01 Silver ores 1.81 1.40 2.34 Slate (crushed & broken) 3.41 2.63 4.43 Slate (dimension) 3.21 2.50 4.11 Stone, crushed & broken, NEC 2.93 2.28 3.75 Stone, dimension, NEC 3.96 3.10 5.07 Talc, soapstone, & pyrophylite 1.47 1.17 1.84 Titanium 0.77 0.56 1.06 Traprock (crushed & broken) 1.70 1.32 2.19 Traprock (dimension) 2.01 1.50 2.70 Trona 1.14 0.87 1.49 Tungsten 2.80 1.63 5.10 Uranium 1.82 1.39 2.38 Uranium - vanadium ores 4.05 2.97 5.57 Vanadium 1.07 0.71 1.63 Vermiculite 1.33 1.01 1.74 Zircon 2.70 1.89 3.91
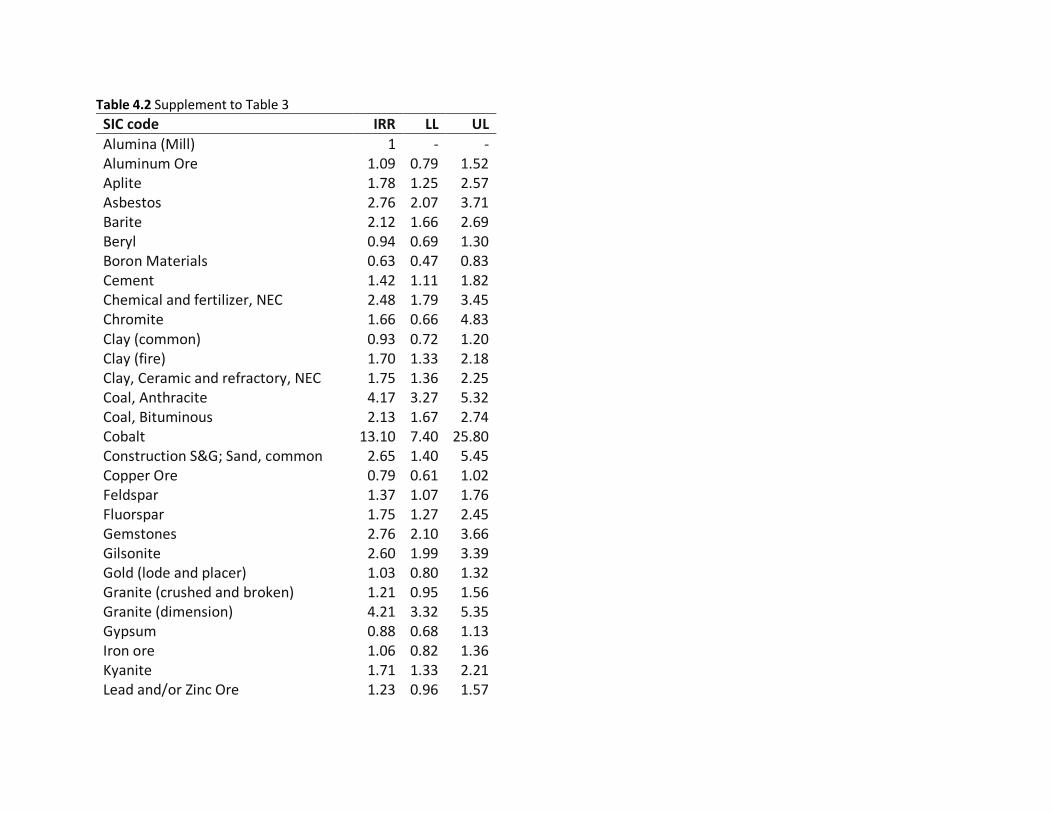
Table 4.2 Supplement to Table 3 SIC code IRR LL UL Alumina (Mill) 1 - - Aluminum Ore 1.09 0.79 1.52 Aplite 1.78 1.25 2.57 Asbestos 2.76 2.07 3.71 Barite 2.12 1.66 2.69 Beryl 0.94 0.69 1.30 Boron Materials 0.63 0.47 0.83 Cement 1.42 1.11 1.82 Chemical and fertilizer, NEC 2.48 1.79 3.45 Chromite 1.66 0.66 4.83 Clay (common) 0.93 0.72 1.20 Clay (fire) 1.70 1.33 2.18 Clay, Ceramic and refractory, NEC 1.75 1.36 2.25 Coal, Anthracite 4.17 3.27 5.32 Coal, Bituminous 2.13 1.67 2.74 Cobalt 13.10 7.40 25.80 Construction S&G; Sand, common 2.65 1.40 5.45 Copper Ore 0.79 0.61 1.02 Feldspar 1.37 1.07 1.76 Fluorspar 1.75 1.27 2.45 Gemstones 2.76 2.10 3.66 Gilsonite 2.60 1.99 3.39 Gold (lode and placer) 1.03 0.80 1.32 Granite (crushed and broken) 1.21 0.95 1.56 Granite (dimension) 4.21 3.32 5.35 Gypsum 0.88 0.68 1.13 Iron ore 1.06 0.82 1.36 Kyanite 1.71 1.33 2.21 Lead and/or Zinc Ore 1.23 0.96 1.57
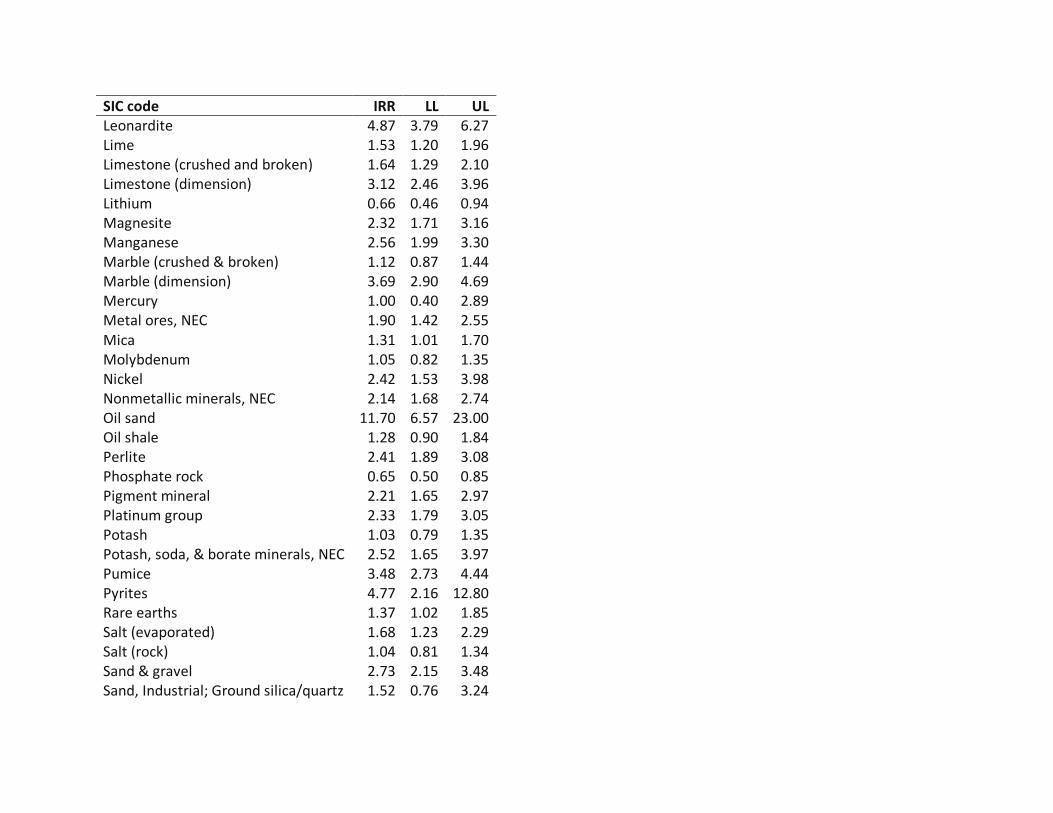
SIC code IRR LL UL Leonardite 4.87 3.79 6.27 Lime 1.53 1.20 1.96 Limestone (crushed and broken) 1.64 1.29 2.10 Limestone (dimension) 3.12 2.46 3.96 Lithium 0.66 0.46 0.94 Magnesite 2.32 1.71 3.16 Manganese 2.56 1.99 3.30 Marble (crushed & broken) 1.12 0.87 1.44 Marble (dimension) 3.69 2.90 4.69 Mercury 1.00 0.40 2.89 Metal ores, NEC 1.90 1.42 2.55 Mica 1.31 1.01 1.70 Molybdenum 1.05 0.82 1.35 Nickel 2.42 1.53 3.98 Nonmetallic minerals, NEC 2.14 1.68 2.74 Oil sand 11.70 6.57 23.00 Oil shale 1.28 0.90 1.84 Perlite 2.41 1.89 3.08 Phosphate rock 0.65 0.50 0.85 Pigment mineral 2.21 1.65 2.97 Platinum group 2.33 1.79 3.05 Potash 1.03 0.79 1.35 Potash, soda, & borate minerals, NEC 2.52 1.65 3.97 Pumice 3.48 2.73 4.44 Pyrites 4.77 2.16 12.80 Rare earths 1.37 1.02 1.85 Salt (evaporated) 1.68 1.23 2.29 Salt (rock) 1.04 0.81 1.34 Sand & gravel 2.73 2.15 3.48 Sand, Industrial; Ground silica/quartz 1.52 0.76 3.24
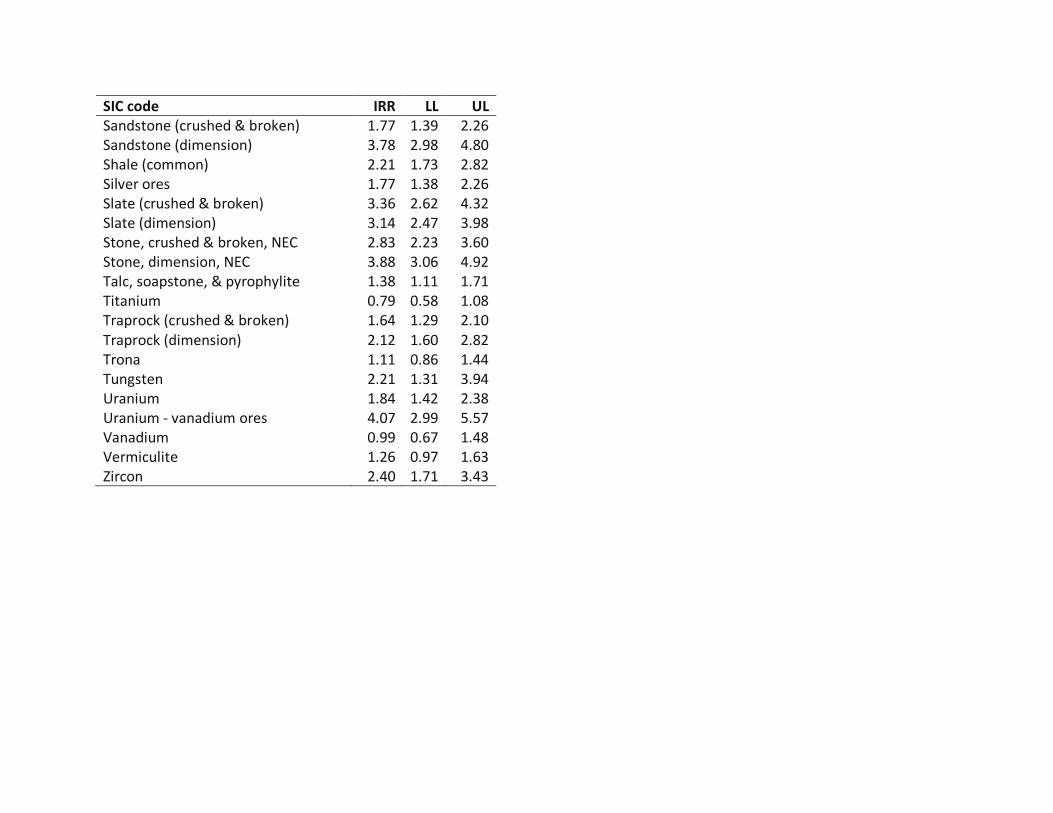
SIC code IRR LL UL Sandstone (crushed & broken) 1.77 1.39 2.26 Sandstone (dimension) 3.78 2.98 4.80 Shale (common) 2.21 1.73 2.82 Silver ores 1.77 1.38 2.26 Slate (crushed & broken) 3.36 2.62 4.32 Slate (dimension) 3.14 2.47 3.98 Stone, crushed & broken, NEC 2.83 2.23 3.60 Stone, dimension, NEC 3.88 3.06 4.92 Talc, soapstone, & pyrophylite 1.38 1.11 1.71 Titanium 0.79 0.58 1.08 Traprock (crushed & broken) 1.64 1.29 2.10 Traprock (dimension) 2.12 1.60 2.82 Trona 1.11 0.86 1.44 Tungsten 2.21 1.31 3.94 Uranium 1.84 1.42 2.38 Uranium - vanadium ores 4.07 2.99 5.57 Vanadium 0.99 0.67 1.48 Vermiculite 1.26 0.97 1.63 Zircon 2.40 1.71 3.43

Table 4.3 Bivariate Logistic Regression Analysis of Fatalities Variable OR 95% CI AIC N LL UL SIC 1826 TWAMSHA (per 5 dBA) 1.14 1.01 1.30 1990.19 Year 0.98 0.97 0.99 1986.22 Mine Type 1927.93 Coal 1 - - Metal 0.13 0.06 0.24 Nonmetal 0.09 0.05 0.17 SOC 260 TWAMSHA (per 5 dBA) 1.47 1.09 1.99 328.45 Year 0.97 0.94 1.00 332.27 Major SOC code* 232.39 Protective Service (33-0000) (ref) 1 - - Construction and Extraction (47-0000) 9.18 3.42 27.81 Installation, Maintenance, and Repair (49-0000) 0.39 0.08 1.55 Production (51-0000) 3.40 1.10 11.48 Transportation and Material Moving (53-0000) 181.33 29.88 3575.2
* Among fatalities, minor SOC codes did not converge, so the occupations were converted to major SOC instead