almacenes Éxito s.a. - grupoexito.com.co · 3 of net revenues. excluding the non-recurring tax...
TRANSCRIPT
1
Almacenes Éxito S.A.
For the Second Quarter and Six-month period ended June 30, 2017
Envigado, Colombia, August 14, 2017 Almacenes Éxito S.A. (“Éxito” or “the Company” – BVC, Colombian Stock Exchange: ÉXITO; ADR Program: ALAXL), announces its results for the period ended June 30, 2017. All figures are expressed in COP – Colombian Pesos. All comparisons are with the same period last year, except when stated otherwise. Via Varejo S.A., treated as a discontinued operation in the quarterly financial statements of GPA as of June 30, 2017, due to the its ongoing divestment process as announced in the material fact notice of November 23, 2016, with a retrospective adjustment of net sales and other profit or loss accounts, as required under IFRS 5/CPC 31 and approved by CVM Resolution 598/09 – Sale of non-current assets and discontinued operations.
Strong contribution from GPA positively influenced consolidated results
KEY BUSINESS HIGHLIGHTS
Operating Highlights
Strong contribution from GPA positively influenced consolidated results and Net Income recovery, ratifying the strategic
decision of the investment diversification within the region.
Total market share gains in the food business in Brazil, Uruguay and Argentina, and SSS market gain in Colombia.
Synergy plan continues capturing value and advances beyond initial expectations.
Consolidated Group Capital Expenditures was COP$400,000 million.
Financial Highlights
Net Sales totalled COP$13.3 billion driven by the mid-teens growth in Uruguay and Brazil.
Recurring Ebitda grew 52.2% to COP$1,058,910 million for an 8.0% margin (1).
Recurring Operating Income reached COP$813,528 million with a margin of 6.1%
Net Income Group Share was COP$69,263 million mainly driven strong operational performance of Brazil and better
financial result.
Outlook
LatAm synergy outlook exceeding USD$50 million.
Mid-term economic recovery expected in Colombia, Brazil and Argentina.
Focus on cost and expense control activities.
High potential from store conversions and renovations of premium store.
(1) Excluding non-recurring tax credits of GPA, the Recurring EBITDA would have been COP$648,091 M for a 5.0% EBITDA margin in Colombian pesos.
“The consolidated results for the 2Q17 confirmed the importance of Grupo Éxito´s internationalization strategy in Latin
America. The positive consolidated performance reflected the diversification of revenues and margins derived from the
growth of the Assaí and Extra brands in Brazil; Uruguay's healthy profitability margin; the strong contribution of the real
estate business in Argentina and the implementation of innovative strategies in Colombia that allow us a resilient result,
despite the low dynamism of the local market”. Carlos Mario Giraldo - CEO Grupo Éxito
Consolidated Financial Results 2Q17

2
Consolidated Income Statement
Note: 2Q16 results include the effects of the restatement of Companhia Brasileira de Distribuição –CBD results arising from the adjustment booked by such subsidiary regarding
the investigation on Cnova N.V. and the effect of the adjustments from the completion of the Purchase Price Allocation process relevant to the acquisition of control of Companhia
Brasileira de Distribuição -CBD, pursuant to IFRS 3 -Business combinations. Quarterly data for 2016 and 2017 do not include Via Varejo S.A and Cnova N.V. operations.
Consolidated Net Revenues grew by 11.8% in 2Q17 and by 12.4% in 1H17, driven by the strong consolidated Net Sales
performance in both periods derived by the mid-teens growth in Uruguay and Brazil. It is glad to see that our investment in
Brazil is contributing strongly to the consolidated performance of Grupo Éxito and ratifies the accuracy of the investment
diversification within the region.
The lower contribution of the food category to sales (57.3% of the mix vs 59.6% in 2Q16) reflected an inflation deceleration
trend in the region while the non-food benefitted by the performance of entertainment and the textile categories. The textile
model continued showing the effectiveness of the business model implementation across the region.
Other Operating Revenues were also a strong contributor with a double-digit grow driven mainly by the performance of
contribution of complementary business, particularly real estate in both Colombia and Argentina and growth in Brazil.
Gross Profit grew by 18.9% and margin gained 160 bps to 26.9% and reflected mainly the strong performance of our
operation in Brazil and the contribution of non-recurring tax credits. Nevertheless, excluding this non-recurring tax
credits effect, Gross Profit in 2Q17 would have grown by 14.4% to a margin of 24.2% (+ 60 basis points versus margin
also adjusted in the base of 2Q16). In 1H17 gross profit grew by 90 basis points and margin reached 25.4% as percentage
2Q17 2Q16 1H17 1H16
In COP M In COP M 2Q17/16 In COP M In COP M 1H17/16
Net Revenues 13,267,721 11,865,074 11.8% 26,793,634 23,845,589 12.4%
Gross Profit 3,569,347 3,003,042 18.9% 6,807,294 5,831,635 16.7%
Gross Margin 26.9% 25.3% 25.4% 24.5%
SG&A expenses -2,755,819 -2,529,062 9.0% -5,568,507 -5,014,584 11.0%
SG&A/Net Revenues -20.8% -21.3% -20.8% -21.0%
Recurring Operating Income 813,528 473,980 71.6% 1,238,787 817,051 51.6%
Recurring Operating margin 6.1% 4.0% 4.6% 3.4%
Operating Income (Ebit) 621,235 342,858 81.2% 1,041,608 600,433 73.5%
Operating margin 4.7% 2.9% 3.9% 2.5%
Net Income Group Share 69,263 -48,453 N/A 61,670 -47,693 N/A
Net margin 0.5% -0.4% 0.2% -0.2%
Recurring EBITDA 1,058,910 695,962 52.2% 1,733,115 1,237,801 40.0%
Recurring EBITDA margin 8.0% 5.9% 6.5% 5.2%
EBITDA 866,617 564,840 53.4% 1,535,936 1,021,183 50.4%
EBITDA margin 6.5% 4.8% 5.7% 4.3%
Gross Profit exc non-recurring tax credits 3,158,528 2,760,244 14.4% 6,396,475 5,588,837 14.5%
Gross Margin exc non-recurring tax credits 24.2% 23.6% 24.2% 23.8%
Recurring EBITDA exc non-recurring tax credits 648,091 453,164 43.0% 1,322,296 995,003 32.9%
Recurring EBITDA Margin exc non-recurring tax credits 5.0% 3.9% 5.0% 4.2%
I. Consolidated Financial and Operational Performance
3
of Net Revenues. Excluding the non-recurring tax credits effect, Gross Profit in 1H17 in Colombian pesos would have
grown by 14.5% to a margin of 24.2% (+40 basis points versus margin also adjusted in the base of 2Q16).
SG&A expenses decreased as percentage of Net Revenues and were 20.8% both in 2Q17 and 1H17 versus the same
period last year, reflecting productivity efforts and other cost-cutting initiatives despite the effect of high inflation from last
year.
Recurring Operating Income grew by 71.6% in 2Q17 and doubled in 1H17 versus the same period last year. Recurring
Operating Income margin grew 210 basis points and was 6.1% in 2Q17 and 4.6% in 1H17 driven mainly by the strong
rebound of our operation in Brazil.
Recurring EBITDA grew by 52.2% and 40.0% and margin was 8.0% and 6.5% in 2Q17 and 1H17 respectively. Margin
improvement reflected the strong top line and gross profit growth and lower expenditure levels from productivity efforts.
Excluding the non-recurring tax credits effect, Recurring EBITDA in 2Q17 in Colombian pesos would have grown by
43% to a margin of 5.0% (+110 basis points versus margin also adjusted in the base of 2Q16). Excluding the non-
recurring tax credits effect, Recurring EBITDA in 1H17 in Colombian pesos would have grown by 32.9% to a margin of
5.0% (+80 basis points versus margin also adjusted in the base of 2Q16).
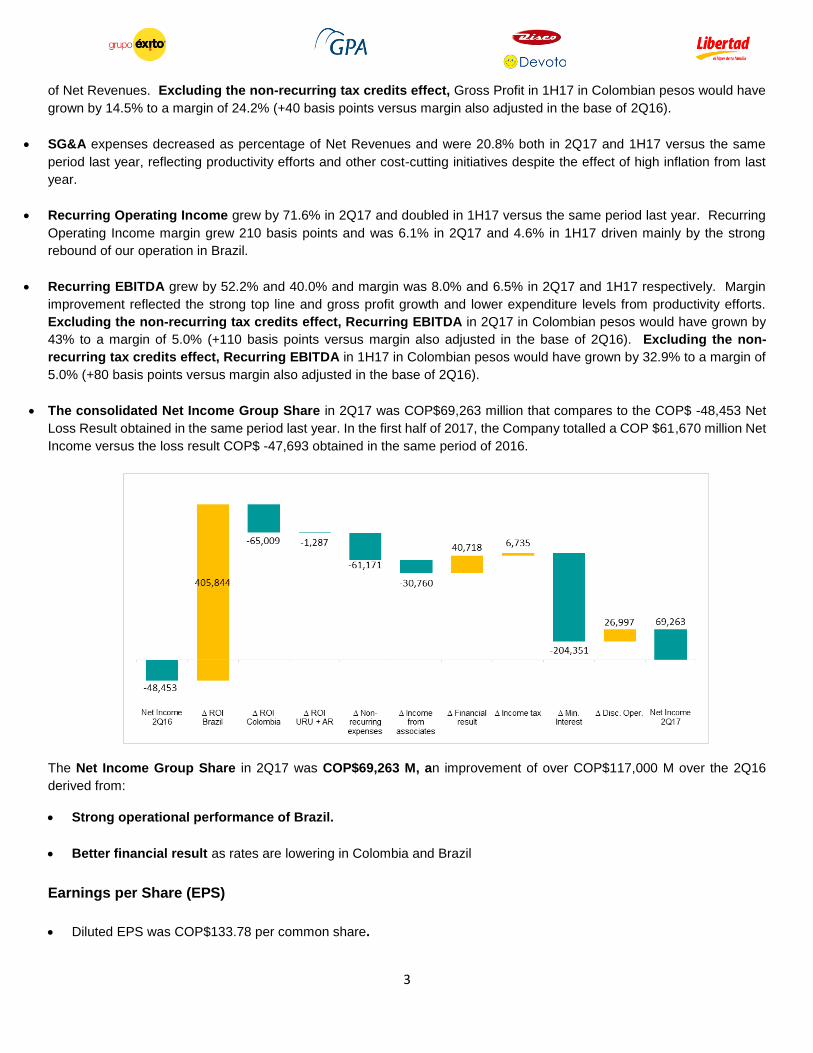
The consolidated Net Income Group Share in 2Q17 was COP$69,263 million that compares to the COP$ -48,453 Net
Loss Result obtained in the same period last year. In the first half of 2017, the Company totalled a COP $61,670 million Net
Income versus the loss result COP$ -47,693 obtained in the same period of 2016.
The Net Income Group Share in 2Q17 was COP$69,263 M, an improvement of over COP$117,000 M over the 2Q16
derived from:
Strong operational performance of Brazil.
Better financial result as rates are lowering in Colombia and Brazil
Earnings per Share (EPS)
Diluted EPS was COP$133.78 per common share.

4
Capex
The level of Consolidated Capital Expenditures in 2Q17 was COP$400,000 M, of which 30% was allocated to retail
and real estate expansion as well as conversions and the remaining 70% was used in maintaining and supporting
operational structures, updating IT systems and for logistics.
In Colombia, Capital Expenditures reached COP$85,000 M in 2Q17 of which nearly 58% corresponded to real estate
requirements, including the construction of Viva Envigado and Viva Tunja projects.
Food Retail Expansion
Grupo Éxito continued expanding key formats and markets across the region. In Colombia, the Company opened 6
Éxito, 1 Carulla and 1 Surtimax stores and added 64 “Aliados”. In Brazil, the Company opened 2 Minuto Pão de Açucar
and 4 Assaí stores (3 converted from Extra Hiper and opened the brand´s largest box) and added 86 “Aliados
CompreBem”. In Uruguay and Argentina, the focus was Proximity with the opening of 1 Devoto Express store and 2
Petit Libertad stores, respectively.
As a net result, during 2Q17, Grupo Éxito ended the period with 1,563 food retail stores, geographically diversified with
568 stores in Colombia, 884 in Brazil, 81 in Uruguay and 30 in Argentina. Stores in Brazil do not include pharmacies,
gas stations and stores from the discontinued business unit of Via Varejo. The Company´s consolidated selling area
reached 2.75 million of square meters.
Real Estate Expansion
In Colombia, the Company moved forward on the construction of Viva Envigado, which is at 38% completion and is
expected to open by the 2H18. The construction of Viva Tunja advanced by 13% and the shopping mall is expected to
open by the 4Q18.
In Argentina, the construction of Paseo San Juan shopping mall is at 60% completion and Paseo Rivera Indarte
shopping mall is at 45% completion.
Strategic Activities
Grupo Éxito continued advancing with the divestment process for Via Varejo.

5
Net Sales Colombia
Net Sales - Colombia
(1) % Var Total sales and SSS including a calendar effect of +1 day during the promotional event in June 2017 of 1.15% in 2Q17 and of -0.17% in 1H17 from leap year 2016. (2) B2B: Sales from Allies, Institutional, 3rd party sellers and Surtimayorista.
Colombia continued with a challenging economic environment with mixed trends of the macro variables. On the positive
side, unemployment posted a better level and was 8.7% as of June 2017. The Central Bank continued with an expansionary
policy and decreased rates in 2Q17 by 125 basis points versus the same period last year. Nevertheless, lower rates have
not been yet translated to the same extent into the financial system, and therefore, consumption is still weak despite the
lower inflationary trend. Consumption and the retail sector were strongly affected by the VAT increase and the tax reform
of 2016. Even though the consumer confidence level has improved in 2Q17 (-11.7 2Q17 vs -21.1 1Q17), retail sales ---
excluding gas and vehicles – contracted by 0.6% as of 1H17.
Grupo Éxito´s Net Sales in Colombia reached COP $2.5 billion and suffered an annual contraction of 3.7% in 2Q17
adjusted by the calendar effect versus the same period last year (2.5% when excluding a calendar effect of 1.15%).
Net sales performance in the country, reflected the continuity of weak consumption as well as an inflation deceleration
trend especially in food, as the index went from 14.3% in 2Q16 to 1.4% in 2Q17. CPI also reduced by more than half
and went from 8.6% in 2Q16 to 3.99% in 2Q17. Inflation deceleration and the negative retail sales trend offset the
contribution to net sales of the organic expansion of 25 new stores opened during the last 12 months.
The mix share in the food category lost 100 basis points and was 74.1% in 2Q17 versus the same period last year,
while the non-food category benefited from the increased share and stake growth of the electronics and the textile
categories reflecting the strong acceptance of our Every Day Low Price strategy among customers. Both categories
were the best performers in 2Q17 with electronics posting the strongest growth.
Same-store sales in Colombia decreased by 4.2% in 2Q17 adjusted by the calendar effect (3.1% excluding the
calendar effect) and by 3.1% adjusted by the calendar effect during the first half of the year (3.3% excluding the calendar
effect).
The Éxito segment gained 180 basis points and represented approximately 68% of sales in Colombia. Sales of the
Éxito segment experienced a decrease of 1.0% in 2Q17 adjusted by the calendar effect and a decrease of 0.5% in
1H17 adjusted by the calendar effect mainly derived from the supermarket format. In terms of like-for-like, Éxito posted
a decrease of 2.9% in 2Q17 adjusted by the calendar effect and of 2.2% in 1H17 adjusted by the calendar effect. Éxito
hypermarkets remained resilient and growing in 1H17 as a result of the positive performance seen in entertainment and
textiles.
The Carulla segment sales performance reflected mainly the strong inflation deceleration trend of the food segment
which represents 97% of Carulla share of sales. Nevertheless, the banner continued posting healthy low-double digit
EBITDA margin levels. Notably, the contribution of sales from customers enrolled in our loyalty program increased
across all banners but was especially high in Carulla.
In COP M Net SalesVar.
Net Sales
Var.
SSS
Var. Net
Sales
Var.
SSSNet Sales
Var.
Net Sales
Var.
SSS
Var. Net
Sales
Var.
SSS
Total Colombia 2,513,016 -2.5% -3.1% -3.7% -4.2% 5,115,122 -2.4% -3.3% -2.2% -3.1%
Éxito 1,697,231 0.2% -1.8% -1.0% -2.9% 3,485,307 -0.6% -2.4% -0.5% -2.2%
Carulla 366,892 -3.6% -4.3% -3.6% -4.3% 732,813 -3.3% -3.9% -2.5% -3.2%
Surtimax-Super Inter 381,042 -6.3% -7.4% -6.1% -7.2% 766,047 -6.3% -6.9% -5.5% -6.0%
B2B(2) + Other 67,851 -29.0% N/A N/A N/A 130,955 -17.8% N/A N/A N/A
2Q17Adjusted by calendar
(1) 1H17Adjusted by calendar
(1)
II. Financial and Operational Performance by Country
6
The segment of Surtimax and Super Inter decreased sales due to the strong inflation deceleration trend especially in
food considering the high contribution of the category to sales (97% on average). The segment continued posting mid-
single digit profitability at the operational level reflecting the Company´s expansion strategy, focused on store
profitability. This compares to the aggressive non-profitable expansion at any cost seen from other players.
Sales in the B2B and Other segment included the strong 11.9% sales growth from the 1.255 “Aliados” as of 2Q17 and
+31.2% sales growth of the cash and carry store “Surtimayorista”. Surtimayorista reached its first year of operations,
is already profitable and grew sales by 2.7 times per square meter versus previous banner in-site. The positive result
obtained from our cash and carry format led us to increase our expected store base from 3 - as initially guided - to 8
stores in 2017.
Operating Performance in Colombia
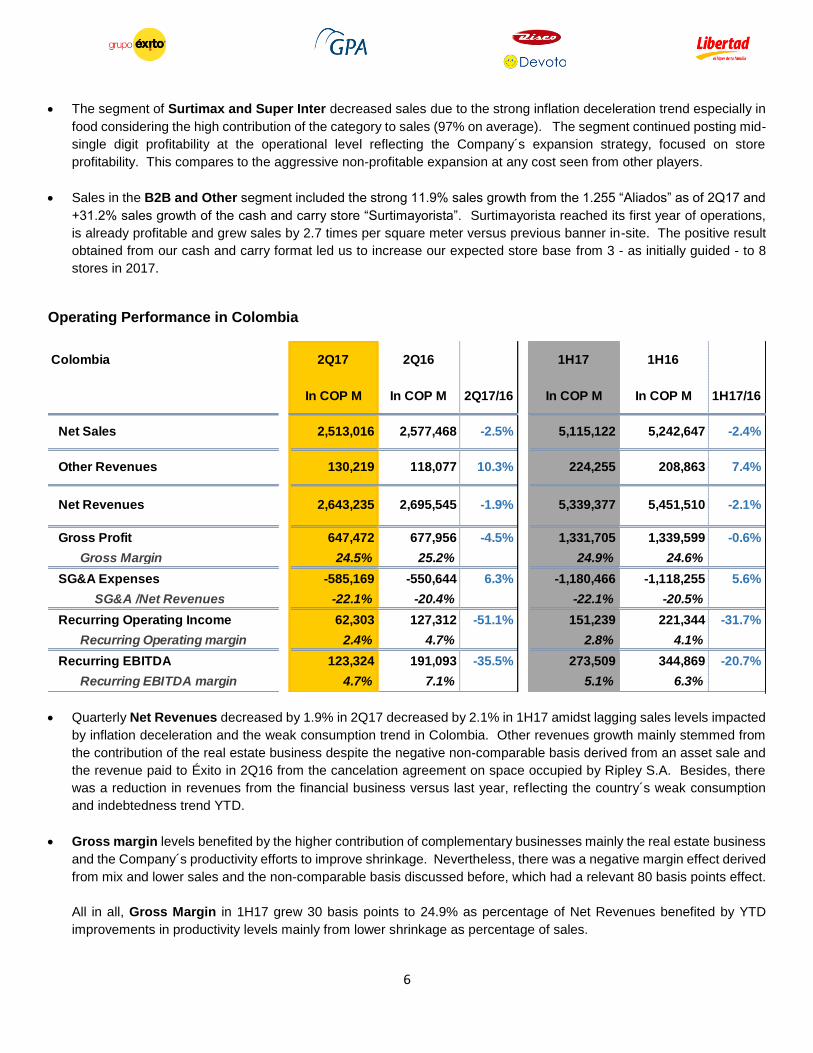
Quarterly Net Revenues decreased by 1.9% in 2Q17 decreased by 2.1% in 1H17 amidst lagging sales levels impacted
by inflation deceleration and the weak consumption trend in Colombia. Other revenues growth mainly stemmed from
the contribution of the real estate business despite the negative non-comparable basis derived from an asset sale and
the revenue paid to Éxito in 2Q16 from the cancelation agreement on space occupied by Ripley S.A. Besides, there
was a reduction in revenues from the financial business versus last year, reflecting the country´s weak consumption
and indebtedness trend YTD.
Gross margin levels benefited by the higher contribution of complementary businesses mainly the real estate business
and the Company´s productivity efforts to improve shrinkage. Nevertheless, there was a negative margin effect derived
from mix and lower sales and the non-comparable basis discussed before, which had a relevant 80 basis points effect.
All in all, Gross Margin in 1H17 grew 30 basis points to 24.9% as percentage of Net Revenues benefited by YTD
improvements in productivity levels mainly from lower shrinkage as percentage of sales.
Colombia 2Q17 2Q16 1H17 1H16
In COP M In COP M 2Q17/16 In COP M In COP M 1H17/16
Net Sales 2,513,016 2,577,468 -2.5% 5,115,122 5,242,647 -2.4%
Other Revenues 130,219 118,077 10.3% 224,255 208,863 7.4%
Net Revenues 2,643,235 2,695,545 -1.9% 5,339,377 5,451,510 -2.1%
Gross Profit 647,472 677,956 -4.5% 1,331,705 1,339,599 -0.6%
Gross Margin 24.5% 25.2% 24.9% 24.6%
SG&A Expenses -585,169 -550,644 6.3% -1,180,466 -1,118,255 5.6%
SG&A /Net Revenues -22.1% -20.4% -22.1% -20.5%
Recurring Operating Income 62,303 127,312 -51.1% 151,239 221,344 -31.7%
Recurring Operating margin 2.4% 4.7% 2.8% 4.1%
Recurring EBITDA 123,324 191,093 -35.5% 273,509 344,869 -20.7%
Recurring EBITDA margin 4.7% 7.1% 5.1% 6.3%
7
SG&A expenses in 2Q17 reflected higher inflation in 2016 (5.75%) versus the trend YTD (3.99%) that affected the base
of expenses in 2017. Excluding the 7% wage growth due to inflation, expenses would have grown only by 1.7% as
there were also non-comparable items that represented 2/3 of expenses in 2Q17 mainly related to LTM expansion,
higher occupancy costs and higher tax payments and an increased VAT base. All these negative effects were partially
offset by the Company´s efforts and actions plans to control expenses with focus in operational efficiencies and in
general expenses.
Recurring Operating Margin was 2.4% in 2Q17 and 2.8% in 1H17, reflecting the food inflation deceleration trend and
the effect of inflation on expenditure levels.
Recurring EBITDA margin was 4.7% in 2Q17 and 5.1% in 1H17. Margins benefitted from productivity efforts offset by
weak top line and higher expenditure levels.
To sum up, the Company´s sales performance in Colombia reflected the lower inflationary trend and the adjustment in
household expenditures due to the tax reform. The Company expects the weak economic and retail performance to
improve during the 2H17 driven by adjustments done to the macro policy that may benefit consumption.
Net Sales - Brazil
(1) Variations in sales and SSS in local currency and adjusted for the calendar effect. Brazil’s food figures include: Multivarejo + Assaí. Via Varejo registered as a
discontinued operation
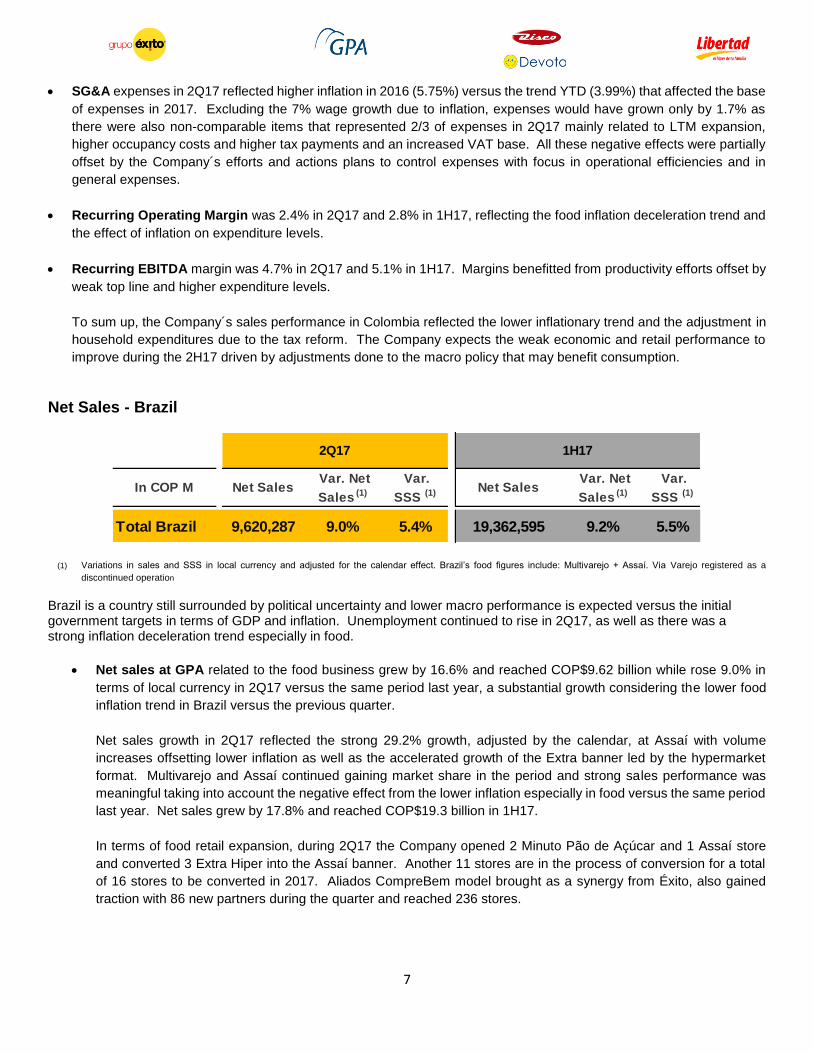
Brazil is a country still surrounded by political uncertainty and lower macro performance is expected versus the initial government targets in terms of GDP and inflation. Unemployment continued to rise in 2Q17, as well as there was a strong inflation deceleration trend especially in food.
Net sales at GPA related to the food business grew by 16.6% and reached COP$9.62 billion while rose 9.0% in
terms of local currency in 2Q17 versus the same period last year, a substantial growth considering the lower food
inflation trend in Brazil versus the previous quarter.
Net sales growth in 2Q17 reflected the strong 29.2% growth, adjusted by the calendar, at Assaí with volume
increases offsetting lower inflation as well as the accelerated growth of the Extra banner led by the hypermarket
format. Multivarejo and Assaí continued gaining market share in the period and strong sales performance was
meaningful taking into account the negative effect from the lower inflation especially in food versus the same period
last year. Net sales grew by 17.8% and reached COP$19.3 billion in 1H17.
In terms of food retail expansion, during 2Q17 the Company opened 2 Minuto Pão de Açúcar and 1 Assaí store
and converted 3 Extra Hiper into the Assaí banner. Another 11 stores are in the process of conversion for a total
of 16 stores to be converted in 2017. Aliados CompreBem model brought as a synergy from Éxito, also gained
traction with 86 new partners during the quarter and reached 236 stores.
In COP M Net Sales Var. Net
Sales (1)
Var.
SSS (1) Net Sales Var. Net
Sales (1)
Var.
SSS (1)
Total Brazil 9,620,287 9.0% 5.4% 19,362,595 9.2% 5.5%
2Q17 1H17
8
Same-store-sales growth in the food segment in Brazil was 5.4% in 2Q17 in terms of local currency. The outcome
derived mainly from the strong 13.5% growth in Assaí and the Extra Hiper stores. Thus, sales and LFL levels of
the food business excelled in the midst of a strong declining inflation trend in Brazil.
Assaí Net Sales grew by 29.2% in 2Q17 in terms of local currency as a result of the good performance of the new
stores. The consistent growth of the banner derived from commercial actions that improved the customer traffic
trend and favour volume growth which offset the effect at top line level of a slower inflationary trend especially in
food. The banner continued posting accelerated LFL levels that grew by 13.5% in terms of local currency when
adjusted by the calendar effect, which significantly outpaced inflation.
With the 3 stores converted from Extra Hiper and the opening of an additional box, Assaí totalled 110 stores year-
to-date which accounted for the increased sales contribution to the food segment to 40.1%, an increase of 570
basis points versus the same period last year. As of the first half of 2017, converted stores maintained a solid 2.5x
sales growth on average versus the previous banner as well as the average profitability of Assaí. Store maturity
and higher traffic allowed the banner to gain 400 basis points of market share versus the same period in 2016.
Multivarejo posted 1.2% SSS growth in 2Q17 in terms of local currency and the segment obtained market share
gains versus last year despite the closing of stores due to the conversion plan. Multivarejo benefitted by the
accelerated growth of Extra Hiper, despite the negatively effect on sales from the closure of Extra Hiper stores
converted into Assaí and the food inflation sharp decline that affected the performance of the supermarkets and
proximity stores under the Pão de Açúcar and Extra banners due to their high mix of sales of the food category.
Extra Hiper, posted a strong SSS growth of 7.6%, level increased from the 5.4% obtained in 1Q17, driven mainly
by the sequential performance improvement of the non-food categories driven by initiatives to improve assortment
and shopping experience mainly for the mobile business and household appliances as well as the textile category
benefitted from the synergy model brought by Éxito Colombia. The banner continued to gain market share versus
last year.
The company is implementing diverse activities to increase traffic and sales such as strengthening commercials
campaigns at regional basis, converting discounts at stores into prepaid mobile bonuses and renovating between
15 to 20 Pão de Açúcar stores in the coming quarters. Moreover, the Company launched “My Discount” program
as an innovative marketing activity, in which near 12 M customers registered in the loyalty program of the Pão de
Açúcar and Extra banners will have access to personalised offers by using a mobile app. Over one million
downloads were done by customers in the first 10 days of this program which in addition to improve the service to
customers, aims to build loyalty and increase the share of wallet.

9
Operating performance in Brazil
Note: 2Q16 results includes the effects of the restatement of Companhia Brasileira de Distribuição – CBD results arising from the adjustment booked by such subsidiary regarding the investigation on Cnova N.V. and the effect of the adjustments from the completion of the Purchase Price Allocation process relevant to the acquisition of control of Companhia Brasileira de Distribuição - CBD, pursuant to IFRS 3 – Business combinations. 2Q17 and 2Q16 data do not include Via Varejo S.A and Cnova N.V. operations
Net Revenues grew by 16.7% in Colombian Pesos during 2Q17 versus the same period last year, growth related to
the strong performance of Assaí and the continued recovery of the Extra banner. Other revenues were also a strong
contributor as posted a 28.1% growth in Colombian Pesos. Net Revenues grew by 17.9% and other revenues by
25.5% in 1H17.
Gross Profit rose by 28.7% to a gross margin of 27.0% in 2Q17 versus the same period last year in Colombian Pesos.
The 250 bps margin increase stemmed from faster-than-expected maturity of Assaí stores, lower shrinkage due to
efficiencies in logistics, a more accurate investment in promotions, the exclusion of lower margin of Extra Hiper stores
converted and non-recurring tax credits. Excluding this non-recurring tax credits effect, Gross Profit in 2Q17 in
Colombian pesos would have grown by 23.2% to a margin of 22.9% (a 120 basis point increase versus margin also
adjusted in the base of 2Q16). Gross Profit rose by 24.7% and posted a 24.7% margin in 1H17 versus the same
period last year in Colombian Pesos. Excluding this non-recurring tax credits effect, Gross Profit in 1H17 in
Colombian pesos would have grown by 21.7% to a margin of 22.7% (a 70 basis point increase versus margin also
adjusted in the base of 2Q16).
SG&A expenses grew below inflation in local currency and experienced a significant reduction of 120 bps in Colombian
Pesos in 2Q17 versus the same period of last year. In Multivarejo, a 3% expense reduction continued from efficiency
and productivity initiatives adopted last year that led to lower electricity consumption and the optimization of the staff
base due to productivity gains in the operations at stores and distribution centres. In Assaí, the expense dilution
continued despite the strong expansion in the LTM. In 1H17 SG&A expenses as percentage of Net Revenues
decreased by 90 basis points versus the same period last year.
Brazil 2Q17 2Q16 1H17 1H16
Food Segment In COP M In COP M 2Q17/16 In COP M In COP M 1H17/16
Net Sales 9,620,287 8,251,492 16.6% 19,362,595 16,435,749 17.8%
Other Revenues 67,615 52,783 28.1% 135,218 107,778 25.5%
Net Revenues 9,687,902 8,304,275 16.7% 19,497,813 16,543,527 17.9%
Gross Profit 2,614,471 2,031,022 28.7% 4,809,430 3,856,690 24.7%
Gross Margin 27.0% 24.5% 24.7% 23.3%
SG&A Expenses -1,901,225 -1,723,620 10.3% -3,827,903 -3,383,388 13.1%
SG&A /Net Revenues -19.6% -20.8% -19.6% -20.5%
Recurring Operating Income 713,246 307,402 132.0% 981,527 473,302 107.4%
Recurring Operating margin 7.4% 3.7% 5.0% 2.9%
Recurring EBITDA 887,409 455,404 94.9% 1,333,365 765,592 74.2%
Recurring EBITDA margin 9.2% 5.5% 6.8% 4.6%
Gross Profit exc non-recurring tax credits 2,203,652 1,788,224 23.2% 4,398,611 3,613,892 21.7%
Gross Margin exc non-recurring tax credits 22.9% 21.7% 22.7% 22.0%
Recurring EBITDA exc non-rec tax credits 476,590 212,606 124.2% 922,546 522,794 76.5%
Recurring EBITDA Margin exc non-rec tax cred 5.0% 2.6% 4.8% 3.2%

10
Recurring Operating Income in 2Q17grew by 132% in Colombian Pesos and margin went from 3.7% to 7.4%. In
1H17, Recurring Operating Income grew by 107.4% in Colombian Pesos and margin went from 2.9% to 5.0% versus
the same period of last year.
Recurring EBITDA in Colombian Pesos grew by 94.9% and margin went from 5.5% to 9.2% in 2Q17. In local currency,
Recurring EBITDA grew 220 bps in Multivarejo and 260 bps in Assaí versus the same period last year. Excluding the
non-recurring tax credits effect, Recurring EBITDA in 2Q17 in Colombian pesos would have grown by 124.2% to a
margin of 5.0% (+240 basis points versus margin also adjusted in the base of 2Q16). Recurring EBITDA in Colombian
Pesos grew by 74.2% and margin went from 4.6% to 6.8% in 1H17. Excluding the non-recurring tax credits effect,
Recurring EBITDA in 1H17 in Colombian pesos would have grown by 76.5% to a margin of 4.8% (+160 basis points
versus margin also adjusted in the base of 2Q16).
The performance of our Brazilian operation was outstanding with top line growing strongly despite a sharp food inflation
deceleration trend. Margins continued reflecting significant operational improvements at Multivarejo and Assaí, which
led to higher profitability. GPA sales and margin performance constantly improving since Éxito´s acquisition and positive
contribution to consolidated results, make us very confident about the accuracy and correct timing behind our investment
in Brazil.
Sales and Operating Performance in Uruguay
Net Sales
The macroeconomic environment in Uruguay continued distressed by an unemployment rate that reached its highest in 13
years and a public deficit affecting consumption via higher utilities rates and taxes. Inflation during 2Q17 continued its
decreasing trend and was 5.3% versus the 10.9% posted the same period last year.
Uruguay 2Q17 2Q16 1H17 1H16
In COP M In COP M 2Q17/16 In COP M In COP M 1H17/16
Net Sales 603,961 526,031 14.8% 1,272,338 1,156,481 10.0%
Other Revenues 6,140 6,551 -6.3% 11,264 13,872 -18.8%
Net Revenues 610,101 532,582 14.6% 1,283,602 1,170,353 9.7%
Gross Profit 201,965 186,384 8.4% 434,779 402,516 8.0%
Gross Margin 33.1% 35.0% 33.9% 34.4%
SG&A Expenses -168,751 -151,558 11.3% -340,776 -295,499 15.3%
SG&A /Net Revenues -27.7% -28.5% -26.5% -25.2%
Recurring Operating Income 33,214 34,826 -4.6% 94,003 107,017 -12.2%
Recurring Operating margin 5.4% 6.5% 7.3% 9.1%
Recurring EBITDA 39,377 41,477 -5.1% 106,280 104,693 1.5%
Recurring EBITDA margin 6.5% 7.8% 8.3% 8.9%

11
Amidst this macro environment, Net sales in Uruguay grew by 8.2% in local currency (above inflation) and by 14.8% in
Colombian Pesos in 2Q17 versus the same period last year. The food sales mix in Uruguay gained 60 basis points to
87.3% in 2Q17 and sales continue benefitting from the Company´s expansion into convenience stores --- with the
opening of 12 Devoto Express in the last 12 months which doubled the format contribution to total sales. The Company
continued gaining market share (+1% in 2Q17). Net sales grew by 10.0% in Colombian Pesos in 1H17 versus the same
period last year.
Same-store-sales levels grew also above inflation and were 6.2% in 2Q17 in local currency when adjusted by the
calendar effect, benefitted mainly by the strong like-for-like performance of FMCG followed by the fresh category.
Quarterly Net Revenues rose by 14.6% and rose by 9.7% in Colombian Pesos in 1H17 versus the same period last
year. There was a weak contribution of other revenues mainly related to the lower dynamism of rental revenues affected
by macro winds.
Gross Profit in 2Q17 grew by 8.4% in Colombian Pesos and margin was 33.1% as percentage of Net Revenues. The
190 basis point margin decrease in 2Q17 relates mainly to higher logistic cost derived from expansion and higher weight
of the promotional mix. Gross Profit in 1H17 grew by 8.0% in Colombian Pesos and margin was 33.9% as percentage
of Net Revenues.
SG&A expenses increased by 11.3% in 2Q17 and grew below inflation in local currency due to operational efficiencies
such as reduction in marketing expenditure, staff base optimization and a more efficient use of utilities. Expenditure
related mainly to the effect of wage increases due to union negotiations (+14.5%), higher commissions to transactions
(+20.8%) and tax related to higher asset valuation (+46%). SG&A expenses were diluted as they grew below net sales
and margin went from 28.5% to 27.7% as percentage of Net Revenues. SG&A expenses in 1H17 grew by 15.3% in
Colombian Pesos and margin was 26.5% as percentage of Net Revenues.
Recurring Operating Income margin was 5.4% in 2Q17 reflected the lower gross profit level affected by higher
operational expenses (+12.2%). Recurring Operating Income margin was 7.3% in 1HQ17 in Colombian Pesos as
percentage of Net Revenues and included a strong D&A adjustment related to the adjustment to reduce the asset life
base.
Recurring EBITDA margin was 6.5% in 2Q17 and 8.3% in 1H17, an operation posing a healthy retail profitability levels
despite the challenging macro environment in the country.

12
Sales and Operating Performance in Argentina
Net Sales
Argentina experienced the strongest inflation deceleration trend of all our 4 operations in LatAm as the index decreased
from 45.5% in 2Q16 to 24.6% in 2Q17. The repo rate was kept stable at 26.25% and the country continued with weak retail
sales levels according to CAME, that contracted by 3.0% year-to-June versus the same period last year.
Libertad Net sales in 2Q17 and decreased by 1.4% in Colombian pesos related to a 12.0% FX effect. Net sales in local
currency posted a growth and SSS increase of 10.2% when adjusted by the calendar effect (+1.8%). The net sales
performance of Libertad below inflation in Argentina, reflected the challenging consumption context and the negative
trend of the non-food category.
The food mix in Argentina grew strongly by 510 bps in 2Q17 versus the same period last year to 77% mainly driven by
expansion in convenience. The format gained share and double their stake in total sales in 2Q17 versus the same
period last year, benefitted by the market share gains and the continuous expansion of Petit Libertad stores that
completed 15 YTD. The format is gaining traction and grew LFL levels above inflation. The fresh category also grew
net sales and SSS levels over inflation.
The non-food part of the business lagged with decreases in the home and entertainment categories. Nevertheless, the
textile category excelled and recorded a 64% sales growth in the quarter and totalled a 46% growth in 1H17 versus the
same period last year. The strong performance of apparel derived from the successful implementation of the textile
model, present now at 11 of our hypermarkets.
In Argentina, 2 premium proximity stores opened under the Petit Libertad banner (5 in LTM), which captured the format
expertise gained by Minuto Pão de Açúcar in Brazil and Carulla Express in Colombia. The Company totalled 30 stores
year-to-2Q17 in the country.
Quarterly Net Revenues in 2Q17 reflected the sales decrease that offset higher revenues mainly from the strong
performance of the real estate business which continued expanding its contribution to profitability. Devaluation trend
affected the consolidation of figures in Colombian Pesos with a negative effect of nearly 12% at top line level.
Argentina 2Q17 2Q16 1H17 1H16
In COP M In COP M 2Q17/16 In COP M In COP M 1H17/16
Net Sales 319,385 323,855 -1.4% 640,867 652,337 -1.8%
Other Revenues 11,016 9,637 14.3% 37,743 31,924 18.2%
Net Revenues 330,401 333,492 -0.9% 678,610 684,261 -0.8%
Gross Profit 106,307 107,592 -1.2% 232,933 232,950 0.0%
Gross Margin 32.2% 32.3% 34.3% 34.0%
SG&A Expenses -101,542 -103,152 -1.6% -220,915 -217,562 1.5%
SG&A /Net Revenues -30.7% -30.9% -32.6% -31.8%
Recurring Operating Income 4,765 4,440 7.3% 12,018 15,388 -21.9%
Recurring Operating margin 1.4% 1.3% 1.8% 2.2%
Recurring EBITDA 8,800 7,988 10.2% 19,961 22,647 -11.9%
Recurring EBITDA margin 2.7% 2.4% 2.9% 3.3%
13
Gross Profit in 2Q17 posted a 32.2% margin as a percentage of Net Revenues negatively impacted by lower volumes
and mix effect due to the increased share of fresh and partially benefited by the strong contribution of the real estate
business. In 1H17, gross margin improved by 30 basis points to 34.3% as percentage of Net Revenues.
SG&A expenses decreased by 1.6% in 2Q17 in Colombian pesos to 30.7% as percentage of Net Revenues benefitted
by a strong expense control activities. Expenditures included advertising, mailing and marketing activities (+17%) to
improve sales. SG&A expenses in 1H17 were to 32.6% as percentage of Net Revenues and reflected the effect of the
40% inflation in 2016 at the cost and expense level.
Recurring Operating Income grew by 7.3% and margin improved by 10 basis points to 1.4% in 2Q17 as a percentage
of Net Revenues while was 1.8% in 1H17 as percentage of Net Revenues.
Recurring EBITDA grew by 10.2% and margin improved by 30 basis points to 2.7% in 2Q17 and was 2.9% in 1H17 as
a percentage of Net Revenues. Margins in Argentina reflected the effect of last year inflation in costs and expenditures
and the weak growth of the top line below inflation that partially offset the strong contribution of the real estate business
at adjusted EBITDA level.
Net Debt at holding level
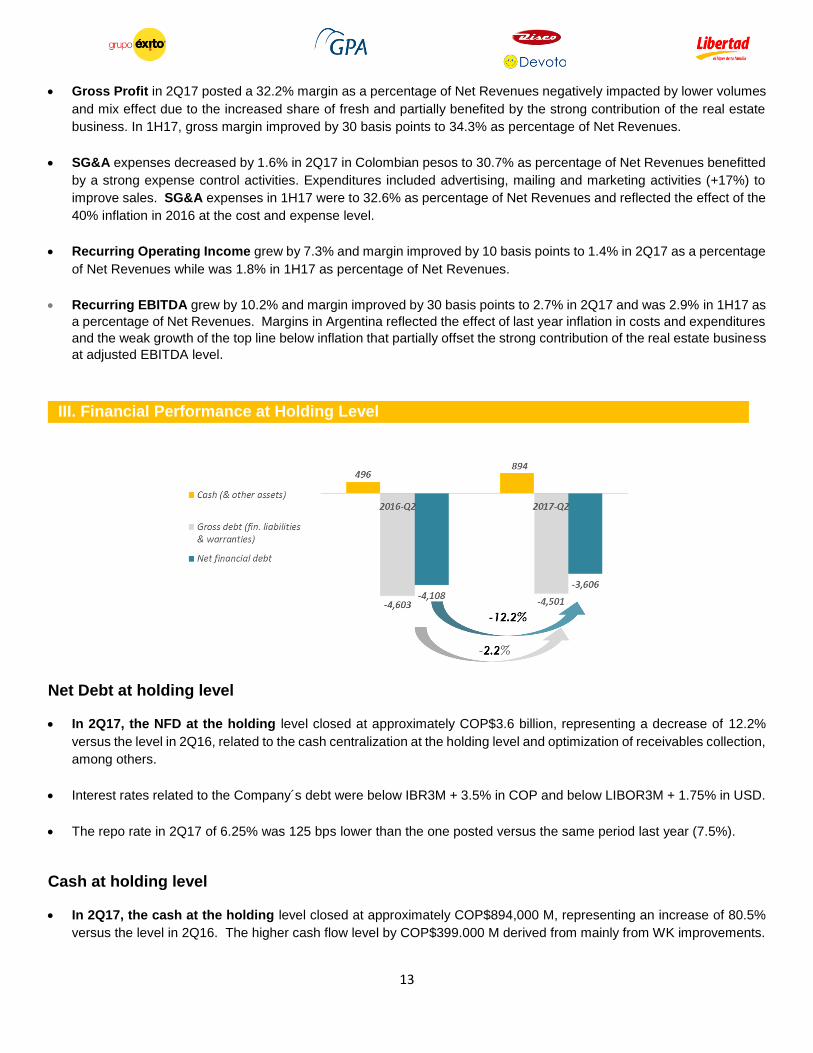
In 2Q17, the NFD at the holding level closed at approximately COP$3.6 billion, representing a decrease of 12.2%
versus the level in 2Q16, related to the cash centralization at the holding level and optimization of receivables collection,
among others.
Interest rates related to the Company´s debt were below IBR3M + 3.5% in COP and below LIBOR3M + 1.75% in USD.
The repo rate in 2Q17 of 6.25% was 125 bps lower than the one posted versus the same period last year (7.5%).
Cash at holding level
In 2Q17, the cash at the holding level closed at approximately COP$894,000 M, representing an increase of 80.5%
versus the level in 2Q16. The higher cash flow level by COP$399.000 M derived from mainly from WK improvements.
III. Financial Performance at Holding Level

14
Company´s International Strategy and the Synergy Process Follow Up
Synergies captured as of 2Q17 in value surpassed the level achieved in FY 2016 (USD$25M).
Grupo Éxito confirms that the expected run rate from synergies should exceed initial guidance of USD$50 M in
recurring gains in 2017 at consolidated level, derived from:
LatAm
Joint negotiation in categories for indirect purchasing of items (shopping carts, baskets, plastic bags, among others).
Exchange of best practises to reduce shrinkage in perishables.
Joint commodity purchasing.
Brazil
Execution of the textile project with the implementation in around 30 Extra Hiper stores in 2017.
Aiming at 500 Aliados CompreBem by 2017 (236 YTD).
Colombia
Surtimayorista reached its first year of operations, is already profitable and grew sales by 2.7 times per square meter
versus the previous format. The positive result obtained from our cash and carry format led us to increase our expected
store openings from 3 - as initially guided - to a total of 8 stores in 2017.
Uruguay & Argentina
The Company continued its expansion plan in Uruguay and Argentina – mainly focused on opening of proximity formats.
LatAm
Strategic Priorities
LatAm integration with benefits at the recurrent operational profit level. Run rate benefits from synergies in 2017
exceeding USD$50 M through 18 initiatives across the 4 countries, mainly related to: the launch of a renewed loyalty
program in Brazil; the exchange of best practices between Colombia and Brazil in supply chain to reduce shrinkage in
perishables; and other synergies derived from the ongoing integration process between countries.
The gradual decrease of interest rates in Colombia and Brazil may lower financial expenses and trigger consumption
levels.
Mid-term economic recovery expected in Colombia, Brazil and Argentina.
IV. International Strategy and Synergy Process
V. Outlook

15
Focus on cost and expense control activities.
Expansion focus on high-return formats such as cash and carry in Brazil and Colombia.
High potential from store conversions and renovations of premium stores.
Colombia
Strategic Priorities
Grupo Éxito continues focusing on cost and expense control activities and in profitable expansion to maintain
profitability.
Strengthening the differentiation of the textile, the fresh model from Super Inter, allies, unbeatable and private label
penetration to defend the Company´s market positioning and to improve sales volumes in the country.
The recently announced loyalty program “Puntos Colombia” may improve the Company´s strength for traffic
monetization in the near future and a high potential for optimizing Grupo Éxito´s intangible asset base.
Guidance
Lower inflation and interest rates could favour demand for credit and a gradually a recovery of consumer expenditures
from the second half of the year.
A relief in the Company´s financial expenditure from lower repo rates should benefit the Net Income result in Colombia.
Opening 25 to 30 stores in profitable formats mainly in mid-size cities to avoid cannibalization, including 8 cash and
carry stores, for a sales expansion of nearly 35.000 square meters in 2017.
Real estate expansion of Viva Malls will represent additional 120k sqm of GLA in 2018.
Capex in Colombia around COP$300.000 M.
Brazil
Strategic Priorities
Optimization of store portfolio by focusing on Assaí openings (6-8 stores) and conversions of Extra Hiper stores into
Assaí (16 stores).
Guidance
Colombian textile business model implemented in over 30 stores in Brazil by year-end.
Aliados CompreBem to reach around 500 by year-end.
Market share gains at Multivarejo and Assaí.
Recurring EBITDA Margin around 5.5% in the food segment derived from higher profitability in Assaí and stability in
Multivarejo.
16
Capex: around R$1.2 billion.
Uruguay
Strategic Priorities
To maintain solid margin levels and to continue strengthening market share.
Guidance:
Expanding in high-return formats --- such with the opening of 10 to 15 Devoto Express stores.
Argentina
Strategic Priorities
Strengthening the real estate business as the key business unit for the Company in the country.
Guidance
To construct GLA of nearly 35.000 square meters in the next 2/3 years.

17
Conference Call Details
Almacenes Éxito S.A. Cordially invites you to participate in its Second Quarter 2017 Earnings Conference Call
Date: Tuesday, August 15, 2017 Time: 10:00 a.m. Eastern Time
9:00 a.m. Colombia Time
To participate, please dial:
U.S. Toll Free 1 888 771 4371 Colombia Toll Free: 01 800 9 156 924
International (outside U.S. dial): +1 847.585.4405
Conference ID Number: 45335151
2Q17 results will be accompanied by a webcast presentation and audio webcast that will be available on the company’s
website at www.grupoÉxito.com.co under “Investors” or
http://event.onlineseminarsolutions.com/wcc/r/1475177-1/F95AAAA072A58CE1CEFCBAC08115A4EA
Upcoming Financial Publications
Third Quarter 2017 Earnings Release – November 14, 2017
IR and PR contacts
María Fernanda Moreno R.
Investor Relations Director
+ (574) 339 6156 + (574) 339 6560
maria.morenorodriguez@grupo-Éxito.com
Cr 48 No. 32B Sur – 139 –Envigado, Colombia
Claudia Moreno B.
PR and Communications Director
Tel + (574) 339 5174
claudia.moreno@grupo-Éxito.com
Cr 48 No. 32B Sur – 139 – Envigado, Colombia
VI. Additional Information
18
Company Description
Grupo Éxito is one of the largest multinationals in Colombia and a relevant food retailer in Latin America. The Company
has clear competitive advantages derived from its strength in bricks and mortar and the value of their brands, supported by
the quality of its human resource. Grupo Éxito also leads an e-commerce strategy and diversifies its revenues with a sound
set of complementary businesses to enhance its retail offering.
In 2016, Consolidated Net Revenues totalled COP$51.6 billion derived from retail sales and its strong portfolio of
complementary businesses: credit card, travel, insurance and real estate with shopping malls in Colombia, Brazil and
Argentina. The Company operates near to 1.600 stores: in Colombia with Grupo Éxito; in Brazil with Grupo Pão de Açucar;
in Uruguay with Grupo Disco and Grupo Devoto, and in Argentina with Libertad. Grupo Éxito is also the e-commerce leader
in Colombia with Éxito.com and carulla.com.
Grupo Éxito´s solid omni-channel model and multi-format and multi-brand strategies make it the leader in all modern retail
segments. The Company´s hypermarkets lead under the Éxito, Extra, Geant and Libertad brands; in premium supermarkets
under the Carulla, Pão de Açucar, Disco and Devoto brands; in proximity under the Carulla, Éxito, Devoto and Libertad
Express and Minuto Pão de Açucar brands. In discount, the Company leads with Surtimax and Super Inter brands and in
Cash and Carry with Assai and Surtimayorista.
Disclaimer
Consolidated statements of income as of June 30, 2016 include the effects of the restatement of the discontinued operation
relevant to Via Varejo S.A. and Cnova N.V. for comparison purposes to 2017. They also include the effects of the
restatement of the results of Companhia Brasileira de Distribuição – CBD, arising from the adjustment booked regarding
the Cnova N.V investigation and the adjustments from the completion of the Purchase Price Allocation process relevant to
the acquisition of control over Companhia Brasileira de Distribuição - CBD and of Libertad S.A., pursuant to IFRS 3 -
Business combinations.
19
I.
Notes:
Numbers expressed in COP billion represent 1.000.000.000.000.
Growth and variations expressed versus the same period last year, except when stated otherwise.
Glossary
Consolidated results: includes Almacenes Éxito results with Colombian and international subsidiaries
Holding results: includes Almacenes Éxito results without Colombian and international subsidiaries.
Colombia results: includes the consolidation of Almacenes Éxito S.A. and its subsidiaries in the country.
Total Net Sales: sales related to the retail business.
Other Revenues: Revenues related to complementary businesses (real estate, insurance, financial services,
transportation business unit, etc.) and other revenues.
Net Revenues: Total revenues related to Total Net Sales and Other Revenues.
Recurring Operating Income (ROI): Includes the Gross Profit adjusted by SG&A expenses and D&A.
EBIT: Includes the Recurring Operating Income adjusted for the Other Non-Recurring Operational
Income/Expense result.
Recurring EBITDA: Measure of profitability that includes ROI adjusted for D&A.
EBITDA: Measure of profitability that includes EBIT adjusted for D&A.
Net Income Group Share: Net Income attributable to Grupo Éxito’s Shareholders.
EPS: Calculated on an entirely diluted basis.
Financial Result: Impacts of interests, derivatives, financial assets/liabilities valuation, FX changes and other
related to cash, debt and other financial assets/liabilities.
VII. Appendices
20
Consolidated Financial Statements
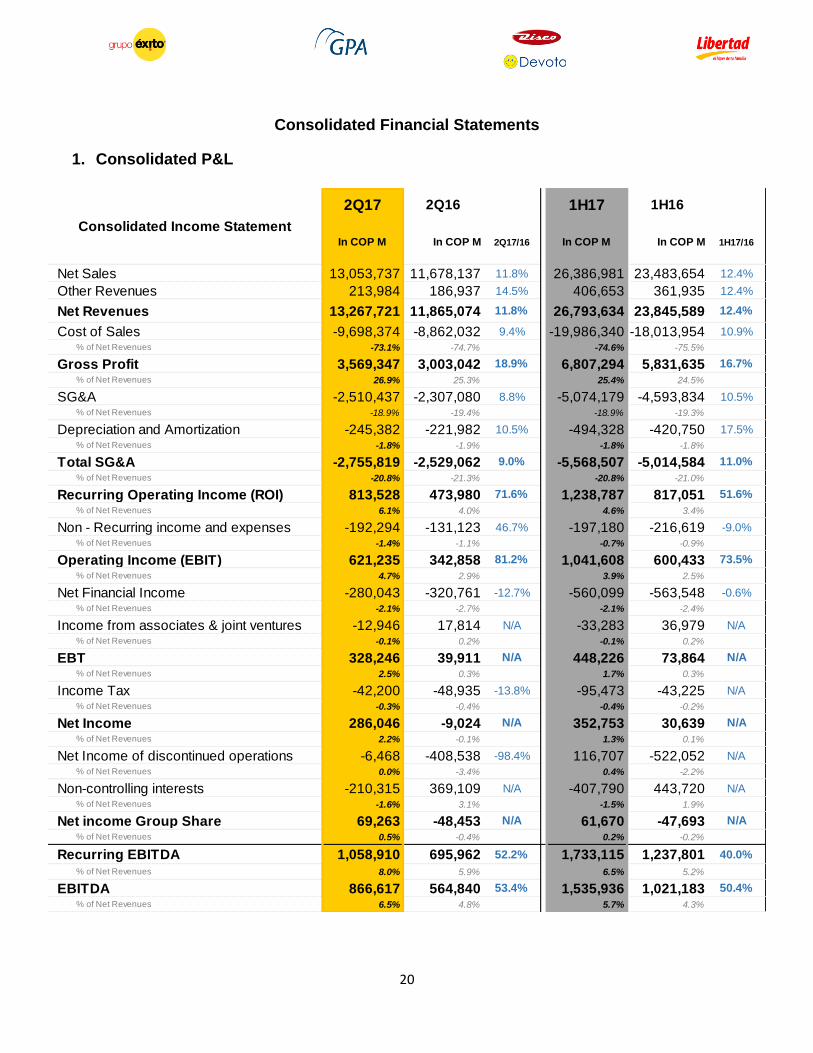
1. Consolidated P&L
2Q17 2Q16 1H17 1H16
In COP M In COP M 2Q17/16 In COP M In COP M 1H17/16
Net Sales 13,053,737 11,678,137 11.8% 26,386,981 23,483,654 12.4%
Other Revenues 213,984 186,937 14.5% 406,653 361,935 12.4%
Net Revenues 13,267,721 11,865,074 11.8% 26,793,634 23,845,589 12.4%
Cost of Sales -9,698,374 -8,862,032 9.4% -19,986,340 -18,013,954 10.9%
% of Net Revenues -73.1% -74.7% -74.6% -75.5%
Gross Profit 3,569,347 3,003,042 18.9% 6,807,294 5,831,635 16.7%
% of Net Revenues 26.9% 25.3% 25.4% 24.5%
SG&A -2,510,437 -2,307,080 8.8% -5,074,179 -4,593,834 10.5%
% of Net Revenues -18.9% -19.4% -18.9% -19.3%
Depreciation and Amortization -245,382 -221,982 10.5% -494,328 -420,750 17.5%
% of Net Revenues -1.8% -1.9% -1.8% -1.8%
Total SG&A -2,755,819 -2,529,062 9.0% -5,568,507 -5,014,584 11.0%
% of Net Revenues -20.8% -21.3% -20.8% -21.0%
Recurring Operating Income (ROI) 813,528 473,980 71.6% 1,238,787 817,051 51.6%
% of Net Revenues 6.1% 4.0% 4.6% 3.4%
Non - Recurring income and expenses -192,294 -131,123 46.7% -197,180 -216,619 -9.0%
% of Net Revenues -1.4% -1.1% -0.7% -0.9%
Operating Income (EBIT) 621,235 342,858 81.2% 1,041,608 600,433 73.5%
% of Net Revenues 4.7% 2.9% 3.9% 2.5%
Net Financial Income -280,043 -320,761 -12.7% -560,099 -563,548 -0.6%
% of Net Revenues -2.1% -2.7% -2.1% -2.4%
Income from associates & joint ventures -12,946 17,814 N/A -33,283 36,979 N/A
% of Net Revenues -0.1% 0.2% -0.1% 0.2%
EBT 328,246 39,911 N/A 448,226 73,864 N/A
% of Net Revenues 2.5% 0.3% 1.7% 0.3%
Income Tax -42,200 -48,935 -13.8% -95,473 -43,225 N/A
% of Net Revenues -0.3% -0.4% -0.4% -0.2%
Net Income 286,046 -9,024 N/A 352,753 30,639 N/A
% of Net Revenues 2.2% -0.1% 1.3% 0.1%
Net Income of discontinued operations -6,468 -408,538 -98.4% 116,707 -522,052 N/A
% of Net Revenues 0.0% -3.4% 0.4% -2.2%
Non-controlling interests -210,315 369,109 N/A -407,790 443,720 N/A
% of Net Revenues -1.6% 3.1% -1.5% 1.9%
Net income Group Share 69,263 -48,453 N/A 61,670 -47,693 N/A
% of Net Revenues 0.5% -0.4% 0.2% -0.2%
Recurring EBITDA 1,058,910 695,962 52.2% 1,733,115 1,237,801 40.0%
% of Net Revenues 8.0% 5.9% 6.5% 5.2%
EBITDA 866,617 564,840 53.4% 1,535,936 1,021,183 50.4%
% of Net Revenues 6.5% 4.8% 5.7% 4.3%
Consolidated Income Statement

21
2. Consolidated Balance Sheet
Consolidated Balance Sheet Jun 2017 Dec 2016 Var %
ASSETS 58,625,795 62,497,566 -6.2%
Current Assets 28,157,876 32,644,699 -13.7%
Cash & Cash Equivalents 3,366,152 6,117,844 -45.0%
Inventories 5,749,105 5,778,173 -0.5%
Accounts receivable 1,001,444 1,132,750 -11.6%
Assets for taxes 608,039 891,790 -31.8%
Non-current assets held for sale 17,057,663 18,429,787 -7.4%
Others 375,473 294,355 27.6%
Non-current Assets 30,467,919 29,852,867 2.1%
Goodwill 5,668,921 5,616,136 0.9%
Other intangible assets 5,644,537 5,663,422 -0.3%
Property, plant and equipment 12,096,870 12,256,656 -1.3%
Investment Properties 1,945,025 1,843,593 5.5%
Investments in associates and JVs 925,629 1,068,087 -13.3%
Deferred tax assets 1,560,137 1,456,866 7.1%
Assets for taxes 1,178,457 581,947 102.5%
Others 1,448,343 1,366,160 6.0%
Consolidated Balance Sheet Jun 2017 Dec 2016 Var %
LIABILITIES 38,914,310 43,386,357 -10.3%
Current Liabilities 25,734,562 30,870,203 -16.6%
Trade Payables 8,936,032 11,537,028 -22.5%
Borrowing-Short Term 2,709,147 2,963,111 -8.6%
Other financial liabilities 199,847 805,413 -75.2%
Non-current liabilities held for sale 13,000,072 14,592,207 -10.9%
Liabillities for taxes 425,948 320,023 33.1%
Others 463,516 652,421 -29.0%
Non-current Liabilities 13,179,748 12,516,154 5.3%
Trade Payables 52,560 42,357 24.1%
Borrowing-Long Term 4,151,335 4,354,879 -4.7%
Other provisions 2,448,618 2,706,629 -9.5%
Deferred tax liabilities 2,905,416 2,965,586 -2.0%
Liabillities for taxes 723,728 502,452 44.0%
Others 2,898,091 1,944,251 49.1%
Shareholder´s Equity 19,711,485 19,111,209 3.1%
Non-controlling interests 11,856,099 11,389,522 4.1%
Shareholder´s Equity 7,855,386 7,721,687 1.7%
22
3. Consolidated Cash Flow
4. Debt by Country- Currency and Maturity
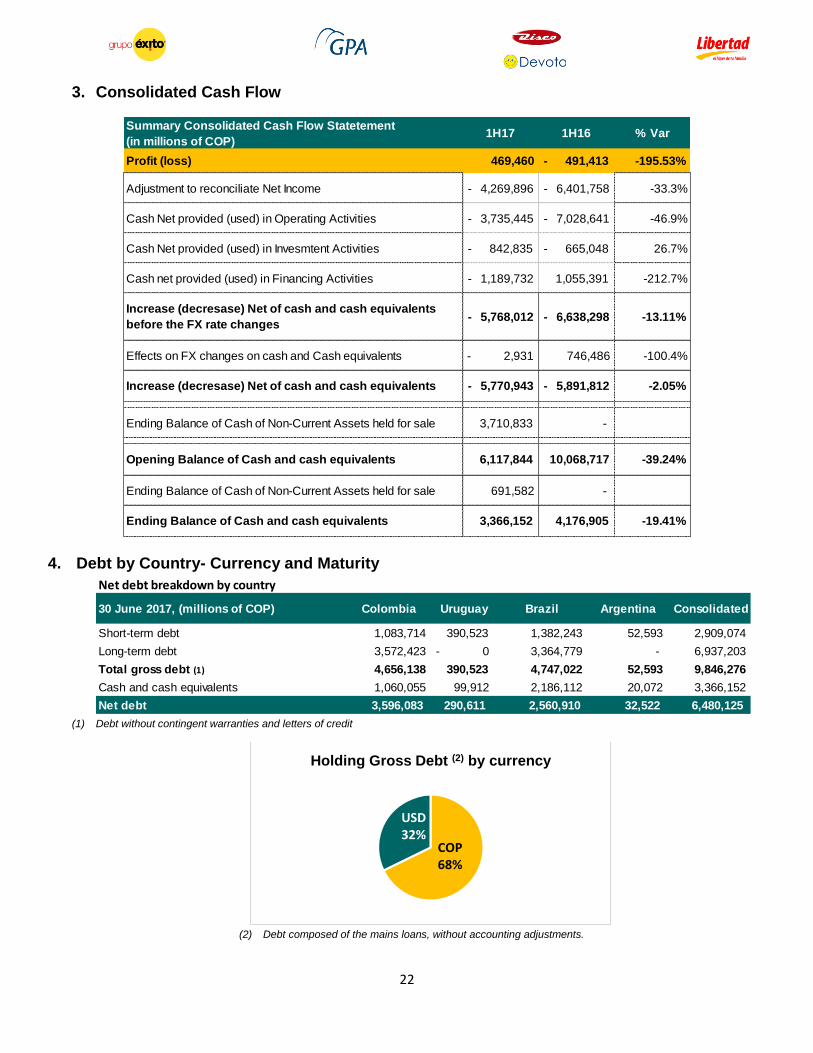
(1) Debt without contingent warranties and letters of credit
(2) Debt composed of the mains loans, without accounting adjustments.
Summary Consolidated Cash Flow Statetement
(in millions of COP)1H17 1H16 % Var
Profit (loss) 469,460 - 491,413 -195.53%
Adjustment to reconciliate Net Income - 4,269,896 - 6,401,758 -33.3%
Cash Net provided (used) in Operating Activities - 3,735,445 - 7,028,641 -46.9%
Cash Net provided (used) in Invesmtent Activities - 842,835 - 665,048 26.7%
Cash net provided (used) in Financing Activities - 1,189,732 1,055,391 -212.7%
Increase (decresase) Net of cash and cash equivalents
before the FX rate changes- 5,768,012 - 6,638,298 -13.11%
Effects on FX changes on cash and Cash equivalents - 2,931 746,486 -100.4%
Increase (decresase) Net of cash and cash equivalents - 5,770,943 - 5,891,812 -2.05%
Ending Balance of Cash of Non-Current Assets held for sale 3,710,833 -
Opening Balance of Cash and cash equivalents 6,117,844 10,068,717 -39.24%
Ending Balance of Cash of Non-Current Assets held for sale 691,582 -
Ending Balance of Cash and cash equivalents 3,366,152 4,176,905 -19.41%
Net debt breakdown by country
30 June 2017, (millions of COP) Colombia Uruguay Brazil Argentina Consolidated
Short-term debt 1,083,714 390,523 1,382,243 52,593 2,909,074
Long-term debt 3,572,423 - 0 3,364,779 - 6,937,203
Total gross debt (1) 4,656,138 390,523 4,747,022 52,593 9,846,276
Cash and cash equivalents 1,060,055 99,912 2,186,112 20,072 3,366,152
Net debt 3,596,083 290,611 2,560,910 32,522 6,480,125
COP68%
USD32%
Holding Gross Debt (2) by currency

23
Holding Gross debt by maturity
5. P&L and Capex by Country
Note: Consolidated figures include eliminations and adjustments
30 June 2017, (millions of COP)Nominal
amount (3)
Nature of
interest
rate
Maturity Date 30/06/2017 (3)
Long term 1,850,000 Floating August 2025 1,655,010
Mid term COP 838,000 Floating December 2020 838,000
Mid term - Bilateral 158,380 Fixed April 2019 158,380
Mid term USD 1,367,217 Floating December 2018 1,367,217
Revolving credit facility - Syndicated 500,000 Floating August 2018 300,000
Revolving credit facility - Bilateral 100,000 Floating August 2018 100,000
Short term - Bilateral USD 82,033 Floating August 2017 (4) 82,033
Total gross debt 4,895,630 4,500,640
(3) The loans in USD were converted to COP using the Central Bank's closing exchange rate as of june 30th, 2017 (3,038,26)
(4) With option to extend up to 18 months
Colombia Brazil Uruguay Argentina Consolidated
In COP M 2Q17 2Q17 2Q17 2Q17 2Q17
Net Revenues 2,643,235 9,687,902 610,101 330,401 13,267,721
Gross Profit 647,472 2,614,471 201,965 106,307 3,569,347
% Net Revenues 24.5% 27.0% 33.1% 32.2% 26.9%
SG&A Expenses -524,148 -1,727,062 -162,588 -97,507 -2,510,437
% Net Revenues -19.8% -17.8% -26.6% -29.5% -18.9%
Depreciation and Amortization -61,021 -174,163 -6,163 -4,035 -245,382
Total SG&A -585,169 -1,901,225 -168,751 -101,542 -2,755,819
% Net Revenues -22.1% -19.6% -27.7% -30.7% -20.8%
Recurring Operating Income 62,303 713,246 33,214 4,765 813,528
% Net Revenues 2.4% 7.4% 5.4% 1.4% 6.1%
Non-Recurring Income and Expenses -16,832 -176,834 382 990 -192,294
Operating Income (EBIT) 45,471 536,412 33,596 5,756 621,235
% Net Revenues 1.7% 5.5% 5.5% 1.7% 4.7%
Recurring EBITDA 123,324 887,409 39,377 8,800 1,058,910
% Net Revenues 4.7% 9.2% 6.5% 2.7% 8.0%
Non- Recurring EBITDA 106,492 710,575 39,759 9,791 866,617
% Net Revenues 4.0% 7.3% 6.5% 3.0% 6.5%
Net Financial Income -104,818 -171,197 2,223 -6,251 -280,043
CAPEX
In COP 84,703 293,179 11,723 9,913 399,519
In Local Currency 84,703 319 114 53

24
6. SOTP Analysis
7. Almacenes Éxito P&L
Quarterly Net Revenues decreased by 1.9% in 2Q17 and by 2.2% in 1H17. Net sales reflected the weak
consumption and the inflation deceleration trend especially in food (14.3% in 2Q16 to 1.4% in 2Q17). Other
revenues represented 3.5% as percentage of Net Revenues in 2Q17 and posted a 9.2% increase mainly stemmed
from the strong performance of the real estate business.
Gross Margin levels benefited by efforts to improve productivity mainly from lower shrinkage levels and higher
contribution of real estate that were offset by a non-comparable basis derived from an asset sale and a fee paid to
Éxito in 2Q16 from the cancelation of the agreement with Ripley. Besides, revenues from the financial business have
reduced significantly versus last year, reflecting the country´s weak consumption and indebtedness trend YTD.
(COP Million)LTM net
revenues(1)
LTM recurring
EBITDALTM ROI
Net debt (Last
quarter)(2) Éxito stakeMarket Value of
the Stake(3)
Colombia 11,321,710 752,847 515,354 -3,596,083 100%
Brazil 43,924,220 2,492,019 1,764,465 -2,560,910 18.71% 2,990,040
Uruguay 2,515,676 189,995 167,614 -290,611 62.5%-100%(4)
Argentina 1,404,714 66,123 51,356 -32,522 100%
Total 59,166,320 3,500,984 2,498,789 -6,480,125
(1) Does not include Intercompany eliminations
(2) Gross Debt (Without contigent warranties and letters of credit) - Cash
(3) Market Capitalization of GPA as at 30/06/2017
(4) Éxito Owns 100% of Devoto and 62.5% of Disco
2Q17 2Q16 1H17 1H16
In COP M In COP M 2Q17/16 In COP M In COP M 1H17/1H16
Net Revenues 2,593,084 2,643,907 -1.9% 5,242,734 5,360,356 -2.2%
Gross Profit 607,741 642,367 -5.4% 1,252,335 1,278,932 -2.1%
Gross Margin 23.4% 24.3% 23.9% 23.9%
SG&A expenses -579,511 -535,536 8.2% -1,152,033 -1,084,970 6.2%
SG&A/Net Revenues -22.3% -20.3% -22.0% -20.2%
Recurring Operating Income 28,230 106,831 -73.6% 100,302 193,962 -48.3%
Recurring Operating margin 1.1% 4.0% 1.9% 3.6%
Operating Income (Ebit) 15,394 109,487 -85.9% 52,940 137,083 -61.4%
Operating margin 0.6% 4.1% 1.0% 2.6%
Net Income 69,263 -45,635 N/A 61,670 -44,688 N/A
Net margin 2.7% -1.7% 1.2% -0.8%
Recurring EBITDA 81,155 165,140 -50.9% 206,787 306,477 -32.5%
Recurring EBITDA margin 3.1% 6.2% 3.9% 5.7%
EBITDA 68,319 167,796 -59.3% 159,425 249,598 -36.1%
EBITDA margin 2.6% 6.3% 3.0% 9.4%

25
SG&A expenses reflected higher inflation in 2016 (5.75%) versus the trend YTD (3.99%) that affected the base of
expenses in 2017 as well as the minimum wage increase above inflation of 7%.
Recurring Operating Margin and Recurring EBITDA margin reflected the weak top line performance and higher
expenditure levels derived from an inflation deceleration.
8. Almacenes Éxito Balance Sheet
Balance Sheet Jun 2017 Dec 2016 Var %
ASSETS 15,451,280 15,450,108 0.0%
Current Assets 2,503,470 2,695,276 -7.1%
Cash & Cash Equivalents 894,349 1,098,825 -18.6%
Inventories 1,217,439 1,077,659 13.0%
Accounts receivable 145,195 183,330 -20.8%
Assets for taxes 85,561 191,292 -55.3%
Others 160,926 144,170 11.6%
Non-current Assets 12,947,810 12,754,832 1.5%
Goodwill 1,453,077 1,453,077 0.0%
Other intangible assets 165,809 174,413 -4.9%
Property, plant and equipment 2,444,465 2,497,016 -2.1%
Investment Properties 418,939 312,047 34.3%
Investments in associates and JVs 8,358,085 8,207,810 1.8%
Others 107,435 110,469 -2.7%
Balance Sheet Jun 2017 Dec 2016 Var %
LIABILITIES 7,595,894 7,728,421 -1.7%
Current Liabilities 3,909,989 3,930,675 -0.5%
Trade Payables 2,430,372 2,968,282 -18.1%
Borrowing-Short Term 1,029,832 469,362 119.4%
Other financial liabilities 33,667 87,457 -61.5%
Liabillities for taxes 38,115 43,920 -13.2%
Others 378,003 361,654 4.5%
Non-current Liabilities 3,685,905 3,797,746 -2.9%
Trade Payables 3,502,533 3,499,454 0.1%
Other provisions 21,240 23,093 -8.0%
Deferred tax liabilities 75,027 201,049 -62.7%
Others 87,105 74,150 17.5%
Shareholder´s Equity 7,855,386 7,721,687 1.7%
26
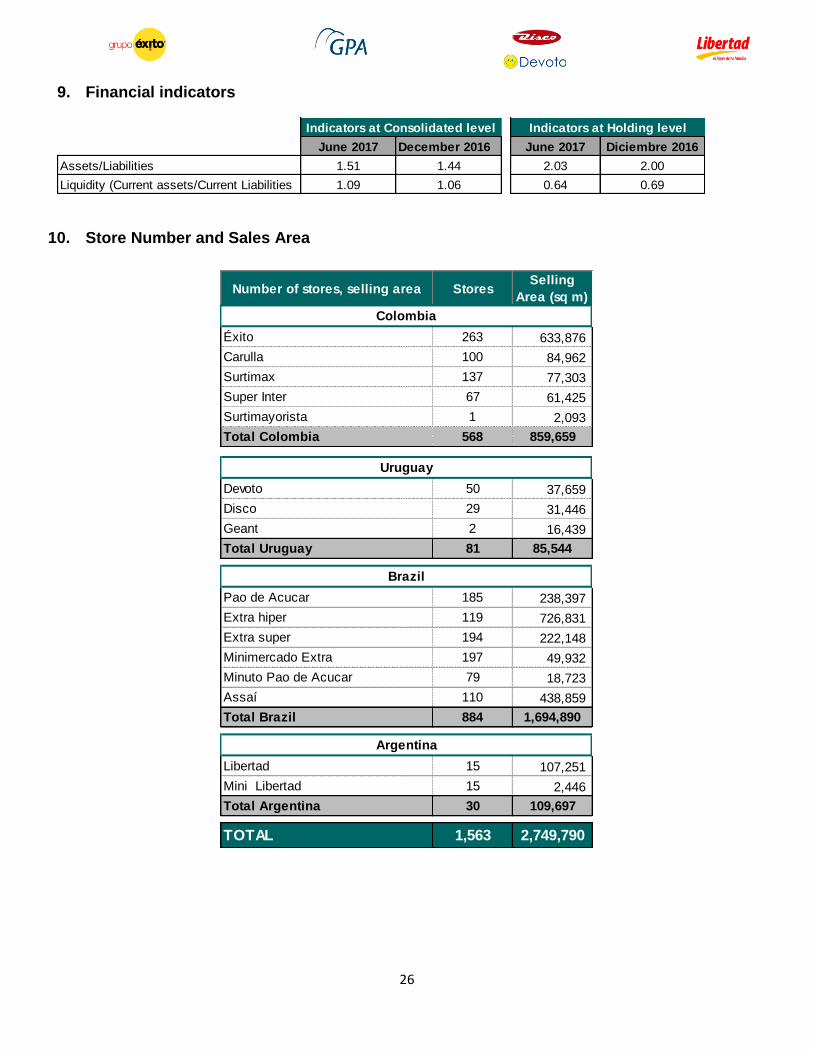
9. Financial indicators
10. Store Number and Sales Area
June 2017 December 2016 June 2017 Diciembre 2016
Assets/Liabilities 1.51 1.44 2.03 2.00
Liquidity (Current assets/Current Liabilities 1.09 1.06 0.64 0.69
Indicators at Consolidated level Indicators at Holding level
Number of stores, selling area StoresSelling
Area (sq m)
Éxito 263 633,876
Carulla 100 84,962
Surtimax 137 77,303
Super Inter 67 61,425
Surtimayorista 1 2,093
Total Colombia 568 859,659
Devoto 50 37,659
Disco 29 31,446
Geant 2 16,439
Total Uruguay 81 85,544
Pao de Acucar 185 238,397
Extra hiper 119 726,831
Extra super 194 222,148
Minimercado Extra 197 49,932
Minuto Pao de Acucar 79 18,723
Assaí 110 438,859
Total Brazil 884 1,694,890
Libertad 15 107,251
Mini Libertad 15 2,446
Total Argentina 30 109,697
TOTAL 1,563 2,749,790
Colombia
Uruguay
Brazil
Argentina
27
Note on Forward-Looking Statements
This document contains certain forward-looking statements. This information is not historical data and should
not be interpreted as guarantees of the future occurrence of such facts and data.
These statements are based on data, assumptions and estimates that the Group believes are reasonable.
The Group operates in a competitive and rapidly changing environment. It is therefore not in a position to
predict all of the risks, uncertainties or other factors that may affect its business, their potential impact on its
business, or the extent to which the occurrence of a risk or a combination of risks could have results that are
significantly different from those included in any forward-looking statement.
The forward-looking statements contained in this document are made only as of the date hereof. Except as
required by any applicable law, rules or regulations, the Group expressly disclaims any obligation or
undertaking to publicly release any updates of any forward‐looking statements contained in this press release
to reflect any change in its expectations or any change in events, conditions or circumstances on which any
forward-looking statement contained in this press release is based.
******
.
“The Issuers Recognition -IR granted by the Colombian Stock Exchange is not a
certification about the quality of the securities listed at the BVC nor the solvency of
the issuer”.