allied irish banks, p.l.c
DESCRIPTION
Allied Irish Banks, p.l.c. Forward looking statements. - PowerPoint PPT PresentationTRANSCRIPT
Allied Irish Banks, p.l.c.
Slide 2
A number of statements we will be making in our presentation and in the accompanying slides will not be based on historical fact, but will be “forward-looking” statements within the meaning of the United States Private Securities Litigation Reform Act of 1995. Actual results may differ materially from those projected in the forward looking statements. Factors that could cause actual results to differ materially from those in the forward looking statements include, but are not limited to, global, national and regional economic conditions, levels of market interest rates, credit or other risks of lending and investment activities, competitive and regulatory factors and technology change. Any ‘forward-looking statements made by or on behalf of the Group speak only as of the date they are made.
visit www.aibgroup.com/investorrelations
Forward looking statements

Slide 3
David HodgkinsonExecutive Chairman
Slide 4
Agenda
Overview
2010 Financial Summary
Outline of Restructuring Plan and Strategic Review
Slide 5
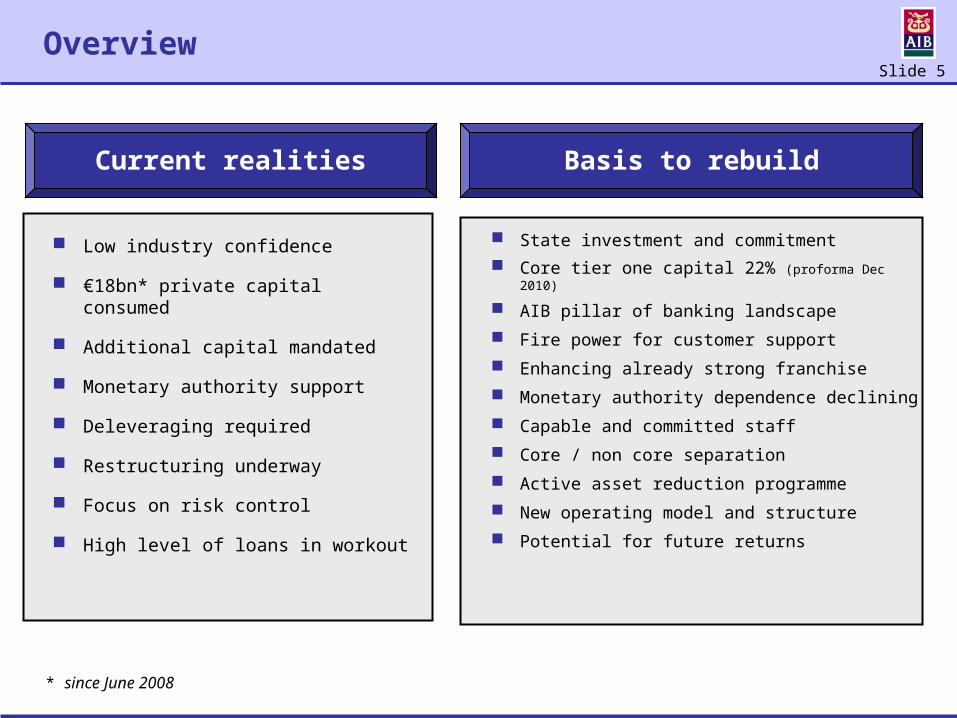
Overview
Low industry confidence
€18bn* private capital consumed
Additional capital mandated
Monetary authority support
Deleveraging required
Restructuring underway
Focus on risk control
High level of loans in workout
State investment and commitment Core tier one capital 22% (proforma Dec 2010)
AIB pillar of banking landscape
Fire power for customer support
Enhancing already strong franchise
Monetary authority dependence declining
Capable and committed staff
Core / non core separation
Active asset reduction programme
New operating model and structure
Potential for future returns
* since June 2008
Current realities Basis to rebuild
Slide 6
AIB’s vision
Fulfil a key role in the recovery and development of the Irish economy
Restore AIB to a sustainable position of stand-alone strength and stability with the capacity to grow in a measured and prudent manner
Redefine customer proposition to meet their needs and expectations
Strengthen our controls, governance and approach to risk
Deliver these goals with new leadership and a reinvigorated workforce of skilled, engaged and accountable people
Ultimately generate a return to our shareholders enabling a return to private ownership
Slide 7
Necessary steps to achieve our vision
Most challenging change programme AIB has ever undertaken; necessary to fulfil responsibilities to our stakeholders and customers
Separate €86bn net loans into core bank c. €61bn and newly established non-core bank c. €25bn (non-core to include performing loans not of strategic relevance)
Pursue a controlled deleveraging plan to run down the non-core bank over time, achieving a consolidated loan to deposit ratio of 122.5% by year end 2013 (core bank 115%)
Restructure operations to better align our business with our customers
Get back to business as usual
Significantly reduce the cost base in line with the new operating model to ensure financial viability over the medium term
Identify new leadership and foster cultural change
Slide 8
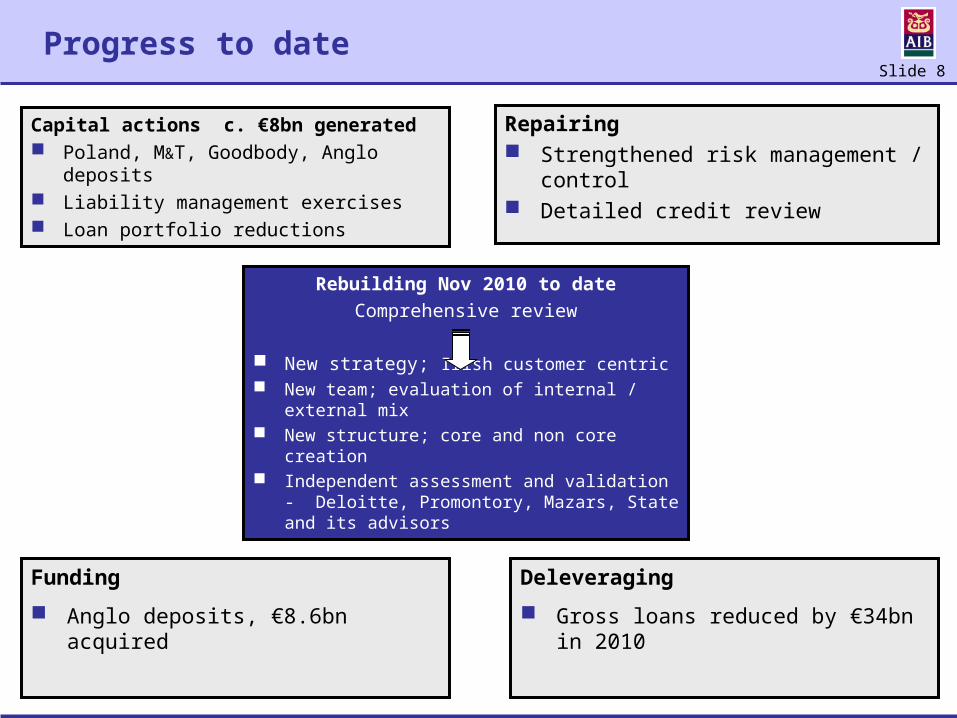
Progress to date
Capital actions c. €8bn generated Poland, M&T, Goodbody, Anglo deposits Liability management exercises Loan portfolio reductions
Funding
Anglo deposits, €8.6bn acquired
Rebuilding Nov 2010 to dateComprehensive review
New strategy; Irish customer centric New team; evaluation of internal / external mix New structure; core and non core creation Independent assessment and validation
- Deloitte, Promontory, Mazars, State and its advisors
Repairing Strengthened risk management / control Detailed credit review
Deleveraging
Gross loans reduced by €34bn in 2010

Slide 9
PCAR / PLAR – implications for AIB
Increased capital requirement
Net core loans €61bn, non-core loans €25bn c. €20bn deleveraging, loan / deposit ratio
of 122.5% by Dec 2013
AIB to merge with EBS Good customer base
Positive early engagement
Details to be agreed
€bnEquity 6.3Capital buffer 1.4Contingent capital 1.4
9.1Capital deferred since Feb 4.2Total 13.3
State commitment €7.2bn already invested
Early achievement of capital requirement
Highly conservative approach AIB will be very strongly capitalised
Customer support capability
Slide 10
Bernard Byrne, Chief Financial OfficerBernard Byrne
Chief Financial Officer
2010 Financial Summary

Slide 11
Basis of Presentation
Except where stated, the commentary in this presentation is on a continuing operations basis which constitute the businesses AIB will
continue to operate following business disposals.
In 2010 these continuing businesses comprised the following divisions: AIB Bank RoI, Capital Markets, AIB Bank UK and Group.
Slide 12
2010 overview
Extremely difficult year, loss after tax of c. €10.4bn
Irish economic environment and sentiment further deteriorated in H2
Materially influenced our assessment of asset quality; higher bad debt charges were required
AIB’s capital requirement increased significantly following regulatory reviews and increased discounts on loans transferring to NAMA
Elevated market concerns about Ireland and its banking sector
Reduction in customer deposits; wholesale funding sources mainly confined to monetary authorities
Slide 13
Dec* Dec* €bn 2010 2009
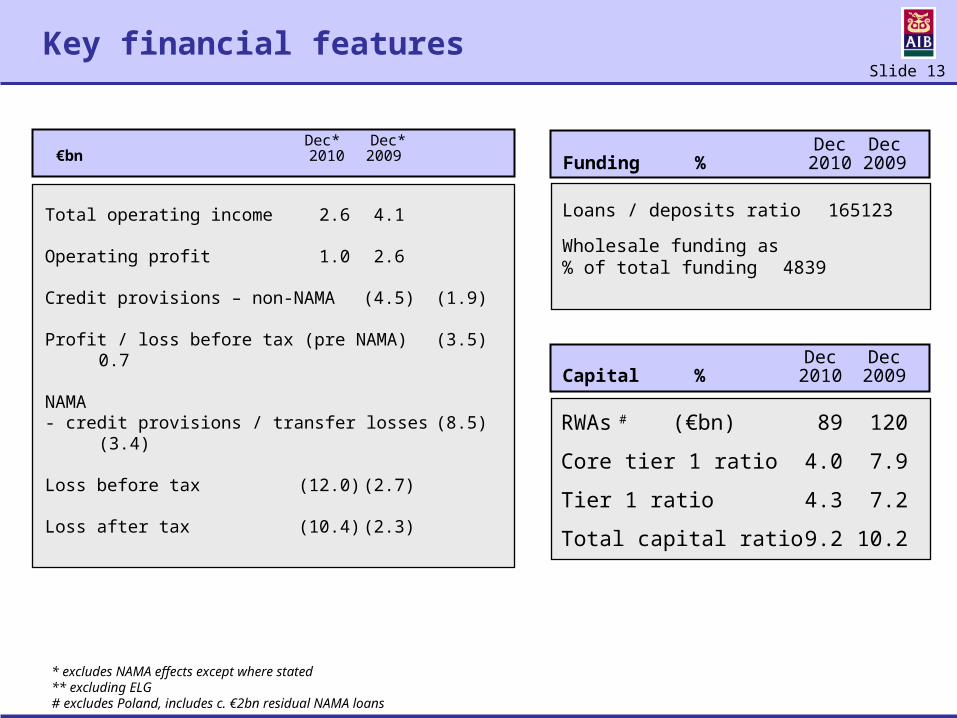
Key financial features
Total operating income 2.6 4.1
Operating profit 1.0 2.6
Credit provisions – non-NAMA (4.5) (1.9)
Profit / loss before tax (pre NAMA) (3.5) 0.7
NAMA- credit provisions / transfer losses (8.5) (3.4)
Loss before tax (12.0) (2.7)
Loss after tax (10.4) (2.3)
Dec DecFunding % 2010 2009
Loans / deposits ratio 165 123
Wholesale funding as % of total funding 48 39
RWAs # (€bn) 89 120
Core tier 1 ratio 4.0 7.9
Tier 1 ratio 4.3 7.2
Total capital ratio 9.2 10.2
Dec DecCapital % 2010 2009
* excludes NAMA effects except where stated** excluding ELG# excludes Poland, includes c. €2bn residual NAMA loans
Slide 14
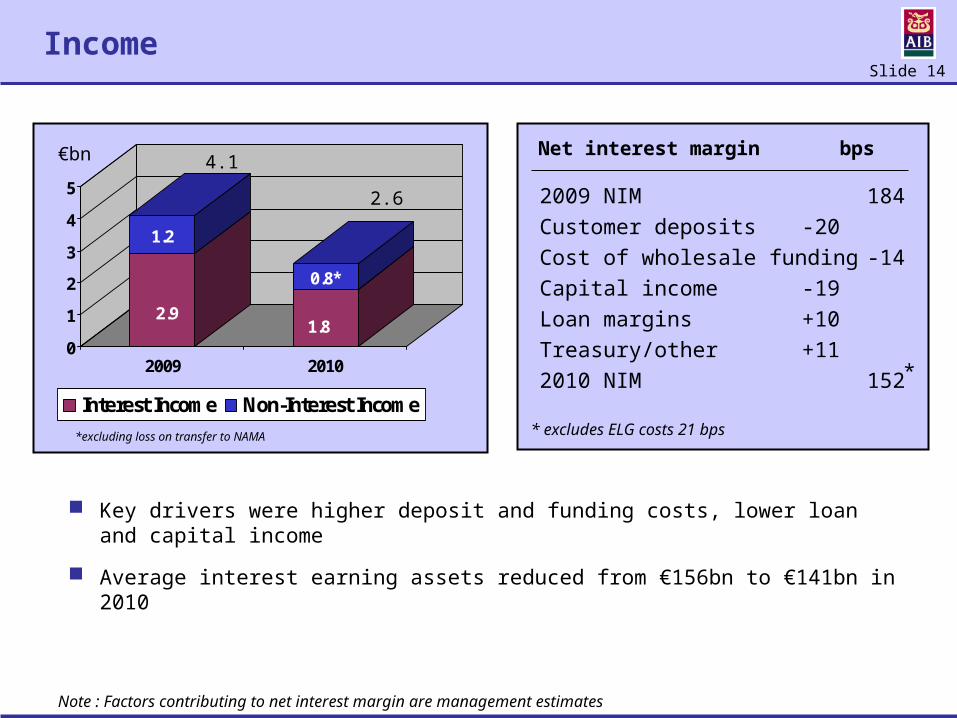
Income
2.9
1.2
1.8
0.8*
0
1
2
3
4
5
2009 2010
Interest Income Non-Interest Income
Key drivers were higher deposit and funding costs, lower loan and capital income
Average interest earning assets reduced from €156bn to €141bn in 2010
€bn
*excluding loss on transfer to NAMA * excludes ELG costs 21 bps
Net interest margin bps
*
4.1
2009 NIM 184Customer deposits -20Cost of wholesale funding -14Capital income -19Loan margins +10Treasury/other +112010 NIM 152
2.6
Note : Factors contributing to net interest margin are management estimates
Slide 15
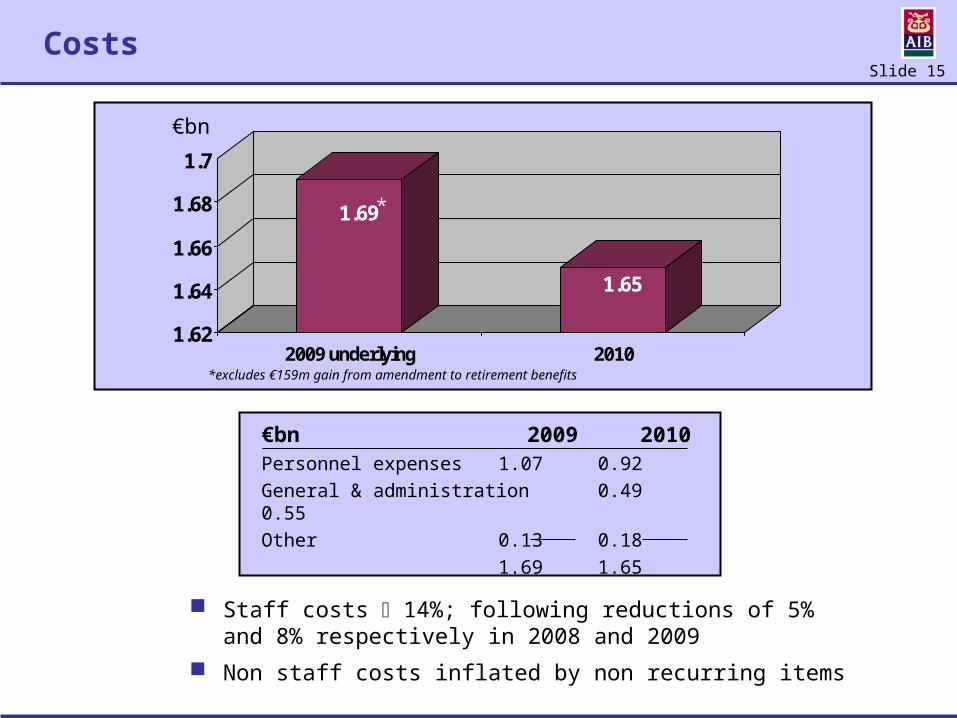
Costs
1.69
1.65
1.62
1.64
1.66
1.68
1.7
2009 underlying 2010
Personnel expenses 1.07 0.92General & administration 0.49 0.55Other 0.13 0.18
1.69 1.65
€bn
€bn 2009 2010
Staff costs 14%; following reductions of 5% and 8% respectively in 2008 and 2009
Non staff costs inflated by non recurring items
*excludes €159m gain from amendment to retirement benefits
*
Slide 16
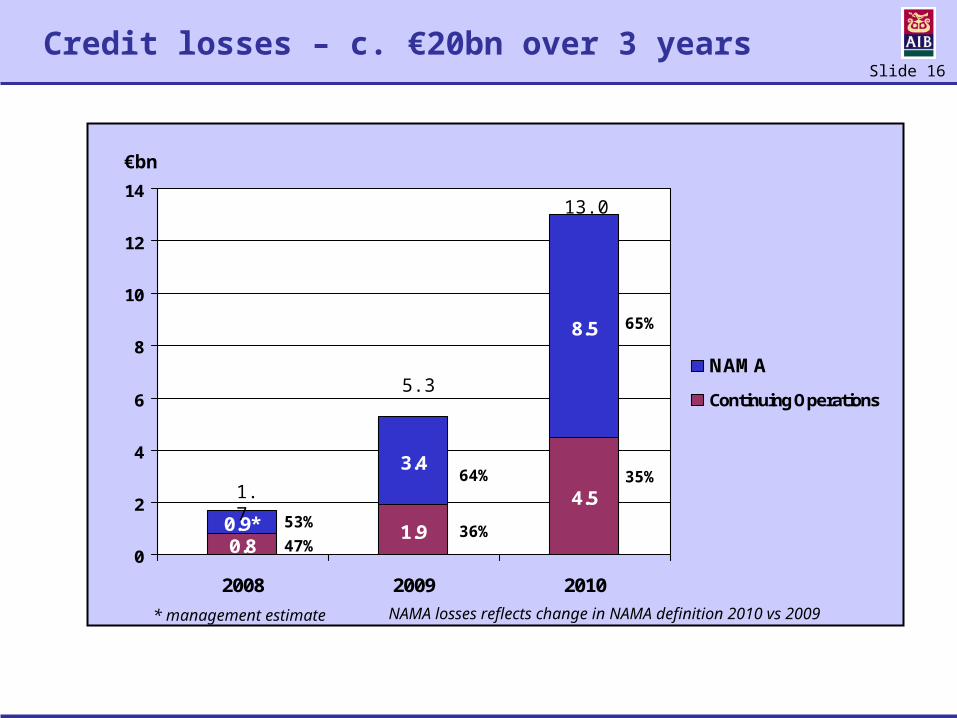
Credit losses – c. €20bn over 3 years
1.9
4.5
3.4
8.5
0.8 0.9*
0
2
4
6
8
10
12
14
2008 2009 2010
NAMA
Continuing Operations
€bn
1.7
5.3
13.0
47%53% 36%
64% 35%
65%
* management estimate NAMA losses reflects change in NAMA definition 2010 vs 2009
Slide 17
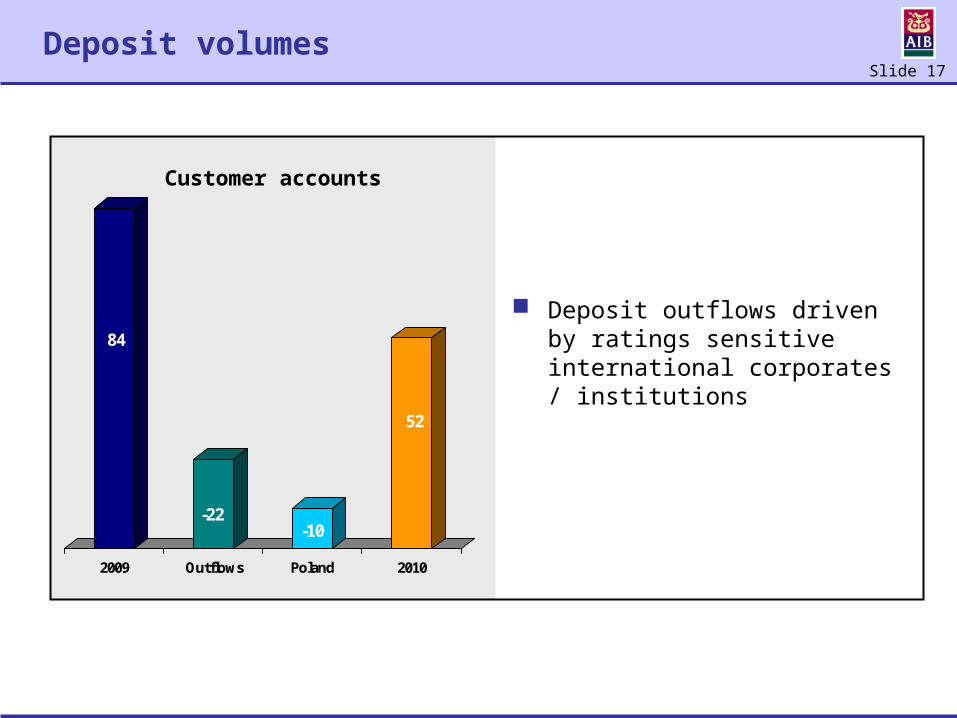
Deposit volumes
Deposit outflows driven by ratings sensitive international corporates / institutions
84
-22-10
52
2009 Outflows Poland 2010
Customer accounts
Slide 18
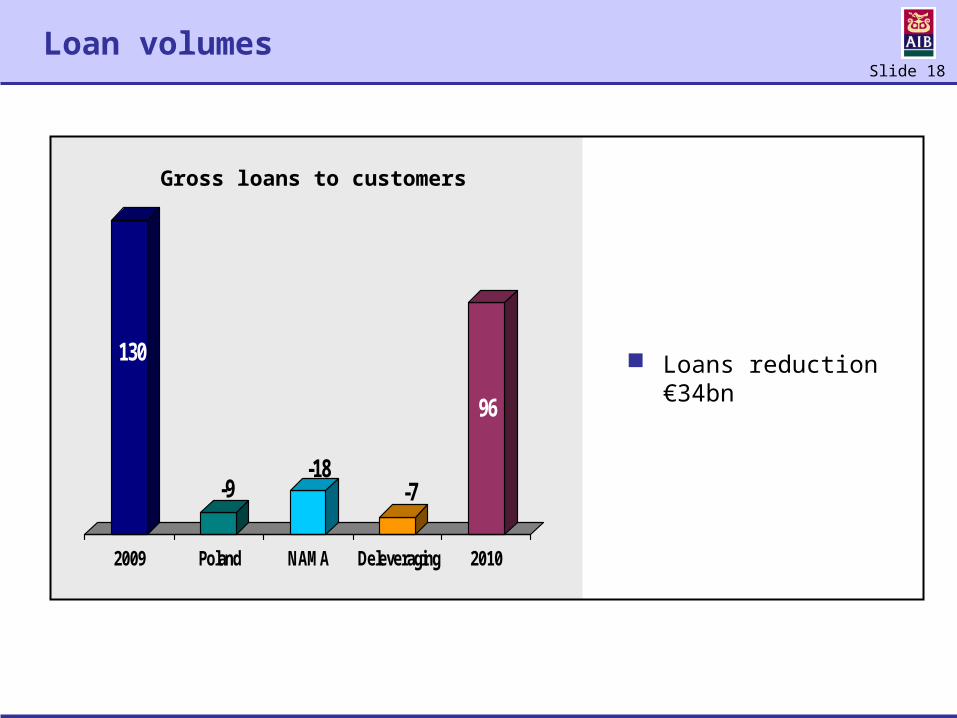
Loan volumes
130
-9-18
-7
96
2009 Poland NAMA Deleveraging 2010
Gross loans to customers
Loans reduction €34bn
Slide 19
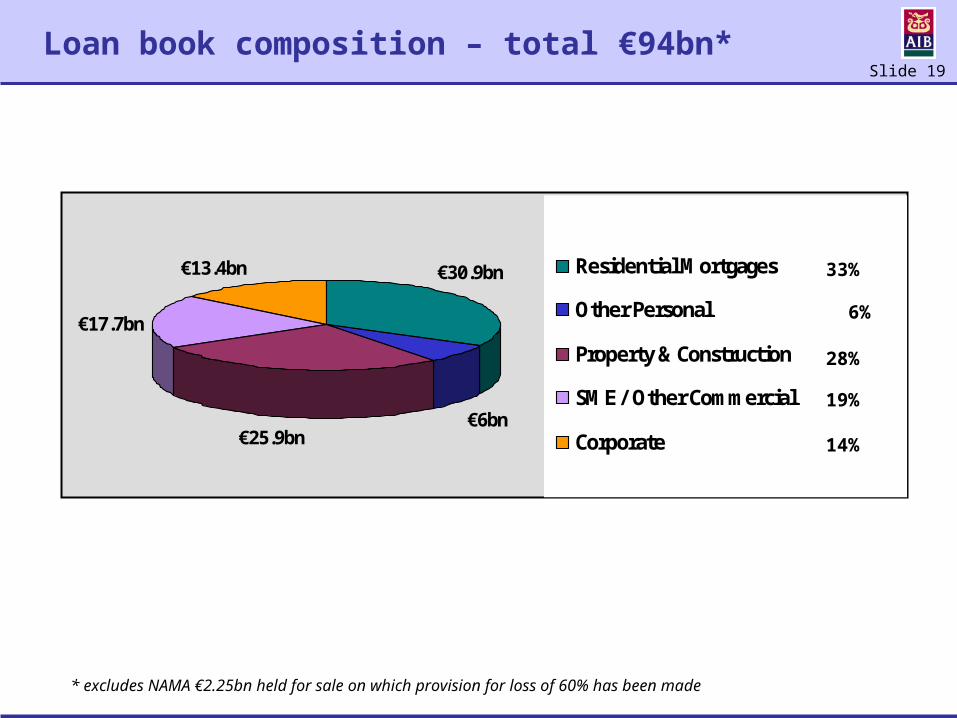
Loan book composition – total €94bn*
€25.9bn€6bn
€30.9bn€13.4bn
€17.7bn
Residential Mortgages
Other Personal
Property & Construction
SME / Other Commercial
Corporate
33%
6%
28%
14%
19%
* excludes NAMA €2.25bn held for sale on which provision for loss of 60% has been made
Slide 20
Provisions & PCAR loss forecasts
Provisions and PCAR loss forecasts are very different.
To comply with accounting rules (IFRS), AIB and other banks are required to make provisions on an “incurred” loss basis. This means that we provide for losses on loans that we have identified as impaired (specific provisions) and for loans that, based on current conditions, management consider have incurred losses not yet reported (IBNR provisions)
AIB and other banks are prohibited under the accounting rules from making provisions for “expected” losses. These are losses that may occur depending on future conditions
The Central Bank of Ireland estimated “expected” losses and requested banks to do their own estimates as part of the recent PCAR. Allowance for these losses is made
in the capital requirement mandated for banks by the Central Bank.
Slide 21
Criticised loans - definitions
Watch
Credit exhibiting weakness but with the expectation that existing debt can be fully repaid from normal cashflow
Vulnerable
Credit where repayment is in jeopardy from normal cash flow and may be dependent on other sources
Impaired
A loan is impaired if there is objective evidence of impairment as a result of one or more events that occurred after the initial recognition of the assets (a “loss event”) and that loss event (or events) has an impact such that the present value of future cash flows is less than the current carrying value of the financial asset or group of assets i.e. requires a provision to be raised through the income statement
Slide 22
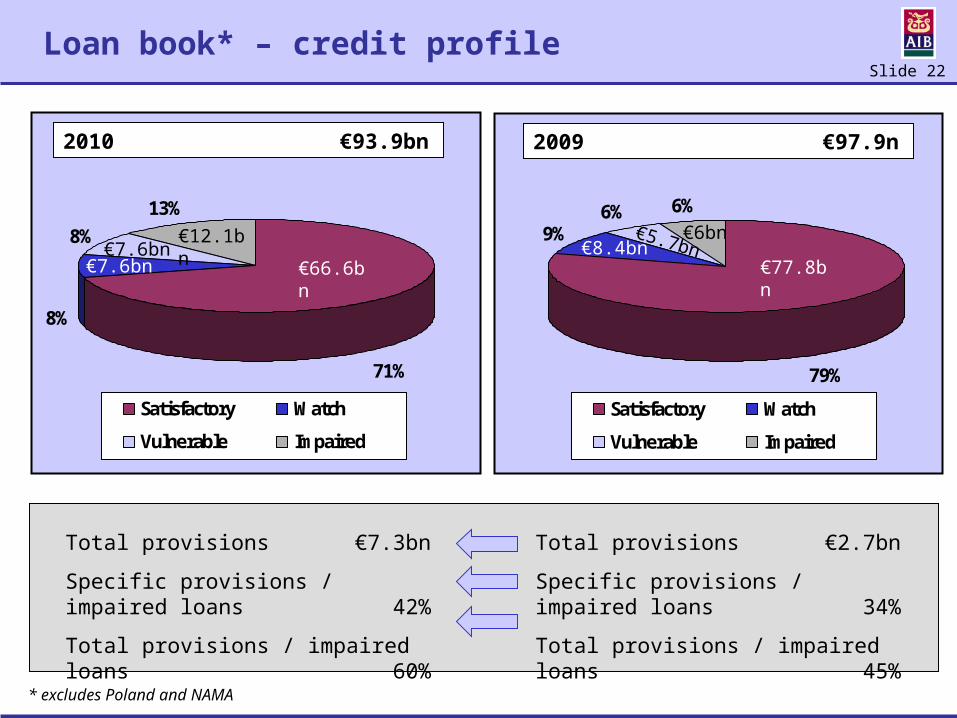
Loan book* – credit profile
8%
8%
71%
13%
Satisfactory Watch
Vulnerable Impaired
€66.6bn€7.6bn€7.6bn
€12.1bn
Total provisions €7.3bn
Specific provisions / impaired loans 42%
Total provisions / impaired loans 60%
2010 €93.9bn
9%6%
79%
6%
Satisfactory Watch
Vulnerable Impaired
€77.8bn€8.4bn
€5.7bn€6bn
Total provisions €2.7bn
Specific provisions / impaired loans 34%
Total provisions / impaired loans 45%
2009 €97.9n
* excludes Poland and NAMA
Slide 23
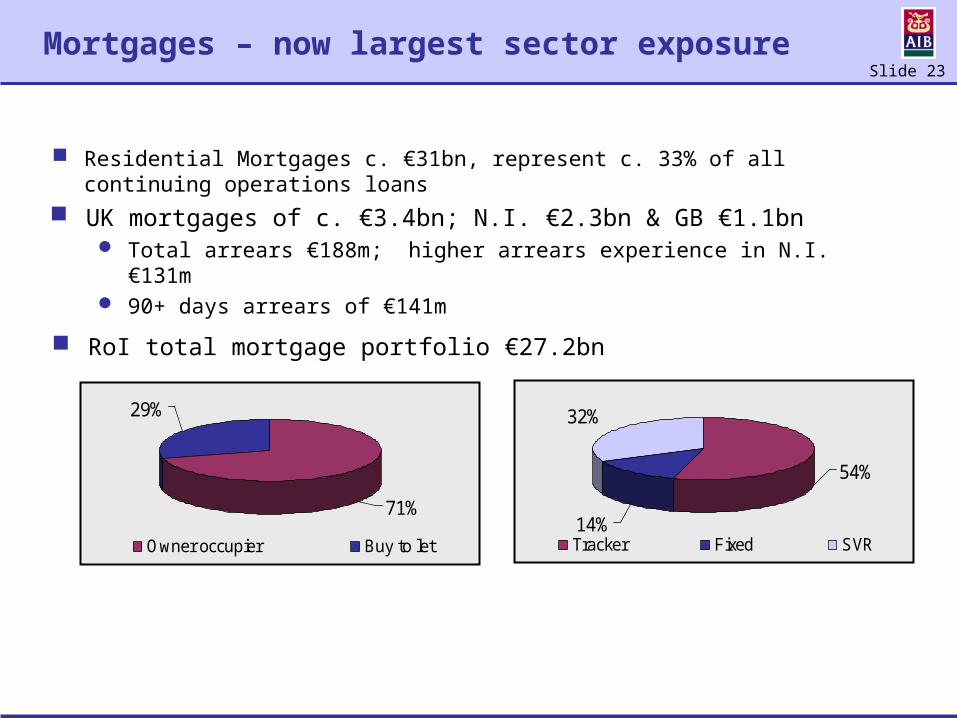
Mortgages – now largest sector exposure
Residential Mortgages c. €31bn, represent c. 33% of all continuing operations loans
RoI total mortgage portfolio €27.2bn
71%
29%
Owner occupier Buy to let
UK mortgages of c. €3.4bn; N.I. €2.3bn & GB €1.1bn Total arrears €188m; higher arrears experience in N.I. €131m 90+ days arrears of €141m
54%
32%
14%Tracker Fixed SVR
Slide 24
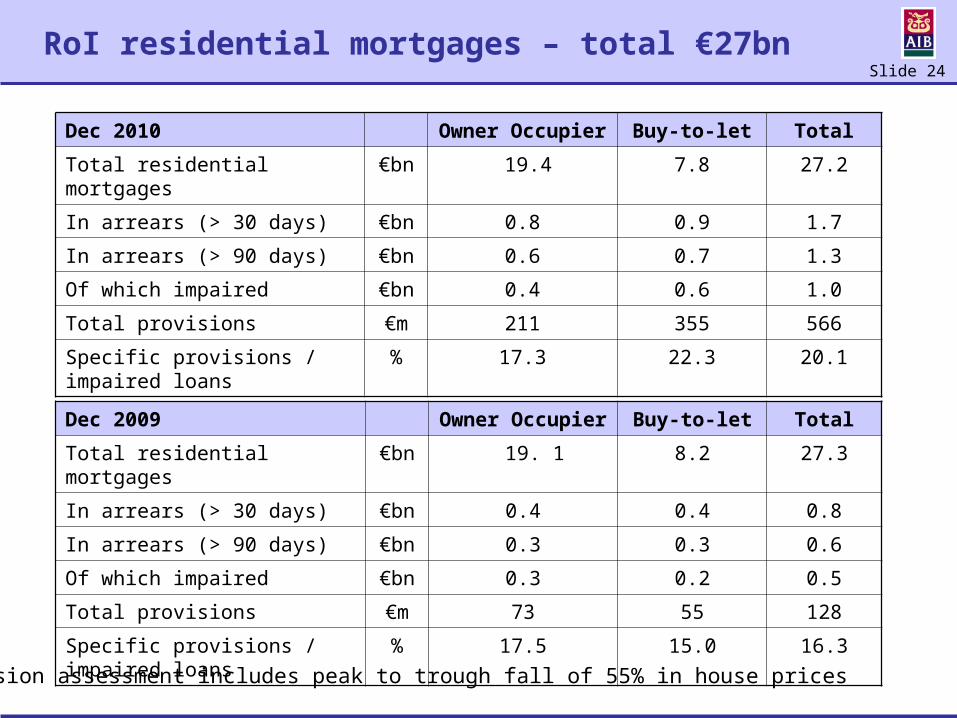
RoI residential mortgages – total €27bn
Dec 2009 Owner Occupier Buy-to-let Total
Total residential mortgages €bn 19. 1 8.2 27.3
In arrears (> 30 days) €bn 0.4 0.4 0.8
In arrears (> 90 days) €bn 0.3 0.3 0.6
Of which impaired €bn 0.3 0.2 0.5
Total provisions €m 73 55 128
Specific provisions / impaired loans % 17.5 15.0 16.3
Dec 2010 Owner Occupier Buy-to-let Total
Total residential mortgages €bn 19.4 7.8 27.2
In arrears (> 30 days) €bn 0.8 0.9 1.7
In arrears (> 90 days) €bn 0.6 0.7 1.3
Of which impaired €bn 0.4 0.6 1.0
Total provisions €m 211 355 566
Specific provisions / impaired loans % 17.3 22.3 20.1
Provision assessment includes peak to trough fall of 55% in house prices
Slide 25
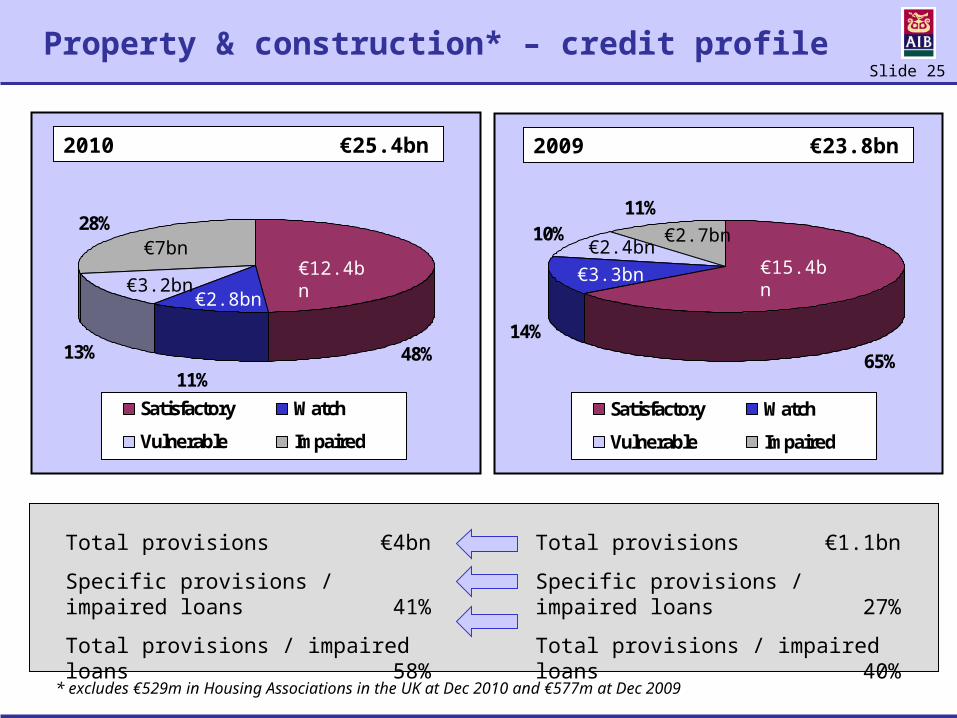
Property & construction* – credit profile
11%13% 48%
28%
Satisfactory Watch
Vulnerable Impaired
€12.4bn
€2.8bn€3.2bn
€7bn
Total provisions €4bn
Specific provisions / impaired loans 41%
Total provisions / impaired loans 58%
2010 €25.4bn
14%
10%
65%
11%
Satisfactory Watch
Vulnerable Impaired
€15.4bn€3.3bn€2.4bn
€2.7bn
Total provisions €1.1bn
Specific provisions / impaired loans 27%
Total provisions / impaired loans 40%
2009 €23.8bn
* excludes €529m in Housing Associations in the UK at Dec 2010 and €577m at Dec 2009
Slide 26
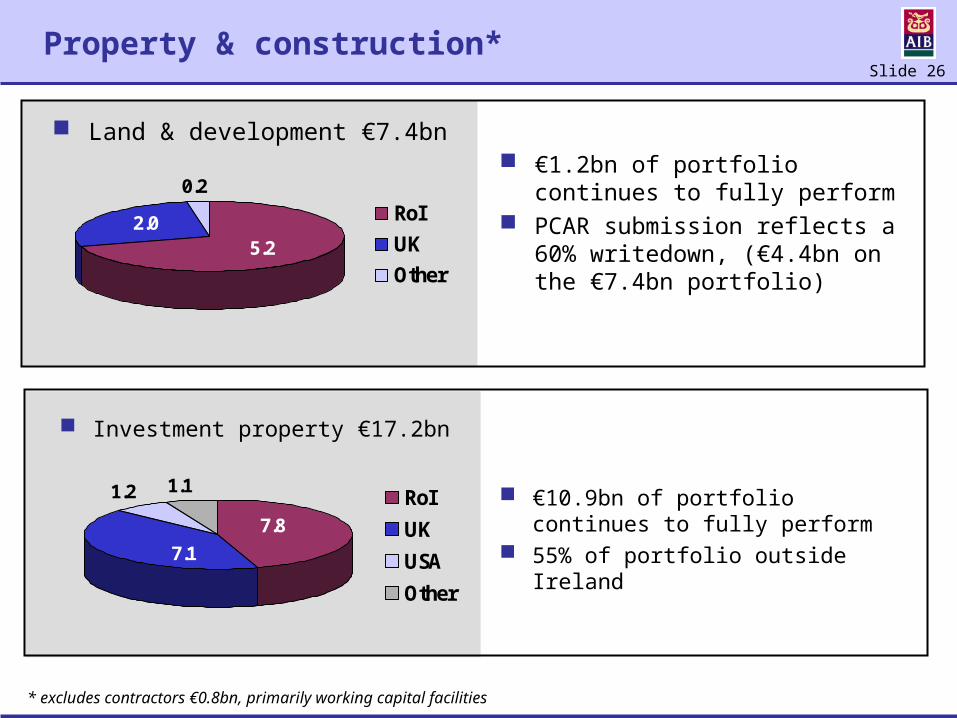
Property & construction*
0.2
2.05.2
RoIUKOther
€1.2bn of portfolio continues to fully perform
PCAR submission reflects a 60% writedown, (€4.4bn on the €7.4bn portfolio)
Land & development €7.4bn
1.2 1.1
7.17.8
RoI
UK
USA
Other
Investment property €17.2bn
€10.9bn of portfolio continues to fully perform
55% of portfolio outside Ireland
* excludes contractors €0.8bn, primarily working capital facilities
Slide 27
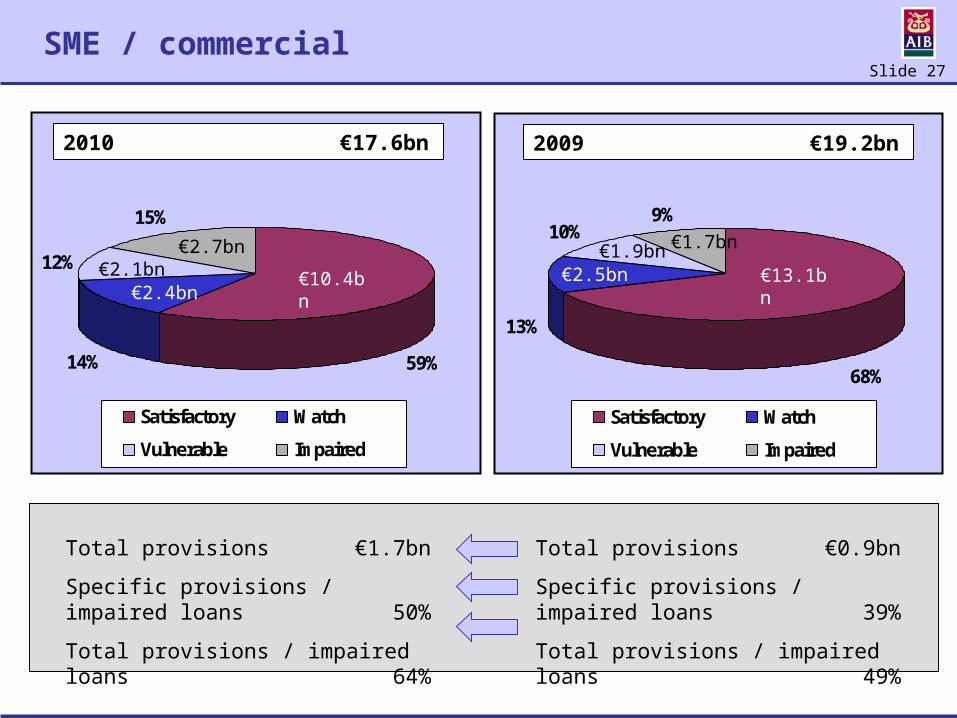
SME / commercial
14%
12%
59%
15%
Satisfactory Watch
Vulnerable Impaired
€10.4bn€2.4bn
€2.1bn€2.7bn
Total provisions €1.7bn
Specific provisions / impaired loans 50%
Total provisions / impaired loans 64%
2010 €17.6bn
13%
10%
68%
9%
Satisfactory Watch
Vulnerable Impaired
€13.1bn€2.5bn€1.9bn €1.7bn
Total provisions €0.9bn
Specific provisions / impaired loans 39%
Total provisions / impaired loans 49%
2009 €19.2bn
Slide 28
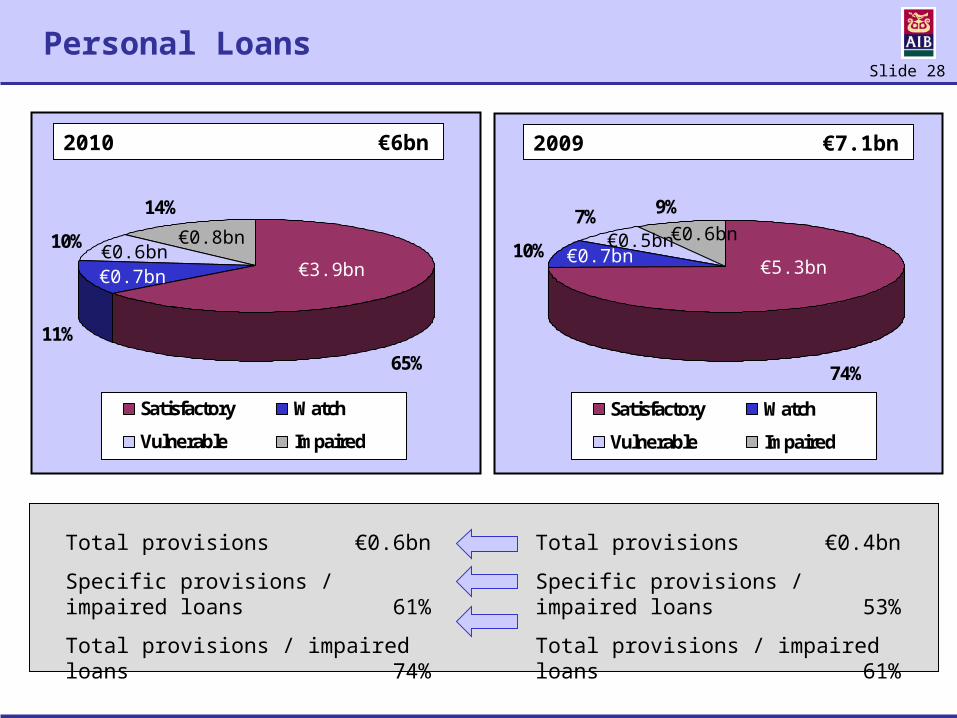
Personal Loans
10%
11%65%
14%
Satisfactory Watch
Vulnerable Impaired
€3.9bn€0.7bn€0.6bn
€0.8bn
Total provisions €0.6bn
Specific provisions / impaired loans 61%
Total provisions / impaired loans 74%
2010 €6bn
10%
7%
74%
9%
Satisfactory Watch
Vulnerable Impaired
€5.3bn€0.7bn
€0.5bn €0.6bn
Total provisions €0.4bn
Specific provisions / impaired loans 53%
Total provisions / impaired loans 61%
2009 €7.1bn
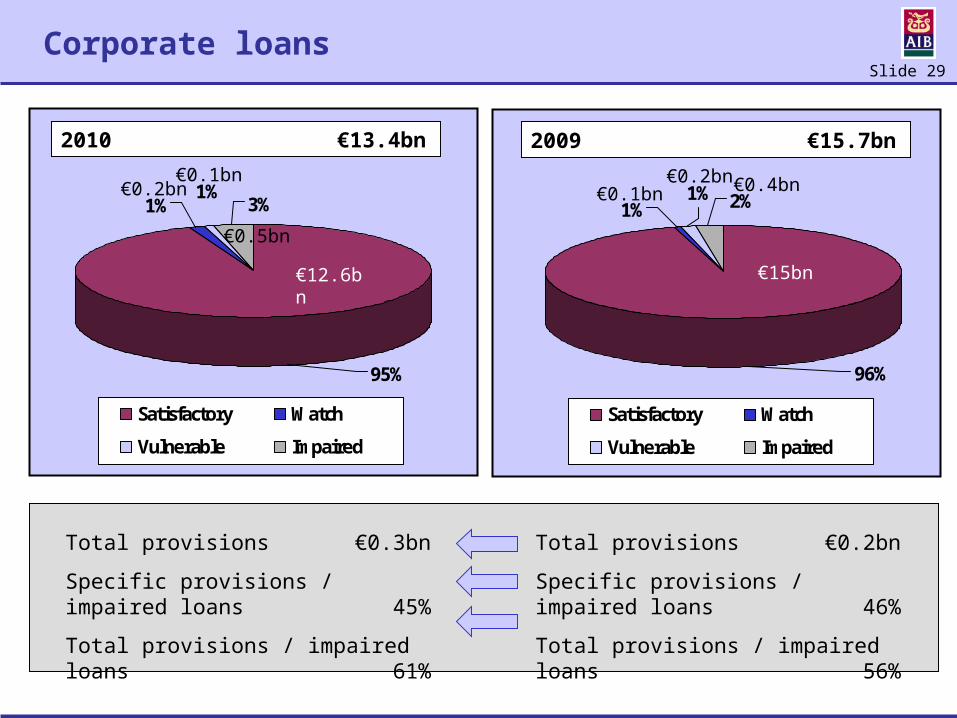
Slide 29
Corporate loans
1%1%
95%
3%
Satisfactory Watch
Vulnerable Impaired
€12.6bn
€0.2bn€0.1bn
€0.5bn
Total provisions €0.3bn
Specific provisions / impaired loans 45%
Total provisions / impaired loans 61%
2010 €13.4bn
1%1%
96%
2%
Satisfactory Watch
Vulnerable Impaired
€15bn
€0.2bn€0.1bn €0.4bn
Total provisions €0.2bn
Specific provisions / impaired loans 46%
Total provisions / impaired loans 56%
2009 €15.7bn

Slide 30
Available for sale portfolios
96% investment grade Excludes NAMA bonds of c. €8bn held in loans and receivables Weighted average price 95% of par value; full repayment at maturity expected No specific impairment taken in 2010 within the portfolio; IBNR charge of €59m Pay down / maturities of bank and ABS securities, overall reduction of c. €4.5bn in 2010 Continuing reductions will be phased over time to protect value Average life of total portfolio < 4 years
48%
15%
14%
5%
6%4% 3% 3% 2%
Gov Securities
Senior Bank / Fin Inst Debt
ABS -RMBS
Gov Guaranteed Snr Bank Debt
Supranationals
Covered Bonds
Corporate Debt
Other ABS
Subordinated Bank Debt
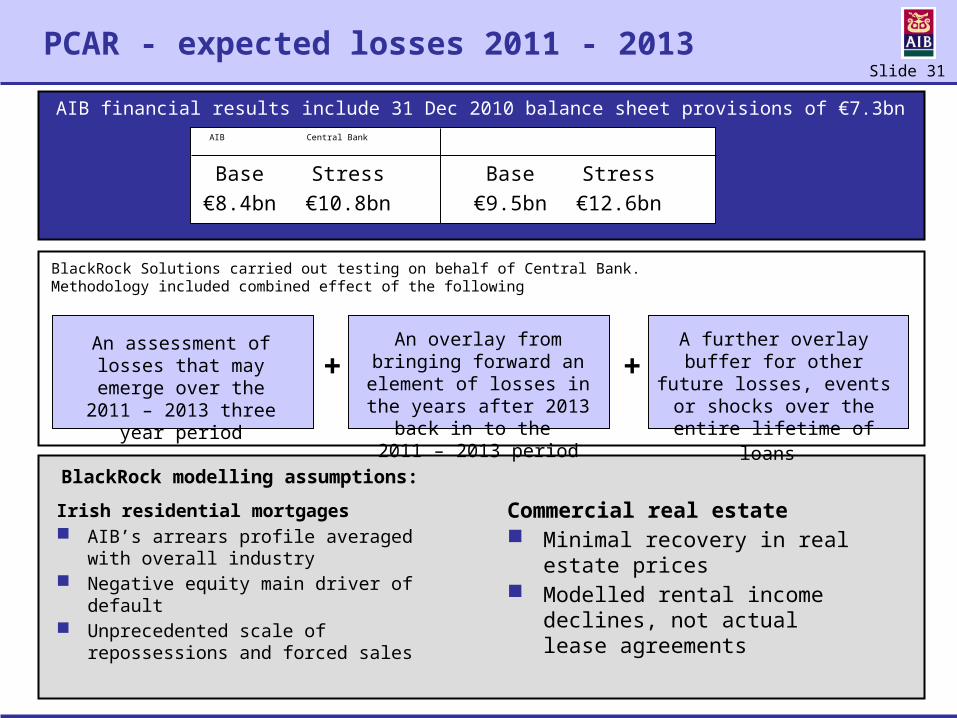
Slide 31
PCAR - expected losses 2011 - 2013
AIB financial results include 31 Dec 2010 balance sheet provisions of €7.3bn
Irish residential mortgages AIB’s arrears profile averaged with
overall industry Negative equity main driver of
default Unprecedented scale of
repossessions and forced sales
Commercial real estate Minimal recovery in real estate prices Modelled rental income declines, not
actual lease agreements
BlackRock modelling assumptions:
An assessment of losses that may emerge over the
2011 – 2013 three year period
An overlay from bringing forward an element of losses in the years
after 2013 back in to the 2011 – 2013 period
A further overlay buffer for other future losses, events or shocks over the entire lifetime
of loans
+ +
BlackRock Solutions carried out testing on behalf of Central Bank. Methodology included combined effect of the following
AIB Central Bank
Base Stress Base Stress€8.4bn €10.8bn €9.5bn €12.6bn
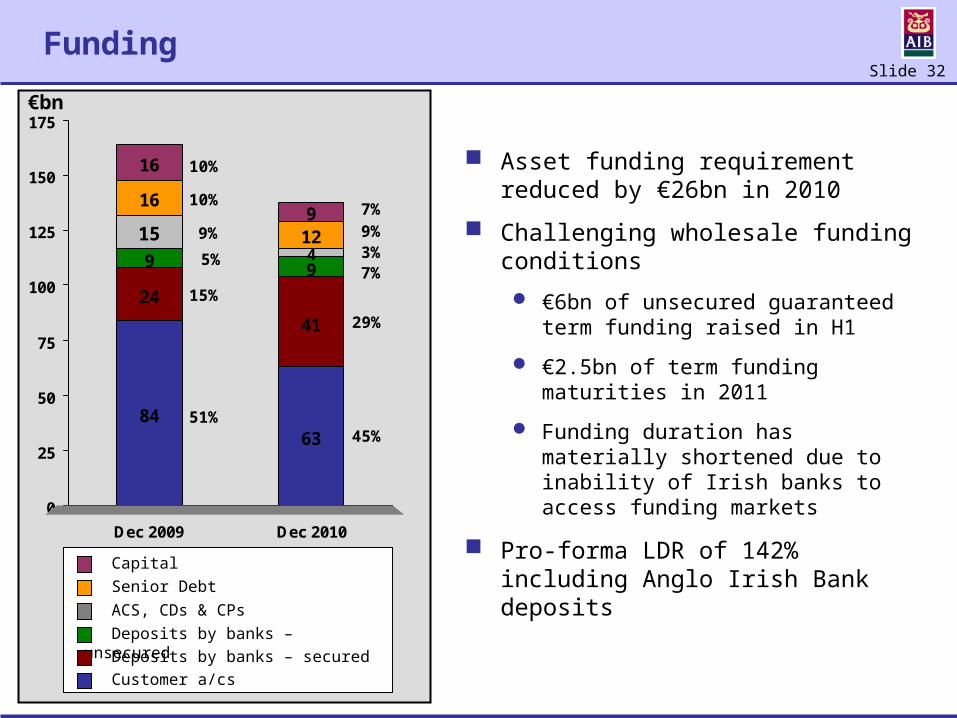
Slide 32
Funding
8463
24
41
9 94
16
12
16
915
0
25
50
75
100
125
150
175
Dec 2009 Dec 2010
€bn
Senior Debt
Capital
Deposits by banks – unsecured
Deposits by banks – secured
Customer a/cs
ACS, CDs & CPs
Asset funding requirement reduced by €26bn in 2010
Challenging wholesale funding conditions
€6bn of unsecured guaranteed term funding raised in H1
€2.5bn of term funding maturities in 2011
Funding duration has materially shortened due to inability of Irish banks to access funding markets
Pro-forma LDR of 142% including Anglo Irish Bank deposits
51%
15%
5%
9%
10%
10%
45%
29%
7%3%9%7%
Slide 33
Outline of our Restructuring Planand
Strategic Review
David HodgkinsonExecutive Chairman
Slide 34
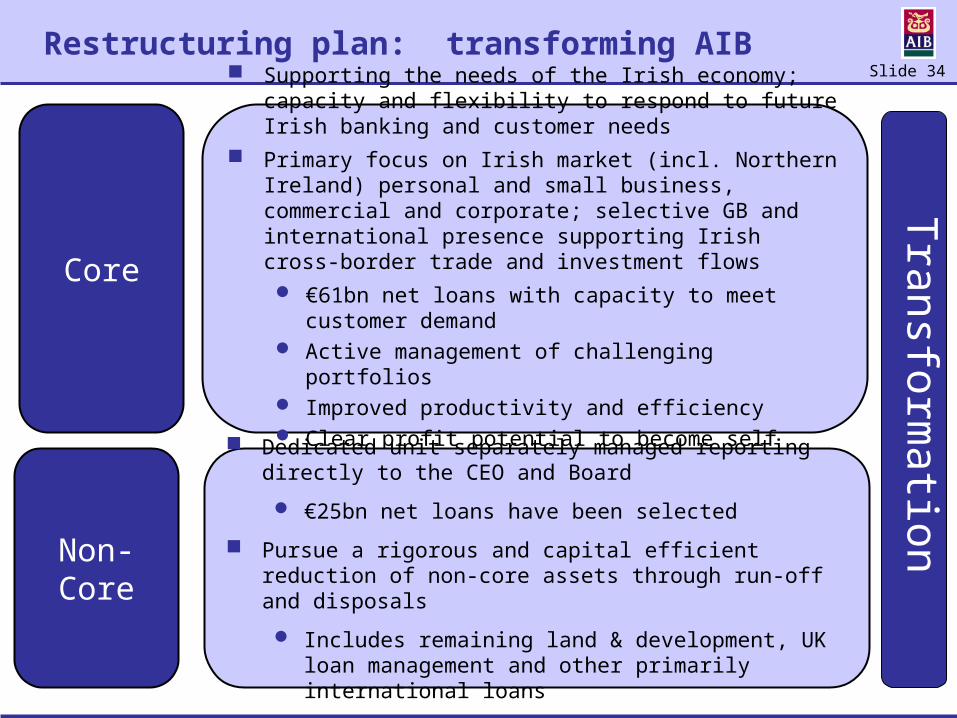
Supporting the needs of the Irish economy; capacity and flexibility to respond to future Irish banking and customer needs
Primary focus on Irish market (incl. Northern Ireland) personal and small business, commercial and corporate; selective GB and international presence supporting Irish cross-border trade and investment flows €61bn net loans with capacity to meet customer demand Active management of challenging portfolios Improved productivity and efficiency Clear profit potential to become self capitalising and
investible
Dedicated unit separately managed reporting directly to the CEO and Board
€25bn net loans have been selected
Pursue a rigorous and capital efficient reduction of non-core assets through run-off and disposals
Includes remaining land & development, UK loan management and other primarily international loans
Restructuring plan: transforming AIB
Core
Non-Core
Transformation
Slide 35
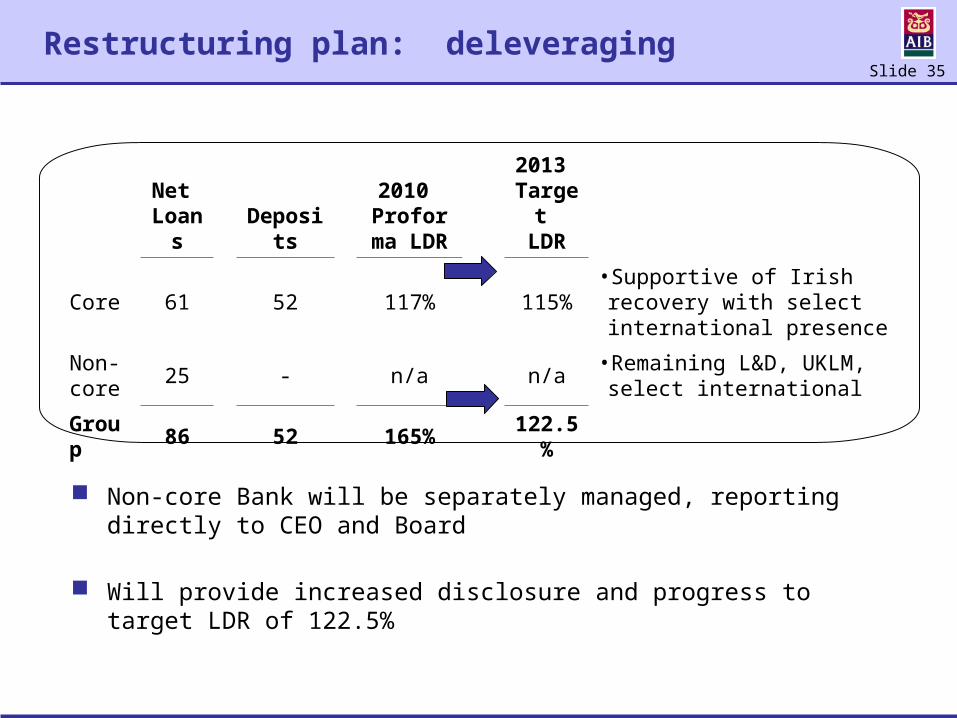
Net Loans Deposits
2010 Proforma
LDR
2013 Target
LDR
Core 61 52 117% 115%•Supportive of Irish recovery with select international presence
Non-core 25 - n/a n/a
•Remaining L&D, UKLM, select international
Group 86 52 165% 122.5%
Restructuring plan: deleveraging
Non-core Bank will be separately managed, reporting directly to CEO and Board
Will provide increased disclosure and progress to target LDR of 122.5%
Slide 36
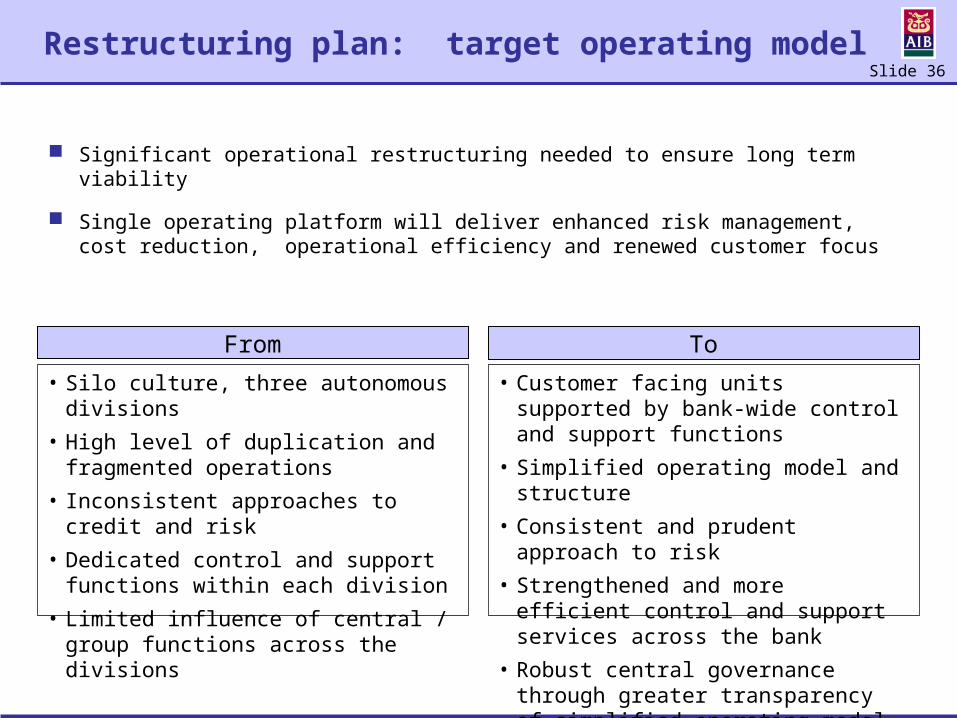
Restructuring plan: target operating model
Significant operational restructuring needed to ensure long term viability
Single operating platform will deliver enhanced risk management, cost reduction, operational efficiency and renewed customer focus
From To
• Silo culture, three autonomous divisions• High level of duplication and fragmented
operations• Inconsistent approaches to credit and risk• Dedicated control and support functions
within each division• Limited influence of central / group functions
across the divisions
• Customer facing units supported by bank-wide control and support functions
• Simplified operating model and structure• Consistent and prudent approach to risk• Strengthened and more efficient control and
support services across the bank• Robust central governance through greater
transparency of simplified operating model
Slide 37
Restructuring plan: staff
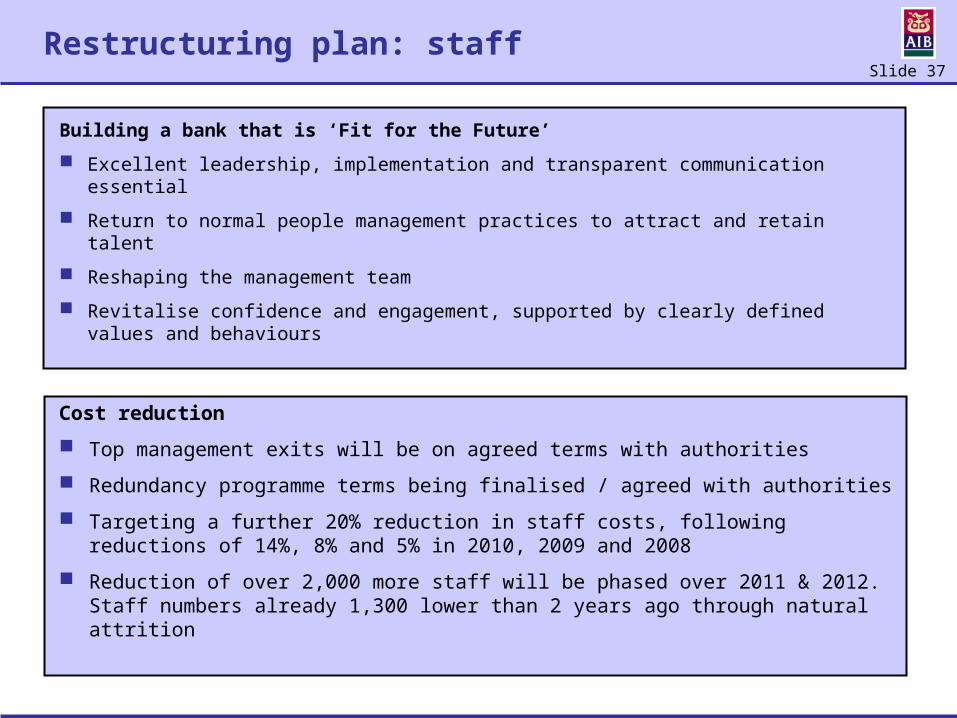
Building a bank that is ‘Fit for the Future’
Excellent leadership, implementation and transparent communication essential
Return to normal people management practices to attract and retain talent
Reshaping the management team
Revitalise confidence and engagement, supported by clearly defined values and behaviours
Cost reduction
Top management exits will be on agreed terms with authorities
Redundancy programme terms being finalised / agreed with authorities
Targeting a further 20% reduction in staff costs, following reductions of 14%, 8% and 5% in 2010, 2009 and 2008
Reduction of over 2,000 more staff will be phased over 2011 & 2012. Staff numbers already 1,300 lower than 2 years ago through natural attrition
Slide 38
Restructuring plan: customers
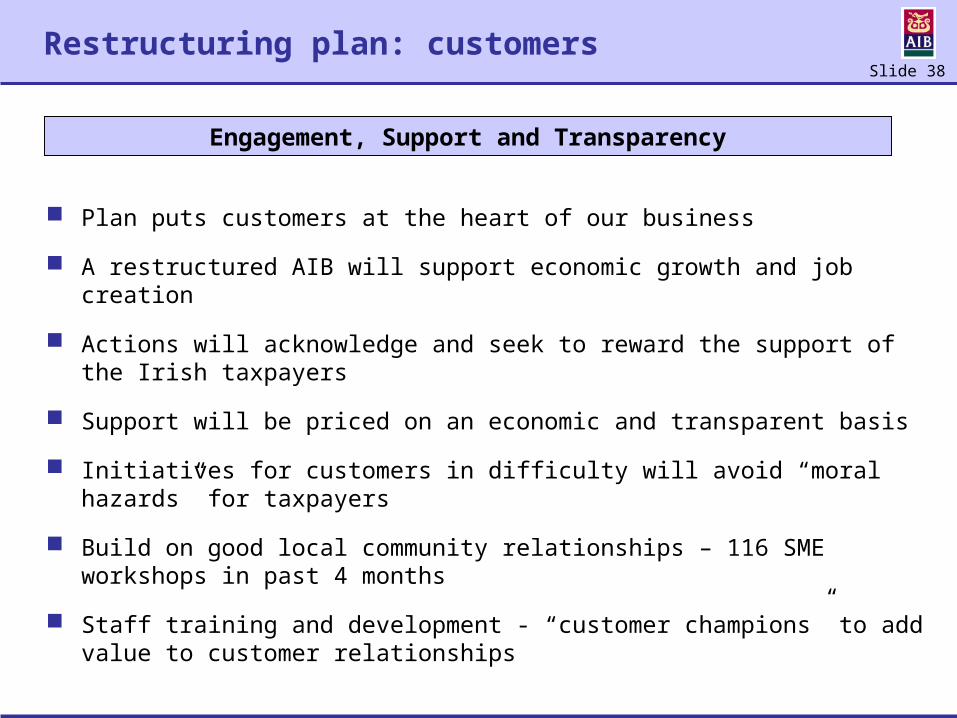
Plan puts customers at the heart of our business
A restructured AIB will support economic growth and job creation
Actions will acknowledge and seek to reward the support of the Irish taxpayers
Support will be priced on an economic and transparent basis
Initiatives for customers in difficulty will avoid “moral hazards” for taxpayers
Build on good local community relationships – 116 SME workshops in past 4 months
Staff training and development - “customer champions” to add value to customer relationships
Engagement, Support and Transparency
Slide 39
2013 goals
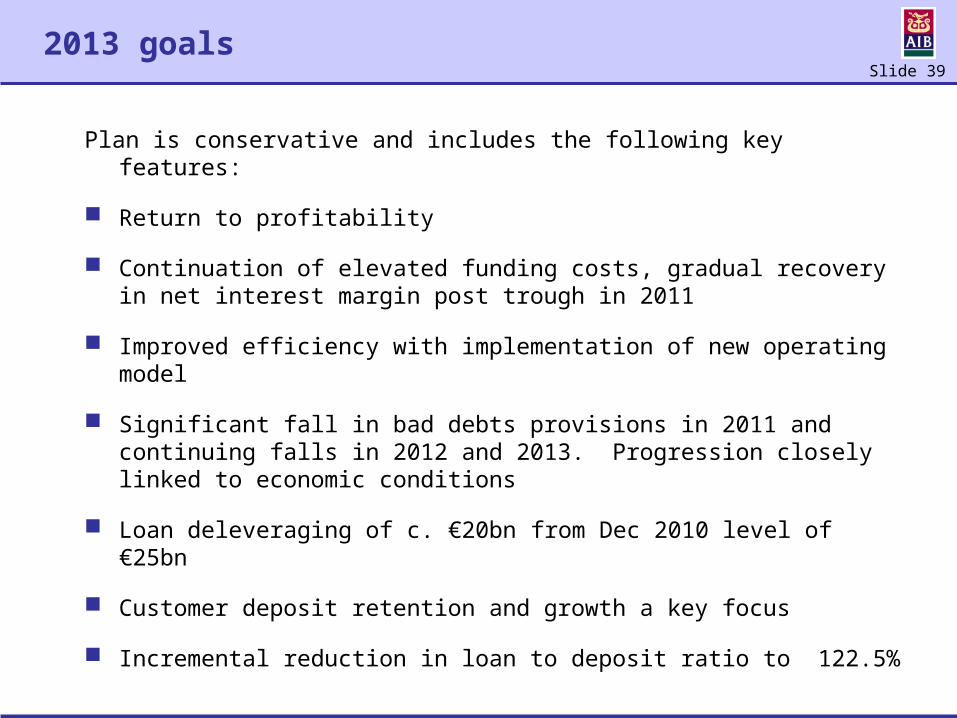
Plan is conservative and includes the following key features:
Return to profitability
Continuation of elevated funding costs, gradual recovery in net interest margin post trough in 2011
Improved efficiency with implementation of new operating model
Significant fall in bad debts provisions in 2011 and continuing falls in 2012 and 2013. Progression closely linked to economic conditions
Loan deleveraging of c. €20bn from Dec 2010 level of €25bn
Customer deposit retention and growth a key focus
Incremental reduction in loan to deposit ratio to 122.5%
Slide 40
In conclusion
AIB Board and management are grateful to Irish taxpayers for the support essential to the bank’s survival
AIB has the capital, staff and customer franchises to regenerate the organisation
The recovery has begun though the future remains challenging
Successful implementation of our plan will restore AIB to a stand alone profitable bank that supports Irish economic revival

Slide 41
Contacts
+353-1-660 0311
+353-1-641 2075
Alan Kelly [email protected] +353-1-6412162
Rose O’Donovan rose.m.o’[email protected] +353-1-6414191
Pat Clarke [email protected] +353-1-6412381
Our Group Investor Relations Department will be happy to facilitate your requests for any further information
Visit our website www.aibgroup.com/investorrelations