allianz global wealth report 2019 · allianz global wealth report 2019 – table of contents 7...
TRANSCRIPT
ECONOMIC RESEARCH
ALLIANZ GLOBALWEALTH REPORT 2019

2

ALLIANZ GLOBAL WEALTH REPORT 2019 3
Economic Research
ALLIANZ GLOBAL WEALTH REPORT 2019 3
Economic Research
Dr. Michaela GrimmDr. Michael HeiseDr. Arne HolzhausenPatricia Pelayo Romero

PREFACE SECURING OUR VALUES
ALLIANZ GLOBAL WEALTH REPORT 2019 – PREFACE 5
Economic Research
Over the last two decades, global wealth dynamics were shaped by one particular trend: convergence between rich and poor. Financial assets in emerging markets easily outgrew those in advanced countries; the annual growth gap amounted to more than 11 percentage points on average. But 2018, convergence stopped. And that’s not all: For the first time, total financial assets of households in emerging markets declined. Just a bump in the road or a harbinger of things to come? Do we need to rewrite the emerging market narrative of a sustained catch-up process? It is certainly too early to judge. The jury is still out. But in the meanwhile, more dark clouds have gathered on the horizon of the global economy.
However, not only savers in poorer countries felt the brunt of escalating trade conflicts and rising political uncertainties. One man’s sorrow is not another man’s joy: Households in advanced countries, too, had to cope with negative financial asset growth in 2018. There are no winners in dismantling the global order that underpinned rapid globalization in the first place. When capital is no longer flowing into the emerging world in search for higher returns, it stays stuck in the rich world, chasing the same safe assets – whose returns are pushed deeply into the red as a consequence. But in a world without returns, how can we secure the incomes of future generations? How can we undertake the necessary investments to mitigate climate change?
It is a very challenging environment for savers worldwide – as it is for us. Allianz is one of the leading global financial service providers. We strive to provide our clients with solutions and services that secure their financial well-being, for today and all the years to come. Fulfilling this purpose requires – among many other things – strong values of openness and diversity, collaboration and tolerance. Because it is exactly this set of values that shapes successful behavior and underpins progress.
The tenth edition of our „Allianz Global Wealth Report“ is coming out at a time of rising economic belligerence and exclusionism. Instead, the world desperately needs more cooperation and inclusive growth. This can only be achieved if we rigorously defend and secure our values. I personally hope that many readers of this year’s report will join us in that important engagement.
Oliver Bäte Chairman of the Board of Management of Allianz SE
6
TABLE OF CONTENTS
ALLIANZ GLOBAL WEALTH REPORT 2019 – TABLE OF CONTENTS 7
Economic Research
081529415055
121
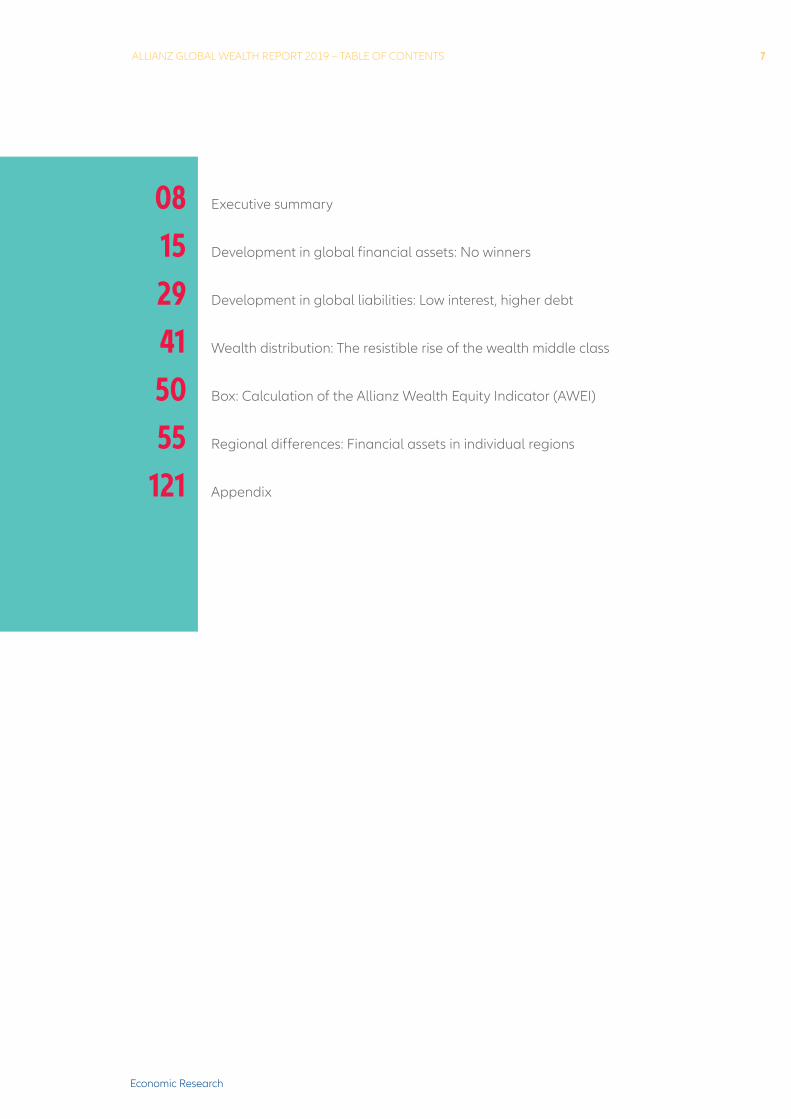
Executive summary
Development in global financial assets: No winners
Development in global liabilities: Low interest, higher debt
Wealth distribution: The resistible rise of the wealth middle class
Box: Calculation of the Allianz Wealth Equity Indicator (AWEI)
Regional differences: Financial assets in individual regions
Appendix

8
EXECUTIVE SUMMARY
ALLIANZ GLOBAL WEALTH REPORT 2019 – EXECUTIVE SUMMARY 9
Economic Research
No winnersRising uncertainty took its toll on finan-cial markets in 2018 – and households felt the brunt: Private financial assets fell by 0.1% in 2018, the first decline since 2008. Gross financial assets in the 53 countries we analyzed thus remained more or less flat at EUR 172.5 trillion. The decline in gross financial assets in 2018 was widespread, both emerging and advanced countries ended the year in the red. For emerg-ing markets, it was the first time in this century, for advanced markets the third time since 2008 and 2002.
Convergence stalledThe global process of convergence, the closure of the gap between richer and poorer regions, seems to have come to a halt. In 2018 growth in gross financial assets in emerging markets was for the second year in a row below that of advanced markets and the share of emerging markets in global financial assets remained flat at around 18%. But as the growth gap between poor-er and richer regions of the world still stands at an impressive 11 percentage points on average over the last two decades, it might be too early to rewrite the narrative of sustained catch-up. But economic belligerence has made the path to the rich world much more rocky for emerging markets.
Fresh savings at a record highTotal financial assets declined in 2018, but fresh savings set a new record. They increased by 22% to more than EUR 2,700 billion. Were it not for tumbling stock markets, this record purchase of financial assets would have resulted in asset growth of 2%. In other words: The decline in asset prices, mainly equi-ties, cost the households around EUR 3,000 billion in 2018. The increase in the flow of funds was mainly driven by US households, who upped their fresh savings by a whopping 46% to EUR 1,800 billion; US savings thus accounted for two thirds of global savings in 2018. This was driven in large parts by the US tax reform bringing some windfall profits to US households – which were duly reinvested.
The price of low yieldsThe years of continuously falling yields have left a clear mark on savings behaviors: Savers are turning their backs on the asset class of insurance and pensions. Its share in total fresh savings has fallen from around 60% in the aftermath of the crisis to a mere 25% in 2018. At first glance, securities seemed to benefit from the low yield environment. Their share in total fresh savings increased by 2pp to 29% in 2018, the highest share on record. This development, however, is entirely due to the situation in the US. Other savers are clearly more cautious: Be it Europe, Japan or Australia: Households were net sellers of securities in 2018. Bank deposits remained by far the most popular destination for fresh savings in 2018, for the eighth year in a row. This
10
penchant for liquidity and safety costs savers dearly, however: Losses suffered by households as a result of inflation if they parked their savings in bank accounts are expected to have risen to almost EUR 600 billion in 2018.
As safe as a bankBank deposits were the best perform-ing asset class in 2018: Rising inflows led to an increase in growth from 4.3% to 5.7%, on par with the average for the last decade. Securities, on the other hand, declined by 4.9% in 2018, the first drop in over a decade. The slump was, however, less pronounced than in 2008 (-22.3%) and 2002 (-6.5%). Growth in insurance and pensions disappointed, too: the 1.0% increase was the second weakest in this century. This meagre growth reflects in part lower inflows but also the weak performance of underly-ing assets.
Asia’s fall from graceThe regional growth league table used to be dominated by one region: Asia ex Japan. But in 2018, the region suffered a decline, with financial assets contract-ing by 0.9%, mainly “thanks” to develop-ments in China. The other two emerging markets regions – Eastern Europe and Latin America – fared much better in 2018. Growth rates of 8% and 7.1%, respectively, are, however, also clearly below the long-term average and part-ly due to relatively high inflation rates. In the wealthier parts of the world, households had to cope with declining financial assets – with the exception
of Australia and New Zealand (+3.1%). Financial assets of households in Western Europe declined almost in step with North America last year (-0.2% and
-0.3%, respectively).
Precarious debt dynamics in Asia Worldwide household liabilities rose by 5.7% in 2018, a tad below the previous year’s level of 6.0%, but also well above the long-term average annual growth rate of 3.6%. Debt growth has acceler-ated noticeably for the last five years and is gradually returning to levels last seen before the financial crisis. The global debt ratio (liabilities as a per-centage of GDP), however, remained stable at 65.1%, thanks to still robust economic growth. Most regions saw a similar development in that respect. Asia (excluding Japan) is a different sto-ry. In the last three years alone, the debt ratio jumped by almost ten percentage points, mimicking the US development in the run-up to the subprime crisis. As a result, the debt ratio was 52.4% at the end of last year, roughly twice the level of Eastern Europe and Latin Ameri-ca, the other two emerging markets regions.
America rules the world (in net financial assets)If we subtract debt from gross financial assets, we are left with net financial assets. In 2018, they fell slightly to EUR 129.8 trillion on a global level (-1.9%). Despite the catch-up process, discrep-ancies between household assets in richer regions and those in the world’s
ALLIANZ GLOBAL WEALTH REPORT 2019 – EXECUTIVE SUMMARY 11
Economic Research
poorer regions remain huge. North America remains the richest region in the world, with average per capita as-sets of EUR 173,850 last year after de-duction of liabilities. On the other hand, Eastern Europe was the region with the lowest net financial assets. At the end of 2018, households had an average of EUR 4,430 per capita.
Just a bump in the road?For the first time in over a decade, the global wealth middle class did not grow: At the end of 2018, roughly 1,040 million people belonged to the global wealth middle class – which is more or less the same number of people as one year before. Compared to the beginning of the century, however, a whopping increase of almost 140% can be noticed. Moreover, the composition of the middle class has changed quite substantially: While the share of the Chinese and other Asians increased by more than 20 percentage points, the share of people coming from Western Europe, North America or Japan fell by 20 percentage points.
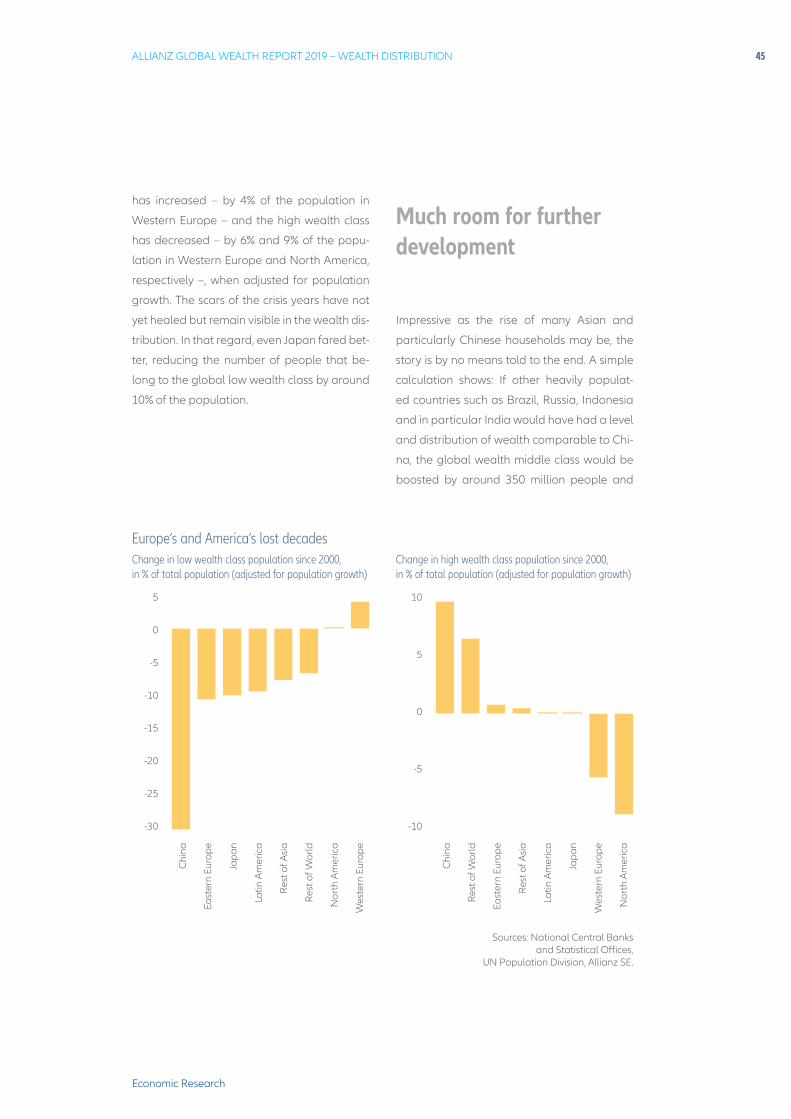
The scars of the crisis yearsWhen analyzing the movements between the wealth classes, one thing becomes evident: Whereas Asian coun-tries – first and foremost China – can look back on two decades of mostly social rise, the picture for Western Europeans and Americans is bleaker. In fact, it’s only in these two regions that the low wealth class has increased – by 4% of the population in Western Eu-
rope – and the high wealth classs has decreased – by 6% and 9% of the pop-ulation in Western Europe and North America, respectively –, when adjusted for population growth.
A story not told to the endThe rise of the new global wealth middle class is by no means completed. If other heavily populated countries such as Brazil, Russia, Indonesia and in particular India would have had a level and distribution of wealth comparable to China, the global wealth middle class would be boosted by around 350 million people and the global wealth upper class by around 200 million people. Moreover, the concentration of wealth is still extremely high from a global perspective. The richest 10% of the population worldwide own roughly 82% of total net financial assets; among them, the richest 1% – with average net financial assets of above EUR 1 million
– own almost 43%. At least, the share of the richest decile of the population in total assets dropped by more than 8 percentage points since 2000.
Mind the gapThe relation between median and average net financial assets and how it developed over time is a good indicator for wealth distribution, with a narrowing gap indicating an increase in prosper-ity in the middle of society i.e. a more even distribution. There are as many countries in which distribution has im-proved since the turn of the millennium as countries in which distribution has
12
deteriorated. The biggest group, how-ever, consists of countries with almost no change. In contrast to the general perception, wealth distribution seems to be rather stable in many countries. Among the countries in which wealth distribution has worsened are some
“usual suspects”, like the US, Russia and India but also many European countries
– and China: It’s a sign that, with growth slowing down, wealth dynamics in the Chinese society are becoming more uneven.
Eluding simple generalizationsOur new proprietary Allianz Wealth Equity Indicator (AWEI) helps to provide a more nuanced picture of wealth dis-tribution. In some cases, it substantiates the general perception, think of the two opposing poles USA (very unequal) and Japan (very equal). In other cases, it produces surprising insights, think of the Scandinavian countries (rather une-qual) or Spain and Italy (rather equal). Compared to last year, India, Russia and China are the biggest “losers”, suf-fering huge drops in their rankings.

ALLIANZ GLOBAL WEALTH REPORT 2019 – EXECUTIVE SUMMARY 13
Economic Research


DEVELOPMENT IN GLOBAL FINANCIAL ASSETS: NO WINNERS
16
If 2018 were to be characterized by one word,
“uncertainty” could well be it. From the es-
calating trade conflict between the US and
China to the never-ending story of Brexit and
mounting geopolitical tensions, political risks
were elevated throughout the year. Economic
activity, however, held up rather well; econom-
ic momentum even accelerated in the US over
the course of the year due to a strongly pro-cy-
clical fiscal policy.
Against the backdrop of a still robustly grow-
ing world economy, central banks around
the globe continued with their attempts to
normalize their monetary policy stance. The
US Federal Reserve, for example, increased
its target rate range four times in 2018 and
trimmed its bloated balance sheet.
For financial markets, however, this cocktail in-
cluding a highly uncertain outlook, increased
political risks, and tighter monetary policies
was poisonous. Stock markets experienced
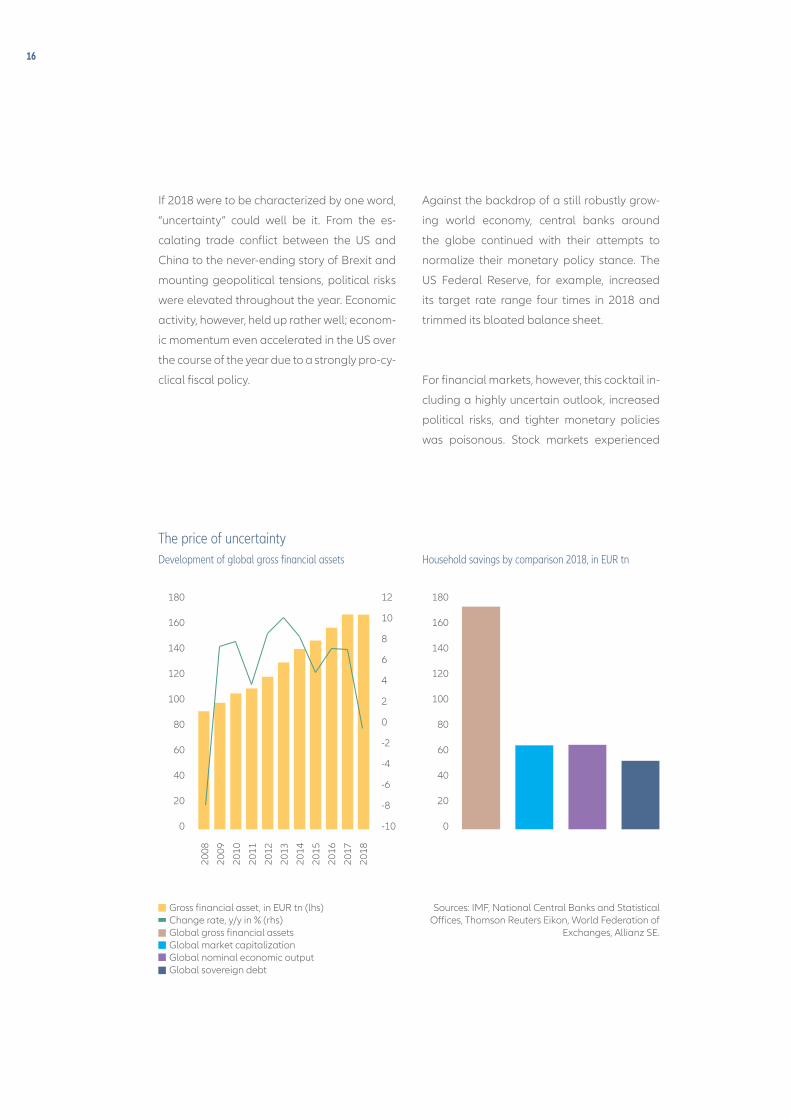
The price of uncertaintyDevelopment of global gross financial assets Household savings by comparison 2018, in EUR tn
180
160
140
120
100
80
60
40
20
0
180
160
140
120
100
80
60
40
20
0
12
10
8
6
4
2
0
-2
-4
-6
-8
-10
Sources: IMF, National Central Banks and Statistical Offices, Thomson Reuters Eikon, World Federation of
Exchanges, Allianz SE.
Gross financial asset, in EUR tn (lhs)Change rate, y/y in % (rhs)Global gross financial assetsGlobal market capitalizationGlobal nominal economic outputGlobal sovereign debt
2008
2009
2010
2011
2012
2013
2014
2015
2016
2017
2018
ALLIANZ GLOBAL WEALTH REPORT 2019 – DEVELOPMENT IN GLOBAL FINANCIAL ASSETS 17
Economic Research
several episodes of spikes in volatility in 2018.
At the end of year, most major stock markets
ended deep in the red and global equity mar-
kets lost around 12%.
Households felt the brunt of this development.
Private financial assets fell by 0.1% in 2018, the
first decline since 2008, the year of the great
financial crisis. Gross financial assets in the 53
countries we analyzed thus remained more or
less flat at EUR 172.5 trillion, corresponding to
roughly 260% of global economic output and
global market capitalization.
Global financial assets of households have
grown at an annual rate of 4.8% over the last
ten years (2008-2018), just a tad faster than
global nominal economic output (+4.5% in
the last decade). In per capita terms, however,
long-term growth rates for each fell by almost
one percentage point as a result of population
growth, to 4.0% and 3.7% respectively. After
taking into account the inflation rate (global
average of 2.3%), average annual per capita
asset growth was 1.7% in real terms. Average
gross financial assets per capita came to EUR
33,690 at global level at the end of 2018.
No place to hide
The decline in gross financial assets in 2018
was widespread. Households in China and
Japan, in Mexico, the US and Canada, as well
as in many European countries – from Italy in
the South to Sweden in the North – suffered
losses. Only half a dozen countries were able
to post double digit growth, with Argentina
and Turkey as growth champions of 2018 –
two countries ravaged by inflation. As a result,
both emerging and advanced countries end-
ed the year in the red. For emerging markets, it
was the first time in this century, for advanced
markets the third time since 2008 and 2002.
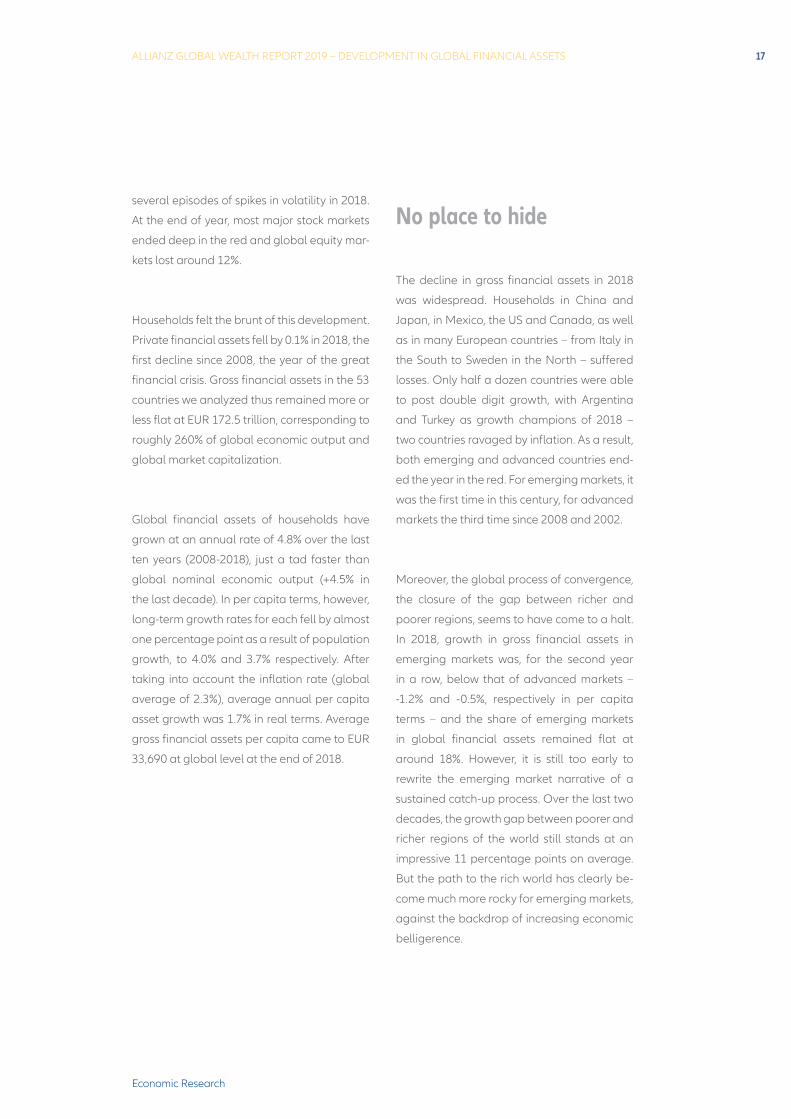
Moreover, the global process of convergence,
the closure of the gap between richer and
poorer regions, seems to have come to a halt.
In 2018, growth in gross financial assets in
emerging markets was, for the second year
in a row, below that of advanced markets –
-1.2% and -0.5%, respectively in per capita
terms – and the share of emerging markets
in global financial assets remained flat at
around 18%. However, it is still too early to
rewrite the emerging market narrative of a
sustained catch-up process. Over the last two
decades, the growth gap between poorer and
richer regions of the world still stands at an
impressive 11 percentage points on average.
But the path to the rich world has clearly be-
come much more rocky for emerging markets,
against the backdrop of increasing economic
belligerence.
18
Savings behavior in a
world without returns
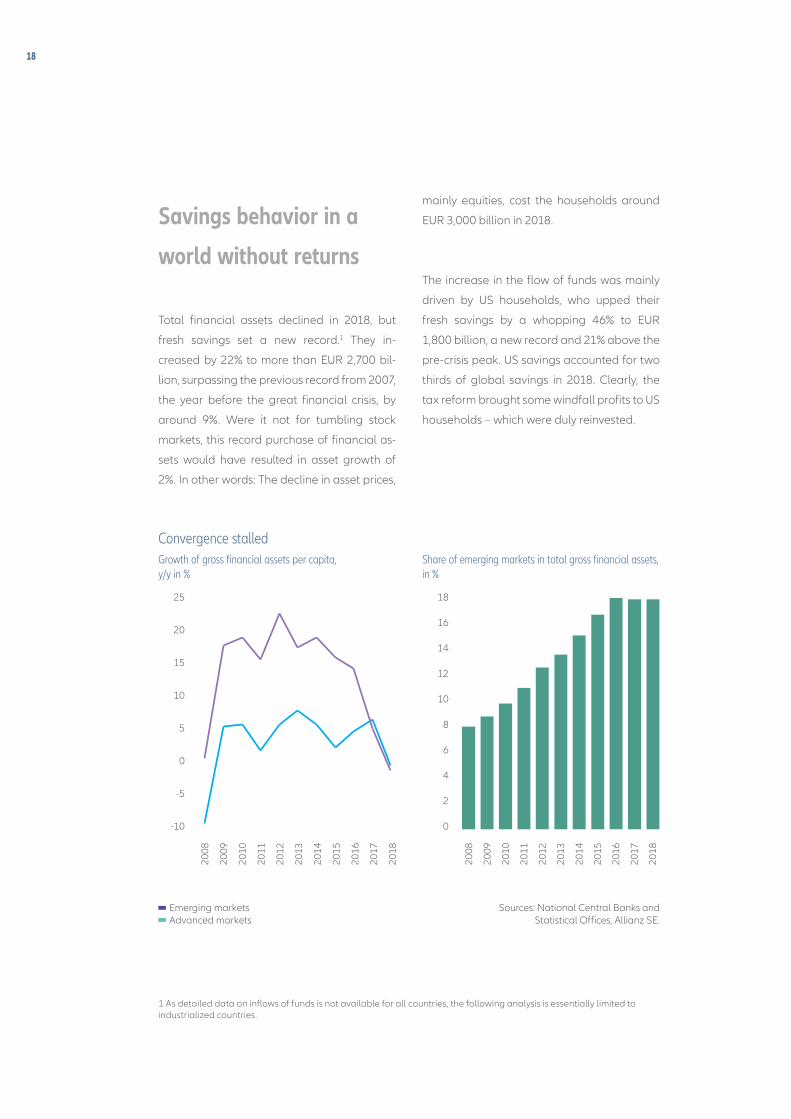
Total financial assets declined in 2018, but
fresh savings set a new record.1 They in-
creased by 22% to more than EUR 2,700 bil-
lion, surpassing the previous record from 2007,
the year before the great financial crisis, by
around 9%. Were it not for tumbling stock
markets, this record purchase of financial as-
sets would have resulted in asset growth of
2%. In other words: The decline in asset prices,
mainly equities, cost the households around
EUR 3,000 billion in 2018.
The increase in the flow of funds was mainly
driven by US households, who upped their
fresh savings by a whopping 46% to EUR
1,800 billion, a new record and 21% above the
pre-crisis peak. US savings accounted for two
thirds of global savings in 2018. Clearly, the
tax reform brought some windfall profits to US
households – which were duly reinvested.
1 As detailed data on inflows of funds is not available for all countries, the following analysis is essentially limited to industrialized countries.
Convergence stalledGrowth of gross financial assets per capita, y/y in %
Share of emerging markets in total gross financial assets, in %
25
20
15
10
5
0
-5
-10
18
16
14
12
10
8
6
4
2
0
Sources: National Central Banks and Statistical Offices, Allianz SE.
Emerging marketsAdvanced markets
2008
2009
2010
2011
2012
2013
2014
2015
2016
2017
2018
2008
2009
2010
2011
2012
2013
2014
2015
2016
2017
2018
ALLIANZ GLOBAL WEALTH REPORT 2019 – DEVELOPMENT IN GLOBAL FINANCIAL ASSETS 19
Economic Research
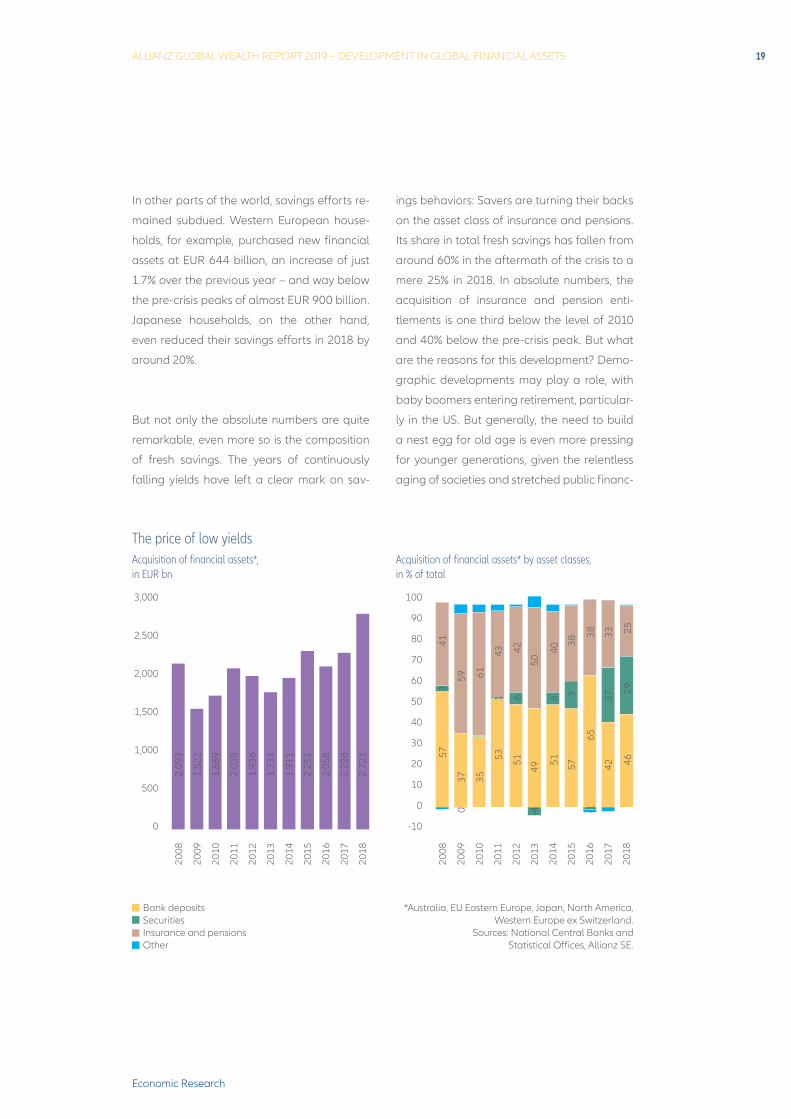
The price of low yieldsAcquisition of financial assets*, in EUR bn
Acquisition of financial assets* by asset classes, in % of total
3,000
2,500
2,000
1,500
1,000
500
0
100
90
80
70
60
50
40
30
20
10
0
-10
*Australia, EU Eastern Europe, Japan, North America, Western Europe ex Switzerland.
Sources: National Central Banks and Statistical Offices, Allianz SE.
Bank depositsSecuritiesInsurance and pensionsOther
In other parts of the world, savings efforts re-
mained subdued. Western European house-
holds, for example, purchased new financial
assets at EUR 644 billion, an increase of just
1.7% over the previous year – and way below
the pre-crisis peaks of almost EUR 900 billion.
Japanese households, on the other hand,
even reduced their savings efforts in 2018 by
around 20%.
But not only the absolute numbers are quite
remarkable, even more so is the composition
of fresh savings. The years of continuously
falling yields have left a clear mark on sav-
ings behaviors: Savers are turning their backs
on the asset class of insurance and pensions.
Its share in total fresh savings has fallen from
around 60% in the aftermath of the crisis to a
mere 25% in 2018. In absolute numbers, the
acquisition of insurance and pension enti-
tlements is one third below the level of 2010
and 40% below the pre-crisis peak. But what
are the reasons for this development? Demo-
graphic developments may play a role, with
baby boomers entering retirement, particular-
ly in the US. But generally, the need to build
a nest egg for old age is even more pressing
for younger generations, given the relentless
aging of societies and stretched public financ-
2.09
3
1.52
2
1.68
9
2.03
5
1.93
6
1.73
3
1.91
1
2.25
1
2.05
8
2.22
8
2.72
1 57
37 35
53 51
49-4 -10
51 57
65
42 46
3
1 6 6 3 27
29
41
59 61
43 42
50
40
38
38 33 25
2008
2009
2010
2011
2012
2013
2014
2015
2016
2017
2018
2008
2009
2010
2011
2012
2013
2014
2015
2016
2017
2018
20
es. Most people are aware of this sorry state
of affairs, as many surveys show in which the
(in)stability of the pension system often tops
the list of perceived risks for the future.2 So the
most likely explanation is that the long yield
winter has rendered many of these long-term
savings products unattractive in the eyes of
savers. But they may neglect these products
at their peril: Without proper savings, old-age
income could well be insufficient for future
generations. Low yields work as an accelerant
for the looming pension crisis.
At first glance, securities seemed to benefit
from the low yield environment. Their share in
total fresh savings increased by 2pp to 29% in
2018, the highest share on record. This devel-
opment, however, is entirely due to the situa-
tion in the US: Households purchased shares,
funds and other securities at the tune of EUR
860 billion – almost 50% above the level of the
previous year. Again, this jump might be more
of a reflection of the tax reform than of gen-
uine interest in riskier but higher yielding prod-
ucts. Other savers are clearly more cautious:
Be it Europe, Japan or Australia: Households
were net sellers of securities in 2018.
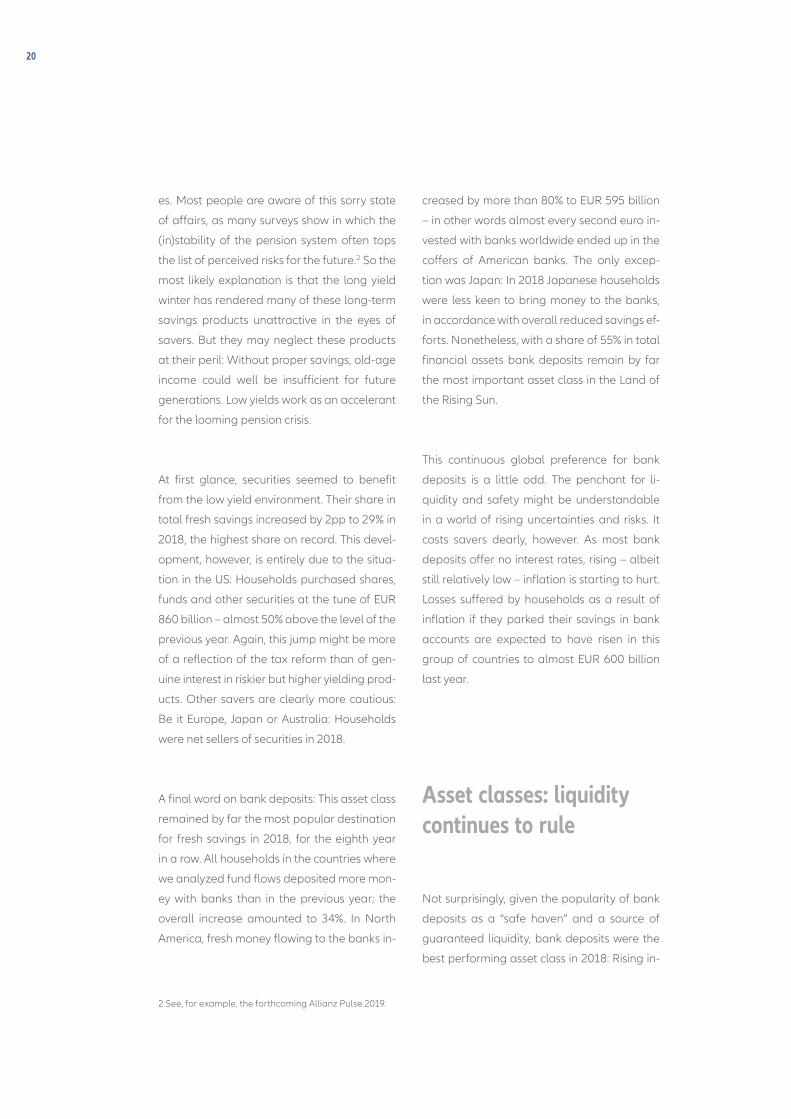
A final word on bank deposits: This asset class
remained by far the most popular destination
for fresh savings in 2018, for the eighth year
in a row. All households in the countries where
we analyzed fund flows deposited more mon-
ey with banks than in the previous year; the
overall increase amounted to 34%. In North
America, fresh money flowing to the banks in-
creased by more than 80% to EUR 595 billion
– in other words almost every second euro in-
vested with banks worldwide ended up in the
coffers of American banks. The only excep-
tion was Japan: In 2018 Japanese households
were less keen to bring money to the banks,
in accordance with overall reduced savings ef-
forts. Nonetheless, with a share of 55% in total
financial assets bank deposits remain by far
the most important asset class in the Land of
the Rising Sun.
This continuous global preference for bank
deposits is a little odd. The penchant for li-
quidity and safety might be understandable
in a world of rising uncertainties and risks. It
costs savers dearly, however. As most bank
deposits offer no interest rates, rising – albeit
still relatively low – inflation is starting to hurt.
Losses suffered by households as a result of
inflation if they parked their savings in bank
accounts are expected to have risen in this
group of countries to almost EUR 600 billion
last year.
Asset classes: liquidity continues to rule
Not surprisingly, given the popularity of bank
deposits as a “safe haven” and a source of
guaranteed liquidity, bank deposits were the
best performing asset class in 2018: Rising in-
2 See, for example, the forthcoming Allianz Pulse 2019.
ALLIANZ GLOBAL WEALTH REPORT 2019 – DEVELOPMENT IN GLOBAL FINANCIAL ASSETS 21
Economic Research
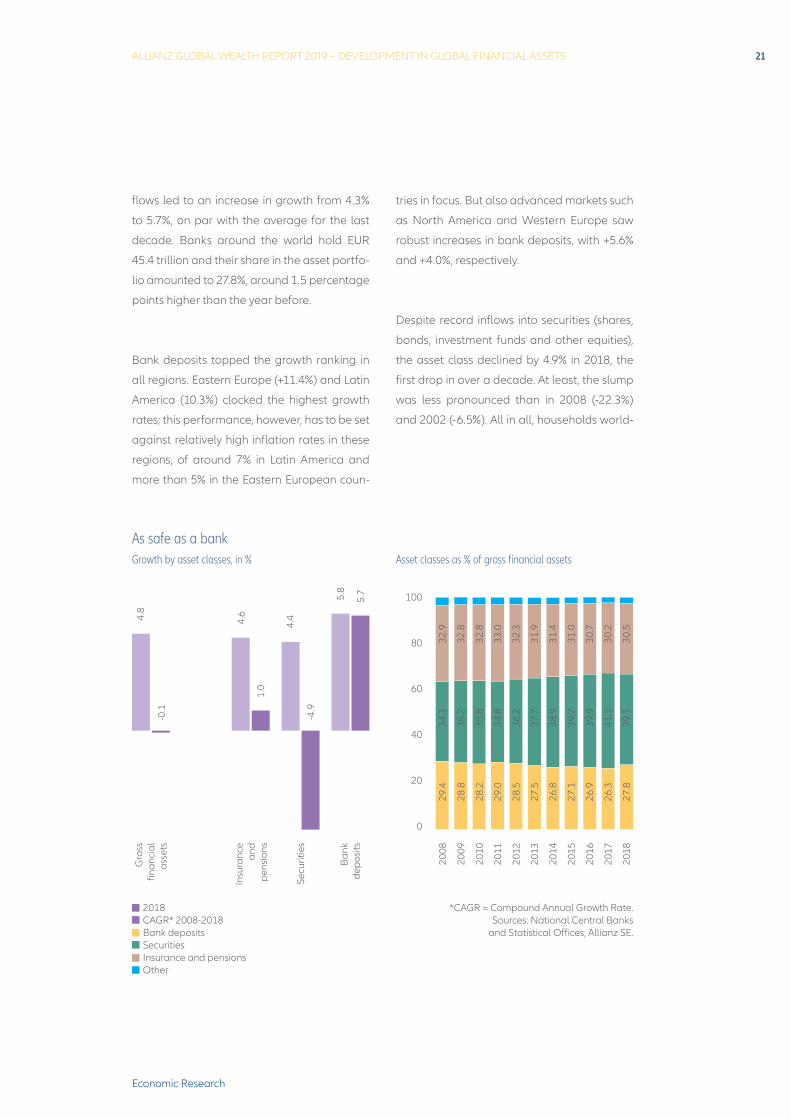
flows led to an increase in growth from 4.3%
to 5.7%, on par with the average for the last
decade. Banks around the world hold EUR
45.4 trillion and their share in the asset portfo-
lio amounted to 27.8%, around 1.5 percentage
points higher than the year before.
Bank deposits topped the growth ranking in
all regions. Eastern Europe (+11.4%) and Latin
America (10.3%) clocked the highest growth
rates; this performance, however, has to be set
against relatively high inflation rates in these
regions, of around 7% in Latin America and
more than 5% in the Eastern European coun-
tries in focus. But also advanced markets such
as North America and Western Europe saw
robust increases in bank deposits, with +5.6%
and +4.0%, respectively.
Despite record inflows into securities (shares,
bonds, investment funds and other equities),
the asset class declined by 4.9% in 2018, the
first drop in over a decade. At least, the slump
was less pronounced than in 2008 (-22.3%)
and 2002 (-6.5%). All in all, households world-
As safe as a bankGrowth by asset classes, in % Asset classes as % of gross financial assets
100
80
60
40
20
0
*CAGR = Compound Annual Growth Rate.Sources: National Central Banks
and Statistical Offices, Allianz SE.
2018CAGR* 2008-2018Bank depositsSecuritiesInsurance and pensionsOther
4.8
-0.1
4.6
1.0
4.4
-4.9
5.8
5.7
Gro
ss
finan
cial
as
sets
Insu
ranc
e an
d p
ensi
ons
Secu
ritie
s
Ban
k de
pos
its
2008
2009
2010
2011
2012
2013
2014
2015
2016
2017
2018
29.4
28.8
28.2
29.0
28.5
27.5
26.8
27.1
26.9
26.3
27.8
34.3
35.2
35.8
34.8
36.2
37.7
38.9
39.2
39.9
41.1
39.1
32.9
32.8
32.8
33.0
32.3
31.9
31.4
31.0
30.7
30.2
30.5
22
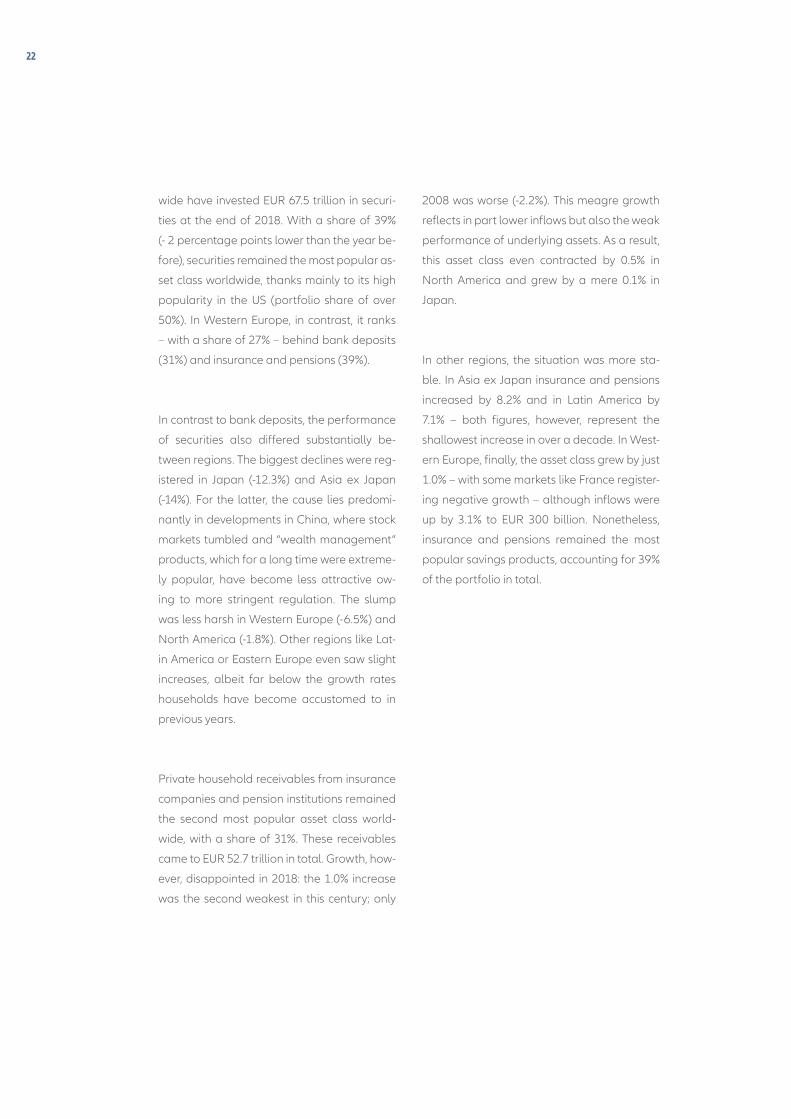
wide have invested EUR 67.5 trillion in securi-
ties at the end of 2018. With a share of 39%
(- 2 percentage points lower than the year be-
fore), securities remained the most popular as-
set class worldwide, thanks mainly to its high
popularity in the US (portfolio share of over
50%). In Western Europe, in contrast, it ranks
– with a share of 27% – behind bank deposits
(31%) and insurance and pensions (39%).
In contrast to bank deposits, the performance
of securities also differed substantially be-
tween regions. The biggest declines were reg-
istered in Japan (-12.3%) and Asia ex Japan
(-14%). For the latter, the cause lies predomi-
nantly in developments in China, where stock
markets tumbled and “wealth management”
products, which for a long time were extreme-
ly popular, have become less attractive ow-
ing to more stringent regulation. The slump
was less harsh in Western Europe (-6.5%) and
North America (-1.8%). Other regions like Lat-
in America or Eastern Europe even saw slight
increases, albeit far below the growth rates
households have become accustomed to in
previous years.
Private household receivables from insurance
companies and pension institutions remained
the second most popular asset class world-
wide, with a share of 31%. These receivables
came to EUR 52.7 trillion in total. Growth, how-
ever, disappointed in 2018: the 1.0% increase
was the second weakest in this century; only
2008 was worse (-2.2%). This meagre growth
reflects in part lower inflows but also the weak
performance of underlying assets. As a result,
this asset class even contracted by 0.5% in
North America and grew by a mere 0.1% in
Japan.
In other regions, the situation was more sta-
ble. In Asia ex Japan insurance and pensions
increased by 8.2% and in Latin America by
7.1% – both figures, however, represent the
shallowest increase in over a decade. In West-
ern Europe, finally, the asset class grew by just
1.0% – with some markets like France register-
ing negative growth – although inflows were
up by 3.1% to EUR 300 billion. Nonetheless,
insurance and pensions remained the most
popular savings products, accounting for 39%
of the portfolio in total.
ALLIANZ GLOBAL WEALTH REPORT 2019 – DEVELOPMENT IN GLOBAL FINANCIAL ASSETS 23
Economic Research
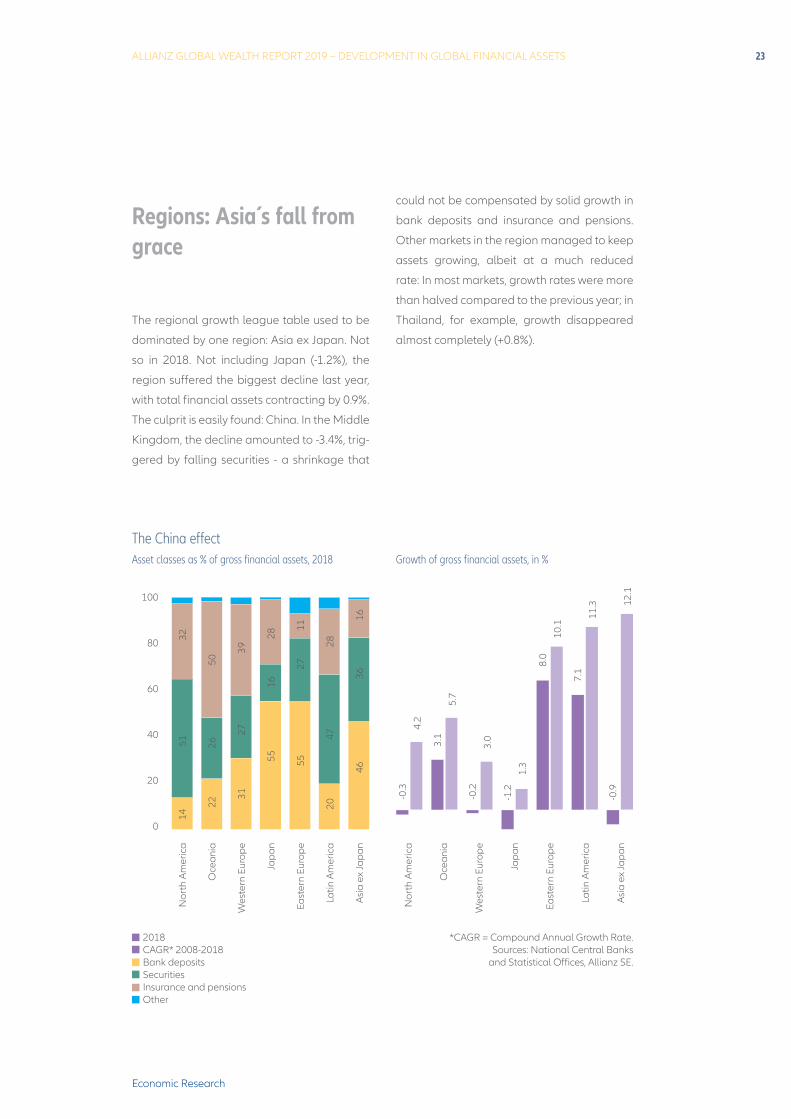
Regions: Asia s fall from grace
The regional growth league table used to be
dominated by one region: Asia ex Japan. Not
so in 2018. Not including Japan (-1.2%), the
region suffered the biggest decline last year,
with total financial assets contracting by 0.9%.
The culprit is easily found: China. In the Middle
Kingdom, the decline amounted to -3.4%, trig-
gered by falling securities - a shrinkage that
could not be compensated by solid growth in
bank deposits and insurance and pensions.
Other markets in the region managed to keep
assets growing, albeit at a much reduced
rate: In most markets, growth rates were more
than halved compared to the previous year; in
Thailand, for example, growth disappeared
almost completely (+0.8%).
The China effectAsset classes as % of gross financial assets, 2018 Growth of gross financial assets, in %
*CAGR = Compound Annual Growth Rate.Sources: National Central Banks
and Statistical Offices, Allianz SE.
2018CAGR* 2008-2018Bank depositsSecuritiesInsurance and pensionsOther
-0.3
4.2
3.1
5.7
-0.2
3.0
-1.2
1.3
8.0
10.1
11.3 12
.1-0
.9
7.1
Nor
th A
mer
ica
Oce
ania
Wes
tern
Eur
ope
Jap
an
East
ern
Euro
pe
Latin
Am
eric
a
Asi
a ex
Jap
an
Nor
th A
mer
ica
Oce
ania
Wes
tern
Eur
ope
Jap
an
East
ern
Euro
pe
Latin
Am
eric
a
Asi
a ex
Jap
an
100
80
60
40
20
0
1451
32
2226
50
3127
39
5516
28
5527
11
2047
28
4636
16
24
Over the last decade, however, Asia ex Japan
remains the growth champion, with average
annual growth of over 12% since 2008. But
2018 can be interpreted as a warning sign
that the region will become one of the main
victims if the trade war should drag on, com-
pounded by increasing geopolitical tensions.
All in all, Asian households (ex Japan) had to-
tal savings of around EUR 31.7 trillion at the
end of 2018. This amounted to gross financial
asset per capita of EUR 9,790, more than three
times as much as ten years before. The share
of the region in global assets doubled in this
period to 18.4%.
The other two emerging markets regions –
Eastern Europe and Latin America – fared
much better in 2018. Growth rates of 8% and
7.1%, respectively, are, however, also clearly
below the long-term average and among the
lowest since the great financial crisis. As said
before, these rates are partly due to relatively
high inflation rates, because in both regions
asset growth was propelled by double-digit
increases in bank deposits.
Household assets in Latin America have more
than tripled since 2008 and totaled around
EUR 3.7 trillion at the end of 2018. The region’s
share of global gross financial assets doubled
to 2.1% during this period. In contrast, house-
holds in Eastern Europe held a total of almost
EUR 2.6 trillion, or 1.5% of global financial as-
sets at the end of 2018 (up from 1.0% in 2008).
In per capita terms, too, Eastern Europe was
still trailing behind Latin America: Whereas
gross financial assets per capita amounted
to EUR 6,450 in Eastern Europe, they reached
EUR 7,680 in Latin America.
In the wealthier parts of the world, households
had to cope with declining financial assets –
with the only exception of Australia and New
Zealand: Down Under, assets increased by
3.1% in 2018. This was, however, only half the
rate of the previous year and the lowest one
since 2011. Households in these two countries
combined held a total of EUR 3,8 trillion at the
end of 2018, amounting to financial assets per
capita of EUR 126,790. With that, Australians
and New Zealanders are among the richest
households worldwide, almost 50% ahead of
the average Western European. Whereas at
the beginning of the century, Western Europe-
an households used to be slightly richer than
their counterparts Down Under.
Financial assets of households in Western Eu-
rope declined almost in step with North Amer-
ica last year (-0.2% and -0.3%, respectively).
For both regions, it was the first decline since
2008. In Western Europe “only” securities de-
clined (-6.5%), but meagre growth in insurance
and pensions (+1%) and more robust growth in
bank deposits (+4%) were not enough to com-
pensate. In North America, the fall in securities
was much less severe (-1.8%). But as insurance
and pensions also declined (-0.5%) and giv-
en the significance of securities in the overall
portfolio, even robust increases in bank de-
posits (+5.6%) were not sufficient to lift total
asset growth above zero.
ALLIANZ GLOBAL WEALTH REPORT 2019 – DEVELOPMENT IN GLOBAL FINANCIAL ASSETS 25
Economic Research
Total savings of Western European house-
holds amounted to approximately EUR 36.4
trillion or 21.1% of global assets; over the last
decade, the region lost more than five per-
centage points. In contrast, North America lost
only one percentage point over the same time
span; with a share of around 46% in global fi-
nancial assets, the region is by far the richest
on the planet: gross financial assets per capita
amounted to EUR 216,460 at the end of 2018,
compared to an average of EUR 86,420 for
Western Europe. Although the numbers are
slightly distorted by the strong dollar of late,
they remain impressive.
Inflation bites
The significantly higher rates of asset growth
in emerging countries are put into perspec-
tive if we include two factors in the analysis:
development of consumer prices and popula-
tion growth. The latter plays only a minor role;
total population growth in emerging markets
reduces long-term average growth in gross
financial assets by 1 percentage point in per
capita terms, while this demographic effect
comes to half a percentage point in advanced
economies. There is therefore little change
with regard to the major differences.
As far as asset growth in real terms is con-
cerned, however, i.e. minus the general rate
of inflation, the effects are much more pro-
nounced. Per capita asset growth is signifi-
cantly reduced in all regions, but inflation has
the biggest impact on private assets in East-
ern Europe and Latin America, where average
annual growth over the last decade has fall-
en to 3.9% (instead of 9.7%) and 4.4% (instead
of 10.1%) respectively. Asia (excluding Japan)
remains the clear leader in a long-term com-
parison even after deduction of inflation, with
growth of 7.9% p.a. since 2008 (down from
11%).
26
In real terms, growth differentials between ad-
vanced economies are also less pronounced,
with all richer regions clocking up growth of
less than 2.0% a year (real gross per capita
financial assets since 2008). Western Europe
is no longer growing faster than Japan, both
regions manage just 1% after adjustments for
inflation. From that perspective, the question
of “Japanification” is no longer open.
“Old” Europe follows JapanInflation rate and real growth of gross financial assets per capita, in %
Sources: National Central Banks and Statistical Offices,
UN Population Division, Allianz SE.
Real growth, CAGR* 2008-2018 Inflation, average 2008-2018
1.0 1.01.7 1.9
3.9 4.4
7.9
3.1
5.75.8
2.31.7
1.50.4
Jap
an
Wes
tern
Eur
ope
Nor
th A
mer
ica
Oce
ania
East
ern
Euro
pe
Latin
Am
eric
a
Asi
a ex
Jap
an
12
10
8
6
4
2
0

ALLIANZ GLOBAL WEALTH REPORT 2019 – DEVELOPMENT IN GLOBAL FINANCIAL ASSETS 27
Economic Research

Entw
ickl
ung
des
glob
alen
Gel
dver
mög
ens
28

Allia
nz G
loba
l Wea
lth R
epor
t 201
6
29
DEVELOPMENT IN GLOBAL LIABILITIES: LOW INTEREST, HIGH DEBT
30
Despite the obscurity of the economic pan-
orama, worldwide private household liabili-
ties reached new highs of EUR 42.7 trillion in
2018. At 5.7%, the growth rate was a tad be-
low the previous year’s level of 6.0%, but also
well above the long-term average annual
growth rate of 3.6%. Low interest rates make
borrowing more attractive. Debt growth has
accelerated noticeably for the last five years
and is gradually returning to levels last seen
before the financial crisis. Besides low interest
rates, rising house prices are another driver for
debt growth, increasing mortgage volumes. In
some regions of the world, debt grew faster in
2018 than in the previous year, and at a larger
rate than the total world debt growth, espe-
cially in emerging markets (+15.4%), where the
interest rates are nowhere near the zero lower
bound. The rate of growth slightly increased
over the course of the year from 3.1% to 3.2%
in Western Europe, from 7.8 % to 9.5% in Latin
America, from 7.2% to 11.1% in Eastern Europe,
from 5.2% to 6.9% in South Africa, and from
1.9% to 2.3% in Japan. In contrast, borrowing
slowed slightly in North America, where the
Welcome to the debt sideDevelopment of global debt burden Increase of debt by region, in %
North America
Oceania
Western Europe
Japan
Eastern Europe
Latin America
Asia ex Japan
Worldwide
7
6
5
4
3
2
1
0
40
30
20
10
0
*CAGR = Compound Annual Growth Rate.Sources: National Central Banks
and Statistical Offices, Allianz SE.
Liabilities worldwide, in EUR tn (lhs) Change rate y/y, in % (rhs) CAGR* 2008-2018, in % (rhs)20172018 CAGR* 2008-2018
0 2 4 6 8 10 12 14 16
2008
2009
2010
2011
2012
2013
2014
2015
2016
2017
2018
2.4
2.1 2.
7
2.0
2.1
3.4
3.5
4.1
5.5
6.0
5.7
ALLIANZ GLOBAL WEALTH REPORT 2019 – DEVELOPMENT IN GLOBAL LIABILITIES 31
Economic Research
growth rate declined from 3.9% to 3.2%. Al-
though debt growth remained high in the rest
of Asia at 13.8%, the percentage increase was
down compared with the previous year’s fig-
ure of +15.7%. In Oceania, notorious for very
high debt levels, growth declined from 6.5% in
2017 to 4.4% in 2018.
Emerging markets finally gaining territory
Asset and liability distribution across regions
are very similar. The wealthier parts of the
world held almost three-quarters of the glob-
al debt (73.6%) at the end of 2018, with North
America (36.5%) and Western Europe (26.7%)
at the top. Nonetheless, the emerging markets
have been gaining ground. At the beginning
of the 2000s, the advanced economies’ share
was around 90%. The volume of liabilities in
Latin America, Eastern Europe, and Asia (ex-
cluding Japan) has almost quadrupled since
2008, from EUR 3.1 trillion to EUR 11.2 trillion
in 2018.
In the last decade the annual liability growth
(CAGR) has been generally high in emerging
markets such as Eastern Europe (+9.0%), Latin
America (+11.4%), and Asia ex Japan (+14.6%).
But there is not a single story when it comes
to liability growth in the last decade. In East-
ern Europe and Latin America, for example,
households went on a borrowing galore in
the first half of the last decade but have, since
2013, started walking on the safe side by slow-
ing down their spending habits and curving
down their borrowing levels – until last year; as
a consequence, annual growth rates almost
halved in that (short) period. In Asia (exclud-
ing Japan), on the other hand, credit growth
remained more or less constant in both peri-
ods. Private debt has risen by an average of
+14.2% per year since 2014, while between
2008 and 2013 the average growth rate was
only 0.9 percentage points higher. Liabilities in
the region increased almost five-fold over the
decade as a whole and totaled EUR 9.3 trillion
at the end of 2018, 65% of which is related to
China alone. Ten years ago, this figure was
about half of what it is today.
When looking at the debt levels of advanced
economies, the average growth per region is
markedly more demure than in their develop-
ing counterparties. North America reached
household debt levels of EUR 15.5 trillion by
growing on average 1.3% per annum since
the global financial crisis. Western Europe-
ans hold EUR 11.4 trillion in household debt,
32
on average over the last decade they grew by
+2.0%. Japan is at the bottom of the growth
rank, its holdings in household debt amounted
to EUR 2.8 trillion as it grew by only +0.4% per
annum on average. Growth in liabilities hap-
pened mainly in the second half of the dec-
ade as, after the financial crisis, households
in advanced economies had to trim the debt
burdens.
Japan’s extremely expansive monetary policy
has helped the debt growth in the second half
of the decade (+1.8%) and it seems to finally
be bearing some sort of “growth fruit”. House-
holds in North America had to restructure
their balance sheet after the global financial
crisis. The debt burden per capita rose dras-
tically in the years preceding the crisis (CAGR
2003-2007: +7.2% ), but fell to -0.9% from 2008
to 2013 in the midst of the subprime crisis, par-
tially due to the restructuring and down-writ-
ing of non-performing loans. Liabilities growth
in the second half was more positive at +1.8%
per annum as low interest rates have fostered
the demand for credit. In addition, the regu-
lations for lending and borrowing are increas-
ingly relaxed as opposed to the stinginess
immediately after the crisis. A replay of the
debt crisis, however, seems not yet to be on
the cards as the debt service – interest pay-
ments in percentage of disposable income – is
still under control, more so in the United States
(5.7%) than in Canada (14.1%). Total liabili-
ties amounted to EUR 15.5 trillion at the end
of 2018, of which more than 90% sits with US
households.
The financial crisis also had an impact on
the borrowing habits in Western Europe as
households showed restraint and had a very
modest liability growth of only 1.6% for the
decade following the crisis per annum. In the
years preceding the subprime crisis, house-
holds in Greece, Ireland, Portugal and Spain
had a high demand for credit, so much so that
their growth rates were in the double-digit
spectrum. Debts in these four countries have
contracted by a total of EUR 284 billion, or an
average rate of 2.1% per year, since the end
of 2008. In other Western European countries,
however, debts rose by an average of 2.4% per
year in the same period or EUR 2.2 trillion. In
the region as a whole, the trend towards debt
growth has picked up again slightly since 2015.
After borrowing stagnated in 2012 and 2013,
annual growth accelerated continuously and
reached 3.2% last year, the highest growth
rate since 2008. Total debt in the region thus
came to around EUR 11.4 trillion.
Private liabilities in Oceania grew much faster
than in Western Europe and North America,
with annual growth averaging 5.8% over the
last decade. However, last year the growth
rate “down under” was still higher than in
Western Europe at 4.4%, but slowed down
from 2017 onwards +6.2%, while private debt
totaled around EUR 1.6 trillion. Rising house
prices, in particular, have driven up credit
growth, but contracted in the last half of 2018,
thus exhibiting milder growth rates.
ALLIANZ GLOBAL WEALTH REPORT 2019 – DEVELOPMENT IN GLOBAL LIABILITIES 33
Economic Research
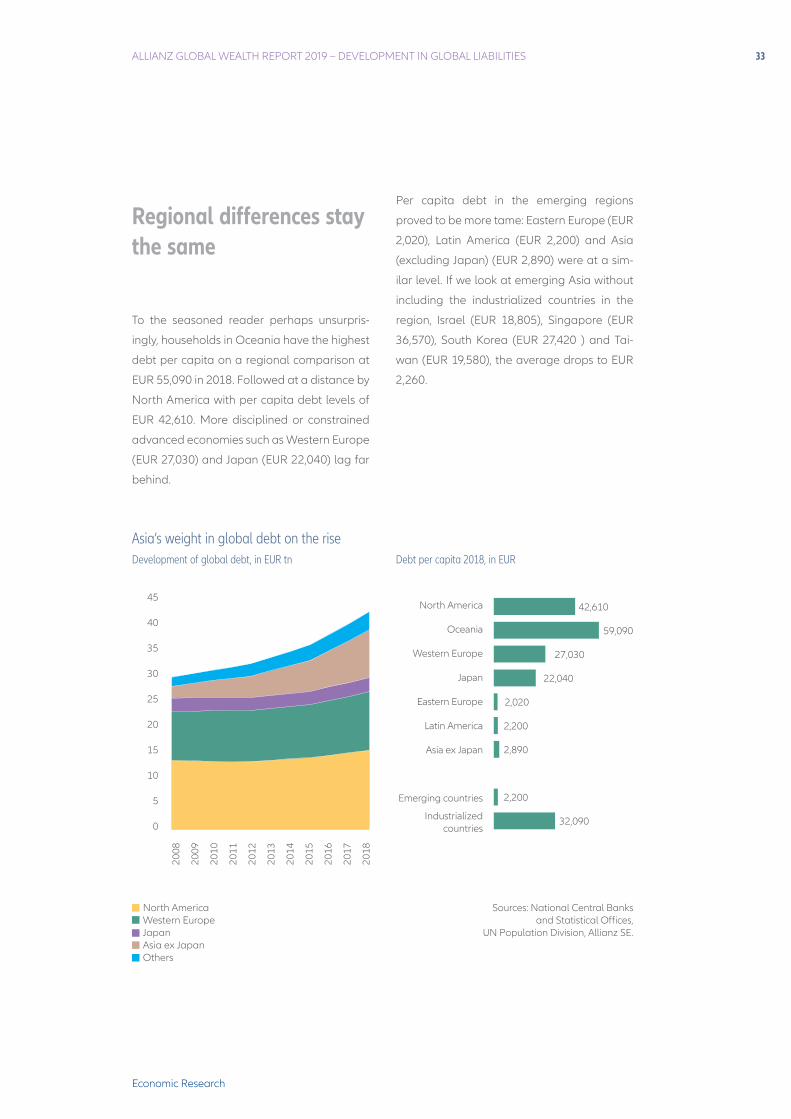
Regional differences stay the same
To the seasoned reader perhaps unsurpris-
ingly, households in Oceania have the highest
debt per capita on a regional comparison at
EUR 55,090 in 2018. Followed at a distance by
North America with per capita debt levels of
EUR 42,610. More disciplined or constrained
advanced economies such as Western Europe
(EUR 27,030) and Japan (EUR 22,040) lag far
behind.
Per capita debt in the emerging regions
proved to be more tame: Eastern Europe (EUR
2,020), Latin America (EUR 2,200) and Asia
(excluding Japan) (EUR 2,890) were at a sim-
ilar level. If we look at emerging Asia without
including the industrialized countries in the
region, Israel (EUR 18,805), Singapore (EUR
36,570), South Korea (EUR 27,420 ) and Tai-
wan (EUR 19,580), the average drops to EUR
2,260.
North America Western EuropeJapanAsia ex Japan Others
Asia’s weight in global debt on the riseDevelopment of global debt, in EUR tn Debt per capita 2018, in EUR
North America
Oceania
Western Europe
Japan
Eastern Europe
Latin America
Asia ex Japan
Emerging countries
45
40
35
30
25
20
15
10
5
0
Sources: National Central Banks and Statistical Offices,
UN Population Division, Allianz SE.
2008
2009
2010
2011
2012
2013
2014
2015
2016
2017
2018
42,610
59,090
27,030
22,040
2,020
2,200
2,890
2,200
32,090Industrialized countries
34
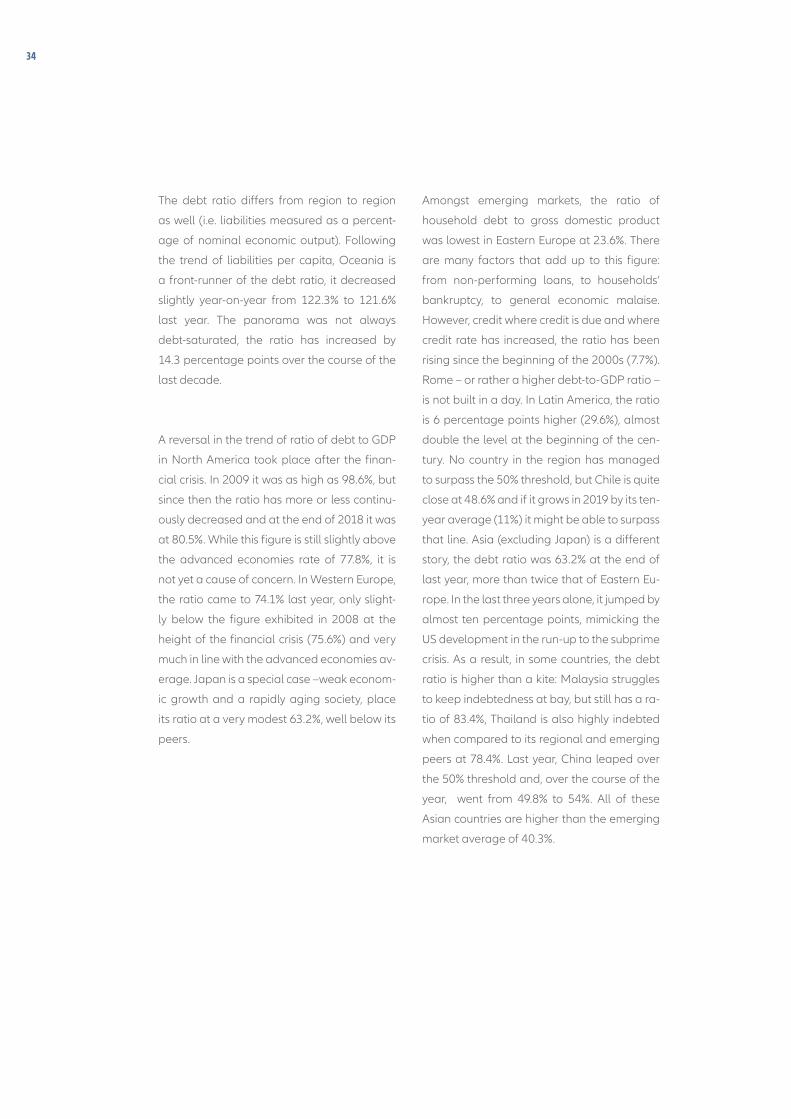
The debt ratio differs from region to region
as well (i.e. liabilities measured as a percent-
age of nominal economic output). Following
the trend of liabilities per capita, Oceania is
a front-runner of the debt ratio, it decreased
slightly year-on-year from 122.3% to 121.6%
last year. The panorama was not always
debt-saturated, the ratio has increased by
14.3 percentage points over the course of the
last decade.
A reversal in the trend of ratio of debt to GDP
in North America took place after the finan-
cial crisis. In 2009 it was as high as 98.6%, but
since then the ratio has more or less continu-
ously decreased and at the end of 2018 it was
at 80.5%. While this figure is still slightly above
the advanced economies rate of 77.8%, it is
not yet a cause of concern. In Western Europe,
the ratio came to 74.1% last year, only slight-
ly below the figure exhibited in 2008 at the
height of the financial crisis (75.6%) and very
much in line with the advanced economies av-
erage. Japan is a special case –weak econom-
ic growth and a rapidly aging society, place
its ratio at a very modest 63.2%, well below its
peers.
Amongst emerging markets, the ratio of
household debt to gross domestic product
was lowest in Eastern Europe at 23.6%. There
are many factors that add up to this figure:
from non-performing loans, to households’
bankruptcy, to general economic malaise.
However, credit where credit is due and where
credit rate has increased, the ratio has been
rising since the beginning of the 2000s (7.7%).
Rome – or rather a higher debt-to-GDP ratio –
is not built in a day. In Latin America, the ratio
is 6 percentage points higher (29.6%), almost
double the level at the beginning of the cen-
tury. No country in the region has managed
to surpass the 50% threshold, but Chile is quite
close at 48.6% and if it grows in 2019 by its ten-
year average (11%) it might be able to surpass
that line. Asia (excluding Japan) is a different
story, the debt ratio was 63.2% at the end of
last year, more than twice that of Eastern Eu-
rope. In the last three years alone, it jumped by
almost ten percentage points, mimicking the
US development in the run-up to the subprime
crisis. As a result, in some countries, the debt
ratio is higher than a kite: Malaysia struggles
to keep indebtedness at bay, but still has a ra-
tio of 83.4%, Thailand is also highly indebted
when compared to its regional and emerging
peers at 78.4%. Last year, China leaped over
the 50% threshold and, over the course of the
year, went from 49.8% to 54%. All of these
Asian countries are higher than the emerging
market average of 40.3%.
ALLIANZ GLOBAL WEALTH REPORT 2019 – DEVELOPMENT IN GLOBAL LIABILITIES 35
Economic Research
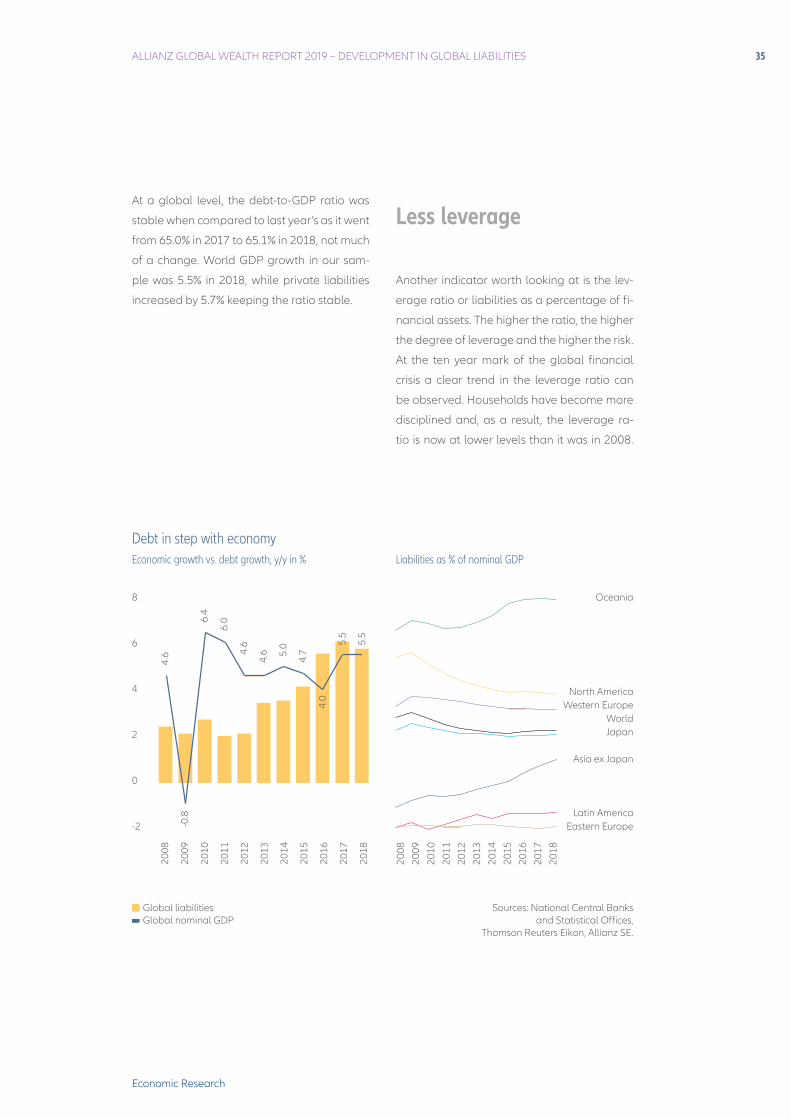
At a global level, the debt-to-GDP ratio was
stable when compared to last year’s as it went
from 65.0% in 2017 to 65.1% in 2018, not much
of a change. World GDP growth in our sam-
ple was 5.5% in 2018, while private liabilities
increased by 5.7% keeping the ratio stable.
Less leverage
Another indicator worth looking at is the lev-
erage ratio or liabilities as a percentage of fi-
nancial assets. The higher the ratio, the higher
the degree of leverage and the higher the risk.
At the ten year mark of the global financial
crisis a clear trend in the leverage ratio can
be observed. Households have become more
disciplined and, as a result, the leverage ra-
tio is now at lower levels than it was in 2008.
Debt in step with economyEconomic growth vs. debt growth, y/y in % Liabilities as % of nominal GDP
Sources: National Central Banks and Statistical Offices,
Thomson Reuters Eikon, Allianz SE.
Oceania
North AmericaWestern Europe
WorldJapan
Asia ex Japan
Latin AmericaEastern Europe
8
6
4
2
0
-2
Global liabilities Global nominal GDP
2008
2009
2010
2011
2012
2013
2014
2015
2016
2017
2018
2008
2009
2010
2011
2012
2013
2014
2015
2016
2017
2018
4.6
-0.8
6.4
6.0
4.6
4.6 5.
0
4.7
4.0
5.5
5.5
36
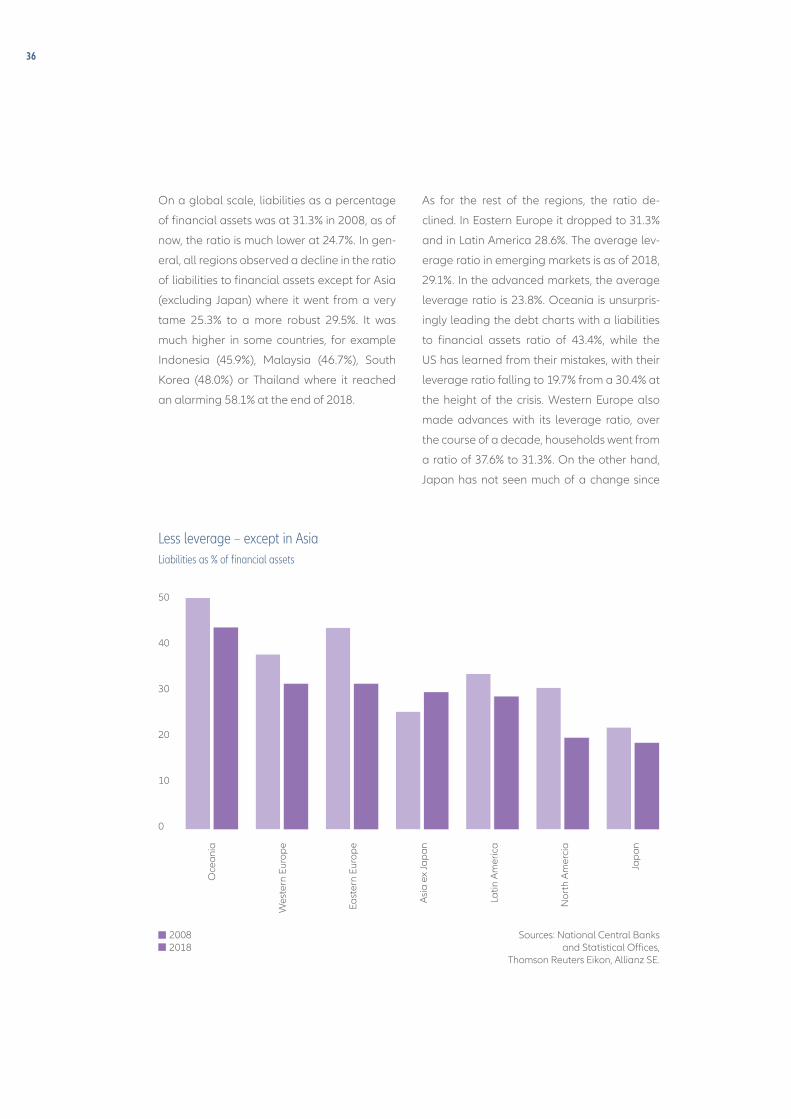
On a global scale, liabilities as a percentage
of financial assets was at 31.3% in 2008, as of
now, the ratio is much lower at 24.7%. In gen-
eral, all regions observed a decline in the ratio
of liabilities to financial assets except for Asia
(excluding Japan) where it went from a very
tame 25.3% to a more robust 29.5%. It was
much higher in some countries, for example
Indonesia (45.9%), Malaysia (46.7%), South
Korea (48.0%) or Thailand where it reached
an alarming 58.1% at the end of 2018.
As for the rest of the regions, the ratio de-
clined. In Eastern Europe it dropped to 31.3%
and in Latin America 28.6%. The average lev-
erage ratio in emerging markets is as of 2018,
29.1%. In the advanced markets, the average
leverage ratio is 23.8%. Oceania is unsurpris-
ingly leading the debt charts with a liabilities
to financial assets ratio of 43.4%, while the
US has learned from their mistakes, with their
leverage ratio falling to 19.7% from a 30.4% at
the height of the crisis. Western Europe also
made advances with its leverage ratio, over
the course of a decade, households went from
a ratio of 37.6% to 31.3%. On the other hand,
Japan has not seen much of a change since
Less leverage – except in AsiaLiabilities as % of financial assets
Sources: National Central Banks and Statistical Offices,
Thomson Reuters Eikon, Allianz SE.
50
40
30
20
10
0
2008 2018
Oce
ania
Wes
tern
Eur
ope
East
ern
Euro
pe
Asi
a ex
Jap
an
Latin
Am
eric
a
Nor
th A
mer
cia
Jap
an
ALLIANZ GLOBAL WEALTH REPORT 2019 – DEVELOPMENT IN GLOBAL LIABILITIES 37
Economic Research
2008 (21.9%), today its debt ratio has fallen
to a tame 18.6%. With the low level of inter-
est rates, it is – at present – hard to imagine
debt leverage and debt services causing a sys-
temic risk, however countries like Norway
(77%), Australia (46.7%), Denmark (45.1%),
Greece (43.8%), and Portugal (41.5%) should
be weary of their borrowing behavior.
A large wealth gap between the regions
When looking at financial assets free from the
weight of liabilities we are left with net finan-
cial assets. This year net financial assets fell
slightly from 2017’s record high of EUR 132.4
trillion to EUR 129.8 trillion on a global level.
Debt growth (+5.7%) surpassed asset growth
(-0.1%) which made net wealth fall by 1.9% in
2018, clearly lower than the average growth
of 5.5% in the last decade.
When looking at the regional distribution
of wealth, we see the same story over and
over again: huge gaps in net financial assets
between households in richer regions and
in poorer ones. North America remains the
richest region in the world, with average per
capita assets of EUR 173,850 last year after
deduction of liabilities. On the other hand,
Eastern Europe was the region with the low-
est net financial assets. At the end of 2018,
households had an average of EUR 4,430
per capita. This means that North Americans
had 39 times the assets of Eastern Europeans.
Nevertheless, this factor was as high as 68 ten
years ago.
Japanese households are also having a pros-
perous moment, their net assets per capita
holdings were EUR 96,310 at the end of 2018.
However, they used to lead the charts in Asia
Pacific, but there are new winners in town:
Singapore with net assets per capita of EUR
100,370, closely followed by Taiwan at EUR
97,850. Due to high debt levels, average net
financial assets of households in Australia and
New Zealand came to EUR 71,700 per capita
on average, well below the figure for Japan.
Leaving liabilities out of the equation, house-
holds in Oceania had average gross financial
assets of EUR 126,800 per capita, putting
them ahead of their Japanese counterparts
(EUR 118,350), but also more in debt. In West-
ern Europe the net financial assets per capita
were less impressive at the end of 2018, com-
ing in at EUR 59,390. The gap between the
east and the west of Europe has not narrowed
nearly enough compared to their Eastern
neighbors (EUR 4,430 net assets per capita).
38
Eastern Europe claims the top spot
Net financial assets per capita have grown
very dynamically over the last decade in
emerging markets. But given the rapid in-
crease in liabilities and the drop in assets in
2018, Asia (ex. Japan) is no longer the only
growth champion. Net per capita financial
assets in this region have grown at a rate of
10.2% per year since 2008. However, last year
the region’s net wealth decreased by 6.7%
mainly due to a dip in Chinese households’ net
wealth (y-o-y: -10.6%). In Eastern Europe, per
capita assets have risen at an average annual
rate of 10.3% in net terms since 2008, owing to
a decline in debt growth. Latin America, finally,
clocked a growth rate of 10.1% over the dec-
ade. Both regions had positive growth rates
in 2018 as well, of 6.3% and 5.1%, respectively.
Sources: National Central Banks and Statistical Offices, UN Population Division, Allianz SE.
Same old storyNet financial assets per capita in EUR, 2018
59,392
4,428
96,308
71,702
6,908
5,483
Western Europe
Eastern Eruope
Japan
Oceania
Asia ex Japan
Latin America
2007
2008
2009
2010
2011
2012
2013
2014
2015
2016
2017
2007
2008
2009
2010
2011
2012
2013
2014
2015
2016
2017
2007
2008
2009
2010
2011
2012
2013
2014
2015
2016
2017
2007
2008
2009
2010
2011
2012
2013
2014
2015
2016
2017
2007
2008
2009
2010
2011
2012
2013
2014
2015
2016
2017
2007
2008
2009
2010
2011
2012
2013
2014
2015
2016
2017
173,849
North America
2008
2009
2010
2011
2012
2013
2014
2015
2016
2017
2018
ALLIANZ GLOBAL WEALTH REPORT 2019 – DEVELOPMENT IN GLOBAL LIABILITIES 39
Economic Research
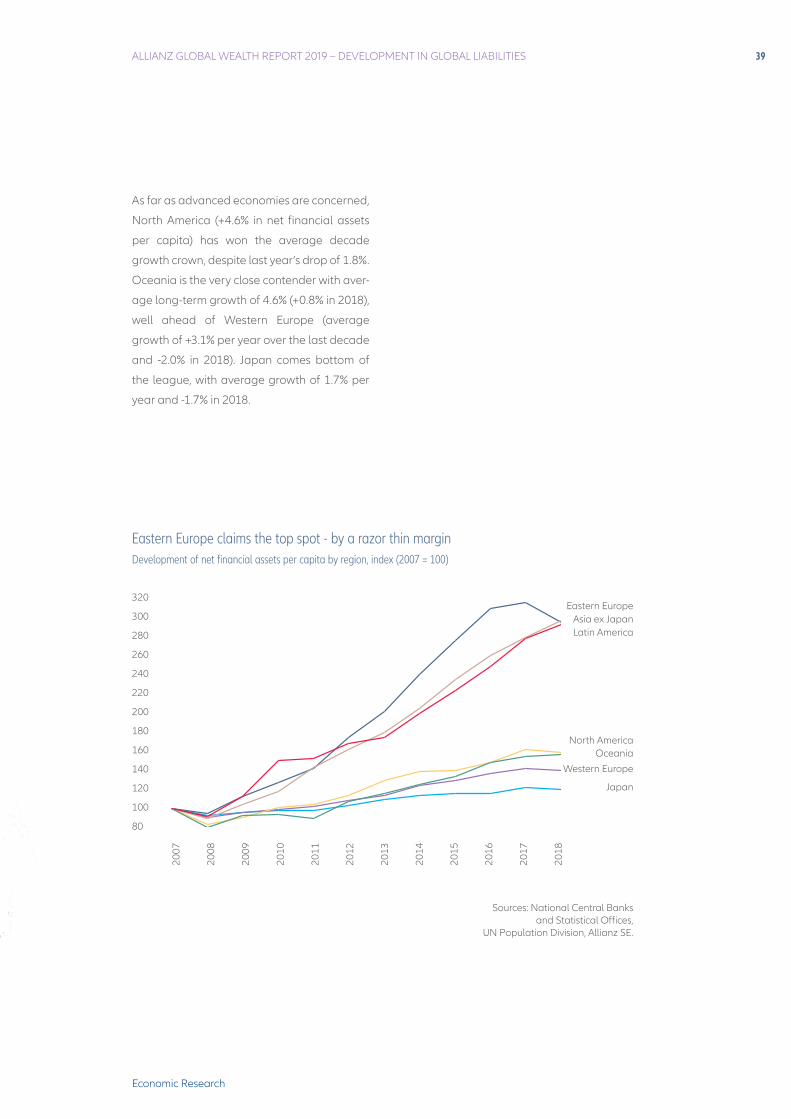
As far as advanced economies are concerned,
North America (+4.6% in net financial assets
per capita) has won the average decade
growth crown, despite last year’s drop of 1.8%.
Oceania is the very close contender with aver-
age long-term growth of 4.6% (+0.8% in 2018),
well ahead of Western Europe (average
growth of +3.1% per year over the last decade
and -2.0% in 2018). Japan comes bottom of
the league, with average growth of 1.7% per
year and -1.7% in 2018.
Eastern Europe claims the top spot - by a razor thin marginDevelopment of net financial assets per capita by region, index (2007 = 100)
Sources: National Central Banks and Statistical Offices,
UN Population Division, Allianz SE.
Eastern EuropeAsia ex JapanLatin America
North AmericaOceania
Western Europe
Japan
320
300
280
260
240
220
200
180
160
140
120
100
80
2007
2008
2009
2010
2011
2012
2013
2014
2015
2016
2017
2018

40

ALLIANZ GLOBAL WEALTH REPORT 2019 41
Economic Research
WEALTH DISTRIBUTION: THE RESISTIBLE RISE OF THE WEALTH MIDDLE CLASS
42
The last decades were characterized by two
opposing trends: less inequality between
countries, exemplified by the rise of a new
global wealth middle class, and more inequal-
ity within countries, in particular in industrial-
ized countries. One of these trends stalled in
2018: For the first time in over a decade, the
global middle class did not grow. Just a bump
in the road or a turning point?
It’s undeniable that the rise of the global
wealth middle class is deeply intertwined
with the process of globalization. The integra-
tion of formerly marginalized countries into
global value chains – from Eastern Europe
to South-East Asia – was the spark that ignit-
ed an explosion of wealth in these countries.
Many thought of this process as a natural,
quasi-automatic development that leads to
an ever more integrated world, governed by
shared principles and rules. Although cracks
in the global edifice were visible through all
the years, in 2018 they became glaring as the
trade dispute between the US and China esca-
lated. If anything, the politics of US President
Donald Trump have debunked the blind faith
in the irreversibility of globalization. The up-
shot: Further convergence in wealth between
countries, i.e. between the rich West and the
poorer East, can no longer be taken for grant-
ed. 2018 is a strong reminder that if the wheel
of globalization is turned back the great suc-
cess story of the past – the parallel reduction
of poverty and increase in prosperity in many
parts of the world – might unravel, too.
It would be a great pity. Because the advance-
ments are impressive – but not yet complete.
Huge progress: The global perspective
As in previous years, when examining the
global context of wealth distribution, i.e. the
relationships between countries, we have di-
vided all households/individuals into global
wealth classes. This classification is based on
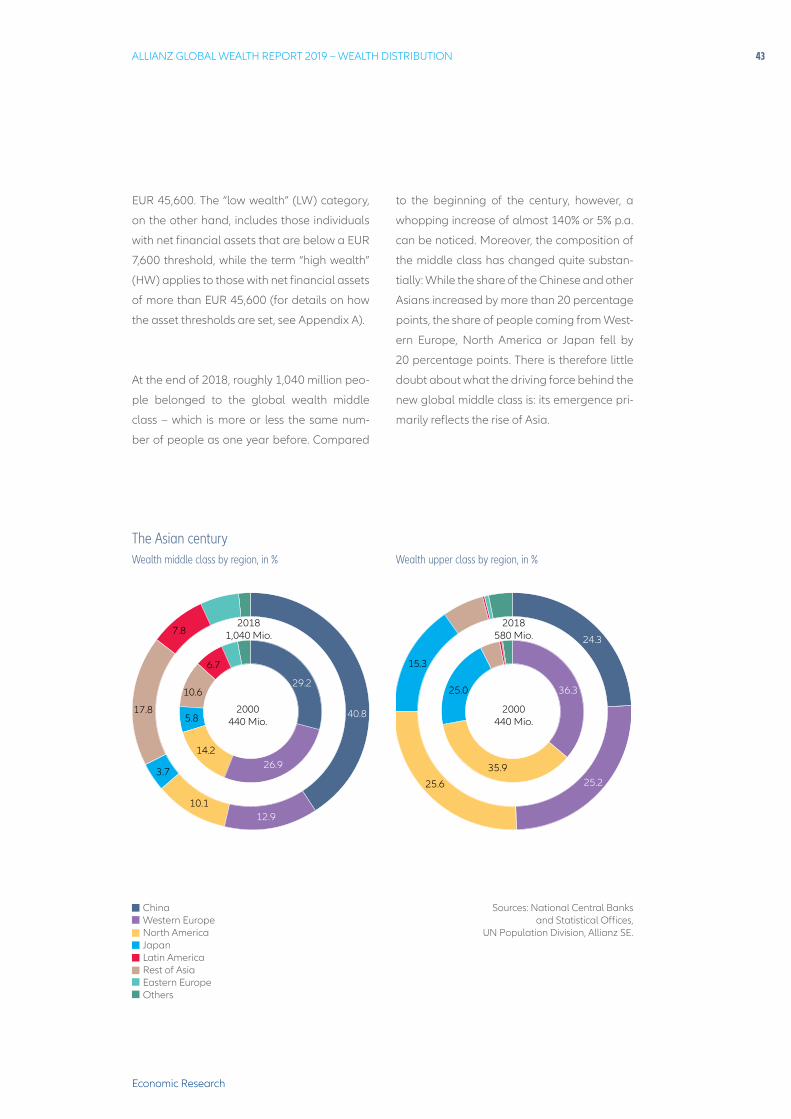
worldwide average net financial assets per
capita, which stood at EUR 25,360 in 2018,
more than twice as high as in 2000. The glob-
al wealth middle class (“middle wealth”, MW)
includes all individuals with assets of between
30% and 180% of the global average. This
means that for 2018, asset thresholds for the
global wealth middle class are EUR 7,600 and
ALLIANZ GLOBAL WEALTH REPORT 2019 – WEALTH DISTRIBUTION 43
Economic Research
2000 440 Mio.
EUR 45,600. The “low wealth” (LW) category,
on the other hand, includes those individuals
with net financial assets that are below a EUR
7,600 threshold, while the term “high wealth”
(HW) applies to those with net financial assets
of more than EUR 45,600 (for details on how
the asset thresholds are set, see Appendix A).
At the end of 2018, roughly 1,040 million peo-
ple belonged to the global wealth middle
class – which is more or less the same num-
ber of people as one year before. Compared
to the beginning of the century, however, a
whopping increase of almost 140% or 5% p.a.
can be noticed. Moreover, the composition of
the middle class has changed quite substan-
tially: While the share of the Chinese and other
Asians increased by more than 20 percentage
points, the share of people coming from West-
ern Europe, North America or Japan fell by
20 percentage points. There is therefore little
doubt about what the driving force behind the
new global middle class is: its emergence pri-
marily reflects the rise of Asia.
The Asian centuryWealth middle class by region, in % Wealth upper class by region, in %
Sources: National Central Banks and Statistical Offices,
UN Population Division, Allianz SE.
ChinaWestern EuropeNorth AmericaJapanLatin AmericaRest of AsiaEastern EuropeOthers
40.8
24.3
29.236.3
26.9
25.2
12.9
14.2
35.9
5.8
3.7
10.1
25.6
17.8
7.8
15.3
2018 580 Mio.
2018 1,040 Mio.
2000 440 Mio.
6.7
25.010.6
44
The change in the global wealth upper class
is more modest: It grew by more than 30% or
1.6% p.a. to around 580 million people, also
in line with the 2017 figure. The set-up of the
upper class, however, changed dramatically.
In 2000, it was made up almost exclusively
of Western Europeans, Americans and Japa-
nese, accounting for well over 90%; this share
has dropped to 66%. Hence, a quarter of the
upper class speaks Chinese today.
Where do the new members of the wealth
middle and upper class come from? In the
case of the middle class, the main source is so-
cial rise from lower classes. Almost 600 million
people have moved up to join the ranks of the
global wealth middle class since 2000 – and
two thirds were recruited from China alone.
But social descent occurred as well: Around 50
million people joining the middle class have
moved down the scale, i.e. as households that
have been “relegated” from the high wealth
class; this phenomenon affects only the US
and Western Europe. A further source is simply
population growth to the tune of 120 million
people. But at the same time, 160 million peo-
ple also left the middle class, with the over-
whelming majority considering themselves
now part of the global wealth upper class.
Accordingly, the biggest source for the in-
crease in the number of people belonging to
the global wealth upper class is the rise from
the middle class. Population growth of around
50 million people was just enough to compen-
sate for the “bloodletting” in the old industrial-
ized countries.
A final word on the global wealth lower class.
With 3,500 million people, it is not only by far
the biggest class – more than two thirds of
the population in the countries analyzed are
considered as “low wealth” – but its size has
also barely changed since the turn of the mil-
lennium. The class, however, is far from static.
The unchanged total number disguises huge
movements: As said before, roughly 600 mil-
lion people were able to leave the low wealth
class behind them and joined the middle
class. But as the population grew in equal di-
mensions, this does not show up in the overall
figures. Furthermore, there was also – a much
smaller – movement in the opposite direction:
around 16 million people – all of them West-
ern Europeans – moved down from middle to
low wealth class.
When analyzing the movements between
classes, one thing becomes evident: Where-
as Asian countries – first and foremost China
– can look back on two decades of mostly
social rise, the picture for Western Europeans
and Americans is bleaker. In fact, it’s only in
these two regions that the low wealth class
ALLIANZ GLOBAL WEALTH REPORT 2019 – WEALTH DISTRIBUTION 45
Economic Research
has increased – by 4% of the population in
Western Europe – and the high wealth class
has decreased – by 6% and 9% of the popu-
lation in Western Europe and North America,
respectively –, when adjusted for population
growth. The scars of the crisis years have not
yet healed but remain visible in the wealth dis-
tribution. In that regard, even Japan fared bet-
ter, reducing the number of people that be-
long to the global low wealth class by around
10% of the population.
Much room for further development
Impressive as the rise of many Asian and
particularly Chinese households may be, the
story is by no means told to the end. A simple
calculation shows: If other heavily populat-
ed countries such as Brazil, Russia, Indonesia
and in particular India would have had a level
and distribution of wealth comparable to Chi-
na, the global wealth middle class would be
boosted by around 350 million people and
Europe’s and America’s lost decades Change in low wealth class population since 2000, in % of total population (adjusted for population growth)
Change in high wealth class population since 2000, in % of total population (adjusted for population growth)
Sources: National Central Banks and Statistical Offices,
UN Population Division, Allianz SE.
Chi
na
East
ern
Euro
pe
Jap
an
Latin
Am
eric
a
Res
t of A
sia
Res
t of W
orld
Nor
th A
mer
ica
Wes
tern
Eur
ope
Chi
na
Res
t of W
orld
East
ern
Euro
pe
Res
t of A
sia
Latin
Am
eric
a
Jap
an
Wes
tern
Eur
ope
Nor
th A
mer
ica
5
0
-5
-10
-15
-20
-25
-30
10
5
0
-5
-10
46
the global wealth upper class by around 200
million people.
Moreover, the progress over the last two dec-
ades notwithstanding, the concentration of
wealth is still extremely high from a global
perspective. This becomes clear if we break
down the overall population of the countries
we have analyzed into population deciles
based on net financial assets.
This shows that the richest 10% worldwide
together own roughly 82% of total net finan-
cial assets; among them, the richest 1% – with
average net financial assets of above EUR 1
million – own almost 43%. On the other end of
the spectrum, for the lower half of the popu-
lation, about 2.5 billion people, less than 1% is
left. The latter figure must be interpreted with
caution, however, as those with the fewest as-
sets also include many people from the richest
countries who are in debt; the “poorest” glob-
al population decile actually has negative net
financial assets, but high levels of debt can-
The winners have to share Change in share of total net financial assets by global population decile, in percentage points
4
2
0
-2
-4
-6
-8
-10
Sources: National Central Banks and Statistical Offices, UN Population Division, Allianz SE.
1. D
ecile
2. D
ecile
3. D
ecile
4. D
ecile
5. D
ecile
6. D
ecile
7. D
ecile
8. D
ecile
9. D
ecile
10. D
ecile
ALLIANZ GLOBAL WEALTH REPORT 2019 – WEALTH DISTRIBUTION 47
Economic Research
not necessarily be equated with poverty. The
Scandinavian countries are a good example
of this. Households in Denmark and Sweden
are among the most highly indebted world-
wide, with up to 30% of the population there
having higher liabilities than financial assets.
However, these high debts are generally like-
ly to be offset by tangible assets, particularly
property. A happy home owner in Denmark
should not be confused with a penniless day
laborer in India.
As a consequence of this high global wealth
concentration, there is also a wide gulf be-
tween the global median (the so-called “mid-
dle value” separating the richer half from the
poorer half of the global population) and the
global average of net financial assets. Where-
as median net financial assets amount to EUR
2,260 per capita, the average figure is more
than ten times as high (EUR 25,360).
At least, the trend of wealth concentration is
moving in the right direction. Compared with
2000, the share of the richest decile of the
population in total assets dropped by more
than 8 percentage points. In contrast, all oth-
er population deciles increased their share of
the global wealth pie, with the exception of
the poorest decile, where debt continued to
rise. Also with regard to the median value of
net financial assets, the last two decades have
seen much progress: The median value grew
by 11.9% p.a. since 2000, almost three times as
fast as average net financial assets which in-
creased by 4.4% over the same time span.
So, the overall development is rather encour-
aging – even if there is still undoubtedly a very
long way to go. This becomes evident when
global wealth concentration is compared to
the situation within countries: The share of the
richest decile in national wealth is “only” 53%
(unweighted average of all countries analyz-
ed).
In conclusion, the distribution of financial as-
sets remains extremely unequal at global
level. However, the years of rampant globali-
zation had left their positive mark: The glob-
al middle is becoming broader and richer.
Recent political developments, however, are
about to break the decades long trend to-
wards greater global openness.
Mind the gap: The na-tional perspective
By average net financial assets, the USA are
the richest country in the world, not least
thanks to the strong dollar. But if we drew up
our rankings of the world’s richest countries
based on median values, they would look
different. The US would slide by a whopping
12 ranks from the top spot to 13th place. Also
Singapore (from third to sixth place), Sweden
(from seventh to 12th place), Denmark (from
tenth to 22nd place) and UK (from 12th to 16th
place) would drop significantly. In all these
countries the difference between median and
average values tend to be bigger than in most
other countries. For all countries analyzed, the
48
(unweighted) average for the median value
expressed as percentage of the average val-
ue is 44%. In the US, in contrast, this number
is just 15%; in the UK and Sweden it comes to
around 30%.
But there are also several countries for which
the opposite is true. Japan, Belgium and Ire-
land climbed the rankings each by four plac-
es; Australia and Italy jumped by six and sev-
en places, respectively. Accordingly, the gap
between median and average values is much
smaller in these countries. In Australia, for ex-
ample, the median value amounts to 56% of
the average, in Italy to 65%, and in Japan to
68%.
The alternative rankings naturally only pro-
vide a snapshot of the current situation. The
long-term development of wealth distribution
The alternative rankingMedian and average net financial assets per capita 2018, in EUR
Average MedianUSA
SwitzerlandSingapore
TaiwanNetherlands
JapanSwedenBelgium
New ZealandDenmark
CanadaUK
IsraelAustralia
FranceAustria
ItalyGermany
IrelandSouth Korea
SwitzerlandJapan
NetherlandsBelgium
TaiwanSingapore
New ZealandAustraliaCanada
ItalyIsrael
SwedenUSA
FranceIreland
UKAustria
South KoreaSpain
Germany
Sources: National Central Banks and Statistical Offices,
UN Population Division, Allianz SE.
0
30,0
00
60,0
00
90,0
00
120,
000
150,
000
180,
000 0
30,0
00
60,0
00
90,0
00
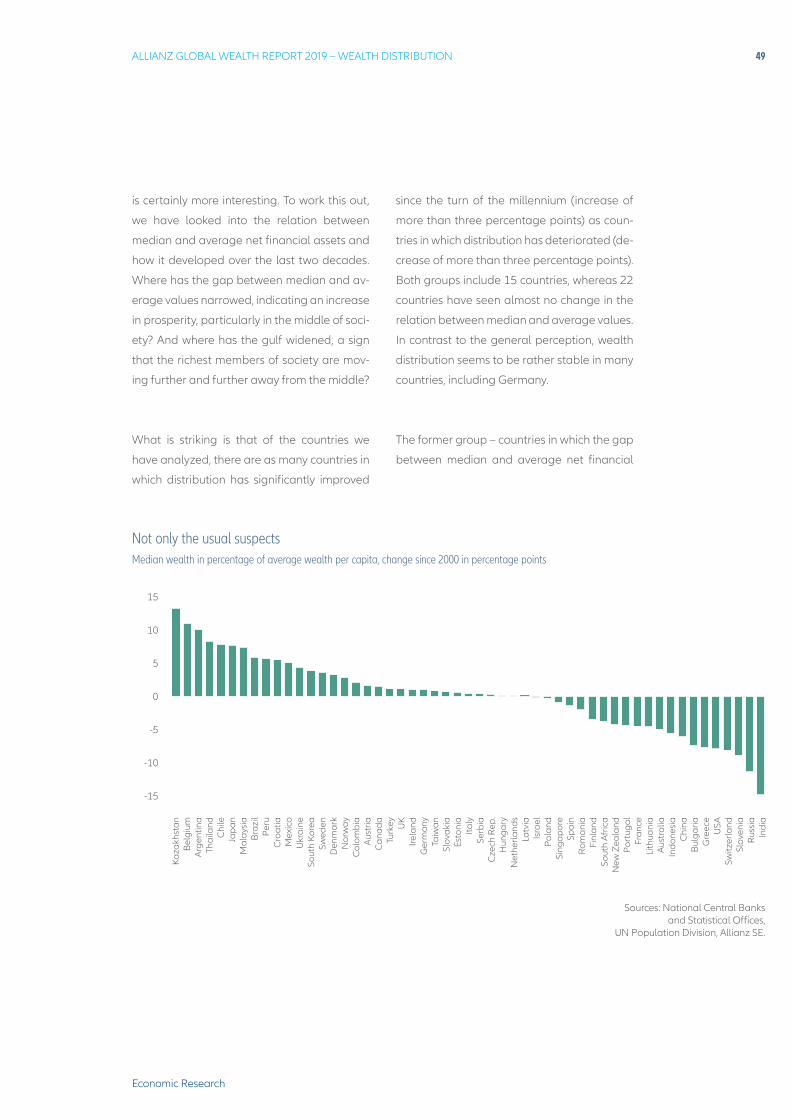
ALLIANZ GLOBAL WEALTH REPORT 2019 – WEALTH DISTRIBUTION 49
Economic Research
is certainly more interesting. To work this out,
we have looked into the relation between
median and average net financial assets and
how it developed over the last two decades.
Where has the gap between median and av-
erage values narrowed, indicating an increase
in prosperity, particularly in the middle of soci-
ety? And where has the gulf widened, a sign
that the richest members of society are mov-
ing further and further away from the middle?
What is striking is that of the countries we
have analyzed, there are as many countries in
which distribution has significantly improved
since the turn of the millennium (increase of
more than three percentage points) as coun-
tries in which distribution has deteriorated (de-
crease of more than three percentage points).
Both groups include 15 countries, whereas 22
countries have seen almost no change in the
relation between median and average values.
In contrast to the general perception, wealth
distribution seems to be rather stable in many
countries, including Germany.
The former group – countries in which the gap
between median and average net financial
Not only the usual suspectsMedian wealth in percentage of average wealth per capita, change since 2000 in percentage points
15
10
5
0
-5
-10
-15
Sources: National Central Banks and Statistical Offices,
UN Population Division, Allianz SE.
Kaza
khst
anB
elgi
umA
rgen
tina
Thai
land
Chi
leJa
pan
Mal
aysi
aB
razi
lP
eru
Cro
atia
Mex
ico
Ukr
aine
Sout
h Ko
rea
Swed
enD
enm
ark
Nor
way
Col
ombi
aA
ustr
iaC
anad
aTu
rkey UK
Irela
ndG
erm
any
Taiw
anSl
ovak
iaEs
toni
aIta
lySe
rbia
Cze
ch R
ep.
Hun
gary
Net
herla
nds
Latv
iaIs
rael
Pol
and
Sing
apor
eSp
ain
Rom
ania
Finl
and
Sout
h A
fric
aN
ew Z
eala
ndP
ortu
gal
Fran
ceLi
thua
nia
Aus
tral
iaIn
done
sia
Chi
naB
ulga
riaG
reec
eU
SASw
itzer
land
Slov
enia
Rus
sia
Indi
a
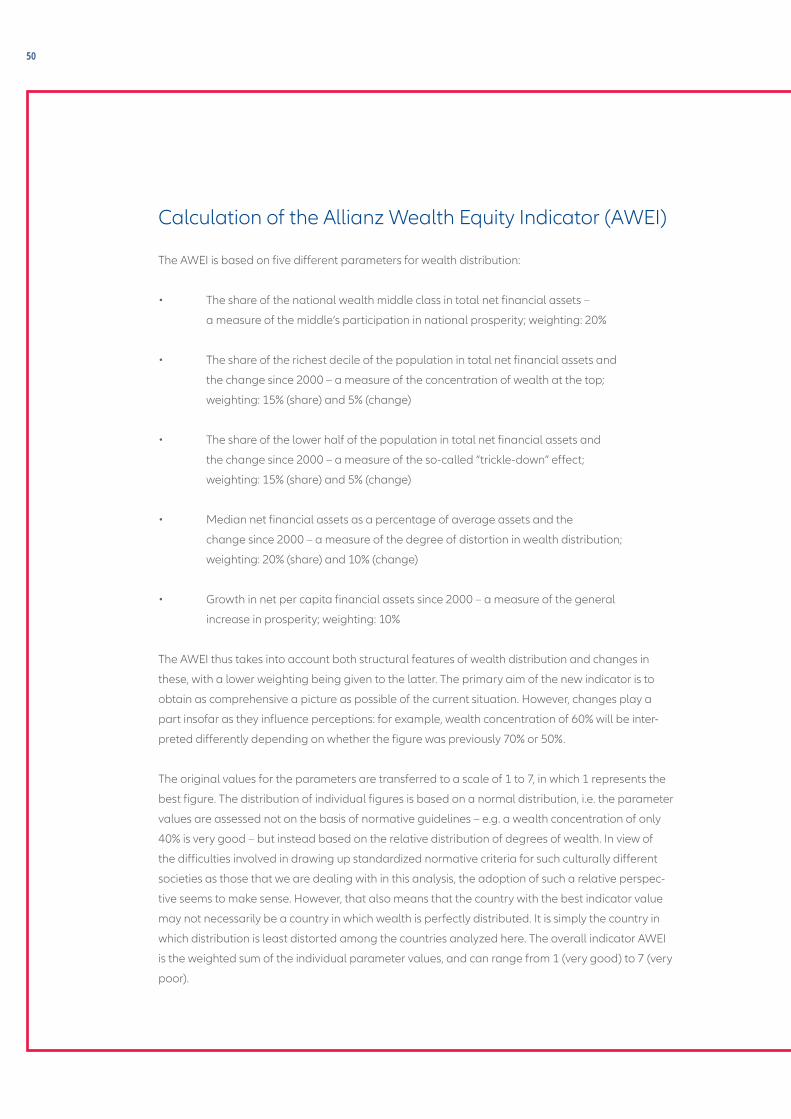
50
Calculation of the Allianz Wealth Equity Indicator (AWEI)
The AWEI is based on five different parameters for wealth distribution:
• The share of the national wealth middle class in total net financial assets –
a measure of the middle’s participation in national prosperity; weighting: 20%
• The share of the richest decile of the population in total net financial assets and
the change since 2000 – a measure of the concentration of wealth at the top;
weighting: 15% (share) and 5% (change)
• The share of the lower half of the population in total net financial assets and
the change since 2000 – a measure of the so-called “trickle-down” effect;
weighting: 15% (share) and 5% (change)
• Median net financial assets as a percentage of average assets and the
change since 2000 – a measure of the degree of distortion in wealth distribution;
weighting: 20% (share) and 10% (change)
• Growth in net per capita financial assets since 2000 – a measure of the general
increase in prosperity; weighting: 10%
The AWEI thus takes into account both structural features of wealth distribution and changes in
these, with a lower weighting being given to the latter. The primary aim of the new indicator is to
obtain as comprehensive a picture as possible of the current situation. However, changes play a
part insofar as they influence perceptions: for example, wealth concentration of 60% will be inter-
preted differently depending on whether the figure was previously 70% or 50%.
The original values for the parameters are transferred to a scale of 1 to 7, in which 1 represents the
best figure. The distribution of individual figures is based on a normal distribution, i.e. the parameter
values are assessed not on the basis of normative guidelines – e.g. a wealth concentration of only
40% is very good – but instead based on the relative distribution of degrees of wealth. In view of
the difficulties involved in drawing up standardized normative criteria for such culturally different
societies as those that we are dealing with in this analysis, the adoption of such a relative perspec-
tive seems to make sense. However, that also means that the country with the best indicator value
may not necessarily be a country in which wealth is perfectly distributed. It is simply the country in
which distribution is least distorted among the countries analyzed here. The overall indicator AWEI
is the weighted sum of the individual parameter values, and can range from 1 (very good) to 7 (very
poor).
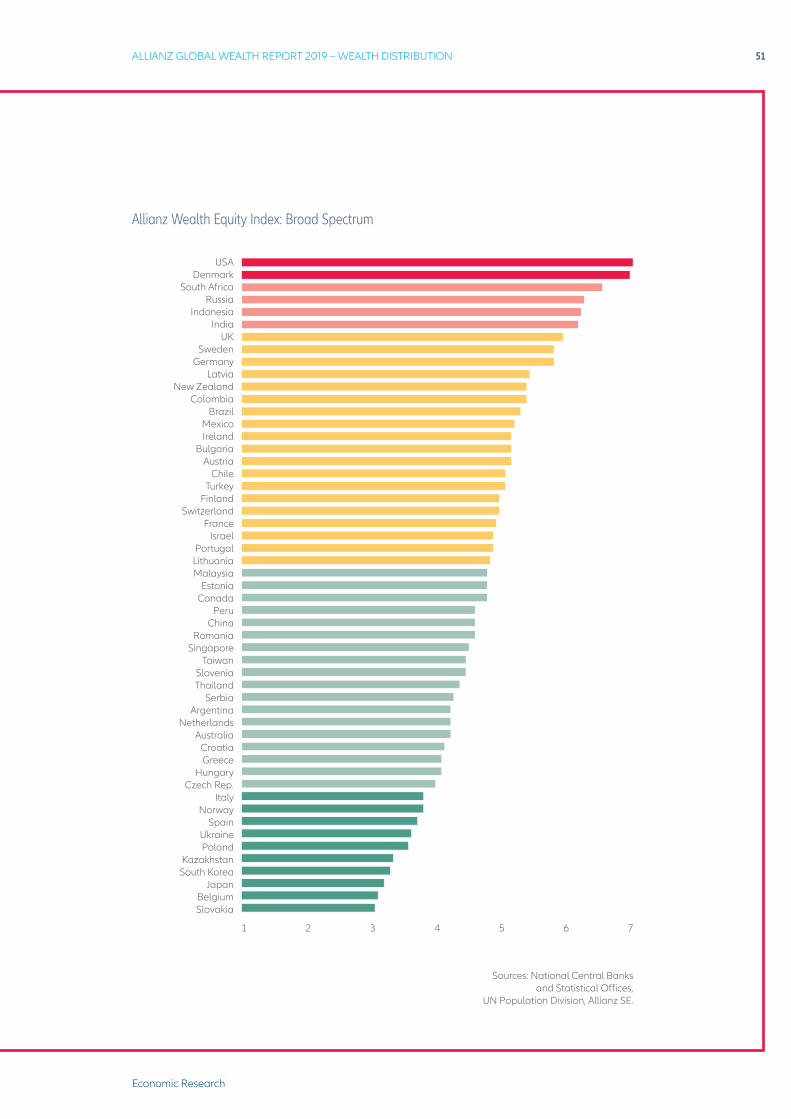
ALLIANZ GLOBAL WEALTH REPORT 2019 – WEALTH DISTRIBUTION 51
Economic Research
USADenmark
South AfricaRussia
IndonesiaIndia
UKSweden
GermanyLatvia
New ZealandColombia
BrazilMexicoIreland
BulgariaAustria
ChileTurkey
FinlandSwitzerland
FranceIsrael
PortugalLithuaniaMalaysia
EstoniaCanada
PeruChina
RomaniaSingapore
TaiwanSloveniaThailand
SerbiaArgentina
NetherlandsAustralia
CroatiaGreece
HungaryCzech Rep.
ItalyNorway
SpainUkrainePoland
KazakhstanSouth Korea
JapanBelgiumSlovakia
Allianz Wealth Equity Index: Broad Spectrum
Sources: National Central Banks and Statistical Offices,
UN Population Division, Allianz SE.
1 2 3 4 5 6 7
52
assets has narrowed – include many Latin
American countries. Although assets are still
distributed very unequally in many of these
countries, improvements in the last two dec-
ades have been quite impressive. Also, some
Asian – Thailand, Malaysia and South Korea
– and Eastern European countries – Croatia,
Ukraine and Kazakhstan – appear here. But
there is only one country form the eurozone
(Belgium) but two Scandinavian countries
(Sweden and Denmark).
At the other end of the spectrum are some
“usual suspects”, like the US, Russia and India.
But also many European countries belong to
the group of countries in which wealth distri-
bution has become less equal: Finland, Por-
tugal, France, Greece and Switzerland. Again,
these findings underline the challenging situ-
ation in Europe after the crisis. In addition to
India, two other Asian countries appear here:
Indonesia – and China. It’s a sign that, with
growth slowing down, wealth dynamics in the
Chinese society are becoming more uneven.
While the first years after the opening of the
economy were dominated by asset accumula-
tion through savings, gains in value have also
played a bigger role more recently, i.e. access
to higher-yield investments – which is gener-
ally likely to be easier for households that are
already wealthier.
As well as analyzing median and average
assets, there are naturally many other indica-
tors that can be used to measure the extent
of equality or inequality in wealth distribu-
tion. These include the Gini coefficient, for
example, which serves as a comprehensive
indicator. However, as the Gini coefficient is
an overall indicator that measures changes
in all wealth deciles simultaneously, the shifts
from one year to the next are only slight.3 We
therefore decided last year to introduce a new
indicator, the Allianz Wealth Equity Indicator
(AWEI), which takes into account various other
parameters relating to wealth distribution and
its development over time. See the box above
for information on how the AWEI is calculated.
The AWEI underlines once again the findings
of previous analyses. The US has a significant
distribution problem; the same can be said
for the UK, South Africa, Indonesia, India and
Russia. The latter two have also suffered huge
drops in their rankings, compared to last year,
by 23 and 18 places, respectively. There is
only one other country that saw a compara-
ble decline in its ranking: China. But thanks to
rampant asset growth in the past, it has yet to
enter the “red” area of the AWEI.
3 The current Gini coefficients for wealth distribution in all countries included in our analysis can be found in the annex.
ALLIANZ GLOBAL WEALTH REPORT 2019 – WEALTH DISTRIBUTION 53
Economic Research
Like last year – and somewhat surprisingly –
Denmark, Sweden and Germany also rank
among the countries where wealth distribution
is strongly distorted, although development
here has been moving in the “right” direction,
at least in the last few years. The reasons for
this relatively high level of inequality can be
found in high debt levels among large parts
of the population (Sweden and Denmark) or
the general shortage of capital-funded pen-
sion schemes as well as delayed reunification
(Germany).
At the other end of the spectrum, rankings
have not much changed over the previous
year, with one exception: Japan jumped 23
places and is now number three among those
countries where wealth distribution is rela-
tively balanced. It seems as if the aging of the
society, coupled with permanently low yields,
has a wealth leveling effect. But as financial
assets grew only at a snail’s pace over the last
decades in Japan, this more even wealth distri-
bution is nothing to cheer about.
The group of countries with a relatively bal-
anced wealth distribution is completed by
some Eastern European countries – such as
Slovakia or Poland – and some Western Eu-
ropean countries, namely Belgium, Spain,
and Italy. As regards the Eastern European
countries, their late start to building up private
assets is likely to have played a crucial role in
their good performance in the AWEI. The case
of Spain and Italy is a little more complicated.
Wealth distribution here has tended to be-
come more unequal since the crisis, particu-
larly in Spain. However, these countries still
have a solid base to fall back on; the situation
in these countries with regard to asset distri-
bution is nowhere near as bad as in northern
Europe, for example, not to mention the US.
Belgium, on the other hand, achieved good
to very good scores in all areas. We can only
speculate here about the reasons for this, al-
though the fact that Brussels is the capital of
Europe – and thus a magnet for well-paid jobs
– is certain to have had an influence.
In conclusion, the new indicator AWEI helps
to provide a more nuanced picture of wealth
distribution. In some cases, it substantiates the
general perception, think of the two oppos-
ing poles USA (very unequal) and Japan (very
equal). In other cases, it produces surprising
insights, think of the Scandinavian countries
(rather unequal) or Spain and Italy (rather
equal). So, the AWEI can offer a more complex
picture of wealth distribution that eludes sim-
ple generalization.
54
REGIONAL DIFFERENCES:
FINANCIAL ASSETS IN
INDIVIDUAL REGIONS
ALLIANZ GLOBAL WEALTH REPORT 2019 – REGIONAL DIFFERENCES 55
Economic Research
5767778799
105113
Latin America
North America
Western Europe
Eastern Europe
Asia
Box: Japan’s older investors have a higher appetite for risk than their younger peers
Australia and New Zealand

56
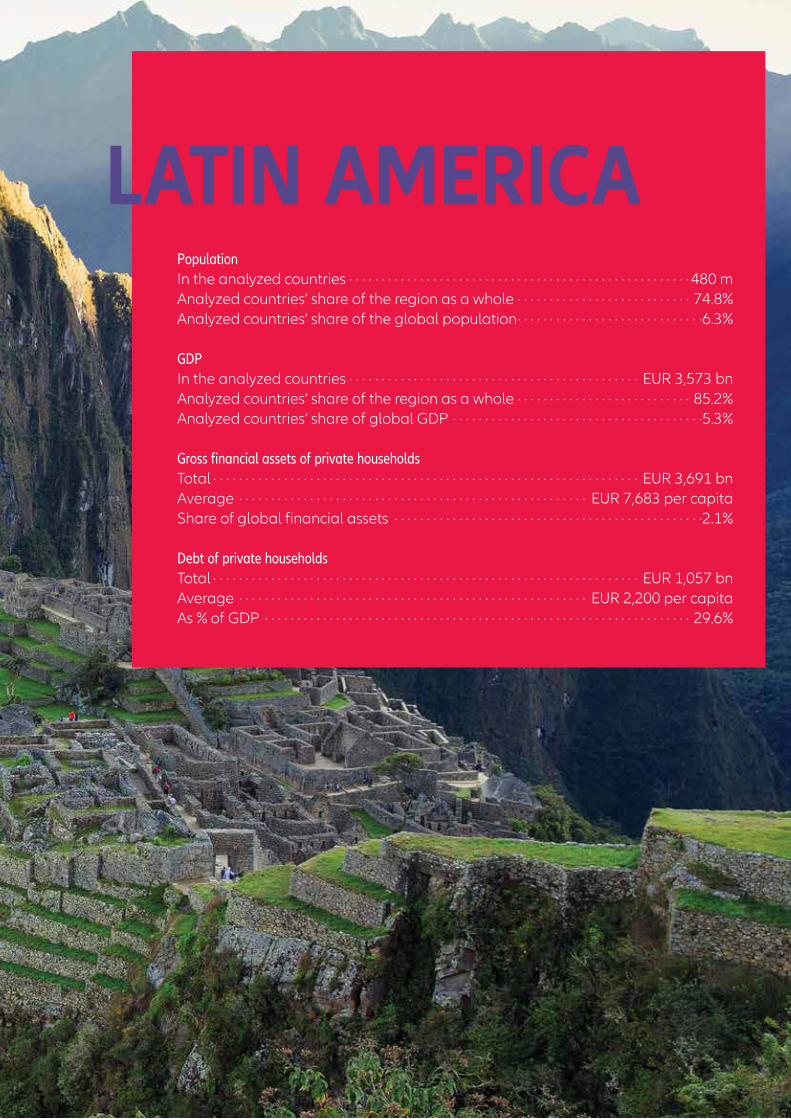
ALLIANZ GLOBAL WEALTH REPORT 2019 – REGIONAL DIFFERENCES: LATIN AMERICA 57
Economic Research
Population In the analyzed countries · · · · · · · · · · · · · · · · · · · · · · · · · · · · · · · · · · · · · · · · · · · · · · · · · · · · · 480 m Analyzed countries’ share of the region as a whole · · · · · · · · · · · · · · · · · · · · · · · · · · · 74.8%Analyzed countries’ share of the global population· · · · · · · · · · · · · · · · · · · · · · · · · · · · ·6.3% GDP In the analyzed countries · · · · · · · · · · · · · · · · · · · · · · · · · · · · · · · · · · · · · · · · · · · · · EUR 3,573 bnAnalyzed countries’ share of the region as a whole · · · · · · · · · · · · · · · · · · · · · · · · · · · 85.2%Analyzed countries’ share of global GDP · · · · · · · · · · · · · · · · · · · · · · · · · · · · · · · · · · · · · · ·5.3% Gross financial assets of private households Total · · · · · · · · · · · · · · · · · · · · · · · · · · · · · · · · · · · · · · · · · · · · · · · · · · · · · · · · · · · · · · · · · · EUR 3,691 bnAverage · · · · · · · · · · · · · · · · · · · · · · · · · · · · · · · · · · · · · · · · · · · · · · · · · · · · · · EUR 7,683 per capitaShare of global financial assets · · · · · · · · · · · · · · · · · · · · · · · · · · · · · · · · · · · · · · · · · · · · · · · ·2.1% Debt of private households Total · · · · · · · · · · · · · · · · · · · · · · · · · · · · · · · · · · · · · · · · · · · · · · · · · · · · · · · · · · · · · · · · · · EUR 1,057 bnAverage · · · · · · · · · · · · · · · · · · · · · · · · · · · · · · · · · · · · · · · · · · · · · · · · · · · · · · EUR 2,200 per capitaAs % of GDP · · · · · · · · · · · · · · · · · · · · · · · · · · · · · · · · · · · · · · · · · · · · · · · · · · · · · · · · · · · · · · · · · · 29.6%
LATIN AMERICA
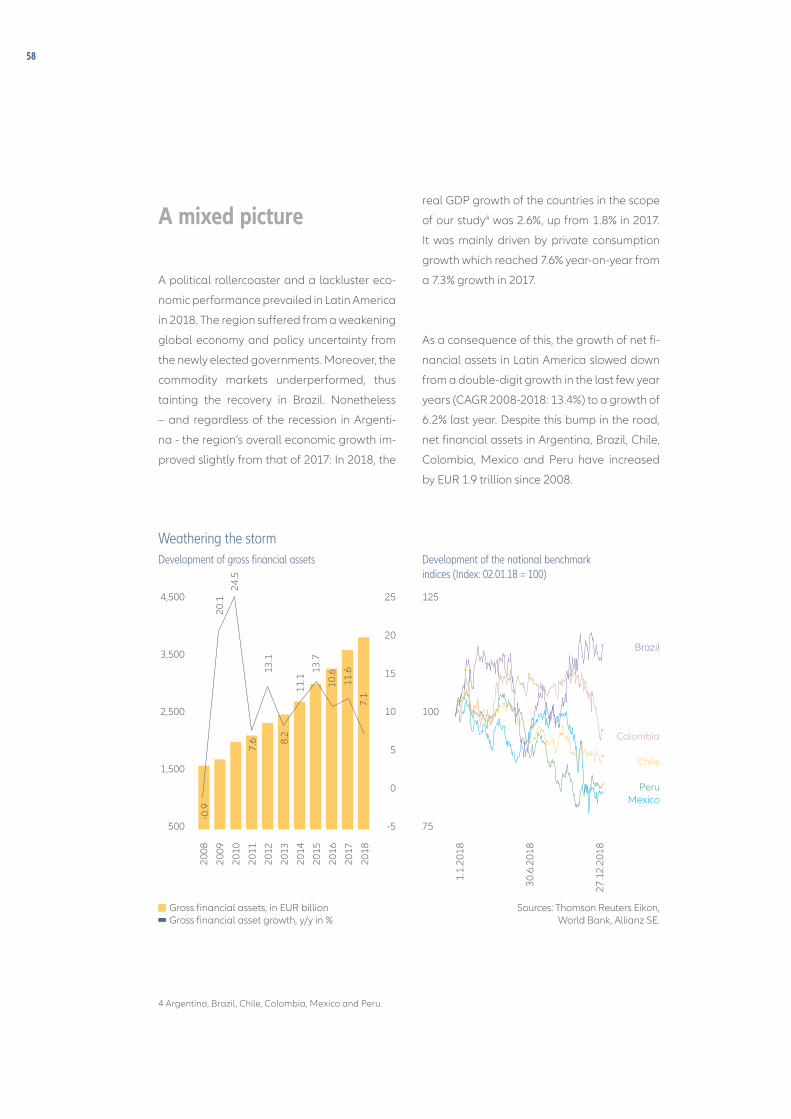
58
A mixed picture
A political rollercoaster and a lackluster eco-
nomic performance prevailed in Latin America
in 2018. The region suffered from a weakening
global economy and policy uncertainty from
the newly elected governments. Moreover, the
commodity markets underperformed, thus
tainting the recovery in Brazil. Nonetheless
– and regardless of the recession in Argenti-
na - the region’s overall economic growth im-
proved slightly from that of 2017: In 2018, the
real GDP growth of the countries in the scope
of our study4 was 2.6%, up from 1.8% in 2017.
It was mainly driven by private consumption
growth which reached 7.6% year-on-year from
a 7.3% growth in 2017.
As a consequence of this, the growth of net fi-
nancial assets in Latin America slowed down
from a double-digit growth in the last few year
years (CAGR 2008-2018: 13.4%) to a growth of
6.2% last year. Despite this bump in the road,
net financial assets in Argentina, Brazil, Chile,
Colombia, Mexico and Peru have increased
by EUR 1.9 trillion since 2008.
Weathering the stormDevelopment of gross financial assets Development of the national benchmark
indices (Index: 02.01.18 = 100)
Sources: Thomson Reuters Eikon, World Bank, Allianz SE.
4,500
3,500
2,500
1,500
500
25
20
15
10
5
0
-5
125
100
75
2008
2009
2010
2011
2012
2013
2014
2015
2016
2017
2018
Gross financial assets, in EUR billion Gross financial asset growth, y/y in %
Brazil
Colombia
Chile
PeruMexico
1.1.
2018
30.6
.201
8
27.1
2.20
18
-0.9
20.1
24.5
7.6
13.1
8.2
11.1
13.7
10.6
11.6
7.1
4 Argentina, Brazil, Chile, Colombia, Mexico and Peru.
ALLIANZ GLOBAL WEALTH REPORT 2019 – REGIONAL DIFFERENCES: LATIN AMERICA 59
Economic Research
In gross terms, growth in financial assets
slowed down from the 12% growth in 2017
to a 7% growth in 2018. However, it still
outperformed that of industrialized coun-
tries(-0.03%). As a result of this growth, Latin
American financial assets increased to around
EUR 3.7 trillion. The most dynamic asset class
was cash, demand and savings deposits which
grew by 10% and reached a EUR 724 billion in
total. However, the largest holding of assets
are still securities (47% of all financial assets),
which are mainly equity in unincorporated
businesses and grew by 6.3% in 2018,reaching
a total value of EUR 1.7 trillion. This is quite a
remarkable performance, against the back-
drop of the region’s stock markets’ tough year
in 2018. The MSCI Emerging Markets Latin
America fell by 9.27% year-on-year after hav-
ing climbed around 20% in 2017. With the ex-
ception of Brazil (15% growth) and Argentina
(1%), the benchmark indices in all the coun-
tries we analyzed reported losses. The largest
slump was recorded in Mexico (-15.6%) be-
cause of NAFTA uncertainties, trade war fears
and new administration uncertainties. At the
end of 2018, the stock exchange barometers
in Peru (-13.8%), Chile (-8.3%), and Colombia
(-2.9%) suffered because of global economic
sluggishness.
Different asset structures in individual countries
The election of Jair Bolsonaro was good for
markets in 2018. Brazil is slowly but surely
lifting itself from the recession it suffered in
2015 and 2016, growing at around 1% both
in 2017 and 2018. The growth prospects of
Brazil’s GDP were dampened last year by
the fall in commodity prices and US-China
trade tensions, as the Asian giant is its larg-
est commodity export destination (19% of
exports). Despite the modest growth, things
are looking up for Brazil, the new administra-
tion’s market-friendly reformist agenda has
helped boost consumer confidence by 4.6% in
2018 and thus consumption (4.8% y-o-y). Un-
employment remains an issue hard to tackle
for Brazil, it remained high and was reported
as 12.3%; it increased slightly from the figure
of 2017 (11.8%). However, despite this, Bra-
zilian household income increased by 4.3%
on a year-on-year basis and inflation stayed
at bay at 3.6%. The gains in Brazil’s leading
stock index (BOVESPA) benefited households,
as they hold 53% of their assets in some form
of shares, funds or other equity interests. The
growth of securities in the Brazilian household
portfolio was 14% at the end of 2018, to EUR
1.0 trillion. Insurance receivables (EUR 408 bil-
lion) had a less dynamic growth at 6.9%, bank
deposits (19% of the portfolio) were up by 9.4%
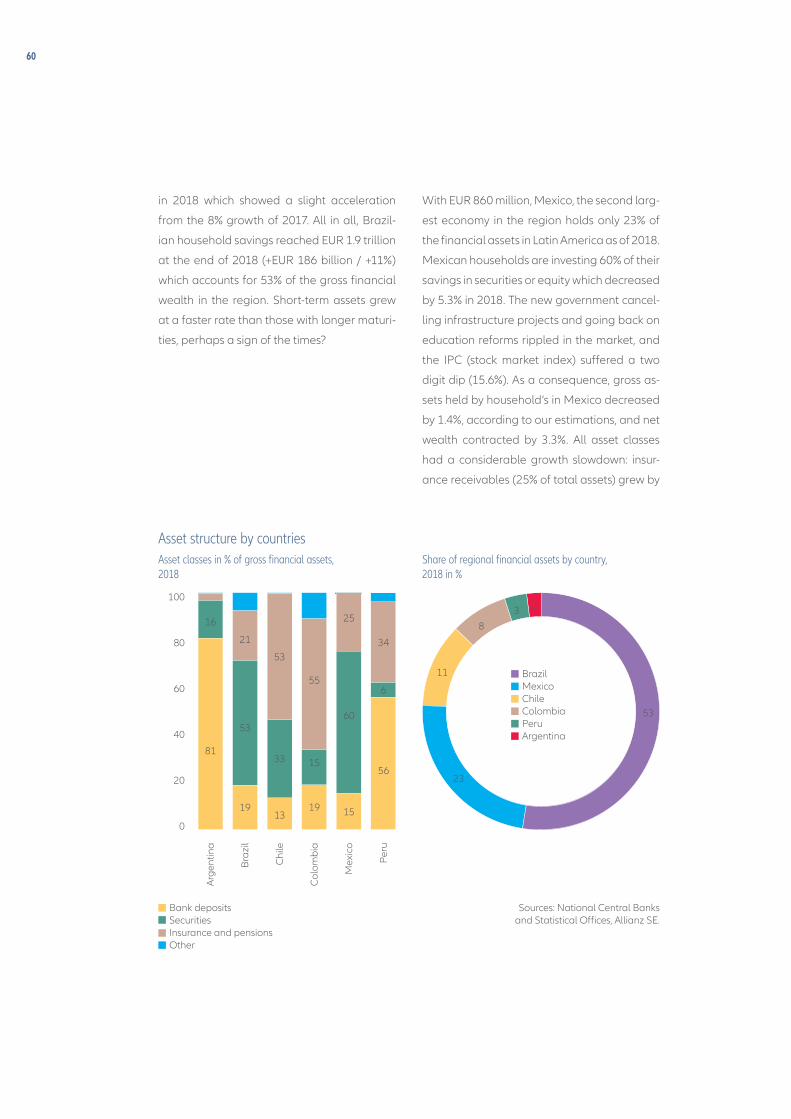
60
in 2018 which showed a slight acceleration
from the 8% growth of 2017. All in all, Brazil-
ian household savings reached EUR 1.9 trillion
at the end of 2018 (+EUR 186 billion / +11%)
which accounts for 53% of the gross financial
wealth in the region. Short-term assets grew
at a faster rate than those with longer maturi-
ties, perhaps a sign of the times?
With EUR 860 million, Mexico, the second larg-
est economy in the region holds only 23% of
the financial assets in Latin America as of 2018.
Mexican households are investing 60% of their
savings in securities or equity which decreased
by 5.3% in 2018. The new government cancel-
ling infrastructure projects and going back on
education reforms rippled in the market, and
the IPC (stock market index) suffered a two
digit dip (15.6%). As a consequence, gross as-
sets held by household’s in Mexico decreased
by 1.4%, according to our estimations, and net
wealth contracted by 3.3%. All asset classes
had a considerable growth slowdown: insur-
ance receivables (25% of total assets) grew by
Asset structure by countriesAsset classes in % of gross financial assets, 2018
Share of regional financial assets by country, 2018 in %
Sources: National Central Banks and Statistical Offices, Allianz SE.
Arg
entin
a
Bra
zil
Chi
le
Col
ombi
a
Mex
ico
Per
u
100
80
60
40
20
0
16
21
53
11
23
53
8
3 2
55
25
34
6
56
60
1519
1533
1319
53
81
Bank deposits Securities Insurance and pensions Other
BrazilMexicoChileColombiaPeruArgentina
ALLIANZ GLOBAL WEALTH REPORT 2019 – REGIONAL DIFFERENCES: LATIN AMERICA 61
Economic Research
5.4% (after 12.8% in 2017), and cash and bank
deposits (15% of total assets) increased by 5%
(8.5 % in 2017). Liabilities also slowed down to
a 7.4 year-on-year growth (from 9.5% in 2017),
recording the weakest growth since 2009. It
is not all bad news, consumer confidence in
Mexico increased by 11.7% in 2018, perhaps
because of the local popularity of the incum-
bent administration. Inflation was kept under
control at 4.9%, unemployment stayed stable
at 3.3%, household income grew by 8.2% and
consumption increased by 2% at the end of
2018. Hopes of reforms and prosperity are
widespread amongst the population, but the
sentiment has failed to reach the markets due
to the policy uncertainty that the new govern-
ment awakens.
Households in Argentina, Chile, Colombia
and Peru share the remaining quarter of the
region’s wealth and represented around 30%
of the Latin American population in our sam-
ple. Asset growth ranged from 5.3% in Peru to
34.5% in Argentina, however this figure should
be taken with a pinch of salt given the 33.4%
inflation rate in the South American country
in 2018. Early optimism for Macri’s adminis-
tration has faded out. Inflation remains out of
control, and real GDP continues to contract, in
2018 by 2,5 %, after a break of growth in 2017
(3 %). Private consumer spending fell by 2.5 %
in 2018, after growing by 3.8 % in 2017. As a re-
sult of this, Argentine households are seeking
refuge in foreign assets. Bank deposits and
cash represent 80.8 % of the households’ as-
set portfolio. In contrast, insurance provisions
are barely 3% of household investments as a
result of the pension fund nationalization in
2008 when it was 11.1 % of the households’
financial assets.
In Chile and Colombia the insurance assets
outweigh the rest of the asset classes and are
53% and 55% of the portfolio, respectively.
The growth in insurance receivables in Chile
slowed down to 5.2% from a ten year average
growth of 9.1 % (CAGR 2008-2018). Pension
reform plans put forward by the Piñera ad-
ministration to increase the replacement rate
have influenced this. In Colombia, however,
insurance asset growth was strong at 15.3%
year-on-year because of a new pension de-
cree that allows to allocate funds in different
risk profiles for higher profitability, introduced
in 2018.
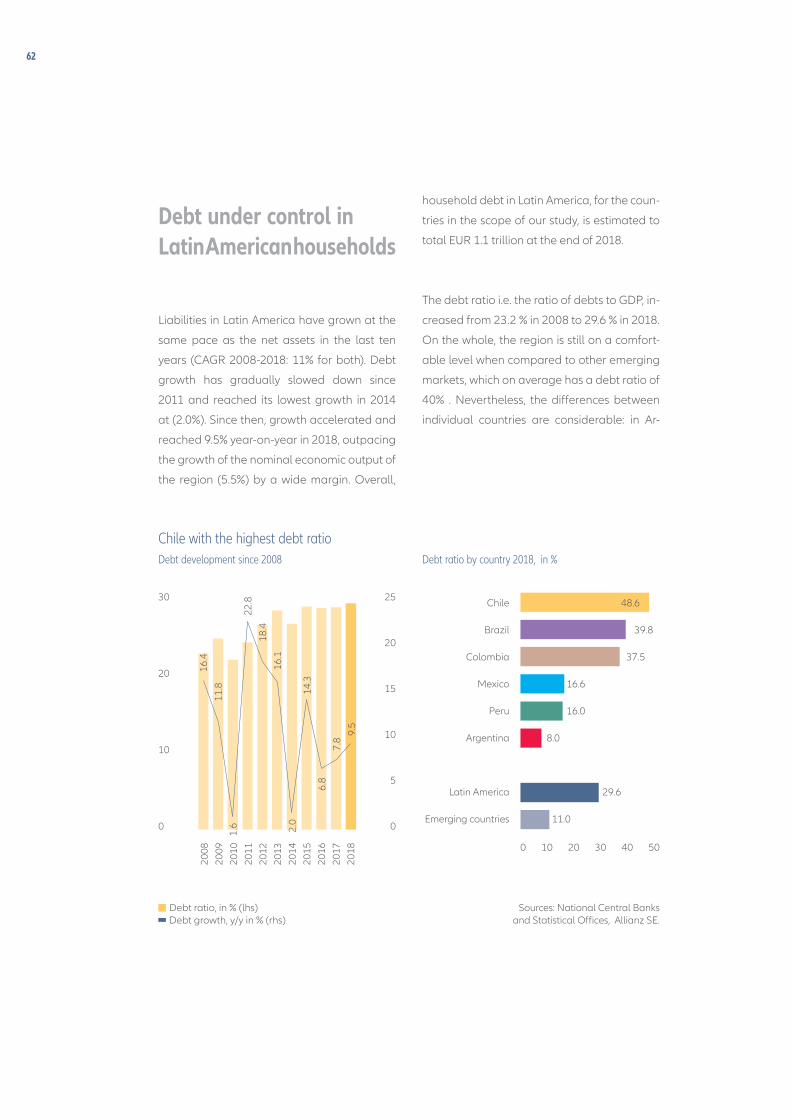
62
Debt under control in Latin American households
Liabilities in Latin America have grown at the
same pace as the net assets in the last ten
years (CAGR 2008-2018: 11% for both). Debt
growth has gradually slowed down since
2011 and reached its lowest growth in 2014
at (2.0%). Since then, growth accelerated and
reached 9.5% year-on-year in 2018, outpacing
the growth of the nominal economic output of
the region (5.5%) by a wide margin. Overall,
household debt in Latin America, for the coun-
tries in the scope of our study, is estimated to
total EUR 1.1 trillion at the end of 2018.
The debt ratio i.e. the ratio of debts to GDP, in-
creased from 23.2 % in 2008 to 29.6 % in 2018.
On the whole, the region is still on a comfort-
able level when compared to other emerging
markets, which on average has a debt ratio of
40% . Nevertheless, the differences between
individual countries are considerable: in Ar-
Chile with the highest debt ratioDebt development since 2008 Debt ratio by country 2018, in %
Sources: National Central Banks and Statistical Offices, Allianz SE.
2008
2009
2010
2011
2012
2013
2014
2015
2016
2017
2018
30
20
10
0
25
20
15
10
5
0
Chile
Brazil
Colombia
Mexico
Peru
Argentina
Latin America
Emerging countries
Debt ratio, in % (lhs) Debt growth, y/y in % (rhs)
0 10 20 30 40 50
16.4
11.8
1.6
22.8
18.4
16.1
14.3
9.5
7.8
6.8
2.0
48.6
39.8
37.5
16.6
16.0
8.0
29.6
11.0
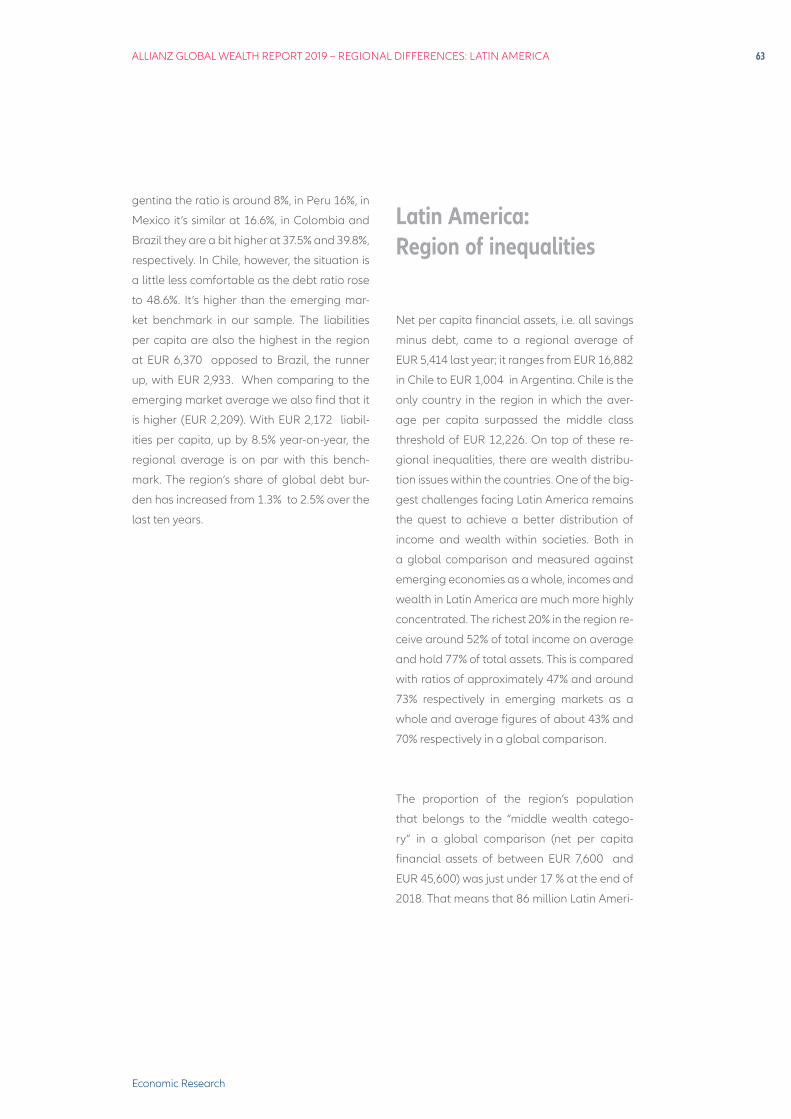
ALLIANZ GLOBAL WEALTH REPORT 2019 – REGIONAL DIFFERENCES: LATIN AMERICA 63
Economic Research
gentina the ratio is around 8%, in Peru 16%, in
Mexico it’s similar at 16.6%, in Colombia and
Brazil they are a bit higher at 37.5% and 39.8%,
respectively. In Chile, however, the situation is
a little less comfortable as the debt ratio rose
to 48.6%. It’s higher than the emerging mar-
ket benchmark in our sample. The liabilities
per capita are also the highest in the region
at EUR 6,370 opposed to Brazil, the runner
up, with EUR 2,933. When comparing to the
emerging market average we also find that it
is higher (EUR 2,209). With EUR 2,172 liabil-
ities per capita, up by 8.5% year-on-year, the
regional average is on par with this bench-
mark. The region’s share of global debt bur-
den has increased from 1.3% to 2.5% over the
last ten years.
Latin America: Region of inequalities
Net per capita financial assets, i.e. all savings
minus debt, came to a regional average of
EUR 5,414 last year; it ranges from EUR 16,882
in Chile to EUR 1,004 in Argentina. Chile is the
only country in the region in which the aver-
age per capita surpassed the middle class
threshold of EUR 12,226. On top of these re-
gional inequalities, there are wealth distribu-
tion issues within the countries. One of the big-
gest challenges facing Latin America remains
the quest to achieve a better distribution of
income and wealth within societies. Both in
a global comparison and measured against
emerging economies as a whole, incomes and
wealth in Latin America are much more highly
concentrated. The richest 20% in the region re-
ceive around 52% of total income on average
and hold 77% of total assets. This is compared
with ratios of approximately 47% and around
73% respectively in emerging markets as a
whole and average figures of about 43% and
70% respectively in a global comparison.
The proportion of the region’s population
that belongs to the “middle wealth catego-
ry” in a global comparison (net per capita
financial assets of between EUR 7,600 and
EUR 45,600) was just under 17 % at the end of
2018. That means that 86 million Latin Ameri-
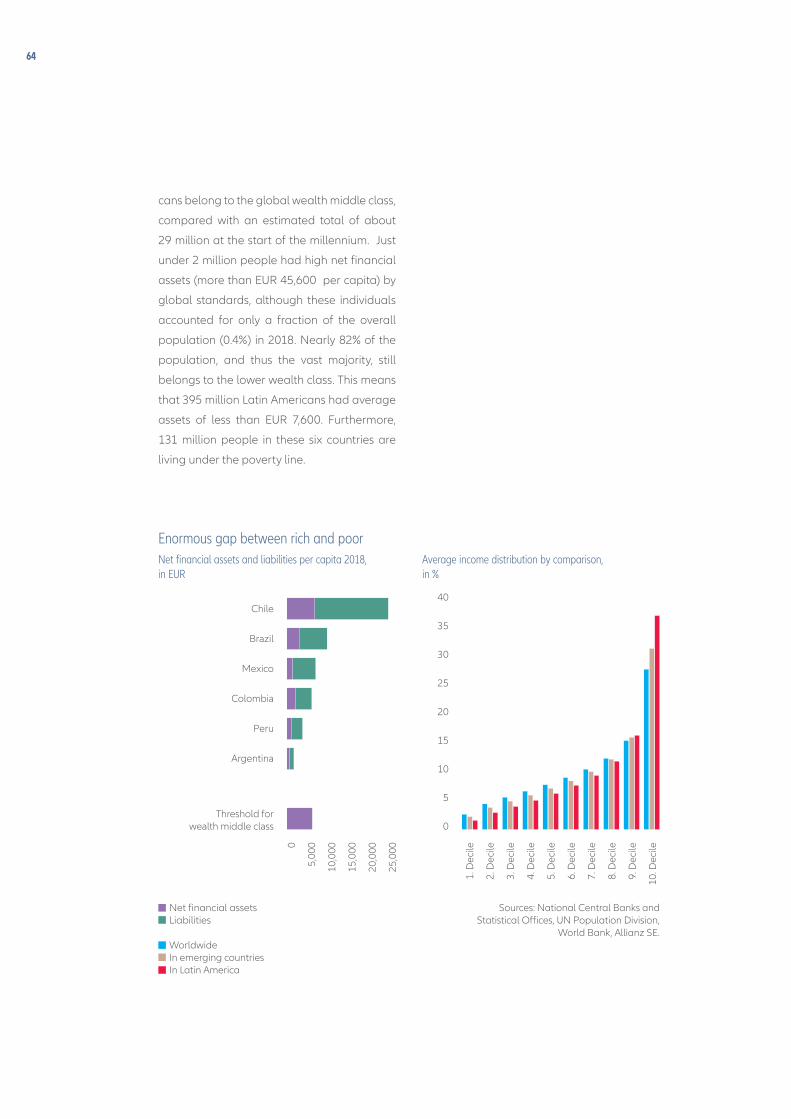
64
cans belong to the global wealth middle class,
compared with an estimated total of about
29 million at the start of the millennium. Just
under 2 million people had high net financial
assets (more than EUR 45,600 per capita) by
global standards, although these individuals
accounted for only a fraction of the overall
population (0.4%) in 2018. Nearly 82% of the
population, and thus the vast majority, still
belongs to the lower wealth class. This means
that 395 million Latin Americans had average
assets of less than EUR 7,600. Furthermore,
131 million people in these six countries are
living under the poverty line.
Net financial assets Liabilities
Worldwide In emerging countries In Latin America
Enormous gap between rich and poorNet financial assets and liabilities per capita 2018, in EUR
Average income distribution by comparison, in %
Chile
Brazil
Mexico
Colombia
Peru
Argentina
0
5,00
0
10,0
00
15,0
00
20,0
00
25,0
00
1. D
ecile
2. D
ecile
3. D
ecile
4. D
ecile
5. D
ecile
6. D
ecile
7. D
ecile
8. D
ecile
9. D
ecile
10. D
ecile
40
35
30
25
20
15
10
5
0Threshold for
wealth middle class
Sources: National Central Banks and Statistical Offices, UN Population Division,
World Bank, Allianz SE.

ALLIANZ GLOBAL WEALTH REPORT 2019 – REGIONAL DIFFERENCES: LATIN AMERICA 65
Economic Research

66

ALLIANZ GLOBAL WEALTH REPORT 2019 – REGIONAL DIFFERENCES: NORTH AMERICA 67
Economic Research
NORTH AMERICAPopulation Total · · · · · · · · · · · · · · · · · · · · · · · · · · · · · · · · · · · · · · · · · · · · · · · · · · · · · · · · · · · · · · · · · · · · · · · · · · 364 m Share of the global population · · · · · · · · · · · · · · · · · · · · · · · · · · · · · · · · · · · · · · · · · · · · · · · · ·4.8% GDP Total · · · · · · · · · · · · · · · · · · · · · · · · · · · · · · · · · · · · · · · · · · · · · · · · · · · · · · · · · · · · · · · · · EUR 19,273 bnShare of global GDP· · · · · · · · · · · · · · · · · · · · · · · · · · · · · · · · · · · · · · · · · · · · · · · · · · · · · · · · · · 26.2% Gross financial assets of private households Total · · · · · · · · · · · · · · · · · · · · · · · · · · · · · · · · · · · · · · · · · · · · · · · · · · · · · · · · · · · · · · · · · EUR 78,829 bnAverage · · · · · · · · · · · · · · · · · · · · · · · · · · · · · · · · · · · · · · · · · · · · · · · · · · · ·EUR 216,463 per capitaShare of global financial assets · · · · · · · · · · · · · · · · · · · · · · · · · · · · · · · · · · · · · · · · · · · · · · 45.7% Debt of private households Total · · · · · · · · · · · · · · · · · · · · · · · · · · · · · · · · · · · · · · · · · · · · · · · · · · · · · · · · · · · · · · · · · EUR 15,518 bnAverage · · · · · · · · · · · · · · · · · · · · · · · · · · · · · · · · · · · · · · · · · · · · · · · · · · · · · EUR 42,613 per capitaAs % of GDP · · · · · · · · · · · · · · · · · · · · · · · · · · · · · · · · · · · · · · · · · · · · · · · · · · · · · · · · · · · · · · · · · · 80.5%
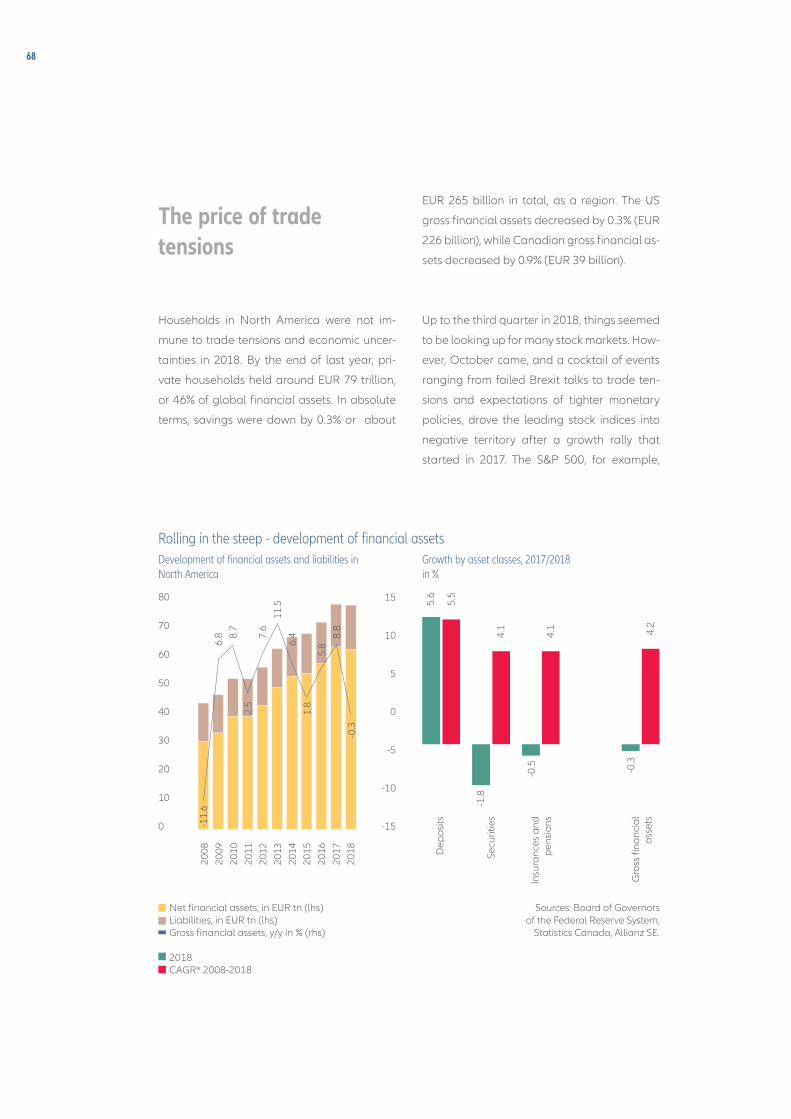
68
The price of trade tensions
Households in North America were not im-
mune to trade tensions and economic uncer-
tainties in 2018. By the end of last year, pri-
vate households held around EUR 79 trillion,
or 46% of global financial assets. In absolute
terms, savings were down by 0.3% or about
EUR 265 billion in total, as a region. The US
gross financial assets decreased by 0.3% (EUR
226 billion), while Canadian gross financial as-
sets decreased by 0.9% (EUR 39 billion).
Up to the third quarter in 2018, things seemed
to be looking up for many stock markets. How-
ever, October came, and a cocktail of events
ranging from failed Brexit talks to trade ten-
sions and expectations of tighter monetary
policies, drove the leading stock indices into
negative territory after a growth rally that
started in 2017. The S&P 500, for example,
Rolling in the steep - development of financial assets Development of financial assets and liabilities in North America
Growth by asset classes, 2017/2018 in %
Sources: Board of Governors of the Federal Reserve System,
Statistics Canada, Allianz SE.
2008
2009
2010
2011
2012
2013
2014
2015
2016
2017
2018
15
10
5
0
-5
-10
-15
Net financial assets, in EUR tn (lhs) Liabilities, in EUR tn (lhs) Gross financial assets, y/y in % (rhs)
2018CAGR* 2008-2018
Dep
osits
Secu
ritie
s
5.6
5.5
4.1
-1.8
4.1
-0.5
4.2
-0.3
Gro
ss fi
nanc
ial
asse
ts
Insu
ranc
es a
nd
pen
sion
s
80
70
60
50
40
30
20
10
0 -11.
66.
8 8.7
2.5
7.6
11.5
1.8
-0.3
8.8
5.86.
4
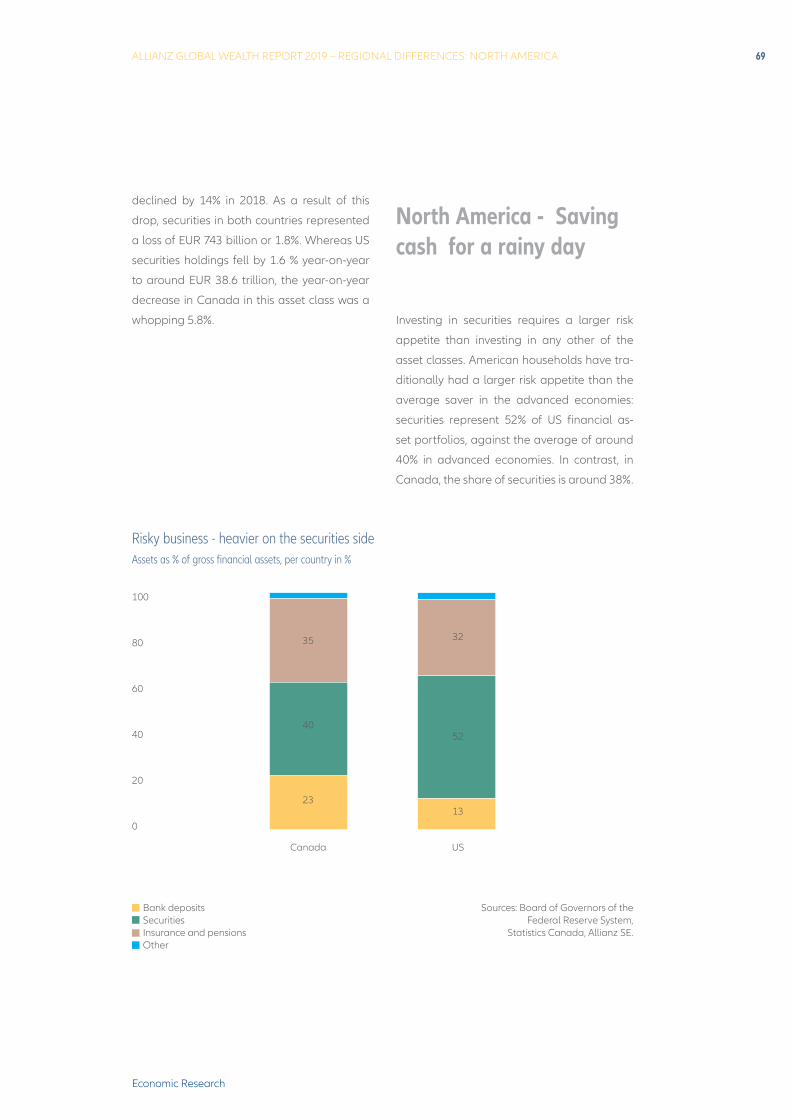
ALLIANZ GLOBAL WEALTH REPORT 2019 – REGIONAL DIFFERENCES: NORTH AMERICA 69
Economic Research
declined by 14% in 2018. As a result of this
drop, securities in both countries represented
a loss of EUR 743 billion or 1.8%. Whereas US
securities holdings fell by 1.6 % year-on-year
to around EUR 38.6 trillion, the year-on-year
decrease in Canada in this asset class was a
whopping 5.8%.
North America - Saving cash for a rainy day
Investing in securities requires a larger risk
appetite than investing in any other of the
asset classes. American households have tra-
ditionally had a larger risk appetite than the
average saver in the advanced economies:
securities represent 52% of US financial as-
set portfolios, against the average of around
40% in advanced economies. In contrast, in
Canada, the share of securities is around 38%.
100
80
60
40
20
0
Risky business - heavier on the securities side Assets as % of gross financial assets, per country in %
Sources: Board of Governors of the Federal Reserve System,
Statistics Canada, Allianz SE.
US
13
52
32
Canada
23
40
35
Bank deposits Securities Insurance and pensions Other
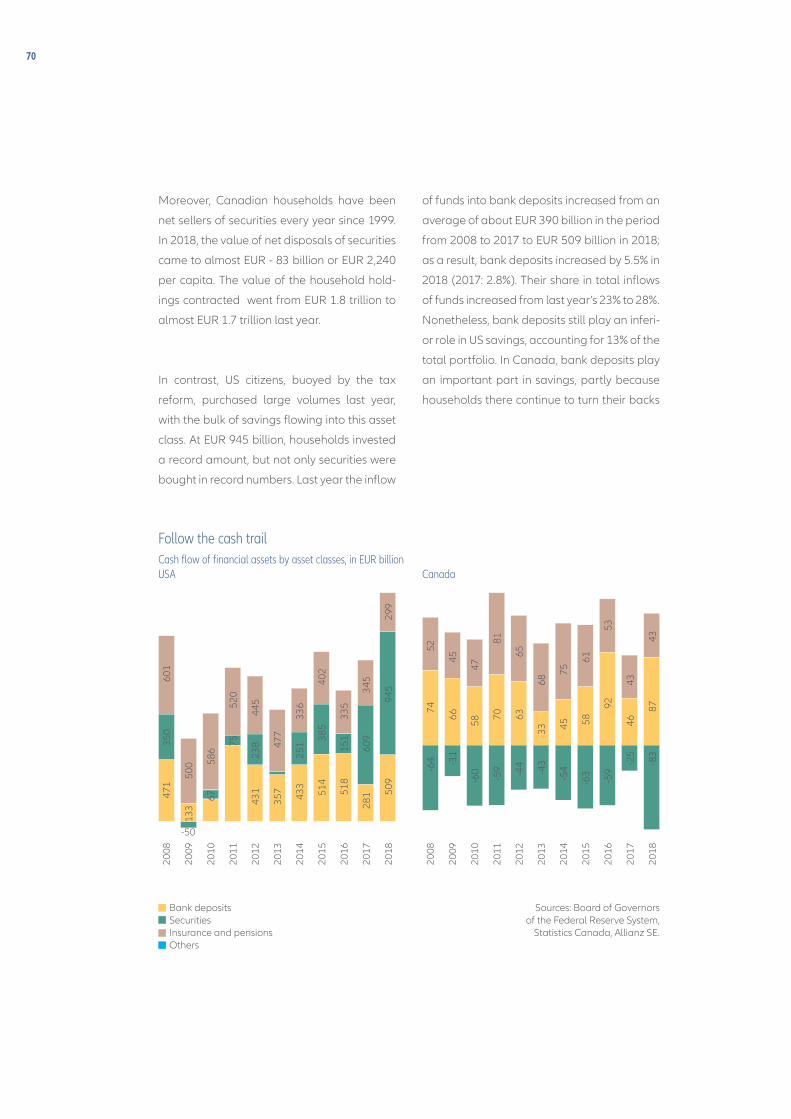
70
Moreover, Canadian households have been
net sellers of securities every year since 1999.
In 2018, the value of net disposals of securities
came to almost EUR - 83 billion or EUR 2,240
per capita. The value of the household hold-
ings contracted went from EUR 1.8 trillion to
almost EUR 1.7 trillion last year.
In contrast, US citizens, buoyed by the tax
reform, purchased large volumes last year,
with the bulk of savings flowing into this asset
class. At EUR 945 billion, households invested
a record amount, but not only securities were
bought in record numbers. Last year the inflow
of funds into bank deposits increased from an
average of about EUR 390 billion in the period
from 2008 to 2017 to EUR 509 billion in 2018;
as a result, bank deposits increased by 5.5% in
2018 (2017: 2.8%). Their share in total inflows
of funds increased from last year’s 23% to 28%.
Nonetheless, bank deposits still play an inferi-
or role in US savings, accounting for 13% of the
total portfolio. In Canada, bank deposits play
an important part in savings, partly because
households there continue to turn their backs
Follow the cash trailCash flow of financial assets by asset classes, in EUR billion USA
Canada
Sources: Board of Governors of the Federal Reserve System,
Statistics Canada, Allianz SE.
2008
2009
2010
2011
2012
2013
2014
2015
2016
2017
2018
2008
2009
2010
2011
2012
2013
2014
2015
2016
2017
2018
350
471
-64
601
7452
66
500
133
-31
45
6758
6
-50
-60
5847
7552
0
7081
-59
445
65
238
63
431
-44
357
-43
477 33
68
336
251
4575
433
-54
514 -6
3
385 58
402
61
335
53
151
92
518 -5
9
281
-25
345
609
4346
299
4387
945
-83
509
Bank deposits Securities Insurance and pensionsOthers
ALLIANZ GLOBAL WEALTH REPORT 2019 – REGIONAL DIFFERENCES: NORTH AMERICA 71
Economic Research
on the stock markets. More than half of fresh
savings are going into bank deposits, a share
that has barely changed in the last decade.
The share of bank deposits in total financial
assets in Canada is 22% or EUR 978 billion.
The only asset class in the US that could not
benefit from the tax reform was insurance
policies and pensions: inflows were at a mod-
est EUR 299 billion, after a decade of an av-
erage of EUR 455 billion (2008-2017). This
decrease may reflect demographic shifts, as
baby boomers leave the labor market and no
longer buy retirement products. As a result, in-
surance and pensions shrank by 0.6 % in 2018.
In Canada, insurance and pension assets are
a key component of household savings at EUR
1.7 trillion or 37 % of their portfolio. In The US,
they account for 32% of the total asset portfo-
lio or EUR 24 trillion at the end of 2018.
Americans learning from experience...
Liability management was not a popular con-
cept in the US in the years leading up to the
financial crisis. Personal debt was at times
growing in the double-digits. In 2008, when
the housing crisis in the US had already erupt-
ed, households started to borrow less. Nowa-
days, ten years later, the growth of liabilities is
still at a relatively low rate of 3.2% and total
liabilities amount to103.5% of their disposable
income, much lower than the rate a decade
ago (132%). Debt has been growing at a lower
rate than disposable income in the years fol-
lowing the financial crisis. In 2018, disposable
income increased by 4.9%. This development
can be attributed by the improvements in the
labor market in the last few years as well as
the tax reform of early 2018. Growth was re-
corded across all categories of credit, includ-
ing home and car loans as well as student
loans and credit card debt. Home loans, which
accounted for the largest share of private
debt (64%), grew by 2.6% year-on-year in 2018.
Mortgage debt at the end of 2018 was still 3%
below its record level to date.
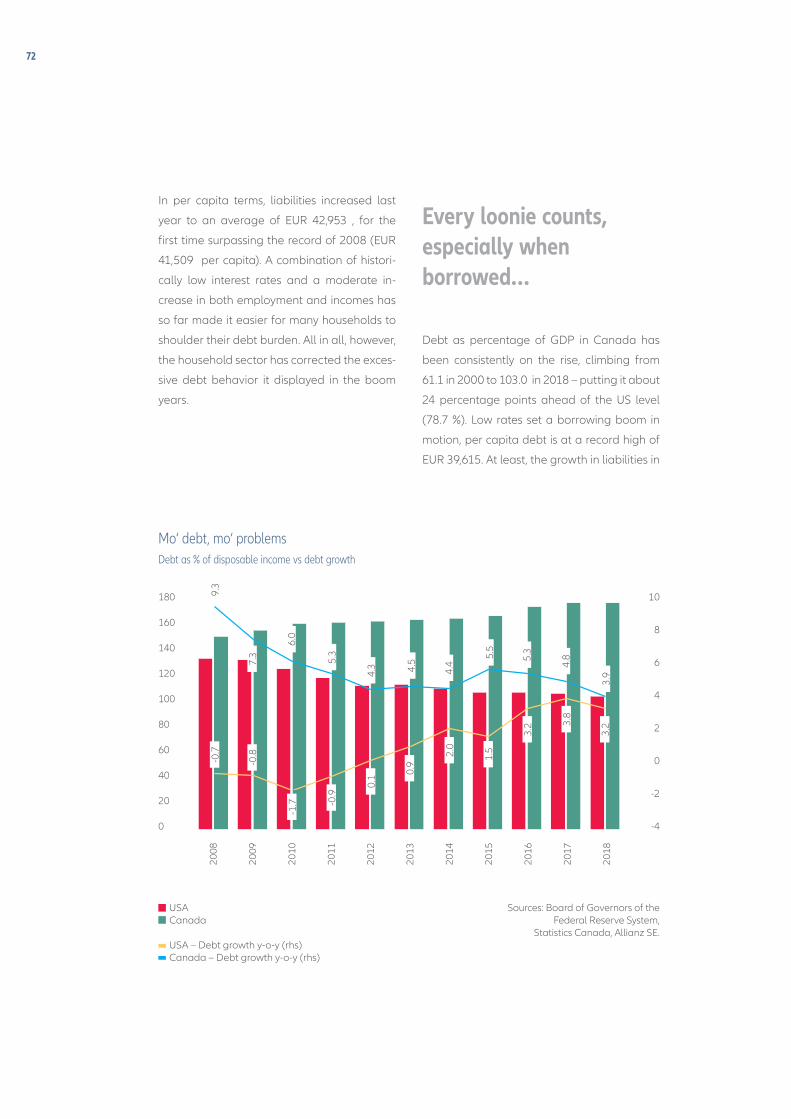
72
In per capita terms, liabilities increased last
year to an average of EUR 42,953 , for the
first time surpassing the record of 2008 (EUR
41,509 per capita). A combination of histori-
cally low interest rates and a moderate in-
crease in both employment and incomes has
so far made it easier for many households to
shoulder their debt burden. All in all, however,
the household sector has corrected the exces-
sive debt behavior it displayed in the boom
years.
Every loonie counts, especially when borrowed…
Debt as percentage of GDP in Canada has
been consistently on the rise, climbing from
61.1 in 2000 to 103.0 in 2018 – putting it about
24 percentage points ahead of the US level
(78.7 %). Low rates set a borrowing boom in
motion, per capita debt is at a record high of
EUR 39,615. At least, the growth in liabilities in
Sources: Board of Governors of the Federal Reserve System,
Statistics Canada, Allianz SE.
Mo‘ debt, mo‘ problemsDebt as % of disposable income vs debt growth
2008
2009
2010
2011
2012
2013
2014
2015
2016
2017
2018
180
160
140
120
100
80
60
40
20
0
10
8
6
4
2
0
-2
-4
USACanada
USA – Debt growth y-o-y (rhs)Canada – Debt growth y-o-y (rhs)
5.5
4.4
3.9
9.3
-0.7
-0.8
-1.7 -0
.9
0.1 0.
9
2.0
1.5
3.2 3.
8
3.2
7.3
6.0
5.3
4.3 4.
5 5.3
4.8
ALLIANZ GLOBAL WEALTH REPORT 2019 – REGIONAL DIFFERENCES: NORTH AMERICA 73
Economic Research
Canada showed signs of a slowdown, falling
to 3.9% in 2018, the lowest rate in two decades
and compared to an average of 5.7% since
2008.
There are also signs that, the root cause for
the debt bonanza, the buoyant Canadian
housing market starts to moderate. Housing
prices did not experience much of a change
in 2018 at the national level (y-o-y: +1%). The
Bank of Canada has long been monitoring
the household debt burden. Ultimately, the
driver of instability in a highly indebted coun-
try is the debt service burden: the lower the
interest rate, the more debt a given household
can afford to pay. The debt service, or the re-
quired payments of interest and principal as a
percentage of income, in Canada was 14.5%
at the end of 2018, surpassing that of 2008 at
the break of the financial crisis (14.48 %). New
regulations have been thus introduced requir-
ing households to show that they can service
their debt at higher levels of interest to help re-
duce the economy’s vulnerability to rate hikes.
The US amongst the richest households worldwide
North America is, without the shadow of a
doubt, the most prosperous region with net
assets per capita of EUR 173,850 (US: EUR
184,411 and Canada: EUR 80,667) As a re-
gion, it is well above the industrialized coun-
tries’ average of EUR 102,804 . As means of
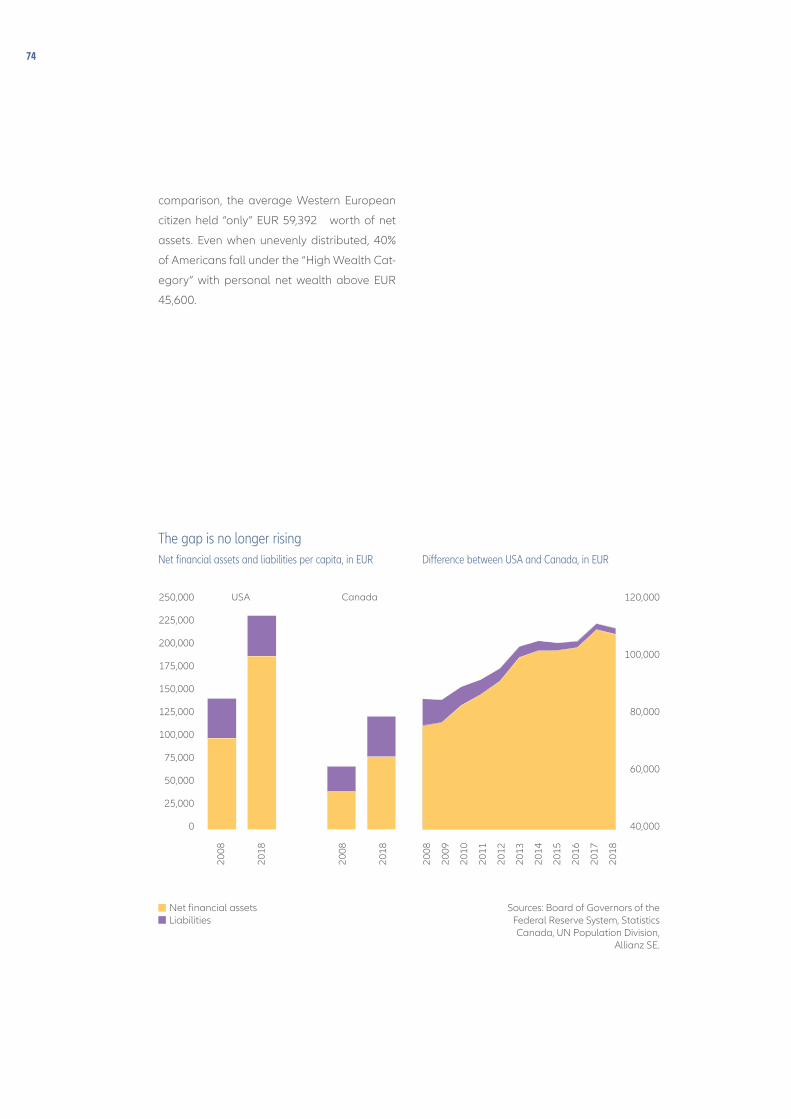
74
comparison, the average Western European
citizen held “only” EUR 59,392 worth of net
assets. Even when unevenly distributed, 40%
of Americans fall under the “High Wealth Cat-
egory” with personal net wealth above EUR
45,600.
Net financial assetsLiabilities
The gap is no longer risingNet financial assets and liabilities per capita, in EUR Difference between USA and Canada, in EUR
250,000
225,000
200,000
175,000
150,000
125,000
100,000
75,000
50,000
25,000
0
120,000
100,000
80,000
60,000
40,000
Sources: Board of Governors of the Federal Reserve System, Statistics Canada, UN Population Division,
Allianz SE.
2008
2018
2008
2018
2008
2009
2010
2011
2012
2013
2014
2015
2016
2017
2018
USA Canada

ALLIANZ GLOBAL WEALTH REPORT 2019 – REGIONAL DIFFERENCES: NORTH AMERICA 75
Economic Research

76
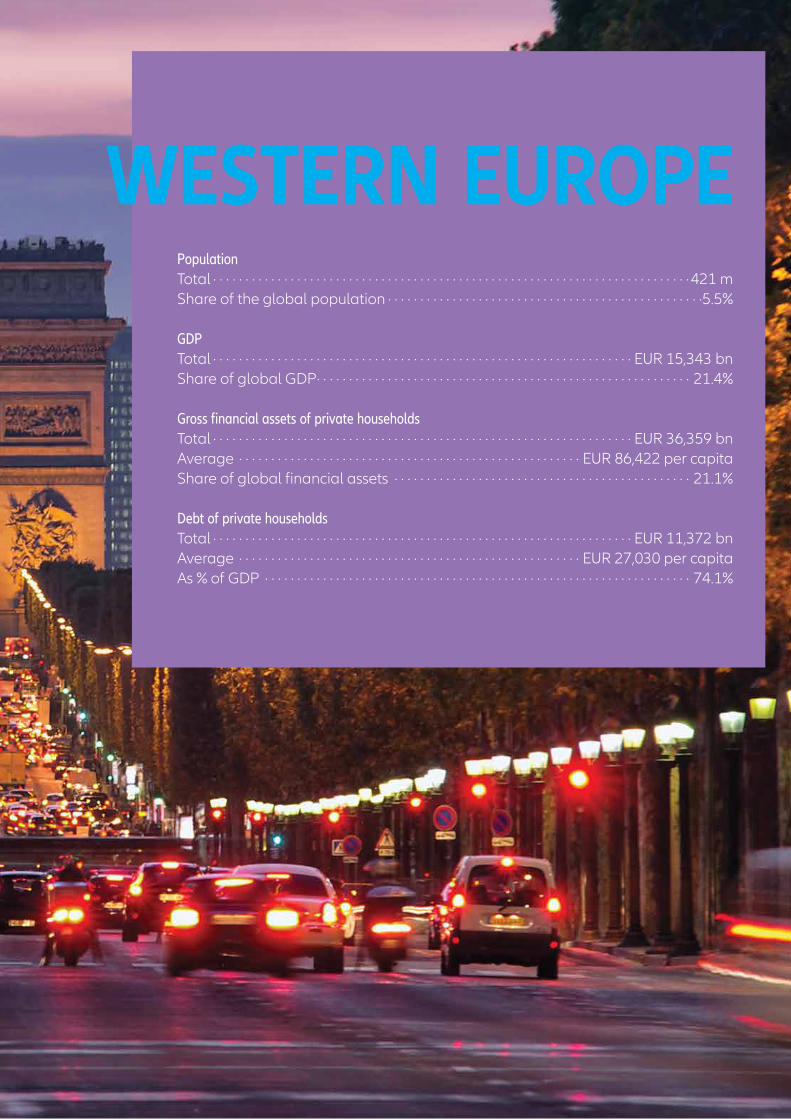
ALLIANZ GLOBAL WEALTH REPORT 2019 – REGIONAL DIFFERENCES: WESTERN EUROPE 77
Economic Research
WESTERN EUROPEPopulation Total · · · · · · · · · · · · · · · · · · · · · · · · · · · · · · · · · · · · · · · · · · · · · · · · · · · · · · · · · · · · · · · · · · · · · · · · · · 421 m Share of the global population · · · · · · · · · · · · · · · · · · · · · · · · · · · · · · · · · · · · · · · · · · · · · · · · ·5.5% GDP Total · · · · · · · · · · · · · · · · · · · · · · · · · · · · · · · · · · · · · · · · · · · · · · · · · · · · · · · · · · · · · · · · · EUR 15,343 bnShare of global GDP· · · · · · · · · · · · · · · · · · · · · · · · · · · · · · · · · · · · · · · · · · · · · · · · · · · · · · · · · · 21.4% Gross financial assets of private households Total · · · · · · · · · · · · · · · · · · · · · · · · · · · · · · · · · · · · · · · · · · · · · · · · · · · · · · · · · · · · · · · · · EUR 36,359 bnAverage · · · · · · · · · · · · · · · · · · · · · · · · · · · · · · · · · · · · · · · · · · · · · · · · · · · · · EUR 86,422 per capitaShare of global financial assets · · · · · · · · · · · · · · · · · · · · · · · · · · · · · · · · · · · · · · · · · · · · · · 21.1% Debt of private households Total · · · · · · · · · · · · · · · · · · · · · · · · · · · · · · · · · · · · · · · · · · · · · · · · · · · · · · · · · · · · · · · · · EUR 11,372 bnAverage · · · · · · · · · · · · · · · · · · · · · · · · · · · · · · · · · · · · · · · · · · · · · · · · · · · · · EUR 27,030 per capitaAs % of GDP · · · · · · · · · · · · · · · · · · · · · · · · · · · · · · · · · · · · · · · · · · · · · · · · · · · · · · · · · · · · · · · · · · 74.1%
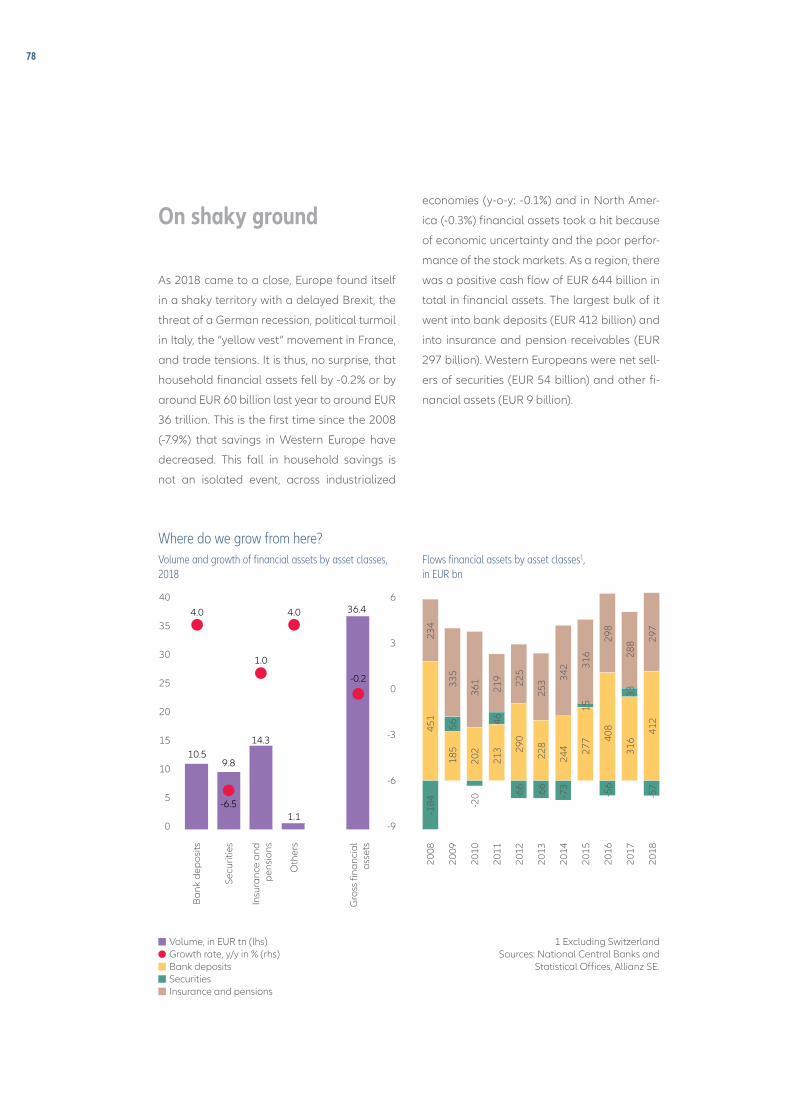
78
On shaky ground
As 2018 came to a close, Europe found itself
in a shaky territory with a delayed Brexit, the
threat of a German recession, political turmoil
in Italy, the “yellow vest” movement in France,
and trade tensions. It is thus, no surprise, that
household financial assets fell by -0.2% or by
around EUR 60 billion last year to around EUR
36 trillion. This is the first time since the 2008
(-7.9%) that savings in Western Europe have
decreased. This fall in household savings is
not an isolated event, across industrialized
economies (y-o-y: -0.1%) and in North Amer-
ica (-0.3%) financial assets took a hit because
of economic uncertainty and the poor perfor-
mance of the stock markets. As a region, there
was a positive cash flow of EUR 644 billion in
total in financial assets. The largest bulk of it
went into bank deposits (EUR 412 billion) and
into insurance and pension receivables (EUR
297 billion). Western Europeans were net sell-
ers of securities (EUR 54 billion) and other fi-
nancial assets (EUR 9 billion).
Where do we grow from here?Volume and growth of financial assets by asset classes, 2018
Flows financial assets by asset classes1, in EUR bn
1 Excluding SwitzerlandSources: National Central Banks and
Statistical Offices, Allianz SE.
Ban
k de
pos
its
Secu
ritie
s
Oth
ers
Insu
ranc
e an
d p
ensi
ons
Gro
ss fi
nanc
ial
asse
ts
4.0
10.5
1.0
4.0
14.3
1.1
9.8
-6.5
36.4
-0.2
2008
2009
2010
2011
2012
2013
2014
2015
2016
2017
2018
451
-184
234
5618
533
5
202
-20
361
219
4621
3
225
-66
290
228
-66
253 34
224
4-7
3
277
1531
6
298
408
-56
316
288
33
297
412
-57
Volume, in EUR tn (lhs) Growth rate, y/y in % (rhs)Bank depositsSecuritiesInsurance and pensions
40
35
30
25
20
15
10
5
0
6
3
0
-3
-6
-9
ALLIANZ GLOBAL WEALTH REPORT 2019 – REGIONAL DIFFERENCES: WESTERN EUROPE 79
Economic Research
The asset structure in Western Europe is quite
balanced: 29% of the gross financial assets are
in the form of bank deposits or cash savings
(EUR 11.2 trillion), securities comprise about
31% of the average European household
portfolio (EUR 9.8 trillion), and insurance and
pension receivables represent almost 40% of
financial assets (EUR 14.3 trillion). Household
financial asset structure in Europe has been
changing for the past twenty years. The distri-
bution of assets in the early 2000s was slightly
heavier on the securities and stocks side with
a 37% share of the portfolio, while insurance
represented only 32%, and cash savings made
up 28%. The shift towards insurance and pen-
sion products is likely due to demographic
changes and a greater need to make private
provisions for retirement.
With the persistence of low-yields, it is be-
coming increasingly complicated to choose
between long maturity financial products
because of the suppressed returns. When
looking at the financial asset structure per
country, there is no “one size fits all” portfolio.
The proportion of securities ranges from 13%
in Ireland to 49% in Finland. Bank deposits
Differing preferencesAsset classes as % of gross financial assets, 2018
Sources: National Central Banks and Statistical Offices, Allianz SE.
100
90
80
70
60
50
40
30
20
10
0
GR PT AT ES DE IE CH IT FL BE FR NO GB NL DK SE
65
5
28
45
18
31
42
20
36
41
17
40
41
37
22
39
47
13
38
10
47
33
41
26
32
23
44
32
17
49
29
37
28
28
32
28
25
56
16
17
66
14
16
52
30
15
38
45
Bank depositsSecuritiesInsurance and pensionsOther
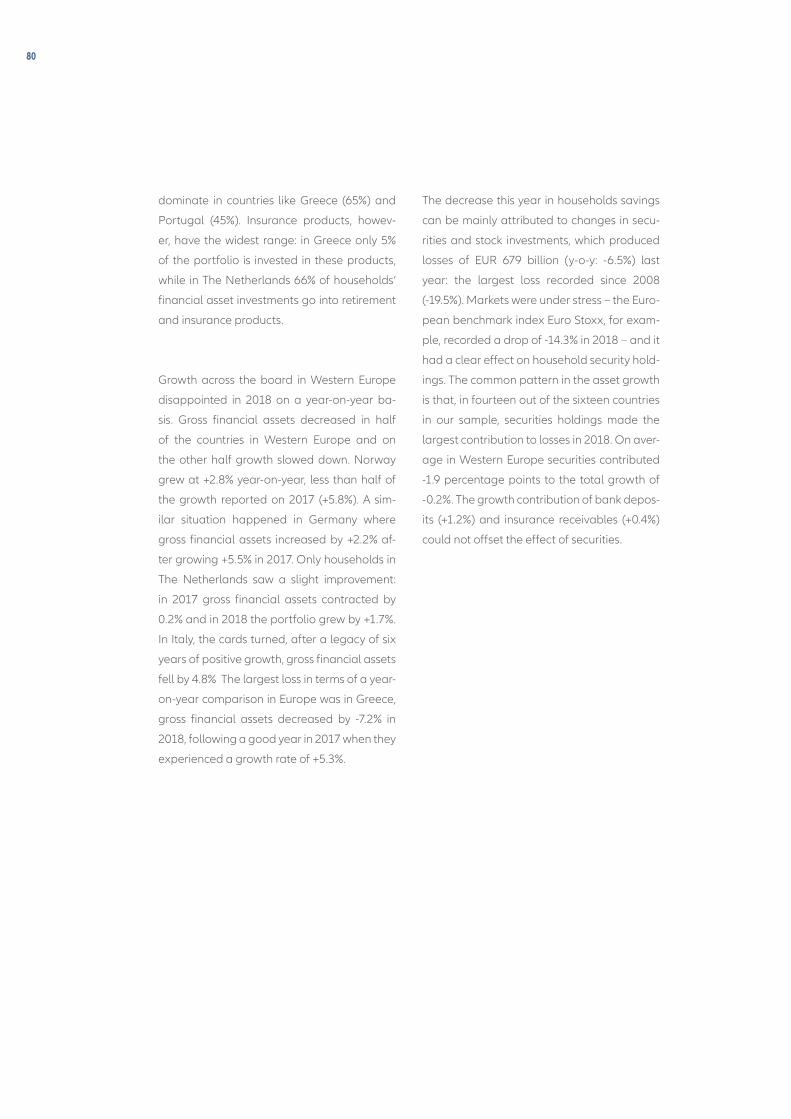
80
dominate in countries like Greece (65%) and
Portugal (45%). Insurance products, howev-
er, have the widest range: in Greece only 5%
of the portfolio is invested in these products,
while in The Netherlands 66% of households’
financial asset investments go into retirement
and insurance products.
Growth across the board in Western Europe
disappointed in 2018 on a year-on-year ba-
sis. Gross financial assets decreased in half
of the countries in Western Europe and on
the other half growth slowed down. Norway
grew at +2.8% year-on-year, less than half of
the growth reported on 2017 (+5.8%). A sim-
ilar situation happened in Germany where
gross financial assets increased by +2.2% af-
ter growing +5.5% in 2017. Only households in
The Netherlands saw a slight improvement:
in 2017 gross financial assets contracted by
0.2% and in 2018 the portfolio grew by +1.7%.
In Italy, the cards turned, after a legacy of six
years of positive growth, gross financial assets
fell by 4.8% The largest loss in terms of a year-
on-year comparison in Europe was in Greece,
gross financial assets decreased by -7.2% in
2018, following a good year in 2017 when they
experienced a growth rate of +5.3%.
The decrease this year in households savings
can be mainly attributed to changes in secu-
rities and stock investments, which produced
losses of EUR 679 billion (y-o-y: -6.5%) last
year: the largest loss recorded since 2008
(-19.5%). Markets were under stress – the Euro-
pean benchmark index Euro Stoxx, for exam-
ple, recorded a drop of -14.3% in 2018 – and it
had a clear effect on household security hold-
ings. The common pattern in the asset growth
is that, in fourteen out of the sixteen countries
in our sample, securities holdings made the
largest contribution to losses in 2018. On aver-
age in Western Europe securities contributed
-1.9 percentage points to the total growth of
-0.2%. The growth contribution of bank depos-
its (+1.2%) and insurance receivables (+0.4%)
could not offset the effect of securities.
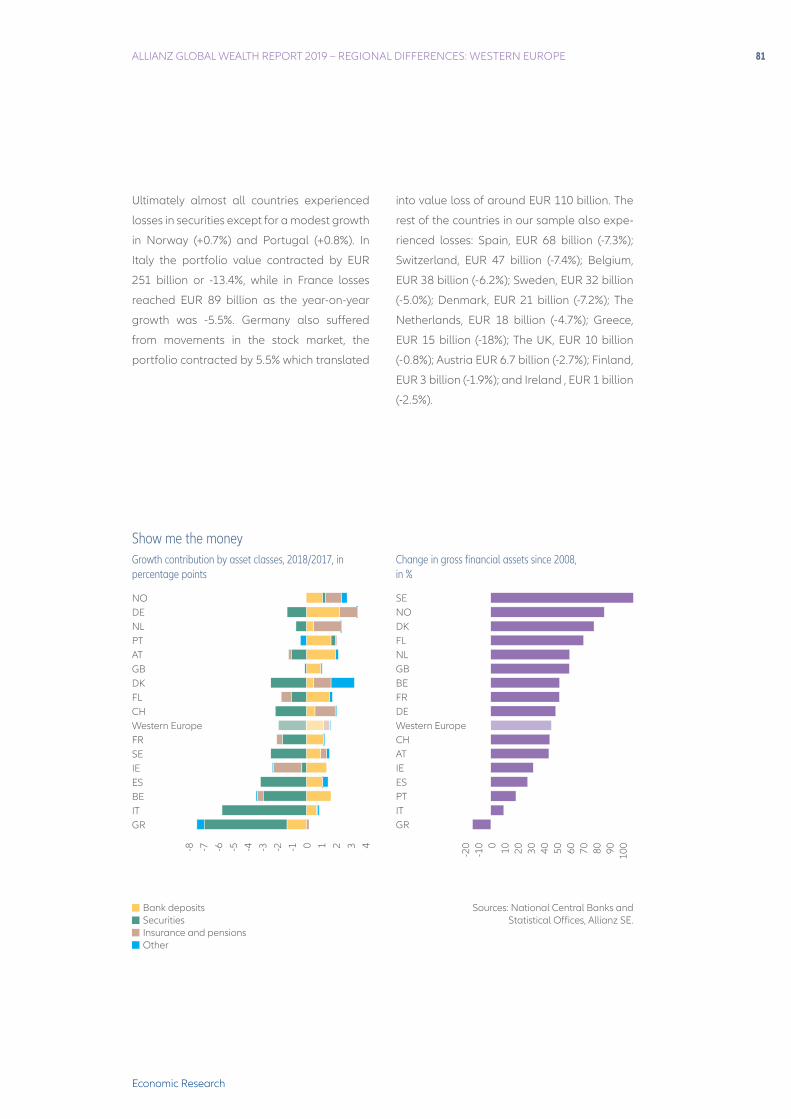
ALLIANZ GLOBAL WEALTH REPORT 2019 – REGIONAL DIFFERENCES: WESTERN EUROPE 81
Economic Research
Ultimately almost all countries experienced
losses in securities except for a modest growth
in Norway (+0.7%) and Portugal (+0.8%). In
Italy the portfolio value contracted by EUR
251 billion or -13.4%, while in France losses
reached EUR 89 billion as the year-on-year
growth was -5.5%. Germany also suffered
from movements in the stock market, the
portfolio contracted by 5.5% which translated
into value loss of around EUR 110 billion. The
rest of the countries in our sample also expe-
rienced losses: Spain, EUR 68 billion (-7.3%);
Switzerland, EUR 47 billion (-7.4%); Belgium,
EUR 38 billion (-6.2%); Sweden, EUR 32 billion
(-5.0%); Denmark, EUR 21 billion (-7.2%); The
Netherlands, EUR 18 billion (-4.7%); Greece,
EUR 15 billion (-18%); The UK, EUR 10 billion
(-0.8%); Austria EUR 6.7 billion (-2.7%); Finland,
EUR 3 billion (-1.9%); and Ireland , EUR 1 billion
(-2.5%).
Show me the moneyGrowth contribution by asset classes, 2018/2017, in percentage points
Change in gross financial assets since 2008, in %
NODENLPTATGBDKFLCHWestern EuropeFRSEIEESBEITGR
SENODKFLNLGBBEFRDEWestern EuropeCHATIEESPTITGR
-8 -7 -6 -5 -4 -3 -2 -1 0 1 2 3 4
-20
-10 0 10 20 30 40 50 60 70 80 90 100
Sources: National Central Banks and Statistical Offices, Allianz SE.
Bank depositsSecuritiesInsurance and pensionsOther
82
In Western Europe we can also observe a pref-
erence for liquidity. In all countries – except for
Greece – bank and deposit savings positively
contributed to gross financial asset growth.
On a regional level, this asset class grew by
+4.0%. In Germany, the effect of cash holdings
on growth was more pronounced. Germans
are risk averse, and as an asset class it grew
by 6.0% year-on-year. In Belgium, for example,
it is the only asset class that grew at all (5.7%).
Since the height of the financial crisis in 2008,
almost all countries have grown in terms of
gross financial assets – except for Greece.
Greek households hold almost 13% less than
what they owned in 2008 at EUR 245 billion
in 2018.
Insurance in Western Europe – walking on the safe side
Insurance receivables in Western Europe rep-
resent almost 40% (EUR 14.3 trillion) of the
total financial assets, slightly above the ad-
vanced economy weight of 34% (EUR 48.3 tril-
lion in total). Demographics and local pension
systems play an important role in the growth
of this asset class. Growth in this asset class
was also subdued, in the last decade it grew
on average +4.5%, in 2018, only by a meager
+1.0%. The three largest holdings, in terms of
total volume, in the region are the UK (EUR 4.2
trillion), Germany (EUR 2.3 trillion), and France
(EUR 2.0 trillion).
The debt factor
On a global level, since the financial crisis hit,
debt has been taken more seriously. In Europe,
in particular debt has grown very modestly in
the last few years. In 2006, growth in liabilities
reached its highest level at 8.8%. In 2018, it
reached 3.2% y-o-y, lower than the advanced
economies average of 3.4%. Despite the ECB’s
loose monetary policy and the efforts focused
on fostering private consumption, European
household debt increased on average +2.0%
since 2008, showing an only very slight accel-
eration in the past four years. The efforts by
the ECB seem to fall on deaf ears. In 2018
the gap between liabilities and gross finan-
cial asset growth increased to 3.4 percentage
points (2017: -0.8%). Nonetheless, the ratio of
household debt to financial assets has contin-
uously fallen from a record of 37.6% in 2008, to
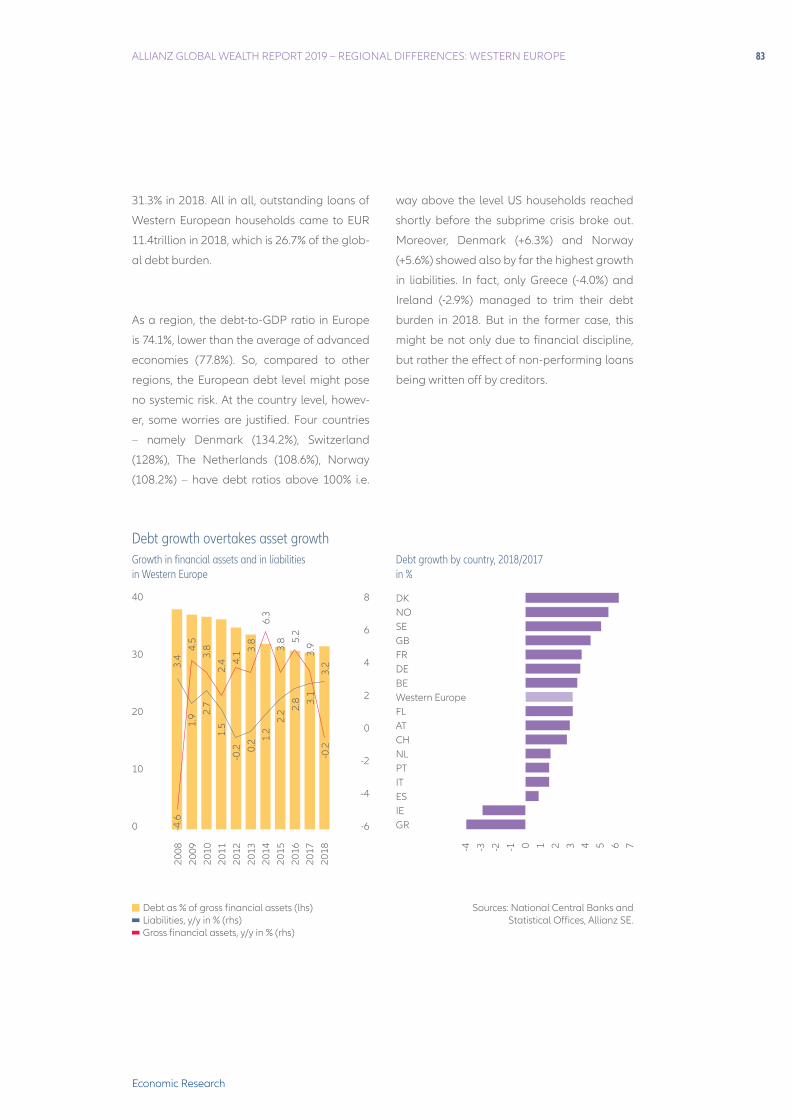
ALLIANZ GLOBAL WEALTH REPORT 2019 – REGIONAL DIFFERENCES: WESTERN EUROPE 83
Economic Research
31.3% in 2018. All in all, outstanding loans of
Western European households came to EUR
11.4trillion in 2018, which is 26.7% of the glob-
al debt burden.
As a region, the debt-to-GDP ratio in Europe
is 74.1%, lower than the average of advanced
economies (77.8%). So, compared to other
regions, the European debt level might pose
no systemic risk. At the country level, howev-
er, some worries are justified. Four countries
– namely Denmark (134.2%), Switzerland
(128%), The Netherlands (108.6%), Norway
(108.2%) – have debt ratios above 100% i.e.
way above the level US households reached
shortly before the subprime crisis broke out.
Moreover, Denmark (+6.3%) and Norway
(+5.6%) showed also by far the highest growth
in liabilities. In fact, only Greece (-4.0%) and
Ireland (-2.9%) managed to trim their debt
burden in 2018. But in the former case, this
might be not only due to financial discipline,
but rather the effect of non-performing loans
being written off by creditors.
Debt growth overtakes asset growth Growth in financial assets and in liabilities in Western Europe
Debt growth by country, 2018/2017 in %
DKNOSEGBFRDEBEWestern EuropeFLATCHNLPTITESIEGR
-4 -3 -2 -1 0 1 2 3 4 5 6 7
Sources: National Central Banks and Statistical Offices, Allianz SE.
Debt as % of gross financial assets (lhs) Liabilities, y/y in % (rhs) Gross financial assets, y/y in % (rhs)
2008
2009
2010
2011
2012
2013
2014
2015
2016
2017
2018
40
30
20
10
0
8
6
4
2
0
-2
-4
-6
3.4
-4.6
4.5
1.9 2.
73.
81.
52.
4-0
.24.
1 3.8
0.2
2.2
3.8
-0.2
3.2
3.1
3.9
2.8
5.2
1.2
6.3
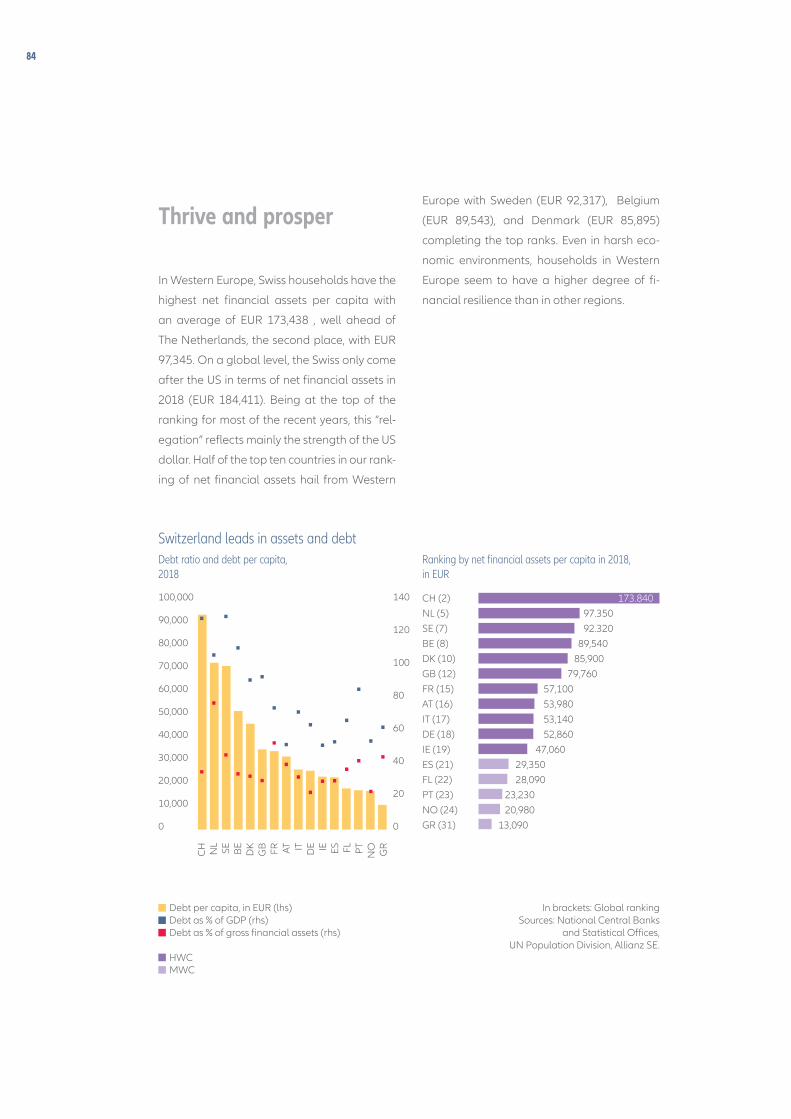
84
Thrive and prosper
In Western Europe, Swiss households have the
highest net financial assets per capita with
an average of EUR 173,438 , well ahead of
The Netherlands, the second place, with EUR
97,345. On a global level, the Swiss only come
after the US in terms of net financial assets in
2018 (EUR 184,411). Being at the top of the
ranking for most of the recent years, this “rel-
egation” reflects mainly the strength of the US
dollar. Half of the top ten countries in our rank-
ing of net financial assets hail from Western
Europe with Sweden (EUR 92,317), Belgium
(EUR 89,543), and Denmark (EUR 85,895)
completing the top ranks. Even in harsh eco-
nomic environments, households in Western
Europe seem to have a higher degree of fi-
nancial resilience than in other regions.
Switzerland leads in assets and debtDebt ratio and debt per capita, 2018
Ranking by net financial assets per capita in 2018, in EUR
In brackets: Global rankingSources: National Central Banks
and Statistical Offices, UN Population Division, Allianz SE.
100,000
90,000
80,000
70,000
60,000
50,000
40,000
30,000
20,000
10,000
0
140
120
100
80
60
40
20
0
Debt per capita, in EUR (lhs) Debt as % of GDP (rhs) Debt as % of gross financial assets (rhs)
HWCMWC
CH NL
SE BE
DK
GB FR AT IT DE IE ES FL PT
NO GR
CH (2)NL (5)SE (7)BE (8)DK (10)GB (12)FR (15)AT (16)IT (17)DE (18)IE (19)ES (21)FL (22)PT (23)NO (24)GR (31)
173.840 97.350 92.320 89,540 85,900 79,760 57,100 53,980 53,140 52,860 47,060 29,350 28,090 23,230 20,98013,090
ALLIANZ GLOBAL WEALTH REPORT 2019 – REGIONAL DIFFERENCES: WESTERN EUROPE 85
Economic Research
…If I was a rich man
As far as net financial assets are concerned,
Western Europeans are spread relatively
evenly across all three asset classes. Almost
all countries in the region exhibit a net asset
per capita above EUR 45,600, which places
them within the “high wealth class” country
club. However, it is not all “la vie en rose”, in
terms of wealth distribution, almost 33% of the
population (138 million) in Western Europe
doesn’t have savings of at least EUR 7,600.
Which places them in the lowest wealth cate-
gory. The middle class is comprised of 135 mil-
lion people (32% of the population in Europe)
and the highest wealth category reaches 35%
of the population (or 148 million Europeans).

86
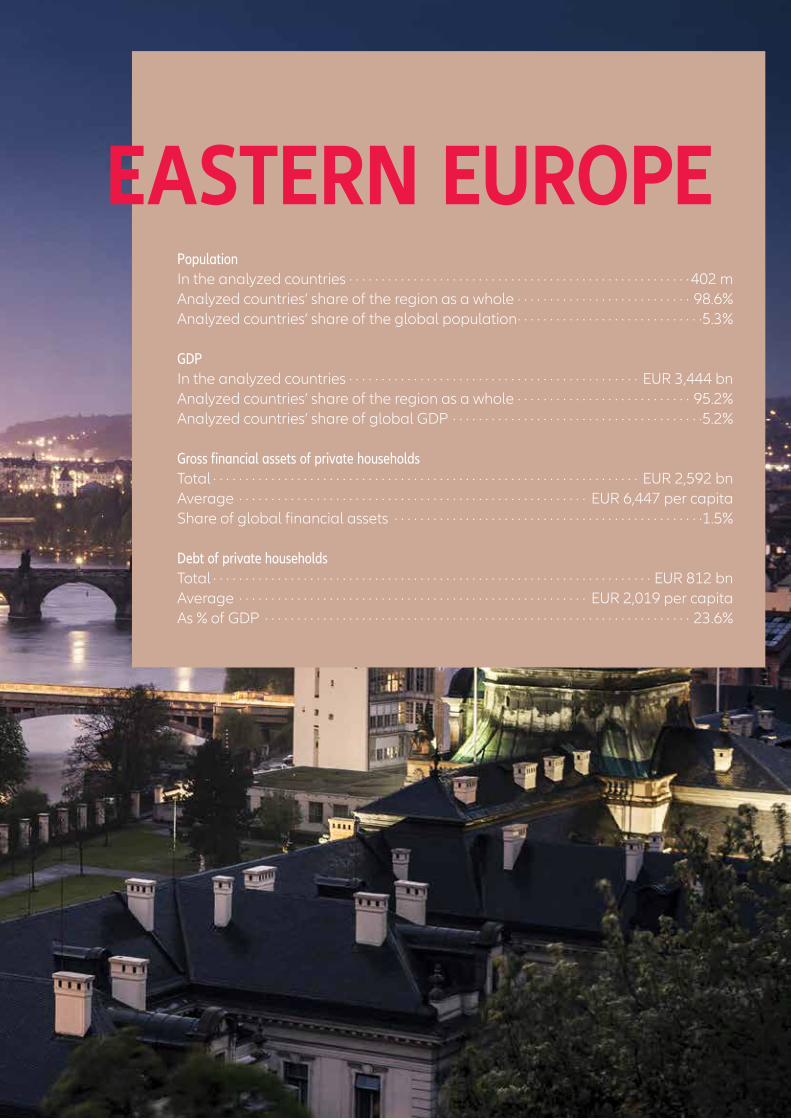
ALLIANZ GLOBAL WEALTH REPORT 2019 – REGIONAL DIFFERENCES: EASTERN EUROPE 87
Economic Research
EASTERN EUROPEPopulation In the analyzed countries · · · · · · · · · · · · · · · · · · · · · · · · · · · · · · · · · · · · · · · · · · · · · · · · · · · · · 402 m Analyzed countries’ share of the region as a whole · · · · · · · · · · · · · · · · · · · · · · · · · · · 98.6%Analyzed countries’ share of the global population· · · · · · · · · · · · · · · · · · · · · · · · · · · · ·5.3% GDP In the analyzed countries · · · · · · · · · · · · · · · · · · · · · · · · · · · · · · · · · · · · · · · · · · · · · EUR 3,444 bnAnalyzed countries’ share of the region as a whole · · · · · · · · · · · · · · · · · · · · · · · · · · · 95.2%Analyzed countries’ share of global GDP · · · · · · · · · · · · · · · · · · · · · · · · · · · · · · · · · · · · · · ·5.2% Gross financial assets of private households Total · · · · · · · · · · · · · · · · · · · · · · · · · · · · · · · · · · · · · · · · · · · · · · · · · · · · · · · · · · · · · · · · · · EUR 2,592 bnAverage · · · · · · · · · · · · · · · · · · · · · · · · · · · · · · · · · · · · · · · · · · · · · · · · · · · · · · EUR 6,447 per capitaShare of global financial assets · · · · · · · · · · · · · · · · · · · · · · · · · · · · · · · · · · · · · · · · · · · · · · · ·1.5% Debt of private households Total · · · · · · · · · · · · · · · · · · · · · · · · · · · · · · · · · · · · · · · · · · · · · · · · · · · · · · · · · · · · · · · · · · · · EUR 812 bnAverage · · · · · · · · · · · · · · · · · · · · · · · · · · · · · · · · · · · · · · · · · · · · · · · · · · · · · · EUR 2,019 per capitaAs % of GDP · · · · · · · · · · · · · · · · · · · · · · · · · · · · · · · · · · · · · · · · · · · · · · · · · · · · · · · · · · · · · · · · · · 23.6%
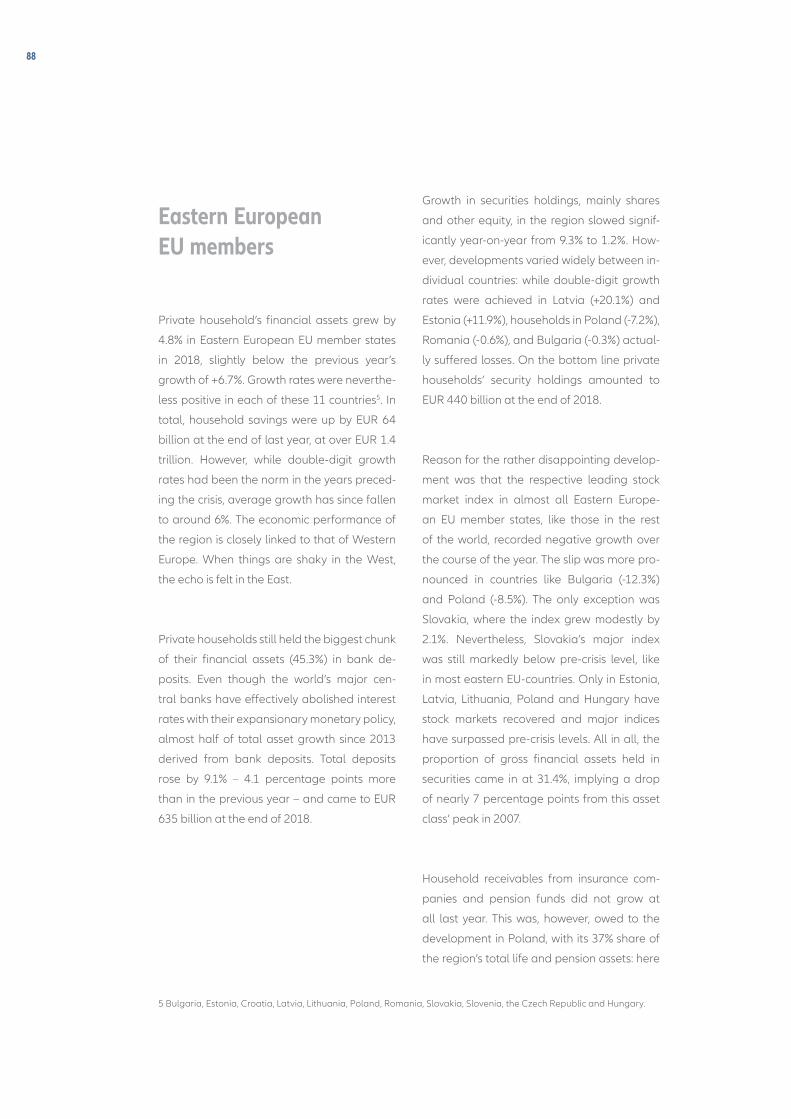
88
Eastern European EU members
Private household’s financial assets grew by
4.8% in Eastern European EU member states
in 2018, slightly below the previous year’s
growth of +6.7%. Growth rates were neverthe-
less positive in each of these 11 countries5. In
total, household savings were up by EUR 64
billion at the end of last year, at over EUR 1.4
trillion. However, while double-digit growth
rates had been the norm in the years preced-
ing the crisis, average growth has since fallen
to around 6%. The economic performance of
the region is closely linked to that of Western
Europe. When things are shaky in the West,
the echo is felt in the East.
Private households still held the biggest chunk
of their financial assets (45.3%) in bank de-
posits. Even though the world’s major cen-
tral banks have effectively abolished interest
rates with their expansionary monetary policy,
almost half of total asset growth since 2013
derived from bank deposits. Total deposits
rose by 9.1% – 4.1 percentage points more
than in the previous year – and came to EUR
635 billion at the end of 2018.
Growth in securities holdings, mainly shares
and other equity, in the region slowed signif-
icantly year-on-year from 9.3% to 1.2%. How-
ever, developments varied widely between in-
dividual countries: while double-digit growth
rates were achieved in Latvia (+20.1%) and
Estonia (+11.9%), households in Poland (-7.2%),
Romania (-0.6%), and Bulgaria (-0.3%) actual-
ly suffered losses. On the bottom line private
households’ security holdings amounted to
EUR 440 billion at the end of 2018.
Reason for the rather disappointing develop-
ment was that the respective leading stock
market index in almost all Eastern Europe-
an EU member states, like those in the rest
of the world, recorded negative growth over
the course of the year. The slip was more pro-
nounced in countries like Bulgaria (-12.3%)
and Poland (-8.5%). The only exception was
Slovakia, where the index grew modestly by
2.1%. Nevertheless, Slovakia’s major index
was still markedly below pre-crisis level, like
in most eastern EU-countries. Only in Estonia,
Latvia, Lithuania, Poland and Hungary have
stock markets recovered and major indices
have surpassed pre-crisis levels. All in all, the
proportion of gross financial assets held in
securities came in at 31.4%, implying a drop
of nearly 7 percentage points from this asset
class’ peak in 2007.
Household receivables from insurance com-
panies and pension funds did not grow at
all last year. This was, however, owed to the
development in Poland, with its 37% share of
the region’s total life and pension assets: here
5 Bulgaria, Estonia, Croatia, Latvia, Lithuania, Poland, Romania, Slovakia, Slovenia, the Czech Republic and Hungary.
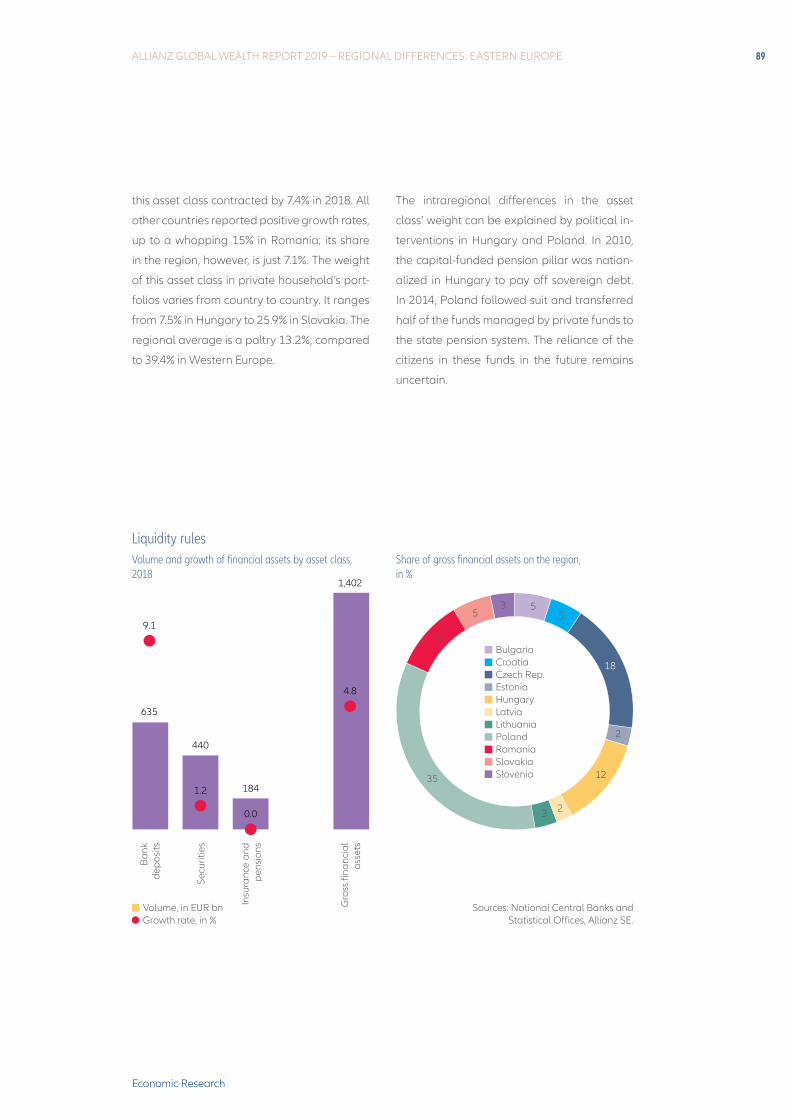
ALLIANZ GLOBAL WEALTH REPORT 2019 – REGIONAL DIFFERENCES: EASTERN EUROPE 89
Economic Research
this asset class contracted by 7.4% in 2018. All
other countries reported positive growth rates,
up to a whopping 15% in Romania; its share
in the region, however, is just 7.1%. The weight
of this asset class in private household’s port-
folios varies from country to country. It ranges
from 7.5% in Hungary to 25.9% in Slovakia. The
regional average is a paltry 13.2%, compared
to 39.4% in Western Europe.
The intraregional differences in the asset
class’ weight can be explained by political in-
terventions in Hungary and Poland. In 2010,
the capital-funded pension pillar was nation-
alized in Hungary to pay off sovereign debt.
In 2014, Poland followed suit and transferred
half of the funds managed by private funds to
the state pension system. The reliance of the
citizens in these funds in the future remains
uncertain.
Liquidity rulesVolume and growth of financial assets by asset class, 2018
Share of gross financial assets on the region, in %
Sources: National Central Banks and Statistical Offices, Allianz SE.
Ban
k de
pos
its
Secu
ritie
s
Insu
ranc
e an
d p
ensi
ons
Gro
ss fi
nanc
ial
asse
ts
35
18
10
53 5
5
2
12
23
Volume, in EUR bn Growth rate, in %
BulgariaCroatiaCzech Rep.EstoniaHungaryLatviaLithuaniaPolandRomaniaSlovakiaSlovenia
9.1
1.2
0.0
4.8
1,402
184
440
635
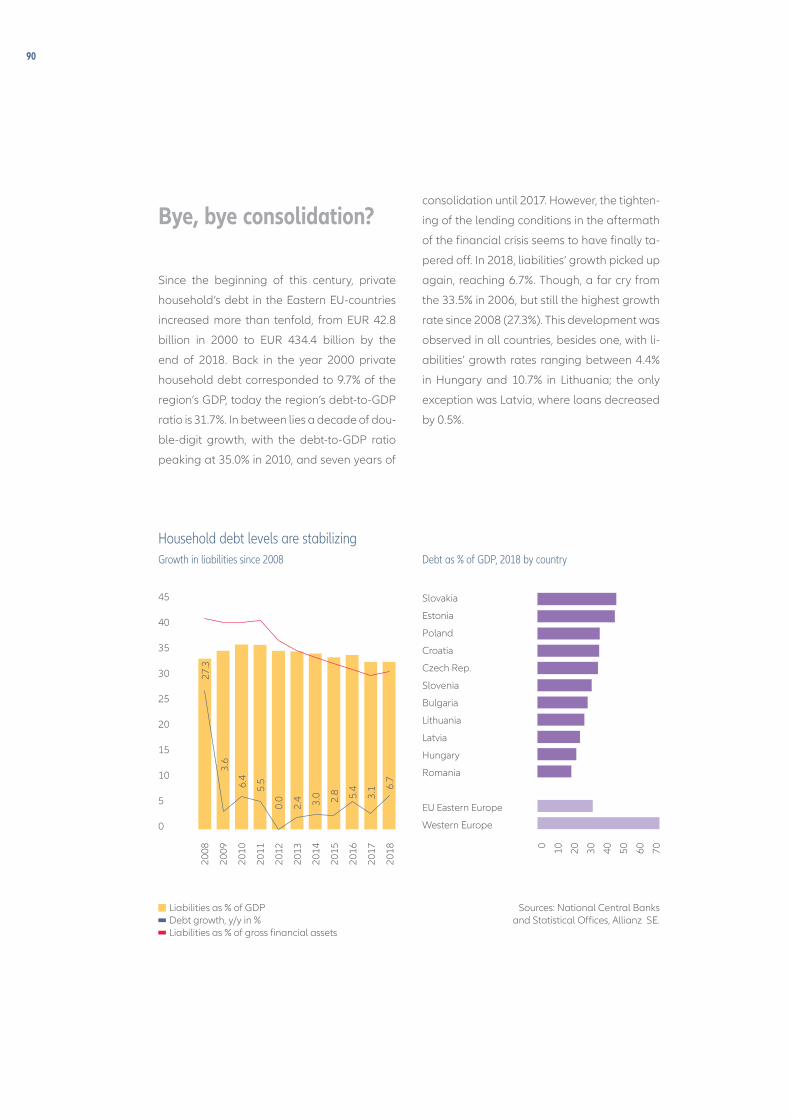
90
Bye, bye consolidation?
Since the beginning of this century, private
household’s debt in the Eastern EU-countries
increased more than tenfold, from EUR 42.8
billion in 2000 to EUR 434.4 billion by the
end of 2018. Back in the year 2000 private
household debt corresponded to 9.7% of the
region’s GDP, today the region’s debt-to-GDP
ratio is 31.7%. In between lies a decade of dou-
ble-digit growth, with the debt-to-GDP ratio
peaking at 35.0% in 2010, and seven years of
consolidation until 2017. However, the tighten-
ing of the lending conditions in the aftermath
of the financial crisis seems to have finally ta-
pered off. In 2018, liabilities’ growth picked up
again, reaching 6.7%. Though, a far cry from
the 33.5% in 2006, but still the highest growth
rate since 2008 (27.3%). This development was
observed in all countries, besides one, with li-
abilities’ growth rates ranging between 4.4%
in Hungary and 10.7% in Lithuania; the only
exception was Latvia, where loans decreased
by 0.5%.
Household debt levels are stabilizingGrowth in liabilities since 2008 Debt as % of GDP, 2018 by country
Slovakia
Estonia
Poland
Croatia
Czech Rep.
Slovenia
Bulgaria
Lithuania
Latvia
Hungary
Romania
EU Eastern Europe
Western Europe
0 10 20 30 40 50 60 70
Sources: National Central Banks and Statistical Offices, Allianz SE.
Liabilities as % of GDP Debt growth, y/y in % Liabilities as % of gross financial assets
2008
2009
2010
2011
2012
2013
2014
2015
2016
2017
2018
45
40
35
30
25
20
15
10
5
0
27.3
6.4
3.6
5.5
2.4
0.0 2.
8 6.7
3.1
5.4
3.0
ALLIANZ GLOBAL WEALTH REPORT 2019 – REGIONAL DIFFERENCES: EASTERN EUROPE 91
Economic Research
However, despite this increase debt-to-GDP
levels in the majority of the countries are still
lower than before or shortly after the outbreak
of the financial crisis, ranging from 19.4% in
Romania to 45.0% in Slovakia, with the latter
being the only country in the region where no
consolidation took place after 2008. They are
also still lower than in the Western European
EU-member countries, where the average
debt-to-GDP ratio was 74.1%.
Another positive effect of the rather subdued
liabilities growth was a marked improvement
of debt-to-asset ratio, which declined from a
maximum 41.6% in 2008 to 30.4% in 2017 on
average. Despite the slight increase to 31.0%
at the end of 2018, it is not only on regional
level but also on country level still well below
the levels seen at the end of 2008 , with the
only exception of Slovakia, where the ratio has
reached record-high 54.3% at the end of 2018.
Still large wealth gaps between the EU-member countries
Net assets per capita in Eastern European
EU-member countries amounted to an aver-
age of EUR 9,430 the end of 2018. However,
the range between the richest and the poor-
est countries in the region is still rather wide.
Like in the year before, the inhabitants of the
Czech Republic were the richest in the region
with net financial assets amounting to EUR
16,785 per capita. Estonia ranked second,
with an average EUR 16,214 per inhabitant
and Slovenia, until 2015 topping the ranking
every year, ranked third, with an amount of
EUR 15,196 per capita. At the lower end were
Slovakia with net financial assets adding up
to EUR 6,255 per capita and Romania with
a mere EUR 4,878 per inhabitant; thus these
were the only two EU members belonging to
the global low wealth class countries. How-
ever, in the case of Slovakia it is the high in-
debtedness of the private households, that
pushed the country in the low wealth class.
In gross terms, Slovakia ranked among the
middle wealth countries like all the other East-
ern EU-member countries besides Romania,
the poorest country of the Eastern European
EU-member countries with gross financial
assets per capita amounting to a mere EUR
6,843.
92
However, compared to Western European
households, where net financial assets per
capita amounted to EUR 59,392 in 2018, the
gap is still huge. However, there has been at
least some progress since the turn of the cen-
tury: In 2000 the average net financial assets
per capita in the Eastern European EU-mem-
ber states amounted to a mere 6.1% of those
of their Western European peers; in 2018 they
corresponded to 15.9% of the respective sum.
Nevertheless, it is still a long way to conver-
gence within the EU.
Eastern European coun-tries outside of the EU
Private household’s gross financial assets
in Kazakhstan, Russia, Serbia, Turkey, and
Ukraine have increased by a compound av-
erage growth rate of 21.6% since the financial
crisis. However, growth had slowed down in re-
cent years, but in 2018 it picked-up to +12.0%,
Huge differencesNet financial assets and debt per capita 2018, in EUR
Debt as % of gross financial assets by country
0
5.00
0
10.0
00
15.0
00
20.0
00
25.0
00
Sources: National Central Banks and Statistical Offices, UN Population
Division, Allianz SE.
Net financial assets Liabilities
20082018
Slov
akia
Pol
and
Esto
nia
Slov
enia
Cro
atia
Lith
uani
a
Rom
ania
Cze
ch R
ep.
Latv
ia
Bul
garia
Hun
gary
70
60
50
40
30
20
10
0
Estonia
Czech Republic
Slovenia
Hungary
Latvia
Croatia
Lithuania
Slovakia
Poland
Bulgaria
Romania
Threshold formiddle wealth class
ALLIANZ GLOBAL WEALTH REPORT 2019 – REGIONAL DIFFERENCES: EASTERN EUROPE 93
Economic Research
the highest increase since 2015. The volume
of assets in these five countries is too low to
make up for losses in other regions (global
share: 0.7%; gross financial assets: EUR 1.1
trillion), despite its dynamism. These countries
are home to almost 6% of the population in
our sample. In per capita terms, the popula-
tion owns EUR 3,974, while the Eastern Europe-
an EU members own EUR 13,665 on average.
Liabilities have been growing at a faster pace
than assets for a couple of years now. In the
period between 2008 and 2017, household
debt grew on average 15% annually. Last
year, it grew by 16.7% and reached EUR 377
billion. The high growth notwithstanding, the
region has still the lowest debt ratio (debt as
percentage of GDP), liabilities are only 18.2%
of the regional GDP. As means of comparison,
emerging markets have an average of 40.3%,
Latin America has 29.6%, and their EU-mem-
ber neighbors have a 31.7% debt-to-GDP
ratio. Households held net average assets of
EUR 2,714 per capita at the end of 2018. The
largest share of assets were owned by house-
holds in Russia (75%) and Turkey (20%);their
net assets per capita were EUR 4,167 and EUR
1,953, respectively.
Russia’s economy was strained by trade ten-
sions and sanctions. As a consequence, China
is now one of Russia’s most important trade
partners, making Russia increasingly depend-
ent on its giant neighbor. On top of this, the
volume of fuel oil exports have been falling
since 2015. Last year, GDP seemed to improve
and grew by 2.3% in real terms, but this was
mostly related to revenue from the World Cup
and slightly increasing commodity prices.
However, household gross financial assets
in Russia reached EUR 855 billion by grow-
ing +10.7% y-o-y. Deposits showed dynamic
growth in 2018 (+11.7%). Cash savings are the
lion’s share of the gross financial assets (62%
of gross financial assets or EUR 530 billion).
Securities also had a good year in Russia: they
outpaced the growth in 2017 (+4.7%), grew by
+10.6%, and came to a total of EUR 237 billion.
Securities, stocks and bonds make up 28% of
the gross financial assets as of 2018.
Insurance in Russia is highly influenced by the
rate of growth in lending to households, as
well as by the demand of life insurance prod-
ucts. In 2018, insurance and pension products
showed an increase of +12.2% and totaled
EUR 61 billion; but its portfolio share of 7.2%
is still very low. Going forward, this asset class
should respond to changes in regulations ef-
fective from January 2019, which influence the
demand of investment life insurance premi-
ums.
Moreover, liability growth outpaced asset
94
growth by a wide margin: household debt
grew by 22% to EUR 247 billion in 2018. As a
consequence, net wealth in the country grew
by “only”+5.6% (EUR 607 billion). While the
debt ratio (20% of GDP) is nowhere near wor-
rying, there is a cause of concern: most of the
new debt in Russia is related to consumption.
With a stagnant economy and increasing con-
sumer prices, the Central Bank of the Russian
Federation needs to find a way to boost the
economic health of households.
In 2018, gross financial asset growth in Tur-
key, accelerated to 19.7% from 13.9% in 2017.
However, this growth is not all that impressive
when taking into account that the country has
a 16.3% year-on-year inflation rate. Neverthe-
less, the volume of household’s gross financial
assets reached EUR 262 billion. The Turkish
GDP seemed to be picking up positively after
the coup attempt in 2016. However, a number
of policy mistakes placed the economy be-
tween a rock and a hard place and it grew by
only +2.6%, compared to 2017’s 7.4% real GDP
growth.
Excessive corporate lending contributed to
the inflation hike and currency devaluation did
not bode well on foreign currency nominated
debt. However, macro-prudential policies that
blocked new FX borrowing by households
helped keep debt at bay. Household debt saw
a below average growth of 6.0%. Since the fi-
nancial crisis, liabilities had mostly seen dou-
ble digit growth at an average of +17.7%. By
the end of 2018 household debt totaled EUR
101 billion. The debt ratio in Turkey is 18%, well
below the emerging market average of 40.3%.
However, things seem to be picking up, as the
country embraces the need for fiscal and
monetary discipline. Nevertheless, growth in
2019 will most likely be subdued.
With gross assets per capita at EUR 3,180,
Turkey still has a long way to go before it can
join the ranks of the middle wealth countries
(EUR 7,600 per capita). Their household assets
are invested very conservatively: deposits rep-
resent 77% of the gross financial assets (EUR
203 billion), well above the emerging market
average of 45%. The increasing share of de-
posits in foreign currency translates into a lack
of confidence in the currency stability. Securi-
ties make up 11.3% of the total assets, last year
they fell by 1.4%, and as of 2018 they totaled
EUR 29 billion. As for insurance and pension
products, at EUR 23 billion, they represent
only 8.7% of the household portfolio. This as-
set class, however, shows the most dynamic
development, clocking an impressive growth
rate of +33.5% in 2018; over the last decade,
the average annual increase stands at+20.3%.
Gross financial assets in Ukraine are estimat-
ALLIANZ GLOBAL WEALTH REPORT 2019 – REGIONAL DIFFERENCES: EASTERN EUROPE 95
Economic Research
ed at EUR 6 billion, after slightly growing last
year by +1.1%. However, at an inflation rate
of 10.9%, assets in real terms suffered loss-
es of -9.8%. The average net financial assets
per capita came to just EUR 610 at the end
of 2018, only Kazakhstan was lower at EUR
569 amongst the countries analyzed. Serbia’s
households, too, lag far behind with average
assets of only about EUR 790 per capita. As
in Turkey, bank deposits account for the lion’s
share of financial assets in these countries,
with households there also favoring safe for-
eign currencies. About half of bank deposits
in Kazakhstan were denominated in foreign
currencies. Households in Serbia held around
80% of their savings deposits in foreign curren-
cies, primarily in euros. This high preference for
foreign currency reflects the low trust in the lo-
cal financial system and could be seen as an
indicator for a huge black market. Therefore,
financial asset data for these countries have
to be taken with a pinch of salt; they might un-
derestimate the “real” level of wealth.
All five countries belong to the LWCs and still
Russia leader of the pack Net financial assets and liabilities per capita 2018, in EUR
Sources: National Central Banks and Statistical Offices, UN Population
Division, Allianz SE.
Net financial assets Liabilities
0
2.00
0
4.00
0
6.00
0
8.00
0
Russia
Turkey
Serbia
Kazakhstan
Ukraine
Threshold formiddle wealth class
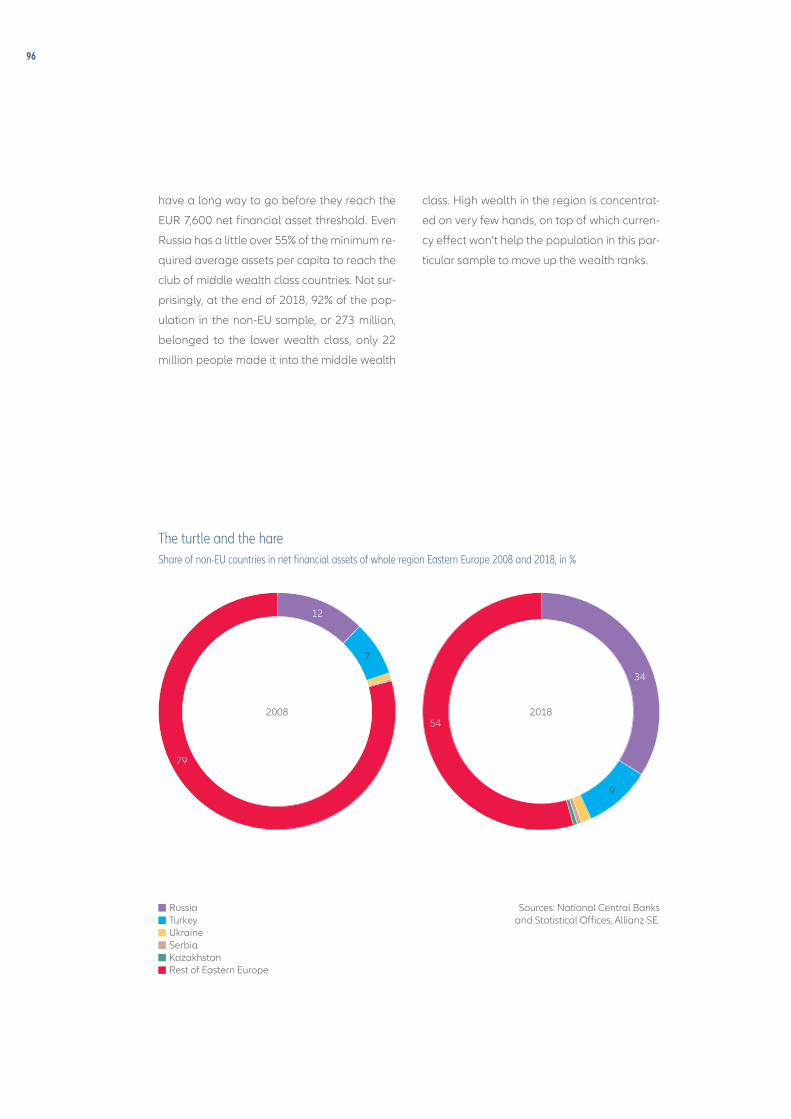
96
have a long way to go before they reach the
EUR 7,600 net financial asset threshold. Even
Russia has a little over 55% of the minimum re-
quired average assets per capita to reach the
club of middle wealth class countries. Not sur-
prisingly, at the end of 2018, 92% of the pop-
ulation in the non-EU sample, or 273 million,
belonged to the lower wealth class, only 22
million people made it into the middle wealth
class. High wealth in the region is concentrat-
ed on very few hands, on top of which curren-
cy effect won’t help the population in this par-
ticular sample to move up the wealth ranks.
The turtle and the hareShare of non-EU countries in net financial assets of whole region Eastern Europe 2008 and 2018, in %
Sources: National Central Banks and Statistical Offices, Allianz SE.
54
79
34
7
9
12
RussiaTurkeyUkraineSerbiaKazakhstanRest of Eastern Europe
2008 2018

ALLIANZ GLOBAL WEALTH REPORT 2019 – REGIONAL DIFFERENCES: EASTERN EUROPE 97
Economic Research

98
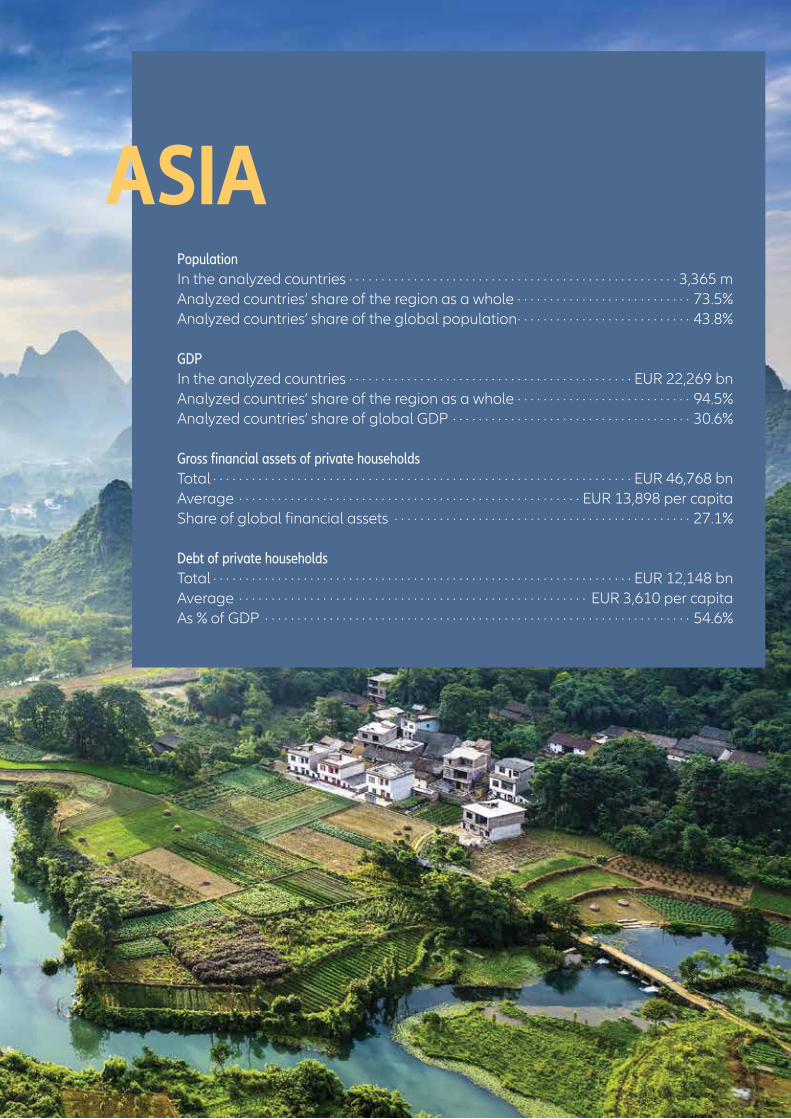
ALLIANZ GLOBAL WEALTH REPORT 2019 – REGIONAL DIFFERENCES: ASIA 99
Economic Research
ASIA Population In the analyzed countries · · · · · · · · · · · · · · · · · · · · · · · · · · · · · · · · · · · · · · · · · · · · · · · · · · · 3,365 m Analyzed countries’ share of the region as a whole · · · · · · · · · · · · · · · · · · · · · · · · · · · 73.5%Analyzed countries’ share of the global population· · · · · · · · · · · · · · · · · · · · · · · · · · · 43.8% GDP In the analyzed countries · · · · · · · · · · · · · · · · · · · · · · · · · · · · · · · · · · · · · · · · · · · · EUR 22,269 bnAnalyzed countries’ share of the region as a whole · · · · · · · · · · · · · · · · · · · · · · · · · · · 94.5%Analyzed countries’ share of global GDP · · · · · · · · · · · · · · · · · · · · · · · · · · · · · · · · · · · · · 30.6% Gross financial assets of private households Total · · · · · · · · · · · · · · · · · · · · · · · · · · · · · · · · · · · · · · · · · · · · · · · · · · · · · · · · · · · · · · · · · EUR 46,768 bnAverage · · · · · · · · · · · · · · · · · · · · · · · · · · · · · · · · · · · · · · · · · · · · · · · · · · · · · EUR 13,898 per capitaShare of global financial assets · · · · · · · · · · · · · · · · · · · · · · · · · · · · · · · · · · · · · · · · · · · · · · 27.1% Debt of private households Total · · · · · · · · · · · · · · · · · · · · · · · · · · · · · · · · · · · · · · · · · · · · · · · · · · · · · · · · · · · · · · · · · EUR 12,148 bnAverage · · · · · · · · · · · · · · · · · · · · · · · · · · · · · · · · · · · · · · · · · · · · · · · · · · · · · · EUR 3,610 per capitaAs % of GDP · · · · · · · · · · · · · · · · · · · · · · · · · · · · · · · · · · · · · · · · · · · · · · · · · · · · · · · · · · · · · · · · · · 54.6%
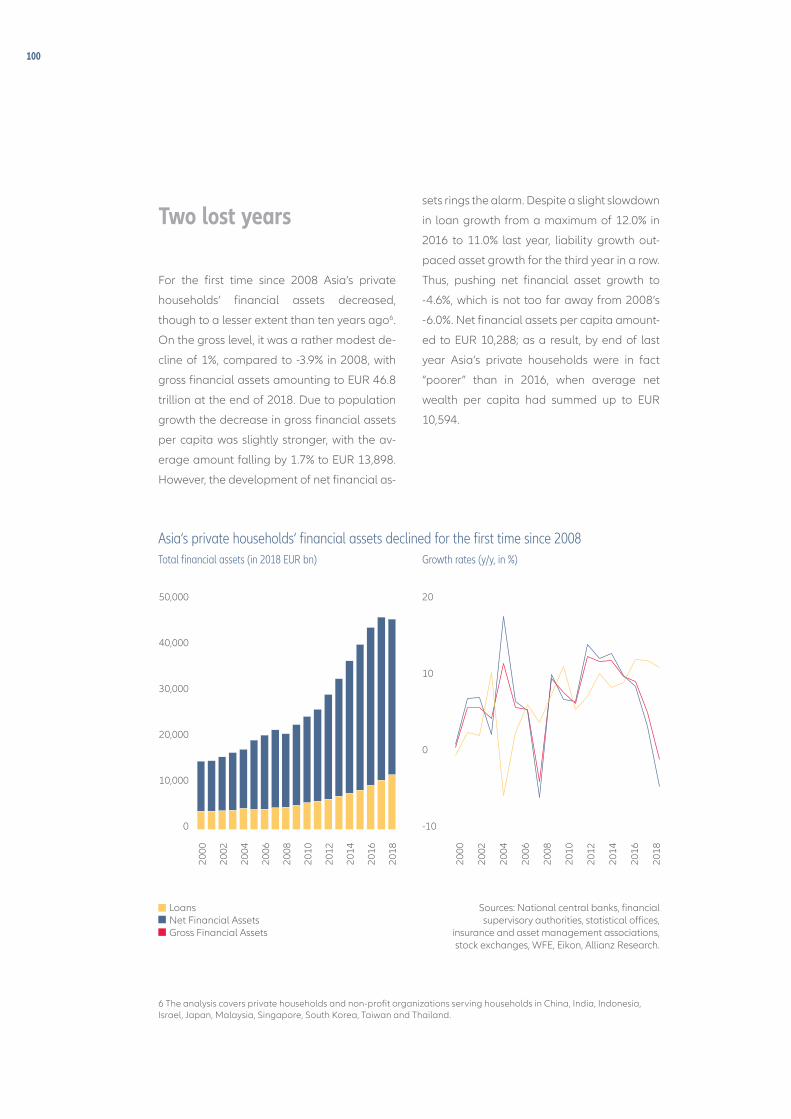
100
Two lost years
For the first time since 2008 Asia’s private
households’ financial assets decreased,
though to a lesser extent than ten years ago6.
On the gross level, it was a rather modest de-
cline of 1%, compared to -3.9% in 2008, with
gross financial assets amounting to EUR 46.8
trillion at the end of 2018. Due to population
growth the decrease in gross financial assets
per capita was slightly stronger, with the av-
erage amount falling by 1.7% to EUR 13,898.
However, the development of net financial as-
sets rings the alarm. Despite a slight slowdown
in loan growth from a maximum of 12.0% in
2016 to 11.0% last year, liability growth out-
paced asset growth for the third year in a row.
Thus, pushing net financial asset growth to
-4.6%, which is not too far away from 2008’s
-6.0%. Net financial assets per capita amount-
ed to EUR 10,288; as a result, by end of last
year Asia’s private households were in fact
“poorer” than in 2016, when average net
wealth per capita had summed up to EUR
10,594.
Asia‘s private households‘ financial assets declined for the first time since 2008Total financial assets (in 2018 EUR bn) Growth rates (y/y, in %)
Sources: National central banks, financial supervisory authorities, statistical offices,
insurance and asset management associations, stock exchanges, WFE, Eikon, Allianz Research.
50,000
40,000
30,000
20,000
10,000
0
20
10
0
-10
2000
2002
2004
2006
2008
2010
2012
2014
2016
2018
LoansNet Financial AssetsGross Financial Assets
2000
2002
2004
2006
2008
2010
2012
2014
2016
2018
6 The analysis covers private households and non-profit organizations serving households in China, India, Indonesia, Israel, Japan, Malaysia, Singapore, South Korea, Taiwan and Thailand.
ALLIANZ GLOBAL WEALTH REPORT 2019 – REGIONAL DIFFERENCES: ASIA 101
Economic Research
Japan, usually pushing down the region’s av-
erage growth rates due to the rather subdued
development of its private households’ finan-
cial assets, was this time the stabilizing factor,
at least with respect to the development of
net financial assets. Taking into account only
net financial assets of the private households
in the remaining nine countries, the decline in
2018 was 6.0% and thus even stronger than in
2008, when net assets had dropped by 3.7%.
The same holds true for net assets per capi-
ta: without Japan the average net wealth per
capita amounted to a mere EUR 6,908 by the
end of 2018, which was not only 6.7% lower
than in the previous year, but also less than the
amount of EUR 7,267 in 2016. For comparison:
in 2008, net financial assets per capita had
“only” declined by 4.7%. One reason for this
development is the high demand for loans,
resulting in a 13.8% plus in 2018 compared to
8.9% in 2008. Another reason is the ongoing
weight shift between Japan and China.
China’s private house-holds hold 45% of Asia’s gross financial assets
The distribution of private households’ fi-
nancial assets in Asia is dominated by the
two heavyweights China and Japan, with a
combined 77% of total financial assets. The
situation was the same in 2008, though with
reversed roles: since then, China’s private
households’ share of Asia’s gross financial as-
sets has increased from 21% to 45%, while that
of Japan’s households’ declined from 58% to
32%. Therefore, developments in China are
decisive for the region as a whole. In the last
years, gross asset growth in China usually out-
paced growth in the other countries, pushing
up the region’s average while Japan was the
brake pad. However, in 2018, both countries
blurred the picture: gross financial assets of
China’s private households declined by 3.4%
and those of Japan’s by 1.2%, thus dragging
the whole region into the red, as the total 4.5%
growth in the other countries – which was also
rather disappointing after 9.0% in 2017 – could
not make up for the two heavyweights’ loss-
es. Growth champion was India with a plus
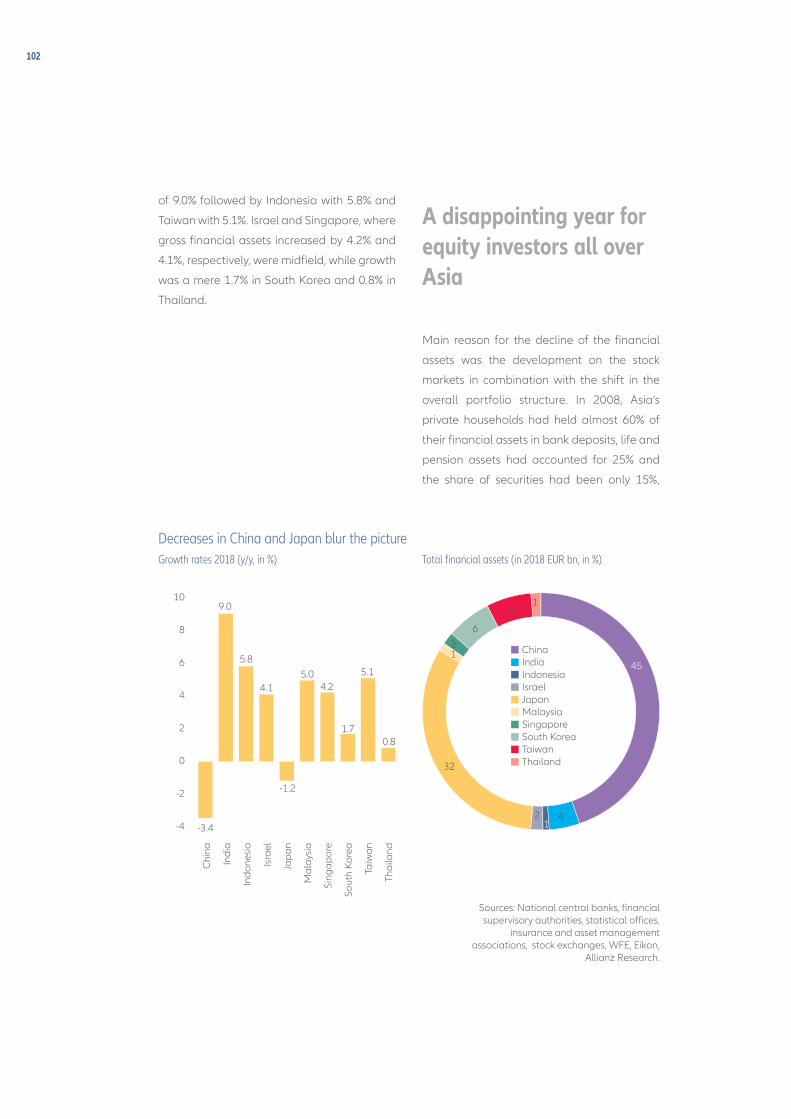
102
of 9.0% followed by Indonesia with 5.8% and
Taiwan with 5.1%. Israel and Singapore, where
gross financial assets increased by 4.2% and
4.1%, respectively, were midfield, while growth
was a mere 1.7% in South Korea and 0.8% in
Thailand.
A disappointing year for equity investors all over Asia
Main reason for the decline of the financial
assets was the development on the stock
markets in combination with the shift in the
overall portfolio structure. In 2008, Asia’s
private households had held almost 60% of
their financial assets in bank deposits, life and
pension assets had accounted for 25% and
the share of securities had been only 15%,
10
8
6
4
2
0
-2
-4
Chi
na
Indi
a
Indo
nesi
a
Isra
el
Jap
an
Mal
aysi
a
Sing
apor
e
Sout
h Ko
rea
Taiw
an
Thai
land
Decreases in China and Japan blur the pictureGrowth rates 2018 (y/y, in %) Total financial assets (in 2018 EUR bn, in %)
Sources: National central banks, financial supervisory authorities, statistical offices,
insurance and asset management associations, stock exchanges, WFE, Eikon,
Allianz Research.
32
4512
6
6
-3.4
9.0
5.8
4.1
-1.2
5.04.2
1.7
5.1
0.8
1
21
4
ChinaIndiaIndonesiaIsraelJapanMalaysiaSingaporeSouth KoreaTaiwanThailand
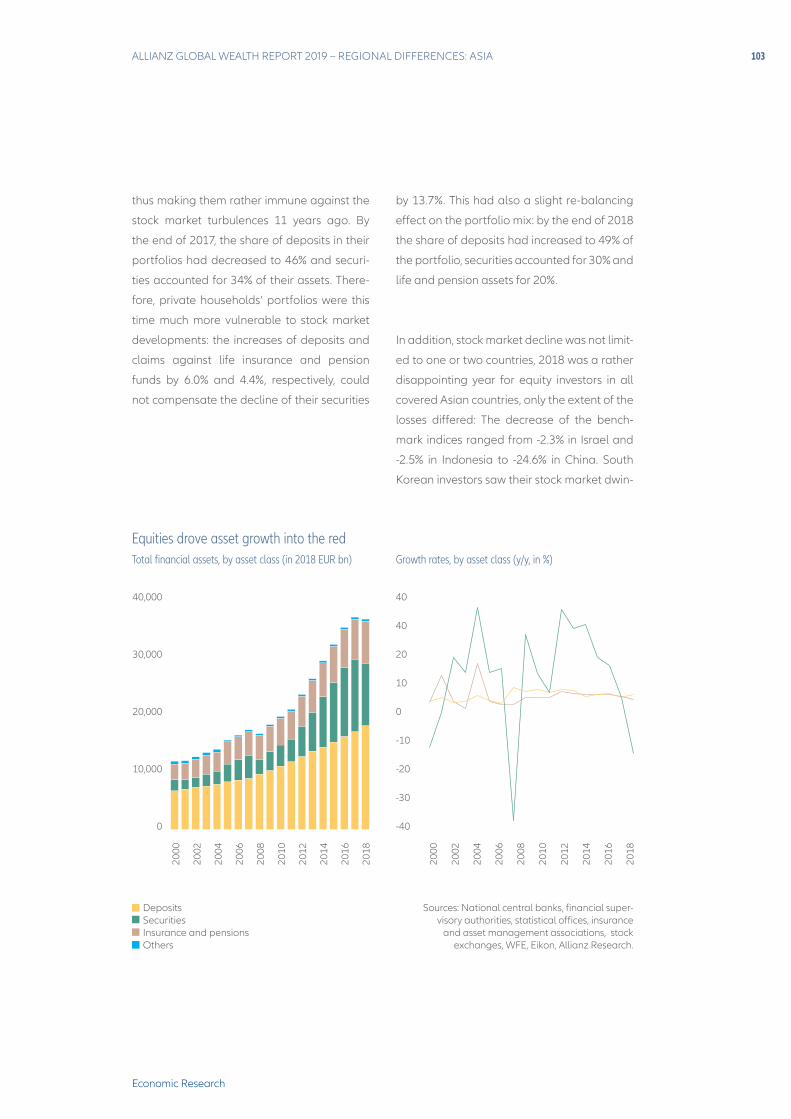
ALLIANZ GLOBAL WEALTH REPORT 2019 – REGIONAL DIFFERENCES: ASIA 103
Economic Research
thus making them rather immune against the
stock market turbulences 11 years ago. By
the end of 2017, the share of deposits in their
portfolios had decreased to 46% and securi-
ties accounted for 34% of their assets. There-
fore, private households’ portfolios were this
time much more vulnerable to stock market
developments: the increases of deposits and
claims against life insurance and pension
funds by 6.0% and 4.4%, respectively, could
not compensate the decline of their securities
by 13.7%. This had also a slight re-balancing
effect on the portfolio mix: by the end of 2018
the share of deposits had increased to 49% of
the portfolio, securities accounted for 30% and
life and pension assets for 20%.
In addition, stock market decline was not limit-
ed to one or two countries, 2018 was a rather
disappointing year for equity investors in all
covered Asian countries, only the extent of the
losses differed: The decrease of the bench-
mark indices ranged from -2.3% in Israel and
-2.5% in Indonesia to -24.6% in China. South
Korean investors saw their stock market dwin-
Equities drove asset growth into the redTotal financial assets, by asset class (in 2018 EUR bn) Growth rates, by asset class (y/y, in %)
Sources: National central banks, financial super-visory authorities, statistical offices, insurance
and asset management associations, stock exchanges, WFE, Eikon, Allianz Research.
40,000
30,000
20,000
10,000
0
40
40
20
10
0
-10
-20
-30
-40
2000
2002
2004
2006
2008
2010
2012
2014
2016
2018
Deposits Securities Insurance and pensions Others
2000
2002
2004
2006
2008
2010
2012
2014
2016
2018
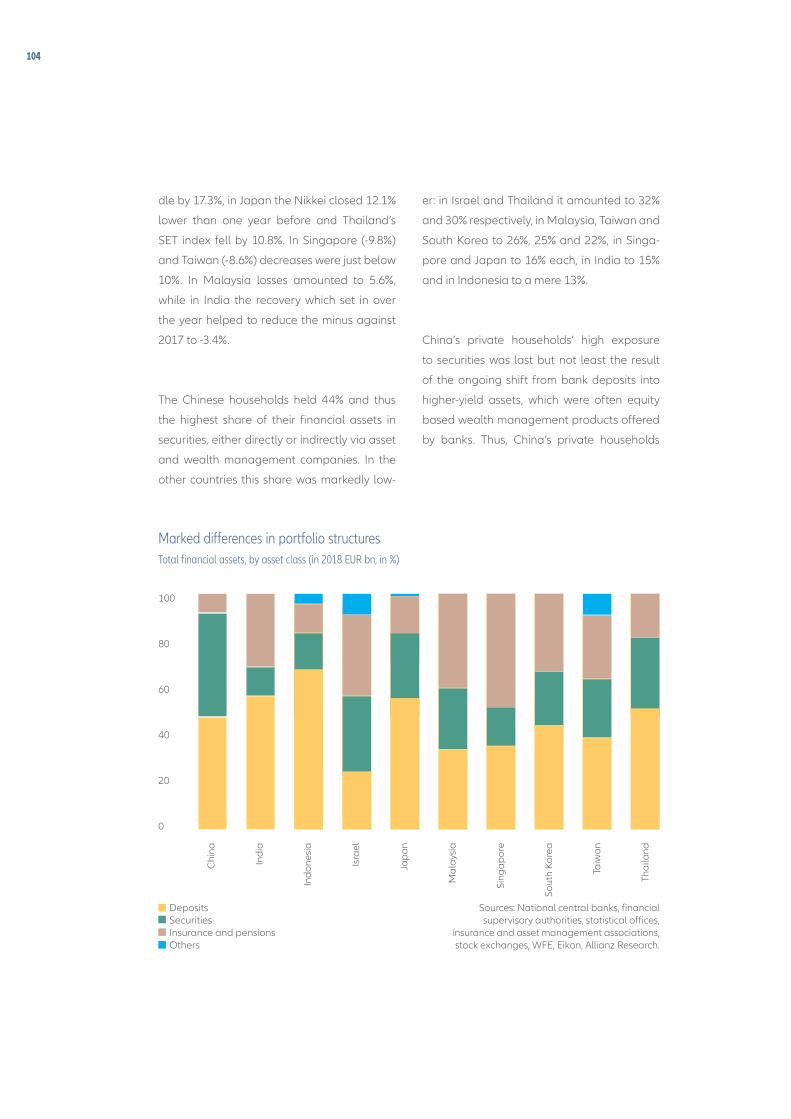
104
dle by 17.3%, in Japan the Nikkei closed 12.1%
lower than one year before and Thailand’s
SET index fell by 10.8%. In Singapore (-9.8%)
and Taiwan (-8.6%) decreases were just below
10%. In Malaysia losses amounted to 5.6%,
while in India the recovery which set in over
the year helped to reduce the minus against
2017 to -3.4%.
The Chinese households held 44% and thus
the highest share of their financial assets in
securities, either directly or indirectly via asset
and wealth management companies. In the
other countries this share was markedly low-
er: in Israel and Thailand it amounted to 32%
and 30% respectively, in Malaysia, Taiwan and
South Korea to 26%, 25% and 22%, in Singa-
pore and Japan to 16% each, in India to 15%
and in Indonesia to a mere 13%.
China’s private households’ high exposure
to securities was last but not least the result
of the ongoing shift from bank deposits into
higher-yield assets, which were often equity
based wealth management products offered
by banks. Thus, China’s private households
Marked differences in portfolio structuresTotal financial assets, by asset class (in 2018 EUR bn, in %)
Sources: National central banks, financial supervisory authorities, statistical offices,
insurance and asset management associations, stock exchanges, WFE, Eikon, Allianz Research.
Chi
na
Indi
a
Indo
nesi
a
Isra
el
Jap
an
Mal
aysi
a
Sing
apor
e
Sout
h Ko
rea
Taiw
an
Thai
land
100
80
60
40
20
0
Deposits Securities Insurance and pensions Others
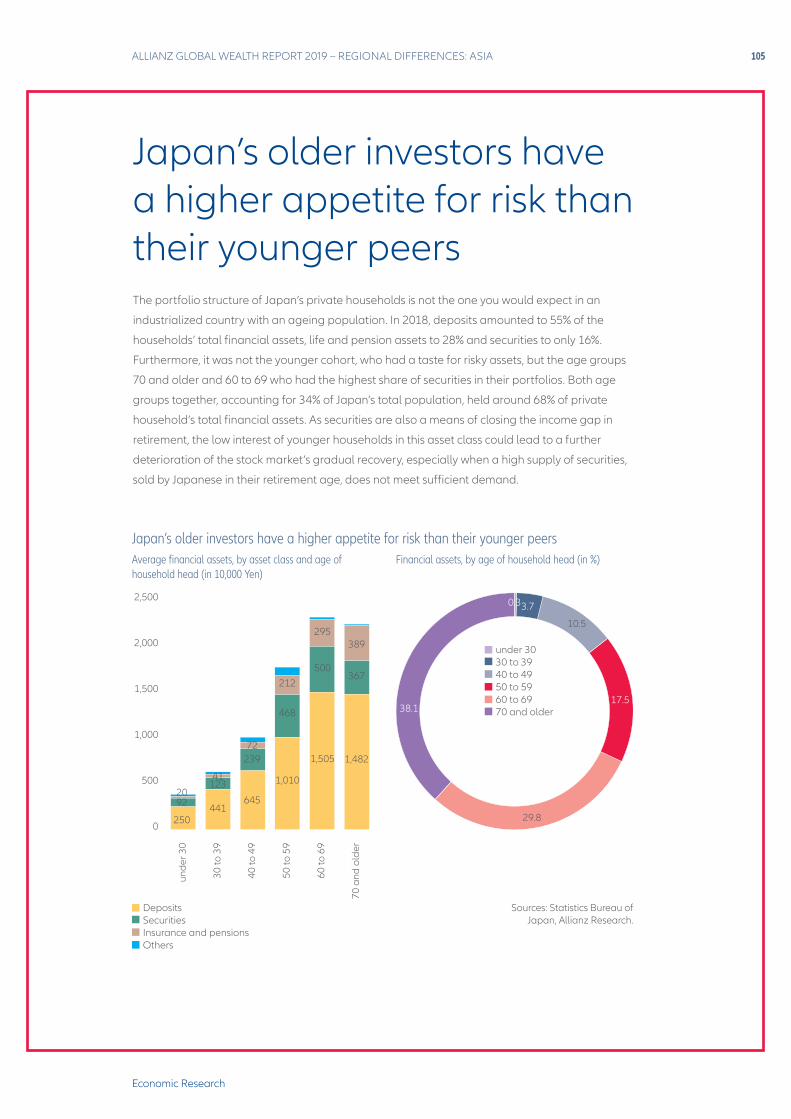
ALLIANZ GLOBAL WEALTH REPORT 2019 – REGIONAL DIFFERENCES: ASIA 105
Economic Research
Japan’s older investors have a higher appetite for risk than their younger peers The portfolio structure of Japan’s private households is not the one you would expect in an
industrialized country with an ageing population. In 2018, deposits amounted to 55% of the
households’ total financial assets, life and pension assets to 28% and securities to only 16%.
Furthermore, it was not the younger cohort, who had a taste for risky assets, but the age groups
70 and older and 60 to 69 who had the highest share of securities in their portfolios. Both age
groups together, accounting for 34% of Japan’s total population, held around 68% of private
household’s total financial assets. As securities are also a means of closing the income gap in
retirement, the low interest of younger households in this asset class could lead to a further
deterioration of the stock market’s gradual recovery, especially when a high supply of securities,
sold by Japanese in their retirement age, does not meet sufficient demand.
Japan’s older investors have a higher appetite for risk than their younger peersAverage financial assets, by asset class and age of household head (in 10,000 Yen)
Financial assets, by age of household head (in %)
Sources: Statistics Bureau of Japan, Allianz Research.
10.5
17.538.1
0.33.7
29.8
under 3030 to 3940 to 4950 to 5960 to 69 70 and older
2,500
2,000
1,500
1,000
500
0
unde
r 30
30 to
39
40 to
49
50 to
59
60 to
69
70 a
nd o
lder
Deposits Securities Insurance and pensions Others
1,482
367
389
1,505
500
295
1,010
468
212
645
23972
441
12341
250
9220
106
were hit by a double impact last year: both the
downturn of the stock market and regulatory
measures to strengthen financial stability, es-
pecially aiming at the asset and wealth man-
agement industry. Furthermore, regulatory
changes in the life insurance sector led to a
slowdown in the growth of private households’
life insurance entitlements. Thus, the positive
development in the other asset classes, espe-
cially the strongest increase in bank deposits
within the last five years of 10.5%, could not
fully compensate the losses in securities.
In Japan, a rather subdued growth in depos-
its of a mere 1.6% and a, with a plus of 0.1%,
practically stagnating life and pension fund
assets class could also not make up for the
losses of 12.3% in shares and other equities,
although securities were the smallest asset
class accounting for only 16% of Japan’s pri-
vate households’ total financial assets, while
deposits amounted to 55%. In this respect,
Japan is kind of an anomaly, as in an industri-
alized country like Japan one would expect a
lower share of deposits and a more balanced
portfolio structure reflecting the development
stage of the financial system. However, due to
the subdued development of the stock market
– the Nikkei picked up only in recent years and
reached at the end of 2017 for the first time
a value close to the one in 1991 – and some
distortions on the life insurance market, bank
deposits developed into the asset class of first
choice for the Japanese households.
Higher shares of deposits in the overall portfo-
lio than in Japan were only reported in India,
with 56% and Indonesia with 68%. However, at
the end of 2018, bank deposits had also the
highest share in the average portfolio of the
private households in Thailand (51%), China
(48%, but only due to the slump at the capital
market), South Korea (44%) and Taiwan (39%).
In Singapore and Malaysia life insurance and
pension assets was the dominating asset class
with a share of 48% and 40%, respectively,
reflecting the ageing of the population, espe-
cially in Singapore, and thus the need of pri-
vate old-age provision.
Looking at the liability side, China dominat-
ed also the picture. In 2018, it recorded the
highest growth rate of all countries in the re-
gion, with a plus of 18.2%. Thus, the share of
China’s households in the region’s total loans
increased further, amounting to 50% by the
end of last year. In contrast, Japan’ share de-
creased further to 23% due to a loan increase
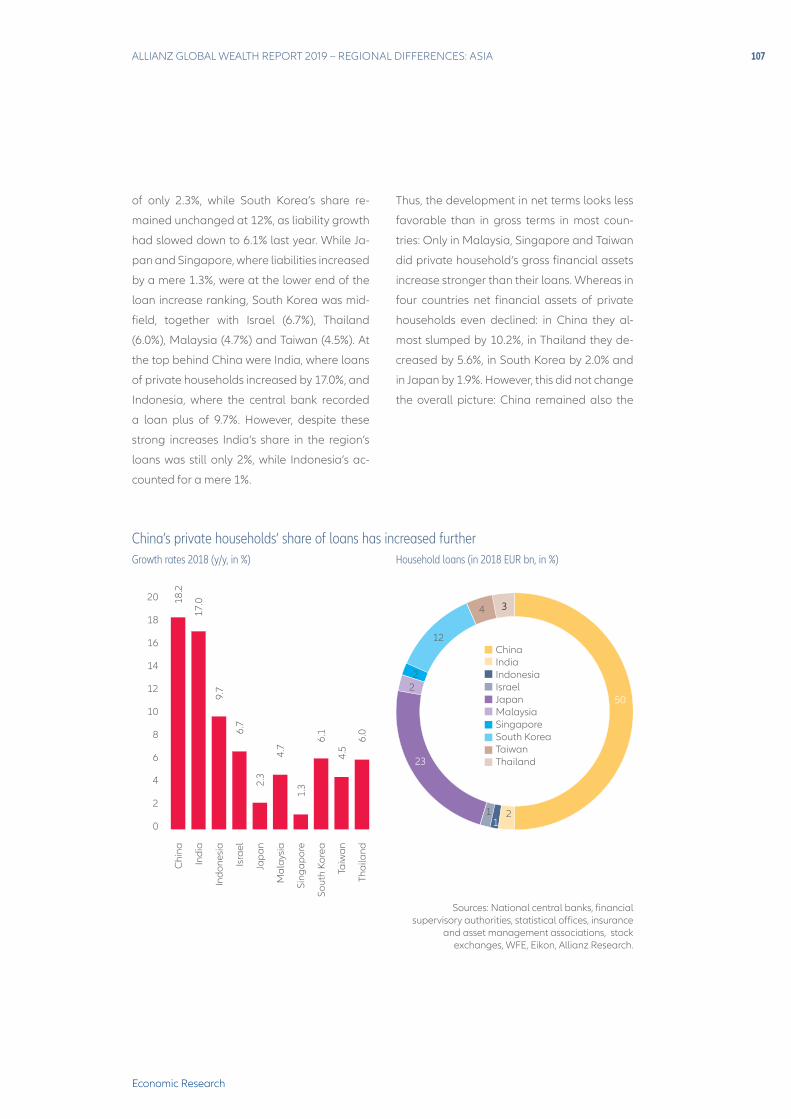
ALLIANZ GLOBAL WEALTH REPORT 2019 – REGIONAL DIFFERENCES: ASIA 107
Economic Research
of only 2.3%, while South Korea’s share re-
mained unchanged at 12%, as liability growth
had slowed down to 6.1% last year. While Ja-
pan and Singapore, where liabilities increased
by a mere 1.3%, were at the lower end of the
loan increase ranking, South Korea was mid-
field, together with Israel (6.7%), Thailand
(6.0%), Malaysia (4.7%) and Taiwan (4.5%). At
the top behind China were India, where loans
of private households increased by 17.0%, and
Indonesia, where the central bank recorded
a loan plus of 9.7%. However, despite these
strong increases India’s share in the region’s
loans was still only 2%, while Indonesia’s ac-
counted for a mere 1%.
Thus, the development in net terms looks less
favorable than in gross terms in most coun-
tries: Only in Malaysia, Singapore and Taiwan
did private household’s gross financial assets
increase stronger than their loans. Whereas in
four countries net financial assets of private
households even declined: in China they al-
most slumped by 10.2%, in Thailand they de-
creased by 5.6%, in South Korea by 2.0% and
in Japan by 1.9%. However, this did not change
the overall picture: China remained also the
China’s private households’ share of loans has increased furtherGrowth rates 2018 (y/y, in %) Household loans (in 2018 EUR bn, in %)
Sources: National central banks, financial supervisory authorities, statistical offices, insurance
and asset management associations, stock exchanges, WFE, Eikon, Allianz Research.
50
23
3
21
1
22
12
4
ChinaIndiaIndonesiaIsraelJapanMalaysiaSingaporeSouth KoreaTaiwanThailand
20
18
16
14
12
10
8
6
4
2
0
Chi
na
Indi
a
Indo
nesi
a
Isra
el
Jap
an
Mal
aysi
a
Sing
apor
e
Sout
h Ko
rea
Taiw
an
Thai
land
17.018
.2
9.7
6.7
2.3
4.7
1.3
6.1
4.5
6.0
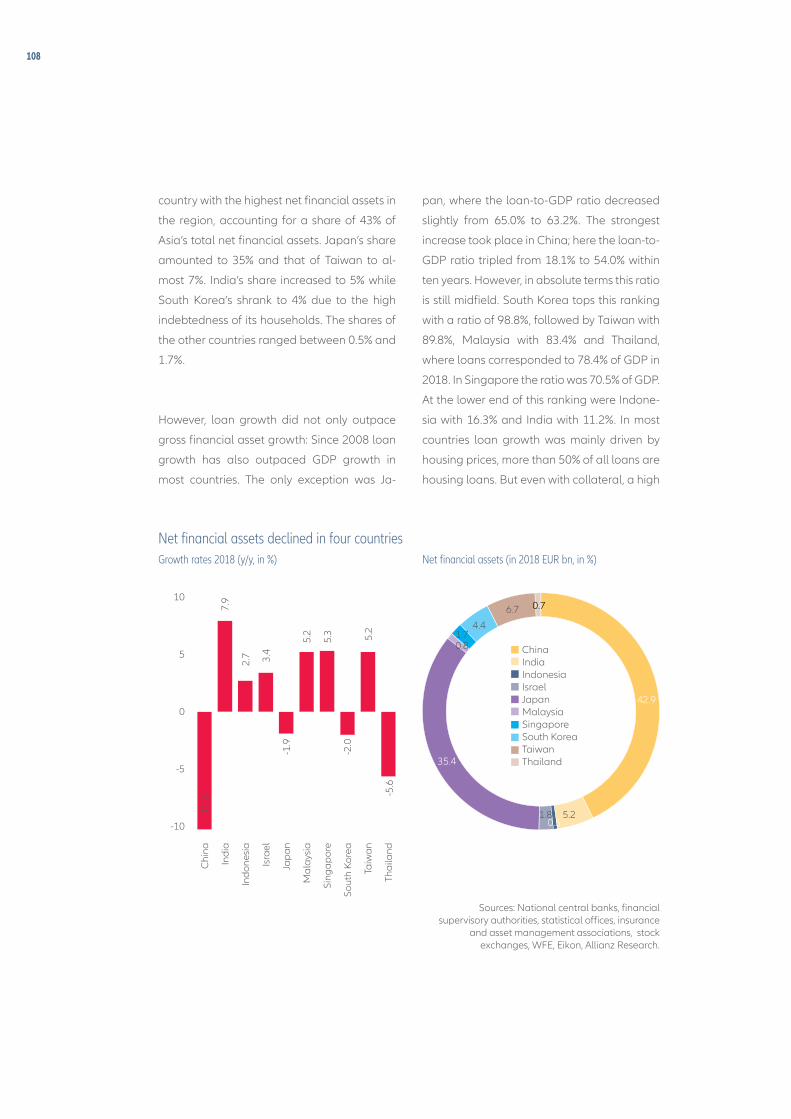
108
country with the highest net financial assets in
the region, accounting for a share of 43% of
Asia’s total net financial assets. Japan’s share
amounted to 35% and that of Taiwan to al-
most 7%. India’s share increased to 5% while
South Korea’s shrank to 4% due to the high
indebtedness of its households. The shares of
the other countries ranged between 0.5% and
1.7%.
However, loan growth did not only outpace
gross financial asset growth: Since 2008 loan
growth has also outpaced GDP growth in
most countries. The only exception was Ja-
pan, where the loan-to-GDP ratio decreased
slightly from 65.0% to 63.2%. The strongest
increase took place in China; here the loan-to-
GDP ratio tripled from 18.1% to 54.0% within
ten years. However, in absolute terms this ratio
is still midfield. South Korea tops this ranking
with a ratio of 98.8%, followed by Taiwan with
89.8%, Malaysia with 83.4% and Thailand,
where loans corresponded to 78.4% of GDP in
2018. In Singapore the ratio was 70.5% of GDP.
At the lower end of this ranking were Indone-
sia with 16.3% and India with 11.2%. In most
countries loan growth was mainly driven by
housing prices, more than 50% of all loans are
housing loans. But even with collateral, a high
Net financial assets declined in four countriesGrowth rates 2018 (y/y, in %) Net financial assets (in 2018 EUR bn, in %)
Sources: National central banks, financial supervisory authorities, statistical offices, insurance
and asset management associations, stock exchanges, WFE, Eikon, Allianz Research.
42.9
35.4
0.7
5.20.5
1.8
0.81.7
4.4
6.7
ChinaIndiaIndonesiaIsraelJapanMalaysiaSingaporeSouth KoreaTaiwanThailand
10
5
0
-5
-10
Chi
na
Indi
a
Indo
nesi
a
Isra
el
Jap
an
Mal
aysi
a
Sing
apor
e
Sout
h Ko
rea
Taiw
an
Thai
land
7.9
-10.
2
2.7 3.4
-1.9
5.2
5.3
-2.0
5.2
-5.6
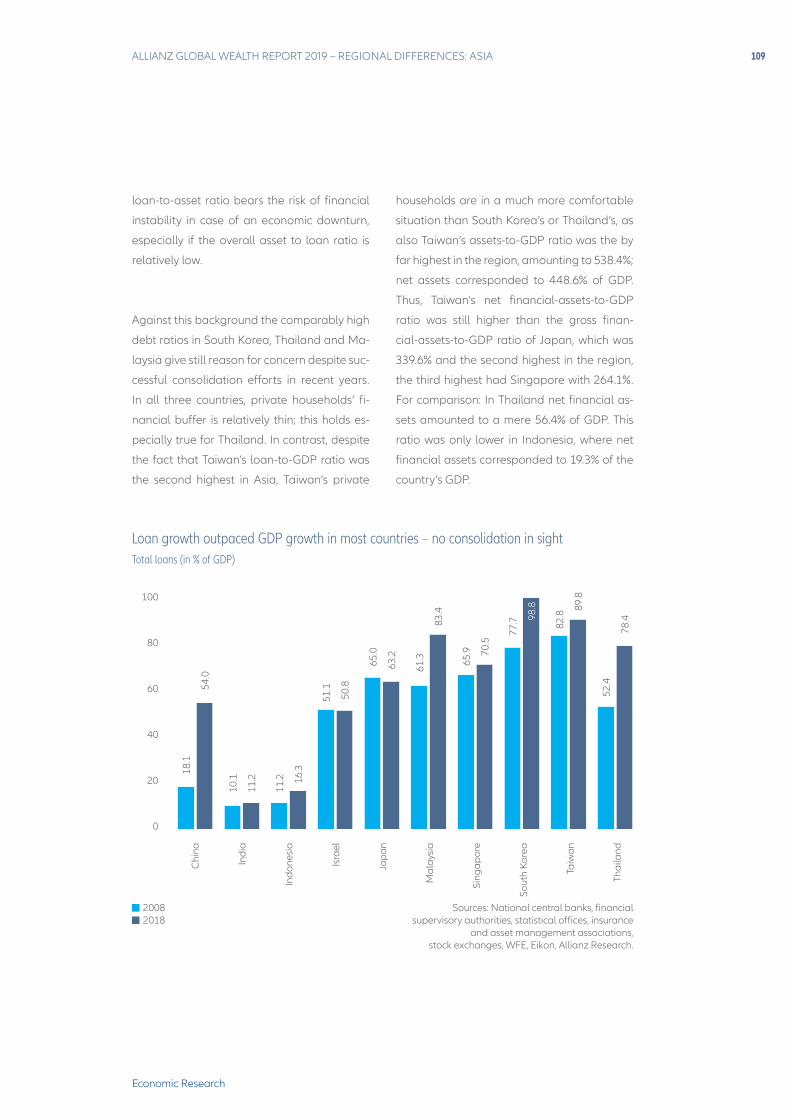
ALLIANZ GLOBAL WEALTH REPORT 2019 – REGIONAL DIFFERENCES: ASIA 109
Economic Research
loan-to-asset ratio bears the risk of financial
instability in case of an economic downturn,
especially if the overall asset to loan ratio is
relatively low.
Against this background the comparably high
debt ratios in South Korea, Thailand and Ma-
laysia give still reason for concern despite suc-
cessful consolidation efforts in recent years.
In all three countries, private households’ fi-
nancial buffer is relatively thin; this holds es-
pecially true for Thailand. In contrast, despite
the fact that Taiwan’s loan-to-GDP ratio was
the second highest in Asia, Taiwan‘s private
households are in a much more comfortable
situation than South Korea’s or Thailand’s, as
also Taiwan’s assets-to-GDP ratio was the by
far highest in the region, amounting to 538.4%;
net assets corresponded to 448.6% of GDP.
Thus, Taiwan‘s net financial-assets-to-GDP
ratio was still higher than the gross finan-
cial-assets-to-GDP ratio of Japan, which was
339.6% and the second highest in the region,
the third highest had Singapore with 264.1%.
For comparison: In Thailand net financial as-
sets amounted to a mere 56.4% of GDP. This
ratio was only lower in Indonesia, where net
financial assets corresponded to 19.3% of the
country’s GDP.
Loan growth outpaced GDP growth in most countries – no consolidation in sightTotal loans (in % of GDP)
Sources: National central banks, financial supervisory authorities, statistical offices, insurance
and asset management associations, stock exchanges, WFE, Eikon, Allianz Research.
100
80
60
40
20
0
Chi
na
Indi
a
Indo
nesi
a
Isra
el
Jap
an
Mal
aysi
a
Sing
apor
e
Sout
h Ko
rea
Taiw
an
Thai
land
18.1
54.0
10.1
11.2
11.2 16
.3
63.2
61.3
83.4
65.9 70
.5
77.7 98
.8
82.8
89.8
52.4
78.4
51.1
50.8
65.0
20082018
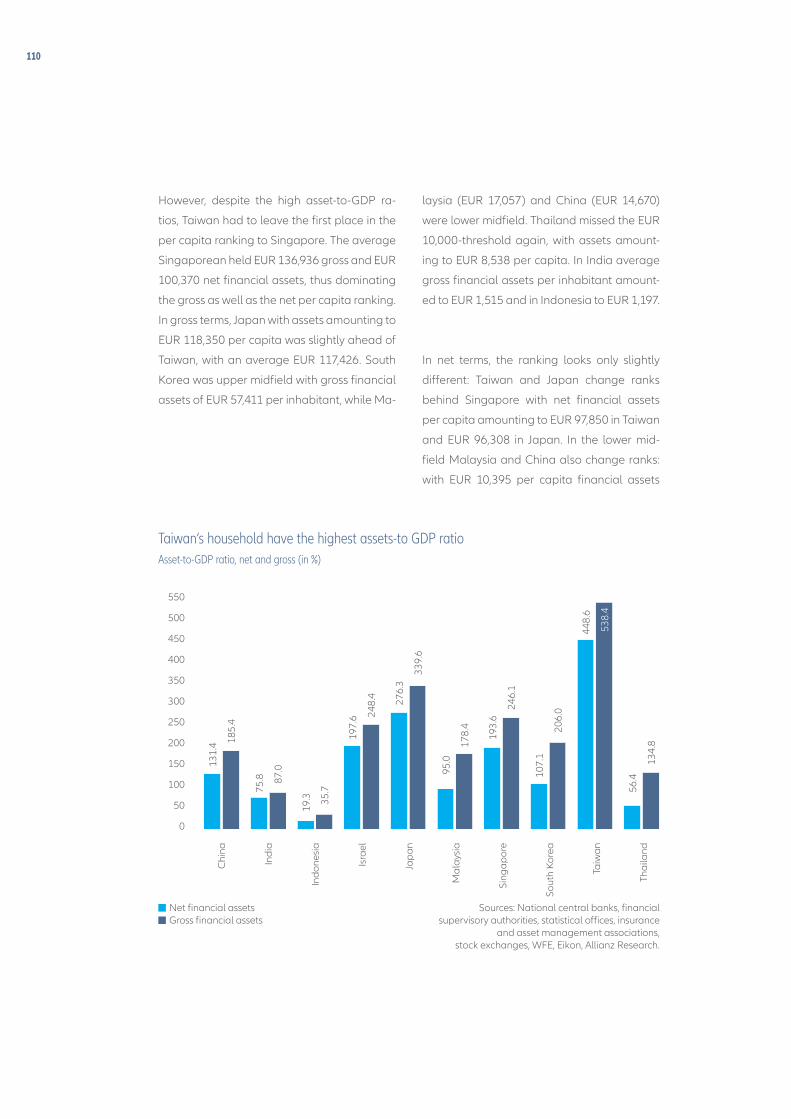
110
However, despite the high asset-to-GDP ra-
tios, Taiwan had to leave the first place in the
per capita ranking to Singapore. The average
Singaporean held EUR 136,936 gross and EUR
100,370 net financial assets, thus dominating
the gross as well as the net per capita ranking.
In gross terms, Japan with assets amounting to
EUR 118,350 per capita was slightly ahead of
Taiwan, with an average EUR 117,426. South
Korea was upper midfield with gross financial
assets of EUR 57,411 per inhabitant, while Ma-
laysia (EUR 17,057) and China (EUR 14,670)
were lower midfield. Thailand missed the EUR
10,000-threshold again, with assets amount-
ing to EUR 8,538 per capita. In India average
gross financial assets per inhabitant amount-
ed to EUR 1,515 and in Indonesia to EUR 1,197.
In net terms, the ranking looks only slightly
different: Taiwan and Japan change ranks
behind Singapore with net financial assets
per capita amounting to EUR 97,850 in Taiwan
and EUR 96,308 in Japan. In the lower mid-
field Malaysia and China also change ranks:
with EUR 10,395 per capita financial assets
Net financial assetsGross financial assets
Taiwan‘s household have the highest assets-to GDP ratioAsset-to-GDP ratio, net and gross (in %)
Sources: National central banks, financial supervisory authorities, statistical offices, insurance
and asset management associations, stock exchanges, WFE, Eikon, Allianz Research.
550
500
450
400
350
300
250
200
150
100
50
0
Chi
na
Indi
a
Indo
nesi
a
Isra
el
Jap
an
Mal
aysi
a
Sing
apor
e
Sout
h Ko
rea
Taiw
an
Thai
land
131.
4 185.
4
75.8 87
.0
19.3 35
.7
339.
6
95.0
178.
4
193.
6
246.
1
107.
1
206.
0
448.
6
538.
4
56.4
134.
8
197.
6 248.
4
276.
3
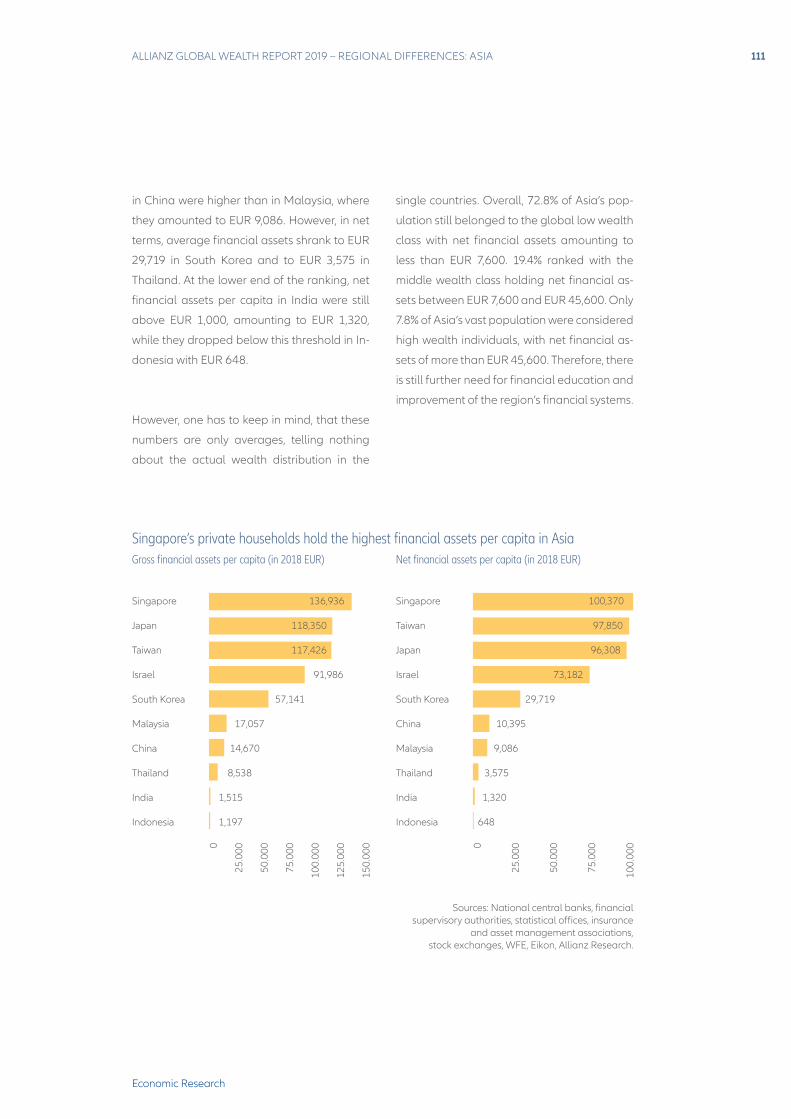
ALLIANZ GLOBAL WEALTH REPORT 2019 – REGIONAL DIFFERENCES: ASIA 111
Economic Research
in China were higher than in Malaysia, where
they amounted to EUR 9,086. However, in net
terms, average financial assets shrank to EUR
29,719 in South Korea and to EUR 3,575 in
Thailand. At the lower end of the ranking, net
financial assets per capita in India were still
above EUR 1,000, amounting to EUR 1,320,
while they dropped below this threshold in In-
donesia with EUR 648.
However, one has to keep in mind, that these
numbers are only averages, telling nothing
about the actual wealth distribution in the
single countries. Overall, 72.8% of Asia’s pop-
ulation still belonged to the global low wealth
class with net financial assets amounting to
less than EUR 7,600. 19.4% ranked with the
middle wealth class holding net financial as-
sets between EUR 7,600 and EUR 45,600. Only
7.8% of Asia’s vast population were considered
high wealth individuals, with net financial as-
sets of more than EUR 45,600. Therefore, there
is still further need for financial education and
improvement of the region’s financial systems.
Singapore’s private households hold the highest financial assets per capita in AsiaGross financial assets per capita (in 2018 EUR) Net financial assets per capita (in 2018 EUR)
0
25.0
00
50.0
00
75.0
00
100.
000
125.
000
150.
000 0
25.0
00
50.0
00
75.0
00
100.
000
Sources: National central banks, financial supervisory authorities, statistical offices, insurance
and asset management associations, stock exchanges, WFE, Eikon, Allianz Research.
Singapore
Japan
Taiwan
Israel
South Korea
Malaysia
China
Thailand
India
Indonesia
Singapore
Taiwan
Japan
Israel
South Korea
China
Malaysia
Thailand
India
Indonesia
136,936
118,350
117,426
91,986
57,141
17,057
14,670
8,538
1,515
1,197
100,370
97,850
96,308
73,182
29,719
10,395
9,086
3,575
1,320
648

112
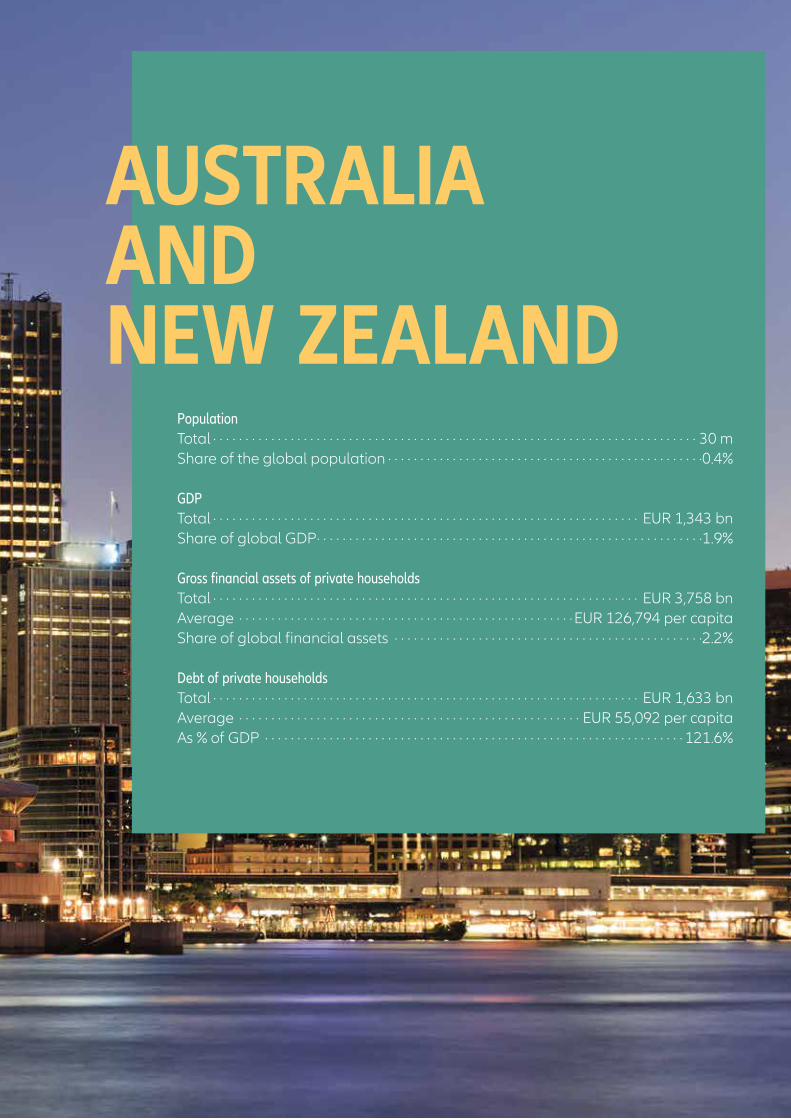
ALLIANZ GLOBAL WEALTH REPORT 2019 – REGIONAL DIFFERENCES: AUSTRALIA AND NEW ZEALAND 113
Economic Research
AUSTRALIA AND NEW ZEALAND
Population Total · · · · · · · · · · · · · · · · · · · · · · · · · · · · · · · · · · · · · · · · · · · · · · · · · · · · · · · · · · · · · · · · · · · · · · · · · · · 30 m Share of the global population · · · · · · · · · · · · · · · · · · · · · · · · · · · · · · · · · · · · · · · · · · · · · · · · ·0.4% GDP Total · · · · · · · · · · · · · · · · · · · · · · · · · · · · · · · · · · · · · · · · · · · · · · · · · · · · · · · · · · · · · · · · · · EUR 1,343 bnShare of global GDP· · · · · · · · · · · · · · · · · · · · · · · · · · · · · · · · · · · · · · · · · · · · · · · · · · · · · · · · · · · ·1.9% Gross financial assets of private householdsTotal · · · · · · · · · · · · · · · · · · · · · · · · · · · · · · · · · · · · · · · · · · · · · · · · · · · · · · · · · · · · · · · · · · EUR 3,758 bnAverage · · · · · · · · · · · · · · · · · · · · · · · · · · · · · · · · · · · · · · · · · · · · · · · · · · · ·EUR 126,794 per capitaShare of global financial assets · · · · · · · · · · · · · · · · · · · · · · · · · · · · · · · · · · · · · · · · · · · · · · · ·2.2% Debt of private households Total · · · · · · · · · · · · · · · · · · · · · · · · · · · · · · · · · · · · · · · · · · · · · · · · · · · · · · · · · · · · · · · · · · EUR 1,633 bnAverage · · · · · · · · · · · · · · · · · · · · · · · · · · · · · · · · · · · · · · · · · · · · · · · · · · · · · EUR 55,092 per capitaAs % of GDP · · · · · · · · · · · · · · · · · · · · · · · · · · · · · · · · · · · · · · · · · · · · · · · · · · · · · · · · · · · · · · · · · 121.6%
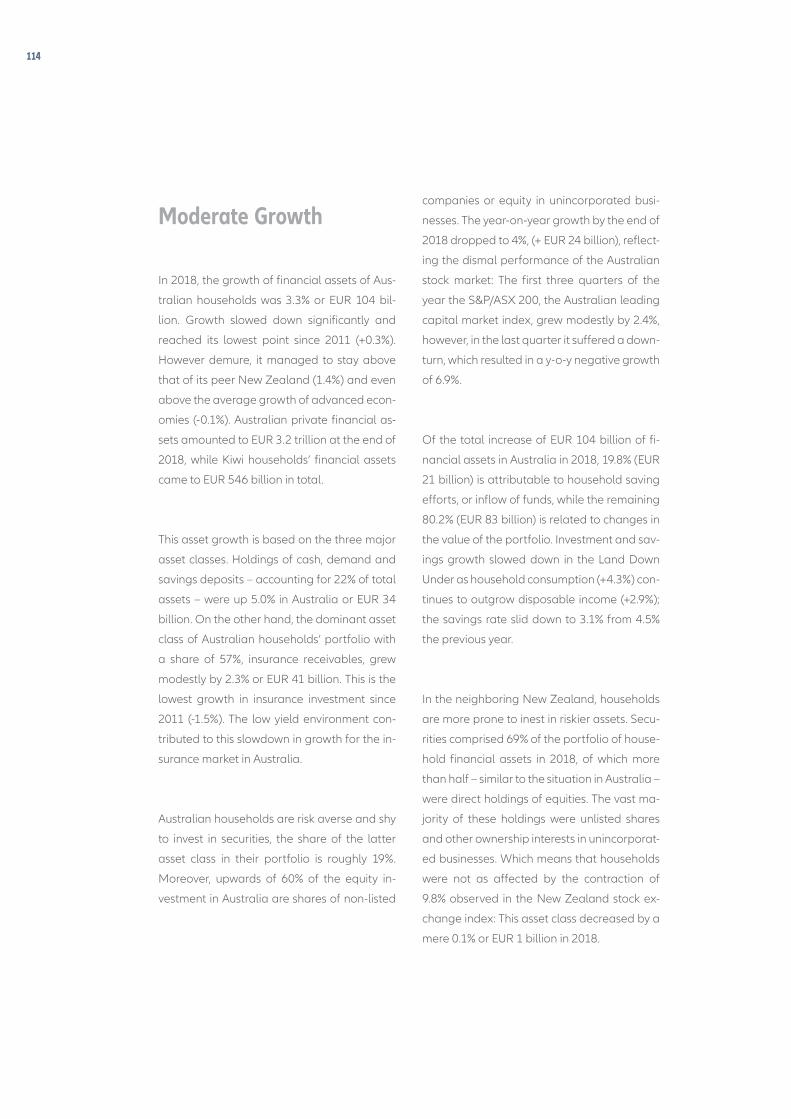
114
Moderate Growth
In 2018, the growth of financial assets of Aus-
tralian households was 3.3% or EUR 104 bil-
lion. Growth slowed down significantly and
reached its lowest point since 2011 (+0.3%).
However demure, it managed to stay above
that of its peer New Zealand (1.4%) and even
above the average growth of advanced econ-
omies (-0.1%). Australian private financial as-
sets amounted to EUR 3.2 trillion at the end of
2018, while Kiwi households’ financial assets
came to EUR 546 billion in total.
This asset growth is based on the three major
asset classes. Holdings of cash, demand and
savings deposits – accounting for 22% of total
assets – were up 5.0% in Australia or EUR 34
billion. On the other hand, the dominant asset
class of Australian households’ portfolio with
a share of 57%, insurance receivables, grew
modestly by 2.3% or EUR 41 billion. This is the
lowest growth in insurance investment since
2011 (-1.5%). The low yield environment con-
tributed to this slowdown in growth for the in-
surance market in Australia.
Australian households are risk averse and shy
to invest in securities, the share of the latter
asset class in their portfolio is roughly 19%.
Moreover, upwards of 60% of the equity in-
vestment in Australia are shares of non-listed
companies or equity in unincorporated busi-
nesses. The year-on-year growth by the end of
2018 dropped to 4%, (+ EUR 24 billion), reflect-
ing the dismal performance of the Australian
stock market: The first three quarters of the
year the S&P/ASX 200, the Australian leading
capital market index, grew modestly by 2.4%,
however, in the last quarter it suffered a down-
turn, which resulted in a y-o-y negative growth
of 6.9%.
Of the total increase of EUR 104 billion of fi-
nancial assets in Australia in 2018, 19.8% (EUR
21 billion) is attributable to household saving
efforts, or inflow of funds, while the remaining
80.2% (EUR 83 billion) is related to changes in
the value of the portfolio. Investment and sav-
ings growth slowed down in the Land Down
Under as household consumption (+4.3%) con-
tinues to outgrow disposable income (+2.9%);
the savings rate slid down to 3.1% from 4.5%
the previous year.
In the neighboring New Zealand, households
are more prone to inest in riskier assets. Secu-
rities comprised 69% of the portfolio of house-
hold financial assets in 2018, of which more
than half – similar to the situation in Australia –
were direct holdings of equities. The vast ma-
jority of these holdings were unlisted shares
and other ownership interests in unincorporat-
ed businesses. Which means that households
were not as affected by the contraction of
9.8% observed in the New Zealand stock ex-
change index: This asset class decreased by a
mere 0.1% or EUR 1 billion in 2018.
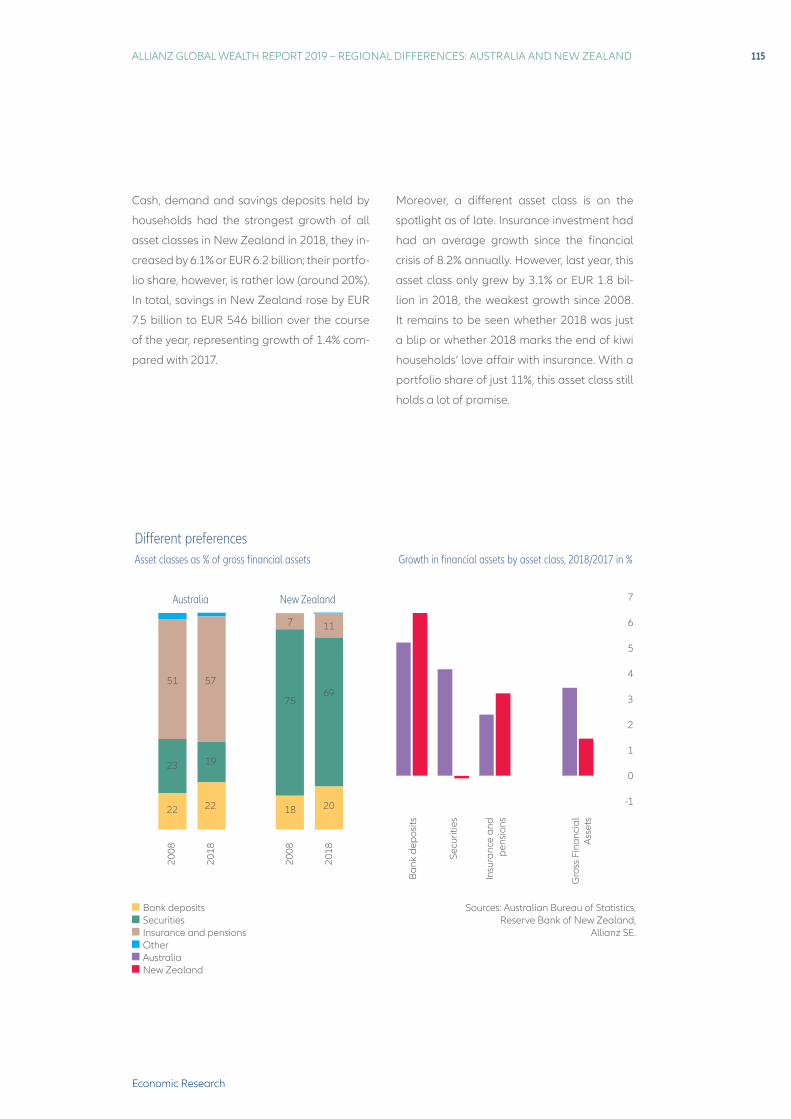
ALLIANZ GLOBAL WEALTH REPORT 2019 – REGIONAL DIFFERENCES: AUSTRALIA AND NEW ZEALAND 115
Economic Research
Cash, demand and savings deposits held by
households had the strongest growth of all
asset classes in New Zealand in 2018, they in-
creased by 6.1% or EUR 6.2 billion; their portfo-
lio share, however, is rather low (around 20%).
In total, savings in New Zealand rose by EUR
7.5 billion to EUR 546 billion over the course
of the year, representing growth of 1.4% com-
pared with 2017.
Moreover, a different asset class is on the
spotlight as of late. Insurance investment had
had an average growth since the financial
crisis of 8.2% annually. However, last year, this
asset class only grew by 3.1% or EUR 1.8 bil-
lion in 2018, the weakest growth since 2008.
It remains to be seen whether 2018 was just
a blip or whether 2018 marks the end of kiwi
households’ love affair with insurance. With a
portfolio share of just 11%, this asset class still
holds a lot of promise.
Different preferencesAsset classes as % of gross financial assets
Australia New Zealand
Growth in financial assets by asset class, 2018/2017 in %
Sources: Australian Bureau of Statistics, Reserve Bank of New Zealand,
Allianz SE.
Ban
k de
posi
ts
Secu
ritie
s
Insu
ranc
e an
d pe
nsio
ns
Gro
ss F
inan
cial
A
sset
s
2008
2018
2008
2018
51 57
19
22 18 20
6975
7 11
23
22
Bank depositsSecuritiesInsurance and pensionsOtherAustraliaNew Zealand
7
6
5
4
3
2
1
0
-1
116
Red alert for private debt
Total household liabilities stood at EUR 1.5 bil-
lion at the end of 2018 and represented 47%
of total financial assets held by households in
Australia. In the mid-2000s household debt
increased rapidly, much faster than, for exam-
ple, wages. As a consequence, the debt-to-in-
come ratio rocketed from 80% to 130% before
the financial crisis. After the crisis, however,
unemployment was high and income growth
was sluggish. Net saving rates started to pick
up in 2009 at 7.9% and reached their peak in
2011 at 9.3%. The debt-to-income ratio fell to
147%. Since then, however, the household net
saving rate has been on a landslide and as of
2018, it represented a meager 3.1%. Although
liability growth slowed down, too, from 6.4%
in 2017 to 4.2% in 2018, the debt-to-income
reached a new record at 164% at the end of
2018.
All in all, household debt has grown by an av-
erage of 5.8% per year or EUR 301 billion in
total over the last five years. Average liabilities
per capita came to EUR 60,361 in Australia at
the end of 2018, almost twice the average for
industrialized countries(EUR 32,087); world-
wide, only Switzerland, Denmark and Norway
exceed this figure. Not surprisingly, debt has
become a key issue for the regulators and the
central bank in Australia.
The credit boom in Australia was fueled in
particular by rapid growth in house prices in
the past few years. However, in 2018 it suf-
fered its longest downturn and housing pric-
es fell from 149.8 to 147.7 (2012 = 100). To try
to avoid an overheating, APRA, the banking
regulator in Australia, tightened the credit
conditions already back in 2014. However, the
low-yield environment overpowered this pol-
icy and Australia’s debt exposure continues
to be worrying. There is a latent deleveraging
risk for Australian households. It is a quicksand
scenario given the high debt dependence in
the region.
The ratio of interest payments to disposable
income increased slightly last year from an
average of 8.7% to 9.1%. The record high was
12.5% in 2008 at the height of the financial cri-
sis. Although the proportion of non-perform-
ing household loans has recently risen slightly,
it has remained at a relatively low level (NPL
ratio below 1%). This suggests that the over-
all quality of outstanding loans is high. None-
theless, the household sector is increasingly
vulnerable as income growth is subdued and
unemployment remains relatively high.
Debt management is the order of the day in
Oceania. The Reserve Bank of New Zealand
has foreseen the risks from domestic debt in
the current economic environment. Debt lev-
els in New Zealand are similarly worrying as
in the neighboring Australia. In 2018, the debt-
to-income ratio of households reached 139.
This is the highest level of indebtedness seen
in the country. Household liability growth ex-
perienced a slowdown after the financial cri-
sis. However the rising housing prices in New
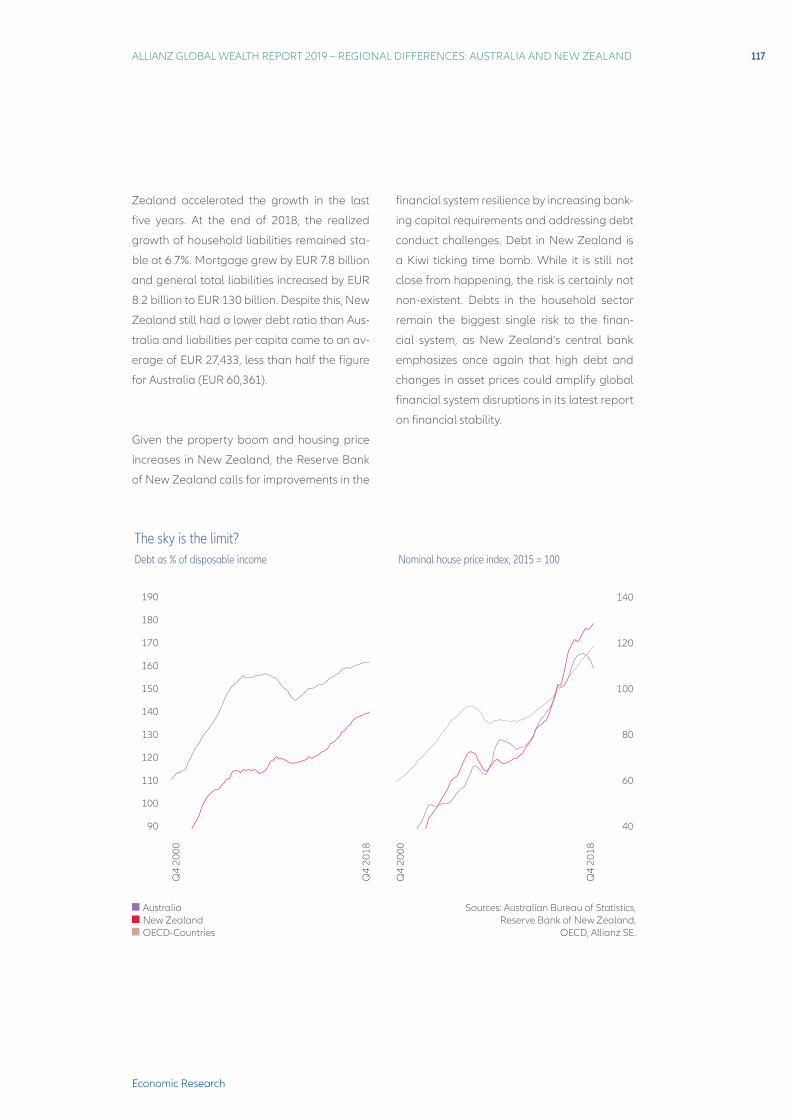
ALLIANZ GLOBAL WEALTH REPORT 2019 – REGIONAL DIFFERENCES: AUSTRALIA AND NEW ZEALAND 117
Economic Research
Zealand accelerated the growth in the last
five years. At the end of 2018, the realized
growth of household liabilities remained sta-
ble at 6.7%. Mortgage grew by EUR 7.8 billion
and general total liabilities increased by EUR
8.2 billion to EUR 130 billion. Despite this, New
Zealand still had a lower debt ratio than Aus-
tralia and liabilities per capita came to an av-
erage of EUR 27,433, less than half the figure
for Australia (EUR 60,361).
Given the property boom and housing price
increases in New Zealand, the Reserve Bank
of New Zealand calls for improvements in the
financial system resilience by increasing bank-
ing capital requirements and addressing debt
conduct challenges. Debt in New Zealand is
a Kiwi ticking time bomb. While it is still not
close from happening, the risk is certainly not
non-existent. Debts in the household sector
remain the biggest single risk to the finan-
cial system, as New Zealand’s central bank
emphasizes once again that high debt and
changes in asset prices could amplify global
financial system disruptions in its latest report
on financial stability.
190
180
170
160
150
140
130
120
110
100
90
Q4
2000
Q4
2018
Q4
2000
Q4
2018
The sky is the limit? Debt as % of disposable income Nominal house price index, 2015 = 100
Sources: Australian Bureau of Statistics, Reserve Bank of New Zealand,
OECD, Allianz SE.
140
120
100
80
60
40
AustraliaNew ZealandOECD-Countries
118
Differences in the ratio of assets to liabilities
Looking at the region as a whole, 41.6% of the
population had high net financial assets in a
global comparison, i.e. an average of more
than EUR 45,600 per capita, at the end of
2018. In North America this proportion came
in at 41%, whereas around 35% of the popula-
tion of Western Europe falls into this category.
In terms of the national distribution of wealth,
the richest 10% of Australian households own
around 45% of total private assets, while the
proportion in New Zealand comes to almost
50%. The average for industrialized countries
is estimated at 51%.
If we only look at the assets side of the wealth
balance sheet, then at the end of last year,
Australians had average per capita finan-
cial assets of EUR 129,031 putting them 12%
ahead of their neighbors in New Zealand
(EUR 115,053 per capita). Following deduc-
tions for liabilities, however, the latter are in
a much better position: due to the relatively
high debt burden, Australian financial assets
fell to only EUR 68,670 per capita in net terms,
whereas in New Zealand, average per capita
assets came in at EUR 87,621 in net terms. For
each euro borrowed in Australia, there were
assets worth EUR 2.13, while households in
New Zealand had EUR 4.20 in assets for each
liability of one euro.
In the global league of the highest net per
capita financial assets, New Zealand is in the
ninth place, and five places ahead of Aus-
tralia. Compared with 2000, the country has
maintained its position, whereas Australia has
climbed from 19th to 14th place. This reflects
the fact that not only debts, but also assets
have risen significantly in Australia, growing
by an average of 6.1% per year in the last
decade, compared with an average of 4.7% in
New Zealand.
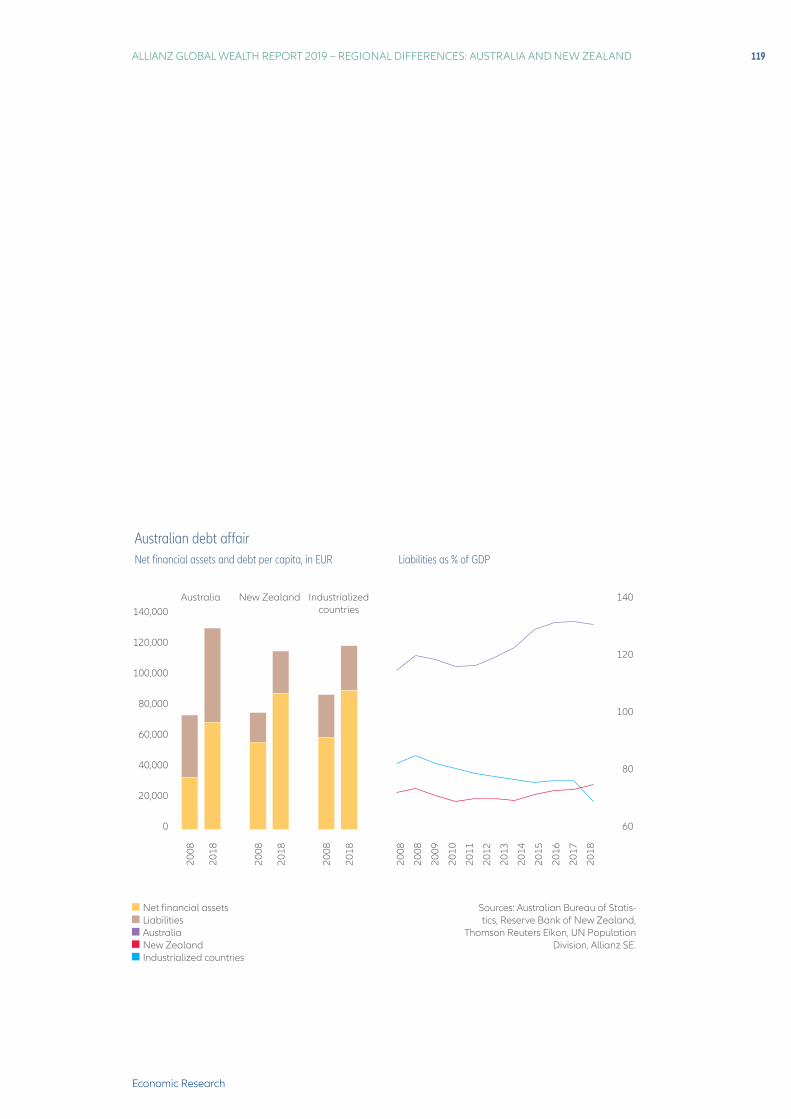
ALLIANZ GLOBAL WEALTH REPORT 2019 – REGIONAL DIFFERENCES: AUSTRALIA AND NEW ZEALAND 119
Economic Research
Australian debt affairNet financial assets and debt per capita, in EUR Liabilities as % of GDP
Sources: Australian Bureau of Statis-tics, Reserve Bank of New Zealand,
Thomson Reuters Eikon, UN Population Division, Allianz SE.
Net financial assetsLiabilities AustraliaNew ZealandIndustrialized countries
140,000
120,000
100,000
80,000
60,000
40,000
20,000
0
2008
2018
2008
2018
2008
2018
Australia New Zealand Industrialized countries
2008
2008
2009
2010
2011
2012
2013
2014
2015
2016
2017
2018
140
120
100
80
60

120
APPENDIX
ALLIANZ GLOBAL WEALTH REPORT 2019 – APPENDIX 121
Economic Research
Appendix A: Methodological comments
General assumptions
The Allianz Global Wealth Report is based on data from 53 countries. This group of countries co-
vers 91% of global GDP and 68% of the global population. In 43 countries, we had access to stati-
stics from the macroeconomic financial accounts. In the other countries, we were able to estimate
the volume of total financial assets based on information from household surveys, bank statistics,
statistics on assets held in equities and bonds, and technical reserves.
In some countries, it is still extremely difficult to find data on the financial assets of private
households. Let‘s take the Latin American countries as an example. For many countries, the only
information that can be found relates to the entire private sector or the economy as a whole, which
is often of only limited use as far as the situation of private households is concerned. In addition to
Chile, Columbia has fairly good data that can be used to analyze the financial structure of private
household assets. In Argentina, for example, we were able to estimate financial assets with the
help of data on bank deposits and insurance reserves.
In order to rule out exchange rate distortions over time, the financial assets were converted into
the national currency based on the fixed exchange rate at the end of 2018.
Statistical distinctions
The process associated with the introduction of the European System of Accounts 2010 (ESA 2010)
in September 2014 involved updating and harmonizing the guidelines governing the preparati-
on of many macroeconomic statistics. The new requirements also apply to the macroeconomic
financial accounts. One change relates to private households: under the ESVG 2010 regulations,
the two sectors „Private households“ and „Private organizations without pecuniary reward“ are no
longer grouped, but are now reported separately. This also has implications for the Allianz Global
Wealth Report, which takes data from the macroeconomic financial accounts as a basis where
available. For many countries, however - particularly those outside of the European Union - there
is no separate data available for these sectors in general, or at least not at present. So in order to
ensure global comparability, this publication analyzes both sectors together under the heading
„private households“.
122
Determination of wealth bands for global wealth classes
Lower wealth threshold: there is a close link between financial assets and the incomes of private
households. According to Davies et al. (2009), private individuals with below-average income tend
to have no assets at all, or only very few. It is only when individuals move into middle and higher
income groups that they start to accumulate any assets to speak of.
We have applied this link to our analysis. Countries in the upper-middle income bracket (based
on the World Bank‘s country classification system) therefore form the group in which the average
assets of private households has reached a relevant volume for the first time. This value marks the
lower threshold for the global wealth middle class. How high should this value be?
In terms of income, households with incomes that correspond to between 75% and 150% of ave-
rage net income are generally considered to constitute the middle class. According to Davies et
al., households with income corresponding to 75% of the average income have assets that corre-
spond to 30% of the average assets. As far as the upper threshold is concerned, 150% of average
income corresponds to 180% of average assets. Consequently, we have set the threshold values
for the middle wealth class at 30% and 180% of average per capital assets. If we use net financial
assets to calculate the two thresholds, we arrive at an asset range of between EUR 7,600 and EUR
45,600 for the global middle wealth class in 2018.
Individuals with higher per capita financial assets then belong to the global high wealth class,
whereas those with lower per capita financial assets belong to the „low wealth“ class.
These asset bands can, of course, also be used for the purposes of country classification. Countries
in which the average net per capita financial assets are less than EUR 7,600 can be referred to
as „low wealth countries“ (LWCs). „Middle wealth countries“ (MWCs) are all countries with ave-
rage net per capita financial assets of between EUR 7,600 and EUR 45,600; finally, all countries
with even higher average net per capita financial assets are described as „high wealth countries“
(HWCs).
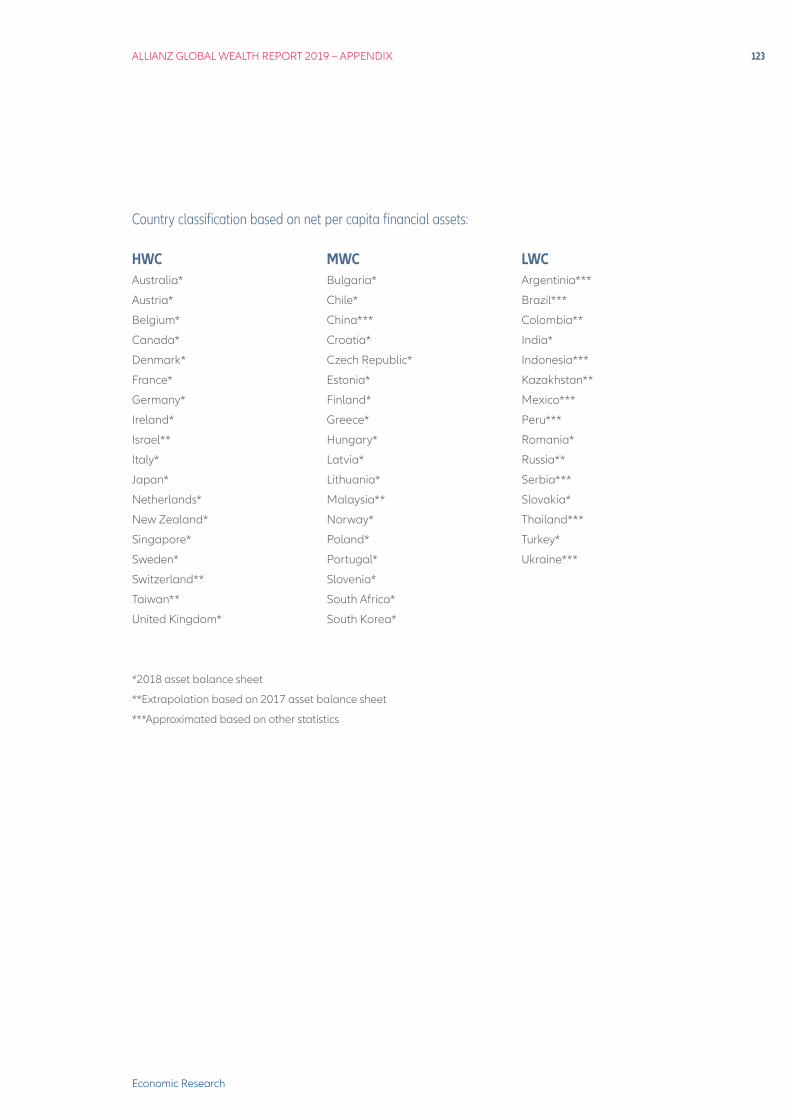
ALLIANZ GLOBAL WEALTH REPORT 2019 – APPENDIX 123
Economic Research
HWCAustralia*
Austria*
Belgium*
Canada*
Denmark*
France*
Germany*
Ireland*
Israel**
Italy*
Japan*
Netherlands*
New Zealand*
Singapore*
Sweden*
Switzerland**
Taiwan**
United Kingdom*
MWCBulgaria*
Chile*
China***
Croatia*
Czech Republic*
Estonia*
Finland*
Greece*
Hungary*
Latvia*
Lithuania*
Malaysia**
Norway*
Poland*
Portugal*
Slovenia*
South Africa*
South Korea*
LWCArgentinia***
Brazil***
Colombia**
India*
Indonesia***
Kazakhstan**
Mexico***
Peru***
Romania*
Russia**
Serbia***
Slovakia*
Thailand***
Turkey*
Ukraine***
*2018 asset balance sheet
**Extrapolation based on 2017 asset balance sheet
***Approximated based on other statistics
Country classification based on net per capita financial assets:

124
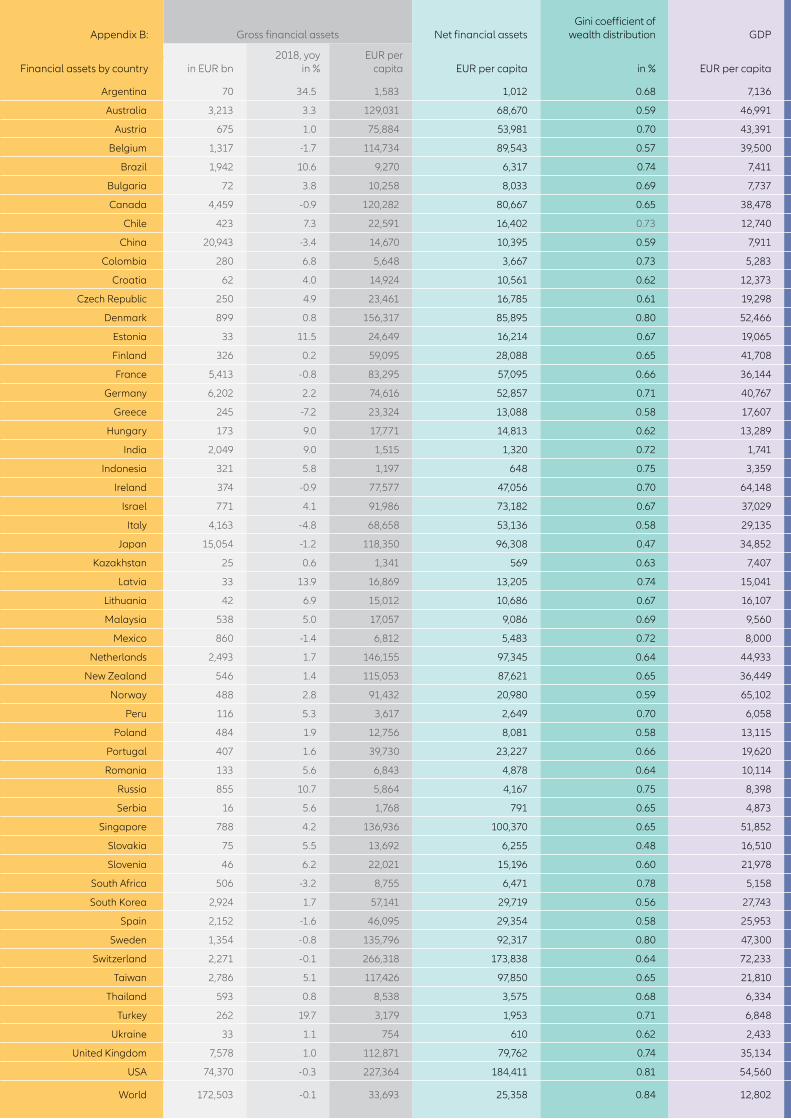
ALLIANZ GLOBAL WEALTH REPORT 2019 – APPENDIX 125
Economic Research
Appendix B: Gross financial assets Net financial assetsGini coefficient of
wealth distribution GDP
Financial assets by country in EUR bn2018, yoy
in %EUR per
capita EUR per capita in % EUR per capita
Argentina 70 34.5 1,583 1,012 0.68 7,136
Australia 3,213 3.3 129,031 68,670 0.59 46,991
Austria 675 1.0 75,884 53,981 0.70 43,391
Belgium 1,317 -1.7 114,734 89,543 0.57 39,500
Brazil 1,942 10.6 9,270 6,317 0.74 7,411
Bulgaria 72 3.8 10,258 8,033 0.69 7,737
Canada 4,459 -0.9 120,282 80,667 0.65 38,478
Chile 423 7.3 22,591 16,402 0.73 12,740
China 20,943 -3.4 14,670 10,395 0.59 7,911
Colombia 280 6.8 5,648 3,667 0.73 5,283
Croatia 62 4.0 14,924 10,561 0.62 12,373
Czech Republic 250 4.9 23,461 16,785 0.61 19,298
Denmark 899 0.8 156,317 85,895 0.80 52,466
Estonia 33 11.5 24,649 16,214 0.67 19,065
Finland 326 0.2 59,095 28,088 0.65 41,708
France 5,413 -0.8 83,295 57,095 0.66 36,144
Germany 6,202 2.2 74,616 52,857 0.71 40,767
Greece 245 -7.2 23,324 13,088 0.58 17,607
Hungary 173 9.0 17,771 14,813 0.62 13,289
India 2,049 9.0 1,515 1,320 0.72 1,741
Indonesia 321 5.8 1,197 648 0.75 3,359
Ireland 374 -0.9 77,577 47,056 0.70 64,148
Israel 771 4.1 91,986 73,182 0.67 37,029
Italy 4,163 -4.8 68,658 53,136 0.58 29,135
Japan 15,054 -1.2 118,350 96,308 0.47 34,852
Kazakhstan 25 0.6 1,341 569 0.63 7,407
Latvia 33 13.9 16,869 13,205 0.74 15,041
Lithuania 42 6.9 15,012 10,686 0.67 16,107
Malaysia 538 5.0 17,057 9,086 0.69 9,560
Mexico 860 -1.4 6,812 5,483 0.72 8,000
Netherlands 2,493 1.7 146,155 97,345 0.64 44,933
New Zealand 546 1.4 115,053 87,621 0.65 36,449
Norway 488 2.8 91,432 20,980 0.59 65,102
Peru 116 5.3 3,617 2,649 0.70 6,058
Poland 484 1.9 12,756 8,081 0.58 13,115
Portugal 407 1.6 39,730 23,227 0.66 19,620
Romania 133 5.6 6,843 4,878 0.64 10,114
Russia 855 10.7 5,864 4,167 0.75 8,398
Serbia 16 5.6 1,768 791 0.65 4,873
Singapore 788 4.2 136,936 100,370 0.65 51,852
Slovakia 75 5.5 13,692 6,255 0.48 16,510
Slovenia 46 6.2 22,021 15,196 0.60 21,978
South Africa 506 -3.2 8,755 6,471 0.78 5,158
South Korea 2,924 1.7 57,141 29,719 0.56 27,743
Spain 2,152 -1.6 46,095 29,354 0.58 25,953
Sweden 1,354 -0.8 135,796 92,317 0.80 47,300
Switzerland 2,271 -0.1 266,318 173,838 0.64 72,233
Taiwan 2,786 5.1 117,426 97,850 0.65 21,810
Thailand 593 0.8 8,538 3,575 0.68 6,334
Turkey 262 19.7 3,179 1,953 0.71 6,848
Ukraine 33 1.1 754 610 0.62 2,433
United Kingdom 7,578 1.0 112,871 79,762 0.74 35,134
USA 74,370 -0.3 227,364 184,411 0.81 54,560
World 172,503 -0.1 33,693 25,358 0.84 12,802

126
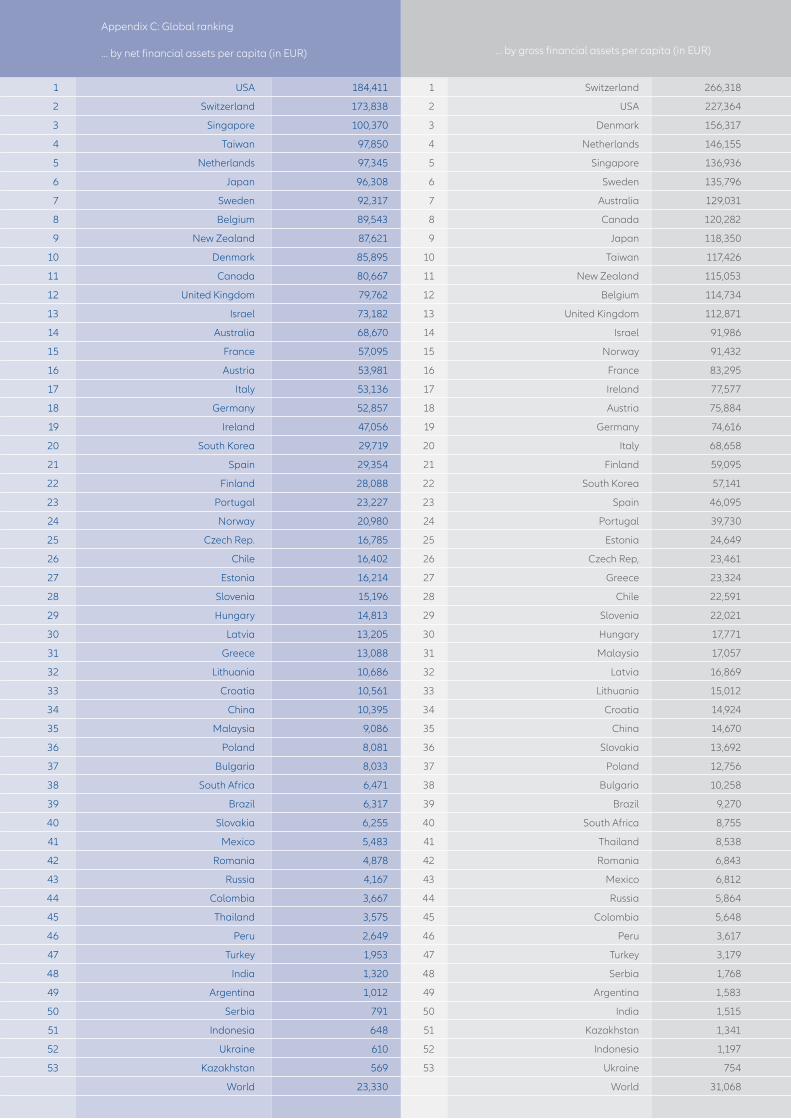
ALLIANZ GLOBAL WEALTH REPORT 2019 – APPENDIX 127
Economic Research
1 USA 184,411 1 Switzerland 266,318
2 Switzerland 173,838 2 USA 227,364
3 Singapore 100,370 3 Denmark 156,317
4 Taiwan 97,850 4 Netherlands 146,155
5 Netherlands 97,345 5 Singapore 136,936
6 Japan 96,308 6 Sweden 135,796
7 Sweden 92,317 7 Australia 129,031
8 Belgium 89,543 8 Canada 120,282
9 New Zealand 87,621 9 Japan 118,350
10 Denmark 85,895 10 Taiwan 117,426
11 Canada 80,667 11 New Zealand 115,053
12 United Kingdom 79,762 12 Belgium 114,734
13 Israel 73,182 13 United Kingdom 112,871
14 Australia 68,670 14 Israel 91,986
15 France 57,095 15 Norway 91,432
16 Austria 53,981 16 France 83,295
17 Italy 53,136 17 Ireland 77,577
18 Germany 52,857 18 Austria 75,884
19 Ireland 47,056 19 Germany 74,616
20 South Korea 29,719 20 Italy 68,658
21 Spain 29,354 21 Finland 59,095
22 Finland 28,088 22 South Korea 57,141
23 Portugal 23,227 23 Spain 46,095
24 Norway 20,980 24 Portugal 39,730
25 Czech Rep. 16,785 25 Estonia 24,649
26 Chile 16,402 26 Czech Rep, 23,461
27 Estonia 16,214 27 Greece 23,324
28 Slovenia 15,196 28 Chile 22,591
29 Hungary 14,813 29 Slovenia 22,021
30 Latvia 13,205 30 Hungary 17,771
31 Greece 13,088 31 Malaysia 17,057
32 Lithuania 10,686 32 Latvia 16,869
33 Croatia 10,561 33 Lithuania 15,012
34 China 10,395 34 Croatia 14,924
35 Malaysia 9,086 35 China 14,670
36 Poland 8,081 36 Slovakia 13,692
37 Bulgaria 8,033 37 Poland 12,756
38 South Africa 6,471 38 Bulgaria 10,258
39 Brazil 6,317 39 Brazil 9,270
40 Slovakia 6,255 40 South Africa 8,755
41 Mexico 5,483 41 Thailand 8,538
42 Romania 4,878 42 Romania 6,843
43 Russia 4,167 43 Mexico 6,812
44 Colombia 3,667 44 Russia 5,864
45 Thailand 3,575 45 Colombia 5,648
46 Peru 2,649 46 Peru 3,617
47 Turkey 1,953 47 Turkey 3,179
48 India 1,320 48 Serbia 1,768
49 Argentina 1,012 49 Argentina 1,583
50 Serbia 791 50 India 1,515
51 Indonesia 648 51 Kazakhstan 1,341
52 Ukraine 610 52 Indonesia 1,197
53 Kazakhstan 569 53 Ukraine 754
World 23,330 World 31,068
Appendix C: Global ranking … by net financial assets per capita (in EUR)
… by gross financial assets per capita (in EUR)

128
ALLIANZ GLOBAL WEALTH REPORT 2019 129
Economic Research
ALLIANZ GLOBAL WEALTH REPORT 2019 129
Economic Research
PublisherAllianz SEEconomic ResearchKöniginstraße 2880802 Munichwww.allianz.com
AuthorsDr. Michaela Grimm Dr. Michael Heise Dr. Arne Holzhausen Patricia Pelayo Romero
EditorsHeike BährLorenz Weimann
PhotosShutterstock
DesignSchmitt. GmbH, Hamburg
Closing date31. July 2019
ABOUT ALLIANZ The Allianz Group is one of the world‘s leading insurers and asset managers with more than 92 million retail and corporate customers. Allianz customers benefit from a broad range of personal and corporate insurance services, ranging from property, life and health insurance to assistance services to credit insurance and global business insurance. Allianz is one of the world’s largest investors, managing around 673 billion euros on behalf of its insurance customers. Furthermore our asset managers PIMCO and Allianz Global Investors manage more than 1.4 trillion euros of third-party assets. Thanks to our systematic integration of ecological and social criteria in our business processes and investment decisions, we hold the leading position for insurers in the Dow Jones Sustainability Index. In 2018, over 142,000 employees in more than 80 countries achieved total revenues of 131 billion euros and an operating profit of 11.5 billion euros for the group.
These assessments are, as always, subject to the disclaimer provided below.
FORWARD-LOOKING STATEMENTSThe statements contained herein may include prospects, statements of future expectations and other for-ward-looking statements that are based on management‘s current views and assumptions and involve known and unknown risks and uncertainties. Actual results, performance or events may differ materially from those expressed or implied in such forward-looking statements.
Such deviations may arise due to, without limitation, (i) changes of the general economic conditions and competitive situation, particularly in the Allianz Group‘s core business and core markets, (ii) performance of financial markets (particularly market volatility, liquidity and credit events), (iii) frequency and severity of insured loss events, including from natural catastrophes, and the development of loss expenses, (iv) mortal-ity and morbidity levels and trends, (v) persistency levels, (vi) particularly in the banking business, the extent of credit defaults, (vii) interest rate levels, (viii) currency exchange rates including the EUR/USD exchange rate, (ix) changes in laws and regulations, including tax regulations, (x) the impact of acquisitions, including related integration issues, and reorganization measures, and (xi) general competitive factors, in each case on a local, regional, national and/or global basis. Many of these factors may be more likely to occur, or more pronounced, as a result of terrorist activities and their consequences.
NO DUTY TO UPDATEThe company assumes no obligation to update any information or forward-looking statement contained herein, save for any information required to be disclosed by law.

130