alliance for downtown new york real estate m… · alliance for downtown new york q2 2012...
TRANSCRIPT

ALLIANCE FOR DOWNTOWN NEW YORK
Q2 2012
COMMERCIAL OFFICE MARKET
LOWER MANHATTAN YEAR-TO-DATE LEASING (sf)Source: CBRE
02003 2004 2005 2006 2007 2008 2009 2010 2011 2012
Q2 Year End
1 million
2 million
3 million
4 million
5 million
6 million
7 million
8 million
Leasing Activity
Lower Manhattan year-to-date leasing totaled 2.02 million square feet, on par with the last two quarters and the ten-year average, but down over Q2 2011 when Condé Nast’s deal for 1 million square feet at the World Trade Center caused a spike in leasing.
Several notable deals drove this quarter’s leasing with each of the top six transactions exceeding 100,000 square feet and more than three-quarters of the leasing activity in the top ten deals being driven by renewals by some of Lower Manhattan’s long-standing private sector and government tenants. Morgan Stanley’s 1.15-million-square-foot expansion at 1 New York Plaza was the top lease this quarter, with a conversion from sublease to a direct lease and the addition of 337,000 square feet. Two Government renewals included the New York City Law Department’s 372,500-square-foot renewal at 100 Church Street and the City of New York’s renewal for 207,800 square feet at 75 Park Place. Milbank, Tweed, Hadley & McCloy renewed 350,000 square feet at 1 Chase Manhattan Plaza. Finally, Fitch Ratings, renewed
1
and expanded at 33 Whitehall Street.
Other top deals reflect the ongoing diversification of Lower Manhattan with an influx of creative and technology firms. The New York Film Academy signed a deal to relocate from Union Square, and two technology firms—Stack Exchange and Addison—are relocating within the district.
Vacancy
Despite a drop in year-to-date leasing activity over 2011, Lower Manhattan’s overall vacancy rate dropped to 8.9% in Q2 2012, down from 9.2% last quarter and 9.7% year-over-year. Sublease vacancy remained low at just 1.5%. According to Cushman & Wakefield, the slight drop in total vacancy caused the district to move up a notch to rank second among business districts nationwide, just behind Midtown South where vacancy is 6.1%.
Midtown’s vacancy was 9.8% this quarter, stable over last quarter and last year. Sublease vacancy there was 1.7%.
LOWER MANHATTAN LEASING BY QUARTER (sf)Source: CBRE
- 200,000
400,000
600,000 800,000
1,000,000
1,200,000
1,400,000 1,600,000 1,800,000 2,000,000
Q2 Q3 Q4 Q1 Q2 Q3 Q4 Q1 Q2 Q3 Q4 Q1 Q2 Q3 Q4 Q1 Q2
2009 2010 2011 20122008

LOWER MANHATTAN REAL ESTATE MARKET OVERVIEW Q2 2012
2
RELOCATIONS Q2 2012Source: CBRE, CoStar, Downtown Alliance
Tenant Name Building Address SF Leased Previous Location Sector
New York Film Academy 17 Battery Place South 73,321 Midtown South Education
Sterling Infosystems 1 State Street Plaza 25,434 Midtown South Professional Services, Other
Half Yard Productions 50 Broad Street 12,730 Midtown South Creative Services, Other
The Century Foundation 1 Whitehall Street 10,735 Upper East Side Nonprofit
TriTek Solutions 22 Cortlandt Street 8,700 Midtown Technology, Computer Systems Design
Gallery Systems 5 Hanover Square 7,225 Midtown Technology, Computer Systems Design
Weathervane Capital 80 Broad Street 6,800 Long Island FIRE
Oxford Economics 5 Hanover Square 4,970 Midtown South Professional Services, Other
RealMatch 90 Broad Street 4,780 East Brunswick, NJ Technology, Other
Projects Abroad 80 Broad Street 1,850 Midtown Professional Services, Management Consulting
TOP TEN LEASES SIGNED Q2 2012Source: CBRE, CoStar, Downtown Alliance
Tenant Name Building Address SF Leased Transaction Type Industry
Morgan Stanley Smith Barney 1 New York Plaza 1,153,000 Renewal/Expansion FIRENew York City Law Department 100 Church Street 372,520 Renewal GovernmentMilbank, Tweed, Hadley & McCloy 1 Chase Manhattan Plaza 350,010 Renewal Professional ServicesThe City of New York 75 Park Place 207,812 Renewal GovernmentFitch Ratings 33 Whitehall Street 180,500 Renewal/Expansion FIRENew York Film Academy 17 Battery Place South 73,321 Relocation Creative ServicesStack Exchange 110 William Street 30,230 Direct TechnologyAddison 48 Wall Street 28,240 Direct TechnologySterling Infosystems 1 State Street Plaza 25,434 Relocation Professional ServicesU.S. Bancorp 100 Wall Street 24,970 Renewal FIRE
2%
4%
6%
8%
10%
12%
14%
Q2 Q3 Q4 Q1 Q2 Q3 Q4 Q1 Q2 Q3 Q4 Q1 Q2 Q3 Q4 Q1 Q2
2009 2010 2011 2012
Lower Manhattan Midtown Midtown South
2008
0.0%
0.5%
1.0%
1.5%
2.0%
2.5%
3.0%
3.5%
4.0%
Q2 Q3 Q4 Q1 Q2 Q3 Q4 Q1 Q2 Q3 Q4 Q1 Q2 Q3 Q4 Q1 Q2
2009 2010 2011 20122008
Lower Manhattan Midtown Midtown South
TOTAL VACANCYSource: Cushman & Wakefield
SUBLEASE VACANCYSource: Cushman & Wakefield
LOWER MANHATTAN REAL ESTATE MARKET OVERVIEW Q2 2012
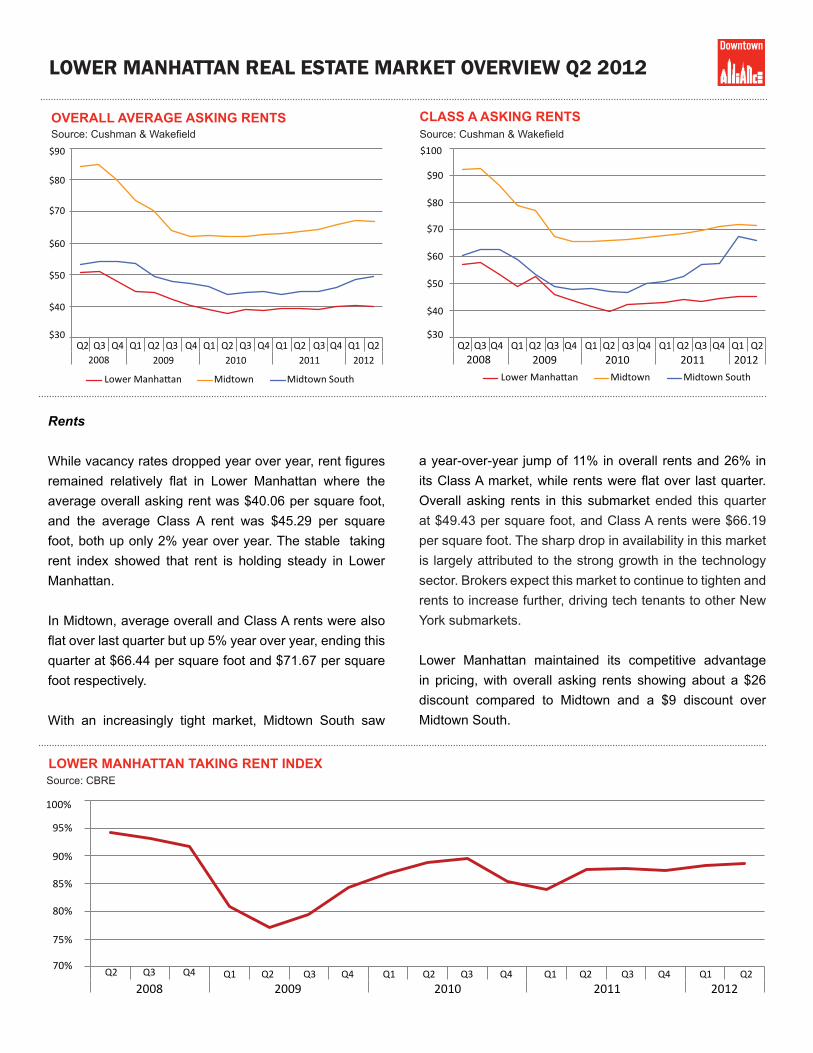
OVERALL AVERAGE ASKING RENTSSource: Cushman & Wakefield
Rents
While vacancy rates dropped year over year, rent figures remained relatively flat in Lower Manhattan where the average overall asking rent was $40.06 per square foot, and the average Class A rent was $45.29 per square foot, both up only 2% year over year. The stable taking rent index showed that rent is holding steady in Lower Manhattan.
In Midtown, average overall and Class A rents were also flat over last quarter but up 5% year over year, ending this quarter at $66.44 per square foot and $71.67 per square foot respectively.
With an increasingly tight market, Midtown South saw
a year-over-year jump of 11% in overall rents and 26% in its Class A market, while rents were flat over last quarter. Overall asking rents in this submarket ended this quarter at $49.43 per square foot, and Class A rents were $66.19 per square foot. The sharp drop in availability in this market is largely attributed to the strong growth in the technology sector. Brokers expect this market to continue to tighten and rents to increase further, driving tech tenants to other New York submarkets.
Lower Manhattan maintained its competitive advantage in pricing, with overall asking rents showing about a $26 discount compared to Midtown and a $9 discount over Midtown South.
LOWER MANHATTAN TAKING RENT INDEXSource: CBRE
$30
$40
$50
$60
$70
$80
$90
Q2 Q3 Q4 Q1 Q2 Q3 Q4 Q1 Q2 Q3 Q4 Q1 Q2 Q3 Q4 Q1 Q22009 2010 2011 2012
Lower Manhattan Midtown Midtown South
2008
$30
$40
$50
$60
$70
$80
$90
$100
Q2 Q3 Q4 Q1 Q2 Q3 Q4 Q1 Q2 Q3 Q4 Q1 Q2 Q3 Q4 Q1 Q22009 2010 2011 2012
Lower Manhattan Midtown Midtown South
2008
CLASS A ASKING RENTSSource: Cushman & Wakefield
70%
75%
80%
85%
90%
95%
100%
Q2 Q3 Q4 Q1 Q2 Q3 Q4 Q1 Q2 Q3 Q4 Q1 Q2 Q3 Q4 Q1 Q22009 2010 2011 20122008

LOWER MANHATTAN REAL ESTATE MARKET OVERVIEW Q2 2012
PROPERTY SALES
Lower Manhattan’s sales market was robust during Q2 2012 with six transactions totaling $843.5 million, nearing the total sales in all of 2011 ($877 million) and outpacing total sales in 2010 by 172%.
Commercial Buildings and Condominiums1
Alex Rovt purchased a majority stake in 14 Wall Street for $294 million from Capstone Equities, which maintains a minority stake in the building. The buyer is a Ukrainian native and president of a fertilizer company.
EDGE Fund Advisors purchased 4 New York Plaza on behalf of HSBC Alternative Investments from Harbor Group International for $270 million, or $265 per square foot, a 150% increase over Harbor Group’s purchase of $107 million in January 2010. The New York Daily News and American Media signed about 100,000 square feet each since Harbor Group International purchased the property, bringing the building to about 95% leased at the point of sale to EDGE Fund.
Bank of America sold 222 Broadway to L&L Holding Company for $230 million, or $304 per square foot. The building is currently 99% leased with the seller occupying 75% of the space on a 10-year lease.
Jacob Klein purchased a 7,804-square-foot ground floor retail condo at 59 John Street from Wiljohn Associates LLC for $3.3 million, or $423 per square foot.
Development Sites
Hidrock Realty purchased the vacant lot at 133 Greenwich Street, which includes 38,606 square feet of air rights from 139 Greenwich Street, for a total $27.9 million, or $214 per buildable square foot. The purchase was a joint venture with Robert Finvarb Companies and the developers plan to build a 28-floor, 300-room hotel scheduled to open in 2015.
1 Source of transactional information: Massay Knakal
14 WALL STREET
4 NEW YORK PLAZA
222 BROADWAY

LOWER MANHATTAN REAL ESTATE MARKET OVERVIEW Q2 2012
RESIDENTIAL MARKET
Development and Inventory2
Lower Manhattan has an estimated 57,000 residents, and 29,722 units in 318 residential and mixed-use buildings.
A 40-unit rental building opened this quarter at 254 Front Street, and another 830 units in six buildings are under construction and scheduled for completion in 2012 and 2013. With these new additions to inventory, Lower Manhattan’s residential population is expected to reach 60,000 in 2013.
Rental Market3
Studios and one-bedroom apartments made up the greatest market share of the rental market in Lower Manhattan, at 34% and 43%, respectively. Nearly 20% were two-bedroom units and 4% were three- and four-bedroom units.
About 900 units were added to the active listings in Q2 2012, 3% greater than last quarter and 25% greater than last year. Despite these additions, absorption was strong and Lower Manhattan apartments spent an average of just 22 days on market, down 45% from last quarter, 31% from last year. That average is 42% less than the Manhattan-wide average.
YEAR-OVER-YEAR INCREASE IN RENTSSource: Citi-Habitats
4
MARKET SHARE OF LOWER MANHATTAN RENTALSSource: Miller Samuel/Prudential Douglas Elliman
0%
2%
4%
6%
8%
10%
Studio 1 BR 2 BR 3 BRLower Manhattan Manhattan
3-Bedroom 3.4%
Studio34.3%2-Bedroom
19.1%
1-Bedroom42.7%
4+ Bedroom 0.6%
RESIDENTIAL PROJECTS UNDER CONSTRUCTIONSource: Downtown Alliance
3 Source of data on market share of rentals, active listings, and days on market: Miller Samuel/Prudential Douglas Elliman. Source of vacancy and rental rates: Citi Habitats
2 Source: Downtown Alliance
Address Lease Type Building Type Status Units Date Open136 Church Street Condo Conversion Under Construction 12 201267 Liberty Street Condo Conversion Under Construction 12 2012116 John Street Rental Conversion Under Construction 418 201219 Park Place Condo New Construction Under Construction 25 20132 John Street (180 Broadway) Dorm New Construction Under Construction 196 2013113 Nassau Street Rental New Construction Under Construction 167 2013

LOWER MANHATTAN REAL ESTATE MARKET OVERVIEW Q2 2012
5
MARKET SHARE OF LOWER MANHATTAN SALESSource: Miller Samuel/Prudential Douglas Elliman
$800
$850
$900
$950
$1,000
$1,050
$1,100
$1,150
$1,200
1Q-2011 2Q-2011 3Q-2011 4Q-2011 1Q-2012 2Q-2012
Lower Manhattan Manhattan-wide
AVERAGE PRICE ($/SF)Source: Miller Samuel/Prudential Douglas Elliman
That swift leasing kept vacancy low at just 0.99%, down from 1.32% last quarter.
The tightening of the market caused rents to increase. Lower Manhattan’s average rent was $3,923 per month, up about 1% from last quarter and 2% from last year. Studios, two-, and three-bedroom units trended similarly in Lower Manhattan and Manhattan overall, but one-bedroom units had the highest jump at 10% over last quarter in Lower Manhattan.
Meanwhile, the Manhattan-wide increase was slightly stronger, ending the quarter at $3,437 per month, up 2% from last quarter and 5% over last year. Despite that growth, Lower Manhattan continues to garner higher rents, at 14% more than the Manhattan-wide average.
Sales Market (Combined Condos and Co-ops)4
Sales velocity jumped over last quarter, showing Lower Manhattan’s peak summer season was off to a strong start, though that increase did not reach last year’s spike. A total 136 sales were transacted during the second quarter, up 28% over last quarter but down 32% year over year. Meanwhile, apartments spent 160 days on market, 8% fewer than last quarter, but up 17% from last year.
Pricing improved year over year, despite the slow-down in sales volume. The median sales price increased 17% year over year to $900,000, outpacing the Manhattan-wide median, which decreased 2.5% year over year, and ended the quarter at $829,000. Similarly, Lower Manhattan averaged $969 per square foot, a 4% increase year over year, and again outpacing the Manhattan-wide average of $1,065 per square foot, which was flat over last year.
The majority of sales were mid-sized apartments: 45% of units sold were one-bedroom, and 26% were two-bedroom homes. Meanwhile, studios made up 18% of the market share and three- and four-bedrooms made up nearly 12%.
0
500
1,000
1,500
2,000
2,500
3,000
3,500
0
50
100
150
200
250
1Q-2011 2Q-2011 3Q-2011 4Q-2011 1Q-2012 2Q-2012
Lower Manhattan Manhattan-wide
VOLUME OF TRANSACTIONSSource: Miller Samuel/Prudential Douglas Elliman
3-Bedroom11% Studio
17.6%
2-Bedroom25.7%
1-Bedroom44.9%
4+ Bedroom 0.7%
4 Source of sales market data: Miller Samuel/Prudential Douglas Elliman

LOWER MANHATTAN REAL ESTATE MARKET OVERVIEW Q2 2012
AVERAGE DAILY ROOM RATES Q2 2011 - Q2 2012Source: Downtown Alliance, NYC & Company
$170
$190
$210
$230
$250
$270
$290
$310
$330
Q2 2011 Q3 2011 Q4 2011 Q1 2012 Q2 2012
Lower Manhattan New York City
HOTEL OCCUPANCY RATES Q2 2011 - Q2 2012Source: Downtown Alliance, NYC & Company
70% 72% 74% 76% 78% 80% 82% 84% 86% 88% 90%
Q2 2011 Q3 2011 Q4 2011 Q1 2012 Q2 2012Lower Manhattan New York City
HOTEL PIPELINESource: Downtown Alliance
Hotel Location Floors Rooms Year Open Owner/ Developer
Holiday Inn 99 Washington Street 44 350 2013 McSam Hotel Group
Independent hotel 24-26 John Street 21 95 2013 Duc Construction Corp
Aloft Hotel 49 Ann Street 18 113 2013 107 West Broadway Realty Corp
Marriott 30 Fletcher Street 32 200 2014 Lam Group
Homewood Suites 33 Beekman Street 32 270 2014 McSam Hotel Group
Development and Inventory
Tremendous growth in hotel development continues. The current inventory—4,092 rooms in 18 hotels—is on track to increase by 25% in the next two years as five hotels with 1,028 rooms are under construction. This new development will bring the total inventory to 23 hotels with 5,120 rooms.
As credit markets thaw, developers are planning even more hotel projects. Another eight sites are in the planning stages for hotel construction. These range from discount to boutique to luxury, complimenting Lower Manhattan’s existing inventory, which spans a full range of product types.
Occupancy and Room Rates
Lower Manhattan’s hotel market fundamentals showed strong increases entering the summer tourism season, and improved year over year, trending almost identically to citywide averages.
Lower Manhattan’s average daily room rate (ADR) was $294, a 23% jump from last quarter and a 3% increase over last year. The district’s ADR was considerably higher than the citywide figure of $258, which increased 30% over last quarter and 12% over last year.
Meanwhile, the average occupancy rate among Lower Manhattan hotels was 87% this quarter, up 18% over last quarter and 2% year over year. The citywide rate trended the same, ending the quarter equal to Lower Manhattan.
HOTEL MARKET

LOWER MANHATTAN REAL ESTATE MARKET OVERVIEW Q2 2012
Ten new restaurants, stores, and storefront services opened south of Chambers Street, including four new quick-service eateries. Café French Gourmand, a French-inspired café, and Yushi Asian Kitchen, serving build-your-own bowls of Asian-inspired cooking, opened on Pearl Street. Brooklyn Yogurt Factory, a self-service frozen yogurt bar, and Cravings Catering and Café opened by the same owner, side-by-side in 17 Trinity Place.
RETAIL MARKET
Visit WWW.DOWNTOWNNY.COM/RESEARCH for additional publications on the Lower Manhattan real estate
market and economy. Documents include a complete list of residential and hotel developments, available retail
spaces and a summary of commercial leasing incentives.
If you have questions or require additional information, please contact [email protected].
BLOOMSource: Bloom
Retail expansion continued in the new Conrad New York hotel including Accents, a gift shop featuring unique and hard-to-find items. Luxury florist Bloom opened its second Manhattan location in North End Way (the corridor between the Conrad and Goldman Sachs’ headquarters).
Several local and national chains have plans to open soon in Lower Manhattan. Baked by Melissa, a bite-size cupcake store with eight Manhattan stores, will open its first Lower Manhattan location at 108 Fulton Street. Morton’s Steakhouse is coming soon with its second Manhattan location at 140 Washington Street, in the base of the World Center Hotel, across from the World Trade Center site. Potbelly will open its third Lower Manhattan location at 90 Broad Street, and Chipotle will add a fifth Lower Manhattan location at 275 Greenwich Street.
YUSHI ASIAN KITCHENSource: Downtown Alliance