allahabad bank performance report 31 mar 12
TRANSCRIPT

8/13/2019 Allahabad Bank Performance Report 31 Mar 12
http://slidepdf.com/reader/full/allahabad-bank-performance-report-31-mar-12 1/35

8/13/2019 Allahabad Bank Performance Report 31 Mar 12
http://slidepdf.com/reader/full/allahabad-bank-performance-report-31-mar-12 2/35
1865 : Founded by a group of Europeans atAllahabad,
1923 : Head Office shifted to Kolkata,
1969 : Nationalization - Business – ` 196 crore
1991: Bank has floated wholly owned subsidiaryAllBank Finance Ltd.
2002 : Initial Public Offer – ` 100 crore,
2005 : Follow on Public Offer – ` 100 crore,
2006: - 1st overseas Branch & Representative officeopened in Hong Kong & Shenzhen, China
- Floated joint venture Insurance companyUniversal Sompo General Insurance,
2007: Crossed ` 1 lac crore of business,
2010: Crossed ` 2 lac crore of business,
2010: Fully on CBS Platform,
2012: 2500 plus branch network
148 Years of Existence: A Brief History
1
8/13/2019 Allahabad Bank Performance Report 31 Mar 12
http://slidepdf.com/reader/full/allahabad-bank-performance-report-31-mar-12 3/35
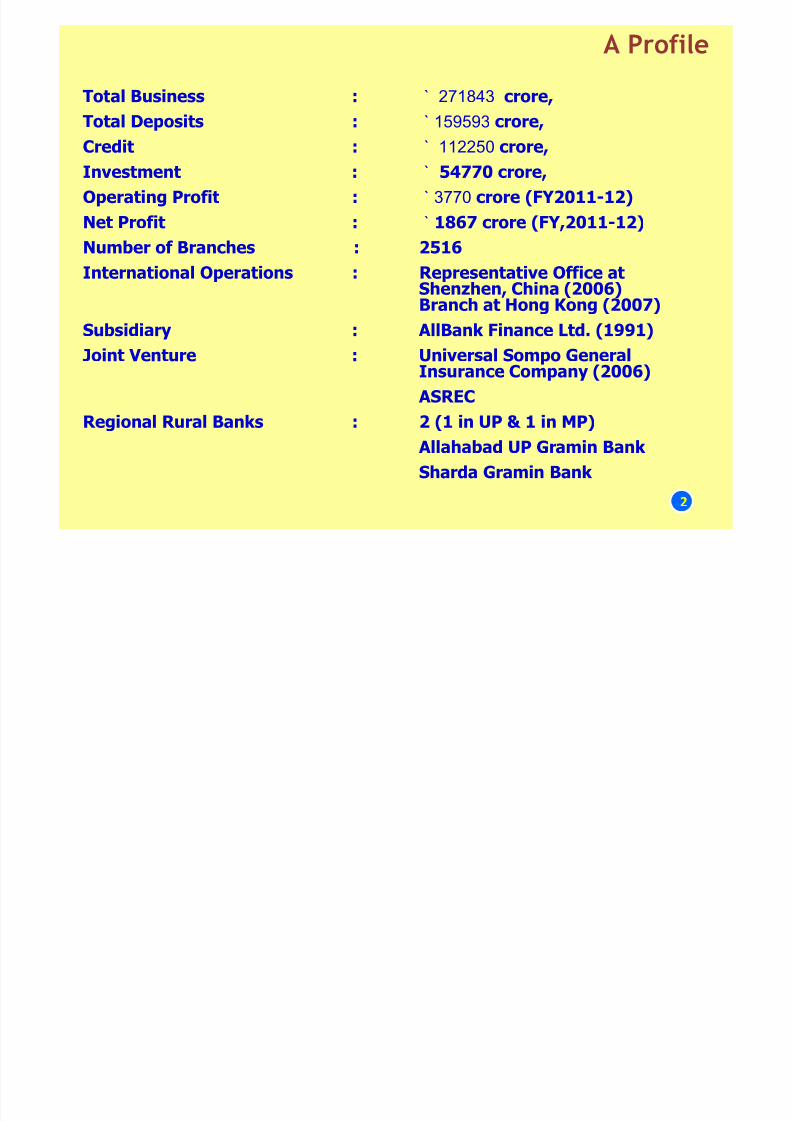
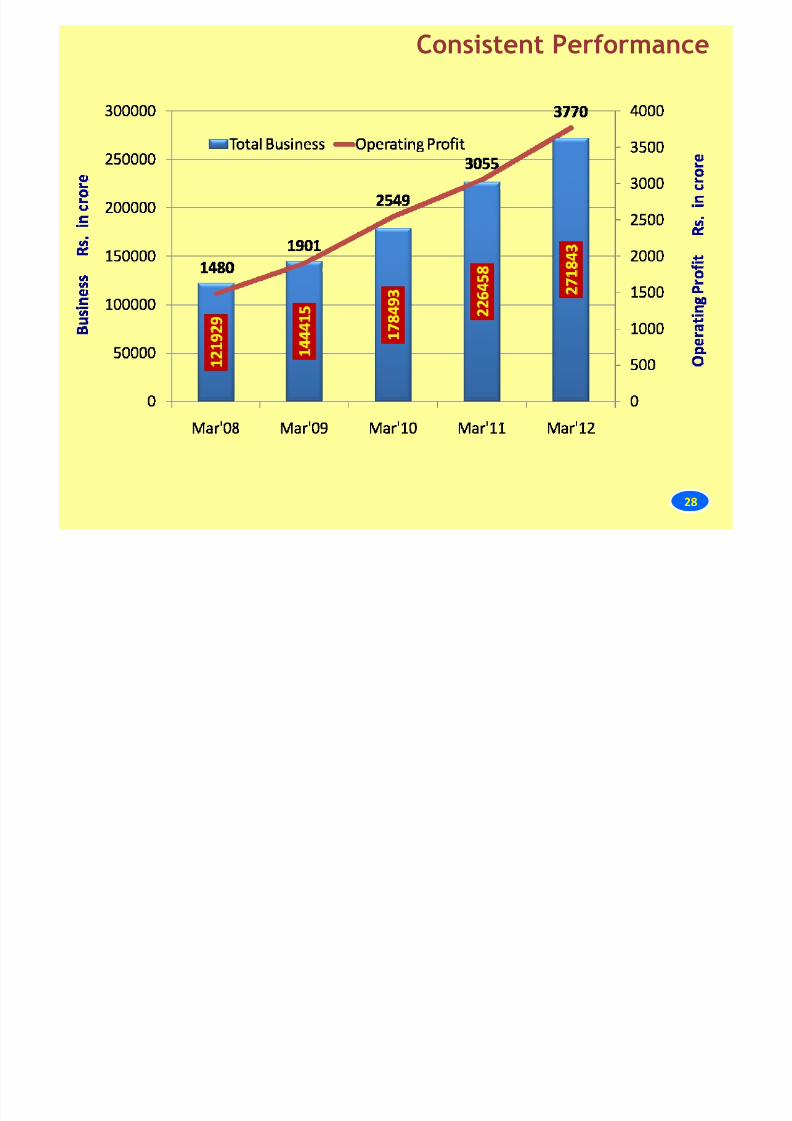
Total Business : ` 271843 crore,Total Deposits : ` 159593 crore,
Credit : ` 112250 crore,
Investment : ` 54770 crore,
Operating Profit : ` 3770 crore (FY2011-12)Net Profit : ` 1867 crore (FY,2011-12)
Number of Branches : 2516
International Operations : Representative Office at
Shenzhen, China (2006)Branch at Hong Kong (2007)
Subsidiary : AllBank Finance Ltd. (1991)
Joint Venture : Universal Sompo GeneralInsurance Company (2006)
ASREC
Regional Rural Banks : 2 (1 in UP & 1 in MP)
Allahabad UP Gramin Bank
Sharda Gramin Bank
A Profile
2
8/13/2019 Allahabad Bank Performance Report 31 Mar 12
http://slidepdf.com/reader/full/allahabad-bank-performance-report-31-mar-12 4/35
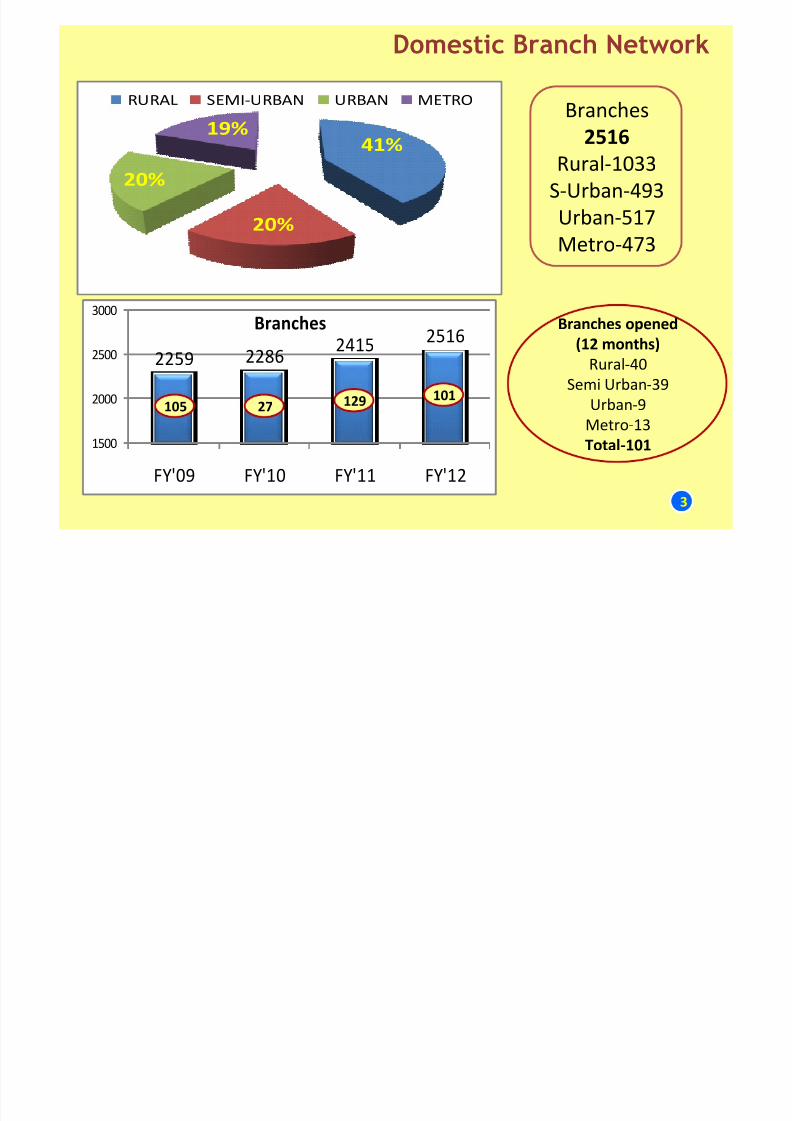
Domestic Branch Network
3
Branches
2516
Rural‐1033
S‐Urban
‐493
Urban‐517
Metro‐473
Branches opened
(12 months)
Rural‐40
Semi Urban‐39
Urban‐9
Metro‐13
Total‐101
41%
20%
20%
19%
RURAL SEMI‐
URBAN URBAN METRO
2259 2286 2415
2516
1500
2000
2500
3000
FY'09 FY'10 FY'11 FY'12
Branches
105 27 129 101
8/13/2019 Allahabad Bank Performance Report 31 Mar 12
http://slidepdf.com/reader/full/allahabad-bank-performance-report-31-mar-12 5/35
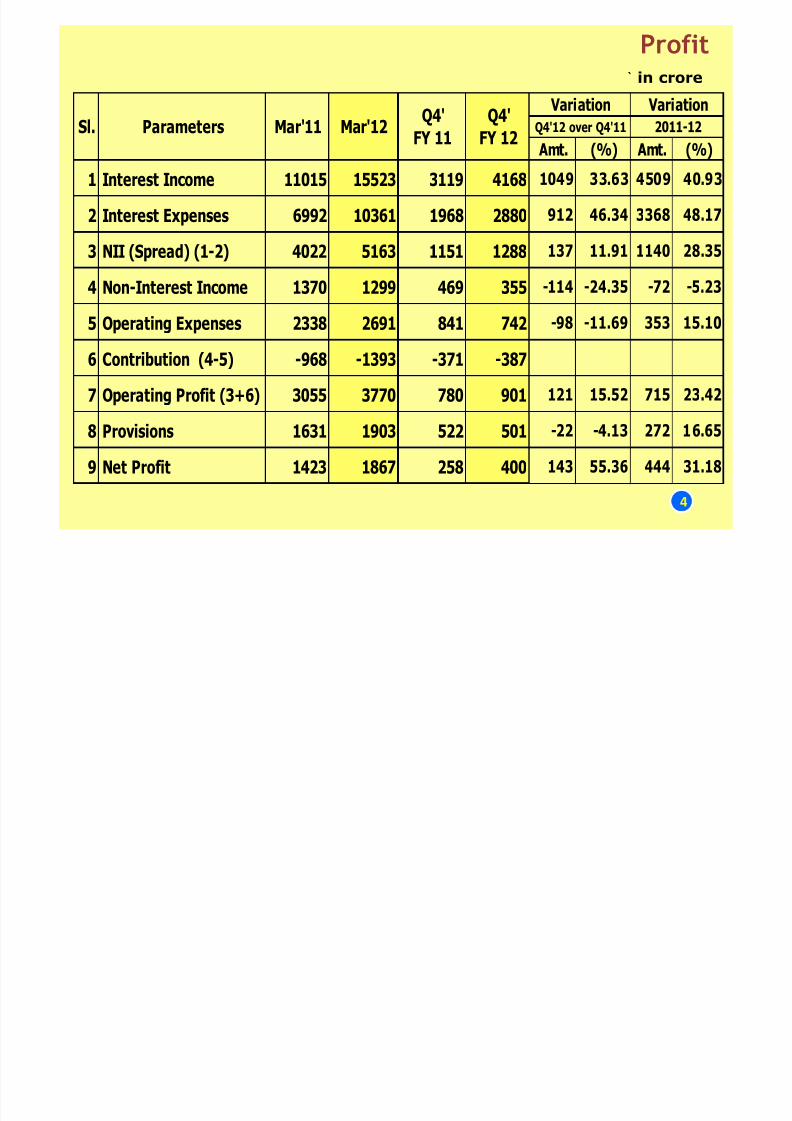
Profit` in crore
4
Amt. (%) Amt. (%)
1 Interest Income 11015 15523 3119 4168 1049 33.63 4509 40.93
2 Interest Expenses 6992 10361 1968 2880 912 46.34 3368 48.17
3 NII (Spread) (1-2) 4022 5163 1151 1288 137 11.91 1140 28.35
4 Non-Interest Income 1370 1299 469 355 -114 -24.35 -72 -5.23
5 Operating Expenses 2338 2691 841 742 -98 -11.69 353 15.10
6 Contribution (4-5) -968 -1393 -371 -387
7 Operating Profit (3+6) 3055 3770 780 901 121 15.52 715 23.42
8 Provisions 1631 1903 522 501 -22 -4.13 272 16.65
9 Net Profit 1423 1867 258 400 143 55.36 444 31.18
Variation
2011-12Sl. Parameters Mar'11
Variation
Q4'12 over Q4'11Q4'
FY 11Mar'12
Q4'
FY 12
8/13/2019 Allahabad Bank Performance Report 31 Mar 12
http://slidepdf.com/reader/full/allahabad-bank-performance-report-31-mar-12 6/35
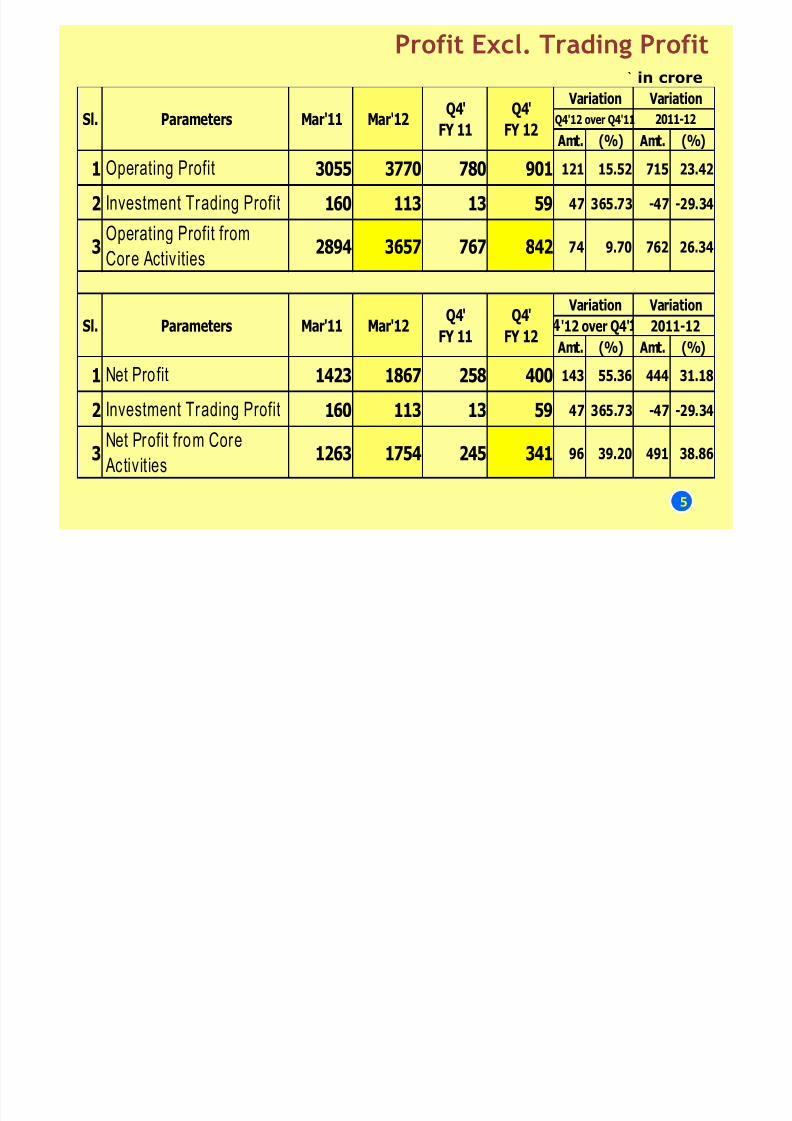
Profit Excl. Trading Profit` in crore
5
Amt. (%) Amt. (%)
1 Operating Profit 3055 3770 780 901 121 15.52 715 23.42
2 Investment Trading Profit 160 113 13 59 47 365.73 -47 -29.34
3Operating Profit from
Core Activ ities 2894 3657 767 842 74 9.70 762 26.34
Amt. (%) Amt. (%)
1 Net Profit 1423 1867 258 400 143 55.36 444 31.18
2 Investment Trading Profit 160 113 13 59 47 365.73 -47 -29.34
3Net Profit from Core
Activities 1263 1754 245 341 96 39.20 491 38.86
Sl. Q4'
FY 12
Parameters Mar'11 Mar'12 2011-12
Variation
Q4'
FY 12
2011-12Mar'11 Q4'
FY 11
Variation
Mar'12
Q4'
FY 11Sl.
'12 over Q4'
Variation
Variation
Parameters
Q4'12 over Q4'11
8/13/2019 Allahabad Bank Performance Report 31 Mar 12
http://slidepdf.com/reader/full/allahabad-bank-performance-report-31-mar-12 7/35
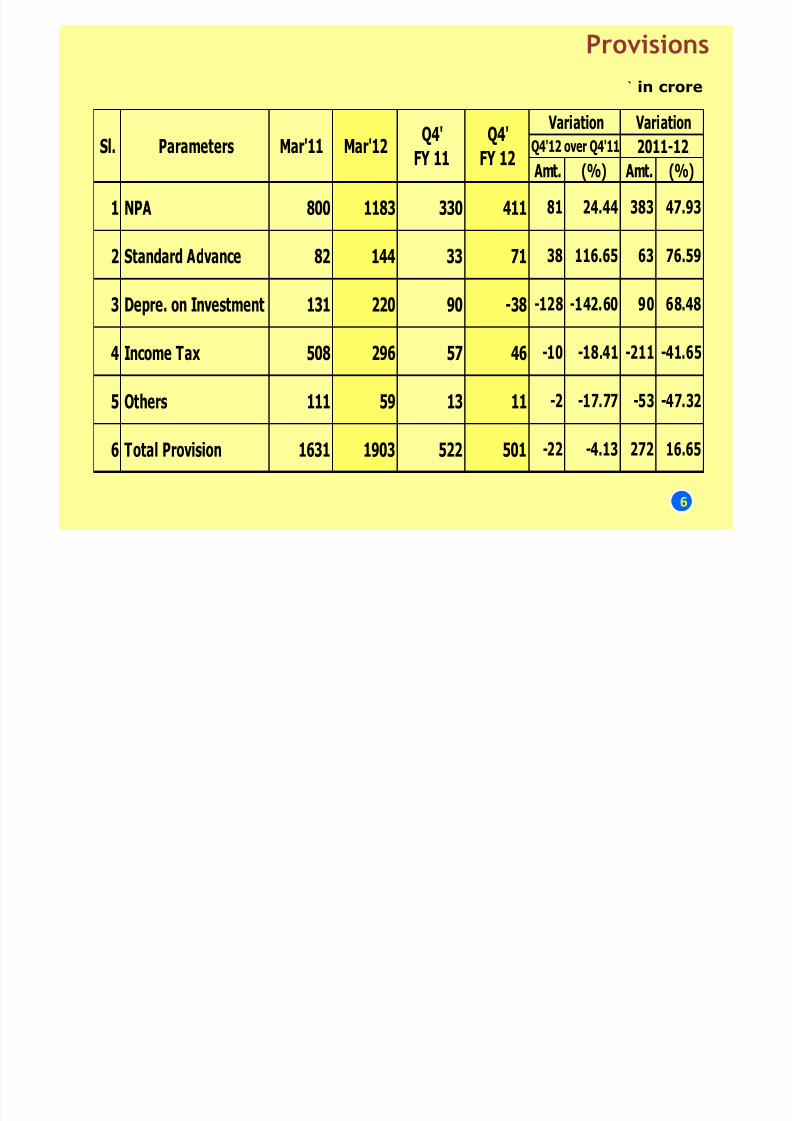
Provisions
` in crore
6
Amt. (%) Amt. (%)
1 NPA 800 1183 330 411 81 24.44 383 47.93
2 Standard Advance 82 144 33 71 38 116.65 63 76.59
3 Depre. on Investment 131 220 90 -38 -128 -142.60 90 68.48
4 Income Tax 508 296 57 46 -10 -18.41 -211 -41.65
5 Others 111 59 13 11 -2 -17.77 -53 -47.32
6 Total Provision 1631 1903 522 501 -22 -4.13 272 16.65
Variation Variation
Q4'12 over Q4'11 2011-12Sl. Parameters Mar'11 Mar'12 Q4'
FY 11
Q4'
FY 12
8/13/2019 Allahabad Bank Performance Report 31 Mar 12
http://slidepdf.com/reader/full/allahabad-bank-performance-report-31-mar-12 8/35
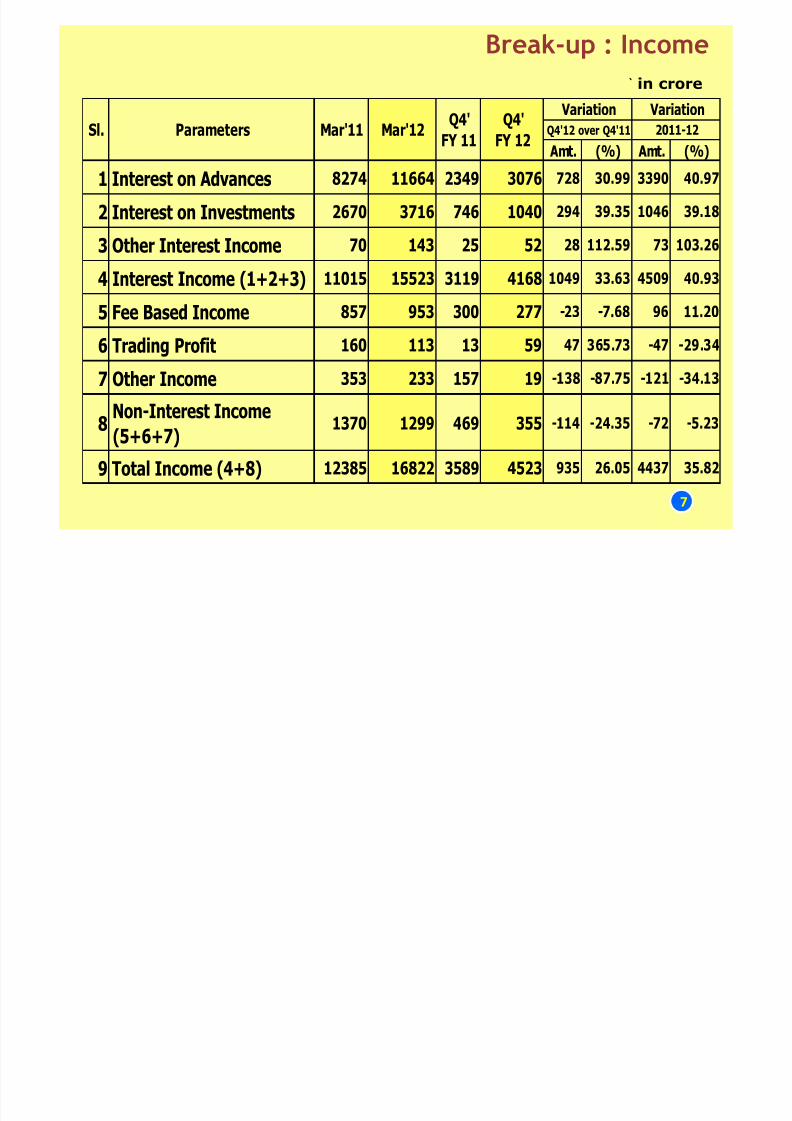
Break-up : Income
` in crore
7
Amt. (%) Amt. (%)
1 Interest on Advances 8274 11664 2349 3076 728 30.99 3390 40.97
2 Interest on Investments 2670 3716 746 1040 294 39.35 1046 39.18
3 Other Interest Income 70 143 25 52 28 112.59 73 103.26
4 Interest Income (1+2+3) 11015 15523 3119 4168 1049 33.63 4509 40.93
5 Fee Based Income 857 953 300 277 -23 -7.68 96 11.20
6 Trading Profit 160 113 13 59 47 365.73 -47 -29.34
7 Other Income 353 233 157 19 -138 -87.75 -121 -34.13
8 Non-Interest Income
(5+6+7) 1370 1299 469 355 -114 -24.35 -72 -5.23
9 Total Income (4+8) 12385 16822 3589 4523 935 26.05 4437 35.82
Variation Variation
Q4'12 over Q4'11 2011-12Sl. Parameters Mar'11 Mar'12 Q4'
FY 11
Q4'
FY 12
8/13/2019 Allahabad Bank Performance Report 31 Mar 12
http://slidepdf.com/reader/full/allahabad-bank-performance-report-31-mar-12 9/35
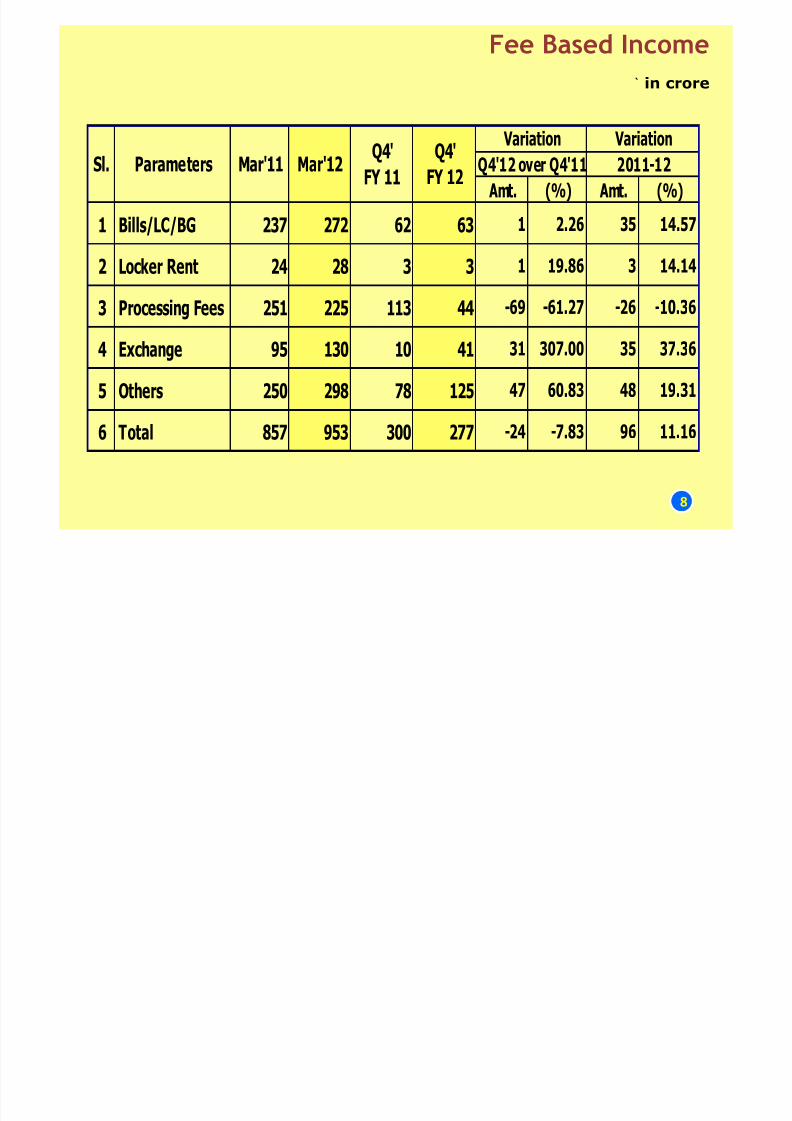
Fee Based Income
` in crore
8
Amt. (%) Amt. (%)1 Bills/LC/BG 237 272 62 63 1 2.26 35 14.57
2 Locker Rent 24 28 3 3 1 19.86 3 14.14
3 Processing Fees 251 225 113 44 -69 -61.27 -26 -10.36
4 Exchange 95 130 10 41 31 307.00 35 37.36
5 Others 250 298 78 125 47 60.83 48 19.31
6 Total 857 953 300 277 -24 -7.83 96 11.16
Q4'
FY 12
Variation Variation
Q4'12 over Q4'11 2011-12Sl. Parameters Mar'11 Mar'12 Q4'
FY 11
8/13/2019 Allahabad Bank Performance Report 31 Mar 12
http://slidepdf.com/reader/full/allahabad-bank-performance-report-31-mar-12 10/35
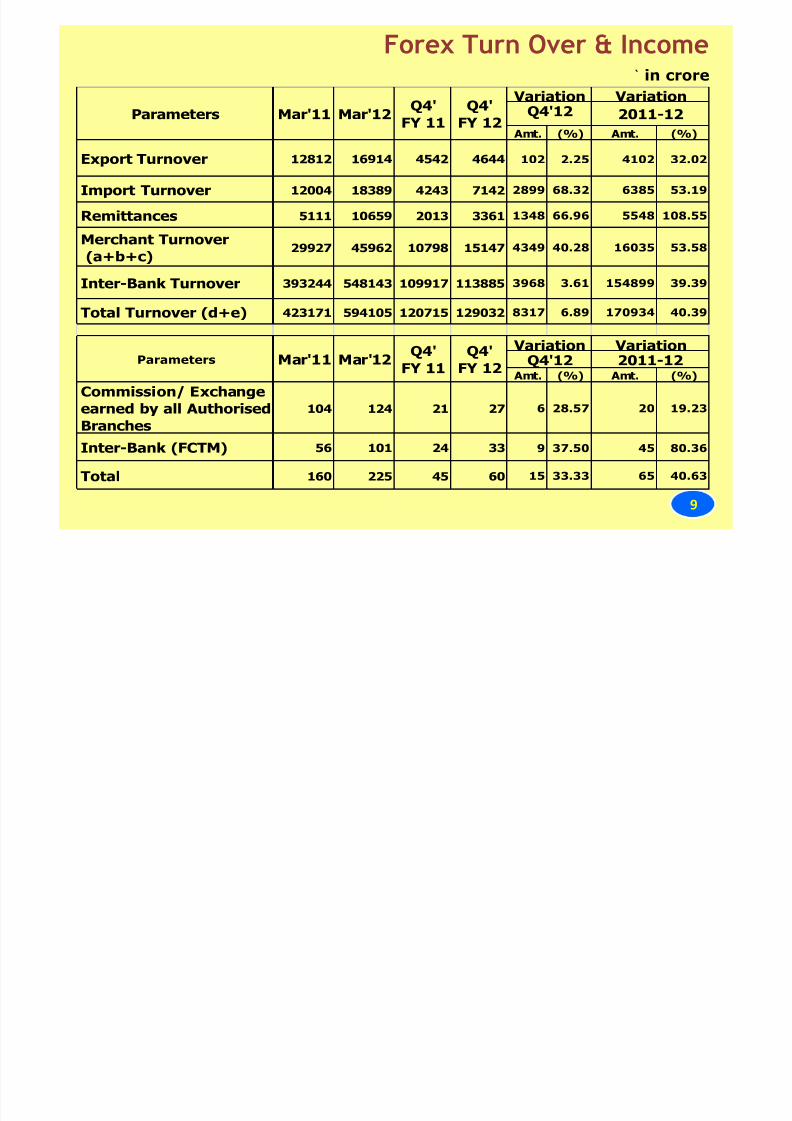
Forex Turn Over & Income` in crore
9
Amt. (%) Amt. (%)
Export Turnover 12812 16914 4542 4644 102 2.25 4102 32.02
Import Turnover12004 18389 4243 7142 2899 68.32 6385 53.19
Remittances 5111 10659 2013 3361 1348 66.96 5548 108.55
Merchant Turnover
(a+b+c)29927 45962 10798 15147 4349 40.28 16035 53.58
Inter-Bank Turnover 393244 548143 109917 113885 3968 3.61 154899 39.39
Total Turnover (d+e) 423171 594105 120715 129032 8317 6.89 170934 40.39
Amt. (%) Amt. (%)
Commission/ Exchangeearned by all Authorised
Branches
104 124 21 27 6 28.57 20 19.23
Inter-Bank (FCTM) 56 101 24 33 9 37.50 45 80.36
Total 160 225 45 60 15 33.33 65 40.63
Parameters Mar'11 Mar'12Q4'
FY 11
Q4'
FY 12
Parameters Mar'11 Mar'12Q4'
FY 11
Q4'
FY 12
Variation VariationQ4'12 2011-12
Variation VariationQ4'12 2011-12
8/13/2019 Allahabad Bank Performance Report 31 Mar 12
http://slidepdf.com/reader/full/allahabad-bank-performance-report-31-mar-12 11/35
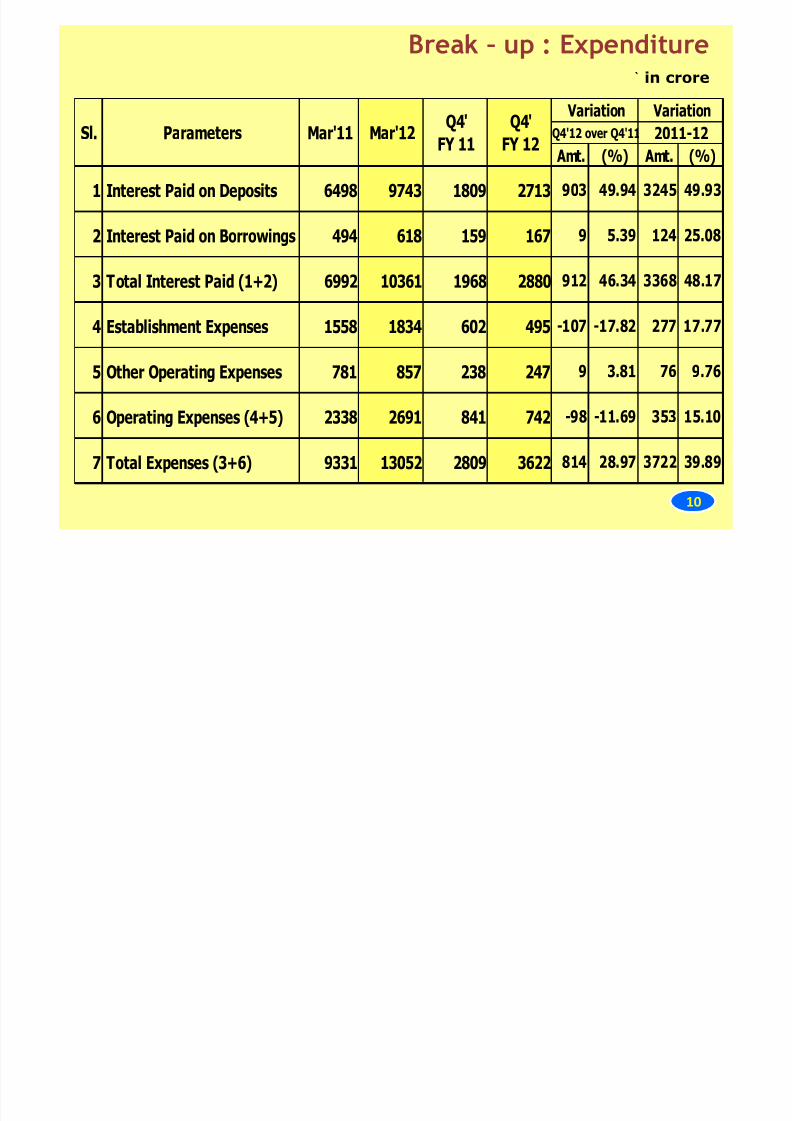
Break – up : Expenditure` in crore
10
Amt. (%) Amt. (%)
1 Interest Paid on Deposits 6498 9743 1809 2713 903 49.94 3245 49.93
2 Interest Paid on Borrowings 494 618 159 167 9 5.39 124 25.08
3 Total Interest Paid (1+2) 6992 10361 1968 2880 912 46.34 3368 48.17
4 Establishment Expenses 1558 1834 602 495 -107 -17.82 277 17.77
5 Other Operating Expenses 781 857 238 247 9 3.81 76 9.76
6 Operating Expenses (4+5) 2338 2691 841 742 -98 -11.69 353 15.10
7 Total Expenses (3+6) 9331 13052 2809 3622 814 28.97 3722 39.89
Variation Variation
Q4'12 over Q4'11 2011-12Sl. Parameters Mar'11 Mar'12 Q4'
FY 11
Q4'
FY 12
8/13/2019 Allahabad Bank Performance Report 31 Mar 12
http://slidepdf.com/reader/full/allahabad-bank-performance-report-31-mar-12 12/35
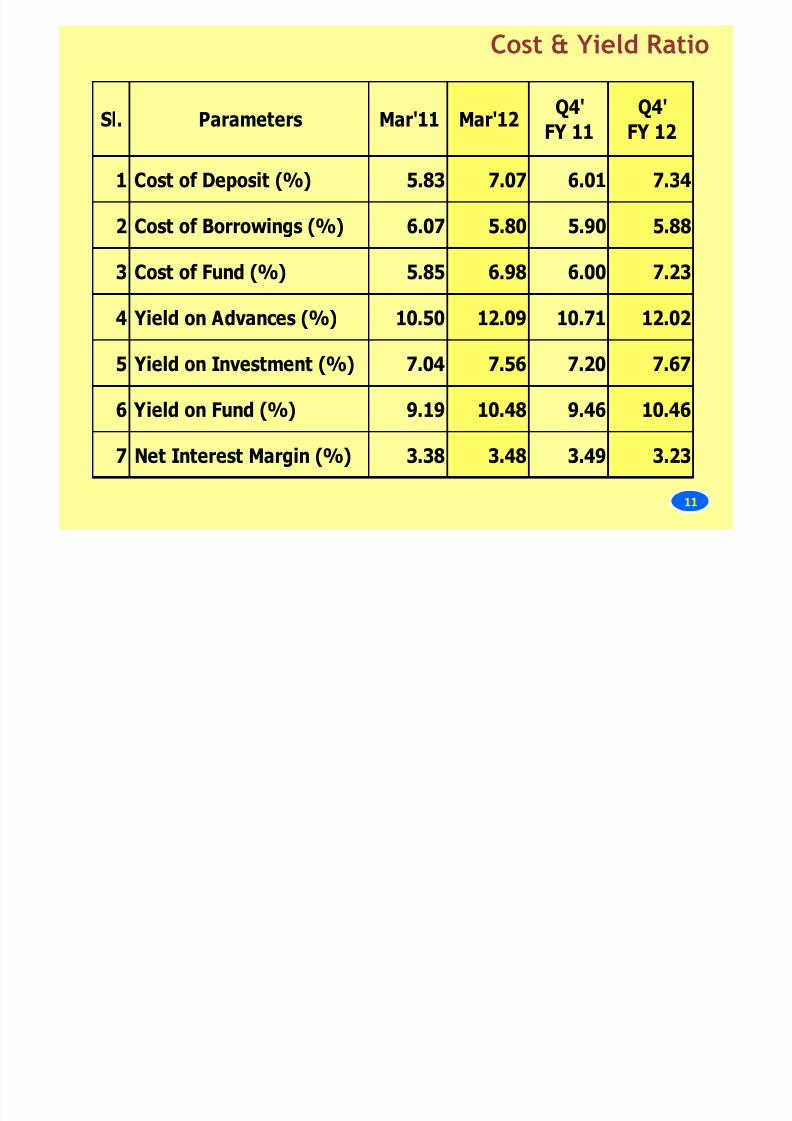
Cost & Yield Ratio
11
1 Cost of Deposit (%) 5.83 7.07 6.01 7.34
2 Cost of Borrowings (%) 6.07 5.80 5.90 5.88
3 Cost of Fund (%) 5.85 6.98 6.00 7.23
4 Yield on Advances (%) 10.50 12.09 10.71 12.02
5 Yield on Investment (%) 7.04 7.56 7.20 7.67
6 Yield on Fund (%) 9.19 10.48 9.46 10.46
7 Net Interest Margin (%) 3.38 3.48 3.49 3.23
Sl. Parameters Mar'11 Mar'12Q4'
FY 11Q4'
FY 12

8/13/2019 Allahabad Bank Performance Report 31 Mar 12
http://slidepdf.com/reader/full/allahabad-bank-performance-report-31-mar-12 13/35
Trend of Net Interest Margin (NIM)
12
2.61
2.88 2.94
3.383.48
2
2.25
2.5
2.75
3
3.25
3.5
F Y
0 8
F Y
0 9
F Y
1 0
F Y
1 1
F Y
1 2
NIM %
‐ Trend

8/13/2019 Allahabad Bank Performance Report 31 Mar 12
http://slidepdf.com/reader/full/allahabad-bank-performance-report-31-mar-12 14/35
Profitability Ratios
13
1 Return on Assets (%) 1.11 1.02 0.74 0.88
2 Return on Networth (%) 21.04 19.35 14.03 16.60
3 Operating Profit to AWF (%) 2.37 2.36 2.24 2.11
4 Cost to Income Ratio (%) 43.36 41.65 51.87 45.17
5 Estab. Exp. to Total Exp. (%) 16.69 14.06 21.45 13.67
6 Operating Exp. to AWF (%) 1.82 1.69 2.42 1.74
7 Book Value Per Share (Rs) 178.64 192.93 178.64 192.93
8Earnings per share (Rs)
(Annualised)31.85 39.18 5.76 8.40
Sl. Parameters Mar'11 Mar'12Q4'
FY 11
Q4'
FY 12
8/13/2019 Allahabad Bank Performance Report 31 Mar 12
http://slidepdf.com/reader/full/allahabad-bank-performance-report-31-mar-12 15/35
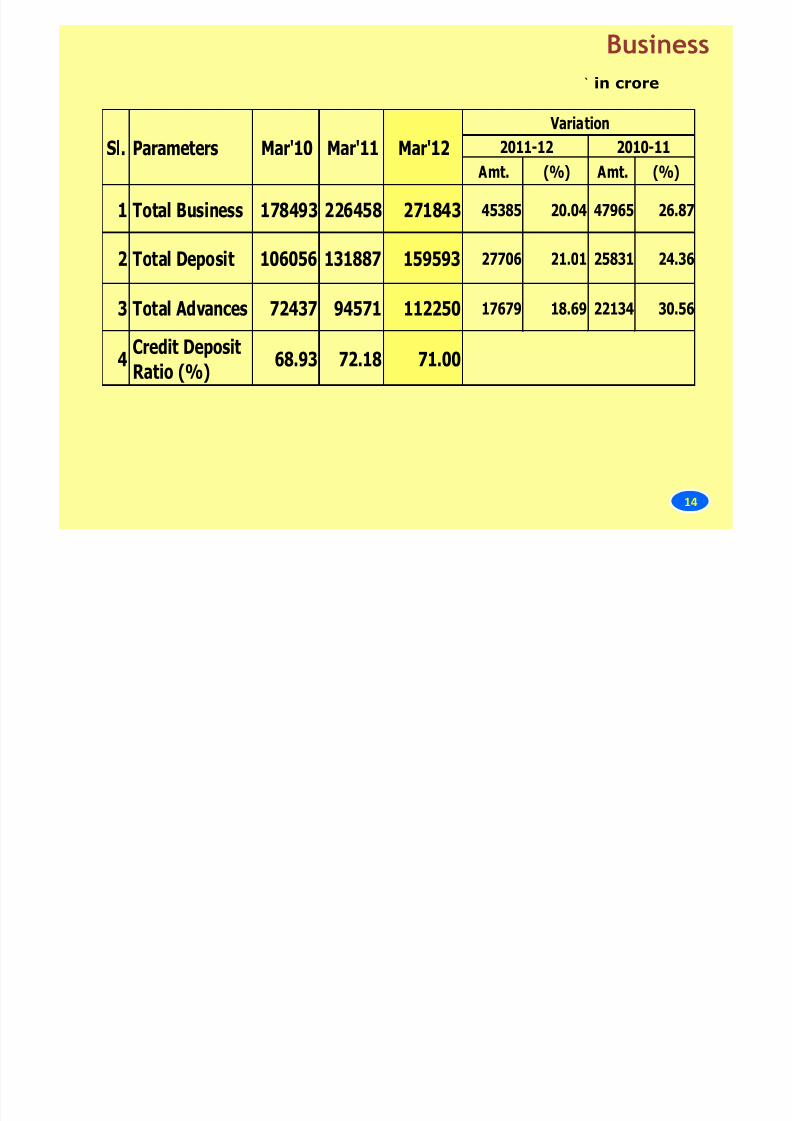
Business
` in crore
14
Amt. (%) Amt. (%)
1 Total Business 178493 226458 271843 45385 20.04 47965 26.87
2 Total Deposit 106056 131887 159593 27706 21.01 25831 24.36
3 Total Advances 72437 94571 112250 17679 18.69 22134 30.56
4 Credit Deposit
Ratio (%) 68.93 72.18 71.00
Sl. Parameters Mar'10 Mar'12
Variation
2011-12 2010-11Mar'11
8/13/2019 Allahabad Bank Performance Report 31 Mar 12
http://slidepdf.com/reader/full/allahabad-bank-performance-report-31-mar-12 16/35
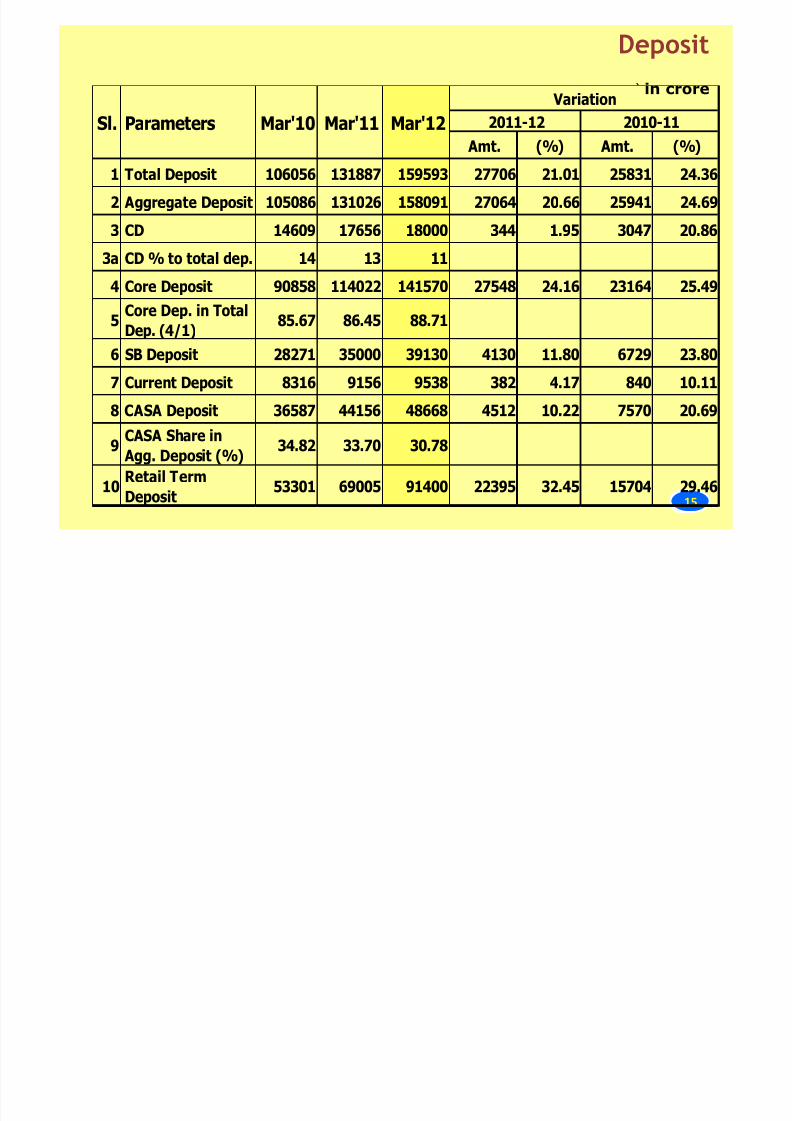
Deposit
` in crore
115
Amt. (%) Amt. (%)
1 Total Deposit 106056 131887 159593 27706 21.01 25831 24.36
2 Aggregate Deposit 105086 131026 158091 27064 20.66 25941 24.69
3 CD 14609 17656 18000 344 1.95 3047 20.86
3a CD % to total dep. 14 13 11
4 Core Deposit 90858 114022 141570 27548 24.16 23164 25.49
5Core Dep. in Total
Dep. (4/1)85.67 86.45 88.71
6 SB Deposit 28271 35000 39130 4130 11.80 6729 23.80
7 Current Deposit 8316 9156 9538 382 4.17 840 10.11
8 CASA Deposit 36587 44156 48668 4512 10.22 7570 20.69
9CASA Share in
Agg. Deposit (%)34.82 33.70 30.78
10
Retail Term
Deposit 53301 69005 91400 22395 32.45 15704 29.46
Sl. Parameters Mar'10 Mar'11 Mar'12 Variation
2011-12 2010-11
8/13/2019 Allahabad Bank Performance Report 31 Mar 12
http://slidepdf.com/reader/full/allahabad-bank-performance-report-31-mar-12 17/35
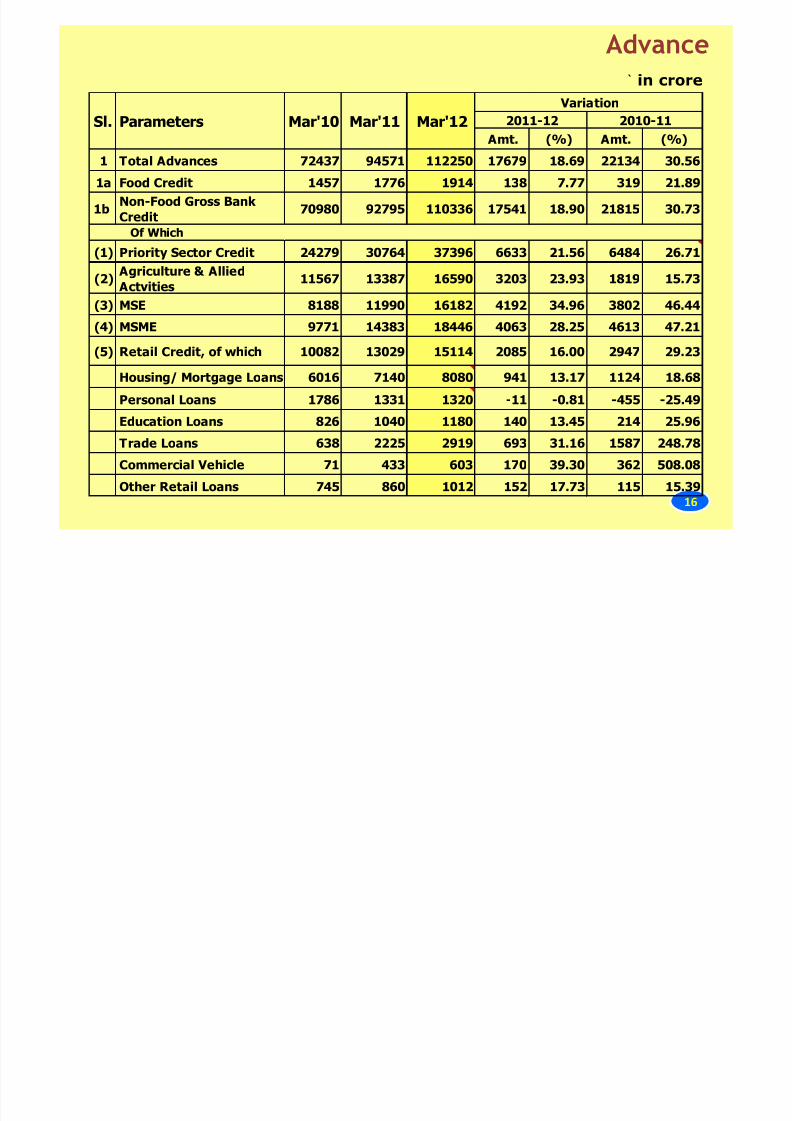
Advance
` in crore
16
Amt. (%) Amt. (%)
1 Total Advances 72437 94571 112250 17679 18.69 22134 30.56
1a Food Credit 1457 1776 1914 138 7.77 319 21.89
1b Non-Food Gross BankCredit
70980 92795 110336 17541 18.90 21815 30.73
(1) Priority Sector Credit 24279 30764 37396 6633 21.56 6484 26.71
(2) Agriculture & Allied
Actvities11567 13387 16590 3203 23.93 1819 15.73
(3) MSE 8188 11990 16182 4192 34.96 3802 46.44
(4) MSME 9771 14383 18446 4063 28.25 4613 47.21
(5) Retail Credit, of which 10082 13029 15114 2085 16.00 2947 29.23
Housing/ Mortgage Loans 6016 7140 8080 941 13.17 1124 18.68
Personal Loans 1786 1331 1320 -11 -0.81 -455 -25.49
Education Loans 826 1040 1180 140 13.45 214 25.96
Trade Loans 638 2225 2919 693 31.16 1587 248.78
Commercial Vehicle 71 433 603 170 39.30 362 508.08
Other Retail Loans 745 860 1012 152 17.73 115 15.39
Of Which
Sl. Parameters Mar'10 Mar'11 Mar'12 Variation
2011-12 2010-11

8/13/2019 Allahabad Bank Performance Report 31 Mar 12
http://slidepdf.com/reader/full/allahabad-bank-performance-report-31-mar-12 18/35
Industry-wise Deployement
` in crore
18
1 Minning & Quarrying 67 0.09 508 0.54 132 0.12
2 Food Processing 1132 1.56 1633 1.73 2725 2.43
3 Textiles 1853 2.56 1877 1.98 3278 2.92
4 Chemical & Chemical Products 2172 3.00 2274 2.40 3974 3.54
4a Cement & Cement Products 341 0.47 467 0.49 588 0.52
5 Basic Metal & Metal products 4638 6.40 6387 6.75 7645 6.81
5a Iron & Steel 4077 5.63 5508 5.82 6351 5.66
6 Engineering Products 3166 4.37 2846 3.01 3334 2.97
7 Infrastructure 12714 17.55 17976 19.01 20380 18.16
7a Power 7433 10.26 12095 12.79 13431 11.97
7b Tele-communication 1651 2.28 746 0.79 666 0.59
Industry
Small Medium & lar e33695 46.52 41742 44.14 49053 43.70
Others 38742 53.48 52829 55.86 63197 56.30
Total Advances 72437 100 94571 100 112250 100
Amt.% of totaladvances
% of totaladvances
Mar'12Sl.
No.
Major Industry wise
Deployment Amt. Amt. % oftotal
advances
Mar'10 Mar'11

8/13/2019 Allahabad Bank Performance Report 31 Mar 12
http://slidepdf.com/reader/full/allahabad-bank-performance-report-31-mar-12 19/35
Investment
` in crore
18
Amt. (%) Amt. (%)
1 Gross Investment 38680 43545 54770 11225 25.78 4864 12.58
2 Held To Maturity (HTM) 23863 28365 36542 8178 28.83 4501 18.86
3 Available For Sale (AFS) 14810 15151 18208 3057 20.18 341 2.30
4 Held For Trading (HFT) 7 29 20 -9 -31.44 22 319.71
5 Duration (AFS+HFT) 2.52 2.65 2.77
6 Modified Duration(AFS+HFT) 2.42 2.53 2.62
7 Total Duration 4.82 4.55 4.33
8 Total Modified Duration 4.64 4.38 4.14
9Net Demand & Time
Liabilities101378 124710 149524 24814 19.90 23331 23.01
10 SLR (%) 30.75 28.28 30.38
11 HTM to SLR (%) 76.56 80.42 80.44
12HTM to Gross
Investment (%)61.69 65.14 66.72
2011-12 2010-11Sl. Parameters Mar'10 Mar'11 Mar'12
0
Variation

8/13/2019 Allahabad Bank Performance Report 31 Mar 12
http://slidepdf.com/reader/full/allahabad-bank-performance-report-31-mar-12 20/35
NPA Ratios
19
1 Net NPA (%) 0.79 0.98
2 Gross NPA (%) 1.74 1.83
3 Provision Coverage Ratio (%) 75.67 74.00
4 Recovery Ratio (%) 49.19 49.74
5 Slippage Ratio (%) 2.21 2.40
Mar'11 Mar'12Sl. Parameters
8/13/2019 Allahabad Bank Performance Report 31 Mar 12
http://slidepdf.com/reader/full/allahabad-bank-performance-report-31-mar-12 21/35
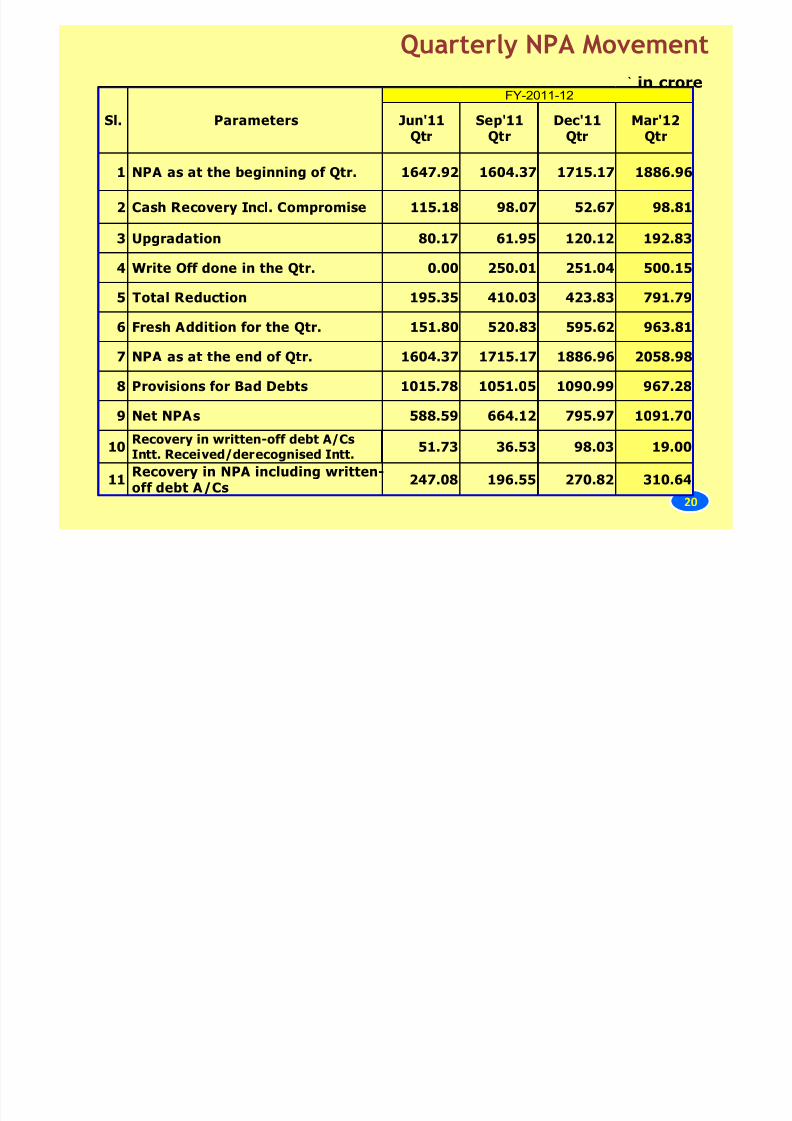
Quarterly NPA Movement
` in crore
20
1 NPA as at the beginning of Qtr. 1647.92 1604.37 1715.17 1886.96
2 Cash Recovery Incl. Compromise 115.18 98.07 52.67 98.81
3 Upgradation 80.17 61.95 120.12 192.83
4 Write Off done in the Qtr. 0.00 250.01 251.04 500.15
5 Total Reduction 195.35 410.03 423.83 791.79
6 Fresh Addition for the Qtr. 151.80 520.83 595.62 963.81
7 NPA as at the end of Qtr. 1604.37 1715.17 1886.96 2058.98
8 Provisions for Bad Debts 1015.78 1051.05 1090.99 967.28
9 Net NPAs 588.59 664.12 795.97 1091.70
10Recovery in written-off debt A/CsIntt. Received/derecognised Intt.
51.73 36.53 98.03 19.00
11Recovery in NPA including written-
off debt A/Cs
247.08 196.55 270.82 310.64
Sl. Sep'11Qtr
Dec'11Qtr
Mar'12Qtr
FY-2011-12
Jun'11Qtr
Parameters

8/13/2019 Allahabad Bank Performance Report 31 Mar 12
http://slidepdf.com/reader/full/allahabad-bank-performance-report-31-mar-12 22/35
Movements of NPA
` in crore
21
1NPA as at the beginning of
Yr./Qr.1221.80 1647.92
2 Cash Recovery Incl. Compromise 275.92 364.73
3 Upgradation 325.13 455.07
4 Write Off 719.90 1001.20
5 Total Reduction 1320.95 1821.00
6 Fresh Addition 1747.07 2232.06
7 NPA as at the end of Year 1647.92 2058.98
8 Provisions 911.55 967.28
9 Net NPAs 736.37 1091.70
10Recovery in written-off debt A/Cs
Intt. Received/derecognised Intt.328.11 205.29
11Recovery in NPA including
written-off debt A/Cs929.16 1025.09
Sl. Parameters Mar'11 Mar'12

8/13/2019 Allahabad Bank Performance Report 31 Mar 12
http://slidepdf.com/reader/full/allahabad-bank-performance-report-31-mar-12 23/35
Restructured Accounts
` in crore
22
No. Amt. No. Amt. No. Amt.
1 Below Rs. 1 Crore 51265 1154 51265 1154 12461 390
2 Rs. 1 Crore & above 312 8134 312 8134 227 5963
3 Total 51577 9288 51577 9288 12688 6353
4 Out of which up to 31.03.2011 44267 4847 44267 4847 5383 1913
5 Out of which during 2011-12 7305 4440 7305 4440 7305 4440
5a During Apr-Dec'11 5924 1800 5924 1800 5924 1800
5b During Jan-Mar'12 1381 2640 1381 2640 1381 2640
6 Standard 50737 9129 50737 9129 10711 5964
7 NPA 840 158 840 158 1977 389
Outstanding as on31.03.12
Sl. Particulars
ApplicationReceived
Sanctioned
8/13/2019 Allahabad Bank Performance Report 31 Mar 12
http://slidepdf.com/reader/full/allahabad-bank-performance-report-31-mar-12 24/35
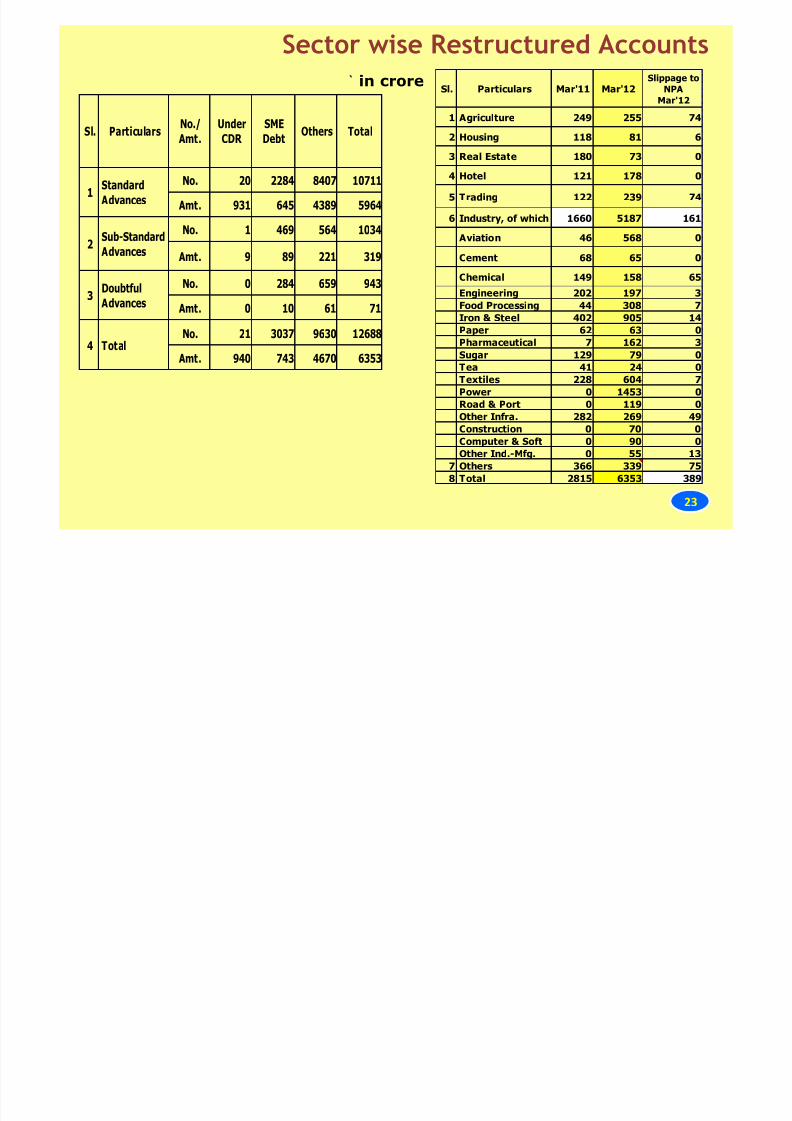
Sector wise Restructured Accounts
` in crore
23
No. 20 2284 8407 10711
Amt. 931 645 4389 5964
No. 1 469 564 1034
Amt. 9 89 221 319
No. 0 284 659 943
Amt. 0 10 61 71
No. 21 3037 9630 12688
Amt. 940 743 4670 6353
No./
Amt.
Under
CDR
Sub-Standard
Advances
Standard
Advances
SME
Debt
4 Total
Others
Doubtful
Advances3
Total
1
2
Sl. Particulars
Sl. Particulars Mar'11 Mar'12Slippage to
NPA
Mar'12
1 Agriculture 249 255 74
2 Housing 118 81 6
3 Real Estate 180 73 0
4 Hotel 121 178 0
5 Trading 122 239 74
6 Industry, of which 1660 5187 161
Aviation 46 568 0
Cement 68 65 0
Chemical 149 158 65
Engineering 202 197 3Food Processing 44 308 7
Iron & Steel 402 905 14
Paper 62 63 0
Pharmaceutical 7 162 3
Sugar 129 79 0
Tea 41 24 0
Textiles 228 604 7
Power 0 1453 0Road & Port 0 119 0
Other Infra. 282 269 49
Construction 0 70 0
Computer & Soft 0 90 0
Other Ind.-Mfg. 0 55 13
7 Others 366 339 75
8 Total 2815 6353 389
8/13/2019 Allahabad Bank Performance Report 31 Mar 12
http://slidepdf.com/reader/full/allahabad-bank-performance-report-31-mar-12 25/35
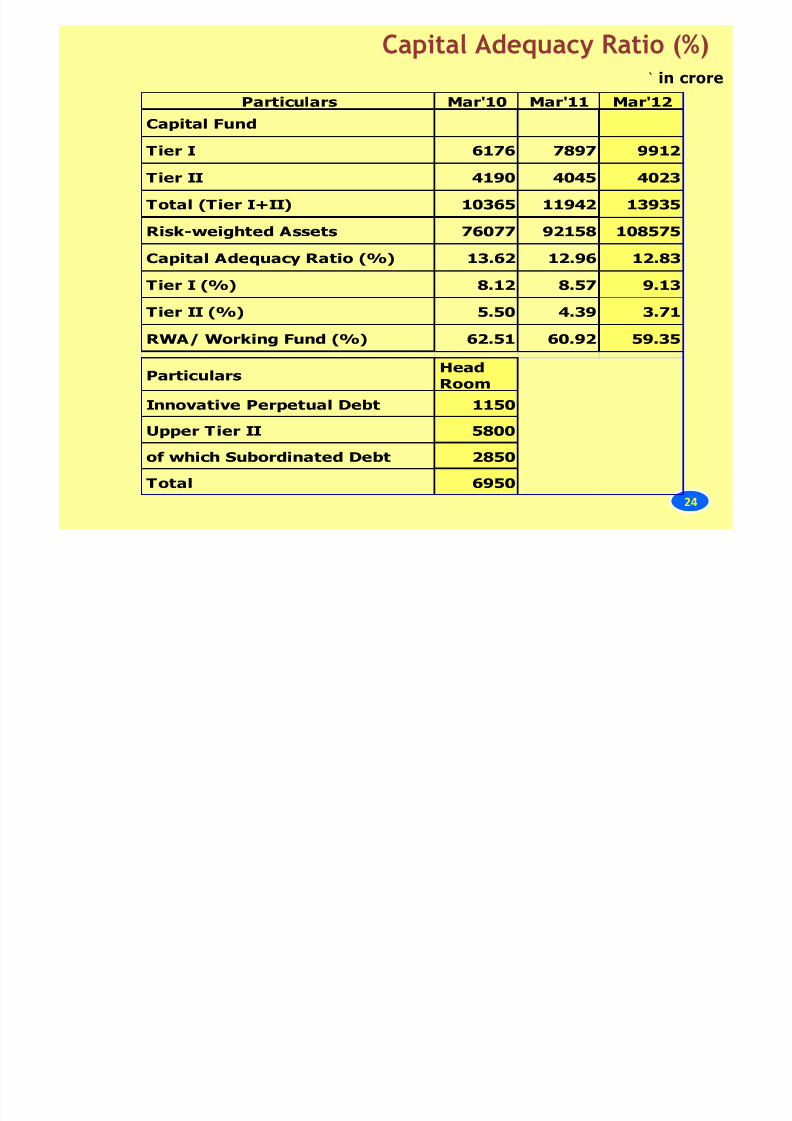
Capital Adequacy Ratio (%)` in crore
24
Particulars Mar'10 Mar'11 Mar'12Capital Fund
Tier I 6176 7897 9912
Tier II 4190 4045 4023
Total (Tier I+II) 10365 11942 13935
Risk-weighted Assets 76077 92158 108575
Capital Adequacy Ratio (%) 13.62 12.96 12.83
Tier I (%) 8.12 8.57 9.13
Tier II (%) 5.50 4.39 3.71
RWA/ Working Fund (%) 62.51 60.92 59.35
ParticularsHead
Room
Innovative Perpetual Debt 1150
Upper Tier II 5800
of which Subordinated Debt 2850
Total 6950
8/13/2019 Allahabad Bank Performance Report 31 Mar 12
http://slidepdf.com/reader/full/allahabad-bank-performance-report-31-mar-12 26/35
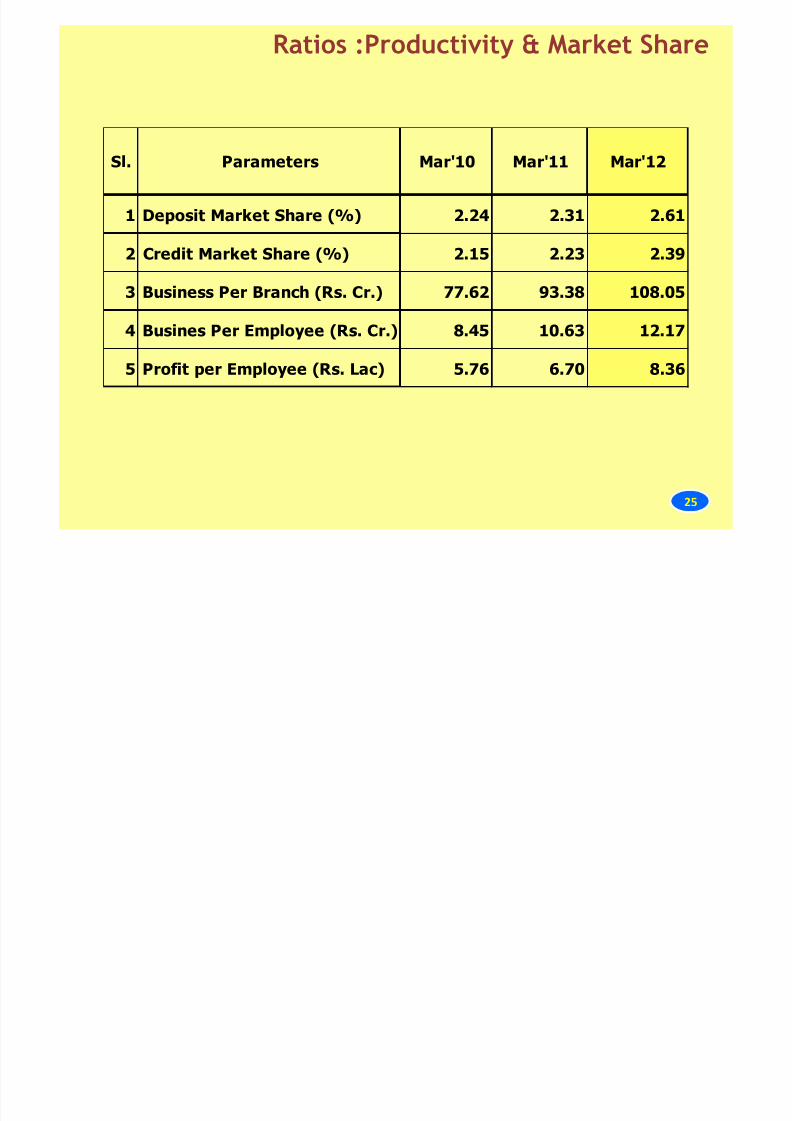
Ratios :Productivity & Market Share
25
1 Deposit Market Share (%) 2.24 2.31 2.61
2 Credit Market Share (%) 2.15 2.23 2.39
3 Business Per Branch (Rs. Cr.) 77.62 93.38 108.05
4 Busines Per Employee (Rs. Cr.) 8.45 10.63 12.17
5 Profit per Employee (Rs. Lac) 5.76 6.70 8.36
Mar'12Sl. Parameters Mar'10 Mar'11
P d i i

8/13/2019 Allahabad Bank Performance Report 31 Mar 12
http://slidepdf.com/reader/full/allahabad-bank-performance-report-31-mar-12 27/35
Productivity
77.62
93.38
108.05
8.45
10.6312.17
2
4
6
8
10
12
14
20
30
40
50
60
70
80
90
100
110
Mar'10 Mar'11 Mar'12Business per Branch Business per Employee
26
Sh h ldi P tt (A 31 03 2012)
8/13/2019 Allahabad Bank Performance Report 31 Mar 12
http://slidepdf.com/reader/full/allahabad-bank-performance-report-31-mar-12 28/35
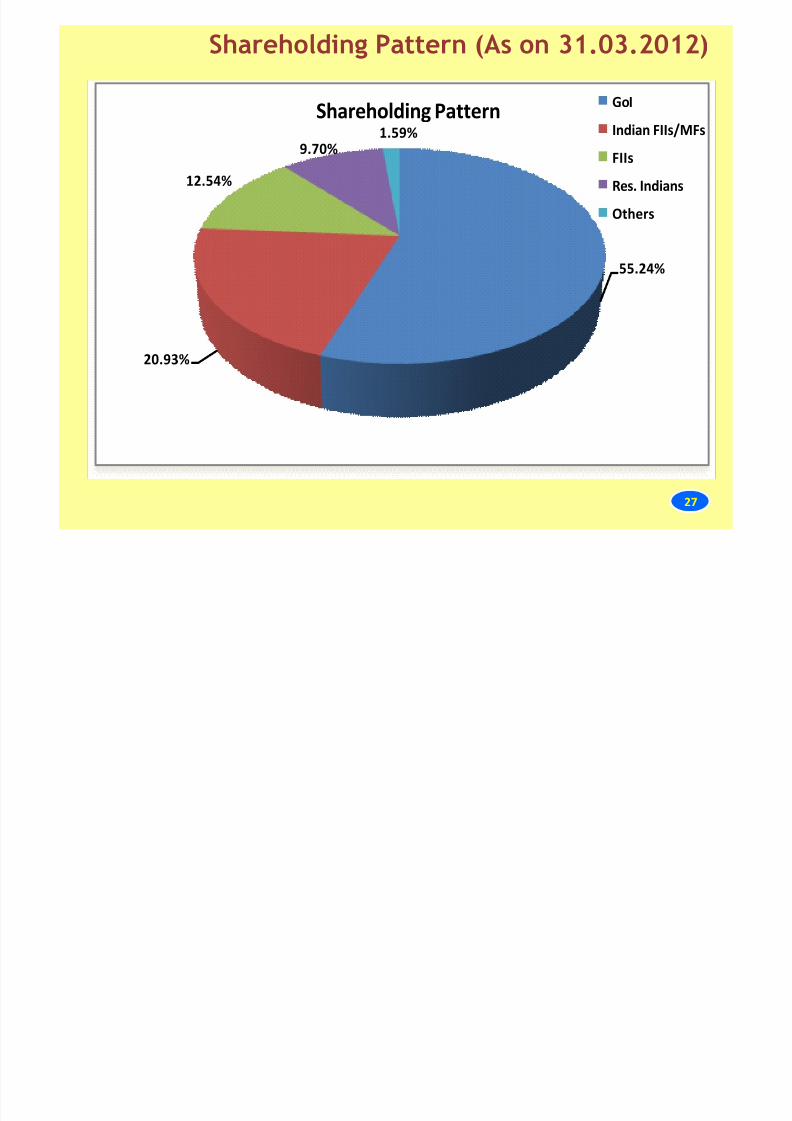
Shareholding Pattern (As on 31.03.2012)
27
55.24%
20.93%
12.54%
9.70%1.59%
Shareholding Pattern GoI
Indian FIIs/MFs
FIIs
Res. Indians
Others
8/13/2019 Allahabad Bank Performance Report 31 Mar 12
http://slidepdf.com/reader/full/allahabad-bank-performance-report-31-mar-12 29/35
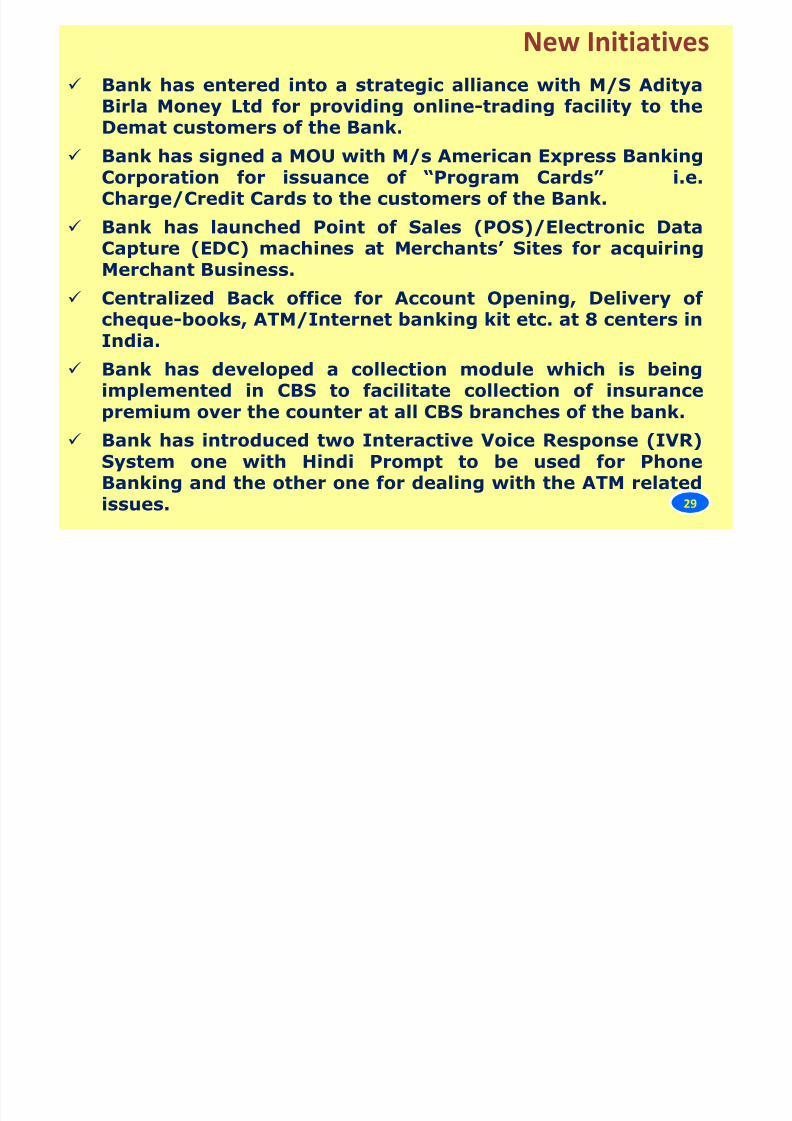
New Initiatives
8/13/2019 Allahabad Bank Performance Report 31 Mar 12
http://slidepdf.com/reader/full/allahabad-bank-performance-report-31-mar-12 30/35
New Initiatives
30
Bank has entered into a strategic alliance with M/S Aditya
Birla Money Ltd for providing online-trading facility to theDemat customers of the Bank.
Bank has signed a MOU with M/s American Express BankingCorporation for issuance of “Program Cards” i.e.
Charge/Credit Cards to the customers of the Bank. Bank has launched Point of Sales (POS)/Electronic Data
Capture (EDC) machines at Merchants’ Sites for acquiringMerchant Business.
Centralized Back office for Account Opening, Delivery ofcheque-books, ATM/Internet banking kit etc. at 8 centers inIndia.
Bank has developed a collection module which is being
implemented in CBS to facilitate collection of insurancepremium over the counter at all CBS branches of the bank.
Bank has introduced two Interactive Voice Response (IVR)System one with Hindi Prompt to be used for PhoneBanking and the other one for dealing with the ATM relatedissues. 29
New Initiatives
8/13/2019 Allahabad Bank Performance Report 31 Mar 12
http://slidepdf.com/reader/full/allahabad-bank-performance-report-31-mar-12 31/35
New Initiatives
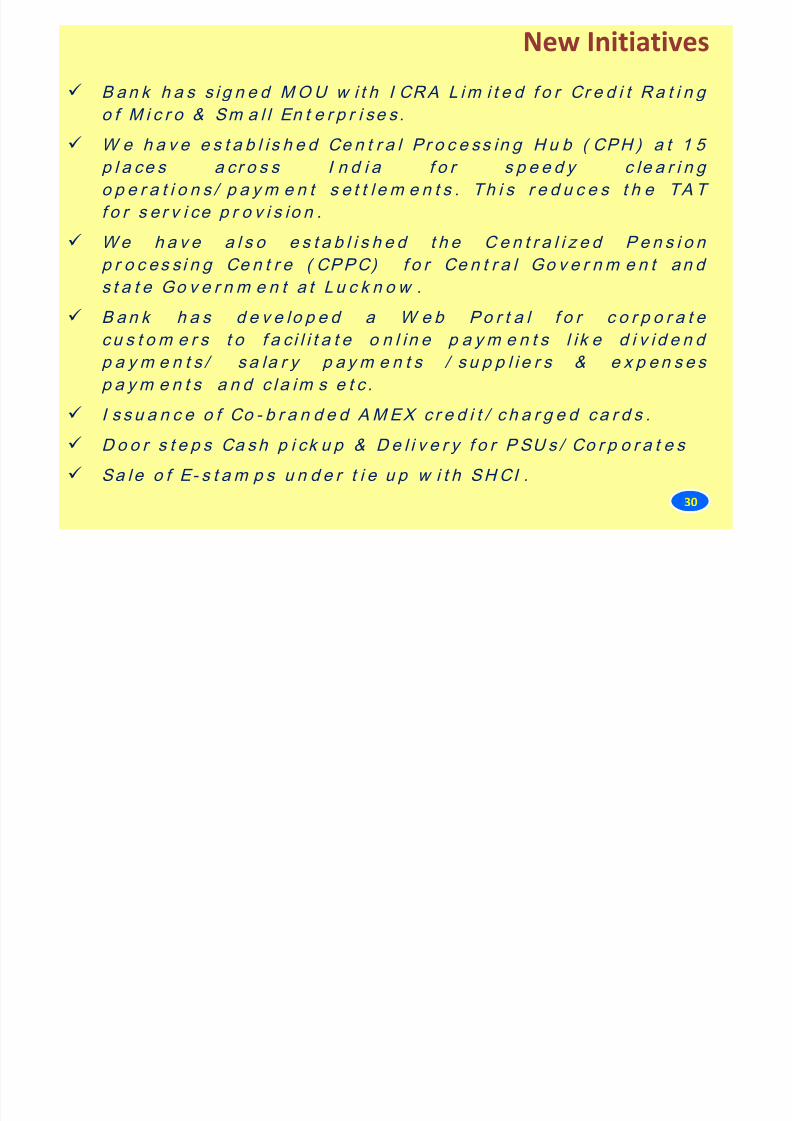
B an k h a s s i g n e d MOU w i t h I CRA L im i t e d f o r Cr e d i t Ra t i n g
o f M i c r o & Sm a l l En t e r p r i se s .
W e h a v e e s t a b l i s h e d Ce n t r a l Pr o c e ss in g H u b ( CPH ) a t 1 5
p l a ce s a cr o s s I n d i a f o r s p e e d y c le a r i n g
o p e r a t i o n s / p a y m e n t s e t t l e m e n t s . Th i s r e d u c e s t h e TA T
f o r s e r v i ce p r o v i s io n .
We h a v e a l s o e s t a b l i s h e d t h e C e n t r a l i z e d P e n s i o n
p r o c es s i n g Ce n t r e ( CPPC) f o r Ce n t r a l Go v e r n m e n t an d
s t a t e Go v e r n m e n t a t Lu c k n o w .
B an k h a s d e v e lo p e d a W e b Po r t a l f o r c o r p o r a t e
cu s t o m e r s t o f a c i l i t a t e o n l i n e p a y m e n t s l i k e d i v i d e n d
p a y m e n t s / s a la r y p a y m e n t s / s u p p l i e r s & e x p e n s e s
p a y m e n t s a n d c l a im s e t c .
I s s u a n c e o f Co - b r a n d e d AMEX c r e d i t / c h a r g e d ca r d s .
D o o r s t e p s Ca sh p i ck u p & D e l i v e r y f o r P SU s / Co r p o r a t e s
Sa le o f E- s t a m p s u n d e r t i e u p w i t h SHCI .
30
Financial Inclusion

8/13/2019 Allahabad Bank Performance Report 31 Mar 12
http://slidepdf.com/reader/full/allahabad-bank-performance-report-31-mar-12 32/35
Financial Inclusion
B a n k h a s co v e r e d a l l t h e 2 6 1 8 a l l o t t e d v i l l a g e s a s o n
M a r c h ’ 1 2 b y w a y o f o p e n i n g f u l l s c a le B r i ck & M o r t a r
b r a n c h e s in 3 0 v i l l a g e s , Sa t e l l i t e b r a n c h e s in 4 v i l l a g e s
a n d o p e r a t i n g m o b i le b r a n ch e s i n 2 2 v i l l a g e s a n d
o p e n i n g BC o u t l e t s i n a l l r e m a in i n g 2 5 6 2 v i l l a g e s .
D u r i n g FY2 0 1 2 , 6 7 3 0 2 9 n o f r i l l a c c o u n t s h a v e b e e n
o p e n e d i n F I im p l em e n t e d v i l l a g e s . 1 5 9 8 4 3 N o F r i l l s
a cco u n t s o p e n e d t h r o u g h B u s in e s s Co r r e s p o n d e n t s u p t o
M a r c h ’ 1 2 .
N o . o f sm a r t c a r d s i s su e d u p t o M a r c h ’ 1 2 i n t h e FI v i l l a g e s
i s 1 3 1 5 8 0 .
B an k h a s co m p l e t e d t h e t o t a l e n r o lm e n t o f 3 , 8 0 ,0 9 3 U I D
o u t o f w h i ch 2 ,2 4 , 0 0 9 U I D n u m b e r s h a v e b ee n i s s u e d t o
r e s i d e n t s .
B an k h a s o p e n e d 1 4 8 U l t r a Sm a l l B r a n c h e s o n t h e
B an k ’ s f o u n d a t i o n d a y o f 2 4 t h A p r i l 2 0 1 2 i n t h e S t a t e s o f
U .P , W .B , Jh a r k h a n d a n d U t t a r a k h a n d .31
Accolades & Achievements
8/13/2019 Allahabad Bank Performance Report 31 Mar 12
http://slidepdf.com/reader/full/allahabad-bank-performance-report-31-mar-12 33/35
Accolades & Achievements
32
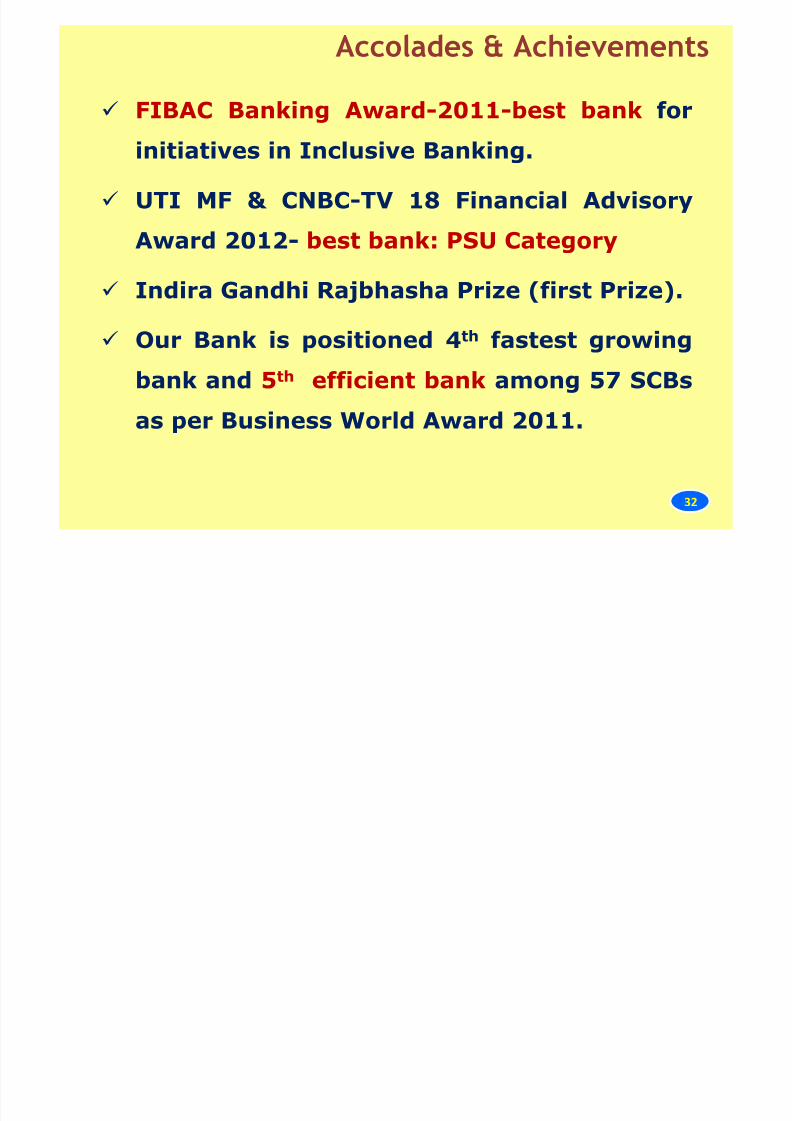
FIBAC Banking Award-2011-best bank for
initiatives in Inclusive Banking.
UTI MF & CNBC-TV 18 Financial Advisory
Award 2012- best bank: PSU Category
Indira Gandhi Rajbhasha Prize (first Prize).
Our Bank is positioned 4th fastest growing
bank and 5th efficient bank among 57 SCBs
as per Business World Award 2011.
Guidence

8/13/2019 Allahabad Bank Performance Report 31 Mar 12
http://slidepdf.com/reader/full/allahabad-bank-performance-report-31-mar-12 34/35
Guidence
33
B u s in e ss P r o j e c t i o n f o r M a r c h 2 0 1 3 -
B u s i n e s s Rs . 3 ,3 0 ,0 0 0 c r o r e s
D e p o s i t Rs .1 ,9 2 ,0 0 0 c r o r e s
A d v a n ce s Rs .1 ,3 8 ,0 0 0 c r o r e s

8/13/2019 Allahabad Bank Performance Report 31 Mar 12
http://slidepdf.com/reader/full/allahabad-bank-performance-report-31-mar-12 35/35
Thank You
34