all set for pillar 3 - pwc: audit and assurance ... · pwc all set for pillar 3 5 external audit”...
TRANSCRIPT

All set for Pillar 3
www.pwc.com/insurance
Managing the final preparations for the Solvency II reporting and disclosure requirements.
September 2015


PwC All set for Pillar 3 3
Contents
Foreword: 04Ready for the final push
Executive summary 06
The new reporting: 08 Turning information into insight
Ready for the final push: 14 Overview of full requirements for Pillar 3
Easing the demands: 22 How to make a clear case for applying proportionality and materiality
Qualitative reporting: 27 Getting to the right level of detail and explanation
Getting there quicker: 30 Making the most of the ‘best effort’ option in quarterly reporting
Seeking assurance: 34 Audit requirements for Pillar 3
Accelerate and adapt: 38 How the right IT can make your life easier
Sustainable footing: 41 Moving from implementation to business as usual
One reality: 45IFRS and Solvency II
Contacts 49

PwC All set for Pillar 34
Foreword: Ready for the final push
The paper is a follow-up to ‘Getting to grips with Pillar 3’1, which we published in January 2013. We now have clarity over what is expected under Pillar 3 following the publication of a second set of Implementing Technical Standards (ITS) and Guidelines for Solvency II by the European Insurance and Occupational Pensions Authority (EIOPA) in July 2015. Therefore, your business can now approach the final stretch to implement the full package.
Since 2013, the focus on what had been the forgotten pillar in many organisations has also greatly increased. Along with the adequacy of reporting, key considerations include how the Pillar 3 disclosures will influence the way your company is judged by the financial markets. It’s also important to look at how to turn investment in new risk and capital evaluation capabilities into a more informed basis for decision making, drawing on the new and more detailed data made available by the implementation of Solvency II.
Over the line in timeIn this paper, we outline the final requirements for Pillar 3 and how to ensure your business is set up to comply in the most efficient and cost-effective way. This includes an overview of the data and systems requirements needed to put reporting on a sustainable footing and the considerations for choosing the right IT options for your business, both now and in the future. It also includes how to make the most of proportionality, materiality and ‘best efforts’ bases, along with information already in place for statutory financial reporting and other aspects of Solvency II such as the Own Risk and Solvency Assessment (ORSA). While applying these ‘labour savers’ can speed up delivery and greatly reduce the demands on key personnel, you will need to make a clear case to your supervisor to justify their use. A key part of this paper therefore looks at what supervisors expect and how you can convince them that your approach is valid.
Shaping public disclosuresAnalysts and investors are already taking a keen interest in what the Solvency II numbers and risk and capital strategies that surround them mean for the performance and prospects of your business. Pillar 3 brings a lot of new information into the public domain for the first time. It’s also going to open up return on capital, risk sensitivities and reserving strategies to much greater scrutiny and comparison. In turn, there may be market pressure to disclose more information and drill deeper into the areas you’re required to report publicly, especially among large international insurers. As we explore in this paper, it’s important to consider how your business will come across under these new public disclosures and how to respond to market
Welcome to ‘All set for Pillar 3’. Drawing on our wide-ranging work with clients and discussions with supervisors, the paper looks at how to manage the final preparations for the Solvency II reporting and disclosure requirements (Pillar 3) and begin the transition from implementation to business as usual.
1 http://www.pwc.com/gx/en/insurance/solvency-ii/getting-to-grips-with-pillar-3.jhtml

PwC All set for Pillar 3 5
external audit” in July 20152. EIOPA believes that external audit can be a “powerful tool” in ensuring high quality public disclosure and that the balance sheet, own funds and capital requirements could fall within its scope.
As no EU legislation is in place, the level of required external audit will continue to be set by national legislation and differ from country to country.
We look at how the requirements are likely to vary and what additional review may be demanded by boards, analysts and investors.
Moving to business as usualWhile most of the focus is on initial compliance, the new processes and activities will change operational demands over the long-term and will need to become part of business as usual. We close this report by looking at how to turn Pillar 3 from an implementation project into an ‘industrialised’ process and how your business can begin planning for this now.
If you have any queries or would like to discuss any of the issues in more detail, please speak to your usual PwC contact or one of the authors listed on page 49.
Jim BichardEMEA Insurance Regulatory Leader Partner, PwC (UK)
pressure for more detail. It’s also important to look closely at how the decisions being made for Solvency II in areas such as target solvency ratios, the management of capital demands and the application of long-term guarantee measures will affect your reported earnings and funds available for investment and dividend payments.
Insights into the businessInternally, Pillar 3 information could join with the evaluations being developed for the ORSA to form the basis for a more risk-sensitive and forward-looking ‘economic’ view of your business and create a clearer link between solvency, strategy and performance. We look at how to develop the key performance indicators from Pillar 3 data and how these can be integrated with existing management reporting needed to bring this economic perspective to life and build it into the strategy and direction of your business.
Comfort over the numbersFurther considerations include how to gain comfort around the numbers you’re reporting. While some of the information may have been generated for Solvency II purposes or used in internal actuarial evaluations, it hasn’t been publicly disclosed before. There is no EU legislation in place setting a minimum standard on external audit, but EIOPA published a document on the “Need for high quality public disclosure: Solvency II’s report on solvency and financial condition and the potential role of
2 Source: https://eiopa.europa.eu/Publications/Other%20Documents/EIOPA_high%20quality%20public%20disclosure_Solvency%20II.pdf
In this paper, we outline the very near final requirements for Pillar 3 and how to ensure your business is set up to comply in the most efficient and cost-effective way.

PwC All set for Pillar 36
Executive summary
1 While Pillar 3 is a huge implementation challenge, there can be a payback
The Solvency II disclosure requirements (Pillar 3) will require your business to report more information, more quickly and with much greater scrutiny than ever before. The tight turnaround times and level of data and analysis that need to be reported present a significant operational hurdle over and above what is required for the other two pillars. But there are also opportunities to use the required investment to improve the quality, reliability and timeliness of management information.
2 Analysts are looking to Pillar 3 to bring greater insight and comparability to insurance reporting
Insurance reporting has long been subject to a patchwork of different local regulations and evaluation techniques, which makes businesses difficult to rate and compare. Therefore, one of the reasons why many analysts are taking such a keen interest in Pillar 3 is that the balance sheet is subject to prescriptive and uniform rules. This makes the numbers uniquely comparable, albeit more volatile than many of the measures currently used.
The new public disclosures will shed particular light on the capital intensity and risk sensitivities within your business, which analysts can use as part of their evaluations of the eventual returns. It’s important to consider how your business will come across under these new public disclosures and what further information and explanation analysts may be
interested in beyond what is required under the regulations.
The new disclosures create challenges. But they could also make insurance easier to understand and rate and hence overcome some of the uncertainty and lack of comparability that can hold back share values within the industry.
3 Partnership with asset managers is essential
A significant amount of the data for Pillar 3 has to come from asset managers. It’s important to ensure that they understand what’s required and how quickly. These demands are likely to form an important element of future tenders.
4 It’s not too late to improve IT From data supply, through to consolidation,
validation and preparation in the required format, the demands on technology are extensive and will increase based on upcoming other requirements like IFRS 9 and 4. While the time until Solvency II goes live is limited, there are solutions available that could take six months or less to implement. However, it’s important to recognise that there is no off-the-shelf solution that can take care of all your Pillar 3 needs. Vendors are offering a range of packages they say are comprehensive. But most only really cover the reporting stage of the process, which is just the tip of the iceberg. Underneath are the extraction and adjustment of vast reams of data from multiple sources.

PwC All set for Pillar 3 7
5 Boards must take an active role in determining capital strategy
Solvency II is expected to make return on capital a more visible and prominent performance measure. It’s therefore vital that your board understands the business impact and actively takes the lead in decisions over capital strategy. Decisions over solvency ratio levels will also affect the trajectory of returns and the funds available for investment. Boards therefore need to be up-to-speed with the assumptions, adjustments and other management actions that shape the capital numbers.
6 Pillar 3 can form part of a comprehensive economic basis for steering the business
The breadth, detail and economic lens of the Pillar 3 reporting (notably within the QRTs) would provide the source for a number of valuable and market comparable key performance indicators (KPIs). This information can then be brought together with statutory financial reporting and other elements of Solvency II, the ORSA in particular, to create a more integrated, economic and forward-looking approach to risk, capital and performance management.
7 Audit requirements will differ by country
EIOPA is calling for high quality public disclosures including the use of external audit, but no minimum standard on audit requirements is in place. That means the local legislation will cover this by defining different scopes and approaches, creating considerable challenges for groups working across different territories.
8 Early moves to build Pillar 3 into business as usual will pay dividends
While most of the focus is on initial compliance, Pillar 3 will eventually need to become part of business as usual (BAU). An efficient shift from implementation to BAU can help to bolster regulatory confidence, curb needless cost and disruption and realise the full business benefits of your investment in new information systems. The basis for building Pillar 3 into BAU is a clear transition plan, which can be prepared while implementation is being finalised. The blueprint for BAU should include a mandate for delivery from the board, assignment of ownership for key deliverables and tangible targets against which to measure progress.
Chapter 1
The new reporting: Turning information into insight
The advent of Solvency II means that for the first time there will be a common standard to measure risks and evaluate assets and liabilities on an economic basis across the European Economic Area (EEA).
From a management reporting perspective, Pillar 3 would ideally form part of a comprehensive economic basis for steering the business. The breadth, detail and economic lens of the Pillar 3 reporting, notably within the quantitative reporting templates (QRTs), would provide the source for a number of valuable and market comparable key performance indicators (KPIs). This information can then be brought together with statutory financial reporting and other elements of Solvency II, the ORSA in particular, to create a more integrated, economic and forward-looking approach to risk, capital and performance management.
Some insurers have already built economic capital or embedded value measures into their KPIs and decision making. But most businesses, especially small and mid-size enterprises, haven’t. The extent to which an economic view is taken into consideration is generally limited (e.g. only when the business is under-capitalised), rather than being used to analyse the impact on certain
management decisions. The primary basis for decision making tends to be what’s happened rather than what’s coming up, which can slow down the response to emerging opportunities and threats.
As Figure 1 outlines, the Solvency II numbers can provide a clearer link between solvency, strategy and performance, in which the capital implications of risk are fully reflected in measures of return and cost. You can not only use this framework to better align risk, capital and performance reporting, but also bring this information to life by providing tangible answers to some of the fundamental strategic questions that all boards grapple with. These include determining the link between your exposures, expected returns and the capital needed to support them and judging how the performance of various areas of the business compares when capital demands are taken into account.
Capital can be measured as a lost opportunity as well as funding cost, which evaluates such factors as the excess of assets over liabilities and the transferability of own funds. The result is a better understanding of your capital efficiency relative to your peers. You can gain valuable insights into the detail of your cash flows, your reinsurance coverage and its performance. You can also evaluate the capital dependencies that influence costs and returns in particular areas of your business and the capital implications of developments such as stressed scenarios and alternative plans more effectively. The result would be a more informed approach to pricing, business development and the targeting of investment, along with reinsurance evaluation and buying. The quality of data and effectiveness of your information systems are clearly critical in making the most of these opportunities.
The Solvency II disclosures are set to bring a considerable amount of new information into the public domain for the first time and join IFRS/local GAAP as the main source of company information for investors. Pillar 3 could thus change the way your performance is judged by the markets and how your management thinks about the business. How can you meet market demands for more information in this new world of disclosure and how can you build the fresh insights from Pillar 3 into a more effective basis for decision making and investor relations?

PwC All set for Pillar 3 9
Statutory reporting measures will continue to be the main basis for management as Solvency II primarily focuses on stakeholder protection based on risk and capital evaluations, rather than performance. Yet the Solvency II evaluations could still yield some important perspectives on the prospects and options for your business.
Why are analysts so interested in Solvency II?Analysts have always found insurers difficult to rate and compare. The long-term nature of life insurance makes it especially difficult for them to judge how much risk is being run and how much return is likely to be generated.
It’s therefore little wonder that the markets seize on any additional information that might help to shed more light on the capital intensity and risk sensitivities within your business, which they can use as part of their evaluations of the eventual returns. Even countries such as the
UK, in which regulatory information is already made public, will see significant new disclosures that the markets will be keen to scrutinise. Examples include claims paid by line of business, which will provide analysts and investors with a useful comparison of the relative conservatism of reserving and the resulting impact on profitability.
Some of this information is in the public domain already, via existing embedded value and economic capital disclosures, for example. But evaluation techniques vary across the market. Current IFRS is also hard to compare as liabilities are subject to a variety of different local accounting practices. Therefore, one of the main reasons why analysts are now taking such a keen interest in Pillar 3 is that the balance sheet is subject to prescriptive and uniform rules. This makes the numbers uniquely comparable, albeit more volatile than many of the measures currently used.
Figure 1: Linking solvency and strategy in a new basis for management reporting
Source: PwC
Target group
Steering parameter (Level I)
Steering parameter (Level II)/Side-Condition
Key performance indicator (Illustrative example)
Risk
SCR, MCR Own funds, eligible own funds
CEO, CFO, Head of Department, etc.
Performance (Return versus cost)
Solvency ratio
Capital

PwC All set for Pillar 310
Therefore, we could well see market pressure to extend public solvency disclosures beyond the core SFCR framework.
The other attraction of Solvency II for analysts is the detail given in the publicly available Solvency and Financial Condition Report (SFCR), especially around the contents of the balance sheet and the capital management. For public disclosure, the level of detail on the Solvency Capital Ratio (SCR) is limited to risk module level, such as market risk or life underwriting risk. There’s no requirement to drill deeper into sub-risk levels, such as equity risk or interest rate risk. But it’s this more granular level of risk that the markets are likely to be most interested in, as it would help them to gain a better understanding of the link between the risks being taken, the expected returns and the capital required as a result. Therefore, we could well see market pressure to extend public solvency disclosures beyond the core SFCR framework.
Further analyst interest stems from the fact that the binding capital constraints imposed by Solvency II will be one of the factors in determining how much money is available for dividends and investment, though local rules will continue to be the main determinant. In a number of jurisdictions (e.g. Germany), if volatility adjustments and/or transitional measures are applied, there is no obligation to restrict pay-outs, as long as they are in accordance with local market rules (e.g. the German Commercial Code). Thus, the decision about dividend distribution or discretionary participation features depends on the forecast of the associated effects over the next five years and remains with the board.
Building a comprehensive management reporting frameworkSo while Solvency II is already becoming an important element of both market and management reporting, there are challenges. What are the key considerations for building the Solvency II results into decision making and how will this information reshape market disclosure?
1. Integrating risk, capital and performance reportingTo create an integrated approach to risk, capital and performance management, it’s important to ensure that all risks are identified and assessed and this information is fed into decision making and capital requirements. It’s also important to include a forward-looking element in the analysis, which at the very least should seek to determine how capital will be affected by the risk management decisions being made. As such, senior management should engage closely with risk management, understand how capital will be affected and are conversant with the controls and mitigation measures. It’s also important that frontline and risk teams are clear about their respective roles in monitoring and managing the company’s exposures.
2. Understanding the links between solvency and strategySolvency II is expected to make return on capital a more visible and prominent performance measure. It’s therefore vital that your board understands the business impact and actively takes the lead in decisions over capital strategy, which is a key requirement of the ORSA process. This in turn requires them to be up-to-speed with the assumptions, adjustments and other management actions that shape the capital numbers.
At the heart of these evaluations is the extent to which solvency, earnings, volatility and growth all impinge on each other and therefore how to strike the right balance between them. For example, a high solvency ratio may deplete the funds available for business investment and development. In turn, it may be possible to increase your Day 1 capital surplus through steps such as the release of prudence, but this may come at the expense of lower subsequent earnings. Similarly, you might seek to adopt a more conservative investment strategy to reduce the balance sheet volatility (and hence the volatility on the existing capital), though this could reduce returns. It’s therefore vital to understand the levers that shape capital and earnings, explain the impact of your strategy to analysts and why the resulting numbers might differ from your peers.

PwC All set for Pillar 3 11
3. Identifying the right KPIsDeveloping appropriate KPIs is a key part of understanding the impact of Solvency II on strategy and performance. Besides the ORSA and the existing management reporting, many of the Pillar 3 QRTs provide useful KPIs in their own right (see Figure 2). It’s also possible to combine QRT cells to create KPIs (see Figure 3), which can be augmented by drilling down into segment, country or other more granular levels. These KPIs can be brought together with existing management reporting and then packaged for the target audience (see Figure 4 overleaf). Using the solvency information as a basis for KPIs can also help to validate the figures to guarantee the right level of data quality.
The KPIs should reflect the demands of management at different levels of the organisation. As such, it’s important to define stakeholder-specific KPIs based on the target group. When working with these KPIs, it’s also important to be clear about your expectations on the results, what’s causing the movements in indicators and the measures you want to take in case of significant deviations.
4. Reshaping supplementary reportingEven though the Pillar 3 SFCR doesn’t have to be disclosed publicly until 2017 on the financial year 2016, analysts are already keen to get a glimpse of the provisional solvency numbers and probe management about what they mean for the direction of the business. The interest can only intensify once the SFCR becomes a regular part of the reporting cycle.
However, the annual SFCR may not be either frequent or detailed enough to satisfy market demands, especially as they know that some of the information they want is being communicated to regulators, but not necessarily to them. This raises the question of how supplementary reporting will need to be reshaped and revised to reflect the Solvency II information (e.g. include changes and risks based on the Solvency II information in the management report as part of the annual statutory reporting). Failure to provide the numbers analysts expect and a credible market story around them could affect market confidence and share values.
Figure 2: Examples using QRT cells as KPIs
Source: PwC
Figure 3: Examples combining QRT cells to create KPIs
Source: PwC
QRT Key Performance Indicator
S.23.01. Solvency Capital Ratio
S.29.03. Total Change in Best Estimates
S.13.01. Number of new contracts
S.13.01. Total amount of written premiums
S.13.01. Total amount claims paid during the year
S.29.02. – 4. Movements of technical provisions
S.09.01. Profitability by asset category
QRT Key Performance Indicator
Relevant cell description
QRT cell Formula
S.29.04. Combined ratio (gross) during the reporting period
Claims and benefits – net of salvages and subrogations recovered
UW2
Expenses (related to insurance and reinsurance obligations)
UW3
Premiums earned AY11
S.04.01. Claims ratio in home country
Business underwritten in the home country, by the undertaking (Premium written)
A1
Business underwritten in the home country, by the undertaking (Claims incurred)
C1
UW2 + UW3 AY11
C1 A1
x100
x100

PwC All set for Pillar 312
The immediate consideration is how much to disclose now given the current uncertainties in the numbers, especially if you’re awaiting internal model or matching/volatility adjustment approval. Looking ahead, we believe it will take a number of reporting seasons until a benchmark for supplementary disclosure begins to emerge. Your business thus has an opportunity to set the standards for others to follow.
It’s important to consider whether separate embedded value reporting will still be necessary as a result of these developments. It’s also important to make sure these evaluations take account of the eventual move to the new IFRS insurance contract standard (see Chapter 9: ‘One reality: IFRS and Solvency II’).
5. Shaping perceptionsHaving determined what you want to disclose, you can then think about the market reaction as part of your wider strategic planning for Solvency II. What is the approach to long-term guarantees, for example? Similarly, what are your target solvency ratio and capital surplus levels? Areas that demand close attention include capital intensive products such as annuities. Changes to product design or investment strategies may be required as a result.
Other disclosures that could attract particular analyst attention and hence may need to be addressed include regulatory capital surplus that is markedly below your peers or significant differences between the Solvency II and IFRS/GAAP balance sheets (we look more closely at explaining the differences in valuation bases in ‘Chapter 4: Qualitative reporting: Getting to the right level of detail and explanation’).
Next stepsFrom a management reporting perspective, the first key question is whether the Solvency II results will be a key performance driver or simply a binding constraint.
If you’re keen to bring these evaluations into the forefront of your business planning, performance management and disclosure, it’s important to determine appropriate KPIs and ensure the data feeds are sufficiently timely and reliable. It’s also important to ensure that your senior management and board understand the interactions between risk, capital and performance. This includes a full appreciation of the market events and risk sensitivities that can influence data and decisions. It also includes the high level of technical understanding needed to manage the relationship between solvency, earnings, volatility and funds available for growth. The ORSA process will provide an important basis for bringing all these various strands together and building them into frontline management.
Alternatively, you may be more sceptical about the usefulness of the Solvency II numbers and therefore opt for minimum compliance with the ‘use test’. Nonetheless, the impact of Solvency II on pricing, returns and market perceptions means that it’s still important to understand and seek to manage the implications.
Figure 4: Shaping the information to the audience
Source: PwC
Solvency II Key deliverables
Potential target group
ORSA
RSR/SFCR
P&L Attribution (internal model user)
QRTs (Core package)
Financial Stability QRTs
ECB QRT Add-ons
Internal reports like “report of the actuarial function”
Board
Analysts and investors
Division manager
Risk Committee
Head of department

PwC All set for Pillar 3 13
It’s also important to look at how the changes to your reporting support your ‘equity story’. This includes explaining to analysts and investors the extent to which Solvency II is likely to change the KPIs you use to run the business and how your strategic objectives accord with your regulatory requirements.
Investor relations teams should take a proactive approach to educating the markets. This includes using the commentaries to explain the potential impact of Solvency II on balance sheet volatility, dividends and earnings, rather than simply providing specific results. How different businesses approach their disclosures, and where the benchmark is eventually set, will take time to settle. In the meantime, the challenge will be to stay ahead of the curve and not get caught out by a better approach from competitors.
Whatever you opt for, you will need to tie the binding regulatory constraints to group level economic capital evaluations, along with those used in IFRS and rating agency capital models. The underlying requirements include ensuring that all the reporting processes flow together to paint a consistent picture of strategy, risk appetite, risk profile, capital levels and back to strategy.
In parallel, it’s important to think through the consequences of what you’re planning to disclose on investor perceptions. How much do you want to disclose now? Do you want to be a market leader in setting the standards for supplementary disclosure? What would be the market reaction if you choose to disclose less information than your peers? In turn, how financially stable will your business look under the SFCR and supplementary disclosures? How does this compare to your competitors? How does it square with the measures used by analysts and investors to rate performance?
Whatever you opt for, you will need to tie the binding regulatory constraints to group level economic capital evaluations, along with those used in IFRS and rating agency capital models. The underlying requirements include ensuring that all the reporting processes flow together to paint a consistent picture of strategy, risk appetite, risk profile, capital levels and back to strategy.

Ready for the final push: Overview of full requirements for Pillar 3
Pillar 3 will require your business to report more information, more quickly and with much greater scrutiny than ever before. The tight turnaround times and level of data and analysis that will need to be reported and disclosed present a significant operational hurdle over and above what is required for the other two pillars. But there will also be opportunities to use the required investment to improve the quality, reliability and timeliness of management information.
The Pillar 3 reporting requirements under Solvency II need to be distinguished between qualitative reporting and quantitative reporting (see Figure 5). The qualitative reporting includes the Regular Supervisory Report (RSR), the Solvency and Financial Condition Report (SFCR), as well as the ORSA report. The quantitative reporting includes the technical provisions, own funds and other data on the business. All QRTs, the ORSA and the RSR will be reported privately to the regulator. A limited number of QRTs and additional qualitative information are required to be made publically available in the SFCR.
The qualitative Pillar 3 reporting and disclosure requirements provide an additional commentary over and above the numbers, which seeks to convey how business activities affect your risk profile and related capital adequacy. The public SFCR would be annual. The disclosure to supervisors (RSR) would include a new report at least every three years, along with annual updates.
Figure 6 sets out the reporting frequency and timelines. The time for submission of the different reports to the local supervisor will decrease every year until 2020. While the Level 1 legislative basis4 and Level 2 implementing measures5 for Solvency II are already finalised and in place, the Level 2.5 implementing technical standards and Level 3 guidelines still need to approved by the EU commission (Level 2,5) respectively the national supervisors (Level 3) by explain or comply (see Figure 7).
The second set of Implementing Technical Standards (ITS) and Guidelines for Solvency II were published in July 20152a. With this final report addressing the remaining uncertainties, your business needs to begin to move into the final preparations for Pillar 3 reporting and disclosure (if not already started). The European Central Bank (ECB) has also provided greater clarity on its reporting expectations, which will overlap with certain elements of Pillar 33. So what’s changed from previous drafts and how can you make sure your business is geared up for the final push?
Chapter 2
2a EIOPA: https://eiopa.europa.eu/Pages/Consultations/Public-consultation-on-the-Set-2-of-the-Solvency-II-Implementing-Technical-Standards-(ITS)-and-Guidelines.aspx
3 ECB: https://www.ecb.europa.eu/ecb/legal/pdf/oj-jol_2014_366_r_0008-en-txt.pdf4 EIOPA: Directive 2009/138/EC: http://eur-lex.europa.eu/legal-content/EN/
TXT/?uri=CELEX:32009L0138 Directive 2014/51/EU: http://eur-lex.europa.eu/legal-content/EN/TXT/?uri=uriserv:OJ.L_.2014.153.01.0001.01.ENG
5 Delegated Acts on Solvency II: http://eur-lex.europa.eu/legal-content/EN/ALL/?uri=uriserv:OJ.L_.2015.012.01.0001.01.ENG

PwC All set for Pillar 3 15
Preparatory phase
Figure 5: Overview of quantitative and qualitative reporting
*If not more frequently required by local supervisory body; annual update as summary required Source: PwC analysis of EIOPA releases
Figure 6: Reporting timeline
*If not required on annual basis by local regulator. Submission of RSR every three years; at least annual submission of significant changes in RSR summary
Solvency and Financial Condition Report (SFCR)• For public disclosure• Frequency: annually • Information for external stakeholder in order to
ensure transparency
QRT including Financial Stability and ECB Reporting• Basic Information • Balance Sheet • Own Funds • Assets • SCR, MCR • Technical Provisions • Long-term guarantees and Matching Adjustment • Variation Analysis • Reinsurance • Group • Financial Stability • European Central Bank (ECB) Reporting
(including QRT Add-ons)
Regular Supervisory Reporting (RSR)• Confidential and future-oriented• Frequency: every three years at least*• Report only to supervisory body
ORSA report• Solvency position (own funds and risk capital)• Risk profile• Capital allocation and risk based management • Governance aspects• Monitoring technical provisions• Private disclosure• Annual report or more frequently if needed
Qualitative reporting Quantitative reporting
Q1 Q2 Q3 Q4
Solvency II in force
2015
2016
Opening balance sheet – day 1 reporting (20W)
2017
Annual SFCR/RSR* (20W)
2018
2020
Annual reporting – elements of RSR and specific QRTs (22W)
Quarterly (8W)
ECB Rep (8W)
FS Rep (8W)
ECB Rep (8W)
FS Rep (8W)
Quarterly (8W)
ECB Rep (7W)
FS Rep (7W)
Quarterly (7W)
ECB Rep (7W)
FS Rep (7W)
Quarterly (7W)
ECB Rep (7W)
FS Rep (7W)
Quarterly (7W)
ECB Rep (7W)
FS Rep (7W)
Quarterly (7W)
ECB Rep (6W)
FS Rep (6W)
Quarterly (6W)
ECB Rep (6W)
FS Rep (6W)
Quarterly (6W)
ECB Rep (6W)
FS Rep (6W)
Quarterly (7W)
Annual SFCR/RSR* (18W)
ECB Rep (5W)
FS Rep (5W)
Quarterly (5W)
ECB Rep (5W)
FS Rep (5W)
Quarterly (5W)
ECB Rep (5W)
FS Rep (5W)
Quarterly (5W)
ECB Rep (5W)
FS Rep (5W)
Quarterly (5W)
Annual SFCR/RSR* (14W)
ECB Rep (8W)
FS Rep (8W)
Quarterly (8W)
+6W
+6W
+6W
+6W
+6W+6W
+6W+6W+6W
+6W +6W +6W
+6W
+6W
+6W
+6W
+6W
ECB Rep (8W)
FS Rep (8W)
Quarterly (8W)Quarterly (8W) +6W
+6W
+2W +2W +2W
+2W +2W +2W
+2W+2W
+2W+2W +2W +2W
+2W +2W
+2W
6 additional weeks for groups (for FS reporting only 2 weeks; +2 week also applies to solo as long as QRT must only be reported for FS); The Deadline of FS apply to quarterly and annually reporting
Source: PwC analysis
PwC All set for Pillar 316
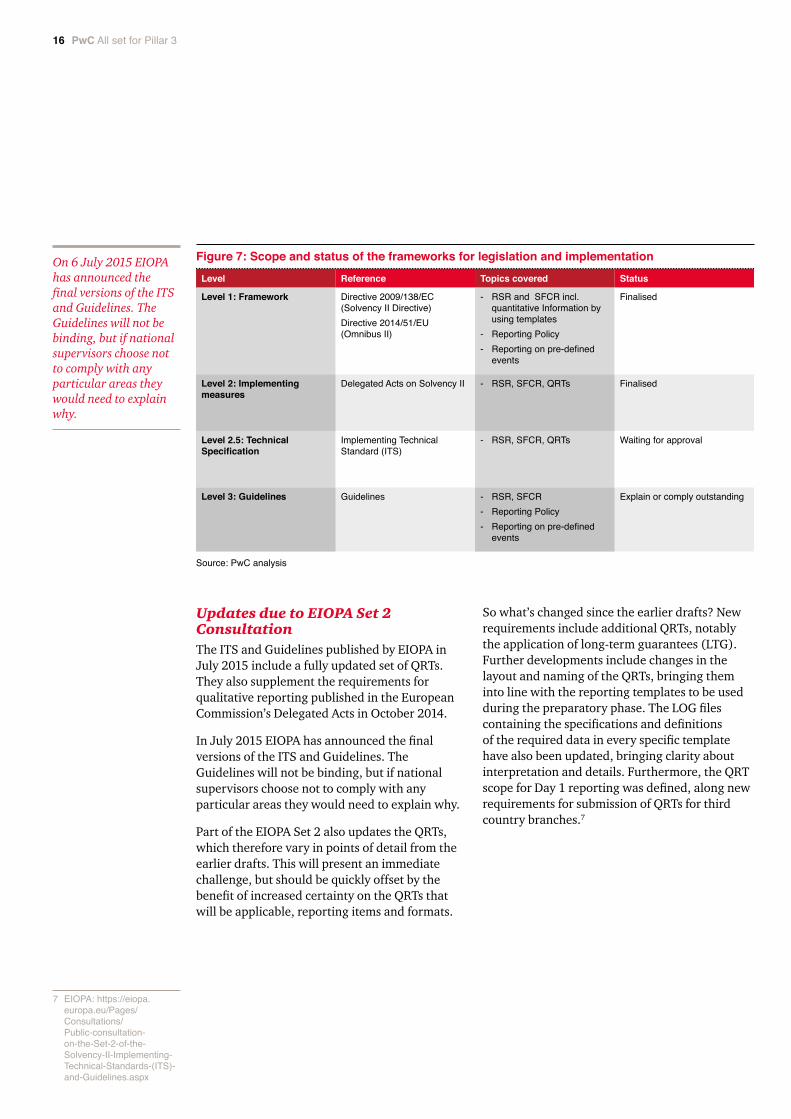
On 6 July 2015 EIOPA has announced the final versions of the ITS and Guidelines. The Guidelines will not be binding, but if national supervisors choose not to comply with any particular areas they would need to explain why.
Updates due to EIOPA Set 2 ConsultationThe ITS and Guidelines published by EIOPA in July 2015 include a fully updated set of QRTs. They also supplement the requirements for qualitative reporting published in the European Commission’s Delegated Acts in October 2014.
In July 2015 EIOPA has announced the final versions of the ITS and Guidelines. The Guidelines will not be binding, but if national supervisors choose not to comply with any particular areas they would need to explain why.
Part of the EIOPA Set 2 also updates the QRTs, which therefore vary in points of detail from the earlier drafts. This will present an immediate challenge, but should be quickly offset by the benefit of increased certainty on the QRTs that will be applicable, reporting items and formats.
So what’s changed since the earlier drafts? New requirements include additional QRTs, notably the application of long-term guarantees (LTG). Further developments include changes in the layout and naming of the QRTs, bringing them into line with the reporting templates to be used during the preparatory phase. The LOG files containing the specifications and definitions of the required data in every specific template have also been updated, bringing clarity about interpretation and details. Furthermore, the QRT scope for Day 1 reporting was defined, along new requirements for submission of QRTs for third country branches.7
Source: PwC analysis
7 EIOPA: https://eiopa.europa.eu/Pages/Consultations/Public-consultation-on-the-Set-2-of-the- Solvency-II-Implementing-Technical-Standards-(ITS)-and-Guidelines.aspx
Level Reference Topics covered Status
Level 1: Framework Directive 2009/138/EC (Solvency II Directive)Directive 2014/51/EU (Omnibus II)
- RSR and SFCR incl. quantitative Information by using templates
- Reporting Policy- Reporting on pre-defined
events
Finalised
Level 2: Implementing measures
Delegated Acts on Solvency II - RSR, SFCR, QRTs Finalised
Level 2.5: Technical Specification
Implementing Technical Standard (ITS)
- RSR, SFCR, QRTs Waiting for approval
Level 3: Guidelines Guidelines - RSR, SFCR- Reporting Policy- Reporting on pre-defined
events
Explain or comply outstanding
Figure 7: Scope and status of the frameworks for legislation and implementation

PwC All set for Pillar 3 17
New requirements include additional QRTs, notably the application of long-term guarantees (LTG). Further developments include changes in the layout and naming of the QRTs, bringing them into line with the reporting templates to be used during the preparatory phase.
Implementing Technical Standards (ITS)
Document Title Summary of content
EIOPA-BoS-15/115 ITS on regular supervisory reporting
- QRTs for opening reporting and regular annual and quarterly reporting by solo entities and groups
- Full updated QRT spreadsheet and LOG files QRTs for material ring-fenced funds
- Reporting thresholds, criteria and application of proportionality for different elements
- Reporting rules including units and foreign currency conversion
EIOPA-BoS-15/118 ITS on public disclosure: procedures, formats and templates
- QRTs subject to public disclosure- Approval of public disclosure by the administrative,
management or supervisory body- Cross references within public disclosure- Means of disclosure including publication online- Intra-group co-ordination- Reporting rules including units and foreign currency
conversion
Guidelines
EIOPA-BoS-15/106 Guidelines on methods to determine the market share for the purpose of exemptions to supervisory reporting
- Guidance on how supervisors should determine market share (including treatment of composite insurers) for the purpose of applying limited regular reporting
EIOPA-BoS-15/107 Guidelines on financial stability reporting
- Identification of insurers within the scope of financial stability reporting and application of requirements
- Best efforts basis for preparation of data- QRTs to be submitted- Submission deadlines- Data plausibility checks to be applied
EIOPA-BoS-15/109 Guidelines on reporting and disclosure
- Additional guidance on items to be covered by insurers in specified sections of their qualitative reporting (SFCR and RSR)
- Identification of pre-defined events and reporting- Requirements for public disclosure and reporting policies- Cross-referencing within the RSR- Data checks to be applied- Approval of reported information by the administrative,
management or supervisory body
EIOPA-BoS-15/110 Guidelines on third country branches
- Authorisation, supervisory powers and processes, accounting and valuation requirements, location of assets, branch capital requirements and solvency, and governance and risk management requirements
- Reporting requirements applicable to third country branches, including RSR, QRTs, ORSA supervisory report and coordination with home-country reporting, including with respect to public disclosure
- Means of reporting, frequency and deadlines- Data checks to be applied to reporting- Transitional arrangements
EIOPA-BoS-15/112 Guidelines on exchange of information on a systematic basis within colleges
- Guidance on information exchange within colleges, including assessment of information to be exchanged and coordination arrangements
Source: PwC analysis of EIOPA releases
Figure 8: Main reporting requirements8
8 EIOPA set 2 https://eiopa.europa.eu/Pages/Consultations/Public-consultation-on-the-Set-2-of-the-Solvency-II-Implementing-Technical-Standards-(ITS)-and-Guidelines.aspx

PwC All set for Pillar 318

PwC All set for Pillar 3 19
The ITS and Guidelines also provide further guidance on the use of simplified approaches by smaller and less complex businesses, including valuation methods or estimations for the quarterly balance sheet.
Important further clarifications centre on the materiality thresholds governing whether reporting will be required in certain areas, one of the questions that had been left outstanding in previous drafts. Areas covered include the relative size of market share under which reporting is not required or how to evaluate markets in which the premiums represent only a small proportion of overall group business – Chapter 3: ‘Easing the demands: Making a clear case for applying proportionality’ sets out a full checklist of the materiality thresholds and how to get approval for their application. The ITS and Guidelines also provide further guidance on the use of simplified approaches by smaller and less complex businesses, including valuation methods or estimations for the quarterly balance sheet (see Chapter 3 for further information).
EIOPA has left scope for EU member states to define national specific templates, covering products and conditions with particular relevance to local markets and national legal requirements. Examples include the UK Prudential Regulation Authority’s9 proposed request for information in areas such as with-profits bonus value and business model analysis10. These expectations would not replace EIOPA’s QRTs, but would have to be submitted in addition. In the Netherlands a consultation on additional QRTs has already been closed, under which insurers would have to report additional templates on care, in-kind funeral services, profit & loss account and windstorm.
9 National legal requirements on QRTs are currently in discussion as well in other countries, like Ireland or the Netherlands.
10 PRA: http://www.bankofengland.co.uk/pra/Pages/publications/ps/2015/ps215a.aspx

PwC All set for Pillar 320
European Central Bank (ECB) reportingThe ECB reporting aims to enhance the quality, coverage and granularity of insurance statistics required for monetary, economic and financial stability analysis.
In November 2014 the ECB published the Regulation (EU) No 1374/201411. The Reporting Items are now part of the Solvency II Package. EIOPA included additional QRTs as well as add-ons to existing QRTs.11
ScopeThe insurance corporation (parent or subsidiary) is treated as a ‘standalone’ entity and its balance sheet is included in the country data where the entity is legally incorporated. This also includes branches of third country insurance undertakings in Euro area member states.
The ECB needs reporting from 95% of the market in any one member state for its annual analysis and 80% of the market for quarterly information (the same thresholds as under Solvency II). The reporting will be phased in between 2016 and 2020 and quarterly reporting will be regularly reviewed to see whether the scope should be extended to cover an increased share of the market.
In March 2015, the ECB published unofficial reporting templates including add-ons12 and accompanying LOG files (see Figure 9). The templates include QRTs, which have been modified, along with new templates, which need to be reported for European System of Central Bank purposes only. While balance sheet information, a list of assets and deposits to cedants (line-by-line reporting) only need to be provided on a quarterly basis, information on pension entitlements and the geographical breakdown of non-life technical provisions referring to reinsurance policies have to be provided additionally on an annual basis.
The ECB add-ons will also be integrated in the technical reporting framework set up by EIOPA, based on the Data Point Model (DPM – a structured representation of the data) and eXtensible Business Reporting Language (XBRL).
11 ECB: https://www.ecb.europa.eu/ecb/legal/pdf/oj-jol_2014_366_r_0008-en-txt.pdf 12 ECB: https://www.ecb.europa.eu/stats/money/icpf/html/index.en.html
Source: PwC analysis of ECB releases
Template variants
Quarterly Annual
Template code Title of template Solo 3rd country branches
Solo 3rd country branches
Type of ECB add-ons
SE.02.01 Balance sheet X X X X Variant of Solvency II template including ECB add-ons
SE.06.02 List of assets X X X X Variant of Solvency II template including ECB add-ons
E.01.01 Deposits to cedants – line-by-line reporting
X X X X New template for ECB purposes
E.02.01 Life obligations analysis – pension entitlements
X X New template for ECB purposes
E.03.01 Non-life technical provisions – reinsurance policies – by country
X X New template for ECB purposes
Figure 9: ECB add-ons

PwC All set for Pillar 3 21
Boards and audit committees will want to consider how they gain appropriate assurance (either internally or externally) over the Solvency II information that they are required to report.
Next stepsIt’s important not to underestimate the work involved and the time it will take get ready.
1. Ensure you’re set up to complyAlthough the documents released are currently in the approval process, they provide a sound basis to begin finalising preparations. Key factors to consider include:
• Data Governance: The reporting policy defining the role and responsibilities and the reporting process, including validations and sign-off should already be in place.13 You will need to make sure that the policy is implemented and reporting processes are documented and linked to the internal control system.
• Data availability: The item-by-item reporting requires a considerable amount of new information in areas such as reinsurance and goes into others in much greater detail. It’s therefore essential to check whether key data is readily available, in the right format, in the right timescales, and with sufficient quality. If not, how can the gaps be addressed?
• Workflow planning: Mapping key processes and data flows in the reporting processes, identifying inefficiencies and bottlenecks that may slow down or prevent reporting within the prescribed deadlines. It’s important to define a closing calendar to manage and monitor the process, as well as to align with your external auditor.
• Systems and technology: Investment in systems and technology will not only cover Solvency II reporting, but also adopted source systems to be able to deliver in the required quality and granularity (see Chapter 7: ‘Accelerate and adapt: How the right IT can make your life easier’).
2. Carry out a dry runQuite a few insurers across the EEA have already completed dry-runs of quantitative and, in some cases, qualitative reporting. Carrying out a dry-run for the Solvency II reporting on the new basis will be essential during 2015 and 201614 to firm up responsibilities, identify issues with enough time to remediate, and to provide sufficient time for an appropriate level of governance and review.
3. Work out how to gain assuranceBoards and audit committees will want to consider how they gain appropriate assurance (either internally or externally) over the Solvency II information that they are required to report. Minimum EEA-wide statutory audit requirements may be augmented locally (see Chapter 6: ‘Seeking assurance: Audit requirements for Pillar 3’). In addition, you may consider voluntary additional external quality assurance or further review by internal functions such as actuarial or internal audit.
In the coming chapters, we will be looking at specific areas of implementation and assurance including audit, proportionality, IT and systems.
13 EIOPA: https://eiopa.europa.eu/Publications/Consultations/EIOPA_EIOPA-CP-14-047_GL_Reporting_public_discl.pdf
14 In 2015 for the full scope of the quarterly reporting and latest in 2016 for the full scope of the annual reporting

Easing the demands: How to make a clear case for applying proportionality and materiality
Proportionality and materiality are among the core tenets of Solvency II.15 They seek to ensure that the regulatory demands on your business reflect its nature, scale and complexity.
The Level 1 Solvency II legislation gives local supervisors the discretion to limit reporting demands if the full requirements are deemed excessive.16 You’re most likely to qualify for such relief if you fit one or more of these three descriptions:
1. Your business is very small
2. Supervisory authorities shall give priority to the smallest undertakings when determining eligibility (reporting requirements can be decreased for 20% of the local market)
3. If requirements are too burdensome and a simplified approach is appropriate to the risk profile you can seek to make a case to your local supervisor
The room to apply proportionality and materiality to your disclosure are most evident when reporting on your Pillar 2 systems and processes. If the business you write and the operations that support it aren’t especially complex, for example, your governance systems are likely to be relatively simple and the nature and scale of reporting on your system of governance would reflect this.
With regard to Pillar 1, there may be some room for simplification in the valuation of technical provisions and the calculation of the standard formula SCR, though there would need to be considerable justification to support this.
There are also applicability and materiality exemptions for reporting certain Pillar 3 QRTs. If your portfolio doesn’t include specific assets or business lines covered by particular QRTs, you would normally be exempt, for example. With regard to materiality, the general rule of thumb is that reporting or disclosure is material if a user might come to a different conclusion or investment decision if the disclosure were to be left out.
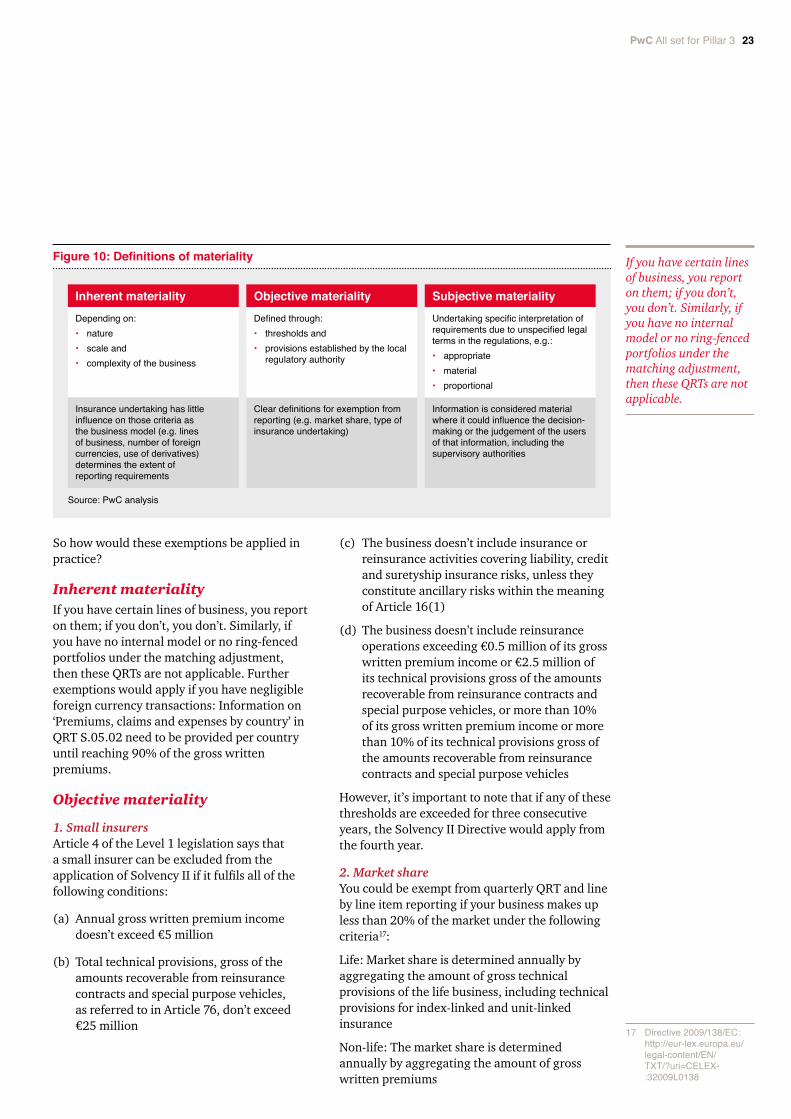
Making the caseIf you’re applying proportionality and materiality you must have a clear and justifiable rationale and report this within your RSR. Your approach also needs to be consistent across group operations – no cherry picking. The main exemption criteria centre on the three types of materiality (Figure 10 outlines the definitions).
Solvency II includes provisions to help ease the burden on smaller and/or less complex insurers. But the criteria for applying proportionality and materiality are quite specific in Pillar 3 and you need a clear rationale to justify to your supervisor why you’re using them based on your risk profile (risks inherent in the business). So looking at the practical application of proportionality and materiality, where and how can they be used and how can you gain supervisory approval?
Chapter 3
15 Directive 2009/138/EC, Section of introduction (19), Page 3
16 Directive 2009/138/EC: http://eur-lex.europa.eu/legal-content/EN/TXT/?uri= CELEX:32009L0138
PwC All set for Pillar 3 23
If you have certain lines of business, you report on them; if you don’t, you don’t. Similarly, if you have no internal model or no ring-fenced portfolios under the matching adjustment, then these QRTs are not applicable.
So how would these exemptions be applied in practice?
Inherent materialityIf you have certain lines of business, you report on them; if you don’t, you don’t. Similarly, if you have no internal model or no ring-fenced portfolios under the matching adjustment, then these QRTs are not applicable. Further exemptions would apply if you have negligible foreign currency transactions: Information on ‘Premiums, claims and expenses by country’ in QRT S.05.02 need to be provided per country until reaching 90% of the gross written premiums.
Objective materiality
1. Small insurersArticle 4 of the Level 1 legislation says that a small insurer can be excluded from the application of Solvency II if it fulfils all of the following conditions:
(a) Annual gross written premium income doesn’t exceed €5 million
(b) Total technical provisions, gross of the amounts recoverable from reinsurance contracts and special purpose vehicles, as referred to in Article 76, don’t exceed €25 million
(c) The business doesn’t include insurance or reinsurance activities covering liability, credit and suretyship insurance risks, unless they constitute ancillary risks within the meaning of Article 16(1)
(d) The business doesn’t include reinsurance operations exceeding €0.5 million of its gross written premium income or €2.5 million of its technical provisions gross of the amounts recoverable from reinsurance contracts and special purpose vehicles, or more than 10% of its gross written premium income or more than 10% of its technical provisions gross of the amounts recoverable from reinsurance contracts and special purpose vehicles
However, it’s important to note that if any of these thresholds are exceeded for three consecutive years, the Solvency II Directive would apply from the fourth year.
2. Market shareYou could be exempt from quarterly QRT and line by line item reporting if your business makes up less than 20% of the market under the following criteria17:
Life: Market share is determined annually by aggregating the amount of gross technical provisions of the life business, including technical provisions for index-linked and unit-linked insurance
Non-life: The market share is determined annually by aggregating the amount of gross written premiums
Figure 10: Definitions of materiality
Source: PwC analysis
17 Directive 2009/138/EC: http://eur-lex.europa.eu/ legal-content/EN/TXT/?uri=CELEX-:32009L0138
Depending on:• nature• scale and• complexity of the business
Insurance undertaking has little influence on those criteria as the business model (e.g. lines of business, number of foreign currencies, use of derivatives) determines the extent of reporting requirements
Clear definitions for exemption from reporting (e.g. market share, type of insurance undertaking)
Information is considered material where it could influence the decision-making or the judgement of the users of that information, including the supervisory authorities
Defined through:• thresholds and• provisions established by the local
regulatory authority
Undertaking specific interpretation of requirements due to unspecified legal terms in the regulations, e.g.:• appropriate• material• proportional
Inherent materiality Objective materiality Subjective materiality

PwC All set for Pillar 324
You’re exempt from financial stability reporting if the total assets in your Solvency II balance sheet are less than €12 billion or equivalent in local currency. In fragmented markets where this threshold fails to capture at least 50% of total assets of the market, supervisors can require reporting from more designated entities to make up the shortfall.
When applying this option, local supervisors will use quantifiable criteria to judge whether a lack of materiality would make assessment for reporting purposes excessively burdensome in the following areas (Article 35 (8))
(a) The volume of premiums, technical provisions and assets
(b) The volatility of the claims and benefits covered
(c) The market risks that the investments give rise to
(d) The level of risk concentrations
(e) The total number of classes of life and non-life insurance for which authorisation is granted
(f) The level of own funds covering the SCR and MCR
(g) Whether the entity is a captive insurance or reinsurance undertaking only covering risks associated with the industrial or commercial group to which it belongs
You’re exempt from financial stability reporting if the total assets in your Solvency II balance sheet are less than €12 billion or equivalent in local currency. In fragmented markets where this threshold fails to capture at least 50% of total assets of the market, supervisors can require reporting from more designated entities to make up the shortfall.
3. Type of insurerCertain forms of insurer are exempt from reporting, depending on national legislation. Local examples include funeral expense funds in Germany. Other exemptions include insurers providing export credit insurance operations for the account of or guaranteed by the government, or where the government is the insurer.18
With regard to the specific requirements for a ‘look-through’ approach to valuing the underlying assets in a fund-of-fund, then this would only apply if such funds make up more than 30% of all your investments.
Subjective materialityThe legal terms ‘appropriate, material, proportional’ in the regulations depend on interpretation. A clear case is needed to convince your supervisor that your implementation is appropriate. For all subjective materiality thresholds you’re applying you should document your rationale to your supervisor. If this would make a difference to users of the reports, you also have to explain the simplifications and their implications.
Implications for quantitative reportingYour supervisor may allow you to confine reporting of certain items to your annual disclosure rather than having to communicate them quarterly. You may also gain exemption from reporting on an item-by-item basis.
The criteria for exemption (Solvency II Directive Article 7) that your supervisor can judge on are:
(a) The submission of that information would be overly burdensome in relation to the nature, scale and complexity of the risks inherent in the business
(b) The submission of that information is not necessary for effective supervision
(c) The exemption doesn’t undermine the stability of the financial systems in the EEA
(d) You’re able to provide the information on an ad-hoc basis
Some QRTs wouldn’t apply if your portfolio or its management don’t include certain types of asset investments or use of derivatives. Quarterly measurements may also rely on estimates to a greater extent than those used for the annual financial data (see Chapter 5: ‘Getting there quicker: Making the most of the ‘best effort’ option in quarterly reporting’). But the resulting information has to be reliable and compliant with Solvency II standards.
18 EIOPA: Directive 2009/ 138/EC: http://eur-lex. europa.eu/legal-content/ EN/TXT/?uri=CELEX: 32009L0138 Article 5 (4)
PwC All set for Pillar 3 25
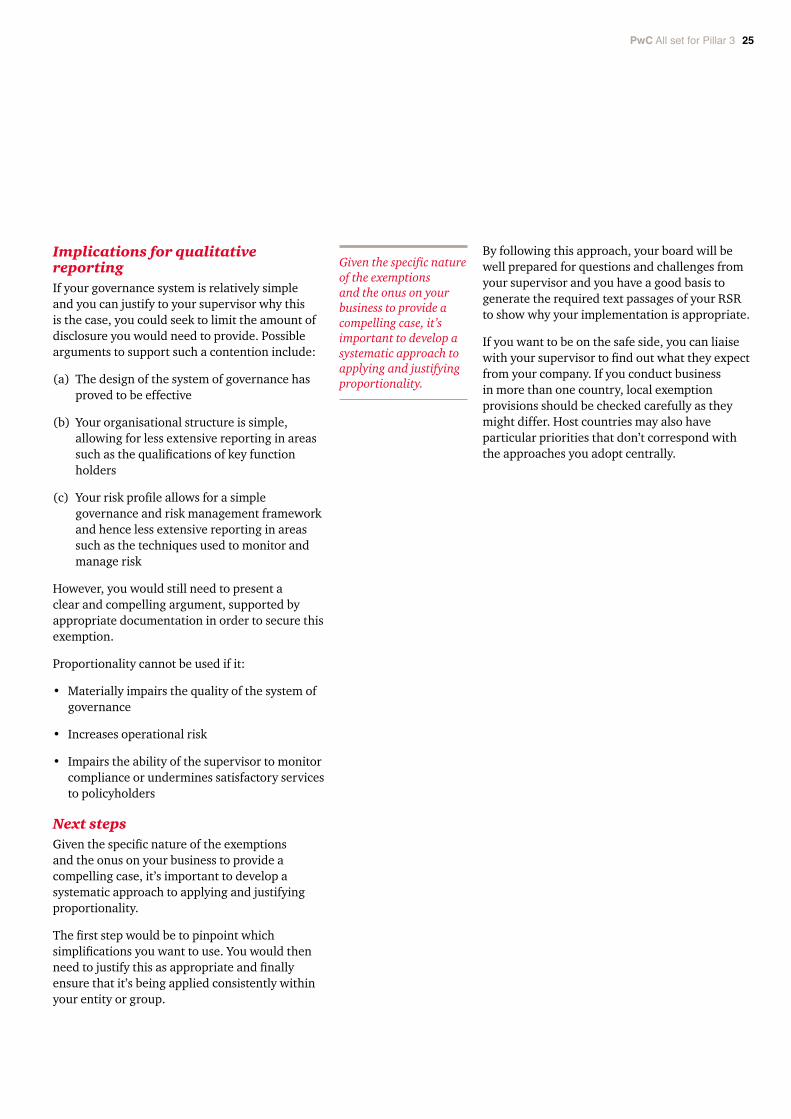
Given the specific nature of the exemptions and the onus on your business to provide a compelling case, it’s important to develop a systematic approach to applying and justifying proportionality.
By following this approach, your board will be well prepared for questions and challenges from your supervisor and you have a good basis to generate the required text passages of your RSR to show why your implementation is appropriate.
If you want to be on the safe side, you can liaise with your supervisor to find out what they expect from your company. If you conduct business in more than one country, local exemption provisions should be checked carefully as they might differ. Host countries may also have particular priorities that don’t correspond with the approaches you adopt centrally.
Implications for qualitative reportingIf your governance system is relatively simple and you can justify to your supervisor why this is the case, you could seek to limit the amount of disclosure you would need to provide. Possible arguments to support such a contention include:
(a) The design of the system of governance has proved to be effective
(b) Your organisational structure is simple, allowing for less extensive reporting in areas such as the qualifications of key function holders
(c) Your risk profile allows for a simple governance and risk management framework and hence less extensive reporting in areas such as the techniques used to monitor and manage risk
However, you would still need to present a clear and compelling argument, supported by appropriate documentation in order to secure this exemption.
Proportionality cannot be used if it:
• Materially impairs the quality of the system of governance
• Increases operational risk
• Impairs the ability of the supervisor to monitor compliance or undermines satisfactory services to policyholders
Next stepsGiven the specific nature of the exemptions and the onus on your business to provide a compelling case, it’s important to develop a systematic approach to applying and justifying proportionality.
The first step would be to pinpoint which simplifications you want to use. You would then need to justify this as appropriate and finally ensure that it’s being applied consistently within your entity or group.
Qualitative reporting: Getting to the right level of detail and explanation
Pillar 3 qualitative reporting should tell the story around the numbers, including insights into your governance, the significance of your risk and capital evaluations for the management of the business and why they may deviate from statutory reporting. So how can you make best use of the information you already have? How should the reports for a knowledgeable regulatory and generally less informed public audience differ?
Pillar 3 qualitative reporting should tell the story around the numbers, including insights into your governance, the significance of your risk and capital evaluations for the management of the business and why they may deviate from statutory reporting. So how can you make best use of the information you already have? How should the reports for a knowledgeable regulatory and generally less informed public audience differ?
Chapter 4
19 EIOPA: Solvency II: https://eiopa.europa.eu/Pages/Consultations/Public-consultation-on-the-Set-2-of-the-Solvency-II-Implementing-Technical-Standards-(ITS)-and-Guidelines.aspx
EIOPA: Preparatory Phase: https://eiopa.europa.eu/Publications/Consultations/EIOPA_13_415_Final_Report_on_CP10.pdf#search=Final%20Report%20on%20CP10
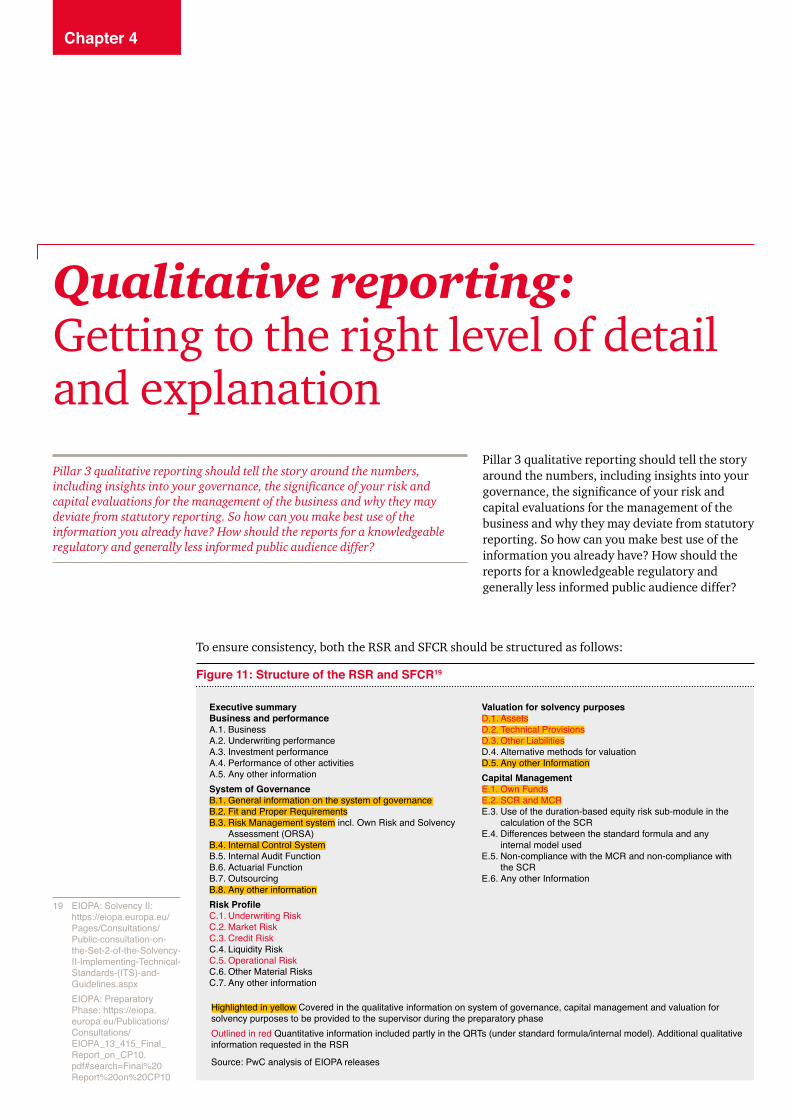
To ensure consistency, both the RSR and SFCR should be structured as follows:
Source: PwC analysis of EIOPA releases
Figure 11: Structure of the RSR and SFCR19
Executive summary Business and performanceA.1. BusinessA.2. Underwriting performanceA.3. Investment performanceA.4. Performance of other activitiesA.5. Any other informationSystem of GovernanceB.1. General information on the system of governanceB.2. Fit and Proper RequirementsB.3. Risk Management system incl. Own Risk and Solvency
Assessment (ORSA)B.4. Internal Control SystemB.5. Internal Audit FunctionB.6. Actuarial FunctionB.7. OutsourcingB.8. Any other informationRisk ProfileC.1. Underwriting RiskC.2. Market RiskC.3. Credit RiskC.4. Liquidity RiskC.5. Operational RiskC.6. Other Material RisksC.7. Any other information
Valuation for solvency purposesD.1. AssetsD.2. Technical ProvisionsD.3. Other LiabilitiesD.4. Alternative methods for valuationD.5. Any other InformationCapital ManagementE.1. Own FundsE.2. SCR and MCRE.3. Use of the duration-based equity risk sub-module in the
calculation of the SCRE.4. Differences between the standard formula and any
internal model usedE.5. Non-compliance with the MCR and non-compliance with
the SCRE.6. Any other Information
Highlighted in yellow Covered in the qualitative information on system of governance, capital management and valuation for solvency purposes to be provided to the supervisor during the preparatory phaseOutlined in red Quantitative information included partly in the QRTs (under standard formula/internal model). Additional qualitative information requested in the RSR

PwC All set for Pillar 3 27
It’s important to ensure that the SFCR is clear and understandable to an audience that is largely unfamiliar with the technical intricacies of Solvency II.
How do the RSR and SFCR differ?In seeking to convey the risks you run, their impact and how they’re managed, the objectives of the RSR and SFCR are very similar. But it’s important to bear in mind that they have different audiences, one public and the other regulatory.
The regulatory RSR is the more comprehensive and would therefore be a good starting point for writing the SFCR. Figure 12 highlights the differences between the two.
But the SFCR can’t just be a cut down version of the RSR. It’s important to ensure that the SFCR is clear and understandable to an audience that is largely unfamiliar with the technical intricacies of Solvency II. Along with analysts and investors, it’s important to bear in mind that the public audience could include policyholders and beneficiaries. It’s also important to consider the reputational implications of what you’re disclosing, including what would happen if one part of the numbers or narrative explanation were picked up in isolation and displayed across the media. This underlines the importance of
ensuring that the SFCR is clear, coherent and well-thought through, with full input from senior management right through preparation.
Easing the burden of deliveryQuite a lot of what is needed for the RSR and SFCR will already be available in your ORSA and statutory reporting or could be taken from the documentation for internal policies. Making good use of what’s already there will not only reduce the effort, but also help to improve consistency between the various aspects of disclosure.
The management summary is designed to highlight any material changes in your business and performance, system of governance, risk profile, valuation for solvency purposes and capital management over the reporting period.
Figure 12: Comparison of RSR and SFCR
Source: PwC analysis of Solvency II requirements
• Complete report every three years• Annual update in terms of a summary
• Material information described in detail
• Pre-knowledge of the supervisor can be assumed
• Illustration of the appropriateness of the implementation (as the document is the basis for the Supervisory Review Process)
• Retrospective and prospective (Report about forecasts based on the planning horizon)
• Complete report every year
• Detailed description in order to understand the content
• Understandable for the public
• Reader should understand how the implementation of Solvency II protects policyholders
• Retrospective at the cut-off date (Report about the past financial year)
RSR SFCR
Reporting frequency
Level of detail
Understandability
Illustration appropriateness
Reporting period

PwC All set for Pillar 328
It’s not enough to simply say that differences are caused by valuation at book and market value. Instead, you would be expected to provide a detailed explanation of why Solvency II and statutory financial reporting values differ for each material asset and lines of business.
The business performance section would be largely derived from the annual report. In turn, much of the system of governance section would come from documented internal policies and the management commentary in the annual report. The risk profile would draw on the SCR, QRTs and ORSA and valuation on the QRTs, annual report and valuation handbook.
For the valuation for solvency purposes chapter (also called regulatory balance sheet) you should provide regulatory balance sheet valuation on a comparative basis to your statutory reporting. This includes a description, separately for assets, technical provisions, and other liabilities, of the bases and methods used for their valuation, together with a quantitative and qualitative explanation of any major differences in the valuation bases and methods used in the financial statements. It’s not enough to simply say that differences are caused by valuation at book and market value. Instead, you would be expected to provide a detailed explanation of why Solvency II and statutory financial reporting values differ for each material asset and lines of business. For example, you could provide a comparison of
the impact of discounting, contract boundaries and other assumptions, including a description of the differences in assumptions used. If other methodologies, valuation principles and recognition are used, details about these and the underlying assumptions should be described as well. While the description should be sufficiently self-explanatory for the reader to understand the differences in values, it’s important to bear in mind the three fundamental principles governing these disclosures: Proportionality, materiality and comparability. These principles will help you to determine the right level of detail. For the RSR, you should provide information that would allow the national supervisor to evaluate the quality of the valuation for solvency purposes and the appropriateness of the approaches chosen.
The capital management chapter should describe the capital management activities within your company. The SFCR would include the SCR/MCR and own funds for the reporting year, while the RSR would include information for the full planning horizon (minimum three years) in addition.

PwC All set for Pillar 3 29
A good starting point would be to map the requirements for the RSR and SFCR and then determine what information is available already that can be adapted and what would need to be sourced and prepared from scratch.
Initial output Most insurers produced the narrative report during the preparatory phase and sent this to the appropriate national supervisor by the middle of 2015 (22 weeks after closing for solo, and 28 weeks after closing for group entities). The narrative report will be a shortened version of the RSR, containing some requirements of the system of governance, the valuation for solvency purposes and capital management chapters. In Germany, the management summary was also required in 2015. The preparation and work performed for this narrative report will provide a good foundation for producing the comparable chapters in the 2016 reports, giving you more time to devote to the remaining chapters. For the upcoming day one reporting no structure is defined on the narrative reporting so far, but it makes sense to start with the narrative report from the preparatory phase, drop the chapter on governance and include a chapter on the SCR/MCR.
Next stepsA good starting point would be to map the requirements for the RSR and SFCR and then determine what information is available already that can be adapted and what would need to be sourced and prepared from scratch.
You can then look at what elements of the SFCR could be drawn and adapted from the RSR and work out how delivery of the RSR and SFCR can be co-ordinated with other disclosures.
It’s important to judge what level of explanation would be needed to make the SFCR understandable for a public audience, while still meeting your obligations for materiality and comparability.
It’s important to identify where Solvency II and other disclosures may vary, why and how this can be explained. It’s also important to look at areas of public disclosure that may convey mixed messages or might be picked up by analysts or the media. How can you present this in a way that safeguards the credibility and reputation of your business, both individually and in comparison to your peers?

Source: PwC analysis of the Level 1 legislation and EIOPA preparatory guidelines
Examples
Completeness - Data contains sufficient level of granularity and historic information to identify trends and be able to evaluate the risks
- Data reflects the risks contained in the business- For each homogenous risk group there is a sufficient level
of data available
Reliability - Data is in line with the requirements for statistical and actuarial methods
- Data out of different periods is consistently applied- Data does not contain material misstatements
Consistency - Data does not contain material estimation deficiencies - Data is being recorded in a timely and consistent way
Getting there quicker: Making the most of the ‘best effort’ option in quarterly reporting
The disclosure of quarterly QRTs will be required effectively for the first time on the first quarter of 2016 and during the preparation phase on the third quarter of 2015 (see Chapter 2: ‘Ready for the final push: Overview of full requirements for Pillar 3’). While the extent of quarterly reporting is less than on an annual basis, it would include the balance sheet, premiums, claims and expenses, as well as own funds, technical provisions, assets and MCR. Insurers that meet the criteria for financial stability reporting would
also have to report on specific financial stability information (like lapses) and their SCR quarterly. In addition some Solvency II data needs to be reported in shorter time frames (applicative for Groups and Solo annually).
Irrespective of the prior reporting regime (quarterly versus annually) you will face pressure on resources and faster turnaround times. There are also new elements including the documentation needed to support materiality justifications for simplification and estimation. One of the biggest challenges for insurers is how to deliver a fourth quarter report in addition to the annual report, in parallel with local GAAP and IFRS (if applicable).
Timings for quarterly reporting are tighter than the annual returns. Solo entities would initially have eight weeks to prepare, check and submit the reports, though this would drop to five by 2020. Groups would have an additional six weeks. For financial stability, solo level reporting would be expected within eight weeks. Groups have two additional weeks. The ECB reporting will also come down from an initial eight weeks to five weeks in 2020 and may eventually go down to four weeks.
The other big challenge is ensuring the completeness, reliability and consistency of data (Figure 13 sets outlines the data requirements needed to comply with the Level 1 legislation and EIOPA preparatory guidelines).
In addition to IFRS, you may already have to produce quarterly reports for rating agencies and internal management information. But the Solvency II requirements go beyond the scope and detail for the information you’re currently likely to be collating.
Pillar 3 introduces tight deadlines and exacting standards on data quality and granularity for quarterly reporting, making it difficult to simply apply the annual reporting process to quarterly submission of QRTs. To create a sufficiently streamlined and systematic quarterly reporting process, it’s therefore important to make the most of the opportunities for estimation on balance sheet reporting and simplification on technical provisions (‘best efforts’). So what are the key challenges presented by quarterly reporting and how can you cut through some of the complexity to get over the line in time?
Chapter 5
Figure 13: Data standards

PwC All set for Pillar 3 31
More frequent analysis and reporting would allow for continuous monitoring based on up-to-date financial information and risk-based calculations. It would also be easier to deal with one-off effects when they occur, which would lead to more stable reporting throughout the year.
Advantages and disadvantagesQuarterly reporting is clearly onerous, especially in seeking to establish valuations so quickly and so frequently. The pressure on people and resources is compounded by the need to meet parallel regulatory and statutory reporting demands. Quite a lot of systems and process modification is going to be needed, including the set-up of accounts, booking logic, IT support and an appropriate control environment, especially in implementing the fourth quarter reporting (see Chapter 7: ‘Accelerate and adapt: How the right IT can make your life easier’).
But there are potential benefits. More frequent analysis and reporting would allow for continuous monitoring based on up-to-date financial information and risk-based calculations. It would also be easier to deal with one-off effects when they occur, which would lead to more stable reporting throughout the year. An additional benefit if you carry out full closing rather than partial closing (relying on best efforts approach to some extent) or no closing (completely relying on best efforts) for quarterly reporting would be to reduce the demands of preparing annual disclosures.
In turn, the more quarterly closing you carry out, the more efficient the process is likely to become, with data quality improved and knowledge transfer increased. While Pillar 3 may vie for people and resources with IFRS, it will be possible to draw on some of systems and data sourcing already in place for statutory reporting and develop synergies between Pillar 3 and the planned new insurance contract standard IFRS 4 Phase II (see Chapter 9: ‘One reality: IFRS and Solvency II’.)
Opportunities for simplificationYet, given the shorter timelines for quarterly reporting, it will be difficult to use all of the same processes needed for annual reporting and therefore your business may want to adopt a quicker and easier best efforts approach. EIOPA has given the green light to apply a degree of proportionality to help ease excessive strains. The latest Implementing Technical Standards (ITS)20 make specific reference to the application of proportionality in several areas, including the use of simplified valuation methods or estimations for
the quarterly balance sheet and best efforts basis for preparation of financial stability reporting.
The principle of proportionality would open the door to estimation and simplification as long as it’s in keeping with the nature (e.g. degree of homogeneity of the risks, interrelation of sub-risks, degree of certainty), scale (looking especially at the ‘quantification’) and complexity (strongly connected to nature of the risks, e.g. linear or non-linear interrelations, complexity of applied risk mitigation techniques) of the risks.
Your business would need to decide whether it should opt for full quarterly closing or part closing (e.g. investments) and estimation or simplification in other areas. You would then need to work through the disclosures to define a quarterly approach for each, including the justifications for simplification and estimation.
An example of how the best efforts approach could be applied in practice would be life insurance obligations. A best estimate of the technical provisions could be derived by using a roll-forward calculation that takes account of the occurred cash flows and new obligations. In addition, the best estimate would need to be sensitive to movements in financial parameters such as interest rates.
Similarly, while there is no exact calculated value for pension obligations available during the year, it’s possible to create a simplified result considering contribution and benefit payments and taking into account changes in interest rates and significant movements in the underlying contractual obligations (e.g. acquisition and disposal of businesses).
Next stepsFigure 14 sets out a good way to structure the setting up of a quarterly reporting analysis, including whether exact determination of the QRT is feasible and, if not, how a best effort approach could be applied. 20 EIOPA: https://eiopa.
europa.eu/Publications/Reports/EIOPA-BoS-15-115_Final_report_ITS_Regular_Supervisory_Reporting.pdf https://eiopa.europa.eu/Publications/Reports/EIOPA-BoS-15-107_Final_Report_GL_Financial_stability.pdf

PwC All set for Pillar 332
Step one: Functional analysis
1. Define quarterly approach:
(a) Full closing
(b) partial closing
(c) no closing
2. Determine which QRTs must be delivered for quarterly reporting (including ECB and financial stability reporting)
3. Define fourth quarter approach:
(a) Calculate required figures in quality level of annually reporting in quarterly timeline to prevent double work
(b) Calculate quarterly figures on estimation basis first and figures for annually reporting later in the process
(c) Mixed approach (if possible using first ‘quality’ approach and where time constraints are a factor in areas such as technical provisions using the second ‘estimation’ approach)
4. Determine how to align the annual QRT reporting process – which items must be provided and what is a sufficient level of granularity?
Step two: Define valuation/calculation method and assure data quality
1. Define required data quality based on nature, scale and complexity of the risks (materiality assessment)
2. Document the results to justify your rationales to your supervisor
21 QE = End of Quarter
Figure 14: Example template to define quarterly approach in each item21
Source: PwC
ID QRT QRT Cell Cell Name Log file explanation Data item
1 S.02.01. (BS-C1) A26 Deferred tax assets
An asset that may be used to reduce any subsequent period’s income tax expense.See cross-templates checks tab CAS 8
1.001
2 S.02.01. (BS-C1) A3 QE+19 Tangible assets which are intended for permanent use and
3 S.02.01. (BS-C1) A4
4 S.02.01. (BS-C1) A21 QE+15 Yes
Needs to be reported quarterly? (Yes/No)
Responsible department
Short description of annual method
Expected delivery date by system
(days after quarter end for preparing
data)
Annual approach possible for
quarterly reporting? (Yes/No)
If no, description of simplified
approach
YesLocal tax
department/Accountant
Using tax calculation tool
provided centrally or locally
QE+22 Yes
Yes Local accounting department
Market value is used QE+19 No
Use data from annual reporting (true up, if IFRS booking value
materially changes)
Yes Asset managerUsed market value provided by asset
managed
Yes Local accounting department
Discounted IFRS value and generation of
default adjustment
QE+15 Yes

PwC All set for Pillar 3 33
Step three: Allocate responsibilities and define processes
1. Determine who is responsible for the delivery of the items needed for specific quarterly QRTs (e.g. finance, risk management, actuarial, asset management) and how the chain of information will be brought together (including timely data input of required information to perform the valuation/calculation)
2. Set out appropriate processes and controls like for the annual reporting
Step four: Create realistic delivery plan
1. Define closing calendar on quarterly closing
2. Implement quarterly closing or roll-out/training on simplified valuation/calculation method
3. Dry-run to be prepared for first effective delivery
In most cases, either the approach used in the annual reporting or a simplification will provide the answer. But if not, you could look for possible solutions through further training, improved efficiency or intelligent sourcing. You might also look at whether it would be possible to determine some values at an earlier date. Other areas for assessment include whether days could be saved not only for a specific item, but for the entire process (e.g. fewer days for consolidation or calculation of deferred taxes).
In seeking to create an efficient basis for delivery, it’s important to make full use of what’s available elsewhere, including planning/forecasts and internal management reporting. It’s also important to look at ways to speed up the process. Within larger companies, this is likely to include a combination of fast close (e.g. more automation) and swifter reporting and early close (projecting ahead before quarter end).

Seeking assurance: Audit requirements for Pillar 3
Only a handful of states such as the UK and Belgium currently (already in 2015) require an external audit of regulatory returns. But the increased scope and complexity of Solvency II mean that the remaining countries are now looking at what level of independent assurance would be necessary and defining it at a local level.
This is a controversial area, however. Opponents of external audit believe that it would add needless further cost to an already expensive compliance exercise and insist that it should be the supervisor’s job to assure the quality and reliability of the Pillar 3 disclosures and the underlying evaluations.
Advocates of audit believe that it would provide boards, analysts and investors with the kind of assurance they have over financial disclosure in statutory reporting. Supervisors may not have the capacity to provide the same level of assurance. Moreover, in the absence of specific Solvency II audit requirements, auditors would have to work on the basis of a less clearly defined general obligation to provide an opinion on the solvency and financial position. A clear audit scope for Solvency II would therefore enhance the efficiency of future audit.
With some areas of Solvency II open to interpretation and hence inconsistency, audit could also help provide a catalyst for more standardised approaches. Among the key areas that could benefit from greater harmony is the assessment of eligibility and quality of own funds at group level.
Varied requirements at local level EIOPA has chosen not to push for common EEA-wide external audit requirements, though it did publish a document on the “Need for high quality public disclosure: Solvency II’s report on solvency and financial condition and the potential role of external audit” in July 2015.22 EIOPA believes that external audit can be a “powerful tool” in ensuring high quality public disclosure and that the balance sheet, own funds and capital requirements could fall within its scope.
While some including EIOPA believe that external audit could provide greater assurance and consistency in Pillar 3 reporting, others are against it, viewing it as a needless extra cost. As the decision over what areas of Pillar 3 should be subject to mandatory audit will be largely left to member states, the local requirements are as yet unclear in many countries and are likely to vary significantly across the EEA. So what are the pros and cons for Pillar 3 audit, how will the demands differ from country-to-country and how might pressure from analysts and investors create the need for audit verification over and above minimum regulatory expectations?
Chapter 6
22 Source: https://eiopa.europa.eu/Publications/Other%20Documents/EIOPA_high%20quality%20public%20disclosure_Solvency%20II.pdf].

PwC All set for Pillar 3 35
Analysts and investors may well also push for assurance that goes beyond the minimum – it would be difficult for a company to present unaudited numbers when their peers’ figures have been reviewed.
Based on these expectations from EIOPA each member state is defining a country specific audit scope.
As each country is free to apply its own local stipulations, the result will be a mismatch of different audit requirements across the EEA, creating particular challenges for international groups. It is expected that the market itself will create some kind level playing field in the coming years.
The maximum audit scope discussed so far (as of August 2015) would cover the SFCR, including the balance sheet, own funds, SCR/MCR, risk management and governance. Austria and most probably also Belgium are set to include all of this, though Belgium will expect these elements for financial year 2015, while Austria would give companies until 2017 (as audit is based on the SFCR). The UK requires audit review in 2015 during the preparatory phase for internal model users and large standard formula companies. This would follow a similar scope and accelerated timeline to Belgium, along with a ‘review and recommendation’ report.
At the other end of the spectrum, Germany is likely to confine audit requirements to the balance sheet. However, the auditor would be expected to inform the local supervisor if the company is not compliant with SCR/MCR requirements. In France, discussion are continuing on whether to include the economic balance sheet, own funds and the SCR/MCR in the audit. Furthermore, it is not yet decided if the opening balance sheet will be included.
More than just the minimumBoards may set a higher bar than the national minimum, not only in gaining assurance for themselves, but also in optimising value from the audit. Some large insurers have already begun discussions with their auditor on integrating financial and regulatory reporting. The rationale for integration is likely to increase as the economic basis for financial and regulatory reporting becomes more aligned following the move to IFRS 4 Phase II and IFRS 9.
Analysts and investors may well also push for assurance that goes beyond the minimum – it would be difficult for a company to present unaudited numbers when their peers’ figures have been reviewed.
Overcoming practical challenges
1. Dealing with inconsistent audit requirementsAs a large group, you may have to follow different audit requirements across your operating territories. It will therefore be important to establish a group view on the local statements and audit opinion that allows the group to draw from local findings.
2. Integrated view on financial and regulatory reportingAn integrated view could prove more cost-effective and help build the regulatory numbers into overall financial and business planning. But it could create organisational challenges. These include the integration and standardisation of data sources and the adjustment of IT infrastructures to ensure appropriate quality and adequate process times. Further challenges include creating consistent assumptions for accounting, solvency balance sheet and internal (risk) valuation, as well as consolidation across a variety of responsibilities, with appropriate rationales and explanation of differences.
To manage these new and changing requirements and to harmonise the different reporting requirements, it’s important to develop an integrated and well-designed closing process. This would be supported by standardised controls, clear definition of responsibilities and the reconciliation of different delivery methods and timelines.

PwC All set for Pillar 336
To manage these new and changing requirements and to harmonise the different reporting requirements, it’s important to develop an integrated and well-designed closing process. This would be supported by standardised controls, clear definition of responsibilities and the reconciliation of different delivery methods and timelines.

PwC All set for Pillar 3 37
There will be no EEA-wide minimum requirements, how the audit will be carried out and how it will be reported. Member states and local supervisors will set their own stipulations, creating varying demands and inconsistencies in application
As financial and regulatory reporting move closer into line, it will be important to look at how preparation of the disclosures could be more closely integrated. Audit is a key area for such evaluations.
Ultimately, it’s important to look at how to maximise the value from any audits or validations you have carried out. Does the scope and approach provide sufficient assurance for analysts, investors and the board? How could the audits be rationalised to avoid inconsistencies and needless extra costs?
Next stepsYour business should expect and prepare for an external audit of certain aspects of the Solvency II requirements and the corresponding interdependencies with other reporting and disclosure demands.
There will be no EEA-wide minimum requirements, how the audit will be carried out and how it will be reported. Member states and local supervisors will set their own stipulations, creating varying demands and inconsistencies in application.
The first step is to follow developments in the local legislation and requirements of key analysts to find out what they are likely to expect. Even where your legislator or supervisor sticks to limited demands, you would need to assess the impact of different expectations in other operating territories and what the markets are likely to want.
The next step is to look at what is needed to bring risk evaluations up to the standard of audited reporting. While some of the information may have been established for Solvency II purposes or used in internal evaluations, it hasn’t been publicly disclosed before. Solvency II provides some guidance on the necessary verification, oversight and controls. But it will also be important to look at the comparable standards set for statutory reporting.

Accelerate and adapt: How the right IT can make your life easier
The availability, quality, granularity, lineage (audit trail) and management of data from source to reporting system are among the biggest issues for Pillar 3 implementation.
From sourcing and adjustment of data, through to consolidation, validation and preparation in the required format, the demands on technology are extensive (Figure 15 outlines the requirements, a typical IT landscape and checklist of the tools, software and interfaces that are likely to be needed).
While the time until Solvency II goes live is limited, there are solutions available that could take six months or less to implement. If you opt for an interim solution, there will of course be opportunities to upgrade later.
However, it’s important to recognise that there is no off-the-shelf solution that can take care of all your Pillar 3 needs. Vendors are offering a range of packages they say are comprehensive. But most only really cover the reporting stage of the process, which is just the tip of the iceberg. Underneath are the extraction and adjustment of vast reams of data from multiple sources. Delivering the level of detail required within the tight turnaround times is likely to demand much greater consistency in the source data. At the very least, it’s important to review your data
warehousing capabilities. It’s also important to mobilise the business around who needs to supply what and when along an extended data sourcing chain. The companies out in front have been reviewing the data demands across all three Solvency II pillars and are now looking at how to close any gaps, iron out potential hold-ups and improve the quality of what is being supplied.
Management reportingManagement will have their own requirements, which can be sourced and customised from the core systems. The IT architecture would include tools and software to present data and KPIs in specific reports, dashboards and/or analysis environments for specific users through various media (intranet, handheld, etc.) – see Chapter 1: ‘The new reporting: Turning information into insight’.
Cross-reporting criteriaWith your business facing a range of financial, regulatory and other reporting demands, the same raw data may need to be presented in many different formats or aggregation levels. It’s therefore important to ensure that your data and wider systems solution are adaptable enough to deliver outputs for multiple requirements. Key considerations include the upcoming move to IFRS 4 Phase II (see Chapter 9: ‘One reality: IFRS and Solvency II’).
Data qualityThe data for the QRTs has to be validated by the software tool with validation rules from the Data Point Model of EIOPA. Validation rules and plausibility checks can be added individually by the user to increase the insight of the report without replacing EIOPA rules.
The choice and implementation of IT is a vital element in the preparations for Pillar 3 and the subsequent shift from project to business as usual, enabling insurers to accelerate reporting turnaround, generate valuable new insights and adapt to changes in business and regulatory demands. So what are the key foundations for an effective IT platform and how can you ensure that all the elements are operating efficiently?
Chapter 7

PwC All set for Pillar 3 39
When selecting a software solution, it’s important to check whether it already has integrated validation rules and offers the opportunity of implementing individual plausibility checks/validation rules. It should also be possible to correct data within the software solution. If such an option is used, it’s important to ensure that an audit trail is implemented and data cannot be easily manipulated.
Range of choicesWhile most large insurers have already chosen a system solution for Pillar 3 and are currently finalising the implementation, a lot of businesses are still trying to get through with spreadsheets. Even insurers where implementation is relatively advanced are facing challenges in aligning these developments with management demands and building them into business as usual. The real crunch is going to come in 2017 when all the
Figure 15: Key technology requirements for Pillar 3
PwC analysis of Solvency II requirements
ChecklistRequirements
There are a number of requirements that need to be satisfied for Pillar 3 reporting. These map across from a typical insurance IT landscape to the key requirements and the checklist to validate these.
Generic IT Landscape
Source data
Data Integration
Data Integration
Applications
Reporting tools
Reporting
Data Storage
• Interface to other systems available
1 Sourcing and validation of data from multiple sources/formats
2 Validation back to statutory (local/IFRS/GAAP) data
3 Enrichment of data in a controlled environment
4 Consolidation, translation and elimination
5 Data validation across the multiple templates
6 Reporting in required format
7 Submission to regulator via XBRL (or other taxonomies required) on EIOPA QRTs and QRTs required locally
• Data warehouse functionality
• Correction of data possible?
• Validation rules already integrated
• Possibility to define further validation rules?
• Standard formula calculations possible?
• Internal modelling possible?
• Scenario analysis and stress testing possible?
• Editorial tool to create qualitative reporting?
• Output in XBRL-format possible?
• Automatical use of latest QRT-templates?
• Management reports/dashboard possible
• Process and controls management available?
• Workflow management possible?
• Projections for ORSA possible?
Financial systems
Fraud systems
Policy administration
OtherCRM systems Underwriting systems
ETL tooling
ETL tooling
Consolidation
Disclosure management
Management reporting
Calculation engines
Financial Risk
InvestmentSolvency II
Risk management
Wor
kflow
& d
ocum
ent m
anag
emen
t
Met
adat
a m
anag
emen
tOne version of the truth/Details area
Reporting data warehouse
Stag
ing
area
Res
ults
ar
ea
Management reporting
EIOPA returns
National reportingtemplates
RSR SFCR
Quantitative Qualitative

PwC All set for Pillar 340
Data is the most common hold-up. This not only includes sourcing and ensuring consistency, but also how to assure quality control and sustain an appropriate audit trail of data supply. This can be especially difficult when taking data feeds from asset managers and other third parties.
various statutory, regulatory, supplementary and management reporting have to be prepared in parallel. This has to become a highly automated ‘industrialised’ process as without it, meeting reporting demands will be unsustainably labour intensive (see Chapter 8: ‘Sustainable footing: Moving from implementation to business as usual’).
While our research into what kinds of systems solutions local companies are opting for reveals a strong showing for the big name vendors, the range of solutions goes much further to encompass a lot of new and smaller niche providers. Larger companies tend to be looking for solutions that would allow them to build on their existing capabilities, consolidate information from multiple entities and adapt to IFRS 4 Phase II and other future demands. Smaller and solo entities are more likely to opt for dedicated Pillar 3 packages, though far from being off-the-shelf solutions some envisage, these will all require significant customisation.
Getting on trackThe crucial first step is to look closely at what is demanded under Pillar 3 and map this against technology requirements.
If you’re still drawing up plans, it’s important to determine what capabilities you already have in place, your appetite for change, level of required/desired investment and longer term strategy for technology. If you’re already implementing a solution, it’s important to check how this aligns with business requirements and its adaptability to the demands of IFRS 4 Phase II.
Given the increasingly pressing timelines for Pillar 3 reporting, it’s important to consider how much customisation is needed and how to tackle hold-ups and accelerate delivery.
Data is the most common hold-up. This not only includes sourcing and ensuring consistency, but also how to assure quality control and sustain an appropriate audit trail of data supply. This can be especially difficult when taking data feeds from asset managers and other third parties. This heightens the importance of carrying out internal dry-runs before the data needs to be sourced and prepared for external reporting.
A number of tools and techniques are now available to improve data quality and consistency and establish governance over master data. Further steps include agreeing data quality standards and remediation measures with third party administrators.
Within actuarial and risk systems, a lot of the issues centre on multiple sourcing, performance issues hampering runs and difficulties interfacing calculation results with proprietary data warehouses.
A number of supporting tools and techniques are coming on stream to manage closing and reporting processes. These include smart close systems designed to speed up turnaround through the assurance of right first time data, reduction in adjustment and rationalisation of processes.
A lot of the time between now and go live will be devoted to overcoming these hold-ups and getting over the line. Ultimately, however, Pillar 3 processes need to be put on a stable and sustainable footing, with effective systems a key foundation for this.

PwC All set for Pillar 3 41
Sustainable footing: Moving from implementation to business as usual
If Pillar 3 implementation could be compared to a building development, then many insurers are still finishing the floors and walls. The final stages of putting on the roof and fitting out the interior are still some way off.
As such, implementation is still being run at arm’s length from day-to-day business operations. Direction comes from a board-led steering committee and project manager. The main site work is being carried out by a series of working groups, who are responsible for applying the rules to the particular circumstances of the business, developing the necessary systems and putting in place the chains of information, verification and reporting. Typically, there are quite a few different contractors on site. Frontline teams are increasingly aware of what’s coming, but embedding this in new or updated BAU processes to ensure and demonstrate ongoing compliance has taken a back seat. And like all building sites where staff are working to tight deadlines, this is a busy, dirty and noisy place.
Yet the project has to end ready for the tenants to move into the building. Embedding Solvency II processes into the day-to-day operations of the business, of which disclosure is a key element, is a compliance requirement (“risk management
happens throughout the organisation”) and therefore can’t be put back to an unspecified future date. Having so many people diverted from their day jobs and reliance on contractors and consultants clearly can’t continue indefinitely. Building Pillar 3 reporting into BAU will also bolster supervisors’ confidence that your risk management processes are robust, the information being reported is reliable and that the demands of the Directive have appropriate influence over how the business is run.
From a business perspective, Pillar 3 is going to be an important element of how your organisation is judged by analysts, investors and rating agencies (we look more closely at this in ‘Chapter 1: The new reporting: Turning information into insight’). Business understanding of the numbers and their implications is vital. Moreover, the newly developed models can provide telling strategic insights in areas ranging from risk appetite setting to what markets to enter, build up or scale back.
Defining efficiencyAll aspects of Solvency II including disclosure can only be sustainable if they are efficiently organised. The efficiency criteria have four basic dimensions:
• Time-efficient: Already tight reporting deadlines will become even tougher, so speed is of the essence
• Disclosure-efficient: Ensuring Solvency II reporting is aligned with local GAAP or IFRS reporting
• Cost-efficient: Using common systems, models, staff, processes and information streams – and maybe even some of the same reports – for
An efficient shift from Pillar 3 implementation to business as usual (BAU) is going to be crucial in bolstering regulatory confidence, curbing needless cost and disruption and realising the full business benefits of your investment in new information systems. So what are the key elements of BAU, who should do what, what skills are needed, what resources are required on the ground and how can you overcome the inevitable snags to ensure a smooth transfer and sustainable Pillar 3 operation?
Chapter 8

PwC All set for Pillar 342
As with any adjustment to the BAU programme, a lot of existing processes will need to be cleared out. Identifying them might be more challenging than expected as they might be ‘hidden’ in undocumented mechanical processes and/or old habits of staff.
Solvency II, statutory reporting and internal disclosures. The right timing of processes is crucial in smoothing delivery and preventing peaks as much as possible during the year
• Governance-efficient: Clear roles and responsibilities and reporting governance (as fixed on the entity specific reporting policy) for data generation (calculation and valuation), data validation and sign-off as well as the support function (IT and business-related)
Preparing for BAUSo how can you prepare for the transition? The first priority is to allocate roles and responsibilities within the business, including those currently undertaken by consultants and contractors:
• Preparing data (sourcing, calculation and reconciliation) for QRTs and reports
• Preparation of other reports like ORSA and the actuarial function report
• Conduction of validation of technical provisions (and internal model) incl. data quality validation
• Management sign-off
• Following-up on feedback from supervisory authority, as well as internal and external audit comments/findings and adjusting existing system in case of changes in regulation
You will have to determine how existing internal systems and processes will need to be modified, upgraded and optimised, if you haven’t done this as part of the implementation phase:
• Support function
• Reporting and disclosure
• Performing required changes to policies, guidelines, valuation handbooks, processes and controls
• Performing design and effectiveness assessments on internal controls
As with any adjustment to the BAU programme, a lot of existing processes will need to be cleared out. Identifying them might be more challenging than expected as they might be ‘hidden’ in undocumented mechanical processes and/or old habits of staff.
Making the changeThe practical processes and procedures for building Pillar 3 into BAU will be the same as for any other major change programme:
1. Ensure everyone knows what to do and how to do itBusiness understanding of what needs to be done and by whom is often far from clear, especially when so much has been left to project teams.
The first step is therefore to ensure the scope of and timeframes for the deliverables (policies, governance system, internal control system, QRTs, reports, etc.) are communicated and understood across what can be long and highly interdependent chains of data sourcing, evaluation and reporting. Responsibility for key deliverables should be assigned to named owners, who are equipped with the budget and authority to make this happen. The designation of deliverables and responsible owners would form the basis for a clear and transparent plan to manage the transformation, including targets for transition and reporting progress against these.
Given the diffuse nature of the information chains, key priorities include working out how to bring the different pieces of the jigsaw together. This includes ensuring that people/departments don’t operate in siloes that only look at their own narrow deliverables, but rather understand and work towards their joint responsibility to deliver. For example, the numbers are calculated in different departments (e.g. actuarial for best estimate liabilities, risk management for SCR and finance for own funds). A mutual understanding of the respective processes is vital, especially if a late adjustment is needed in one area that could affect others (e.g. a change in best estimate liability would require a recalculation of SCR and deferred tax and, if it’s a group, a new group-wide reconciliation). Moreover, it’s important to recognise that Pillar 3 is in itself part of a wider jigsaw puzzle and therefore a further priority is how to ensure consistency between the deliverables and the interaction across all pillars.

PwC All set for Pillar 3 43
The board members and senior management who are responsible for signing off the Pillar 3 disclosures should be fully involved throughout the process.
Recognising that Pillar 3 is only one of the Solvency II deliverables and one part of wider reporting processes, it’s important to look at the timetables for delivery and governance so that input is evenly spread and spikes avoided as far as possible. Think about how to schedule the ORSA and the quality assurance (QA) of the actuarial function (including the report). In case of the QA of the actuarial function, you have to decide whether it should be done before the external auditor will do their QA within the tight reporting timelines or to carry it out afterwards.
3. Live according to the governanceIt’s vital to ensure that the Solvency II governance system, of which Pillar 3 reporting is an integral element, plays an active part in the running of the business. While there may be a temptation to side-line it to save time, money and potential duplication of effort, this would make it very difficult to demonstrate that Solvency II is genuinely embedded into decision-making. Active governance includes prompt communication and proactive identification and tackling of potential problems. While unforeseen difficulties are bound to emerge, supervisors will need to be assured that fast and effective identification and escalation procedures are in place.
4. Don’t hide behind the governanceGovernance will evolve and there needs to be sufficient flexibility and receptiveness to change to accommodate this.
Solvency II processes will have to be updated to meet changes in regulation. Further modifications will be needed to address evolving supervisory expectations. Solvency II governance will in turn evolve to take account of changing circumstances and developments in best practice – if it doesn’t work change it.
At the end of the day, it should be administrative, management or supervisory body (AMSB) or other management that signs-off. They cannot hide behind a committee that is part of the governance framework. Similarly, solo entity boards can’t simply defer to ‘group’. If the solo entities rely upon group’s views, then they should disclose this and explain why they believe that such reliance is allowed.
As Pillar 3 moves into BAU, you will need to allow enough time for management review and sign-off and internal (or to some extent maybe external) challenge. The board members and senior management who are responsible for signing off the Pillar 3 disclosures should be fully involved throughout the process. Given the unfamiliarity of some of the numbers and the concepts that underpin them, the extra time to prepare the disclosures in the initial years might be best deployed helping the people who sign them off to get comfortable with the results, rather than using it up on evaluation.
2. Organise clear governanceGovernance is far more than just signing off some numbers. Different parts of the organisation will be responsible for review and assurance. It’s therefore important to ensure that the reporting governance is well defined, with clear illustrations of the roles of the different functions. Key priorities include creating a clear demarcation between actuarial responsibilities (one side producing technical provisions and showing these are in line with guidance, while the other provides necessary challenge and concludes an opinion).
It’s also important to be clear about the ownership of the assessment of data quality as this might be different for particular blocks of data:
Block of data Department responsible
Technical provisions Data used in valuation should primarily be the actuarial function’s responsibility
SCR/MCR Data to capture the risk profile and translate this into SCR/MCR should primarily be the risk management function’s responsibility. While there will be some contribution form the actuarial team, risk should own the evaluation
Investments Asset manager and investment department
Other assets and liabilities as well as other accounting figures
Finance department
Own funds, including tiering of own funds Risk management function and finance department
Reinsurance Reinsurance and/or actuarial department

PwC All set for Pillar 344
From a BAU perspective, it’s important to ensure that the task force’s work is aligned with day-to-day line management rather than becoming just another standalone project steering committee.
Overcoming the teething problemsClearly, it’s one thing to map out requirements and brief people about what they need to do and another to make it all happen. This will be a huge learning curve for all involved, with all the inherent teething problems this can create. Deadlines may be punishingly tight and internal approval processes incomplete. There may also be unexplained differences between local GAAP, IFRS and Solvency II and miscommunication/inconsistencies between group and solo entities.
A useful way to address these teething problems is to set up a dedicated task force. The task force can pragmatically deal with the initial snags and ensure the need to tackle these issues doesn’t distract the key staff involved in the reporting process (with potential domino effects on mandatory deliverables). From a BAU perspective, it’s important to ensure that the task force’s work is aligned with day-to-day line management rather than becoming just another standalone project steering committee.
Next stepsEven before the floors are finished and the roof is up, good owners and developers will already have plans in place to start the fitting out and get ready for occupancy. Similarly, the basis for building Pillar 3 into BAU is a clear transition plan, which can be prepared while implementation is being finalised. The blueprint for BAU should include a mandate for delivery from the board, assignment of ownership for key deliverables and tangible targets against which to measure progress.
Everyone should know what is required of them, by when and their interdependencies with others. They should be fully trained on the new requirements so they are ready to go when the plan gets underway and to allow prompt/orderly transition from contractor/consultant to internal delivery. With a lot of the same key people likely to be critical to delivery, the overall plan should look at how to allocate resources in a way that avoids overlaps and the resulting delays.
It can’t all be done overnight, so a process of practice, feedback, address and optimise is vital.

PwC All set for Pillar 3 45
One reality: IFRS and Solvency II
The current insurance statutory reporting standard (IFRS 4) is an imperfect fix, in which a patchwork of largely incomparable national approaches to liability measurement has been retained. The planned new IFRS 4 Phase II model aims to deliver a greater degree of comparability and transparency overall, though the long development process attests to the difficulties of meeting these goals in a complex and diverse business like insurance.
This planned new IFRS measurement model is a significant departure from current accounting in most EU states. Like Solvency II, implementation will have a profound effect on the infrastructure of accounting and reporting, actuarial modelling, data requirements, systems, processes and controls. It will also join Pillar 3 and other aspects of Solvency II in requiring closer interaction between finance and actuarial teams. Taking account of the requirements that are already being implemented for Pillar 3 will therefore be vital in developing an integrated approach to data processing and reporting.
Timeline for IFRS 4 Phase IIMost of the main planks for IFRS 4 Phase II are in place, the main exception being participating contracts. The International Accounting Standards Board (IASB) expects to finish the discussions and deliberations on participating contracts in 2015, but is also considering the need for testing and how to support implementation with a final standard to follow after 2015.23 There would then be around three years to implement and comply with the new IFRS. The earliest effective date would therefore be 1 January 2019, though the need for transition and comparison between new and existing statutory reporting means that some of the key deadlines will be earlier. Based on the current discussions the implementation date could be postponed by one additional year.
Overlaps and differences between Solvency II and IFRS 4 Phase IISo how will the new IFRS for insurance contracts work? The standard applies to all contracts that meet the definition of insurance, which depends on whether significant insurance risk is transferred to the insurer, and is thus largely unchanged from current IFRS. The liabilities are measured as the amount required to fulfil the contract over its lifetime, with a series of components (‘building blocks’) coming together to provide the measurement (Solvency II is based on an exit price value, rather than a fulfilment concept).
Building block one – Cash flowsEstimate of the future cash flows needed to fulfil the contract. Solvency II requirements are more prescribed than IFRS and hence there is less scope for interpretation. There are for example no deferred acquisition costs under Solvency
While there are important conceptual differences between Solvency II and the planned new IFRS for insurance contracts (IFRS 4 Phase II), they have enough similarities to create common foundations for valuation and present a consistent picture of your performance and prospects (‘one reality’). And given the investment in Solvency II and potential for synergies with IFRS 4 Phase II in areas such as data collection, modelling systems and reporting lines, it would make sense to use what’s being put in place for Pillar 3 as the starting point for IFRS 4 Phase II implementation. The same would apply to the incoming new financial instrument standard (IFRS 9). So how can you make the most of the overlaps to create a more efficient reporting infrastructure and consistent view of your business?
Chapter 9
23 IASB (http://www.ifrs.org/Current-Projects/IASB-Projects/Insurance-Contracts/Documents/2015/High%20level%20project%20update.pdf)

PwC All set for Pillar 346
For Solvency II, the risk-free rates, volatility adjustment and significant components of the matching adjustment will be prescribed by the EIOPA, whereas IFRS 4 Phase II would allow a top-down or a bottom-up approach that reflects the entity specifics.
II, while certain overhead expenses might be excluded under IFRS.
Building block two - DiscountingDiscounting of building block one to reflect the time value of money within the cash flows.
For Solvency II, the risk-free rates, volatility adjustment and significant components of the matching adjustment will be prescribed by the EIOPA, whereas IFRS 4 Phase II would allow a top-down or a bottom-up approach that reflects the entity specifics.
Conceptually, the top-down approach in IFRS Phase II is similar to Solvency II through the application of a matching adjustment. However, the required IFRS 4 Phase II criteria to reflect the characteristics of the liabilities and calibration of the adjustments to the risk-free rates might be different.
Building block three – Risk adjustmentAn adjustment for risk is included to reflect the compensation the insurer requires for bearing uncertainty. However, the Solvency II requirements are highly prescribed within a cost of capital approach and differences may arise with IFRS 4 Phase II, which does not stipulate a particular method. This includes the technique applied, the risks included, the calibration adopted and the level of diversification benefit.
Building block four – Contractual service marginThe contractual service margin (‘CSM’) represents the future unearned profits of the contract to be recognised in the income statement over the life of the contract. It eliminates any Day 1 gain on the contract by deferring the recognition to future periods. Day 1 losses are recognised immediately in profit or loss. There is no comparable technical provisions component in the Solvency II balance sheet.
Unit of accountThe objective of IFRS 4 Phase II is measuring individual insurance contracts, but entities are allowed to aggregate if it meets this goal. Combining profit-making and loss-making contracts at initial recognition isn’t allowed. Solvency II reporting is based on lines of business. The determination of the portfolio criteria for IFRS 4 Phase II is likely to be on a more granular
level than Solvency II and could have a significant impact on the complexity of accounting.
Different approaches for short duration contracts and participating businessThe IASB has proposed a simplification to the building block approach (‘premium allocation approach’) for short duration contracts, which is not too dissimilar from current accounting under IFRS 4. The distinctive nature of participating business is reflected in a separate approach, which addresses the close interrelation between assets and liabilities. Industry groups have come up with proposals for consideration that are currently being discussed. For Solvency II purposes, there are no additional models.
Income statementSolvency II does not have an income statement or concept of Other Comprehensive Income that are required for accounting purposes. The IASB wants to introduce an ‘earned premium approach’ rather than simply recognising all the premium payments on receipt. Recorded revenues would be calculated by evaluating expected expenses and claims rather than cash receipts and any deposit components should be excluded. This is a big change to the income statement and will take some time getting used to, particularly in the life sector.
Aligning Solvency II and IFRS As we’ve described, there are a number of key differences between Solvency II and IFRS 4 Phase II in areas ranging from the general concept to the unit of account and risk margin. As far as possible, however, both reporting regimes should communicate a consistent basis for steering your business and determining how it’s judged by analysts and investors, from the risk exposure view for Solvency II and from the accounting point of view for IFRS. Many insurers also want to capitalise on the synergies between the two, especially common data input, common systems and processes and common valuation of the first three building blocks of the IFRS 4 Phase II measurement model.
1. Common data inputA key foundation for creating a ‘single version of the truth’ is the establishment of a common database for reporting systems. This would increase the efficiency of data recording and

PwC All set for Pillar 3 47
For the first three building blocks, it will be necessary to analyse which of the elements, techniques, assumptions etc. used for Solvency II calculations could also be deployed in the calculation of insurance contract liabilities under IFRS 4 Phase II.
2. IFRS 4 Phase II sub-ledger
• Accounting systems need to reflect numerous IFRS 4 Phase II core functional requirements, such as aggregating data to unit of account level, calculation of unwinding effects based on locked-in rates, calculation of the effects of changes in expected future cash flows and changes in discount rates
• In applying the accrual accounting principle, functionalities are needed to separate subsequent measurement effects to respective periods, as well as a functionality for archiving of input data
• New functionalities will also be needed for the CSM – within sub-ledger or in actuarial core systems– as there is no equivalent concept under Solvency II
3. Actuarial systems
• A number of adjustments and extensions will be required for actuarial systems – now used for Solvency II calculations – to generate IFRS 4 Phase II-compliant cash flow projections and execute risk adjustment calculations
4. Data and reporting systems
• IFRS 4 Phase II will require new or more granular data for insurance contract liabilities calculations and reporting disclosures in comparison to Solvency II reporting
• The level to which calculations are required (unit of account) could have significant cost implications
• A fundamentally different style of income statement is also likely to necessitate what could be a significant overhaul of general ledgers, consolidation tools and reporting
5. Management implications
• It’s important to identify the right KPIs for the period of change, transition and thereafter. These considerations should take into account the local jurisdiction and the current accounting and regulatory measures (see Chapter 1: ‘The new reporting: Turning information into insight’)
enhance data quality, while ensuring decisions and disclosure are based on consistent and compatible information. Key challenges include bringing data granularity down to what is required for IFRS 4 Phase II.
2. Common systems and processesCommon systems and processes would not only improve efficiency and return on investment, but also help to augment the ‘one reality’. The need for streamlining is heightened by the fact that many of the same people will be engaged in both IFRS and Pillar 3 reporting.
3. Common valuation of the first three building blocks of the IFRS 4 Phase II measurement modelWhile much of the core data sourcing and evaluation can be aligned, it’s important to take account of the differences.
For the first three building blocks, it will be necessary to analyse which of the elements, techniques, assumptions etc. used for Solvency II calculations could also be deployed in the calculation of insurance contract liabilities under IFRS 4 Phase II.
Next steps: Ready for the futureIn seeking to maximise consistency and create common foundations for Solvency II and IFRS 4 Phase II, it’s important to build the additional/different demands of IFRS 4 Phase II into the development of your reporting infrastructure for Solvency II:
1. Governance in accounting, actuarial, risk management and IT departments
• Solvency II experienced staff should be closely involved in the IFRS 4 Phase II project to make sure that the potential synergies are identified and realised
• Assign clear roles and responsibilities for data, methods/calculations, processes etc. as part of the implementation plans
• Define the common functionalities for systems and processes
• Develop closer understanding and collaboration between risk, actuarial, finance and investor relations teams
PwC All set for Pillar 348
IFRS 9 will be effective for IFRS users from the beginning of 2018 and therefore the effective date is unlikely to align with IFRS 4 Phase II.
• The new IFRS would in turn lead to significant modifications to KPIs, management and external reporting. In particular, the CSM would provide the main basis for determining the estimated profitability of the business
6. Other projects and competition for resources
• Besides Solvency II and IFRS 4 Phase II, your business is likely to be facing many other challenging projects including the new financial instrument standard (IFRS 9), revenue standard (IFRS 15) and increased focus on capital for those viewed as globally systemic
• The insurance industry lacks a deep pool of skilled resources that can get these projects over the finish line. A forward-looking rather than reactive approach to judging requirements is therefore vital in identifying the resources available internally and externally and using specialists in the most targeted way
24 IASB (http://www.ifrs.org/Current-Projects/IASB-Projects/Insurance-Contracts/Documents/2015/Insurance-Contracts-without-Participation-Features-March-2015.pdf)
IFRS 9IFRS 9 will be effective for IFRS users from the beginning of 2018 and therefore the effective date is unlikely to align with IFRS 4 Phase II. However, the IASB will consider ways to ensure that entities that issue insurance contracts are not disadvantaged.24 IFRS 9 is divided into three phases: classification and measurement, impairment and hedge accounting.
The classification and measurement phase would require an in-depth look through your investment portfolio to identify the appropriate classification category for each investment, taking the interrelation with IFRS 4 into account to avoid any accounting mismatches. Measurement is based on the classification category.
The impairment phase marks an important shift from an incurred to an expected loss model, which would require forward-looking as well as historic analysis. Developing a robust expected loss model is challenging and may require specific valuation models, which incorporate issuer specific parameters like probability of default, loss given default or exposure at default.
The hedge accounting phase aims to more strongly align the insurers risk management and accounting as it relaxes and improves some basic requirements like effectiveness testing or adds several new options like a wider range of hedging instruments. To date, insurers have used hedge accounting less extensively than banks. The overhauled guidance on hedge accounting may offer interesting opportunities for insurers to manage potential accounting mismatches.
As with IFRS 4 Phase II, it will be important to identify synergies especially in the areas of data, processes and valuation techniques to ensure consistency between IFRS 9 and Solvency II.
PwC All set for Pillar 3 49
ContactsGlobal Jim Bichard EMEA Insurance Regulatory Leader Partner +44 20 7804 3792 [email protected]
Ed Barron Solvency II Coordinator Director +44 20 7213 3398 [email protected]
Christoph Schellhas Insurance Regulatory Reporting & Disclosure Director +49 69 9585 6489 [email protected]
Christoffel van Riet Insurance Regulatory Technology (SII/IFRS) Senior Director +31 88 792 3373 [email protected]
Sven Stark Insurance Regulatory Technology (SII/IFRS) Director +49 69 9585 1131 [email protected]
Austria Rainer Fuchs Director +43 1 501 88 1190 [email protected]
Belgium Dirk Vangeneugden Director +32 2 710 4556 [email protected]
Olivier Dozin Senior Manager +32 2 7109662 [email protected]
Denmark Jenny Maria Thers Rée Senior Manager +45 3945 3195 [email protected]
France Christelle Ferreira Senior Manager +33 1 56 57 6963 [email protected] Valerie Ries Director +33 1 5657 8227 [email protected]
Germany Julia Unkel Partner +49 69 9585 2667 [email protected]
Ireland Niall Naughton Senior Manager +353 1 792 6314 [email protected]
Luxemburg Marc Voncken Partner +352 49 48 48 2461 [email protected]
Malta Romina Soler Partner +356 25 64 7112 [email protected]
Netherlands Bas van de Pas Partner +31 88 792 69 89 [email protected]
Jules Krijgsman van Spangenberg Senior Manager +31 88 792 [email protected]
Spain Juan Jiménez Navas Partner +34 915 684 007 [email protected]
Javier Martin Palacios Senior Manager +34 915 684 199 [email protected]
Sweden Karin Hjalmers Partner +46 10 212 [email protected] Viktor Lindroth Director +46 10 212 4906 [email protected]
Gabriella Johansson Senior Manager +46 10 212 6001 [email protected]
Switzerland Morgan Schaeffer Director +41 58 792 4400 [email protected]
UK Alwin Swales Partner +44 20 7212 2032 [email protected]
Mike Vickery Director +44 117 309 2403 [email protected]
Barney Wanstall Director +44 20 7804 0810 [email protected]
Henry Jupe Senior Manager +44 20 7212 4667 [email protected]


www.pwc.com/insuranceThis publication has been prepared for general guidance on matters of interest only, and does not constitute professional advice. You should not act upon the information contained in this publication without obtaining specific professional advice. No representation or warranty (express or implied) is given as to the accuracy or completeness of the information contained in this publication, and, to the extent permitted by law, PwC does not accept or assume any liability, responsibility or duty of care for any consequences of you or anyone else acting, or refraining to act, in reliance on the information contained in this publication or for any decision based on it.

© 2015 PwC. All rights reserved. PwC refers to the PwC network and/or one or more of its member firms, each of which is a separate legal entity. Please see www.pwc.com/structure for further details. © 2015 PwC. All rights reserved. PwC refers to the PwC network and/or one or more of its member firms, each of which is a separate legal entity. Please see www.pwc.com/structure for further details.