all rights reserved - holy cross school
TRANSCRIPT


i
ALL RIGHTS RESERVED
©COPYRIGHT BY THE AUTHOR The whole or any part of this publication may not be reproduced or transmitted in any form or by any means without permission in writing from the publisher. This includes electronic or mechanical, including photocopying, recording, or any information storage and retrieval system. Every effort has been made to obtain copyright of all printed aspects of this publication. However, if material requiring copyright has unwittingly been used, the copyrighter is requested to bring the matter to the attention of the publisher so that the due acknowledgement can be made by the author. Mathematics Textbook Grade 10 NCAPS (Revised - New Edition) ISBN 13: Print: 9781776112098 E-pub: 9781776112104 PDF: 9781776112111 Product Code: MAT 216 Author: M.D Phillips J Basson C Botha J Odendaal First Edition: August 2016
PUBLISHERS
ALLCOPY PUBLISHERS P.O. Box 963
Sanlamhof, 7532
Tel: (021) 945 4111, Fax: (021) 945 4118 Email: [email protected]
Website: www.allcopypublishers.co.za

ii
MATHS TEXTBOOK GRADE 10 NCAPS INFORMATION
(Revised - New Edition) The AUTHORS
MARK DAVID PHILLIPS B.SC, H Dip Ed, B.Ed (cum laude) University of the Witwatersrand. Mark Phillips has over twenty-five years of teaching experience in both state and private schools and has a track record of excellent matric results. He has presented teacher training and learner seminars for various educational institutions including Excelearn, Isabelo, Kutlwanong Centre for Maths, Science and Technology, Learning Channel, UJ and Sci-Bono. Mark is currently a TV presenter on the national educational show Geleza Nathi, which is broadcast on SABC 1. He has travelled extensively in the United Kingdom, Europe and America, gaining invaluable international educational experience. Based on his experiences abroad, Mark has successfully adapted and included sound international educational approaches into this South African textbook. The emphasis throughout the textbook is on understanding the processes of Mathematics.
JURGENS BASSON B.A (Mathematics and Psychology) HED RAU (UJ) Jurgens Basson is a Mathematics consultant with more than 25 years experience and expertise in primary, secondary and tertiary education. His passion is the teaching of Mathematics to teachers, students and learners. Jurgens founded and started the RAU / Oracle School of Maths in 2002 in partnership with Oracle SA. Due to the huge success of this program in the community, there are now several similar programs running in the previously disadvantaged communities that are being sponsored by corporate companies. During 2012, one of his projects sponsored by Anglo Thermal Coal in Mpumalanga was voted Best Community Project of the Year. Jurgens had the privilege to train and up skill more than 15 000 teachers countrywide since 2006. He was also part of the CAPS panel that implemented the new syllabus for Grade 10 - 12 learners. He successfully co-authored the Mind Action Series Mathematics textbooks, which received one of the highest ratings from the Department of Education.
CONRAD BOTHA Maths Hons, PGCE, B.Sc (Mathema cs and Psychology) Rand Afrikaans University. Conrad Botha has been an educator in both state and private schools for the past eight years. He is currently Head of Department at The King’s School West Rand and has also been extensively involved in teaching Maths at The Maths Centre (Grades 4-12). The institution tutors both primary and high school learners in Maths, Science as well as conducts examination training sessions for Grade 11 and 12 learners. The experience he obtained at The Maths Centre resulted in him gaining valuable knowledge and teaching methodology, particularly in the implementation of the new curriculum. Conrad has also done editing work for the Learning Channel.
JACO ODENDAAL B.Sc (Mathematics and Applied Mathematics) Jaco Odendaal has been an educator of Mathematics and Advanced Programme Mathematics for the past ten years. He is currently the Head of Mathematics at Parktown Boys’ High School in Parktown, Johannesburg. He has worked as a teacher trainer in many districts in Limpopo and Mpumalanga. Jaco has a passion for Mathematics and the impact it can have in transforming our society. He has been successful in teaching and tutoring Mathematics at all levels, from primary school to university level. He has also worked with learners at both ends of the spectrum, from struggling to gifted learners. He is known for his thorough, yet simple explanation of the foundational truths of Mathematics.
iii
MATHS TEXTBOOK GRADE 10 NCAPS INFORMATION
(Revised - New Edition)
The CONCEPT
This revised edition of the Mind Action Series Mathematics Grade 10 is suitable for both DoE and IEB schools and is completely CAPS aligned. It contains the following exciting new features: • The approach to Functions is more effective and includes more examples and exercises on graph interpretation. The axes of symmetry for hyperbolas has also been included. • Euclidean Geometry contains more challenging questions. The reasons used for statements are aligned with the requirements of the DoE. • Financial Mathematics contains exercises that have realistic interest rates and population growth has been included. • Statistics is a major improvement and percentiles are discussed in detail. The examples and exercises are more relevant to the modern world. • Probability is far more learner-friendly. Teaching Venn diagrams using the methods discussed will lead to a greater understanding of the rules. • The chapter on Measurement is a major improvement on the original chapter. • The other topics (Trigonometry, Analytical Geometry, Number Patterns and Algebra) have also been improved. ENDORSEMENT
The original textbook was great, but this revised book is in a league of its own. The approaches used help learners get to the point quickly and completing the syllabus will be a breeze. The layout of the book is user-friendly and the exercises are not too little and not too much. The consolidation and extension exercises are brilliant and are a must for the top kids. I am definitely going to switch to this new book. Well done to the authors! Mrs Judy Ennis (HOD Maths)

iv
MATHEMATICS TEXTBOOK
GRADE 10 NCAPS (Revised - New Edition)
CONTENTS
CHAPTER 1 ALGEBRAIC EXPRESSIONS 1 CHAPTER 2 EXPONENTS 32 CHAPTER 3 NUMBER PATTERNS 41 CHAPTER 4 EQUATIONS AND INEQUALITIES 46 CHAPTER 5 TRIGONOMETRY 62 CHAPTER 6 FUNCTIONS 103 CHAPTER 7 EUCLIDEAN GEOMETRY 163 CHAPTER 8 ANALYTICAL GEOMETRY 188 CHAPTER 9 FINANCIAL MATHEMATICS 206 CHAPTER 10 STATISTICS 219 CHAPTER 11 MEASUREMENT 244 CHAPTER 12 PROBABILITY 257 CHAPTER 13 SOLUTIONS TO EXERCISES 274

1
CHAPTER 1 ALGEBRAIC EXPRESSIONS REVISION OF THE REAL NUMBER SYSTEM In Grade 9 you learnt about real numbers which consist of rational and irrational numbers. Let’s briefly revise these numbers. Rational numbers A rational number is a number that can be expressed in the form where 0b ≠ and where a and b are integers.
Rational numbers include all of the following numbers which can be expressed as common fractions. (a) Integers, whole numbers and natural numbers
For example: 6 2 06 2 01 1 1
−= − = =
(b) Mixed numbers
For example: 1 522 2
= where 5 and 2 are integers
(c) Terminating decimals
For example: 125 10,1251000 8
= =
(d) Recurring decimals A recurring decimal has an infinite pattern. For example, 0,1 0,111111...= and 0,52 0,52525252...........= are examples of recurring decimals.
A recurring decimal like 0,111111.... can be expressed as a fraction in the form ab
.
Irrational numbers Irrational numbers are non-terminating, non-recurring decimals. They cannot be expressed as a ratio between integers. Examples include:
• Square roots of numbers that are not perfect squares. For example: 2 , 6 , 8 • Cube roots of numbers that are not perfect cubes. For example: 3 3 32 , 5 , 9 The following number line contains a few real numbers:
3− 2− 1− 0 1 2 3
1,5− 1− 0 23 2 2 π
ab

2
Not all calculations will produce real numbers. There are two such calculations:
• Square roots of negative numbers do not produce real numbers. 2; 3; 4; ; ..− − − −π
These numbers exist, but don’t have a position on the number line. We call them non-real numbers. This can be extended to any even root of a negative number.
• Division by zero does not produce a real number. There are no real numbers resulting from dividing by zero. Division by zero is undefined.
Summary of the REAL Number System 1. Natural numbers: { }1; 2;3; 4;5;...= 2. Whole numbers: { }0 0;1;2;3;4;5;...= 3. Integers: { }...; 3; 2; 1;0;1;2;3;...= − − −
4. Rational numbers: : ; ; 0a a b bb
= ∈ ∈ ≠
- Whole numbers and integers - Proper fractions - Improper fractions and mixed numbers - Terminating decimals - Recurring decimals 5. Irrational numbers: | - Non-terminating, non-recurring decimals. - Square roots of numbers that are not perfect squares, cube roots of numbers that are not perfect cubes etc. - π 6. Real numbers: Any number on the number line. All rational and irrational numbers put together. 7. Calculations that do NOT produce real numbers: - Square roots of negative numbers - Division by zero
EXAMPLE 1 State whether the following numbers are rational, irrational or neither:
(a) 0,25 (b) 2− (c) π 6+ (d) 10
(e) 16− (f) 16 (g) 0 (h)
(i) 0,543215432154321... (j) 0,7931156480518346...
(k) 3 27− (l) 3 9− (m) (n) 916
50
π3

3
Solutions (a) Rational (terminating decimal) (b) Rational (integer) (c) Irrational (the sum of an irrational number and a rational number is always irrational) (d) Irrational (10 is not a perfect square, therefore the square root of 10 is irrational) (e) Neither (16 is a perfect square but, a square root of a negative is non-real) (f) Rational (16 is a perfect square, therefore the square root of 16 is rational) (g) Rational (whole number) (h) Neither (division by 0 is undefined) (i) Rational (recurring decimal) (j) Irrational (non-terminating, non-recurring decimal) (k) Rational (this equals 3− and 3− is an integer and an integer is rational) (l) Irrational (real since cube roots of negatives are real, but, since 9 is not a perfect cube, the cube root of 9− is irrational). (m) Irrational (any fraction of an irrational number is irrational) (n) Rational (9 and 16 are perfect squares and 9 3
16 4= which is a fraction) EXAMPLE 2 Show that the following numbers are rational: (a) 0,1 (b) 1,75 Solutions (a) 0,1 can be shown to be rational by expressing it as a common fraction. Let 0,1111111...x = Now what you need to do is multiply both sides by 10, 100, 1000 and so forth to get the following equations:
0,111111111... (1)
10 1,111111111... (2)100 11,111111111... (3)
xxx
===
Look for two equations where the decimals after the comma are the same and then subtract the equations.
Two equations where the decimals are the same after the comma are (2) and (1). Subtract (1) from (2) as follows:
10 1,111111111... 0,111111111...9 1,00000
which is a rational
0000...9 1
1 numb 9
er.
x xxx
x
− = −∴ =∴ =
∴ =
You could have also used equation (2) and (3) or (1) and (3).

4
(b) 1,75757575... (1)x =
10 17,57575757... (2)100 175,75757575... (3)
xx=
=
Carefully consider the decimals of each line. It should be clear that the decimals of (2) and (1) are not the same. Two equations where the decimals are the same after the comma are (3) and (1). Subtract (1) from (3).
99 174,00000..........
174 58 9
which is a rational number.9 33
x
x
∴ =
∴ = =
It may be necessary in other cases to continue multiplying by 10 until you have established that the decimals to the right of the comma are equal. It is useful to take note of a few patterns regarding some recurring decimals and their equivalent fractions. EXERCISE 1
(a) From the list of numbers: , write down all the
(1) natural numbers (2) whole numbers (3) integers (4) rational numbers (5) irrational numbers (6) real numbers (b) State whether each of the following numbers are rational, irrational or neither.
(1) (2) (3) (4)
(5) (6) (7) (8)
(c) State why we may conclude that each number below is rational.
(1) 314
(2) 138
− (3) 4 (4) 5−
(5) 0,52 (6) 1, 212 (d) Show that the following recurring decimals are rational.
(1) 0, 4 (2) 0, 21 (3) 0,14 (4) 19,45 (5) 0,124 (6) 0,124 (7) 1,124− (8) 2,35−
EXAMPLE 3
Find a rational number between 57
and 34
.
Solution Start by getting the lowest common denominator of the fractions and rewrite them over this
denominator: 5 207 28
= and 3 214 28
= . Since we can’t find any twenty-eights between 20
twenty-eights and 21 twenty-eights we can try doubling the denominators (and therefore
also the numerators): 20 4028 56
= and 21 4228 56
= . Now we have a fraction, namely, 4156
,
between the two fractions.
33; ; 2; 9; 0; 2; 44
− −
3 33 π2
4,01345 1121
2− 2−22
3 27 1+
1 2 3 13 25 760,1 ; 0, 2 ; 0,3 ; etc. and 0,13 ; 0, 25 ; 0,76 ; etc. 9 9 9 99 99 99
= = = = = =

5
EXAMPLE 4 Between which two consecutive integers do the following irrational numbers lie?
(a) 12 (b) 12− (c) 3 20 (d) 2π−
Solutions (a) 9 12 16 (b) 9 12 16
9 12 16 3 12 4
3 12 4
12 lies between 3 and 4. 12 lies between 4 an .
3 12 4
d 3∴
< < < <
∴ < < ∴ < <
∴ < < ∴−
− −
> − >
−
−
∴
3 3 3
3
3
(c) 8 20 27 (d) 2π 6,2833185307...
8 20 27 7 6,283318... 6
2 20 3
lies between 2 and 3
7 2π
. lies between 7 and2 6
6
20 π∴ ∴
< < − = −
∴ < < − < − < −
∴ < < ∴− <
− −
− −
−
<
Rounding off numbers to certain decimal places The rules for rounding off numbers to certain decimal places are as follows:
• Count to the number of decimal places after the comma that you want to round off to.
• Look at the digit to the right of this decimal place. If it is lower than 5, drop it and all the digits to the right of it. If it is 5 or more than 5, then add one digit to the digit immediately to
the left of it and drop it and all the digits to the right of it. If necessary, keep or add zeros as place holders.
EXAMPLE 5 Round off the following numbers to the number of decimal places indicated: (a) 4,31437 (2 decimal places):
4,31437 and the answer: 4,31(b) 1,77777 (3 decimal places)
1,77777 and the answer: 1,778(c) 365,1534 (1 decimal place)
365,1534 and the answer: 365,2(d) 594,2 (2 decimal places)
594,200 and the answer: 594,20(e) 12,07963 (3 decimal places ) 12,07963 and the answer: 12,080(f) 9,998 (1 decimal place)
9,998 and the anwer: 10,0

6
2 3 4 5 6
EXERCISE 2 (a) Without using a calculator, determine between which two integers the following irrational numbers lie. Then verify your answers by using a calculator. (1) 50 (2) 29 (3) 3 45 (4) 54− (5) 5 30 (6) π (b) Find a rational number between:
(1) 3 2 and 5 3
(2) 3,14 and π
(c) Round off the following numbers to the number of decimal places indicated. (1) 9,23584 (3 decimal places) (2) 67,2436 (2 decimal places) (3) 4,3768534 (4 decimal places) (4) 17,247398 (5 decimal places) (5) 79,9999 (3 decimal places) (6) 34,27846 (4 decimal places) (7) 5,555555 (5 decimal places) (8) 3π (3 decimal places) Representing real numbers Sets and subsets of real numbers can be represented in a variety of ways: Number lines, set builder notation and interval notation. Set builder notation and number lines Set builder notation is a useful way of representing sets and subsets of real numbers. When a set is represented in set builder notation, first describe the set in words before representing it on a number line. Set builder notation consists of three parts, namely: EXAMPLE 6 (a) Integers greater than and including 3 { : 3 ;x x x≥ ∈} (b) Integers less than 5 { : 5 ; }x x x< ∈
(c) Natural numbers less than 4 { : 4 ; }x x x< ∈ (d) Integers between 2− and 3 excluding 2− but including 3 { : 2 3 ; }x x x− < ≤ ∈
{ }: 4 3 ;x x x− < < ∈
1 2 3 4 5
0 1 2 3 4
1 0 1 2 3−

7
(e) Real numbers greater than or including 3 { : 3 ; }x x x≥ ∈ (f) Real numbers less than 7 { : 7 ; }x x x< ∈ (g) Real numbers between 5− and 4 excluding 5− but including 4] { : 5 4 ; }x x x− < ≤ ∈ Interval notation and number lines Interval notation is another way of representing real numbers on a number line. Interval notation may not be used to represent any subset of real numbers (natural numbers, whole numbers, integers and rational numbers). EXAMPLE 7 (a) Real numbers between 2− and 4 excluding 2− but including 4 ( ]2 ; 4− (b) Real numbers between 4− and 7 including 4− but excluding 7 [ )4 ; 7− (c) Real numbers greater than or including 1 [ )1; ∞ (d) Real numbers less than but not including 1− ( ); 1−∞ − EXERCISE 3 (a) Represent the following sets on a number line:
(1) { : 1 12 ; }x x x− < < ∈ (2) { : 4 ; }x x x≥ − ∈(3) { : 3 1; }x x x− ≤ < ∈ (4) { : 2 ; }x x x< ∈(5) 1
2{ : 4 ; }x x x> ∈ (6) { : 7 ; }x x x≤ ∈(7) { : 7 ; }x x x< ∈ (8) { : 0 ; }x x x≥ ∈
3
3 is included
4
4 is included
5−
5 is not included−
42−
74−
1
1−
7
7 is not included

8
(b) Write the following sets in set builder notation:
(1) (2) (3) (4) (c) Represent on a number line:
(1) [ )2 ; 7− (2) ( ]3 ;10− (3) [ ]1; 4− (4)
(5) [ )6 ;− ∞ (6) ( ]; 7−∞ (7) ( )34; 6−∞ (8)
(d) Write the following in interval notation:
(1) (2)
(3) (4)
MULTIPLICATION OF ALGEBRAIC EXPRESSIONS The distributive law (revision) The variable “a” is distributed to and multiplied with all the other terms in the brackets. The product of two binomials (revision) The FOIL method can be used to multiply two binomials. Here you must first multiply the first terms in each bracket. Then you multiply the outer terms, then the inner terms and finally the last terms. F Firsts= O Outers= I Inners= L Lasts=
The product of a binomial and a trinomial The method revised above can be extended to the product of a binomial and a trinomial. or
( )( )a b c d ac ad bc bd+ + = + + +
OUTERS
FIRSTS
INNERS
LASTS
0 1 2 3 4 46−
7− 5
97− 112−
6− 112
( )5 ; 5−
3 ; 8
( )a b c d ab ac ad+ + = + +( )a b c ab ac+ = +
( )( )( ) ( ) ( )x y a b cx y a x y b x y c
ax ay bx by cx cy
+ + += + + + + += + + + + +
( )( )x y a b c+ + +
ax bx cx ay by cy= + + + + +

9
EXAMPLE 8 The examples below illustrate the methods of multiplying binomials and trinomials.
2 2
2 2
(a) ( 3)( 2) (b) (3 1)(2 4)
2 3 6 6 12 2 4
5 6 6 10 4
x x y y
x x x y y y
x x y y
+ + − +
= + + + = + − −
= + + = + −
2 2 2 2
2 2 2 2
(c) (2 4 )( 3 ) (d) (2 3)( 5)
2 6 4 12 2 10 3 15
2 10 12 2 7 15
x y x y ab ab
x xy xy y a b ab ab
x xy y a b ab
− − + −
= − − + = − + −
= − + = − −
3 3 2 2
6 3 3 2 3 2 2 2 2 3
6 3 2 3 2 2 3
(e) (2 7 )( 2 ) (f) ( )( 3 2 )
2 4 7 14 3 2 3 2
2 3 14 4 5 2
x y x y x y x xy y
x x y x y y x x y xy x y xy y
x x y y x x y xy y
+ − − − +
= − + − = − + − + +
= + − = − + +
2 2
2 3 3 2 2
2 3 3
2 3 3
3 2
(g) (8 3 )(4 ) ( 3)( 3 9)
32 8 12 3 ( 3 9 3 9 27)
32 8 12 3 ( 27)
32 8 12 3 27
4 12 8 59
n n n n n
n n n n n n n n
n n n n
n n n n
n n n
− + − − + +
= + − − − + + − − −
= + − − − −
= + − − − +
= − − + +
EXERCISE 4
(a) Expand and simplify:
(1) 3 ( 3)x x + (2) 3 23 (3 6 )a a a a− − + (3) ( 5)( 2)x x+ + (4) ( 5)( 2)x x− − (5) ( 5)( 2)x x+ − (4) ( 5)( 2)x x− + (7) (3 1)(2 3)x x− + (8) (7 2 )(3 4 )m n m n− + (9) 4 2 4 2(2 3 )(3 2 )x y x y− + (10) 4 5 4 3(4 3 )(2 4 )x y x y+ − (b) Expand and simplify:
2 2
2 2
2 2 2 2
2 2 2 2
(1) ( 1)( 2 3) (2) ( 1)( 2 3)
(3) (2 4)( 3 1) (4) (2 4)( 3 1)
(5) (3 )(2 4 ) (6) ( 2 )(4 3 )
(7) (3 2 )(9 6 4 ) (8) (3 2 )(9 6 4 )
x x x x x x
x x x x x x
x y x xy y a b a ab b
x y x xy y x y x xy y
+ + + − − +
+ − + − − +
− + − + − +
− + + + − +
(c) Expand and simplify:
(1) 22 (3 4 ) (7 2 )x x y x xy− − − (2) 2(5 1) (3 4)(2 3 )y y y+ − + −
(3) 2 2(2 ) (3 2 ) ( 4 )( 4 )x y x y x y x y+ − − + − + (4) 6 3 3( 3 )( 3 )x x y x y+ − + (5) (3 )(3 )(2 5 )a b a b a b+ − +

10
Special products We will now consider the following special products: • Products which lead to the difference of two squares • Squaring a binomial • Cubing a binomial Products which lead to the difference of two squares (revision) Consider the product ( )( )x y x y+ − . The product can be simplified as follows:
2 2
2 2
( )( )x y x y
x xy xy y
x y
+ −
= − + −
= −
In other words, the pattern is as follows: 2 2(first term last term)(first term last term) (first term) (last term)+ − = − or 2 2(first term last term)(first term last term) (first term) (last term)− + = −
EXAMPLE 9 Expand and simplify the following:
2 2 2 2
4 3 4 3
8 6
(a) (3 2 )(3 2 ) (b) ( 5 )( 5 )
9 4 25
(c) (4 3 )(4 3 )
16 9
x y x y a b a b
x y a b
x y x y
x y
+ − − +
= − = −
− +
= −
[ ][ ] [ ][ ]2 2
2 2 2
2 2 2 2 2
2 2 2
Alternatively we can substi(d) ( )( )( ) ( ) ( ) ( )
( ) ( )( )
( )(
tute ( )
)
2 ( )
2
a b d a b da b d a b d a b d a b d
a b d k d k d
a b a b d
a b k
k d
a ab b d a b d
a ab b d
− + − −= − + − − − + − −
= − − = + −
= − − − = −
= − + − = − −
= − +
∴
−
− =
The alternative method makes it easier to recognise that the product leads to the difference of two squares.
Squaring a binomial (revision) Consider the squares of the following binomials:
Therefore:
2 2 2 2 2 2( ) 2 and ( ) 2a b a ab b a b a ab b+ = + + − = − + In other words, the pattern is as follows:
2 2 2(first term last term) (first term) 2(first term)(last term) (last term)+ = + + 2 2 2(first term last term) (first term) 2(first term)(last term) (last term)− = − +
2
2 2
2 2
( )( )( )
2
a ba b a b
a ab ba b
a ab b
+= + +
= + + +
= + +
2
2 2
2 2
( )( )( )
2
a ba b a b
a ab ba b
a ab b
−= − −
= − − +
= − +

11
EXAMPLE 10 Expand and simplify the following:
(a) 2( 4)x + (b) 2( 4)x − (c) 2(2 4 )x y+ (d) 2(2 4 )x y− (e) 2( 5 2 )a b− − (f) 3( 3 )a b− Solutions
2 2
2 2 2 2
2 2
(a) ( 4) (b) ( 4)
2( )( 4) (4) 2( )( 4) ( 4)
8 16 8 16
x x
x x x x
x x x x
+ −
= + + + = + − + −
= + + = − +
2 2
2 2 2 2
2 2 2 2
(c) (2 4 ) (d) (2 4 )
(2 ) 2(2 )(4 ) (4 ) (2 ) 2(2 )( 4 ) ( 4 )
4 16 16 4 16 16
x y x y
x x y y x x y y
x xy y x xy y
+ −
= + + = + − + −
= + + = − +
2
2 2
2 2
(e) ( 5 2 )
( 5 ) 2( 5 )( 2 ) ( 2 )
25 20 4
a b
a a b b
a ab b
− −
= − + − − + −
= + +
(f) This is an example where a binomial is cubed.
3
1 2
2 2
3 2 2 2 2 3
3 2 2 3
( 3 )
( 3 ) ( 3 )
( 3 )( 6 9 )
6 9 3 18 27
9 27 27
a b
a b a b
a b a ab b
a a b ab a b ab b
a a b ab b
−
= − −
= − − +
= − + − + −
= − + −
EXERCISE 5 (a) Expand and simplify: (b) Expand and simplify:
3 3
4 4
4 2 2
(1) ( 7)( 7) (2) ( 3)( 3) (3) (2 1)(2 1)
(4) (9 4)(9 4) (5) (3 2 )(3 2 ) (6) (4 3)(4 3)
(7) (6 3 )(6 3 ) (8) (3 2 )(3 2 )
(9) (1 )(1 )(1 )
x x x x x x
x x x y x y a b a b
x y x y x y x y
a a a
+ − − + − +
+ − − + + −
− + − + − −
− − +
[ ]
2 2 2
2 2 2
22 2
3 6 2 3 3
(1) ( 5) (2) ( 5) (3) (2 3)
(4) (2 3) (5) ( 4 ) (6) ( 3 )
(7) ( 3 5 ) (8) 3( 3 ) (9) 2( 4 )
(10) ( 3 ) (11) (2 3 ) (12) (2 3 )
x x a
a a b a b
a b x y m n
x y a b a b
+ − +
− − − −
− + − −
− + −

12
FACTORISATION OF ALGEBRAIC EXPRESSIONS Factorisation is the process of writing a number or an expression as the product of its factors. It can also be seen as the reverse procedure of the distributive law. The following factorisation types will be revised and new types will be introduced: • Highest common factor (revision) • Difference of two squares (revision) • Quadratic trinomials of the form 2x bx c+ + (revision) • Quadratic trinomials of the form 2ax bx c+ + where 0a ≠ (new type) • Grouping (revision) • Sum and difference of two cubes (new types) Taking out the highest common factor Consider the reverse procedure of the distributive law: ( )ab ac a b c+ = +
The highest common factor (a) has been “taken out” of the expression ab ac+ and the expression is said to be factorised as the product ( )a b c+ . EXAMPLE 11 Factorise the following expressions:
(a) 2 515 9x x+ The factors of 15 are 1; 3 ; 5 ; and 15 and the factors of 9 are 1 ; 3 ; and 9 Therefore the highest common factor between 15 and 9 is 3. The factors of 2x are 21; and x x and the factors 5x are 2 3 4 51 ; ; ; ; and x x x x x
Therefore, the highest common factor between 2x and 5x is 2x . Therefore, the highest common factor between 2 515 and 9x x is 23x . We can now take out the highest common factor (HCF) as follows and thus factorise the expression by writing it as a product of factors:
2 5
2 2 3
2 3 2 3 2 5
15 9
3 . 5 3 . 3
3 (5 3 ) Verify: 3 (5 3 ) 15 9
x x
x x x
x x x x x x
∴ +
= +
= + + = +
(b) 4 6 215 3a b ab− HCF = 23ab 2 3 4 2
2 3 4 2 3 4 4 6 2
3 5 3 1
3 (5 1) Verify: 3 (5 1) 15 3
ab a b ab
ab a b ab a b a b ab
= × − ×
= − − = −
(c) 2 ( ) 3 ( )a x y b x y+ − + For the above example the common factor is a common bracket.
2 ( ) 3 ( ) HCF ( )( )(2 3 )
a x y b x y x yx y a b
∴ + − + = += + −

13
7 4 4
4 3 4
4 3
7 4
7 4 4
4 3
4 3
Alternatively we can substit
(d) ( 1) ( 1) HCF ( 1)
( 1) ( 1) ( 1) 1
(
ute
1) ( 1) 1
(
( 1) ( 1)
HCF
( 1)
(
1
1) ( 1) 1
)
x x x
x x x
x x
x x
k k k
k k
x k
x x
−
− − − = −
= − × − − − ×
= − − −
− − −
= − =
= −
= − − −
=
The next examples involve the sign-change rule discussed in Grade 9. Let’s revise this rule by using the following examples. (a) 3 2b a− (b) 4 7y x− + (c) 5 2b a− −
(3 2 )b a= + − ( 4 7 )y x= + − + ( 5 2 )b a= + − − ( 3 2 )b a= − − + (4 7 )y x= − − (5 2 )b a= − + (2 3 )a b= − − 4 7 (4 7 )y x y x∴− + = − − 3 2 (2 3 )b a a b∴ − = − − You can simplify this method by “taking out a negative” and changing signs. Whenever you “take out a negative sign”, the signs of the terms inside the brackets will be different to the signs of the the terms in the original expression. Consider the following examples using this short-cut approach. (a) 3 9y x− (b) 3 6y x− − 3( 3 )y x= − − + 3( 2 )y x= − + 3(3 )x y= − − 3(2 )x y= − +
In these examples, the HCF of 3 as well as a negative sign has been “taken out”. EXAMPLE 12 Factorise: (a) 2 (3 2 ) 5 (2 3 )a x y b y x− + − (b) 3 (5 ) ( 5 )a x y x y+ − − − Solutions (a) 2 (3 2 ) 5 (2 3 )a x y b y x− + −
2 (3 2 ) 5 ( 2 3 )2 (3 2 ) 5 (3 2 )(3 2 )(2 5 )
a x y b y xa x y b x yx y a b
= − − − += − − −= − −
(b) 3 (5 ) ( 5 )a x y x y+ − − −
3 (5 ) (5 )(5 )(3 1)a x y x yx y a
= + + += + +
5 2 (5 2 )b a b a∴− − = − +

14
2 2(8 7 )(8 7 )x y x y= + −
EXERCISE 6 (a) Factorise:
3 3 2 3
3 2 2 2 2
4 8 3 7 2 3
(1) 6 12 (2) 6 4 (3) 5 5
(4) 12 18 (5) 3 9 12 (6) 8 64
(7) 16 8 36
x x x x x x
x x x y xy a b ab
m n m n m n
+ + +
− − + −
− +
(b) Factorise:
(1) ( ) ( )x a b y a b+ + + (2) ( ) ( )k x y p x y+ + + (3) 3 ( ) 4 ( )p q r m r q+ − + (4) 7 ( 3 ) 3 ( 3 )k m n p m n− − − (5) 2( ) 3( )x y x y− − − (6) 4 5( ) ( )a c a c+ + + (7) 6 2( ) ( )m n m n− + − (8) 7 ( 3 ) 4 (3 )x m n y n m− − − (9) 7 ( 3 ) 4 (3 )x m n y n m− + − (10) 7 ( 3 ) 4 ( 3 )x m n y m n+ + − − (11) 2 (3 ) 4 ( 3 )x p q y q p+ + − − (12) ( ) ( )a b pb pa− − − (13) 3 34 ( 2) (2 )x a a− + − (14) 22 (3 ) 12 ( 3 )x a b x b a− − − (15) ( 3 ) (3 ) (3 )a b c b a d b a− − − + −
Difference of two squares (revision)
Consider the product 2 2( )( )a b a b a b+ − = − . The reverse process 2 2 ( )( )a b a b a b− = + − is called the factorisation of the difference of two squares. Another way of seeing this type of factorisation is:
2 2 2 2 2 2( )( ) ( )( )a b a b a b a b a b− = + − = + − where 0, 0a b> > EXAMPLE 13 Factorise fully: (a) 2 25x − (b) 4 264 49x y−
2 2( 25)( 25)( 5)( 5)
x xx x
= + −= + −
8 8
8 8
4 4 4 4
4 4 2 2 2 2
4 4 2 2
(c) 2 2
2( ) [always take out the HCF first]
2( )( )
2( )( )( )
2( )( )( )( )
a b
a b
a b a b
a b a b a b
a b a b a b a b
−
= −
= + −
= + + −
= + + + −
[ ][ ]
[ ][ ]
2
2
2
(d) 16 ( ) [alternatively: Let ( ) ]
4 ( ) 4 ( ) 16 ( )
(4 )(4 ) 16(4 )(4 )4 ( ) 4 ( )
(4 )(4 )
x y x y k
x y x y x y
x y x y kk kx y x y
x y x y
− − − =
= + − − − ∴ − −
= + − − + = −= − += + − − −= + − − +

15
EXERCISE 7 (a) Factorise fully:
2 2 2
2 2 2 2
8 6 4 2 4
(1) 16 (2) 36 (3) 9 4
(4) 1 (5) 169 100 (6) 16 121
(7) 100 (8) (9) 16
x x x
x x a b
x y x x a
− − −
− − −
− − −
(b) Factorise fully:
Quadratic trinomials (revision) Consider the product ( )( )x a x b+ +
By multiplying out, it is clear that this product will become:
2
2 2
( )( )
( ) Take note that has a coefficient of 1.
x a x b
x ax bx a b
x a b x a b x
+ +
= + + + ×
= + + + ×
So the expression 2 ( )x a b x ab+ + + can be factorised as ( )( )x a x b+ + . For example, the trinomial 2 7 12x x+ + can be factorised as follows:
Write the last term, 8, as the product of two numbers ( a b× ). The options are:1 12, 3 4 and 2 6× × × The middle term ( )a b+ is now obtained by adding the numbers of one of the above options. The obvious choice will be the option 3 4× because the sum of the numbers 3 and 4 gives 7. Therefore:
2
2
7 12
(3 4) (3 4)( 3)( 4)
x x
x xx x
+ +
= + + + ×= + +
So the strategy to factorising quadratic trinomials is as follows: • Write down the last term as the product of two numbers. • Find the two numbers (using the appropriate numbers from one of the products) which gets the coefficient of the middle term by adding or subtracting. • Check that when you multiply these numbers you get the last term. EXAMPLE 14 Factorise:
(a) 2 5 36x x+ − The last term can be written as the following products: 1 36, 2 18, 4 9, 6 6× × × ×
We now need to get 5+ from one of the options above. Using 4 9× will enable us to get 5+ since
4 9 5− + = which is the coefficient of the middle term and ( 4)( 9) 36− + = − which is the last term.
Therefore: 2 5 36 ( 4)( 9)x x x x+ − = − +
8 2 2 3 2
3 2 8 2 2 4 4 3
2 2 2 2 2 2
(1) 81 (2) 12 75 (3) 81 49
(4) 27 3 (5) 4 16 (6) 25 100
(7) ( ) (8) (2 ) (9) 25 16( )
n x y a ab
a ab x y y p q p q
a b c x y y a a b
− − −
− − −
+ − + − − −

16
(b) 2 5 6x x− + The last term can be written as the following products: 3 2, 1 6× × We now need to get the middle term 5− from one of the options above. Try the option 3 2× . Clearly 3 2 5− − = − which is the coefficient of the middle
term and 3 2 6− × − = + which is the last term. Notice that the option 1 6× will not work because even though 1 6 5+ − = − is the coefficient of the middle term, 1 6 6+ × − = − , is not the last term. Therefore: 2 5 6 ( 3)( 2)x x x x− + = − −
(c) 23 21 24a a− − Here it is necessary to first take out the highest common factor:
2
2
3 21 24
3( 7 8)
a a
a a
− −
= − −
The last term of the trinomial in the brackets can be written as the following products: 1 8, 4 2× ×
The option 1 8× will work because: 1 8 7+ − = − which is the coefficient of the middle term, and ( 1)( 8) 8+ − = − which is the last term.
Therefore,
2 23 21 24 3( 7 8)
3( 1)( 8)a a a a
a a− − = − −
= + −
Take note: • If the sign of the last term of a trinomial is negative, the signs in the brackets are different (see Example 8a and 8c). • If the sign of the last term of a trinomial is positive, the signs in the brackets are the
same i.e. both positive or both negative (see Example 8b) EXERCISE 8 (a) Factorise the following quadratic trinomials fully:
2 2 2
2 2 2
2 2 2
2 2 2
2 2 2
(1) 11 28 (2) 5 84 (3) 6 9
(4) 4 12 (5) 9 20 (6) 11 12
(7) 12 35 (8) 2 48 (9) 5 6
(10) 5 6 (11) 5 6 (12) 5 6
(13) 7 12 (14) 7 12 (15) 4 12
x x x x x x
x x a a a a
a a a a m m
m m m m m m
x x x x x x
− + − − + +
− − − + − −
− + − − + +
− − + − − +
+ + − + + −
(b) Factorise fully:
(1) 22 2 12x x− − (2) 23 21 54x x− − (3) 24 12 40a a+ −(4) 26 24 30a a+ − (5) 3 22 8x x x+ − (6)
(c) Explain why the trinomial 2 4 5x x+ + cannot factorise. (d) Explain why the following factorisations are incorrect: (1) 2 5 6 ( 6)( 1)x x x x− + = − +
(2) 2 10 24 ( 6)( 4)x x x x+ − = + −
290 45 5x x− +

17
Factorising more advanced quadratic trinomials The method to factorise these trinomials is a little more involved than with the previous trinomials. A suggested method is as follows and will be discussed in the examples that follow: Step 1: Write down the product options of the first and last terms. Step 2: Write the product options in a table format. Step 3: Select any product option from the first term and last term and write these
options using what is called the “cross method”. Then multiply diagonally. Step 4: Add and subtract the products in order to get the middle term Step 5: Obtain the factors by reading off horizontally. EXAMPLE 15 Factorise the following fully:
(a) 221 25 4x x+ − (b) 212 11 2x x− + (c) 2 224 10x xy y− − Solutions
(a) 221 25 4x x+ − Step 1 Write down the product options of the first and last terms:
221 : 1 21 , 7 34 : 1 4, 2 2
x x x x x× ×× ×
Step 2 Write the product options in a table format as follows:
The product option 1 4× for the last term must also be written in reverse order as 4 1× . This is not necessary for the product options for the first term. Step 3 Select any product option from the first term and last term and write these options using what is called the “cross method” and multiply diagonally: Step 4 The strategy is to now get the middle term, 25x+ , from 3x and 28x using different signs (because the sign of the last term of the trinomial is negative). Insert the signs as indicated below.
First term Last term 21x 7x 1 4 2 1x 3x 4 1 2
7x 1
3x 4 28x
3x
7x 1
3x 4 28x+
3x−
25x+

18
Step 5 The factors are now obtained by reading off horizontally. The first factor is (7 1)x − . The negative sign for 1 comes from 3x− . The second factor is (3 4)x + . The positive sign for 4 comes from 28x+ .
221 25 4 (7 1)(3 4)x x x x∴ + − = − + Take note: This method involves trial and error and you need to keep trying different options until you get ones that will work. For example, the following option will not work:
(b) 212 11 2x x− + The product options of the first and last terms: The signs in the brackets must be the same because the sign of the last term of the trinomial is positive. 212 11 2 (4 1)(3 2)x x x x∴ − + = − − (c) 2 224 10x xy y− − The product options of the first and last terms:
2
2
24 : 24 1 , 8 3 , 6 4 ,12 2
: 1 1
x x x x x x x x x
y y y
× × × ×
×
The signs in the brackets must be different because the sign of the last term of the trinomial is negative. The options that work are as follows: 2 224 10 (12 )(2 )x xy y x y x y∴ − − = + −
First term Last term 1x 4x 6x 1 2
12x 3x 2x 2 1
First term Last term 24x 6x 12x 8x 1y1x 4x 2x 3x 1y
212 : 1 12 , 4 3 , 6 22 : 1 2, 2 1
x x x x x x x× × ×× ×
7x 1
3x 4 28x+
3x−
25x+
7x
13x
4
7x
12x
25x+
These two terms cannotgive the middle term.Therefore, the optionsselected are not helpful.
4x 1
3x 2 8x−
3x−
11x−
12x 1y
2x 2 y 12xy−
2xy+
10xy−

19
EXERCISE 9 (a) Factorise fully:
2 2 2
2 2 2
(1) 3 4 1 (2) 2 3 1 (3) 12 7 1
(4) 18 3 1 (5) 2 5 3 (6) 5 14 8
x x x x x x
x x x x x x
+ + − + − +
+ − − − + +
2 2 2
2 2 2
(7) 2 7 6 (8) 6 11 10 (9) 6 5 21
(10) 20 24 9 (11) 18 3 10 (12) 15 6
x x x x x x
x x x x x x
− + − − − −
+ − − − − −
(b) Factorise fully:
(c) Factorise fully:
2 2 3 2 2 4 2
4 2 2 4 2
(1) 10 10 120 (2) 6 9 (3) 12 32
(4) 5 6 (5) ( ) 4( ) 32
x xy y a a b ab x x
x x y y a b a b
− − − + − +
+ + + + + −
Factorisation by grouping in pairs (revision) EXAMPLE 16 Factorise the following expressions fully:
(a) 3 2 6ax a x+ + + (b) 2 22 4 3 6x xy xy y+ − −
(c) 3 24 4 16a a a− − + (d) 26 3 6 12t t x tx+ − − Solutions
(a) 3 2 6ax a x+ + + ( 3 ) ( 2 6)ax a x= + + + + [put brackets around the pairs separated by a + sign] ( 3 ) (2 6)ax a x= + + + [ 2 2x x+ = ] ( 3) 2( 3)a x x= + + + [factorise the pairs] ( 3)( 2)x a= + + [take out the common bracket]
(b) 2 22 4 3 6x xy xy y+ − −
2 2(2 4 ) ( 3 6 )x xy xy y= + + − − [put brackets around the pairs separated by a + sign] 2 2(2 4 ) (3 6 )x xy xy y= + − + [apply sign-change rule] 2 ( 2 ) 3 ( 2 )x x y y x y= + − + [factorise the pairs] ( 2 )(2 3 )x y x y= + − [take out the common bracket]
(c) 3 24 4 16a a a− − +
Method 1 3 24 4 16a a a− − +
3 2( 4 ) ( 4 16)a a a= − + − + [put brackets around the pairs separated by a + sign] 3 2( 4 ) (4 16)a a a= − − − [apply sign-change rule]
2 ( 4) 4( 4)a a a= − − − [factorise the pairs]
2( 4)( 4)a a= − − [take out the common bracket] ( 4)( 2)( 2)a a a= − + − [factorise the difference of two squares]
2 2 2 2
2 2 2 2 2 2
(1) 4 10 6 (2) 15 18 3 (3) 6
(4) 4 7 2 (5) 10 13 3 (6) 12 23 10
x x x x x xy y
p pq q m mn n a ab b
+ − − + − −
+ − − − + +
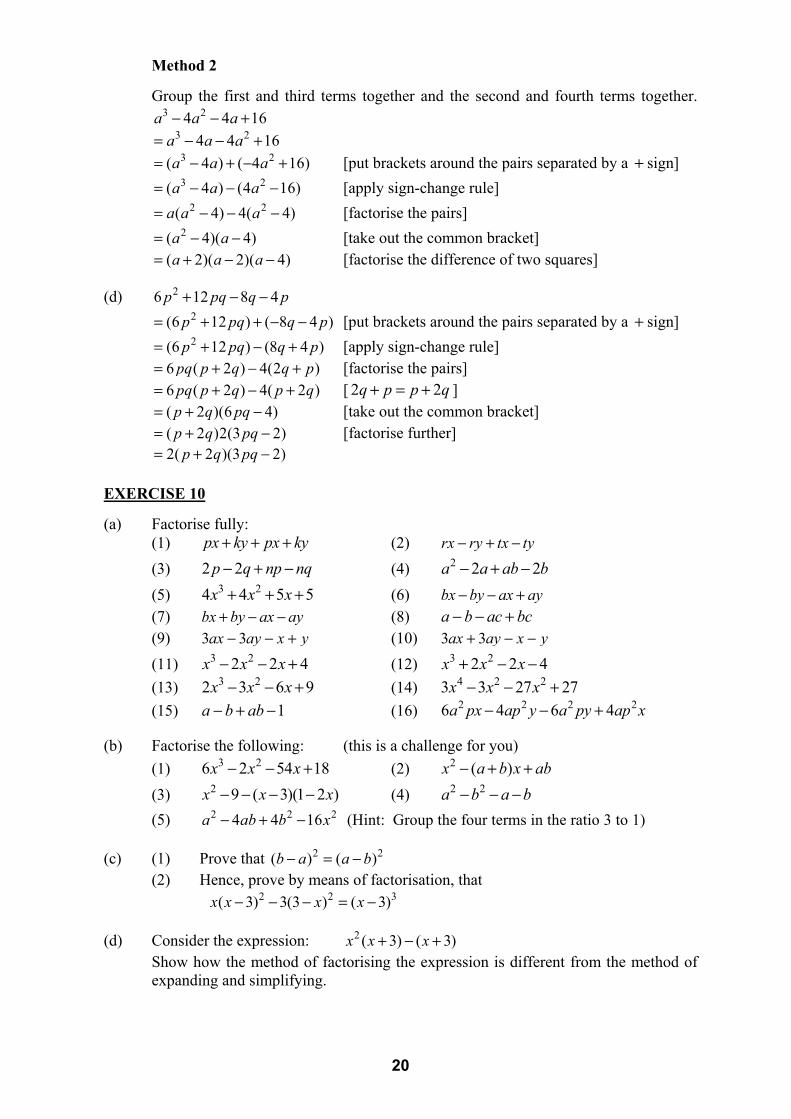
20
Method 2 Group the first and third terms together and the second and fourth terms together. 3 24 4 16a a a− − +
3 24 4 16a a a= − − + 3 2( 4 ) ( 4 16)a a a= − + − + [put brackets around the pairs separated by a + sign] 3 2( 4 ) (4 16)a a a= − − − [apply sign-change rule] 2 2( 4) 4( 4)a a a= − − − [factorise the pairs] 2( 4)( 4)a a= − − [take out the common bracket] ( 2)( 2)( 4)a a a= + − − [factorise the difference of two squares]
(d) 26 12 8 4p pq q p+ − −
2(6 12 ) ( 8 4 )p pq q p= + + − − [put brackets around the pairs separated by a + sign] 2(6 12 ) (8 4 )p pq q p= + − + [apply sign-change rule] 6 ( 2 ) 4(2 )pq p q q p= + − + [factorise the pairs] 6 ( 2 ) 4( 2 )pq p q p q= + − + [ 2 2q p p q+ = + ] ( 2 )(6 4)p q pq= + − [take out the common bracket] ( 2 )2(3 2)p q pq= + − [factorise further] 2( 2 )(3 2)p q pq= + − EXERCISE 10 (a) Factorise fully: (1) px ky px ky+ + + (2) rx ry tx ty− + − (3) 2 2p q np nq− + − (4) 2 2 2a a ab b− + − (5) 3 24 4 5 5x x x+ + + (6) bx by ax ay− − + (7) bx by ax ay+ − − (8) a b ac bc− − + (9) 3 3ax ay x y− − + (10) 3 3ax ay x y+ − − (11) 3 22 2 4x x x− − + (12) 3 22 2 4x x x+ − − (13) 3 22 3 6 9x x x− − + (14) 4 2 23 3 27 27x x x− − + (15) 1a b ab− + − (16) 2 2 2 26 4 6 4a px ap y a py ap x− − + (b) Factorise the following: (this is a challenge for you)
(1) 3 26 2 54 18x x x− − + (2) 2 ( )x a b x ab− + + (3) 2 9 ( 3)(1 2 )x x x− − − − (4) 2 2a b a b− − − (5) 2 2 24 4 16 (Hint: Group the four terms in the ratio 3 to 1)a ab b x− + −
(c) (1) Prove that 2 2( ) ( )b a a b− = −
(2) Hence, prove by means of factorisation, that 2 2 3( 3) 3(3 ) ( 3)x x x x− − − = −
(d) Consider the expression: 2 ( 3) ( 3)x x x+ − + Show how the method of factorising the expression is different from the method of expanding and simplifying.

21
The sum and difference of two cubes Consider the following products.
2 2 2
3 2 2 2 2 3 3 2 2
3 3 3
(a) ( )( ) (b) ( 2)( 2 4)
2 4 2 4 8
8
x y x xy y x x x
x x y xy x y xy y x x x x x
x y x
+ − + + − +
= − + + − + = − + + − +
= + = +
2 2
3 2 2 3 2 2
3 3
(c) (2 3)(4 6 9) (d) (3 1)(9 3 1)
8 12 18 12 18 27 27 9 3 9 3 1
8 27 27 1
x x x x x x
x x x x x x x x x x
x x
+ − + + − +
= − + + − + = − + + − +
= + = +
2 2 2
3 2 2 2 2 3 3 2 2
3 3 3
(e) ( )( ) (f) ( 2)( 2 4)
2 4 2 4 8
8
x y x xy y x x x
x x y xy x y xy y x x x x x
x y x
− + + − + +
= + + − − + = + + − − −
= − = −
The answer for each product turned out to be either a sum or a difference of two cubes. Therefore from the above products we noticed that:
3 3 2 2 of which( )( we may conclude:) x y x y x xy y+ = + − + 3 3 2 2(first term) (last term) (first term last term) (first) (first)(last) (last) + = + − +
3 3 2 2 of which( )( we may conclude:) x y x y x xy y− = − + + 3 3 2 2(first term) (last term) (first term last term) (first) (first)(last) (last) − = − + +
EXAMPLE 17
Factorise the following: (a) 38 27b−
Find the cube root of each of the terms: 3 33 8 2 and 27 3b b= = 3
3 3
2 2
2
8 27
(2 (3 ) )
(2 3 ) (2) (2)(3 ) (3 )
(2 3 )(4 6 9 )
b
b
b b b
b b b
∴ −
= −
= − + +
= − + +
(b) 3 62 2000x y+ 3 62( 1000 ) always take out the highest common factor firstx y= +
3 6
3 2 3
2 2 2 2 2
2 2 2 4
2( 1000 )2( (10 ) )2( 10 )( ( )(10 ) (10 )2( 10 )( 10 100 )
x yx yx y x x y yx y x xy y
= += += + − += + − +
(c) 3 3( )x y x+ −
3 3 6 23 and 1000 10x x y y= =
33 33 ( ) and x y x y x x+ = + =[ ][ ]
2 2
2 2 2 2
2 2
( ) ( ) ( )( ) ( )
2
(3 3 )
x y x x y x y x x
y x xy y x xy x
y x xy y
= + − + + + + = + + + + +
= + +

22
EXERCISE 11
(a) Factorise the following 3 3 3 3
3 3 3 3
4 3 3
3 3 33 3
(1) 27 1 (2) 8 1 (3) 641(4) 125 729 (5) (6) 5 408
1(7) 8 64 (8) 27 (9) 21627
1 1(10) 8 ( 1) (11) (12)
x x x y
x a b x
a a x x
a x xx x
− + −
− − +
− − − +
− − + −
(b) Consider 6 64x −
(1) Factorise the above expression by using the difference of two cubes method first.
(2) Factorise the above expression by using the difference of two squares method first.
The Golden Rules of Factorisation Two terms Three terms Four terms Step 1: Apply the sign-change rule if necessary. Step 2: Take out the HCF if it exists. Step 3: Apply difference of two squares or sum and difference of two cubes if possible.
Step 1: Apply the sign-change rule if necessary. Step 2: Take out the HCF if it exists. Step 3: Factorise the trinomial.
Step 1: Group in pairs and put brackets around each pair separated by the + sign. Step 2: Apply the sign-change rule if necessary. Step 3: Factorise the pairs. Step 4: Take out the common bracket. Step 5: Factorise further if needs be.
EXERCISE 12 (Revision of all factorisation methods) Factorise the following:
(a) 22 15a a− − (b) 25 20 15a a− + (c) 2 4x x−
(d) 38 27x − (e) 2 5 6x x− + (f) 26 2 20x x− − (g) 3 24 4 1x x x− − + (h) 2 2x x− − (i) 3 316 2a b− (j) 7 14 14 77 14x y x y− (k) 216 100x − (l) 31 x− (m) 212 18 6x xy− + (n) 2 212 18 6x xy y− + (o) 26 3 18y y− − (p) 4 8 2 48 4x y x y− (q) 2 24 6 3x x y y− − + (r) 24 ( 1) 36(1 )x y y− + − (s) 225 ( )x y− − (t) 2( ) 3( )a b b a− − − (u) 2 2 2 34 4ax a x x− + +

23
SIMPLIFICATION OF ALGEBRAIC FRACTIONS Multiplication and division of algebraic fractions EXAMPLE 18 Simplify the following expressions which have monomial (single term) denominators:
(a) 2
24 8
4x x
x+
(b) 3
212 3
9x y xy
y+
Solutions In these examples, always factorise the numerators before simplifying:
(a) 2
24 8
4x x
x+
(b) 3
212 3
9x y xy
y+
24 ( 2)
4x x
x+=
2
23 (4 1)
9xy x
y+=
2xx+=
2(4 1)3
x xy
+=
EXAMPLE 19 Simplify the following expressions which have multi-term denominators:
2 2
2 2 212 27 2 4(a) (b)
4 12 4 5 5x x x x
x x x x x x− + − −÷
− + − +
(c) 3 8
2x
x−−
(d) 3 2 26 2 93 9 2 6
x x xx x− −×
− − −
Solutions Whenever the numerator and denominator contains two or more terms, both the numerator and denominator must be factorised. Only then can you cancel and simplify.
2 2
2 2 212 27 2 4(a) (b)
4 12 4 5 5x x x x
x x x x x x− + − −÷
− + − + 2
2 2( 9)( 3) 2 5 "tip and times"
4 ( 3) 4 5 49 2 ( 5)
4 ( 5)( 1) ( 2)( 2)
( 1)( 2)
x x x x xx x x x x
x x x xx x x x x
xx x
− − − += = ×− + − −
− − += = ×+ − − +
=− +

24
3 2 2
3 2 2
2
2
6 2 9(d)3 9 2 66 2 9
3( 3) 2( 1 3 )2 (3 1) ( 3)( 3)
3( 3) 2(3 1)( 3)
3
x x xx xx x x
x xx x x x
x xx x
− −×− − −
− −= ×− + − − +
− − += ×− + − −
−=
3
3
2
2
2
8(c)2
8(2 )
( 2)( 2 4)( 2)
( 2 4)2 4
xx
xx
x x xx
x xx x
−−
−=+ −
− + +=− −
= − + += − − −
EXERCISE 13 (a) Simplify the following single algebraic fractions:
(1) 2x xx− (2)
24 84
a aa− (3)
23 66
p pp−
(4) 2
24 4
4m m
m+ (5)
3 2 2
4 8a a a− ÷ (6)
2
24
2x
x x−
−
(7) 2 5 62 6
x xx
− +−
(8) 2
29
2 5 3x
x x−
− − (9)
3 2
39 81
6p p
p−
(10) 3
227 8
27 18 12p
p p−
+ + (11)
2
29
3k
k k−−
(12) 26 9
9 4k
k+
−
(13) 10 25x
x−−
(14) ( ) ( )( )
2
22 4 2
2
x x x
x
+ − +
+ (15)
2
2(3 )
9x
x−
−
(b) Simplify the following algebraic fractions:
( )
( )
2 2 2 2
2 2 3
2 2 2 2
2
2 4
2 2
6 16 2 1(1) (2)2 8 2
4 4 2 4 6 2 4(3) (4) 32 4 2 4 3 3 1
2 6 9 14 7 2(5) 2 3 (6)2 3 62 6 2
x x x x x x xx x x x x
x xy y x y x k k kkx x k k
k k k x xkk xk x x
+ − − + + +× ÷− −
− + − − + − +÷ × ÷ − ÷− − + −
+ − − − +× ÷ − ×+ −− + −
Addition and subtraction of algebraic fractions Whenever you add or subtract algebraic fractions, the first thing you need to do is to determine the lowest common multiple of the denominators (LCD). This may have been referred to as the LCM. You then have to convert each fraction to an equivalent fraction so that each fraction’s denominator is the same as the LCD. The last thing to do is to write the numerators over the LCD. In the example below we will establish the skill of finding an LCD for different kinds of denominators.

25
EXAMPLE 20 Determine the lowest common multiple of the denominator (LCD) for each of the following sets of algebraic fractions.
(a) 2 31 1 1; ;
24 3 xyx x
For the numbers 4, 3 and 2 the lowest common multiple is 12. For the variables 2 3, and x x x , the term with the highest exponent will be used in the LCD. In this case, the term used will be 3x . Since there are no other terms in y, you will just use y in the LCD. The LCD is 312x y .
(b) 1 1;2x x+
Take note that 2x + is a binomial whereas x is a single term.
Therefore both the denominators have to be accounted for in the LCD. The LCD is ( 2)x x + .
(c) 21 1;
2 2x x+ + 2x + and 2 2x + are binomials but are not identical.
Therefore both the denominators have to be accounted for in the LCD. The LCD is 2( 2)( 2)x x+ + .
(d) 21 1;
2 ( 2)x x+ + 2( 2)x + is the term with the highest exponent for ( 2)x + .
The LCD: 2( 2) or ( 2)( 2)x x x+ + +
(e) 21 1;
2 2x x x+ + 2 2x x+ can be factorised: 2 2 ( 2)x x x x+ = +
Therefore there is x to consider as a single term and ( 2)x + to consider as a binomial. The LCD is ( 2)x x +
(f) 1 1 1; ;4 4 4 4x x x+ +
4 4x + can be factorized: 4 4 4( 1)x x+ = +
Therefore there are 4 and 4x to consider as single terms and ( 1)x + and ( 4)x + to consider as binomials.
The LCD is 4 ( 1)( 4)x x x+ + EXAMPLE 21 Simplify the following:
(a) 2 31 21
4 3x
x y x−+ −
(b) 2 13 3
x x − +
(c) 23 2
3 3x x−
+ +

26
Solutions (a) Insert brackets around a numerator that has more than one term.
32 3
1 ( 2)1 LCD 124 3
x x yx y x
−+ − =
3
3 2 3
3
3 3 3
3
3
3
3
1 12 1 3 ( 2) 41 3 412 4 3
12 3 4 ( 2)12 12 12
12 3 4 ( 2)12
12 3 4 812
x y x x yx yx y x x
x y x y xx y x y x y
x y x y xx y
x y x xy yx y
−= × + × − ×
−= + −
+ − −=
+ − +=
(b) Method 1 Method 2
22
2
2 2
2
2 2
2
2
2 2
2 2
3 2(c) ( 3)( 3)3 33 ( 3) 2 ( 3)
( 3) ( 3)( 3) ( 3)
3( 3)
L
2( 3)( 3)( 3) ( 3)( 3)
3( 3) 2( 3)( 3)( 3)
3 9 2 6 3 2 3( 3)( 3) ( 3)( 3)
CD x xx x
x xx xx x
x xx x x x
x xx x
x x x xx x x x
− + ++ +
+ += × − ×+ ++ +
+ += −+ + + +
+ − +=+ +
+ − − − += =+ + + +
=
2
2 13 3
3 2 3 1 find the LCD of each bracket3 3
(3 2)(3 1) top top and bottom bottom9
9 3 29
x x
x x
x x
x x
− +
− + =
− += × ×
− −=
2
2
2
2 13 3
1 2 23 3 9
9 3 6 29
9 3 29
x x
x x x
x x x
x x
− +
= + − −
+ − −=
− −=

27
EXERCISE 14
(a) Simplify the following:
(1) 2 13 6x + (2)
3
7 2 16 9 3x xy x
− + (3) 23 2x x
+
(4) 2 112
aa −+ − (5) 5 2
6 2x
xy x+− (6) 5 1
2 2x
x x+−−
(7) 2 51x x
++
(8) 22 6
22x
xx+ −
++ (9) 3 3
3 3x xx x
− +−+ −
(10) 24 1
2 1(2 1)xxx+−++
(11) 22 7 1 5 1
2 44x xy
xy x y++ − +
(12) 3 2 13 2 6
x x x− − +− + (13) 23 2
xxx
−−
(b) Simplify the following and write your answers as single fractions:
(1) 1 13 3
x x + −
(2) 1 12 33 2
x y x y + −
(3) 21
4x −
(4) 1 1x xx x
+ −
(5) 22
1 11x xx x
+ − +
(6) 22
2x
x +
(c) Simplify the following complex fractions:
2
1 92(1) (2) 31 3
xx x
xx
+ −−
−
Simplification of expressions involving the factorisation of denominators EXAMPLE 22 Simplify the following: 2
2
1 2 1(a)4 41 2 1 [factorise the denominators first]
( 4) 4( 1) 4 (2 1) ( 4) [LCD 4 ( 4)]( 4) 4 4 ( 4)4( 1) (2 1)( 4)
4 ( 4) 4 ( 4)4( 1) (2 1)( 4)
4 ( 4)4 4 (2 9 4)
4 ( 4
x xx x x
x xx x x
x x x x xx x x x
x x xx x x xx x x
x xx x x
x x
− +−+− +−+
− + += × − × = ++ +− + += −+ +
− − + +=+
− − + +=+
2
2
)4 4 2 9 4
4 ( 1)2 5 84 ( 1)
x x xx x
x xx x
− − − −=+
− − −=+

28
25 3 4(b)
6 3 25 3 4 [factorise the denominators first]
( 3)( 2) 3 2[ 2 2 but 3 3 and we know that 3 ( 3)]
5 3 4( 3)( 2) ( 3) 2
5 3 4 [LCD ( 3)( 2)]( 3)( 2) ( 3) ( 2)
5
xx x x x
xx x x x
x x x x x xx
x x x xx x x
x x x x
+ +− − − +
= + +− + − +
+ = + − ≠ − − = − −
= + +− + − − +
= − + = − +− + − +
=
2
2
3 ( 2) 4 ( 3)( 3)( 2) ( 3) ( 2) ( 2) ( 3)5 3 ( 2) 4( 3)
( 3)( 2)5 3 6 4 12
( 3)( 2)3 2 7
( 3)( 2)
x x xx x x x x x
x x xx x
x x xx x
x xx x
+ −− × + ×− + − + + −
− + + −=− +
− − + −=− +
− − −=− +
EXERCISE 15 (a) Simplify the following as far as possible.
(1) 23 3
xx x
+− −
(2) 23 3
xx x
−+ +
(3) 22 1
3 9x x
x x++
− − (4) 2
3 143 4x
xx x+−−− −
(5) 25
52 11 5x
xx x−
++ + (6) 2
2 244 4
x xx x x
−−− −
(7) 3 26 6 6
xx x
−−+
(8) 2 24 2
22 (2 )x x x
xx x x+ +− +
−− −
(9) 2 32 8 1
4 2 1 8 1x x
x x x+ +−
− + +
(b) Mr Faulty was given the following question.
Simplify 23 1 3
xx x
−+
Mr Faulty answered it in the following manner:
( )( )
123 1 3 1
xx x
+∴ − ×
+ + …………..Line 1
33 1 3 1
xx x
= −+ +
…………..Line 2
33 1xx−=+
…………..Line 3
(1) What were the fundamental errors made in line 1 and line 2? (2) Show Mr Faulty the correct way of doing it.

29
Summary of the strategies for working with algebraic fractions Multiplication and division Addition and subtraction 1. When dividing remember to “tip and times” when required 2. Factorise the numerator and denominator 3. Consider the sign-change rule 4. Cancel and simplify
1. Factorise the denominators 2. Consider the sign-change rule 3. Find the LCD and convert each fraction to an equivalent fraction with the same denominator (LCD) 4. Write your answer as one fraction
CONSOLIDATION AND EXTENSION EXERCISE (a) State whether the following numbers are rational or irrational. If you consider the
number to be rational, provide an explanation of why it is rational.
(1) 67
(2) 519
− (3) 36
(4) 6 (5) 36 (6) 7
(7) ( )27 (8) 0,45 (9) 16
4
(10) 3 8 (11) 3 8− ` (12) 225 400+ (b) Without using a calculator and by showing all of your workings, determine between
which two integers the following irrational numbers lie: (1) 54 (2) 54− (3) 4 25 (c) Write down three rational numbers between and . (d) Represent the following on a number line: (1) { }: 2 5 ;x x x− ≤ < ∈ (2) { }: 3 ;x x x< ∈
(3) (4) (e) Simplify the following:
(1) (2 3 )(3 2 )x y x y− + (2) 2 4 2( 1)( 1)( 1)x x x+ + − (3) 23(2 5)x− − (4) 2 2(9 12 16 )(3 4 )x xy y x y+ + −
(5) 2 3 4(6 ) 43 2 9
x x y x x y − − −
(6) ( 2 3)( 2 3)a b a b− + + +
(7) 2 3 2 2 3 2 3(3 4 ) ( 2 )( 2 )x y x y x y− − + − +
(8) 3(5 2 )a b− (9) 4 4 3
4 4 2(2 3 )(2 .3 )
x xx x
+
(f) Factorise the following:
2 2 2
3 3 2
2 2 2
2 2 2
3 2 3 2 3
(1) 3 5 12 (2) 3 9 12 (3) 12 16 3
(4) 64 (5) 64 (6) 64
(7) 4 100 (8) 4 100 (9) 64
(10) ( 3) 4( 3) (11) ( 3) 4(3 ) (12) 64
(13) 3 6 2 (14) 3 6 2 (15) 2 16
x x x x x x
x x x x
x x x x
x x x x x x x
x x x x x x x
− − − − − −
− − −
− − +
− − − − − − − +
− + − − − + −
2 10
[ )4 ; ∞ ( 5 ; 25−

30
(g) Simplify:
(1) 23 66
x xx+ (2) 3 2 3 17
4 3x x
x x y+− −
(3) 3
22 13
124xx
xx−− + (4)
4 2
34 8
8x x
x−
(5) 223 42
2xx
x +−
(6) 22 4 43
2 2x x
x x x+ −+ +
− −
(7) 3
3(2 )
8x
x−−
(8) 2 23 1
5 6 ( 3)x x
x x x− −
− + −
(9) 4 2
216 4 16
16 4x x
x x− +÷
(h) The number π is the ratio of the circumference of a circle to its diameter.
(1) Use your calculator to determine π. Is the number π rational or irrational?
(2) Show that the recurring decimal 3,142857 is rational.
(3) It has been stated in the past that 227
π = . Is this true?
Use the results in (1) and (2) to justify your answer. (i) (1) Simplify: 2 2 29 (3 2)x x− −
(2) Factorise: 2 2 29 (3 2)x x− − (j) Factorise: 3 22 2 1x x x+ + +
(k) Simplify:
21
21
xx
xxx
−−
+−
(l) (1) Factorise: 2 12 32p p− + (2) Hence or otherwise factorise: 2( ) 12( ) 32a b a b+ − + +
(m) 1If 7, determine the value of:xx
− =
2 32 3
1 1(1) (2)x xx x
+ −
(n) If 2( ) 10a b+ = , 2ab = − and a b> , calculate the value of:
(1) 2 2a b+ (2) a b−
(o) If 2 2 10a b+ = and 3ab = calculate the value of a ba b
+−
if
(p) 2 2( ) 4 9ax b x px+ = + + determine the value of a, b, and p where , , 0a b p >
0, and a b a b+ > >

31
(q) Calculate without the use of a calculator: 2
22011.(2012 9).2013
2015.(2012 1)−
−
(r) Factorise:
(1) 21 42
x x− − (2) 2 73 12
x x− + (3) 21 1 37 2 7
x x+ +
(s) Simplify: 2 2 1 1( ) ( )x y x y− − − −− ÷ + (t) If the product of two numbers is 40 and their sum 20. Show that the sum of their
reciprocals is equal to 12
.

32
CHAPTER 2 EXPONENTS
REVISION OF THE EXPONENTIAL LAWS AND DEFINITIONS In earlier grades you were introduced to the expression
... ( factors)na a a a a n= × × × × where a represents the base, n the exponent and na the power. Here is a summary and examples of the exponential laws and definitions. The bases are positive and the exponents are integers.
LAWS EXAMPLES
Bases are variables Bases are numerical
1. .m n m na a a += 4 4 1 52 . 3 2 . 3 . . 6x x x x x= = 3 3 3 93 . 3 . 3 3 19 683= =
2(a) m
m nn
a aa
−= ( m n> ) 7
34
y yy
= 6
24
6 6 366
= =
2(b) 1m
n n maa a −= ( m n< )
4
7 31y
y y=
4
6 26 1 1
366 6= =
3. ( )m n m na a ×= 3 2 3 2 6( )p p p×= = 5 5 5 5 25(5 ) 5 5×= =
4. ( )m m mab a b= 3 2 2 3 2 2 6 2(4 ) 4 16x y x y x y×= = 6 8 3 18 24(2 . 3 ) 2 . 3=
5. m m
ma ab b
=
3 3 3
38 2 812 3 27
d d de e e
= =
32 6
32 2 645 1255
= =
DEFINITIONS EXAMPLES
Bases are variables Bases are numerical
1. 0 1a = 0 05 (2 ) 5 1 1 6x x+ = × + = 06 . 3 6 1 6= × =
2. 1nnx
x− = 7
71yy
− = 22
1 14164
− = =
3. nn
aaxx
− = 44
33xx
− = 33 3
1 4 4 14.2 4.8 22 2
− = = = =
4. 1( )( )
nnax
ax− = 3
3 31 1(2 )
(2 ) 8x
x x− = = 2
21 1(4 2)
64(4 2)−× = =
×
5. 1 nn x
x− = 55
1 aa− = 3
31 5 125
5− = =
naPower
Exponent
Base

33
6. nn
a axx− = 6
67 7 y
y− = 22
2 2.3 2.9 183− = = =
7. 1 n
nxaax− =
9
91
88p
p− = 2
21 3 9 41
5 5 55.3− = = =
8. 1 ( )( )
nn ax
ax − = 4 44
1 (2 ) 16(2 )
m mm − = = 2 2
21 (3 2) 6 36
(3 2)− = × = =×
9. n na b
b a
− =
2 2 2
25 4 164 5 25
x y yy x x
− = =
2 22 7 49 1127 2 4 4
− = = =
10. m n
n ma bb a
−
− = 5 8 6
6 2 5 8 2.. . .
a b cc d a b d
− −
− = 3 2
2 32 3 9 9
4 .8 324 . 3 4 . 2
−
− = = =
OTHER RULES EXAMPLES
1. 1 1 1 1 1 .........( times) 1n n= × × × × = 3681 1=
1000 1000(80 79) 1 1− = =
2. ( ) if is evenn na a n− =
4 4( 3) 3 81− = = 2016 2016( 1) 1 1− = = 3 6 6 18 6 18 18( 2 ) ( 2) . 2 64x x x x− = − = =
3. ( ) if is oddn na a n− = −
5 5( 3) 3 243− = − = − 2017 2017( 1) 1 1− = − = − 3 5 5 15 5 15 15( 2 ) ( 2) . 2 32x x x x− = − = − = −
EXERCISE 1 (REVISION OF GRADE 8 AND 9)
Simplify: (a) (1) 3 22 8p p× (2) 2 3 46 . 6x y xy (3) 5 32 . 2 . 2
(4) 4 8 29 . 9 . 3 (5) 2 27 . 7 . 7 (6) 2 27 7 7+ + (7) 5 5 55 . 5 . 5 (8) 1212 .12 (9) 13 123 . 3 (10) 8 88 . 8 (11) 2 23 .2 (12) 34.2
(13) 3 5 2(3 )x y (14) 2 32(2 )a (15) 22 33(2 )a b
(16) 3 3 2 2(2 ) (3 )x x× (17) 5 7 3(2 . 6 ) (18) 3 3 33(3 .2 )
(19) 5
3xx
(20) 5
9xx
(21) 38
8
(22) 6
1044
(23) 14
61218
aa
−−
(24) 40 16
36 20x yx y
(25) 3 10
8 46
12a b ca b c
− (26) 2 3 2
7(3 )
(3 )(3 )x y
xy xy (27)
23 5
103 . 212a a
a b

34
(b) (1) 02 p (2) 0(2 )p (3) 0 22(3 )a (4) 5x− (5) 2 2( )a − (6) 62−
(7) 3 52 . 2− (8) 3 6 311 .11 .y y y− − (9) 24x− (10) 2(4 )x − (11) 33a− (12) 3(3 )a −
(13) 24.2− (14) 2(4.2)− (15) 41
x−
(16) 21
7− (17) 22
3− (18) 21
2.3−
(19) 21
(2.3)− (20) 41
2x− (21) 41
(2 )x −
(22) 35
3
−
(23) 3
352
−
− (24) 2
533−
(25) 4
5xy
−
− (26) 2 3 5 8
4 6 8a b c dab c d
−
− − (27) 4 3
2 139
x yx y
− −
− −
(28) 4
53
5 . 3
−
− (29) 2 4 2
2 3( )x y
x y
−
− (30) 23 2
16 .(2 )
xx
−−
(31) 7 2 7
1 10 92(3 ) .3 4
a abc a b
−
− × (32)
2 2 3 6
6 22( ) ( )
(2 )a b ab
b
− − −
−× (33)
24 8
2 3.
.x yx y
−−
−
(c) (1) 601 (2) 47(49 48)− (3) 2014(2016 2015)− (4) 60( 1)− (5) 61( 1)− (6) 50(48 49)− (7) 2017(2015 2016)− (8) 4( 2)− (9) 5( 2)− (10) 9( )a− (11) 12( )a− (12) 6( 2)− − (13) 7( 2)− − (14) 4 3( 3 )( 3 )− − (15) 4 3( 3) ( 3)− − (16) 3 4( 2 )a− (17) 3 5( 2 )a− (18) 3 30( )a b−
(19) 3 33( )a b− (20) 4( 3 )xy− − (21) 5( 3 )xy− −
(22) 2 3 4( 2 )x y− − (23) 2 3 7( 2 )x y− − (24) 3 2 3 3( 3 ) ( 3 )x x− − Remember the difference between multiplication and addition:
4 4 2 8 8(4 )(4 ) 4 . 16x x x x= = [add the exponents of like bases] 4 4 44 4 8x x x+ = [add the coefficients but not the exponents]
(d) Simplify: (1) 3 312 3 2x x− × (2) 3 2 42 . 3 .x x x x+ (3) 3 33 . 4 .x x x x−
(4) 2 3( 2 )( 3 )x y xy− − (5) 5 5 3 64 . 4 3 .x x x x+ (6) (7) 5 5 9 10(5 )(4 ) 15 . 10a a a a b− + (8) 3 4 5 2( 6 . ) ( 2 )( )x x x x− + − − (9) 4 2 2 3( 2 )( 3 ) ( 2 )( 2 )x y xy x− − − − − (10) 3 2 2 33( 2 ) 2( 2 )a a− − + − (11) 4 3 2 2 32 . 3 ( 2 ) ( 3 )( 2 )x x x x x− − + − −
2 2 3 3( 2)( 2 )( 2 )a b a b− − −

35
EXAMPLE 1 Simplify the following:
(a) 2 2 4
7 516 . (3 )2 . 2 . 81
(b) 4
2(2 ) . 9
12
x x
x (c) 1
4162 . 32
x
x
−
Solutions
(a) 2 2 4
7 516 . (3 )2 . 2 . 81
(b) 4
2(2 ) . 9
12
x x
x (c) 1
4162 . 32
x
x
−
4 2 8
12 4(2 ) . 32 . 3
= 4 2
2 22 . (3 )(2 . 3)
x x
x= 4 1
4 5(2 )2 . 2
x
x
−=
8 8
12 42 . 32 . 3
= 4 2
4 22 . 32 . 3
x x
x x= 4 4
4 522
x
x
−
+=
4 4 (4 5)
4 4 4 5
2
22
x x
x x
− − −
− − +
=
==
EXERCISE 2
(a) Simplify the following leaving your answers in exponential form where necessary:
(1) 4 5
23 . 3
3 (2)
8 4
52 . 2
2 (3)
15
12 65
5 . 5
(4) 5 4
3 22 . 2(2 )
(5) 4 2
5 2(3 )3 . 3
(6) 5
3 35 . 5(5 )
(7) 3
2 3(2 . 5)
2 . 5 . 5 (8)
3 2
3 5(2 . 3)2 . 3
(9) 3 3 3
2 5(3 ) . 73 . 3 . 49
(10) 2 3 4 2
6(3 ) . (2 )
9 . 3 . 64 (11)
3 3
2 3 7 236 .16
6 . 6 . (2 ) (12)
2 5 4 2
9 3(11 ) . (7 )(11)(11) . 49
(13) 7 4
12 2 781 .8
3 . (3 ) . 4 (14)
4 2 2
4125 . (5 . 3) . 3
15 (15)
4 4
20(2 )8 . 2
−
−
(b) Simplify the following:
(1) 2 . 2x x (2) 5(2 )x (3) 3(3 )x (4) 32 . 2x (5) 3 5(5 . 3 )x (6) 29 . 3x x
(7) 281 . 27x x (8) 5 . 525
x x
x (9) 3(2 ) . 2
16
x x
x
(10) 2
27 . 7(7 . 7)
x x
x (11) 25 .93 .3 .5
x
x x (12) 3
2(2 ) . 27
8 . (3 ) . 3
x x
x x x
(13) 12 . 32 . 4
x x
x
− (14) 32
4
x
x (15) 31 1.
4 16
x
x
−
1=4
43 81
162= =

36
(c) Simplify the following:
(1) 2 1
233
x
x
+ (2)
5
222
x
x
+
+ (3) 4
555
m
m
+
+
(4) 3 6
3 422
x
x
+
+ (5) 4 2
4 466
x
x
−
− (6) 2 34
2
n
n−
(7) 2 1
1749
x
x
−
− (8) 1
29
3 .81
x
x
+ (9)
3
4168
p
p
−
−
(10) 15 . 25
5 .125
x x
x
− (11)
1
2 1 29 . 4
3 . 2
a a
a a
−
− (12) 2
2 5366
x
x
+
+
(13) 1
1 250
2 . 25
x
x x
+
+ + (14) 25 . 45
9 . 5
y
y y+ (15) 1
1 2 118 . 8
9 . 4
x x
x x
−
+ −
EXPRESSIONS WITH RATIONAL EXPONENTS Exponents need not always be restricted to integers. It is possible to work with powers that include other rational exponents such as fractions. The next example works with fractional exponents. EXAMPLE 2
Simplify: 1 12 23
3(4 ) .x x
x
−
−
Solution
1 12 23
3(4 ) .x x
x
−
−
1 12 22 3
3(2 ) .x x
x
−
−= [write 4 to the base 2]
3 12 2
32 .x x
x
−
−= [multiply exponents]
3 12 2
32x
x
−
−=1
1 3 43
2 2 . 2x x x xx−= = = [apply exponential laws and simplify]
EXERCISE 3 (a) Simplify: (1)
1327 (2)
13125 (3)
1664
(4) 124 2(9 ) .x x− (5)
1 14 22(16 ) .a x (6)
136 1(27 ) .y y−
(b) Simplify:
(1) 122
1(36 )
3xx− (2)
136
3(64 )
2xx
− (3)
13
13 2
(125 )
25 . ( )
m
m−
(4) 14
312 2
2
3
(49 )
(7 ) .
x
x− (5)
1 12 2
12
3 1
2
(9 ) . ( )
(3 )
x x
x
− (6)
1 19 3
16
3 2
2
( ) . ( )
( )
x x
x
−

37
EXAMPLES INVOLVING FACTORISATION EXAMPLE 3 Simplify:
(a) 1 23 2 . 37 . 3
x x
x
+ ++ (b) 9 3 29 4
x x
x+ −
− (challenge)
Solutions
(a) 1 23 2 . 37 . 3
x x
x
+ ++
1 23 . 3 2 . 3 . 37 . 3
x x
x+= [apply the rule .m n m na a a+ = ]
1 23 (3 2 . 3 )7 . 3
x
x+= [factorise numerator]
3 (3 2 . 9)7 . 3
x
x+=
3 (21)7 . 3
x
x=
3= [simplify]
(b) 9 3 29 4
x x
x+ −
−
2
2(3 ) 3 2
(3 ) 4
x x
x+ −=
− [write 9x to base 3]
2
2(3 ) 3 2
(3 ) 4
x x
x+ −=
− [apply the rule ( ) ( )m n n ma a= ]
(3 2)(3 1)(3 2)(3 2)
x x
x x+ −=+ −
[factorise the numerator and denominator]
(3 1)(3 2)
x
x−=−
[simplify]
EXERCISE 4 (a) Simplify:
(1) 2 32 2
12 . 2
x x
x
+ ++ (2) 1 2
13 3
8 . 3
x x
x
+ +
++ (3)
2 1
22 22 2
x x
x x
+ +
+−
+
(4) 4 3
15 5100 . 5
x x
x
+ +
+− (5)
2 1
2 14 3 . 2
7 . 2
x x
x
+
++ (6)
2 1
1(3 ) 9
9
x x
x
−
−−
(7) 1
18 . 2 2 .16
11. 2
x x x
x
+
++ (8)
1
2 412 4 . 3
2 . 3
x x x
x x
+
++ (9)
2
1 12. 3 3
5 . 2 7 . 3
x x
x x
−
+ −+−

38
(b) Simplify:
(1) 9 13 1
x
x−+
(2) 4 92 3
x
x−−
(3) 25 365 6
x
x−+
(4) 36 366 6
x
x−+
(5) 36 66 1
x x
x−−
(6) 16 494 7
x
x−+
(7) 9 3 63 3
x x
x− −
− (8) 4 4 . 2 3
2 1
x x
x− +
− (9)
125 5 65 6
x x
x
+− −−
EXPONENTIAL EQUATIONS In Grade 9 you learnt that in an exponential equation, the exponent is the unknown. EXAMPLE 4 Solve the following equations:
(a) 34 . 25 4x+ = (b) 1 1(0,5)4
xx− =
(c) 2 19 3 36x x++ =
Solutions (a) 34 . 25 4x+ =
325 1x+∴ = [divide both sides by 4] 2 3 0(5 ) 5x+∴ = [write 25 to base 5 and 1 as 05 ]
2 6 05 5x+∴ = [multiply exponents] 2 6 0x∴ + = [equate exponents] 2 6x∴ = − 3x∴ = −
(b) 1 1(0,5)4
xx− =
1
21 12 2
x x− ∴ =
[write 0,5 as a fraction and 4 as 22 ]
1 1 2(2 ) (2 )x x− − −∴ = [apply the definition 1 nn a
a−= ]
1 22 2x x− + −∴ = [multiply exponents] 1 2x x∴− + = − [equate exponents] 1x∴ = − [solve] (c) 2 19 3 36x x++ = 2 2(3 ) 3 . 3 36x x∴ + = [write 9 to base 3] 2 23 3 . 3 36x x∴ + = [apply the rule .m n m na a a+ = ] 23 (1 3) 36x∴ + = [factorise] 23 (4) 36x∴ = [simplify]
23 9x∴ = [divide both sides by 4] 2 23 3x∴ = [write 9 to base 3] 2 2x∴ = [equate exponents] 1x∴ = [solve]

39
EXERCISE 5 (a) Solve the following equations:
(1) 2 1x = (2) 3 3x = (3) 3 27x = (4) 4 16x = (5) 47 49x = (6) 3.3 243x = (7) 3 12 64x− = (8) 4121 11x = (9) 2( 1)3 81x− = (10) 55.5 5x− = (11) 2.3 162x = (12) 8 . 2 128x =
(13) 139
x = (14) 1416
x = (15) 15125
x = (16) 1 42
x =
(17) 1 164
x =
(18) 1 13 27
x =
(19) 11 13
3 3
x− =
(20) 21 . 2 18
x =
(b) Solve the following equations:
(1) 15 . 9 5x− = (2) 27 . 49 49x+ = (3) 1 34349x =
(4) 3 15 .12525
x+ = (5) 22 8
3 27
x− =
(6) (0, 25) 0,125x =
(7) 2(0,2) 0,04x− = (8) 0,4 0,064x = (9) 1 3 3(3 ) 9x x+ −= (10) 14 16x x−= (11) 13 9 81x x−⋅ = (12) 1(0,5) 4x x− −=
(13) 2 1 281 27x x+ −= (14) 18 2. 4x x− −= (15) 24. 2 (0,5)x x−= (c) Solve the following equations: (1) 1 22 2 24x x+ ++ = (2) 15 2 . 5 75x x+ − = (3) 33 3 3 3x x x+ + = (4) 17 14 . 7 147x x+ + = (5) 2 12 . 3 3 . 9 243x x+ + = EQUATIONS WITH RATIONAL EXPONENTS (FRACTIONS) EXAMPLE 5 Solve the following equations:
(a) 13 4x = (b)
1 12 45 6 0x x− + =
Solutions
(a) 13 4x =
13 3 3( ) 4x∴ = [raise both sides to the reciprocal of the exponent]
81x∴ =
(b) 1 12 45 6 0x x− + =
21 14 4( ) 5 6 0x x∴ − + = [change the expression
12x to
14 2( )x ]
1 14 4( 3)( 2) 0x x∴ − − = [factorise the trinomial]
4 4 4 4
1 14 4
1 14 4
3 or 2
( ) 3 or ( ) 2 81 or 16
x x
x xx x
∴ = =
∴ = =∴ = =

40
EXERCISE 6 (a) Solve for x:
(1) 12 5x = (2)
13 2x = (3)
14 1x =
(4) 15 2x = (5)
23 4x = (6)
32 27x =
(7) 52 32x = (8)
76 128x = (9) 53 729x =
(b) Solve for x:
(1) 1 12 47 12 0x x− + = (2)
1 12 48 16 0x x− + = (3)
1 12 48 7 0x x− + =
(4) 1 13 66 8 0x x− + = (5)
1 17 143 2 0x x− + = (6)
129 18 0x x− + =
CONSOLIDATION AND EXTENSION EXERCISE (a) Simplify without using a calculator: (1) 2 22 (2 )x x− −+ (2) 0 02 (2 )x x+ (3) 1 1a b− −+ (4) 1( )a b −+ (5) 3013(3011 3012)− (6) 4 2 2 4(3 ) . 2( )x x (7) 4 2 2 4(3 ) 2( )x x+ (8) 3 3 3(3 3 )x x+ (9) 2 2 2 3( 4 ) . ( 4 )x y x y− −
(10) 22 4
6 71218
x yx y
−−
−
(11) 2 3
432 . 25100 . 8
(12) 2 13 3
12
38 . (2 )
16
−
(13) 1 19 . 24
27 .8
x x
x x
− + (14)
22 5 . 2 25 . 2
x x x
x
+ + + (15) 1 118 32
13
4 3 1
2
( ) . ( ) . ( )
( )
x x x
x
− −
(16) 121 411 2
x
x−
+ (17)
14 3 . 2 272 3
x x
x
+− −+
(18) 50 1010 2
x x
x x−−
(b) Solve for x: (1) 4 0,25x = (2) 29 . 27 3x− = (3) 3 216 . 4 8x x+ −=
(4) 322 250x = (5)
1 12 48 15 0x x− + = (6) 3 2 12 8 48x x+ ++ =
(c) Simplify: (1) 4 . 4 . 4x x x (2) 4 4 4x x x+ + (3) 10 10 104 2 . 4 3 . 4+ + (d) (1) What is one half of 242 ?
(2) What is one sixth of 366 ? (e) Show that: (1) 8 12 6 24 268 4 16 2 2+ + + = (2) 303 is greater than 204
(f) If 1 2na = + and 1 2 nb −= + , show that 1
aba
=−
.

41
CHAPTER 3 NUMBER PATTERNS
REVISION OF LINEAR NUMBER PATTERNS (GRADE 9) In Grade 9, you studied linear number patterns in which there is a constant difference between consecutive terms. For example, consider the sequence 5 ; 7 ; 9 ;11; ...................
2 1T T 7 5 2− = − = 3 2T T 9 7 2− = − = 4 3T T 11 9 2− = − = There is a constant difference of 2 between consecutive terms. We call this constant difference d. The sequence is generated by adding d to each term. In this example, 2d = . It is easy to determine consecutive terms since you are adding 2 to each previous term. Finding the 5th, 6th, 10th or even the 20th term is easy to do. However, if you are required to determine the 100th term, this would be extremely time-consuming. We need to therefore find a rule which helps us do this. This rule is called the general rule for the sequence. One way to find this general rule is to link the position of the term to the constant difference and work from there. Notice that in the sequence above:
1T 5 2(1) 3= = + where 2 is the constant difference, 1 is the position of 5 (first term) and 3 is added to keep the actual term 5.
2T 7 2(2) 3= = + where 2 is the constant difference, the 2 in brackets is the position of 7 (second term) and 3 is added to keep the actual term 7.
3T 9 2(3) 3= = + where 2 is the constant difference, the 3 in brackets is the position of 9 (third term) and 3 is added to keep the actual term 9. We can continue to generate terms of the sequence in this way.
4 5 6T 2(4) 3 11 T 2(5) 3 13 T 2(6) 3 15= + = = + = = + = The general rule is T 2 3n n= + and this rule can help us to find other terms:
10T 2(10) 3 23= + = 100T 2(100) 3 203= + = A table is useful for determining the general rule of a sequence with a constant difference. Using the previous example, draw a table as follows:
The position of the term 1T 2T 3T 4T 5T 10T Tn The constant difference multiplied by the position of term
2(1) 2(2) 2(3) 2(4) 2(5) 2(10) 2( )n
What to do to get the actual term 3+ 3+ 3+ 3+ 3+ 3+ 3+
The actual term in the sequence 5 7 9 11 13 23 2( ) 3n +
The general rule using the letter n is T 2 3n n= + where 2 represents the constant difference and n the position of the term in the sequence. It is important to note that the value of n is always a natural number. We say that the nth term of the sequence is T 2 3n n= + . This general rule can now be used to determine any term of the sequence. For example: 9T 2(9) 3 21= + = 30T 2(30) 3 63= + =
Let’s revise another example to make sure that you fully understand these concepts.
1T 2T 3T 4T 5T 6T 7T

42
EXAMPLE 1 6 ;10 ;14 ;18 ; ......... is a given sequence. (a) Determine the general rule (nth term). (b) Calculate the 100th term. (c) Which term of the sequence is equal to 242? Solutions (a) Draw a table. The constant difference is 4.
The nth term is T 4 2n n= + (b) T 4 2n n= + 100T 4(100) 2 402∴ = + =
(c) The actual term in the sequence is 242 and we want to find its position. Let T 242n = where n represents the position to be determined.
T 4 2242 4 2242 2 4240 460
n nn
nn
n
= +∴ = +∴ − =∴ =∴ =
60T 242∴ = [242 is the 60th term in the sequence]
AN ALTERNATIVE METHOD FOR LINEAR NUMBER PATTERNS The general rule for any linear number pattern takes the form Tn bn c= + , so let’s explore this a little further. We can determine the first few terms using this rule.
1
2
3
4
TT (1)T (2) 2T (3) 3T (4) 4
n bn cb c b cb c b cb c b cb c b c
= += + = += + = += + = += + = +
The constant difference is b and the first term is b c+
The position of the term 1T 2T 3T 4T Tn The constant difference multiplied by the position of term
4(1) 4(2) 4(3) 4(4) 4( )n
What to do to get the actual term 2+ 2+ 2+ 2+ 2+
The actual term in the sequence 6 10 14 18 4( ) 2n +
3b c+ 4b c+
b b b
b c+ 2b c+
3b c+ 4b c+
b b b
b c+ 2b c+

43
Now let’s determine the general term of the linear pattern 5 ; 7 ; 9 ;11; ................... using these findings.
2b = 5b c+ = (first term) 2 5c∴ + = (substitute 2b = into the equation 5b c+ = )
3c∴ = T
T 2 3n
n
bn cn
= +∴ = +
EXAMPLE 2 6 ;10 ;14 ;18 ; ......... is a given sequence. Determine the general rule (nth term) and hence the 1000th term. Solutions
4b = 6b c+ = 4 6c∴ + = 2c∴ = T
T 4 2n
n
bn cn
= +∴ = +
[Teacher’s note: The main reason for using Tn bn c= + is to avoid confusion in Grade 11 when quadratic patterns of the form 2Tn an bn c= + + are dealt with]. T 4 2n n= +
1000T 4(1000) 2 4002= + =
EXERCISE 1
(a) For each of the following sequences, determine the general rule (nth term) and hence calculate the 100th term.
(1) 6 ; 9 ;12 ;15 ; ........ (2) 9 ;13 ;17 ; 21; ........ (3) 3 ; 8 ;13 ;18; ........ (4) 3 ; 7 ;11;15 ; ........ (5) 10 ;16 ; 22 ; 28 ; ..... (6) 4 ;11;18 ; 25 ; ....... (7) 5 ; 0 ; 5 ; 10 ; .......− − (8) 0 ; 3 ; 6 ; .......− − (9) 6 ; 11; 16 ; .......− − − (10) 5 ;1 ; 3 ; 7 ; ....− − (11) 5 ; 11; 17 ; ........− − − (12) 1 1
2 23 ; 4 ; 4 ; ........
(13) 1 1 12 2 22 ; 4 ; 6 ; ..... (14) 71
4 4;1; ; ........ (15) 0,5 ; 0,7 ; 0,9 ; .... (16) 13 ; 7 ; 1 ; .....− − − (17) 1 ; 9 ; 19 ; .......− − (18) 13 ;12 ;11;10 ; .....
(b) 4 ;11;18 ; 25 ; ......... is a given sequence. (1) Determine the 45th term. (2) Which term of the sequence is 627? (c) 19 ;16 ;13 ;10 ; ......... is a given sequence. (1) Determine the 65th term. (2) Which term of the sequence is 113− ? (d) T 9 4n n= − is the nth term of a linear number pattern (sequence). (1) Determine the first four terms of the sequence. (2) Which term is equal to 986? (e) Consider the number pattern: 4 7 ; 7 15 ;10 23 ;13 31; ......× × × ×
(1) Determine the nth term. (2) Determine the 50th term
b c+
b
b c+
b

44
REVISION OF OTHER TYPES OF NUMBER PATTERNS (GRADE 9) EXAMPLE 3 Determine the general term (nth term) and hence the 20th term of the following number patterns: (a) 3 ; 6 ;12 ; 24 ; ......... (b) 3 ; 6 ;11;18 ; ......... Solutions
(a) 01T 3 3 1 3 2= = × = × [ 01 2= ]
12T 6 3 2= = ×
23T 12 3 2= = ×
34T 24 3 2= = ×
The nth term is 1T 3 2nn
−= ×
1920T 3 2 1 572 864∴ = × =
(b) Start by adding 3 to 3 to get 6. Then add 5 to 6 to get 11. Increase the number added each time by 2 to get consecutive terms. To get the nth term of this type of sequence, work with the position squared and take it from there. 2
1T 3 (1) 2= = + [square position 1 and add 2 to get 3]
22T 6 (2) 2= = + [square position 2 and add 2 to get 6]
23T 11 (3) 2= = + [square position 3 and add 2 to get 11]
24T 18 (4) 2= = + [square position 4 and add 2 to get 18]
The nth term is 2T 2n n= +
2T 2n n= +
220T (20) 2 402∴ = + =
EXERCISE 2 (a) For each of the following number patterns, determine the general rule and hence the 10th term.
(1) 2 ; 4 ; 8 ;16 ; ........ (2) 1; 3 ; 9 ; 27 ; ........ (3) 4 ;12 ; 36 ; ........ (4) 32 ;16 ; 8 ; 4 ; ....... (5) 2 ; 6 ; 18 ; ........− − − (6) 1
2 ;1; 2 ; 4 ; ........
(7) 1416 ; 4 ;1; ........ (8) 1 1 1 1
2 4 8 16; ; ; ; ........ (9) 7 74 1628 ; 7 ; ; ........
(b) For each of the following sequences, determine the nth term and hence the 100th term.
(1) 1 ; 4 ; 9 ;16 ;......... (2) 2 ; 5 ;10 ;17 ; ..... (3) 4 ; 7 ;12 ;19 ; ..... (4) 5 ; 8 ;13 ; 20 ; .... (5) 0 ; 3 ; 8 ;15 ; .... (6) 1 ; 2 ; 7 ;14 ; ....−
(c) Determine the general term of the sequence: 1 3 9 27; ; ; ; ............5 8 13 20
1T 2T 3T 4T

45
CONSOLIDATION AND EXTENSION EXERCISE (a) Consider the number pattern: 7 ;16 ; 25 ; 34 ; ....... (1) Determine the nth term and hence the 300th term. (2) Determine which term of the number pattern equals 448.
(b) Consider the number pattern: 2 ; 5 ; 8 ; 11; .......− − − − (1) Determine the nth term and hence the 145th term. (2) Determine which term of the number pattern equals 389− . (c) Consider the diagram made up of black dots joined by thin black lines.
(1) How many dots are there in figure 4? (2) How many lines are there in figure 4? (3) How many dots are there in figure 8? (4) How many lines are there in figure 8? (5) Determine the general rule to find the
number of dots in the nth figure. (6) How many dots are there in the 186th figure? (7) Which figure will contain 272 dots? (8) Determine the general rule to find the number of lines in the nth figure. (9) How many lines are there in the 900th figure? (10) Which figure will contain 650 lines?
(d) Consider the following designs.
(1) Write down the number of squares in design 1, 2, 3, 4, and 5. (2) Determine the number of squares in design n. (3) How many squares are there in design 20?
(e) Consider the sequence: 5 14 22 26 302 ; ; ;1; ; ; ;............4 13 23 28 33
(1) Determine the nth term. (2) Calculate the 20th term.
(f) Consider the number pattern: 1 ; 3 ;1; 6 ;1; 9 ;1;12 ;1;....... Determine the 999th and 1000th terms.
(g) Sipho wrote the name SWEET over and over again as follows: SWEETSWEETSWEETSWEET.................................
(1) What is the 23rd letter? (2) Find the 402nd letter. (3) The first W is in the second position, the second W is in the seventh position, the
third W is in the twelfth position, and so forth. Determine in what position is the 100th W?

46
CHAPTER 4 EQUATIONS AND INEQUALITIES LINEAR EQUATIONS (REVISION OF GRADE 9) A linear equation is an equation of degree one with at most one solution. EXAMPLE 1
Solve the following linear equations:
(a) 3 4( 2) 3 16k k− + = + (b) 4 1 7 23 6 2
x x x− +− = Solutions (a) 3 4( 2) 3 16k k− + = + 3 4 8 3 16k k∴ − − = + [use the distributive law] 4 5 3 16k k∴− − = + [collect like terms] 4 3 16 5k k∴− − = + [add 5 and subtract 3k from both sides] 7 21k∴− = [collect like terms] 3k∴ = − [divide both sides by 7− ] To verify that this value is the solution, substitute into the left and right sides: Left side 3 4(( 3) 2) 7 = − − + = Right side 3 4(( 3) 2) 7 = − − + = ∴Left side = Right side 3k∴ = − is the solution.
(b) 4 1 7 23 6 2
x x x− +− =
The equation contains fractions. Insert brackets around the numeratorors if they are expressions of more than a single term. Determine the lowest common multiple of the denominators (LCD).
(4 1) (7 2) LCD 63 6 2
x x x− +− = =
In Grade 9 two approaches were discussed. Method 1 is the preferred approach. Method 1 Method 2 Multiply both sides by the LCD Write every term as a fraction with
the common denominator
(4 1) (7 2)6 6 6
3 6 2x x x− +× − × = ×
(4 1) 2 (7 2) 1 33 2 6 1 2 3
x x x− +× − × = ×
6(4 1) 6(7 2) 6
3 6 2x x x− +∴ − =
2(4 1) (7 2) 36 6 6x x x− +∴ − =
2(4 1) (7 2) 3x x x∴ − − + = 2(4 1) (7 2) 3x x x∴ − − + = 8 2 7 2 3x x x∴ − − − = 8 2 7 2 3x x x∴ − − − = 4 3x x∴ − = 4 3x x∴ − = 3 4x x∴ − = 3 4x x∴ − = 2 4x∴ − = 2 4x∴ − = 2x∴ = − 2x∴ = −

47
EXERCISE 1 (a) Solve the following equations:
(1) 12 6 3x x+ = − (2) 2 5 3 3x x− = + (3) 3( 2) 2( 1)p p+ = − (4) 4( 3) 3 6( 2)x x− = − − (5) 7( 2) 2(7 3 ) 2 0m m− − − + = (6)
(b) Solve the following equations:
(1) 24 3x x− = (2) 3 11
4 2x x− = (3) 5 7
3xx ++ =
(4) 2 3 53 6
y y+ −− = (5) 2 1 5 05
a a− − + = (6)
(7) 3 2( 1) 24
x x+ − + = (8) 3 4 5 12 42 3 4 5
k k + − = −
QUADRATIC EQUATIONS (REVISION OF GRADE 9 AND EXTENSION) A quadratic equation is a second degree equation with a standard form 2 0ax bx c+ + = and has at most two real solutions. From the standard form it is clear that one side of the equation has to equal zero. When the right hand side is zero then the quadratic expression on the left hand side has to be factorised. Then you apply the zero-factor law, which states that if . 0a b = then either 0 or 0a b= = . This is due to the fact that if you multiply any number by zero the answer will always be zero. For example, the zero-factor law can be applied to the equation ( 3)( 4) 0x x+ − = as follows: ( 3)( 4) 0
3 0 or 4 03 or 4
x xx xx x
+ − =∴ + = − =∴ = − =
EXAMPLE 2
Solve each of the following equations:
2 2 2
2
(a) 5 14 0 (b) 5 2 3 (c) 2 4
(d) 8 16 0 (e) (3 1)( 2) 0 (f ) (3 1)( 2) 10
x x x x x x
x x x x x x
− − = + = =
− − = − + = − + =
Solutions
(a) 2 5 14 0x x− − = ( 7)( 2) 0x x∴ − + = [factorise] 7 0 or 2 0x x∴ − = + = [apply the zero-factor law] 7 or 2x x∴ = = −
(b) 25 2 3x x+ = 22 5 3 0x x∴ + − = [standard form] (2 1)( 3) 0x x∴ − + = [factorise] 2 1 0 or 3 0x x∴ − = + = [apply the zero-factor law] 2 1x∴ =
12
x∴ = or 3x = −
2 6 14 3 2
m m+ −− =
4(2 7) 8(5 ) 3(2 4) 5( 7)x x x x− − − = + − +

48
(c) 22 4x x= Alternatively: 22 4 0x x∴ − = [standard form] First divide by 2: 2 ( 2) 0x x∴ − = [factorise] 2 2x x∴ = 2 0 or 2 0x x∴ = − = 2 2 0x x∴ − = 0 or 2x x∴ = = [apply the zero-factor law] ( 2) 0 x x∴ − = 0 or 2x x∴ = = However, please take note that you may never divide both sides by the variable you are solving for. The reason for this is that you will lose one of the solutions.
2
2
(d) 8 16 0 (e) (3 1)( 2) 0
0 8 16 [standard form] 3 1 0 or 2 0( 4)( 4) 0 [factorise] 3 1
14 0 [no need to write both] or 23
4
x x x x
x x x xx x x
x x xx
− − = − + =
∴ = − + ∴ − = + =∴ − − = ∴ =
∴ − = ∴ = = −∴ =
2
2
(f) (3 1)( 2) 10 The right side is not zero so proceed as follows:
3 6 2 10 [expand the product]
3 5 12 0 [standard form](3 4)( 3) 0 [factorise]3 4
x x
x x x
x xx x
x
− + =
∴ + − − =
∴ + − =∴ − + =∴ = [apply the zero-factor law]
4 or 33
x x∴ = = −
EXAMPLE 3 (Quadratic equations of the form 2 constantx = ) Solve each of the following equations: (a) 2 36x = (b) 23 48x = (c) 2 25 0x + = (d) 2( 5) 9x + = (e) 2( 5) 9x + = − Solutions
(a) 2 36x = Alternatively: 2 36 0x∴ − = [standard form] 2 36x = ( 6)( 6) 0x x∴ − + = [factorise] 2 36x = ± 6 0 or 6 0x x∴ − = + = 6x∴ = ± 6 or 6x x∴ = = − 6 or 6x x∴ = = − (b) 23 48x = Alternatively: 2 16x∴ = [divide by 3] 2 16x∴ = 2 16 0x∴ − = [standard form] 2 16x∴ = ± ( 4)( 4) 0x x∴ − + = [factorise] 4x∴ = ± 4 or 4x x∴ = = − 4 or 4x x∴ = = −

49
(c) 2 25 0x + = The expression on the left cannot be factorised into real factors. Proceed as follows: 2 25x = − 25x∴ = ± −
Since 25− is non-real, the equation has no real solutions.
(d) 2( 5) 9x + = [the right side is not zero] Alternatively: 2 10 25 9x x∴ + + = [expand the left side] 2 10 16 0x x∴ + + = [standard form] ( 2)( 8) 0x x∴ + + = [factorise] 2 or 8 x x∴ = − = − [apply zero-factor law] (e) 2( 5) 9x + = −
5 9 x∴ + = ± − There are no real solutions
EXERCISE 2 (a) Solve the following equations:
(1) ( 3)( 6) 0x x− + = (2) ( 4)( 8) 0x x+ − = (3) ( 3) 0x x + = (4) (2 5)(3 1) 0x x− + = (5) 4( 8) 0x x+ − = (6) 3 (2 5) 0x x + = (b) Solve the following equations:
(1) 2 9x = (2) 2 49x = (3) 22 200x = (4) 2 9x x= (5) 29x x= (6) 22 5x x=
(7) 24 16x = (8) 24 16x x= (9) 2 2 8x x− = (10) ( 5) 6 0x x − + = (11) 23 5 2 0x x− − = (l2) 22 10x x− =
(13) 22 14 16 0x x− − + = (14) ( 3)( 2) 12m m− − = (15) 2( 2) 16x + = (16) 26(1 ) 5x x− = (17) ( 7)( 3) 24p p− + = (18) 2 4x = − (19) 2(2 1) 4x + = (20) 2( 3) 16x + = − (21) 29 4 0x + = (22) 25( 1) 45x − = (23) 2 2x x= − (24) 2 9 0x− + = (25) 2(2 1) (2 1)(2 1)x x x− = + − (26)
(c) Consider the equation 24x x= (d) Consider the equation 2 64 0x + = Sandy solved it in the following Andy solved it in the following way: way:
2
2
( 5) 9
( 5) 95 35 3 or 5 3
8 or 2
x
xxx xx x
+ =
∴ + = ±∴ + = ±∴ + = − + =∴ = − = −
2
2
14
State her error(s) and then solve theequation
4
correc
4
t
4
.
1
ly
x x
x xx xx
x
=
∴ =
∴ =∴ =
2( 3)( 4) (3 2) 8 ( 1)x x x x x x− + − − = − −
2
State his error(s) and then solve
64 0(
the
8)( 8
equa
)
t
08
ion correctly.
xx x
x
+ =∴ + + =∴ = −

50
EQUATIONS WITH FRACTIONS (VARIABLES IN THE DENOMINATOR) When solving equations with fractions (variables in the denominator) it is important to remember that division by 0 is not permissible. You must always check that your solutions do not make any one of the denominators 0. That is the reason why we must state restrictions when solving equations with variables in the denominators. EXAMPLE 4 Solve the following equations. Consider the solution(s) carefully as the solution(s) may have been stated as a restriction.
2
2
16 4( 4) 4 10 2(a) 10 (b)5 5
2 5 3(c)3 39
xx x x x x x
x x xx xx
++ = − =− −
−+ =− +−
Solutions (a) In this example, there are variables in the denominator. Since the denominators can
never equal zero, it is important to note that 0x ≠ . LCD x= and the restriction is 0x ≠
16 4( 4)10 [multiply every term by the LCD]
10 16 4( 4)10 16 4 16 [this is a linear equation]6 0
0
xx x xx x
x xx x
xx
+∴ × + × = ×
∴ + = +∴ + = +∴ =∴ =
However, since 0x ≠ , the equation does not have a solution. (b) With the addition and subtraction of algebraic fractions, you needed to factorise the
denominators first before finding the LCD. With equations you will do the same.
24 10 2
5 54 10 2
5 ( 5)LCD ( 5) and the restrictions are:
0 and 5 0 5
4 10 2( 5) ( 5) ( 5) [multiply by the LCD]3 ( 5)
4 10( 5) 24 10
x x x x
x x x xx x
x xx
x x x x x xx x x xx xx x
− =− −
∴ − =− −
∴ = −≠ − ≠
≠
∴ × − − × − = × −− −
∴ − − =∴ − + 50 2
6 2 506 48
8
xx
x
=∴− = −∴− = −∴ =
This is a valid solution since it is not stated as a restriction.

51
(c) 22 5 3
3 39x x x
x xx−+ =
− +−
2 22
2 5 3 [change in sign: 9 ( 9)]3 3( 9)
x x x x xx xx
−∴ + = − = − −− +− −
2 5 3 [factorise]3 ( 3)( 3) 3
2 5 33 ( 3)( 3) 3
LCD ( 3)( 3) and the restrictions are: 3 and 32 5 3( 3)( 3) ( 3)( 3) ( 3)( 3)
3 ( 3)( 3) 32 ( 3) (5 3)
x x xx x x x
x x xx x x x
x x x xx x xx x x x x x
x x x xx x x x
−∴ + =− − − + +
−∴ − =− − + +
∴ = − + ≠ ≠ −−∴ × − + − × − + = × − +
− − + +∴ + − − =
2 2
2
( 3)
2 6 5 3 3 [this is a quadratic equation]
4 3 0 [standard form]( 1)( 3) 0
1 or 3 Since 3, the solution is 1
x
x x x x x
x xx x
x xx x
−
∴ + − + = −
∴ + + =∴ + + =∴ = − = −
≠ − = −
Summary of the strategy for solving equations with fractions 1. Apply the sign-change rule if necessary and then factorise the denominators. 2. State the restrictions. 3. Multiply every term by the lowest common denominator (LCD). 4. Identify the equation as linear or quadratic and solve the equation.
EXERCISE 3
(a) Solve the following equations. Remember to verify whether or not the solution to the equation is viable by considering the restrictions.
(1) 6 3 12 4x x
= − (2) 3 1 2 52x x x
− = +
(3) 2 1 5 13 3x x x
+ = + (4) 2 12
x − = −
(5) 27 5 3
1x
x xx x− =
++ (6) 2
3 3 62 24
xx xx
++ =− +−
(7) 23 5 24
6 2 8 10 24x
x x x x−− =
− − − + (8) 2
2 1 5 24
x xx x x+ − =
−
(b) Solve the following equations:
(1) 183xx
− = (2) 2 5 71 2 1
xx x x
− − =− + −
(3) 26 2 1
2 24x
x xx+ −− =
− +− (4)
2 1 21
xx
− = −+
(5) 1 22 3 2
xx x x
= −− − −
(6) 3 4 44 3 4
xx
− =−
(7) 23 4 3 2 23
6 3 3 18x x xx x x x
+ −= −+ − + −

52
SIMULTANEOUS LINEAR EQUATIONS Consider the graphs of the straight lines with equations 3 2 8x y− = and 4 2 6x y+ = . Take careful note of the point of intersection of these two graphs, which is (2 ; 1)− . How can we determine this point algebraically?
The sketching of straight line graphs will be revised in Chapter 6. These two lines intersect at the point (2 ; 1)− or at 2 and 1x y= = − . This can be verified by substituting these values into both equations as follows: 3 2 8x y− = 4 2 6x y+ = 3(2) 2( 1) 8− − = 4(2) 2( 1) 6+ − = True statement True statement The values 2 and 1x y= = − are said to satisfy the equations simultaneously. We will now discuss algebraic methods as an alternative method when solving two linear equations simultaneously. There are two algebraic methods: Elimination and Substitution. THE METHOD OF ELIMINATION This method is the preferred method when solving two linear equations simultaneously. EXAMPLE 5
Solve for x and y simultaneously: 3 2 8 and 4 2 6x y x y− = + = Solution Method 1 (Eliminating y)
Label each equation as follows:
3 2 8.......... A4 2 6.......... B
x yx y
− =+ =
By vertically adding these two equations you will eliminate one of the variables (y in this case) and be able to solve for the other variable (x in this case):
3 2 8.......... A4 2 6.......... B
(A B) is 7 0 14 Add the like terms of equation A and B7 14
2
x yx y
x yx
x
− =+ =
∴ + + =∴ =∴ =
1
23
1− 0 1 2 31−
2−
3−
4−

53
Now solve for y if 2x = . Therefore, substitute 2x = into either A or B to get y: If using equation A: If using equation B:If 2 then 3(2) 2 8 If 2 then 4(2) 2 6
6 2 8 8 2 62 2 2 2
1 1
x y x yy y
y yy y
= − = = + =∴ − = ∴ + =∴− = ∴ = −∴ = − ∴ = −
Method 2 (Eliminating x) 3 2 8.......... A4 2 6.......... B
x yx y
− =+ =
If we want the terms in x to be eliminated when added, the coefficients have to be additive inverses (1 and 1 or 2 and 2 or 3 and 3 etc.)− − − . Let us therefore consider the lowest common multiple (LCM) of 3 and 4 (the coefficients of x) in order to attain that. The LCM is 12. We want the coefficient of x of equation A to be 12 and that of equation B to be 12− . Multiply each term of equation A by 4 Multiply each term of equation B by 3− and call the new equation C: and call the new equation D: 3 4 2 4 8 4.......... (A 4) 4 3 2 3 6 3.......... (B 3)
12 8 32......... C 12 6 18.......... Dx y x y
x y x y× − × = × × × − + × − = × − × −
∴ − = − − = −
Now by vertically adding the equations C and D you will eliminate the x:
12 8 32............... C12 6 18.......... D
(C D) is 0 14 14 Add the like terms of equation C and D14 14
1
x yx y
x yx
y
− =− − = −
∴ + − =∴− =∴ = −
If using equation A: If using equation B:If 1 then 3 2( 1) 8 If 1 then 4 2( 1) 6
3 2 8 4 2 63 6 4 8
2 2
y x y xx xx x
x x
= − − − = = − + − =∴ + = ∴ − =∴ = ∴ =∴ = ∴ =
EXERCISE 4 Solve for x and y by using the method of elimination: (a) 3 and 2 9x y x y− = + = (b) 6 and 3 10x y x y+ = − + = − (c) 2 5 and 1x y x y+ = − = − (d) 3 5 8 and 2 1x y x y+ = − = − (e) 2 3 10 and 4 5 42x y x y− = + = (f) 3 4 7 and 2 5 16y x x y− = + =

54
THE METHOD OF SUBSTITUTION The elimination method works mainly for two linear equations only, but the method of substitution is a method you can use for other systems of equations as well. It may seem a little longer than the elimination method but its process is much easier to understand. EXAMPLE 6
Solve for x and y simultaneously: 3 2 8 and 4 2 6x y x y− = + = Solution Method 1 (Making y the subject of one of the equations)
Label each equation as follows: 3 2 8.......... A4 2 6.......... B
x yx y
− =+ =
Now pick either one of the equations and solve for one of the variables. Let’s solve for the variable y in equation B as it will be the easier one because the resultant equation will have no fractions. 4 2 6
2 4 62 3.........C [divide both sides by 2]
x yy x
y x
+ =∴ = − +∴ = − +
Now replace the variable y in equation A with 2 3x− + and solve for x: 3 2 8
3 2( 2 3) 8 3 4 6 8 7 14
2Now substitute 2 into either equation A, B or C. Equation C will always be theeasiest choice. If 2 then 2(2) 3 4 3 1
x yx xx xx
xx
x y
− =∴ − − + =∴ + − =∴ =∴ =
=
= = − + = − + = −
Method 2 (Making y the subject of both equations)
3 2 8.......... A4 2 6.......... B
x yx y
− =+ =
Solve for the variable y in both equation A and B: 3 2 8 4 2 6
2 3 8 2 4 63 4........C 2 3.........D2
x y x yy x y x
xy y x
− = + =∴− = − + ∴ = − +
∴ = − ∴ = − +
Now you equate equations C and D because both equations are equal to y.

55
3 4 2 323 8 4 6 [multiply by the LCD of 2] 3 4 8 6 7 14
2Now substitute 2 into either A, B, C or DEquation C or D will be the easiest. We will choose equation D.
2(2) 3 4 3 1
x x
x xx xx
xx
y
− = − +
∴ − = − +∴ + = +∴ =∴ =
=
∴ = − + = − + = −
Method 3 (Making x the subject of one of the equations) 3 2 8.......... A4 2 6.......... B
x yx y
− =+ =
Choose either one of the equations and solve for x. Let’s use equation A: 3 2 8
3 2 82 8 .........C [divide both sides by 3]3 3
x yx y
yx
− =∴ = +
∴ = +
Now replace the variable x in equation B with 2 83 3y + and solve for y:
4 2 6 2 84 2 6 3 3
8 32 2 6 3 3
8 32 6 18 [multiply by 3]14 14
12( 1) 8 2 8If 1 then 2
3 3 3 3
x yy y
y y
y yy
y
y x
+ =
∴ + + =
∴ + + =
∴ + + =∴ = −∴ = −
− −∴ = − = + = + =
EXERCISE 5 (a) Solve for x and y by using the method of substitution:
(1) 8 and 2 10x y x y− = + = (2) 3 2 and 7 2 8x y x y− = − = (3) 3 5 8 and 2 1x y x y+ = − = − (4) 7 3 41 and 3 17x y x y− = − =
(b) Solve for x and y using either the elimination or substitution method:
(1) 1 and 2 1x y x y+ = − = (2) (3) 4 14 and 3 2 12x y x y+ = + = (4) 2 3 7 and 4 5 21y x y x− = − = (5) 3 2 6 and 5 3 11x y x y+ = + =
(6) 2 1 4 31 and 1
3 2 5 4y x y x− − − −− = − =
(c) At ABC shop, 3 hamburgers and 2 cooldrinks cost R89, whereas 2 hamburgers and 3 cooldrinks cost R73,50. Determine the cost of 1 hamburger.
3 2 2 and 5 2 18x y x y+ = − = −

56
LITERAL EQUATIONS A literal equation is one in which letters of the alphabet are used as coefficients and constants. These equations, usually referred to as formulae, are used a great deal in Mathematics, Science and Technology. The aim is to solve the equation or formula for a specific letter (or to make that letter the subject of the formula). This is a very useful skill in Grade 12. EXAMPLE 7
(a) Make t the subject of the formula v u at= + . (b) The area of a circle is given by 2A r= π . Make r the subject of the formula. (c) The surface area of a cylinder is given by A 2 ( )r h r= π + .
(1) Show that 2A 2
2rh
r− π=
π.
(2) Hence determine the value of h if the radius is 3 cm and the surface area is 286 cm . Round off your answer to one decimal place.
Solutions (a)
Subtract from both sides:
Divide both sides by where 0 :
v u atu
v u ata a
v u ta
= +
∴ − =≠
−∴ =
2
2
2
(b) ADivide both sides by :
A
Square root both sides:
A
A (not as is positive)
r
r
r
r r
= ππ
∴ =π
∴ =π
∴ = ±π
2
(c) (1) A 2 ( )A [divide both sides by 2 ]
2A
2A 2 [LCD is 2 ]
2
r h r
h r rr
r hr
r h rr
= π +
∴ = + ππ
∴ − =π− π∴ = π
π
.
(2) 286 2 (3) 1,6 cm
2 (3)h − π= =
π

57
EXAMPLE 8 The variable you are solving for may sometimes be present in more that one term. For these types of equations, you will need to factorise first before solving the equation. (a) Make d the subject of the formula if T a nd d= + −
(b) Solve for x in terms of y if 2 26 8x xy y= + Solutions (a)
( 1) [factorise]
1
T a nd dT a nd dT a d nT a dn
= + −∴ − = −∴ − = −
−∴ =−
EXERCISE 6 (a) (1) Make a the subject of the formula v u at= +
(2) Make s the subject of the formula 2 2 2v u as= +
(b) Solve for x in the following equations:
(1) ax b c+ = (2) 3 2ax bx c= + (3) 2 0ax bx+ = (4) 2 24 0x y− = (5) 2 25 6 0x xy y− + = (6) 2 218 8y x= (c) Make the variable that is written in brackets after the formula the subject of the formula.
(1) S ( L), ( )2n a a= + (2) 9F C 32, (C)
5= +
(3) 2
F , ( )mv ggr
=
(d) Make v the subject of the formula: 1 1 1u v f
+ =
(e) Make the variable that is written in brackets after the formula the subject of the formula. (1) 2E , ( )mc c= (2) 2 2 2 , ( )v u as u= + (3)
2 2
2 2
(b) 6 8 [quadratic equation]
6 8 0 [standard form]( 4 )( 2 ) 0 [factorise]
4 0 or 2 04 or 2
x xy y
x xy yx y x y
x y x yx y x y
= +
∴ − − =∴ − + =∴ − = + =∴ = = −
2F , ( )mv v
gr=

58
LINEAR INEQUALITIES Consider the following true statement: 5 3− <
If we add or subtract any value to both sides, the statement above will still be true: 5 2 3 2 5 2 3 2
3 5 7 1− + < + − − < −∴− < ∴− <
But, if we multiply (or divide) both sides by 1− , the statement will become 5 3< − , which is clearly now false. However, if the direction of the inequality sign was reversed, then the statement would become true, i.e. 5 3> − . Therefore the following rules are always applicable when working with inequalities:
• Change the direction of the inequality sign whenever you multiply or divide by a negative number.
• Do not change the direction of the inequality sign if you multiply or divide by a positive number.
• Do not change the direction of the inequality sign if you add or subtract by a number or expression.
EXAMPLE 9
Solve the following inequalities and then represent their solutions on a number line: (a) 2 6 (b) 2 6
2 1(c) 4(2 1) 5 2 (d) 2 13
x xxx x x
> − − > −−− > + ≥ +
Solutions
2 6 2 6(a) (b)2 2 2 2
3 3
x x
x x
− − −> >− −
∴ > − ∴ <
[All real numbers larger than 3− ] [All real numbers smaller than 3] [The inequality remains the same] [The inequality is reversed]
(c) 4(2 1) 5 2
8 4 5 28 5 2 43 6
2
x xx xx xx
x
− > +∴ − > +∴ − > +∴ >∴ >
[All real numbers larger than 2]
[All real numbers smaller than and including 1− ]
2 1(d) 2 132 1 3 (2 1) 3
32 1 6 32 6 3 1
4 41
x x
x x
x xx x
xx
− ≥ +
−∴ × ≥ + ×
∴ − ≥ +∴ − ≥ +∴− ≥∴ ≤ −
3− 3
2
1−

59
EXAMPLE 10 Solve the following compound inequalities and then represent the solutions on a number line:
(a) 3 3 1 5x− < − < (b) 12 3 52
x− < − ≤
Solutions (a) The inequality 3 3 1 5x− < − < is read as follows: 3 1x − is smaller than 5 AND larger than 3− which implies that both the inequality
statements must be true.
3 3 1 and 3 1 53 2 and 3 6
2 and 23
2 23
x xx x
x x
x
− < − − <∴− < <
∴ > − <
−∴ < <
An alternative and relatively easier approach is the following:
3 3 1 53 1 3 1 1 5 1 [add 1 to all terms in order to get by itself]2 3 6 [divide all three terms by 3]2 2 [inequality signs remain the same]
3
xx x
x
x
∴− < − <∴− + < − + < +∴− < <
−∴ < <
[All real numbers greater than 23
− and smaller than 2]
1(b) 2 3 5215 2 [subtract 3 to all terms]2
10 4 [multiply all terms by 2][Note that the inequality signs had to be reversed]Rewrite the inequality as follows:
4 10
x
x
x
x
− < − ≤
∴− < − ≤
∴ > ≥ − −
∴− ≤ <
23
− 2
23
x > −
2x <2 23
x− < <
23
− 2
4− 10

60
EXERCISE 7
(a) Solve the following inequalities and represent the solutions on a number line. (1) 18 9 2x x+ ≤ − (2) 3 2 5x x− < + (3) 5( 1) 7( 1)x x− > − (4) 4( 3) 2( 1) 0x x− − − ≥
(b) Solve the following inequalities and represent the solutions on a number line.
(1) 13 2x x− > (2) 3 11
4 2x x− ≤ (3) 5 1
3y y+ + ≤
(4) 3 2 6 04 3
y y+ −− > (5) ( 3)( 4) ( 3)( 4)x x x x+ − ≤ − +
(c) Solve the following inequalities and represent the solutions on a number line. (1) 2 1 5x− ≤ − < (2) 3 2 4− < + <x (3) 5 2 1 5x− ≤ + ≤ (4) 8 3 2 4x− < − < (5) 9 1 5 21x− < − ≤ (6) 2 2 2x− ≤ − <
CONSOLIDATION AND EXTENSION EXERCISE (a) Solve for x: (1) 2 5 3x x= + (2) 22 5 3x x= + (3) 24 16x x= (4) 24 16x = (5) 2 3 10x x− + = − (6) (7) 2(2 3) 0x x− + = (8) ( 2)(2 3) 6x x− + = −
(9) 3( 2) 2 5 44 2
x x x− −− = (10) 23 1 7
2 3 6x x
x x x+ +− =
(11) 2
26 32
2x
xx x+ = −+
(12) ( )6 3 4 5x x x− + <
(13) 3 7 2 11x− < − ≤ (14) ( )2 3 54 1 25 3
xx x−− − ≤ +
(b) Solve the following equations (1) 3 9x = (2) 3 9x = (3) 23 27x = (4)
(c) Solve for x: 22 2 103x− < − <
(d) (1) Solve: 24 11pp
+ =
(2) Hence solve for x if: 22242 11
2x x
x x− + =
−
(e) Given: 4 2 8 and 3 7x y x y− = − =
Solve for x and y simultaneously using the: (1) elimination method (2) substitution method (3) graphical method (sketch the two lines and find the point at which they
intersect. (f) Solve for x and y using the method of your choice. 5 3 10 and 2 3 12x y y x− = − = (g) Solve for x and represent your answer on a number line: 9 6 10 14x x≤ − < (h) Solve for x in the equation (2 1)( 2) 0x y− + = if: (1) 2y = − (2) 4y =
23 27x x=
( 2)(2 3) 0x x− + =

61
(i) Given: 1 5, 1x xx
+ = >
(1) 22
1xx
+ (2) 1xx
− (3) 33
1xx
+
(j) Given:
1
111
xx
x
−=
+
(1) For which values of x is this equation undefined. (2) Solve the equation.
(k) Consider the equation of a hyperbolic function: 3 42
yx
= +−
(1) For what value of x will the equation be undefined? (2) By making x the subject of the equation, show that the equation is also not defined for 4y = .
(l) There were 600 spectators at a tennis match. Of these 144 were children and there were twice as many men as women. Determine how many women were there.
(m) Tickets to the DJ Sbu concert cost R200 and R300. A total of 250 tickets were sold. The total amount taken for the show was R55 000. Determine how many of each ticket were sold.
(n) The length of a rectangular field is 3 metres more than its breadth. The area of the field is 70 2m . Calculate the length of the field.
(o) The area of a room in a house has the following measurements as indicated on the diagram below. If the total area of the room is 43 2m , calculate the value of x.
32
x +
2x
8 m
2 m

62
CHAPTER 5 TRIGONOMETRY INTRODUCTION TO TRIGONOMETRY Trigonometry can be found in many fields such as navigation, surveying, engineering and architecture. It is the study of the relationships between the angles and the lengths of the sides of triangles. The word “Trigonometry” is derived from two Greek words: ‘trigon’ which means triangle and ‘metron’ which means a measure and therefore trigonometry means literally the measurement of a triangle. Angles in Trigonometry are usually indicated by means of Greek letters: theta, beta, alpha, phiθ = β = α = φ = Right-angled triangles These triangles are fundamental to the study of trigonometry. In Grade 8 you were introduced to the theorem of Pythagoras which describes the relationship between the three sides of a right-angled triangle. From the Theorem of Pythagoras:
2 2 2
2 2 2
2 2 2
c a b
a c b
b c a
= +
= −
= −
Furthermore, we will label the three sides as adjacent, opposite and hypotenuse. The longest side (opposite the right-angle) is called the hypotenuse. The opposite and adjacent sides are dependent on which angle is used as the reference point.
Opposite to B
Adjacent to B
Hypotenuse Adjacent to A
Opposite to A
Hypotenuse
TRIGONOMETRIC RATIOS There are three special ratios in the sudy of Trigonometry, namely the sine, cosine and tangent ratios. When these ratios are applied to a right-angled triangle, they define the relationships between its sides and angles. The triangles sketched on the next page are all similar because their corresponding angles are equal and their corresponding sides are in proportion. Each of the triangles has angles 30°, 60° and 90°. The lengths of the sides are also indicated.

63
With respect to the angle 60° in the three triangles, the ratio opposite sidehypotenuse
will be equal.
opposite side 4,33In ABC: 0,866hypotenuse 5
opposite side 6,928In DEF: 0,866hypotenuse 8
opposite side 3, 464In GHI: 0,866hypotenuse 4
Δ = =
Δ = =
Δ = =
This will be true for any triangle with angles 30°, 60° and 90°. The constant 0,866 is called the sine of 60°. We can write this as follows: sin 60 0,866° = In general, we can define the sine of an angle as follows:
length of the side opposite angle sine of an angle length of the hypotenuse
opposite sinhypotenuse
θθ =
∴ θ =
Notice that in all three triangles:
opposite 2,5 4 2 1sin 30hypotenuse 5 8 4 2
° = = = = =
Opposite 60Adjacent to 30
°°
60° 60° 60°
Adjacent to 60°
30°
30°
30°
Opposite 30°

64
With respect to the angle 60° in the three triangles the ratio adjacent sidehypotenuse
will be equal.
adjacent side 2,5In ABC: 0,5hypotenuse 5
adjacent side 4In DEF: 0,5hypotenuse 8
adjacent side 2In GHI: 0,5hypotenuse 4
Δ = =
Δ = =
Δ = =
This will be true for any triangle with angles 30°, 60° and 90°. The constant 0,5 is called the cosine of 60°. We can write it as follows: cos 60 0,5° = . In general, we can define the cosine of an angle as follows:
length of the side adjacent to angle cosine of an angle length of the hypotenuse
adjacent coshypotenuse
θθ =
∴ θ =
Notice that in all three triangles:
adjacent 4,33 6,928 3,464cos30 0,866hypotenuse 5 8 4
° = = = = =
With respect to the angle 60° in the three triangles the ratio opposite sideadjacent side
will be equal.
opposite side 4,33In ABC: 1,732adjacent side 1,5opposite side 6,928In DEF: 1,732adjacent side 4opposite side 3, 464In GHI: 1,732adjacent side 2
Δ = =
Δ = =
Δ = =
This will be true for any triangle with angles 30°, 60° and 90°. The constant 1,732 is called the tangent of 60°. We can write it as follows: tan 60 1,732° = In general, we can define the tangent of an angle as follows:
length of the side opposite angle tangent of an angle length of the side adjacent to angle opposite tanadjacent
θθ =θ
∴ θ =

65
Notice that in all three triangles:
opposite 2,5 4 2tan 30 0,577adjacent 4,33 6,928 3,464
° = = = = = (rounded off to 3 decimal places)
We can therefore conclude that the trigonometric ratios of any two similar triangles will be the same. Summary of the trigonometric ratios
oppositesinhypotenuse
θ = adjacentcos
hypotenuseθ =
oppositetanadjacent
θ =
EXAMPLE 1 In DEFΔ , ˆ ˆ ˆDE 5, EF 12, E 90 , D and F .= = = ° = β = θ
(a) Determine the length of the hypotenuse DF.
(b) Write the value of sin , cos and tanθ θ θ .
(c) Write the value of sin , cos and tanβ β β . Solutions (a) 2 2 2DF 5 12= + [Pythagoras]
2DF 169
DF 13 cm∴ =∴ =
(b) opp 5sinhyp 13
θ = = (c) opp 12sinhyp 13
β = =
adj 12coshyp 13
θ = = adj 5coshyp 13
β = =
opp 5tanadj 12
θ = = opp 12tanadj 5
β = =
EXAMPLE 2 Determine: (a) tan Q (b) cos V Solutions
2 2 2 2 2 2
2 2
(a) PR 15 9 (b) SV 25 7
PR 144 SV 576
PR 144 12cm SV 576 24cmopp 12 4 adj 24tan Q cos Vadj 9 3 hyp 25
= − = −
∴ = ∴ =
∴ = = ∴ = =
∴ = = = ∴ = =
θ
βD
E F12 cm
Opposite Adjacent to
θβ
Opposite Adjacent to
βθ
θ
βD
E F12 cm
P
Q R
S
T
V
9 cm
15 cm
25 cm7 cm

66
EXERCISE 1 (a) Redraw the triangles below and indicate which sides are opposite, adjacent and hypotenuse with respect to θ .
θ θ
(b) State the following in terms of g, k and m:
(1) sin K (2) cos K(3) tan K (4) sin G(5) cos G (6) tan G
(c) State the following in terms of p, q and r:
(1) sin (2) cos(3) tan (4) sin(5) cos (6) tan
θ θθ αα α
(d) DEFΔ is shown with given dimensions. (1) Determine the length of EF. (2) Write the value of sin , cos and tanθ θ θ
(e)
Determine the value of:
(1) sin N (2) tan C (f) (1) Determine cos L and cos B
(2) What do you notice?
(3) What can you deduce about the two triangles and why?
α
θ
DEθ
F
N
EB C O
P
15cm17cm 4 cmk
5 cmk
N E
B
12cm
16cm30cm
K
P L24cm

67
CALCULATING THE TRIGONOMETRIC RATIOS OF A GIVEN ANGLE The sine, cosine and tangent ratio can be calculated with the use of a calculator which must be on the DEG (degree) mode.
Consider the triangles we used to discover the sine, cosine and tangent ratios on page 64.
We discovered that adjcos 60 0,5hyp
° = = and it is possible to use a calculator to do this
calculation as well as for the other trigonometric ratios of 60°.
On your calculator, press the button “cos” and then type in “60” (some calculators will expect you to close the brackets first). Then press “ = ” and you will get 0,5. Now verify the ratios of sin 60 0,866 and tan 60 1,703° = ° = rounded to three decimal places. EXAMPLE 3
Evaluate the following trigonometric ratios rounded off to two decimal places where necessary. (a) cos35 (b) tan 36 (c) sin83 (d) sin 43
sin12(e) cos14 (f) tan 45 (g) 5cos 60 (h)12
1 20,35(i) tan 36 ( j) (k) sin(35 75 ) 0,943 sin 38
° ° ° °°° ° °
° ° + ° =°
(l) sin 35 sin 75 1,54° + ° = Solutions
(a) cos(35 ) 0,82° = (b) tan(36 ) 0,73° = (c) sin(83 ) 0,99° =
(d) sin(43 ) 0,68° = (e) cos(14 ) 0,97° = (f) tan(45 ) 1° =
(g) 5cos(60 ) 2,5° = (h) sin(12 ) 0,0212
° = (i) 1 tan(36 ) 0,243
° =
(j) 20,35 33,05
sin(38 )=
° (k) sin(35 75 ) 0,94° + ° = (l)
Take note: sin(35 75 ) sin 35 sin 75° + ° ≠ ° + ° (An important result) EXAMPLE 4
Determine the decimal value of the following if A 23,8 and B 18,1 = ° = ° (Round off your answers to one decimal place)
2(a) sin(A B) (b) tan 2B (c) cos (2A 10°)+ −
Solutions
2
2
2
(a) sin(23,8 18,1 ) (b) tan(2(18,1 )) (c) cos (2(23,8 ) 10 )
sin(41,9 ) tan(36,2) cos (37,6 )
0,667... 0,7 0,7318... 0,7 (cos(37,6 ))0,627... 0,6
° + ° ° ° − °
= ° = = °
= ≈ = ≈ = °= ≈
sin 35 sin 75 1,54° + ° =

68
EXERCISE 2
(a) Calculate with the use of a calculator the following rounded off to two decimal places where appropriate.
(1) cos 23° (2) sin 68° (3) tan 64°
(4) cos34° (5) 2cos 45° (6) 5sin 65°
(7) 7 tan58° (8) 4sin30− ° (9) 13 sin 70°
(10) sin 6020
° (11) cos 2424
° (12) tan(54 25 )° + °
(13) tan 54 tan 25° + ° (14) 4025sin 45− °
(15) sin 60 cos70tan 46 sin 30
° °° °
(b) Calculate with the use of a calculator the value of the following: [ 2sin θ can be written as ( )22 2(sin ) , eg. sin 23 sin(23 ) 0,1526...θ ° = ° = ]
(1) 2 2sin 61 cos 61° + ° (2) 2 2sin 49 cos 49° + ° (3) 2 2sin 42 cos 42° + ° (4) 2 2cos 30 sin 30° + ° What possible conclusion can you make from the above calculations? (c) Determine the decimal value of the following if A 35= ° and B 52= ° (Round off your answers to two decimal places)
(1) cos (A B)+ (2) cosA cosB+ (3) 3sin 2B
(4) 13tan A3
(5) 22sin (2A B)− (6) cos3A sin B+
SOLVING SIMPLE TRIGONOMETRIC EQUATIONS From the previous example and exercise, we saw that the trigonometric ratio of a given angle can easily be found by using a calculator. The reverse process is also possible. This process is finding the size of an angle when given its sine, cosine or tangent ratio. Consider the trigonometric equation cos 0,5θ = . We want to find the size of the angle that will result in the ratio 0,5. In order to do this, we will make use of the 1cos− function on the calculator. This function can be found above the “cos” button. In order to use this function, you have to press the “SHIFT” button on your calculator. Therefore, the sequence of buttons to press on most of the calculators will be as follows: • Press the SHIFT button followed by the “cos” button. The 1cos− will appear on your calculator screen. • Enter the ratio value (in this case 0.5) • Press the “=” button (some calculators expect you to close the brackets first) Some calculators may have the button INV or 2nd F instead of SHIFT. Always ensure that your calculator is on the degree mode [DEG]

69
EXAMPLE 5 (a) Determine the size of the acute angle θ in each of the following trigonometric equations. Round your answers off to one decimal place where necessary. (1) cos 0,5 (2) tan 4,123 (3) sin 0,707θ = θ = θ = (b) Solve the following equations. Round your answers off to one decimal place where necessary. All angles are acute.
(1) 2sin 1,124 (2) sin 2 0, 435
1(3) tan 2 3 (4) 1 2cos( 10 ) 2,3562
x x
θ = θ =
= + + ° =
Solutions
1
1
(a) (1) cos 0,5 press [shift] [cos] then 0,5
cos (0,5) as it appears on the calculator screen60
(2) tan 4,123 press [shift] [tan] then 4,123
tan (4,123) as it appears on the calculator screen76
−
−
θ =
∴θ =∴θ = °
θ =
∴θ =∴θ =
1
, 4(3) sin 0,706 press [shift] [sin] then 0,706
sin (0,706) as it appears on the calculator screen44,9
−
°θ =
∴θ =∴θ = °
1
(b) (1) 2sin 1,124 sin has been multiplied by 2sin 0,562 isolate sin by dividing by 2
sin (0,562)34,2
−
θ = θ∴ θ = θ
∴θ =∴θ = °
1
(2) sin(2 ) 0,435 insert the brackets
2 sin (0,435)2 25,78529... determine
12,9 divide by 2 and then determine
−
θ =
∴ θ =∴ θ = ° θ∴θ = ° θ
1(3) tan 2 3 LCD: 22
x =
1
12 tan 2 3 2 isolate tan 22
tan 2 6
2 tan (6)2 80,537...
40,3
x x
x
xx
x
−
∴ × = ×
∴ =
∴ =∴ = °∴ = °

70
(4) 1 2 cos( 10 ) 2,356x+ + ° =
1
2cos( 10 ) 1,356cos( 10 ) 0,678
10 cos (0,678)10 47,3124...37,3
xx
xxx
−
∴ + ° =∴ + ° =
∴ + ° =∴ + ° = °∴ = °
EXERCISE 3
(a) Determine the size of the acute angle θ in each of the following, rounding your answers off to two decimal places where necessary. (1) sin 0,866θ = (2) cos 0,866θ = (3) tan 1,703θ = (4) sin 1θ = (5) cos 1θ = (6) tan 1θ =
(b) Solve the following equations by finding the size of the acute angle θ in each case rounding your answers off correct to one decimal place where necessary. (1) cos3 0,33θ = (2) 3cos 0,33θ = (3) sin 4 0,888θ = (4) 4sin 0,888θ = (5) tan 4 4θ = (6) 4 tan 4 4θ =
(c) Determine the value of the acute angle x in each of the following equations. (1) sin( 20 ) 0,678x − ° = (2) 3cos( 30 ) 2,121x + ° = (3) 2 tan(2 10 ) 3, 4641x − ° = (4) 2 tan 2 10 3, 4641x − =
(d) Michael attempted to solve the equation 2 cos(4 20 ) 0,8θ + ° = . Identify what errors were made by Michael in lines 1 and 2 and then provide the correct solution.
1
2cos(4 20 ) 0,8Line 1 cos(2 10 ) 0,4
Line 2 2cos (0,4) 10Line 3 2(66,421... ) 10Line 4 142,8
−
θ + ° =∴ θ + ° =
∴θ = + °∴θ = ° + °∴θ = °
TRIGONOMETRIC RATIOS OF THE SPECIAL ANGLES 30°, 45° AND 60° Before discussing the trigonometric ratios of special angles, it is essential for you to understand the following concepts involving surds. Addition and subtraction of surds Consider the following:
(a) 2 6 5 6 7 6+ = (add the like surds) (b) 7 3+3 7 5 7 7 3 2 7− = − (subtract the like surds) Note that 7 3 2 7− cannot be simplified any further because the surds are unlike.
Multiplication of surds The following rules are useful when multiplying or dividing surds:
● for 0 ; 0a b ab a b× = > >
● 2 2( ) . for 0a a a a a a= = = >

71
30°
60° 60°
3
30°
Consider the following:
(a) 5 7 5 7× = (b) 3 5 2 3 5 2 3 10× = × =
(c) 2( 3) 3= (d) 2 2 2(5 2) (5) ( 2) 25.2 50= = =
(e) 2 5 2 5 2
33 5 3 5× = = −
− × − (f)
2 2 2 2 2 2 2212 2 2 2
++ = × + =
The angles 30° , 45° and 60° are referred to as special angles. The reason for them being called special angles is because the trigonometric ratios of these angles can be evaluated without using a calculator. The following two triangles can be used to determine trigonometric ratios of special angles. Triangle A Triangle B
For 45° we will sketch a right-angled triangle with sides 1 and 1 and then find the third side
using Pythagoras. For 30° and 60°, we will sketch an equilateral triangle with side-lengths of
2 units. The dotted line AD is a perpendicular bisector of side BD and divides A into two
equal angles (30° ). We can find the length of the AD using Pythagoras. EXAMPLE 6 Evaluate the following without using a calculator. Use the above triangles to assist you. (a) cos 45° (b) cos60° (c) tan 45° (d) sin 30° Solutions
(a) adj 1cos 45hyp 2
° = = (Triangle A) (b) adj 1cos60hyp 2
° = = (Triangle B)
(c) opp 1tan 45 1adj 1
° = = = (Triangle A) (d) opp 1sin 30hyp 2
° = = (Triangle B)
45°
45°
2

72
30°
330°
60° 60°
EXAMPLE 7 Calculate the following without using a calculator: (a) sin30 cos60° + ° (b) tan 60 cos30° − °
(c) sin 60tan 30
°°
(d) 2cos 45° Solutions (a) sin30 cos60° + ° (b) tan 60 cos30° − °
1 12 2
1
+
=
(c)
1sin 30 2 1tan 30
3
° =°
(d) 2 2cos 45 (cos 45 )° = °
1 32 1
= × 32
=
EXAMPLE 8 Solve the equation 2cos 3 0x − = without using a calculator where x is an acute angle. Solution
3 is adjacent to 30° and 2 is the hypotenuse
30x∴ = ° since opp 3cos30hyp 2
° = =
EXERCISE 4 (a) Evaluate the following without the use of a calculator:
2
2 2
tan 30(1) sin 30 cos 45 (2) cos30 tan 60 (3)tan 60cos30(4) sin 45 cos 30 (5) tan 60 sin 60 (6)tan 30
°° + ° ° + °°°° − ° ° + °°
3 31 2
2 3 32 2
2 3 3 32 2
= −
= −
−= =
212
12
=
=
2cos 3 0
2cos 3
3cos2
x
x
x
− =
∴ =
∴ =

73
2
sin 45 .cos 45(7) cos30 .tan 30 tan 45 (8)tan 60 .tan 30
(9) 2 cos 45 3 tan 30 (10) 4cos 30 tan 30 .sin 60
° °° ° − °° °
° − ° ° + ° °
(b) (1) Using the fact that 1 aa
= where 0a > , show that 1 2
22=
(2) Hence show that:
(i) 2cos 452
° = (ii) 3tan 303
° =
(iii) (iv) (c) Without using a calculator, solve the following equations, where the angles are acute.
(1) 1sin2
x = (2) 1cos2
x = (3) 2sin 3x =
(4) 2 cos 1x = (5) tan 3x = (6) 3 tan 1 0x − = (7) tan 1x = (8) sin 2 0,5x = (9)
(10) 2cos 2 2x = (11) 3 tan 3x = (12) 1 2sin 44 8
x =
FINDING SIDES AND ANGLES USING TRIGONOMETRIC RATIOS EXAMPLE 9 (Finding the length of a side)
In FUNΔ , ˆ ˆFN 10, U 90 and N 28= = ° = ° . Calculate the length of FU, rounded off to one decimal place. Solution Let N be your point of reference (given angle). Side FU is opposite 28° and side FN is the hypotenuse. You now need to create an equation involving
the ratio opphyp
and the angle 28°.
opp sin 28hyp
FU sin 2810FU 10sin 28 multiply by LCDFU 4,7 units
= °
∴ = °
∴ = °∴ =
F
UN28°
10
.
3tan 603
° = 3sin 602 3
° =
cos (3 15 ) 0,5x − ° =

74
EXAMPLE 10 (Finding the length of a side) Consider the triangle sketched alongside. Calculate the length of ON correct to one decimal place. Solution Let O be your point of reference (given angle). You want side ON, which is adjacent to 57°. You have side NC, which is opposite to 57°.
You now need to create an equation involving the ratio oppadj
and the angle 57°:
opp tan 57adj
12,1 tan 57ON12,1 ON tan 57
12,1 ONtan 57ON 7,9cm
= °
∴ = °
∴ = °
∴ =°
∴ =
ˆAlternatively: C 33 (int s of )oppˆFrom C: tan 33adj
ON tan 3312,1ON 12,1tan 33ON 7,9cm
= ° ∠ Δ
= °
∴ = °
∴ = °∴ =
EXAMPLE 11 (Finding an angle) Calculate the size of θ correct to one decimal place in each case. (a) (b) Solutions (a) We have side PU, which is adjacent to θ. Side PN is the hypotenuse.
Now form an equation involving the ratio adjhyp
and angle θ:
adjcoshyp
10cos16
cos 0,625
θ =
∴ θ =
∴ θ =
51,3∴θ = °
C O
N
12,1 cm
57°
.
P U
N
10m
16m
θ
A
F
N
11,2cm13cm
θ

75
(b) We have side AF, which is adjacent to θ. Side FN is opposite θ.
Now form an equation involving the ratio oppadj
and angle θ:
opptanadj
11, 2tan13
tan 0,8615384615 (don't round off)
θ =
∴ θ =
∴ θ =
40,7∴θ = ° EXERCISE 5 (Round answers off to one decimal place in this exercise) (a) Calculate the length of PQ in PQRΔ . (b) (1) Calculate the length of AB. (2) Calculate the length of BC. (c) Calculate:
(1) the size of θ.
(2) the the length of AC.
(d) Calculate:
(1) the size of α .
(2) the size of θ.
(e) Calculate:
(1) the length of AC. (2) the length of AB.
P
Q R
42° 3
A
B
C
5,667°
67°
θ
α
θ

76
(f) In the diagram, BD AC⊥ . Using the information provided, calculate the length of AC.
(g) In ABCΔ , CD AB⊥ , A = θ , B 40= ° , AD 15 cm= and DB 16 cm= . Calculate the size of θ.
(h) Using the information provided on the given diagram, calculate the length of BC.
(i) In the given diagram, ABCΔ is right-angled at C.
It is given that ( )3 ˆAC 4 units, tan A and A 0 ; 902
= = ∈ ° ° .
(1) Determine the length of BC without solving for A . (2) Calculate the size of B . (3) Determine the length of AB. (j) In PQR, QS PR, QS units, PQ units, QR units.h m nΔ ⊥ = = = (1) Express sin P in terms of h and m. (2) Express sin R in terms of h and n. (3) Hence show that sin P sin Rm n= .
(4) Now use the result in (3) to calculate the size of P if it is given that ˆ40 cm, 30 cm and R 80m n= = = ° .
θ40°
48°42°
14°
36°20°

77
ANGLES OF ELEVATION AND DEPRESSION θ is the angle of elevation of F from N. β is the angle of depression of N from F. [Note that N = β since alt s∠ are equal] EXAMPLE 12 The angle of depression of a boat on the ocean from the top of a cliff is 55° . The boat is 70 metres from the foot of the cliff. (a) What is the angle of elevation of the top of the cliff from the boat? (b) Calculate the height of the cliff. Solutions (a) The angle of elevation of the top of the cliff from the boat is 55° , i.e. B 55= ° . (b) We can calculate the height of the cliff as follows:
tan 5570 m
h = °
(70 m) tan 55100 m
hh
∴ = °∴ =
θ
β
55°
h
70 m55°
B
T
C
55°

78
EXERCISE 6 (Round your answers off to one decimal place in this exercise)
(a) The Cape Town cable car takes tourists to the top of Table Mountain. The cable is 1,2 kilometers in length and makes an angle of 40° with the ground. Calculate the height (h) of the mountain.
(b) An architectural design of the front of a house is given below. The length of the house is to be 10 metres. An exterior stairway leading to the roof is to form an angle of elevation of 30° with ground level. The slanted part of the roof must be 7 metres in length.
(1) Calculate the height of the vertical wall (DE).
(2) Calculate the size of θ, the angle of elevation of the top of the roof (A) from the ceiling BCD.
(3) Calculate the length of the beam AC. (c) In a soccer World Cup, a player kicked the ball from a distance of 11 metres from the goalposts (4 metres high) in order to score a goal for his team. The shortest distance travelled by the ball is in a straight line. The angle formed by the pathway of the ball and the ground is represented by θ .
(1) Calculate the largest angle θ for which the player will possibly score a goal.
(2) Will the player score a goal if the angle θ is 22° ? Explain.
(d) Treasure hunters in a boat, at point A, detect a treasure chest at the bottom of the ocean (C) at an angle of depression of 13° from the boat to the treasure chest. They then sail for 80 metres so that they are directly above the treasure chest at point B. In order to determine the amount of oxygen they will need when diving for the treasure, they must first calculate the depth of the treasure (BC). Calculate the depth of the treasure for the treasure hunters.
40°
A
B C D
EF30° 10 m
θ
Front view of a house
roof
θ
13°

79
ANGLES IN THE CARTESIAN PLANE In this section, we will extend the trigonometric definitions to include angles in the interval [0 ; 360 ]° ° . Consider a circle with centre O(0 ; 0) and radius r with R( ; )x y any point on the circle. θ is the angle measured anti-clockwise from the positive side of the x-axis to the radius OR, which is referred to as the terminal arm and θ is said to be in standard position. Note that for every point R( ; )x y on the circumference of the circle, 2 2 2x y r+ = For each point R( ; )x y on the terminal arm of θ, the following trigonometric functions of θ are defined:
oppsin hypadjcoshypopptanadj
yrxryx
θ = =
θ = =
θ = =
The Cartesian plane is divided into four quadrants allowing for angles in the interval (0 ; 360 )° ° Angles in the first quadrant will lie in the interval (0 ; 90 )° ° Angles in the second quadrant will lie in the interval (90 ;180 )° ° Angles in the third quadrant will lie in the interval (180 ; 270 )° ° Angles in the fourth quadrant will lie in the interval (270 ; 360 )° °
90°
180°
270°
360°
0°
θ
R( ; )x y
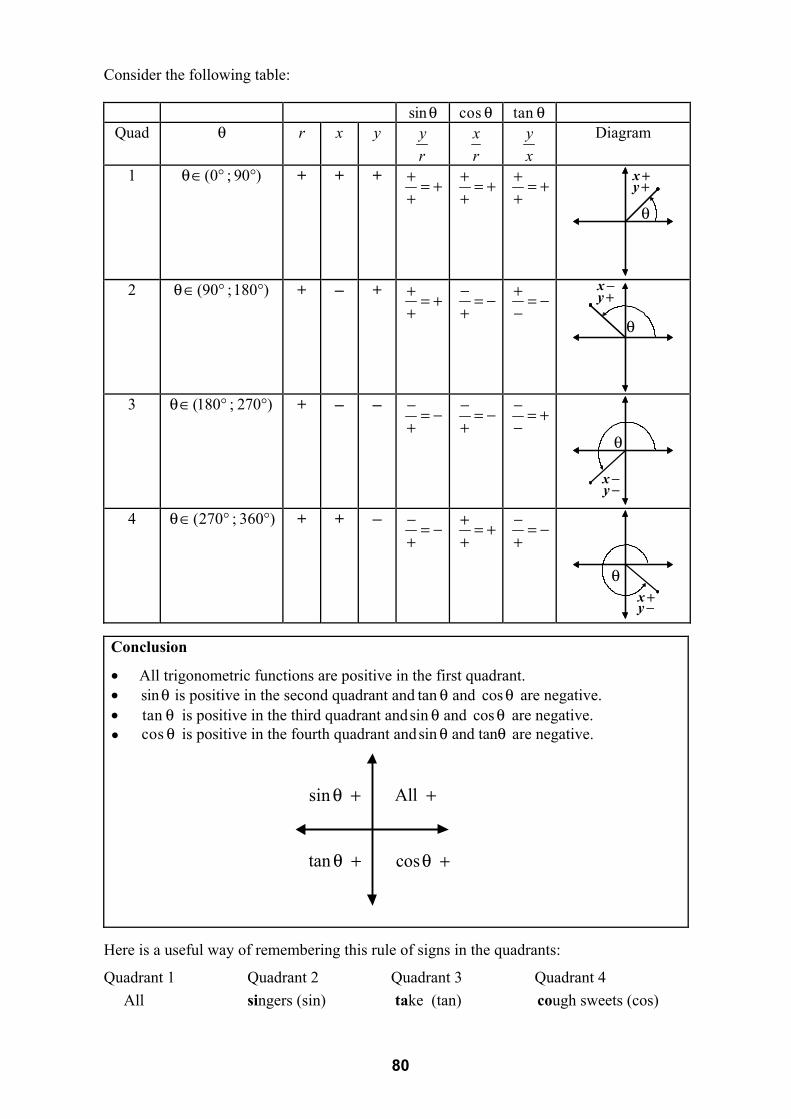
80
Consider the following table: sinθ cos θ tan θ Quad θ r x y y
r x
r y
x
Diagram
1 (0 ; 90 )θ∈ ° ° + + + + = ++
+ = ++
+ = ++
θ
y +x +
2 (90 ;180 )θ∈ ° ° + − + + = ++
− = −+
+ = −−
θ
y +x −
3 (180 ; 270 )θ∈ ° ° + − − − = −+
− = −+
− = +−
θ
y −x −
4 (270 ; 360 )θ∈ ° °
+ + − − = −+
+ = ++
− = −+
θ
y −x +
Conclusion
• All trigonometric functions are positive in the first quadrant. • sinθ is positive in the second quadrant and tan and cosθ θ are negative. • tan θ is positive in the third quadrant andsin and cosθ θ are negative. ● cos θ is positive in the fourth quadrant andsin and tanθ θ are negative.
Here is a useful way of remembering this rule of signs in the quadrants:
Quadrant 1 Quadrant 2 Quadrant 3 Quadrant 4
All singers (sin) take (tan) cough sweets (cos)
cosθ +
sin θ +
tan θ +
All +

81
θ
5(4 ; )y
4
y
435
xyr
===
EXERCISE 7 In which quadrant does the terminal arm of the angle θ lie if: (a) sin 0 and cos 0θ > θ > (b) sin 0 and cos 0θ < θ <
(c) tan 0 and cos 0θ > θ < (d) tan 0 and cos 0θ < θ <
(e) [ ]sin 0 and 90°;270°θ < θ∈ (f) cos 0 and 0° 180θ < < θ < ° EXAMPLE 13
If 4cos5
θ = and [ ]0 ;90θ∈ ° ° , calculate without the use of a calculator and with the aid of a
diagram the value of 2tan θ . Solution
( 3)( 3) 03
But is positive in Quadrant 13
y yy
yy
∴ + − =∴ = ±
∴ =
2 2
2 3 9tan4 16
yx
∴ θ = = =
EXAMPLE 14 If 13sin 5θ = − and [ ]90 ;270θ∈ ° ° calculate without the use of a calculator and with the aid of a diagram the value of cos sinθ + θ . Solution 13sin 5θ = −
5 5sin13 13
yr
−∴ θ = − = = (r is always positive)
sinθ is negative and therefore the terminal arm will lie in the third or fourth quadrant. But with [ ]90 ;270θ∈ ° ° , the terminal arm will lie in the third quadrant.
2
2
Quicker method to solve for :9 0
9
93
yy
y
yy
− =∴ =
∴ = ±∴ = ±
2 2 2
2 2 2
2
2
4cos5
and .......Pythagoras(4) (5)1
Giv
6 259 0
en : xr
x y ry
yy
θ = =
+ =∴ + =∴ + =∴ − =
θ
5−
x
( ; 5)x −
125
13
xyr
= −= −=

82
2 2 2
2 2 2
2
2
.......Pythagoras( 5) (13)25 169144 0
( 12)( 12) 012
But is negative in Quadrant 312
x y rxxxx x
xx
x
+ =∴ + − =∴ + =∴ − =∴ + − =∴ = ±
∴ = −
cos sin12 5
13 1317 41
13 13
θ + θ− − = +
−= = −
EXERCISE 8
(a) If 3sin and 0 905
θ = ° ≤ θ ≤ ° , determine by means of a diagram:
(1) 2cos θ (2) 2 tan θ
(b) If 5tan and sin 012
θ = θ > , determine by means of a diagram:
(1) 13cosθ (2) 2 2cos sinθ + θ (c) If 5cos A 3 0+ = and 180 A 360° < < ° , determine by means of a diagram:
(1) 2tan A (2) sin Acos A
(d) If [ ]8 tan 15 0 and 90 ; 270θ + = θ∈ ° ° , determine by means of a diagram: (1) sin cosθ + θ (2) 34sin 17cosθ − θ (e) If 13cos 5 0 and 180 360θ − = ° ≤ θ ≤ ° , determine by means of a diagram: (1) 2 2sin cosθ + θ (2) 225 tan θ
(f) If 4 tan B 3 0 and cos B 0− = < , determine by means of a diagram: (1) 2(sin B cos B)+ (2) 225(sin B cos B)−
(g) If 2sin 1 0θ + = and 90 270° < θ < ° calculate without the use of a calculator and with the aid of a diagram the value of the following: (1) 24 cos θ (2) 281tan θ
(h) In the diagram alongside 12tan and P( ; 18)5
bθ =
Determine the value of b without using a calculator.
(i) If tan a
bθ = where [ ]0 ; 90θ∈ ° ° , determine 2sin θ by means of a diagram.
P( ; 18)b
x
y
θ
2
2
Quicker method:144 0
144
14412
xx
xx
− =∴ =
∴ = ±∴ = ±

83
RECIPROCALS OF THE TRIGONOMETRIC RATIOS Note to the educator: According to CAPS, the reciprocals of the trigonometric ratios are to be taught and examined in Grade 10 only. Should you be pressurized for time, simply introduce the reciprocals and let the learners study this topic on their own for interest. The reciprocal of a number is a number which when multiplied by the original number gives an answer of 1. Here are some examples:
The number 6 has a reciprocal of 16
since 16 16
× =
The number 23
has a reciprocal of 32
since 2 3 13 2
× = We can define reciprocal funtions for the sine, cosine and tangent ratios.
The cosecant function (cosec )θ is the reciprocal of sin θ 1 hypcosec
sin oppθ = =
θ
The secant function secθ is the reciprocal of cosθ
1 hypseccos adj
θ = =θ
The cotangent function cot θ is the reciprocal of tan θ
1 adjcottan opp
θ = =θ
EXAMPLE 15 Consider the following:
(a) sin N and cosec Nn kk n
= =
(b) cos N and sec Nm kk m
= =
(c) tan N and cot Nn mm n
= =
EXAMPLE 16 (a) Evaluate the following without using a calculator: (1) cosec 45° (2) sec30 . tan 60° ° (b) Evaluate the following rounded off to two decimal places: (1) cot 26° (2) sec36 cot 63° + °

84
Solutions (a) (1) cosec 45° (2)
2 21
= =
(b) (1) cot 26° (2) sec36 cosec63° + °
1 2,05tan 26
= =°
1 1 2,36cos36 sin 63
= + =° °
EXAMPLE 17 Without using a calculator, solve the equation cosecθ 2= if θ is an acute angle. Solution cosecθ 2
2cosecθ1
=
∴ =
2 is the hypotenuse and 1 is opposite 45°
45x∴ = ° since hyp 2cosec45opp 1
° = =
Alternatively:
2cosecθ11sin θ2
=
∴ =
2 is the hypotenuse and 1 is opposite 45° .
45x∴ = ° since opp 1sin 45hyp 2
° = =
EXAMPLE 18 Solve the equation sec 1,5θ = rounded off to two decimal places if θ is an acute angle. Solution
1
secθ 1,51cosθ
1,52cosθ3
2θ cos 48,193
−
=
∴ =
∴ =
∴ = = °
sec30 . cot 602 1 2.
33 3
° °
= =
45°
2 45°

85
θ
α
EXERCISE 9 (a) Refer to the diagram alongside to answer the following questions.
State the following: (1) sec A (2) cot A (3) cosec A (4) cot C (5) cosec C (6) secC (b) Refer to the diagram alongside and then answer the questions below. State the following: (1) sin θ (2) cot θ (3) secθ (4) cosec α (5) tan α (6) cos α (c) Evaluate the following without using a calculator: (1) cosec 60° (2) sec60° (3) cot 45°
(4) cot 60° (5) 2sec 45° (6) 22cosec 45°
(7) cot 30 . tan 30° ° (8) cot 30 tan 30° + ° (9) (d) Evaluate the following rounded off to two decimal places: (1) cosec 43° (2) sec78° (3) cot 64°
(4) cosec94 sec35° + ° (5) 23cot 57° (6) 3( cosec 25 )° (e) Without using a calculator, solve the following equations if the angles are acute. (1) 3 cosec 2x = (2) sec 2x = (3) cot 3x = (f) Solve the following equations rounded off to two decimal places if the angles are acute. (1) cosec θ 1, 2= (2) 2sec 9x = (3) cot 2 2x =
cosec30 . cosec 45° °

86
TRIGONOMETRIC FUNCTIONS (It is advisable to first do Chapter 6 on Functions before doing this topic) THE GRAPHS OF THE BASIC SINE AND COSINE FUNCTIONS In this section, we will discuss the graphs of the basic functions sin θy = and cosθy = and then introduce the functions siny a q= θ + and cosy a q= θ + . Consider sin θy = The following table contains specific values of θ and the corresponding y-values. For example, if 30θ = ° , then sin 30 0,5y = ° = .
θ 0° 30° 45° 60° 90° 120° 135° 150° 180° sin θy = 0 0,5 0,7 0,9 1 0,9 0,7 0,5 0
θ 210° 225° 240° 270° 300° 315° 330° 360° sin θy = 0,5− 0,7− 0,9− 1− 0,9− 0,7− 0,5− 0
We can represent the values of θ on the horizontal axis and the values of y on the vertical axis and then draw the graph of sin θy = . The graph of sin θy = has the following characteristics: (a) The maximum value is 1 and the minimum value is 1− . (b) The range is [ 1;1]y ∈ −
(c) The amplitude of a graph is defined to be 12
[distance between max and min value].
For the graph of sin θy = , the amplitude is 1 [1 ( 1)] 12
− − =
° ° ° ° ° ° ° ° ° °
y
° ° θ

87
(d) If we increase the values of θ , the graph of sin θy = will repeat its basic shape over 360° intervals. Let’s draw the graph for the interval [0 ; 720 ]θ∈ ° ° . Please note that we are dealing with angles that are greater than 360° . These types of angles will be explained in more detail in Grade 11.
We say that the period of the graph of sin θy = is 360° . The graph of sin θy = is therefore cyclical in nature and repeats its basic shape every 360° . Consider cosθy = The following table contains specific values of θ and the corresponding y-values.
θ cosθy = 1 0,9 0,7 0,5 0 0,5− 0,7− 0,9− 1−
θ cosθy = 0,9− 0,7− 0,5− 0 0,5 0,7 0,9 1
We can represent the values of θ on the horizontal axis and the values of y on the vertical axis and then draw the graph of cosθy = .
0° 30° 45° 60° 90° 120° 135° 150° 180°
210° 225° 240° 270° 300° 315° 330° 360°
y
° ° ° ° ° ° ° ° ° °° ° ° ° ° ° ° ° ° ° ° °° ° θ
30 60 90 120 150 180 210 240 270 300 330 360
−1,2−1
−0,8−0,6−0,4−0,2
0,20,40,60,8
11,2
° ° ° ° ° ° ° ° ° °° ° θ
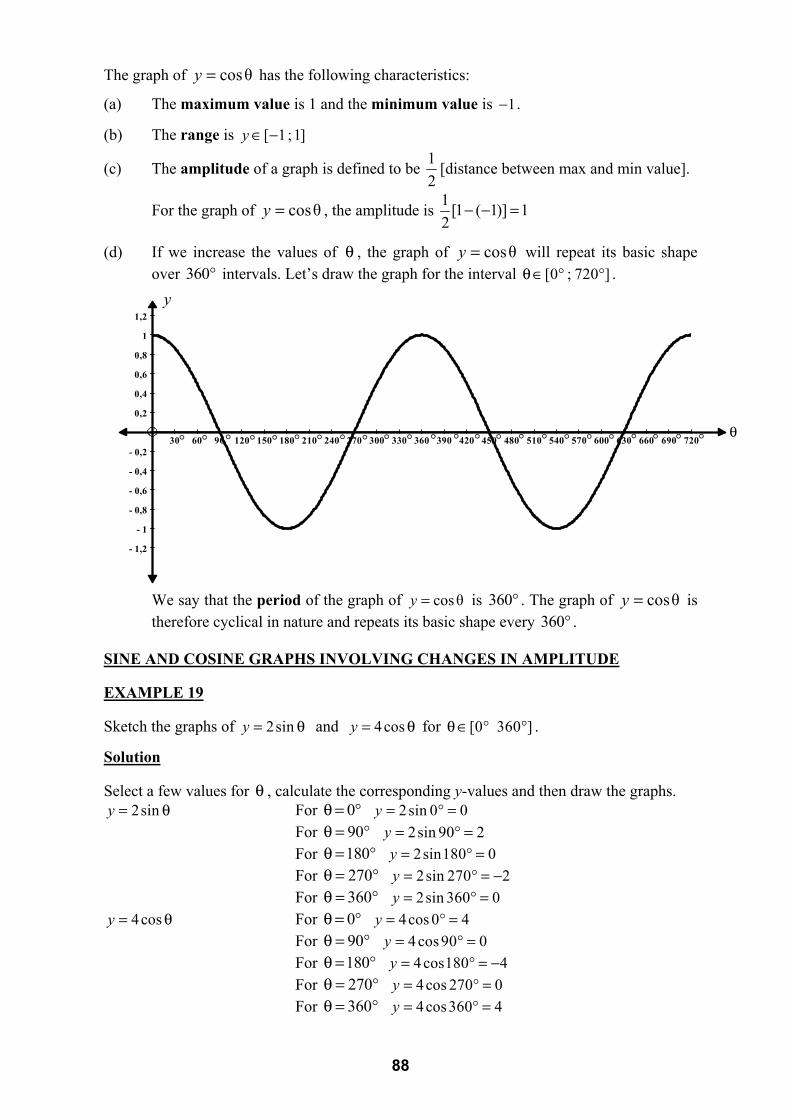
88
The graph of cosθy = has the following characteristics:
(a) The maximum value is 1 and the minimum value is 1− . (b) The range is [ 1 ;1]y ∈ −
(c) The amplitude of a graph is defined to be 12
[distance between max and min value].
For the graph of cosθy = , the amplitude is 1 [1 ( 1)] 12
− − =
(d) If we increase the values of θ , the graph of cosθy = will repeat its basic shape over 360° intervals. Let’s draw the graph for the interval [0 ; 720 ]θ∈ ° ° .
We say that the period of the graph of cosθy = is 360° . The graph of cosθy = is therefore cyclical in nature and repeats its basic shape every 360° . SINE AND COSINE GRAPHS INVOLVING CHANGES IN AMPLITUDE EXAMPLE 19 Sketch the graphs of 2siny = θ and 4cosy = θ for [0 360 ]θ ∈ ° ° .
Solution Select a few values for θ , calculate the corresponding y-values and then draw the graphs.
2siny = θ For 0θ = ° 2sin 0 0y = ° = For 90θ = ° 2sin 90 2y = ° = For 180θ = ° 2sin180 0y = ° = For 270θ = ° 2sin 270 2y = ° = − For 360θ = ° 2sin 360 0y = ° =
4cosy = θ For 0θ = ° 4cos 0 4y = ° = For 90θ = ° 4 cos90 0y = ° = For 180θ = ° 4 cos180 4y = ° = − For 270θ = ° 4cos 270 0y = ° = For 360θ = ° 4cos360 4y = ° =
30 60 90 120 150 180 210 240 270 300 330 360 390 420 450 480 510 540 570 600 630 660 690 720
- 1,2
- 1
- 0,8
- 0,6
- 0,4
- 0,2
0,2
0,4
0,6
0,8
1
1,2y
° ° ° ° ° ° ° ° ° °° ° θ° ° ° ° ° ° ° ° ° °° °

89
Notice that the graph of 2siny = θ is a vertical stretch of the basic graph siny = θ by a factor of 2.
The maximum value is 2 and the minimum value is 2− and the range is [ 2 ; 2]y ∈ − .
The amplitude of the graph of 2siny = θ is 1 [2 ( 2)] 22
− − = and the period is 360° .
This vertical stretch of the graph of siny = θ is called an amplitude shift.
The number 2 in the equation 2siny = θ tells us what the amplitude of the graph is. Notice that the graph of 4cosy = θ is a vertical stretch of the basic graph cosy = θ by a factor of 4.
The maximum value is 4 and the minimum value is 4− and the range is [ 4 ; 4]y ∈ − .
The amplitude of the graph of 2siny = θ is 1 [2 ( 2)] 22
− − = and the period is 360° .
This vertical stretch of the graph of cosy = θ is called an amplitude shift.
The number 4 in the equation 4cosy = θ tells us what the amplitude of the graph is.
90 180 270 360
- 3
- 2
- 1
1
2
° ° °
y
°
siny = θ
2siny = θ
3
θ
° ° °
y
°
cosy = θ
4cosy = θ
θ

90
EXAMPLE 20 Sketch the graph of 3siny = − θ for the interval [0 360 ]θ ∈ ° ° . Solution As with the graphs of other functions (See Chapter 6), the negative sign indicates a reflection in the horizontal axis. All you need to do is first draw the basic graph of sin θy = , stretch this graph vertically by a factor of 3 and then reflect this graph in the horizontal axis to obtain the graph of
3sin θy = − . Note:
The amplitude of the graph of 3siny = − θ is: 1 [3 ( 3)] 32
− − = .
Therefore, in the equation 3siny = − θ , the number 3 tells us that the amplitude is 3 and the
negative sign indicates a reflection in the horizontal axis. EXERCISE 10 (a) Given: 3siny = θ and 2siny = − θ (1) Sketch the graphs on the same set of axes for [0 ; 360 ]θ∈ ° ° . (2) Write down the maximum and minimum values for each graph. (3) Write down the range, amplitude and period for each graph. (b) Given: 2 cosy = θ and 3cosy = − θ (1) Sketch the graphs on the same set of axes for [0 ; 360 ]θ∈ ° ° . (2) Write down the maximum and minimum values for each graph. (3) Write down the range, amplitude and period for each graph.
(c) Given: 1 cos2
y = θ and siny = − θ
(1) Sketch the graphs on the same set of axes for [0 ; 360 ]θ∈ ° ° . (2) Write down the maximum and minimum values for each graph. (3) Write down the range, amplitude and period for each graph.
90 180 270 360
- 4
- 3
- 2
- 1
1
2
3
4
° ° °
y
°
siny = θ
3siny = θ
3siny = − θ
4
θ

91
SINE AND COSINE GRAPHS INVOLVING VERTICAL SHIFTS EXAMPLE 21 Sketch the graph of sin 1y = θ + and cos 1y = − θ − for [0 360 ]θ ∈ ° ° . Solution The graph of sin 1y = θ + is the graph of siny = θ shifted 1 unit up. The graph is shown below.
The maximum value is 2 and the minimum value is 0. The range is [0 ; 2]y ∈ .
The amplitude is 1 [2 0] 12
− = and the period is 360° .
The graph of cos 1y = − θ − is the graph of cosy = θ reflected in the x-axis and then shifted 1 unit down. The graph is shown below.
The maximum value is 0 and the minimum value is 2− . The range is [ 2 ; 0]y ∈ − .
The amplitude is 1 [0 ( 2)] 12
− − = and the period is 360° .
90 180 270 360
- 2
- 1
1
2
3
° ° °
y
°
siny = θ
sin 1y = θ +
θ
90 180 270 360
- 3
- 2
- 1
1
° ° °
y
°
cosy = θ
cos 1y = − θ −
cosy = − θ
2
θ

92
EXERCISE 11
(a) Given: sin 2y = θ + and cos 1y = θ − (1) Sketch the graphs on the same set of axes for [0 ; 360 ]θ∈ ° ° . (2) Write down the maximum and minimum values for each graph. (3) Write down the range, amplitude and period for each graph. (b) Given: cos 3y = − θ + and sin 2y = − θ − (1) Sketch the graphs on the same set of axes for [0 ; 360 ]θ∈ ° ° . (2) Write down the maximum and minimum values for each graph. (3) Write down the range, amplitude and period for each graph.
(c) Given: 2sin 4y = θ + and 3cos 1y = − θ − (1) Sketch the graphs on the same set of axes for [0 ; 270 ]θ∈ ° ° . (2) Write down the maximum and minimum values for each graph. (3) Write down the range, amplitude and period for each graph. THE GRAPH OF THE TANGENT FUNCTION Consider tany = θ The following table contains specific values of θ and the corresponding y-values.
θ 0° 30° 45° 60° 89° 90° 91° 120° 135° 150° 180°tan θ 0 0,6 1 1,7 57,2 error 57, 2− 1,7− 1− 0,6− 0
θ 210° 225° 240° 269° 270° 271° 300° 315° 330° 360°
tan θ 0,6 1 1,7 57,2 error error 1,7− 1− 0,6− 0 We can represent the values of θ on the horizontal axis and the values of y on the vertical axis and then draw the graph of tany = θ . The graph of tany = θ has the following characteristics:
(a) The graph has no maximum value, no minimum value and hence no amplitude.
(b) The range is ( ; )y ∈ −∞ ∞
4 3 8 2 7 1 6
y
45° 90° 135° 180° 225° 270° 315° 360°1−
2−
3−
4−
1
2
34
tany = θ 90θ = ° 270θ = °
(45 ;1)°.. .
.(135 ; 1)° −
(225 ;1)°
(315 ; 1)° −
θ

93
(c) The points (45 ;1)° , (135 ; 1)° − , (225 ;1)° and (315 ; 1)° − may be referred to as the critical points on the basic graph tany = θ . The points are useful when sketching tan graphs involving vertical stretches, reflections in the x-axis and vertical shifts.
(d) As the values of θ approach 90° from the left, the values of y tend towards +∞ . At 90° , the y-value is undefined. This means that the curve moves upwards and never cuts or touches the line 90θ = ° . As the values of θ approach 90° from the right, the values of y tend towards −∞ . The curve moves downwards and never cuts or touches the line 90θ = ° .
An asymptote is a vertical line that a graph approaches but never touches. Therefore, the line 90x = ° is an asymptote of the graph of tany = θ .
All of this applies to 270° . The line 270θ = ° is therefore also an asymptote.
(e) If we start at 90− ° and then increase the values of θ , it is possible to get an idea of how the graph of tanθy = repeats its basic shape over 180° intervals. Let’s draw the graph for the interval ( 90 ; 810 )θ∈ − ° ° . Please note that we are dealing with angles that are negative. These types of angles will be explained in more detail in Grade 11. We say that the period of the graph of tany = θ is 180° . The graph of tany = θ is therefore cyclical in nature and repeats its basic shape every 180° . The graph cuts the horizontal axis at 0 .180kθ = °+ ° where k represents integer values. In other words, every 180° starting from 0° in a negative and positive ` direction. For example, the graph cuts the horizontal axis at:
0 (1).180 180 0 (2).180 3600 (3).180 540 0 (4).180 720
θ = ° + ° = ° θ = ° + ° = °θ = ° + ° = ° θ = ° + ° = °
There are asymptotes at 90 .180kθ = °+ ° where k represents integer values. For example, the graph has asymptotes at:
90 ( 1).180 90 90 (0).180 9090 (1).180 270 90 (2).180 450
θ = ° + − ° = − ° θ = ° + ° = °θ = ° + ° = ° θ = ° + ° = °
4 4 0 3 8 2 7 1 6 0 5 9 4 8 7 2 6
5
2
1
1
2
3
4
5
y
90°1
2
3
4−
1
23
4
90θ = ° 270θ = ° 450θ = ° 630θ = ° 810θ = °
180°270°
360°450°
540°630°
720°810°90− ° θ

94
EXAMPLE 22 Sketch the graph of 2 tany = − θ for the interval [0 ; 270 )θ∈ ° ° . Solution First draw the graph of 2 tany = θ by vertically stretching the graph of tany = θ by a factor of 2. The y-values of the critical points of tany = θ are multiplied by 2 to form the following new points on the graph of 2 tany = θ : (45 ; 2)° , (135 ; 2)° − , (225 ; 2)° The graph of 2 tany = − θ is then formed by reflecting 2 tany = θ in the x-axis. The signs of the y-values of the critical points of 2 tany = θ now become: (45 ; 2)° − , (135 ; 2)° , (225 ; 2)° − The asymptotes of this graph remain the same as well as the x-intercepts. Now plot the critical points, x-intercepts and asymptotes for 2 tany = − θ and restrict the graph in the interval [0 ; 270 )θ∈ ° ° . The graph is shown below. The period of 2 tany = − θ is 180° and the asymptotes are 90θ = ° and 270θ = ° . EXERCISE 12 (a) Sketch the graph of tany = − θ for the interval [0 ; 360 ]θ∈ ° °
(b) Sketch the graph of 3 tany = θ for the interval [0 ; 360 ]θ∈ ° °
(c) Sketch the graph of 12 tany = − θ for the interval [0 ; 270 ]θ∈ ° °
(d) Sketch the graph of tan 1y = θ + for the interval [0 ; 360 ]θ∈ ° °
(e) Sketch the graph of tan 2y = θ − for the interval [90 ; 360 ]θ∈ ° °
(f) Sketch the graph of 2 tan 1y = − θ − for the interval [0 ; 360 ]θ∈ ° °
(g) Given: 2 tany = θ and 3sin 3y = − θ − (1) Sketch the graphs on the same set of axes for [0 ; 270 ]θ∈ ° ° . (2) Write down the period for each graph.
y
45° 90° 135° 180° 225° 270°
(45 ; 2)° .
.
.
(135 ; 2)° −
(225 ; 2)°
270θ = °90θ = °
1
2
3
1−
2−
3−
tany = θ
2tany = θ
2tany = − θ
45
4−
5−
θ

95
Summary of the trigonometric functions For graphs of the form siny a x q= + and cosy a x q= + : The value of a (ignoring negative signs) represents the vertical stretch of the graph as well as the amplitude. If a is negative, then there is a reflection in the x-axis. The value of q represents a vertical shift of the graph siny x= or cosy x= up or down. The period of these graphs is 360° . For graphs of the form tany a x q= + : The value of a (ignoring negative signs) represents a vertical stretch of the graph tany x= from the x-axis. The critical points for tany a x= are (45 ; )a° , (135 ; )a° − , (225 ; )a° and (315 ; )a° − If a is negative, then there is a reflection in the x-axis. The value of q represents a vertical shift of the graph tany x= up or down. The equations of the asymptotes are 90 .180x k= ° + ° where k represents integer values. The x-intercepts are at the points (0 .180 ; 0)k° + ° where k represents integer values. The period of these graphs is 180° .
FINDING THE EQUATION OF A GIVEN TRIGONOMETRIC GRAPH EXAMPLE 23 In the diagram below, the graphs of ( ) siny f x a x q= = + and ( ) cosy g x m x n= = + are shown for the domain [0 ; 360 ]x ∈ ° ° .
Note: The variable x in the equations may also be used to represent the angles.
(a) Write down the amplitude and range of f.
(b) Write down the amplitude and range of g.
(c) Determine the values of a and q.
(d) Determine the values of m and n. Solutions
(a) For f : Amplitude: 2 Range: [ 1 ; 3]y ∈ −
(b) For g: Amplitude: 1 Range: [ 3 ; 1]y ∈ − −
y
x90° 180° 360°270°
(270 ; 3)°
1
2
3
1−
2−
3−
.
.(90 ; 1)° −
.(360 ;1)°
.(360 ; 1)° −
.(180 ; 3)° −
f
g

96
(c) Substitute two points on the graph into the equation siny a x q= + and solve simultaneously. (90 ; 1)° − : 1 sin 90a q− = ° + (270 ; 3)° : 3 sin 270a q= ° + 1 (1)a q∴− = + 3 ( 1)a q∴ = − + 1 a q∴− = + 3 a q∴ = − +
1a q+ = − (A) 3a q− + = (B) 2 2q∴ = (A) + (B)
11 1
2
qaa
∴ =∴ + = −∴ = −
Here is a quicker method: Use the following formulae to determine the positive value of a and the value of q in the equations of siny a x q= + or cosy a x q= + :
1 [max min]2
a = − 1 [max min]2
q = +
1 [3 ( 1)] 22
a = − − = (this is the amplitude)
The given sine graph involves a reflection in the x-axis. 2a∴ = −
1 [3 ( 1)] 12
q = + − = Notice the transformations of siny x= into 2sin 1y x= − + (d) Substitute two points on the graph into the equation cosy m x n= + and solve simultaneously: (180 ; 3)° − : 3 cos180m n− = ° + (360 ; 1)° − : 1 cos360m n− = ° + 3 ( 1)m n∴− = − + 1 (1)m n∴− = + 3 m n∴− = − + 1 m n∴− = +
y
x90° 180° 360°270°
1
2
3
1−
2−
3−
siny x=
2siny x=
2siny x= −
2sin 1y x= − +

97
3m n− + = − (A) 1m n+ = − (B) 2 4n∴ = − (A) + (B)
2
( 2) 11
nmm
∴ = −∴ + − = −∴ =
Alternatively:
1 [max min]2
a = − 1 [max min]2
q = +
1 [ 1 ( 3)] 12
a = − − − =
1 [ 1 ( 3)] 22
q = − + − = − Notice the transformations of cosy x= into cos 2y x= − EXERCISE 13 (a) In the diagram below, the graphs of ( ) cosy f x a x q= = + and ( ) siny g x m x n= = + are shown for the domain [0 ; 360 ]x ∈ ° ° .
(1) Write down the amplitude and range of f.
(2) Write down the amplitude and range of g.
(3) Determine the values of a and q.
(4) Determine the values of m and n.
y
x90° 180° 360°270°
1
1−
2−
3−
cosy x=
cos 2y x= −
y
x90° 360°270°
1
2
1−
2−
cosy a x q= +
siny m x n= +
.(90 ; 2)° −
.(360 ; 2)°
.(180 ; 0)°

98
(b) In the diagram below, the graphs of ( ) siny f x a x q= = + and ( ) cosy g x m x n= = + are shown for the domain [0 ; 360 ]x ∈ ° ° .
(1) Write down the range, amplitude and period of f.
(2) Write down the range, amplitude and period of g.
(3) Determine the values of a and q
(4) Determine the values of m and n. (c) In the diagram below, the graphs of two trigonometric functions are shown.
(1) Determine the equations of the two graphs.
(2) Write down the range, amplitude and period of each graph, where possible. The following exercise includes graph interpretation and the graphical interpretation of inequalities dealt with in Chapter 6.
y
x90° 360°270°
1
2
1−
2− .(90 ; 3)° −
180°
(360 ; 2)° −
.3(180 ; 3)°
.(360 ; 1)° −
3− f
g
y
x90°45° 270°
12
1−2−
(45 ;2)°
180°
.(180 ; 4)°
3
3−
4
4−
135°
(135 ; 2)° −
225°

99
EXERCISE 14 (a) The diagram below represents the graphs of ( ) 2cosf x x= and ( ) cosg x x= − for the interval [0 ; 360 ]x ∈ ° ° . (1) Determine the lengths of OA and OB. (2) Determine the length of CD. (3) Determine the length of EF if OE 315= ° . (4) Determine graphically the values of [0 ; 360 ]x ∈ ° ° for which: (i) ( ) 0f x = (ii) ( ) 0g x = (iii) ( ) 2f x = (iv) ( ) 1g x = − (v) ( ) 0f x < (vi) ( ) 0g x ≤ (vii) ( ) ( )f x g x≥ (viiii) ( ) ( )g x f x> (5) Calculate the value of x for which ( ) 1f x = in the interval [0 ; 90 ]x ∈ ° ° . (6) For which values of x is the graph of ( ) 2cosf x x= increasing? (7) For which values of x is the graph of ( ) cosg x x= − decreasing? (8) For which values of k will the graph of cosy x k= − + not cut the x-axis? (9) For which values of t will the graph of 2cosy x t= + touch the x-axis in one point only?
(b) Sketch the graphs of ( ) tan and ( ) tan 2y f x x y g x x= = − = = + for [ ]0 ;270x ∈ ° ° on the same set of axes and then answer the questions that follow.
(1) Calculate (45 ) (45 )f g° − ° (2) For which values of x is ( ) ( )g x f x= ? (3) For which values of x is ( ) ( )g x f x≥ ? (4) For which values of x ( ) ( ) 2g x f x− = ?
(c) Sketch the graphs of ( ) sin and ( ) cos 1y f x x y g x x= = = = + for [ ]0 ; 360x ∈ ° ° on the same set of axes and then answer the questions that follow.
(1) For which values of x is ( ) ( )f x g x= ? (2) For which values of x is ( ) ( )g x f x≥ ? (3) For which values of x is ( ) 0f x ≤ ? (4) For which values of x is ( ) 0g x > ? (5) For which values of x is ( ) ( ) 2g x f x− = ? (6) For which values of x is ( ) . ( ) 0f x g x ≥ ?
y
x
f
g
A
B
C
D
E
F

100
42°
CONSOLIDATION AND EXTENSION EXERCISE (a) If A 38,6 and B 141, 4= ° = ° , determine of the following to two decimal places:
(1) 1cos 2A sin B2
−
(2) 22 tan B (3) sec A
(4) 2cosec A cot 3B+ (b) Calculate θ in each case where 0 90° ≤ θ ≤ ° (rounded off to two decimal places): (1) sin 2 0, 4θ = (2) 2sin 0, 4θ = (3)
(4) sin 0,42θ = (5) 5cosec
2θ =
(c) Calculate θ in each case where (0 ;90 )θ∈ ° °
(1) tan 3 2θ = (2) 3 tan 2θ = (3) 4cos 1 0θ − =
(4) tan( 13 ) 6,52
θ − ° = (5) sec 2θ = (6) 3cot 1θ =
(d) If A 25,34= ° and B 134,66= ° , determine the following to two decimal places:
(1) sin 2A2
(2) 2cos (A B)+ (3) 2tan A 2cosB3
−
(e) Calculate the following without the use of a calculator:
(1) 2sin 45 cos60° − ° (2) tan 30 . tan 60 cos30 .sin 60° ° − ° °
(3) tan45(sin30 ) °° (4) tan 45 . sin 60tan 30 (1 sin 30 )
° °° − °
(5) cosec30° (6) cot 60 . sin 60° °
(f) Without using a calculator, solve the following equations for (0 ;90 )θ∈ ° ° :
(1) sin θ 0,5= (2) tan 1θ = (3) 2cos 3 0θ − =
(4) 3 tan 1θ = (5) 2cos 2θ = (6) 2sin 3θ =
(7) cosecθ 2= (8) 3 cot 1θ = (g) Two right-angled triangles, GHKΔ and PQRΔ are given.
Calculate, rounded off to two decimal places:
(1) the length of PQ and PR
(2) the value of K
sin 0,42
θ =

101
38°63°
67°75°
θ
(h) Calculate the value of x in each case. (1) (2)
(3) (4)
(i) In the accompanying figure AB represents a lamp
pole with height 25 m. Two cables from the top of the pole, are anchored at points C and D. From A, the angles of depression of C and D in the same horizontal line as B are 75° and 67° .
Calculate the distance (CD) between the two anchor points.
(j) In the diagram below, PQRΔ is right-angled at Q.
It is given that 15PR 34 cm, tan P8
= = and
P (0 ; 90 )∈ ° ° .
(1) Determine the length of QR without solving for P . (2) Determine the length of QR by first solving for P .
(k) In EAYΔ , ES YA⊥ , 5tan12
θ = and ES 7,5 cm=
(1) Calculate the lengths of EA and YA without solving θ.
(2) Calculate the length of YS by first solving θ.

102
θ 5m
2x
x
θ
P(1 ; 3)
θx
y
(l) A handy man attempts to reach the roof of a hall with a ladder 5 metres in length. Unfortunately, the ladder is too short and a new ladder will be required. Suppose that the length of the ladder needed to reach the top has to be double the distance from the foot of the ladder to the wall. Also, the angle between his current ladder and the ground will need to be equal to the angle between the two ladders.
(1) Calculate the value of θ (2) Hence, or otherwise, determine what the length of the ladder should be to get
the handy man to the roof.
(m) On the Cartesian Plane below O is the origin. Q lies on the x-axis and P is the point (1 ; 3)
(1) Calculate θ (2) Determine the length of OQ. (n) A rectangular slab is placed against a wall as shown in the diagram. It has a length of 3 m and a width of 1 m. It is inclined at an angle of 27° to the ground. Calculate the distance (h) of the slab’s highest point above the ground.
27°

103
1−2− 1 21−
2
1
2−
( 1;1)−
(0 ; 0)
(1;1)
y x=
CHAPTER 6 FUNCTIONS In this chapter, you will revise the graphs of linear functions (straight lines). Then you will explore the graphs of quadratic functions (parabolas), hyperbolic functions (hyperbolas) and exponential functions (exponential graphs). LINEAR FUNCTIONS (SKETCHING STRAIGHT LINE GRAPHS) Consider the graph of y x= We can select a few input values (x-values) and hence determine the corresponding output values (y-values). These values will be represented in a table.
x 1− 0 1 y 1− 0 1
The graph of this line is obtained by plotting the points on the Cartesian plane and drawing a solid line through the points. This graph is referred to as the “mother” graph of straight lines and based on this graph, we can generate different types of straight lines depending on the value of a and q in the general equation of a line, which is y ax q= + . Investigation of the effect of the value of a In Grade 9, you learnt about the gradient and steepness of a straight line. Let’s briefly summarise these concepts. The gradient of a line represents the ratio of the change of the y-values with respect to the x-values. In other words, gradient tells us the direction (or slope) of the line. We will revise the concept of gradient later on in this chapter. However, the focus now will be on the steepness of a line, which is the way that the line slants upwards or downwards from left to right. We will compare the steepness of different lines to the mother graph and show how the mother graph is transformed by changing the value of a (the coefficient of x).

104
Let’s investigate this by comparing the graphs of the following straight lines:
A: y x= B: 12
y x= C: 2y x= D: 3y x=
Lines A, B, C and D pass through the origin since for all of the given graphs, the y-value is 0 if 0x = . To sketch the graphs of these lines, select one x-value and then determine the corresponding y-value. For all four graphs, choose 1x = . A: (1) 1y = = Line A passes through the points (0 ;0) and (1;1)
B: 1 1(1)2 2
y = = Line B passes through the points (0 ;0) and 11;2
C: 2(1) 2y = = Line C passes through the points (0 ;0) and (1; 2)
D: 3(1) 3y = = Line D passes through the points (0 ;0) and (1; 3) We will now plot the points and then draw the lines on the same set of axes. Notice that line A (the mother graph) is closer to the y-axis than line B. We say that line A is steeper than line B. The coefficient of x in the equation of line A is greater than the coefficient of x in line B ( 1
21 > ). Line C is steeper line A ( 2 1> ) and line D is steeper than line C (3 2> ). Line D is the steepest of all the lines.
1−2− 1 2
1−
2
1
2−
12(1; )(0 ; 0)
(1;1)
1y x=3
3
3−
3−
2y x=
12
y x=(1; 2)
3y x=
(1; 3)

105
1−2− 1 21−
2
1
2−
(1; 1)−
(0 ; 0)( 1;1)−
y x= −
Let’s now consider what happens if the value of the coefficient of x is negative. (a) Consider the graph of y x= −
We can select a few input values (x-values) and hence determine the corresponding
output values (y-values). These values will be represented in a table.
x 1− 0 1 y 1 0 1−
The graph of this line is obtained by plotting the points on the Cartesian plane and
drawing a solid line through the points.
If you now compare the mother graph 1y x= to the graph of 1y x= − , it is interesting
to note that the graph of y x= − is the reflection of the mother graph in the x-axis. The
negative sign therefore causes a reflection in the x-axis.
(b) Consider the graph of 12
y x= −
We already know that the number 12
affects the steepness of the line. The mother
graph y x= transforms into a line that is not as steep as the mother graph line.
As already seen, the negative sign causes a reflection in the x-axis.
To draw this graph involves transforming the mother graph into the less steep line
12
y x= and then reflecting this newly-formed graph about the x-axis.
To sketch the graph of this line, select one x-value, determine the corresponding y-
value, plot the point formed and the y-intercept (0 ;0)
Choose 1x =
1 1(1)2 2
y = − = −

106
The line passes through the point 12(1; )−
Now plot this point and the y-intercept and draw the graph of the line.
Notice that the mother graph y x= is transformed into 12
y x= and then this new line
is reflected in the x-axis to form the graph of the line 12
y x= − .
Conclusion:
The value of a in the equation y ax q= + (ignoring negative signs), determines the steepness of the line (closeness to the y-axis). The larger the value of a, the steeper the line.
A negative sign will cause a reflection in the x-axis. Investigation of the effect of the value of q (a) Consider the graphs of the following: 3y x= + and 2y x= −
For 3y x= + : If 0x = then 0 3 3y = + = If 1x = then 1 3 4y = + = The line passes through the points (0 ; 3) and (1; 4) For 2y x= − : If 0x = then 0 2 2y = − = − If 1x = then 1 2 1y = − = − The line passes through the points (0 ; 2)− and (1; 1)−
1−2− 1 2
1−
2
1
2−
12(1; )
(1;1)
1y x=
33−
12
y x=
12
y x= −
12(1; )−

107
1−2− 1 21−
2
1
2−
( 1;1)−
(0 ; 0)(1;1)
y x=3
3−
3y x= +
2y x= −
(1; 4)
(1; 1)−
4
(0 ; 3)
(0 ; 2)−
1−2− 1 21−
2
1
2−
y x= − 3
3−
1y x= − +
2y x= − −
3−
y x=
It should be clear to you from the graphs that 3y x= + is the mother graph y x= shifted 3 units up and 2y x= − is the mother graph y x= shifted 2 units down. Also, the y-intercept of 3y x= + is 3 and the y-intercept of 2y x= − is 2− . (b) Consider the graphs of the following: 1y x= − + and 2y x= − −
We will first draw the graph of y x= − which is the reflection of the mother graph y x= in the x-axis and then based on this graph, we will form 1y x= − + by shifting y x= − one unit up and 2y x= − − by shifting y x= − two units down. It should be clear to you from the graphs that 1y x= − + is the line y x= − shifted 1 unit up and 2y x= − − is the line y x= − shifted 2 units down. Also, the y-intercept of 1y x= − + is 1 and the y-intercept of 2y x= − − is 2− .

108
1−2− 1 21−
2
1
2−
(0 ; 0)
(0 ; 4)
3
2 4y x= − +
4
(1; 2)
(1; 2)−
2y x=2y x= −
Conclusion:
The value of q in the equation y ax q= + determines the shift of the graph of y ax= up or down. It also represents the y-intercept of the graph of y ax q= + . EXAMPLE 1 Draw a neat sketch graph of 2 4y x= − + Solution First draw the graph of 2y x= , reflect this graph in the x-axis to form 2y x= − and then shift
2y x= − four units up to form 2 4y x= − + .
The line 2y x= cuts the y-axis at 0. Now choose 1x =
2(1) 2y∴ = = Plot the point (1; 2) and draw the line 2y x= Now reflect 2y x= in the x-axis to form
2y x= − . The point (1; 2) transforms into
the point (1; 2)− .
Then shift 2y x= − four units up. Draw the graph of 2 4y x= − + .
Alternatively, you can make use of the dual-intercept method that you studied in Grade 9.
This method involves determining the intercepts with the axes algebraically. Let’s use this
method for the line 2 4y x= − +
y-intercept: Let 0x = x-intercept: Let 0y = 2(0) 4 4y = − + = 0 2 4x= − +
2 42
xx
∴ =∴ =
The coordinates of the y-intercept are (0 ; 4) and the coordinates of the x-intercept are (2 ; 0).
You would now plot these points and draw the straight line.
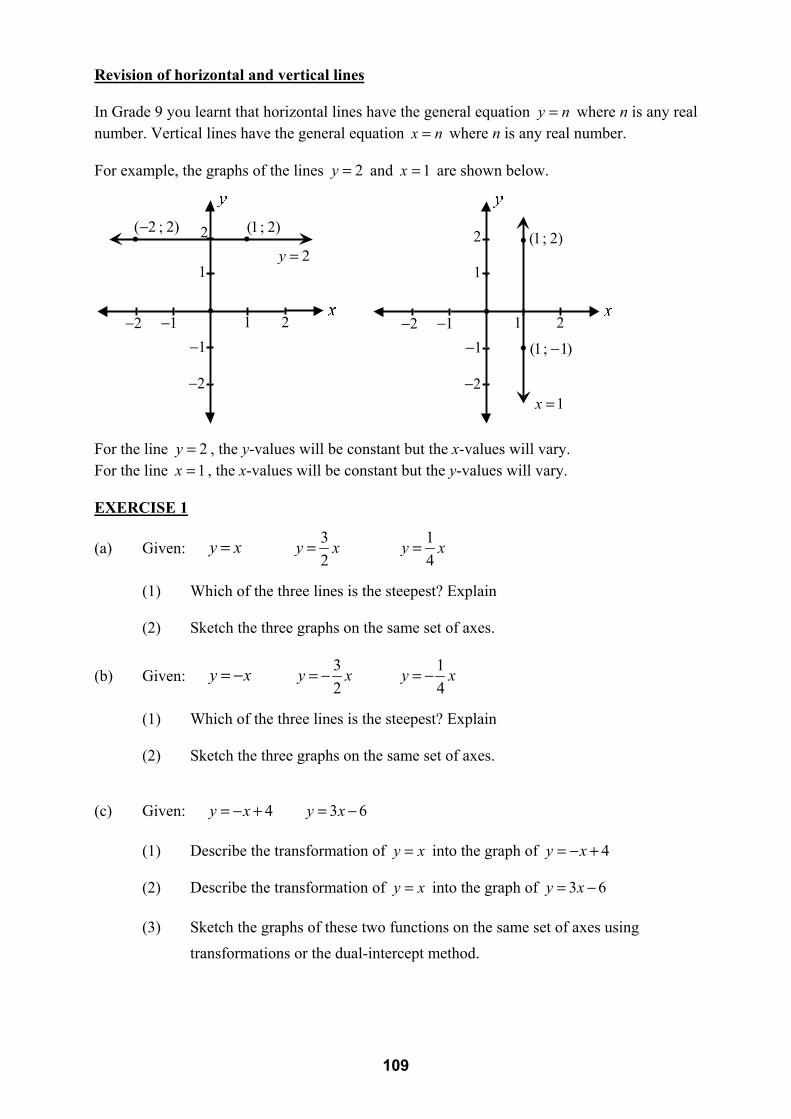
109
1−2− 1 21−
2
1
2−
( 2 ; 2)− (1; 2)
2y =
1−2− 1 21−
2
1
2−
(1; 1)−
(1; 2)
1x =
Revision of horizontal and vertical lines In Grade 9 you learnt that horizontal lines have the general equation y n= where n is any real number. Vertical lines have the general equation x n= where n is any real number. For example, the graphs of the lines 2y = and 1x = are shown below. For the line 2y = , the y-values will be constant but the x-values will vary. For the line 1x = , the x-values will be constant but the y-values will vary. EXERCISE 1
(a) Given: y x= 32
y x= 14
y x= (1) Which of the three lines is the steepest? Explain (2) Sketch the three graphs on the same set of axes.
(b) Given: y x= − 32
y x= − 14
y x= − (1) Which of the three lines is the steepest? Explain (2) Sketch the three graphs on the same set of axes. (c) Given: 4y x= − + 3 6y x= − (1) Describe the transformation of y x= into the graph of 4y x= − + (2) Describe the transformation of y x= into the graph of 3 6y x= − (3) Sketch the graphs of these two functions on the same set of axes using
transformations or the dual-intercept method.

110
1−2− 1 21−
2
1
3
2y x=
(1;1)
4
( 1;1)−
(2 ; 4)( 2 ; 4)−
0
(d) Match the equations on the left to the graphs on the right. (1) 2y x= −
(2) 1 24
y x= +
(3) 2y x= − −
(4) 4y x=
(5) 14
y x=
(6) 4y x= − (7) 4x =
(8) 4y = QUADRATIC FUNCTIONS (SKETCHING PARABOLAS) Consider the graph of 2y x= We can select a few input values (x-values) and hence determine the corresponding output
values (y-values). These values will be represented in a table.
x 2− 1− 0 1 2 y 4 1 0 1 4
The graph of 2y x= is obtained by plotting the points on the Cartesian plane and drawing a
curve through the points.
Notice that: ● all output values are positive ● the graph is not linear but rather a curve referred to as the graph of a parabola
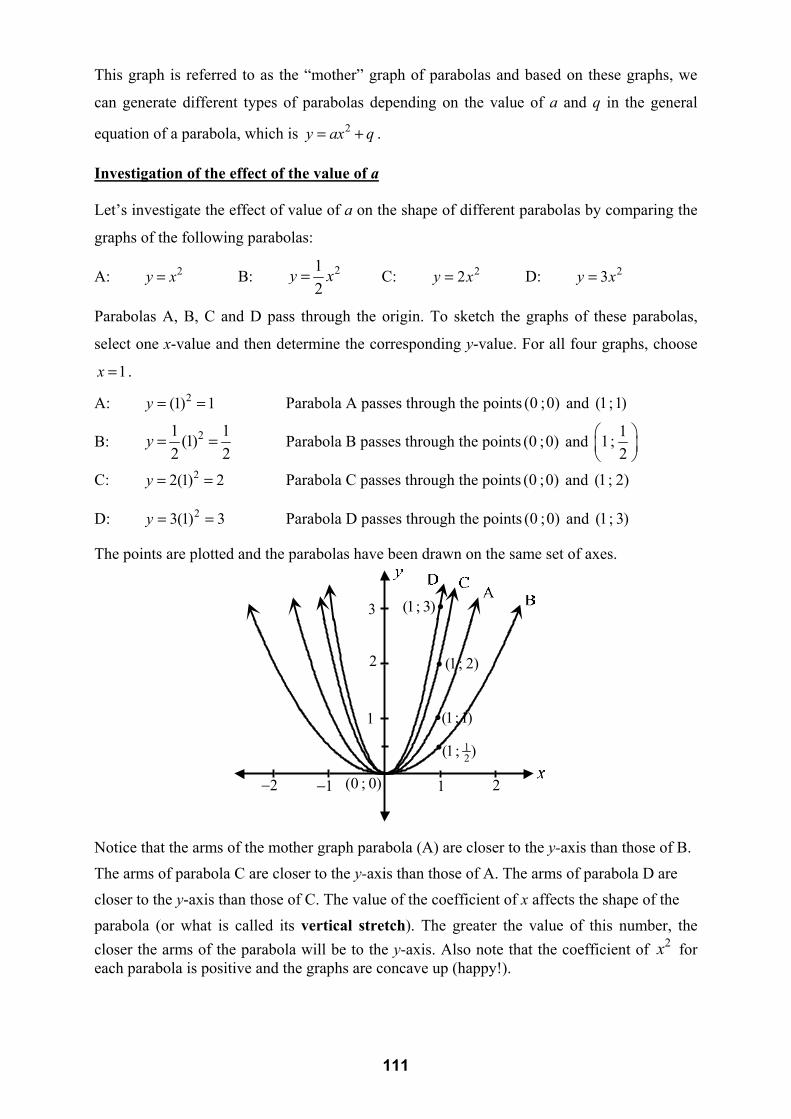
111
1−2− 1 2
2
1
12(1; )
(0 ; 0)
(1;1)
3
(1; 2)
(1; 3)
This graph is referred to as the “mother” graph of parabolas and based on these graphs, we
can generate different types of parabolas depending on the value of a and q in the general
equation of a parabola, which is 2y ax q= + .
Investigation of the effect of the value of a Let’s investigate the effect of value of a on the shape of different parabolas by comparing the
graphs of the following parabolas:
A: 2y x= B: 212
y x= C: 22y x= D: 23y x=
Parabolas A, B, C and D pass through the origin. To sketch the graphs of these parabolas,
select one x-value and then determine the corresponding y-value. For all four graphs, choose
1x = .
A: 2(1) 1y = = Parabola A passes through the points (0 ;0) and (1;1)
B: 21 1(1)2 2
y = = Parabola B passes through the points (0 ;0) and 11;2
C: 22(1) 2y = = Parabola C passes through the points (0 ;0) and (1; 2)
D: 23(1) 3y = = Parabola D passes through the points (0 ;0) and (1; 3) The points are plotted and the parabolas have been drawn on the same set of axes. Notice that the arms of the mother graph parabola (A) are closer to the y-axis than those of B.
The arms of parabola C are closer to the y-axis than those of A. The arms of parabola D are
closer to the y-axis than those of C. The value of the coefficient of x affects the shape of the
parabola (or what is called its vertical stretch). The greater the value of this number, the closer the arms of the parabola will be to the y-axis. Also note that the coefficient of 2x for each parabola is positive and the graphs are concave up (happy!).

112
Let’s now consider what happens if the value of the coefficient of x is negative.
(a) Consider the graph of 2y x= −
We can select a few input values (x-values) and hence determine the corresponding
output values (y-values). These values will be represented in a table.
x 2− 1− 0 1 2 y 4− 1− 0 1− 4−
The graph of 2y x= − is obtained by plotting the points on the Cartesian plane and
drawing a curve through the points.
If you now compare the mother graph 21y x= to the graph of 21y x= − , it is interesting to note that the graph of 2y x= − is the reflection of the mother graph in the x-axis.
The negative sign therefore causes a reflection in the x-axis.
(b) Consider the graph of 212
y x= −
We already know that the number 12
affects the shape of the curve. The mother graph
2y x= transforms into a parabola with arms that arms that are less close to the y-axis.
To sketch the graph of this parabola, select one x-value, determine the corresponding
y-value, plot the point forms and the y-intercept (0 ; 0) .
Choose 1x =
21 1(1)2 2
y∴ = − = −
1−2− 1 2
1
2y x= −
(1; 1)−( 1; 1)− −
(2 ; 4)−( 2 ; 4)− −
1−
2−
3−
4−
0
2
3
42y x=

113
The parabola passes through the point 11;2
−
Now plot this point and the y-intercept and draw the graph of the parabola.
Notice that the mother graph 2y x= transformed into 212
y x= and then this graph was
reflected in the x-axis to form the graph of the parabola 212
y x= −
Conclusion:
The value of a in the equation 2y ax q= + (ignoring negative signs), determines the closeness of the arms of the parabola to the y-axis. The larger the value of a , the closer the
arms are to the y-axis. A negative sign will cause a reflection in the x-axis. If 0a > , then the parabola is concave up (happy face!) If 0a < , then the parabola is concave down (sad face!) The value of a is sometimes referred to as the vertical stretch factor
1−2− 1 2
2−
1−
3−
(1;1)1
2
12(1; )
2y x=21
2y x=
212
y x= −
12(1; )−

114
1−2− 1 2
1−
2
1
3
2 1y x= −
(1;1)
4
(0 ; 1)−
0(1; 0)( 1; 0)−
5
2 2y x= +
(1; 3)
Investigation of the effect of the value of q Consider the following graphs: A: 2 1y x= − B: 2 2y x= + We will first draw the mother graph 2y x= and then based on this graph, we will draw parabola A and B. The graph of A is the graph of 2y x= shifted 1 unit down. The graph of B is the graph of 2y x= shifted 2 units up.
Conclusion:
The value of q in the equation 2y ax q= + determines the shift of the graph of 2y ax= up or down. It also represents the y-intercept of the graph of 2y ax q= + . EXAMPLE 2 Given: 22 8y x= − + and 22 2y x= − −
(a) Sketch the graphs of 22 8y x= − + and 22 2y x= − − on the same set of axes. (b) For these graphs, determine algebraically the coordinates of the intercepts with the axes. Solutions (a) Reflect the graph of 22y x= in the x-axis to form 22y x= − and then shift 22y x= − eight units up to form 22 8y x= − + . Then shift the graph of 22y x= − two units down to form 22 2y x= − − .

115
2−4− 2 42−
4
2
6
22 8y x= − +8
4−
6−
8−22 2y x= − −
(1; 2)−
22y x= −
For 22y x= − , choose 1x = 22(1) 2y∴ = − = − 22y x= − passes through the origin (0 ; 0) and the point (1; 2)− (b) Consider the graph 22 8y x= − + :
y-intercept: Let 0x = x-intercept: Let 0y = 22(0) 8 8y∴ = − + = 20 2 8x∴ = − + (0 ; 8) 22 8 0x∴ − =
2 4 0( 2)( 2) 0
2 or 2( 2 ; 0) (2 ; 0)
xx x
x x
∴ − =∴ + − =∴ = − =
−
Consider the graph 22 2y x= − − :
y-intercept: Let 0x = x-intercept: 22(0) 2 2y∴ = − − = − The graph doesn’t cut the x-axis (0 ; 2)− There are no x-intercepts Also notice that the equation 20 2 2x= − − has no real solutions:
2
2
2
0 2 2
2 2
1
x
x
x
= − −
∴ = −
∴ = −
1x∴ = ± − which is non-real

116
EXERCISE 2 (a) Given: 2y x= 23y x= 24y x= (1) Which parabola has arms that are closest to the y-axis? (2) Sketch the graphs of these parabolas on the same set of axes. (3) Are the parabolas concave up or down? Explain
(b) Given: 2y x= − 212
y x= − 214
y x= −
(1) Which parabola has arms that are closest to the y-axis? (2) Sketch the graphs of these parabolas on the same set of axes. (3) Are the parabolas concave up or down? Explain
(c) Given: 214
y x= 232
y x= 24y x= −
(1) Which parabola has arms that are closest to the y-axis? (2) Sketch the graphs of these parabolas on the same set of axes. (3) Are the parabolas concave up or down? Explain (d) Given: 2 4y x= − and 2 3y x= + (1) Sketch the graphs of 2 4y x= − and 2 1y x= + on the same set of axes. (2) For these graphs, determine algebraically the coordinates of the intercepts with the axes. (e) Given: 24 4y x= − + and 2 2y x= − − (1) Sketch the graphs of 24 4y x= − + and 2 2y x= − − on the same set of axes. (2) For these graphs, determine algebraically the coordinates of the intercepts with the axes.
(f) Given: 21 82
y x= − +
(1) Sketch the graph of 21 82
y x= − + (2) Determine algebraically the coordinates of the intercepts of this parabola with the axes.

117
(g) Match the equations on the left to the graphs on the right.
(1) 214
y x=
(2) 213
y x= −
(3) 215
y x= −
(4) 2 152
y x= − −
(5) 2 1y x= −
(6) 22y x= HYPERBOLIC FUNCTIONS (SKETCHING HYPERBOLAS)
Consider the graph of 1yx
= We can select a few input values (x-values) and hence determine the corresponding output values (y-values). These values will be represented in a table.
x 2− 1− 1
2− 0 12 1 2
y 12− 1− 2− 1
0 2 1 12
Notice from the table that if 0x = then 10
y = which is undefined.
Since the y-value is undefined at 0x = , this means that the graph has no y-intercept. For the graph to have an x-intercept we let 0y = and solve for x.
10x
∴ =
There is no value of x which satisfies this equation. Hence the graph has no x-intercept.
The graph of 1yx
= is obtained by plotting the points on the Cartesian plane and drawing a
curve through the points. From the above discussion, it should be clear that the graph has no
intercepts with the axes. The graph gets closer and closer to the axes but never actually cuts them.

118
An asymptote is a horizontal or vertical line that a graph approaches but never touches. The vertical line 0x = (lying on the y-axis) is called the vertical asymptote of the graph. The horizontal line 0y = (lying on the x-axis) is called the horizontal asymptote of the
graph.
This graph is referred to as the “mother” graph of hyperbolas and based on this graph, we can
generate different types of hyperbolas depending on the value of a and q in the general
equation of a hyperbola, which is ay qx
= + .
Investigation of the effect of the value of a Let’s investigate the effect of value of a on the shape of different hyperbolas by comparing
the graphs of the following hyperbolas:
A: 1yx
= B: 2yx
= C: 4yx
= The graph of A is the mother graph. In order to sketch the graph of B and C, we can select a
few input values (x-values) and hence determine the corresponding output values (y-values)
for each graph.
1 2 31−2−3−
1
2
3
1−
2−
3−
0
0x =
0y =
(1;1)
12( ; 2)
12(2 ; )
( 1; 1)− −12( 2 ; )− −
12( ; 2)− −
1yx
=

119
For B: 2yx
=
x 2− 1− 1 2 y 1− 2− 2 1
For C: 4yx
=
x 4− 1− 1 4 y 1− 4− 4 1
Let’s now plot the points and draw the graphs of A, B and C. Notice that as the number in the numerator (a) gets larger, the branches of the hyperbolas
are stretched vertically away from the x-axis. The branches of the graph of 4yx
= are
stretched further away from the x-axis when compared to the graph of 2yx
= .
1 2 31−2−3−
1
2
3
1−
2−
3−
0
(2 ;1)
2yx
=(1; 4)4
(1; 2)
(4 ;1)
4−
4yx
=
( 2 ; 1)− −
( 1; 2)− −
( 4 ; 1)− −
1yx
=
( 1; 4)− −
4− 4

120
Let’s now consider what happens if the value of the number in the numerator is negative.
Consider the graph of 1yx
−=
As with lines and parabolas, the negative sign indicates a reflection in the x-axis.
As with the mother graph 1yx
= , the graph of 1yx
−= gets closer and closer to the axes but
never actually cuts them. The vertical line 0x = (lying on the y-axis) is the vertical asymptote of the graph. The horizontal line (lying on the x-axis) is the horizontal asymptote of the graph.
Conclusion:
The value of a in the equation ay qx
= + (ignoring negative signs), determines the vertical
stretch of the branches of the hyperbola from the x-axis. The larger the value of a , the
further the stretch away from the axes. A negative sign will cause a reflection in the x-axis.
1 2 31−2−3−
1
2
3
1−
2−
3−
0
0x =
0y =
( 1;1)−
12( ; 2)−
12( 2 ; )−
(1; 1)−
12(2 ; )−
12( ; 2)−
1yx
−=

121
Investigation of the effect of the value of q
Consider the following graph: 2 1yx
= +
The branches of the mother graph 1yx
= stretch vertically to form the graph of 2yx
= and
then the newly-formed graph is shifted 1 unit up to form the graph of 2 1yx
= + .
Let’s draw the graph of 2yx
= and then shift it up 1 unit and see what effect this shifting has.
For 2x = − 2 12
y = = −−
( 2 ; 1)− − lies on 2yx
=
For 1x = − 2 21
y = = −−
( 1; 2)− − lies on 2yx
=
For 1x = 2 21
y = = (1; 2) lies on 2yx
=
For 2x = 2 12
y = = (2 ;1) lies on 2yx
=
Notice that the graph of 2 1yx
= + cuts the x-axis at ( 2 ; 0)− .
The horizontal asymptote shifts 1 unit up and has the equation 1y = .
The constant in the equation 2 1yx
= + therefore represents the horizontal asymptote.
The vertical asymptote is still the line 0x = (lying on the x-axis).
1 2 31−2−3−
1
2
3
1−
2−
3−
0
(2 ;1) 2yx
=
(1; 2)
( 2 ; 1)− −
( 1; 2)− −
4− 4
(1; 3)
(2 ; 2)
1y =
2 1yx
= +
( 2 ; 0)−
( 1; 1)− −

122
Conclusion:
The value of q in the equation ay qx
= + determines the shift of the graph of ayx
= up or
down. It also represents the horizontal asymptote of the graph of ay qx
= + .
EXAMPLE 3
Given: 3 1yx
= − − [Note: 3x
− is the same as 3x
− ]
(a) Determine algebraically the coordinates of the x-intercept for this graph.
(b) Describe the different transformations of 3yx
= to 3 1yx
= − − .
(c) Sketch the graph of 3 1yx
= − − on a set of axes, clearly showing the asymptotes and
x-intercept. Solutions (a) Let 0y =
30 1
0 33
( 3 ; 0)
xx
x
−= −
∴ = − −∴ = −
−
(b) 3 1yx
= − − is the graph of 3yx
= reflected in the x-axis and then shifted 1 unit down.
3yx
= (Start with 3yx
= )
3yx
−= (Reflect 3yx
= in the x-axis)
3 1yx
−= − (Shift 3yx
−= one unit down)

123
(c) First draw the horizontal asymptote 1y = − on a set of axes.
Then plot the x-intercept ( 3 ; 0)−
After this, select one negative x-value and one positive x-value. Find the
corresponding y-values by substituting these x-values into 3 1yx
= − −
For 1x = − 3 1 3 1 21
y −= − = − =−
( 1; 2)− lies on one branch
For 1x = 3 1 3 1 41
y −= − = − − = − (1; 4)− lies on the other branch
We already know the shape from (b) and we can now draw the graph as follows:
1 2 31−2−3−
1
2
3
1−
2−
3−
0
4
( 1; 2)−
4−
( 3 ; 0)−4− 4
(1; 4)−
3 1yx
= − −
1y = −

124
EXERCISE 3
(a) Given: 1yx
= and 5yx
=
(1) Which graph has branches that have the furthest stretch away from the x-axis? Explain. (2) Sketch the graphs on the same set of axes.
(3) Now sketch the graph of 5yx
= − on the same set of axes.
(b) Given: 2 2yx
= +
(1) Write down the equations of the vertical and horizontal asymptotes. (2) Determine the coordinates of the x-intercept. (3) Sketch the graph on a set of axes.
(c) Given: 4 1yx
= − −
(1) Write down the equations of the vertical and horizontal asymptotes. (2) Determine the coordinates of the x-intercept. (3) Sketch the graph on a set of axes.
(d) Sketch the graph of 3 2yx
= + on a set of axes. Indicate the coordinates of the
x-intercept as well as the asymptotes. (e) Match the equations on the left to the graphs on the right.
(1) 2yx
=
(2) 4yx
=
(3) 3yx
= −
(4) 3 1yx
= − +

125
EXPONENTIAL FUNCTIONS (SKETCHING EXPONENTIAL GRAPHS)
Consider 2xy = and 12
xy =
A set of x-values { }1; 0 ;1− has been selected and the corresponding y-values have been calculated in each case. The graphs are shown on the right.
2xy =
x 1− 0 1
y 12
1 2
The x-intercept is calculated by letting 0y = : 0 2x=
But there are no real values of x for which 2 0x = and therefore there is no x-intercept. You might like to check this by substituting a few negative and positive values of x as well as 0 into the equation. The graph will therefore not cut the x-axis. In fact, the graph has a horizontal asymptote lying on the x-axis with equation 0y = . The y-axis is not a vertical asymptote.
12
xy =
x 1− 0 1
y 2 1 12
The x-intercept is calculated by letting 0y = :
102
x =
But there are no real values of x for which
1 02
x =
and therefore there is no x-intercept.
You might like to check this by substituting a few negative and positive values of x as well as 0 into the equation. The graph will therefore not cut the x-axis. In fact, the graph has a horizontal asymptote lying on the x-axis with equation 0y = . The y-axis is not a vertical asymptote.
1− 1
1−
(1; 2)
1
2
2xy =
(0 ;1)12( 1; )− 1
2
1− 1
1−
( 1; 2)−
1
2
12
x
y =
(0 ;1)12(1; )1
2

126
The graphs of 2xy = and 12
xy =
are called the “mother graphs” of the exponential
functions and based on these graphs, we can generate different types of exponential graphs,
depending on the value of a, b and q in the general equation of an exponential function, which
is . xy a b q= + where 0 1b< < or 1b > . These restrictions on b will be explained later in the
chapter.
Investigation of the effect of the value of b Let’s investigate the effect of b on the shape of different exponential graphs by comparing the
following graphs.
(a) We will first consider graphs where 1b > .
A: 2xy = B: 3xy = C: 4xy =
For all of these graphs, the y-intercept is (0 ;1) since 0 1b =
Select one other x-value and determine the corresponding y-value.
For A: Choose 1x = 12 2y = = (1; 2) lies on the graph of A
For B: Choose 1x = 13 3y = = (1; 3) lies on the graph of B
For C: Choose 1x = 14 4y = = (1; 4) lies on the graph of C
The graphs are sketched below:
Notice that if 1b > , all of the exponential graphs move upwards as the x-values
increase. Also as the value of b increases in value, the steeper the graph becomes.
C is steeper than B since 4 3> and B is steeper than A since 3 2> .
1 21−
1
2
3
0
4
(1; 2)
2−
(1 3)
(1; 4)
2x
y =3x
y =4x
y =

127
(b) Now let’s discuss exponential graphs where 0 1b< < .
Consider the following graphs:
D: 12
x
y =
E: 13
x
y =
F: 14
x
y =
For all of these graphs, the y-intercept is (0 ;1) since 0 1b =
Select one other x-value and determine the corresponding y-value. We will choose
negative x-values to avoid fractions.
For D: Choose 1x = − 11 2
2y
− = =
( 1; 2)− lies on the graph of D
For E: Choose 1x = − 11 3
3y
− = =
( 1; 3)− lies on the graph of E
For F: Choose 1x = − 11 4
4y
− = =
( 1; 4)− lies on the graph of F
The graphs are sketched below:
Notice that if 0 1b< < , all of the exponential graphs move downwards as the x-values
increase. Notice that as the value of the base b decreases in value, the steeper the
graph becomes. F is steeper than E since 1 14 3< and E is steeper than D since 1 1
3 2< .
The value of b therefore affects the shape of the exponential graph.
1 21−
1
2
3
0
4
( 1; 2)−
2−
( 1 3)−
( 1; 4)−
12( ) x
y = 13( ) x
y =1
4( ) x
y =

128
Investigation of the effect of the value of a Consider the following exponential graphs:
G: 2xy = H: 2.2xy = I: 3.2xy = J: 12.2
x
y =
We will calculate the y-intercept and one other point for each graph.
For G: y-intercept Let 0x = 02 1y = = (0 ;1) Select 1x = 12 2y = = (1; 2)
For H: y-intercept Let 0x = 02.2 2y = = (0 ; 2) Select 1x = 12.2 4y = = (1; 4)
For I: y-intercept Let 0x = 03.2 3y = = (0 ; 3) Select 1x = 13.2 6y = = (1; 6)
For J: y-intercept Let 0x = 012. 2
2y = =
(0 ; 2)
Select 1x = 112. 1
2y = =
(1;1)
The graphs have been drawn below on the same set of axes.
Notice that the value of a causes a vertical stretch of the mother graphs.
Also note that except for graphs H and J, the graphs have different y-intercepts.
1 21−
1
2
3
0
4
(1; 2)
2−
(1; 6)
(1; 4)
5
6
(1;1)

129
As with lines, parabolas and hyperbolas, the negative sign indicates a reflection in the x-axis.
The graphs of 2xy = − and 12
x
y = −
are reflections of the two mother graphs in the x-axis.
Investigation of the effect of the value of q
As with other graphs discussed thus far, the graph of . xy a b q= + is the graph of . xy a b= shifted up or down by q units.
For example, 2 1xy = + is the graph of 2xy = shifted 1 unit up. The horizontal asymptote is indicated by the constant in the equation 2 1xy = + . The equation of the asymptote is 1y = .
1−
(1; 2)−
1
2−
2xy = −
(0 ; 1)−12( 1; )− −
12−
2xy =
12
x
y = −
( 1; 2)− −
12
x
y =
(0 ;1)
Note: In the expression 2x− , the value of b is 2 and not 2− . Remember that 2 (2)x x− = − and
2 ( 2)x x− ≠ − for all values of x (not true for even values of x). For example, if 2x = , then:
22 4− = − and 2( 2) 4− = 2 22 ( 2)∴− ≠ −
1 21−
1
2
3
0
4
(1; 2)
2−
(1 ; 3)
1y =
2xy =
2 1xy = +
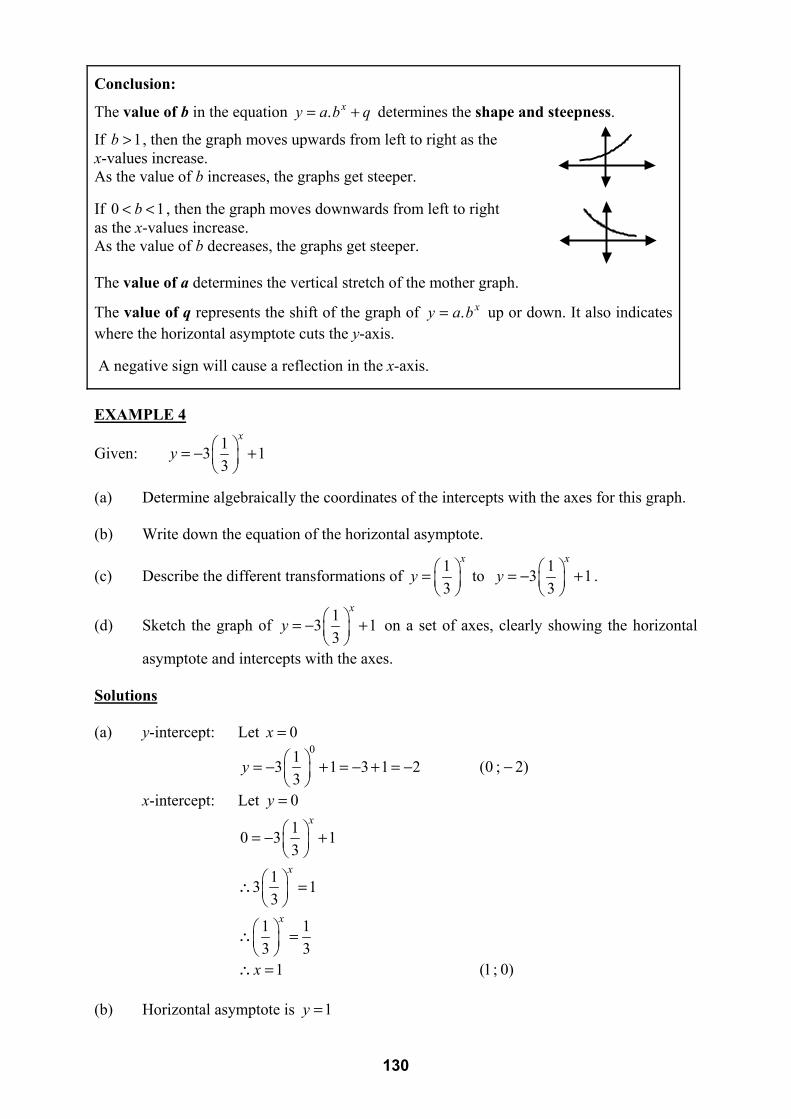
130
Conclusion:
The value of b in the equation . xy a b q= + determines the shape and steepness.
If 1b > , then the graph moves upwards from left to right as the x-values increase. As the value of b increases, the graphs get steeper.
If 0 1b< < , then the graph moves downwards from left to right as the x-values increase. As the value of b decreases, the graphs get steeper. The value of a determines the vertical stretch of the mother graph.
The value of q represents the shift of the graph of . xy a b= up or down. It also indicates where the horizontal asymptote cuts the y-axis. A negative sign will cause a reflection in the x-axis. EXAMPLE 4
Given: 13 13
x
y = − +
(a) Determine algebraically the coordinates of the intercepts with the axes for this graph. (b) Write down the equation of the horizontal asymptote.
(c) Describe the different transformations of 13
x
y =
to 13 13
x
y = − +
.
(d) Sketch the graph of 13 13
x
y = − +
on a set of axes, clearly showing the horizontal
asymptote and intercepts with the axes. Solutions (a) y-intercept: Let 0x =
013 1 3 1 2
3y = − + = − + = −
(0 ; 2)−
x-intercept: Let 0y =
10 3 13
x = − +
13 13
x ∴ =
1 13 3
x ∴ =
1x∴ = (1; 0) (b) Horizontal asymptote is 1y =

131
(c) 13
x
y =
undergoes a vertical stretch to form the
graph of 133
x
y =
with a y-intercept of 3.
133
x
y =
is then reflected in the x-axis to form
133
x
y = −
with a y-intercept of 3− .
133
x
y = −
is then shifted 1 unit up to form the graph
of 13 13
x
y = − +
with a y-intercept of 2− , x-intercept
of 1 and a horizontal asymptote 1y = .
(d) First draw the horizontal asymptote.
Then determine the intercepts with the
axes (if they exist).
If there is no x-intercept, select one
negative x-value and one positive
x-value and determine the corresponding
y-values. Plot these points and draw
the graph.
Check the shape by considering the
transformations of the graph from the
mother graph.
EXERCISE 4
(a) Given: 2xy = 4xy = 6xy =
(1) Which graph is the steepest? Explain. (2) Write down the equation of the horizontal asymptote for the three graphs. (3) Sketch the graphs on the same set of axes.
(b) (a) Given: 12
x
y =
14
x
y =
16
x
y =
(1) Which graph is the steepest? Explain. (2) Write down the equation of the horizontal asymptote for the three graphs. (3) Sketch the graphs on the same set of axes.
3
3−
2−
1y =
1
1− 1
2−
1y =
13 13
x
y = − +
(1; 0)
(0 ; 2)−
1

132
(c) Given: 2.2xy = 4.2xy = 132
x
y =
(1) Determine the coordinates of the y-intercept for each graph. (2) Write down the equation of the horizontal asymptote for all three graphs. (3) Sketch the graphs on the same set of axes indicating the y-intercept and one other point.
(d) Given: 12
x
y = −
132
x
y = −
(1) Determine the coordinates of the y-intercept for each graph. (2) Write down the equation of the horizontal asymptote for both graphs. (3) Sketch the graphs on the same set of axes indicating the y-intercept and one other point.
(4) Explain the transformations of 12
x
y =
into the graph of 132
x
y = −
(e) Given: 2 2xy = − 2 1xy = +
(1) Determine the intercepts of 2 2xy = − with the axes. (2) Write down the equation of the horizontal asymptote of 2 2xy = − . (3) Sketch the graph of 2 2xy = − on a set of axes. (4) Explain the transformation of 2xy = into the graph of 2 2xy = − (5) Sketch the graph of 2 1xy = + on the same set of axes. (6) Explain algebraically why the graph of 2 1xy = + does not cut the x-axis.
(f) Given: 1 44
x
y = −
(1) Determine the intercepts of this graph with the axes. (2) Write down the equation of the horizontal asymptote (3) Sketch the graph on a set of axes.
(4) Explain the transformation of 14
x
y =
into the graph of 1 44
x
y = −

133
(g) On different axes, draw neat sketch graphs of the following exponential graphs. Indicate the coordinates of intercepts with the axes as well as the horizontal asymptotes.
(1) 2.4 2xy = − (2) 2.4 2xy = +
(3) 12 24
x
y = −
(4) 12 24
x
y = +
(h) Match the equations on the left to the graphs on the right. (1) 4xy = (2) 2xy =
(3) 12
x
y =
(4) 12
x
y = −
(5) 13
x
y =
(6) 1 42
x
y = −
(7) 142
x
y =
For interest Here is a short explanation as to why we restrict the base b to 0 1b< < or 1b > for
exponential graphs. The values 0b = , 1b = and all negative values of b are excluded.
If 0b = , then 0 0xy = = which is a horizontal line and not an exponential graph.
If 1b = , then 1 1xy = = which is a horizontal line and not an exponential graph.
If b is negative, and you raise b to a rational power, you may not get a real number.
For example, if 2b = − , then 12( 2)− will not be possible to calculate since your calculator
will state Math ERROR.
In Grade 11 you will learn that 12( 2) 2− = − which is a non-real number.

134
Here is a short summary of the main features of the four functions discussed, the different types of functions, how to recognise each function and the methods required to sketch the graphs of these functions. Linear functions ( y ax q= + ) The value of a determines the steepness of the line (ignoring negative signs). The greater the value of a, the steeper the line. 0a < means a reflection in the x-axis. The value of q is the vertical shift up or down.
All of the different types of lines are shown below:
How to sketch a straight line: If 0q = : Plot (0 ; 0) and one other point and draw the graph of y ax= If 0q ≠ : Draw the graph of y ax= and shift it up or down. Find the x-intercept. Alternatively, use the dual-intercept method to sketch the graph. Quadratic functions ( 2y ax q= + ) (x has been squared) The value of a determines the vertical stretch (ignoring negative signs). The greater the value of a, the closer the arms are to the y-axis. 0a < means a reflection in the x-axis. The value of q is the vertical shift up or down.
All of the different types of parabolas are shown below:
How to sketch a parabola: If 0q = : Plot (0 ; 0) and one other point and draw the graph of 2y ax= If 0q ≠ : Draw the graph of 2y ax= and shift it up or down. Indicate the y-intercept. Determine the x-intercepts, if they exist.
Hyperbolic functions ( ay qx
= + ) (x is in the denominator)
Ignoring negative signs, a determines the vertical stretch of the branches away from the axes. The greater the value of a, the greater the stretch away from the axes.
0a < means a reflection in the x-axis
00
aq
><
00
aq
<>
00
aq
<<
0a >
0a <0q =
00
aq
>>
00
aq
>=
00
aq
>>
00
aq
<=
00
aq
><
00
aq
<>
00
aq
<<
0a >
0a <

135
The value of q is the vertical shift up or down. The hyperbola has two asymptotes: y q= is the equation of the horizontal asymptote
0x = is the equation of the vertical asymptote
All of the different types of hyperbolas are shown below: How to sketch a hyperbola: If 0q = : Select one negative x-value and one positive x-value and determine the corresponding y-values. Plot these points and draw the two branches. The asymptotes lie on the axes (vertical: 0x = ; horizontal: 0y = ) If 0q ≠ : Draw the horizontal asymptote y q= . The vertical asymptote is 0x = . Determine the x-intercept by letting 0y = and solving for x. Then select one negative x-value and one positive x-value and determine the corresponding y-values. Plot these points and draw the two branches. Exponential functions ( . xy a b q= + ) (x is the exponent) The value of b affects the shape and steepness of the graph:
For 1b > : As the value of b increases, the steeper the graph. For 0 1b< < As the value of b decreases, the steeper the graph. The value of a causes a vertical stretch of the mother graph and the y-intercept is affected.
0a < means a reflection in the x-axis. The value of q is the vertical shift up or down. The exponential graph has one horizontal asymptote: y q=
All of the different types of exponential graphs are shown below:
1b > 0 1b< <
00
aq
<=
00
aq
>=
00
aq
><
00
aq
<<
00
aq
>>
00
aq
<>
010
abq
<>=
010
abq
>>=
010
abq
>>>
00 1
0
ab
q
>< <>
00 1
0
ab
q
>< <<
010
abq
>><
00 1
0
ab
q
>< <=
00 1
0
ab
q
<< <=

136
How to sketch an exponential graph: If 0q = : Determine the y-intercept (let 0x = ). Then select one negative x-value and one positive x-value and determine the corresponding y-values. Plot these points and draw the graph. The horizontal asymptote will be the line 0y = . If 0q ≠ : Draw the horizontal asymptote y q= Determine the y-intercept (let 0x = ). Determine the x-intercept (let 0y = ). If the graph has no x-intercept, select one negative x-value and one positive x-value and determine the corresponding y-values. Plot these points and draw the graph. The following exercise is a mixed exercise in which you will be required to identify and sketch the graphs of all functions studied thus far. Use the above summary to guide you. EXERCISE 5 (a) Identify the type of graph and then draw a neat sketch of the graph:
(1) 2y x= (2) 2yx
= (3) 22y x=
(4) 2y = (5) 2xy = (6) 2 2y x= +
(7) 22 2y x= − + (8) 2 1yx
= − + (9) 1 12
x
y = − +
(10) 2 2y x= − − (11) 2x = (12) 2.2 2xy = − (b) Sketch the graphs of the following functions on different axes. You will need to re-work the equations algebraically into the standard equations for the functions you have studied.
(1) 3x y= (2) 3xy = (3) 3xy =
(4) 2
3xy = (5) 3
3xy −= (6) 3 xy
x−=
(7) 3 33
xy += (8) (3 )(3 )y x x= − + (9) 3 3xy −= +
(10) 3(3 1)xy = − (11) 12 2 3x xy += + − (12) 22 4
2 2
x
xy −=+
00 1
0
ab
q
<< <>
y
x
00 1
0
ab
q
<< <<
y
x
010
abq
<><
y
x010
abq
<>>
y
x

137
FUNCTIONAL NOTATION A function may be represented by means of functional notation. Consider the function ( ) 3f x x=
The symbol ( )f x is used to represent the value of the output given an input value.
In other words, the y-values corresponding to the x-values are given by ( )f x , i.e. ( )y f x= .
For example, if 4x = , then the corresponding y-value is obtained by substituting 4x = into
3x . For 4x = , the y-value is (4) 3(4) 12f = = .
The brackets in the symbol (4)f do not mean f multiplied by 4, but rather the y-value when
4x = . Also, ( ) 3f x x= is read as “ f of x is equal to 3x ”.
We can also use other letters to name functions. For example, ( ), ( )g x h x and ( )p x may be
used.
EXAMPLE 5 If 2( ) 3 1f x x= − , determine the value of: (a) (2)f (b) ( 3)f − (c) ( )f a (d) (3 )f x (e) 3 ( ) 1f x + (f) x if ( ) 2f x = Solutions (a) 2( ) 3 1f x x= − (b) 2( ) 3 1f x x= −
2(2) 3(2) 13(4) 111
f = −= −=
2( 3) 3( 3) 13(9) 126
f − = − −= −=
(c) 2( ) 3 1f x x= − (d) 2( ) 3 1f x x= −
(e) 2( ) 3 1f x x= − (f)
2
2
2
2
3 ( ) 3(3 1)
3 ( ) 9 3
3 ( ) 1 9 3 1
3 ( ) 1 9 2
f x x
f x x
f x x
f x x
∴ = −
∴ = −
∴ + = − +
∴ + = −
2
2
2
(3 ) 3(3 ) 1
3(9 ) 1
27 1
f x x
x
x
= −
= −
= −
2
2
( ) 3( ) 1
3 1
f a a
a
= −
= −
2
2
2
2
( ) 3 1
2 3 1
0 3 3
0 10 ( 1)( 1)
1 or 1
f x x
x
x
xx x
x x
= −
∴ = −
∴ = −
∴ = −∴ = + −∴ = − =

138
EXERCISE 6 (a) If 2( ) 2 1f x x x= − + , determine the value of:
(1) (1)f (2) ( 1)f − (3) (2)f
(4) ( 2)f − (5) 12
f
(6) 12
f −
(7) ( )f a (8) (2 )f x (9) 2 ( )f x (10) ( ) 2f x + (11) ( )f x− (12) ( 1)f x − (13) 2 ( 1) 3f x − − (14) ( )f x h+ (15) ( ) ( )f x h f x+ −
(b) If 2( ) 5g x x= − , determine the value(s) of:
(1) x if ( ) 4g x =
(2) x if ( ) 20g x =
(3) x if ( ) 1 5g x x= −
(4) x if ( ) 6 14g x x= − (c) Given: ( ) 2 4g x x= − − (1) Write down an expression for ( 5)g p −
(2) If (2 ) 10g p = , determine the value of p. (d) Describe the transformation from f to g if:
(1) 2( )f x x= and ( ) 3 ( )g x f x=
(2) ( ) 2xf x = and ( ) ( )g x f x= −
(3) 2( )f xx
= and ( ) ( ) 2g x f x= +
(4) 2( ) 5f x x= + and 2( ) 1g x x= +
(5) 2( ) 2f x x= and 2( ) 8g x x=
(6) 6( ) 1f xx
= + and 6( ) 1g xx
= − −

139
FURTHER CHARACTERISTICS OF THE FOUR FUNCTIONS Domain and range In Grade 8 and 9, you learnt that a function is a rule which when applied to a given set of input values, produces a set of output values. For example, suppose that the rule is 2y x= . When applied to a set of input x-values { }2 ; 1; 0 ;1; 2; 3x ∈ − − , the output y-values can be obtained by substituting the given x-values into the equation (rule) 2y x= . The output values are therefore { }4 ; 2 ; 0 ; 2 ; 4; 6y ∈ − −
The domain is simply all of the inputs (x-values) that are used.
The range is the set of outputs (y-values) obtained from the input values. EXAMPLE 6 Determine the domain and range for the following functions: (a) There are four x-values in the domain:
{ }2 ; 1; 0 ;1x ∈ − −
There are four y-values in the range:
{ }1; 0 ;1; 2y ∈ −
For each point on the graph, there is a
y-value corresponding to an x-value.
(b) There are an infinite number of x-values in
the domain from 2− to 1 (including 2− but
excluding 1). The domain is written as:
[ )2 ;1x ∈ − or 2 1x− ≤ <
There are an infinite number y-values in
the range from 1− to 2 (including 1− but
excluding 2). The range is written as:
[ )1; 2y ∈ − or 1 2y− ≤ <
You can use the vertical ruler method to obtain the domain and range: For domain: Keep the edge of the ruler vertical and slide it across the graph from
left to right. Where the edge starts cutting the graph, the domain starts (as read off from the x-axis). Where it stops cutting the graph the domain ends.
For range: Keep the edge of the ruler horizontal and slide it across the graph from bottom to top. Where the edge starts cutting the graph, the range starts (as read off from the y-axis). Where it stops cutting the graph the range ends.
1−
2−
1 22− 1−
(0 ;1)1
2 (1; 2)
( 1; 0)−
( 2 ; 1)− −
1−
2−
1 22− 1−
1
2 (1; 2)
( 2 ; 1)− −

140
1−
2−
1 22− 1−
1
2
9
(c) There are an infinite number x-values in
the domain (as indicated by the arrows).
We write the domain as follows:
( ; )x ∈ −∞ ∞ or x ∈
There are an infinite number y-values in
the range (as indicated by the arrows).
We write the range as follows:
( ; )y ∈ −∞ ∞ or y ∈
(d) There are an infinite number x-values in
the domain (as indicated by the arrows).
We write the domain as follows:
( ; )x ∈ −∞ ∞ or x ∈
There are an infinite number y-values in
the range from 9 downwards. The range is
written as:
( ]; 9y ∈ −∞ or 9y ≤
(e) There are an infinite number x-values in
the domain (as indicated by the arrows).
We write the domain as follows:
( ; )x ∈ −∞ ∞ or x ∈
There are an infinite number y-values in
the range from 2 upwards (excluding 2).
The range is written as:
( )2 ;y ∈ ∞ or 2y >
EXERCISE 7 State the domain and range of the following functions:
(a) (b) (c)
2
( 3 ; 2)−
(1; 4)−
03−

141
0x < 0x >
(d) (e) (f) Increasing and decreasing functions For the graph of a given function, if the y-values increase as the x-values increase, then the graph is said to be increasing. If the y-values decrease as the x-values increase, then the graph is said to be decreasing. In short, a graph is increasing if it moves upwards when moving from left to right and decreasing if it moves downwards when moving from left to right. For example, the graph on the right is increasing for all values of 0x < . As we move from left to right, the graph moves upwards. The graph is decreasing for all values of 0x > . As we move from left to right, the graph moves downwards. Note to the educator: Increasing and decreasing depends on how we define these concepts. For school purposes, we will define increasing and decreasing in terms of the gradient of the curve (positive or negative). At 0x = , the gradient is 0 and therefore we exclude 0 in the solutions. THE LINEAR FUNCTION We will now briefly revise lines of the form ax by c+ = , the gradient of a line and points of intersection of lines. EXAMPLE 7 In the diagram, two lines are drawn: 3 2 6x y+ = and 4 16x y− = The first line cuts the y-axis at A and the x-axis at B. The two lines intersect at C. Determine: (a) the coordinates of A and B. (b) the gradient of 3 2 6x y+ = (c) the gradient and y-intercept of 4 16x y− = (d) the coordinates of C (e) the values of x for which the lines are increasing or decreasing.
2 2
1
3 2 6x y+ =
4 16x y− =

142
Solutions (a) We can use the dual-intercept method: x-intercept: Let 0y = y-intercept: Let 0x =
3 2(0) 63 6
2B(2 ; 0)
xx
x
∴ + =∴ =∴ =
3(0) 2 62 6
3A(0 ; 3)
yy
y
∴ + =∴ =∴ =
(b) In Grade 9, you learnt that the gradient of a line between any two points on the line is
given by the ratio: change in -valueschange in -values
yx
We can determine the gradient by referring to the diagram or by re-writing the equation of the line in the form y ax q= + , bearing in mind that the value of a represents the gradient of the line. Between the points (0 ; 3) and (2 ; 0) , the y-values decrease ( 3− ) as the x-values increase ( 2+ ).
The gradient is therefore 32
−
We can also determine the gradient as follows:
3 2 6
2 3 6x y
y x+ =
∴ = − +
3 3
2y x−∴ = + [The coefficient of x is the gradient]
(c) 4 16x y− =
4 16
1 44
y x
y x
∴− = − +
∴ = −
The gradient is 14
and the y-intercept is 4− (d) In order to determine the coordinates of C, we need to solve simultaneous equations: 3 2 6x y+ = (1) 4 16x y− = (2) 6 4 12x y+ = (1) 2× 4 16x y− = (2) 7 28x∴ = Add like terms and constants 4x∴ = 4 4 16y∴ − = Substitute 4x = into (2) to get the corresponding y-value
4 12
3y
y∴− =∴ = −
The coordinates of C are C(4 ; 3)− (e) 3 2 6x y+ = decreases for all real values of x. 4 16x y− = increases for all real values of x.
(0 ; 3)
3−
(2 ; 0)
2+

143
Finding the equation of a linear function EXAMPLE 8 (a) Determine the equation of the following line in the form ( )f x ax q= + . Solution The y-intercept is 3. Therefore 3q = . 3y ax∴ = + Substitute the point (8 ; 1)− to get a:
1 (8) 31 8 38 4
12
aa
a
a
− = +− = +− =
= −
Therefore the equation is 1( ) 32
f x x= − +
(b) Determine the equation of the following line in the form ( )g x ax q= + . Solution Method 1
The y-intercept is 4. Therefore 4q = . 4y ax∴ = + Substitute the point ( 2 ; 0)− to get a:
0 ( 2) 40 2 42 4
2
aa
aa
= − += − +
==
Therefore the equation is ( ) 2 4g x x= +
Method 2
The gradient is 4 22
+ =+
The y-intercept is 4 Therefore, the equation is ( ) 2 4g x x= +
(8 ; 1)−
3
4
2−
4
2−
4+
2+

144
(c) Determine the equation of the following line in the form ( )f x ax q= + . Solution Method 1 Substitute the two points into y ax q= + and solve simultaneous equations: For ( 1; 3)− : 3 ( 1)a q= − + 3 a q∴ + = For (3 ; 1)− 1 (3)a q− = + 1 3a q∴− − = 3 1 3a a∴ + = − − (both equal q)
4 4
13 ( 1) 2
aaq
∴ = −∴ = −∴ = + − =
Therefore the equation is ( ) 2f x x= − + Method 2
The gradient is 4 14
a −= = −+
1y x q∴ = − + Substitute either of the two points: into the equation y x q= − + to get q: ( 1; 3)− : 3 ( 1) q= − − + 2q∴ = or (3 ; 1)− : 1 (3) q− = − + 2q∴ = The y-intercept is 2 Therefore the equation is ( ) 2f x x= − + Method 3 Use the Analytical Geometry formula to find the gradient (see Chapter 8)
Gradient 1 3 4 13 ( 1) 4− − −= = = −− −
Therefore 1a = − . 1y x q∴ = − + Substitute one of the points into the equation y x q= − + to get q: ( 1; 3)− : 3 ( 1) q= − − + 2q∴ = The y-intercept is 2 Therefore, the equation is ( ) 2f x x= − +
( 1; 3)−
(3 ; 1)−
( 1; 3)−
(3 ; 1)−
4−
4+

145
EXERCISE 8 (a) In the diagram, line 4 2 8x y− = cuts the axes at A and B. Line 1x y+ = − cuts the axes at C and D. The two lines intersect at E.
Determine: (1) the coordinates of A and B. (2) the coordinates of C and D. (3) the gradient of 4 2 8x y− = (4) the gradient of 1x y+ = − (5) the coordinates of E (6) the values of x for which the lines are increasing or decreasing. (b) Given: 3 4x y− = and 2 5x y− = (1) On the same set of axes, draw neat sketch graphs of the two functions. (2) Determine the coordinates of the point of intersection. (c) Determine the equations of the following lines in the form ( )f x ax q= + : (1) (2) (3) (4) (5) (6) (d) (1) Determine the equation of the line passing through the point (0 ; 1)− and
parallel to the x-axis. Do you remember what the gradient of this line is?
(2) Determine the equation of the line passing through the point and parallel to the y-axis. Do you remember what the gradient of this line is?
( 1; 0)−
1x y+ = −
4 2 8x y− =
3
( 4 ; 1)− − 5−
( 7 ; 2)−
3−
6
6−
4−
( 3 ; 1)− −
(2 ; 4) ( 2 ; 7)−(2 ; 5)
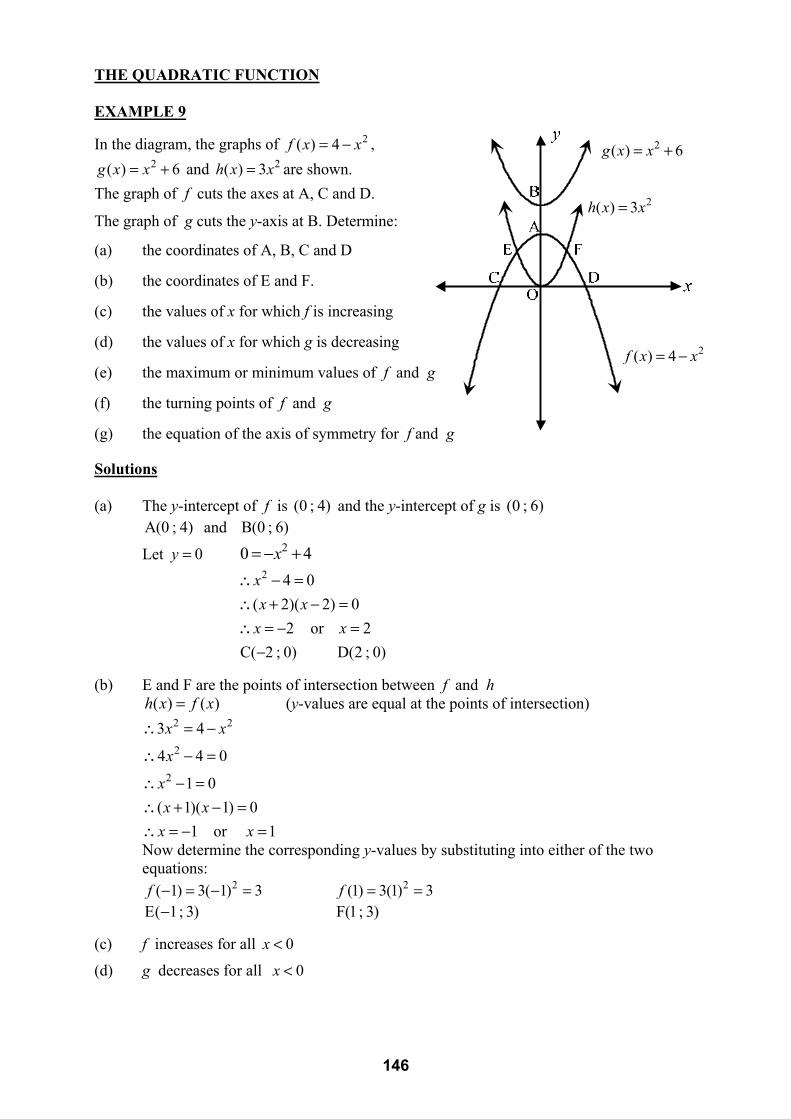
146
2( ) 6g x x= +
2( ) 4f x x= −
2( ) 3h x x=
THE QUADRATIC FUNCTION EXAMPLE 9
In the diagram, the graphs of 2( ) 4f x x= − , 2( ) 6g x x= + and 2( ) 3h x x= are shown.
The graph of f cuts the axes at A, C and D.
The graph of g cuts the y-axis at B. Determine:
(a) the coordinates of A, B, C and D (b) the coordinates of E and F. (c) the values of x for which f is increasing (d) the values of x for which g is decreasing (e) the maximum or minimum values of f and g (f) the turning points of f and g (g) the equation of the axis of symmetry for f and g Solutions (a) The y-intercept of f is (0 ; 4) and the y-intercept of g is (0 ; 6) A(0 ; 4) and B(0 ; 6) Let 0y = 20 4x= − +
2 4 0( 2)( 2) 0
2 or 2C( 2 ; 0) D(2 ; 0)
xx x
x x
∴ − =∴ + − =∴ = − =
−
(b) E and F are the points of intersection between f and h ( ) ( )h x f x= (y-values are equal at the points of intersection)
2 2
2
2
3 4
4 4 0
1 0( 1)( 1) 0
1 or 1
x x
x
xx x
x x
∴ = −
∴ − =
∴ − =∴ + − =∴ = − =
Now determine the corresponding y-values by substituting into either of the two equations: 2( 1) 3( 1) 3f − = − = 2(1) 3(1) 3f = = E( 1; 3)− F(1; 3)
(c) f increases for all 0x <
(d) g decreases for all 0x <

147
3
(2 ; 7)
2−
(1; 6)
2
(e) The maximum value refers to the largest y-value on a graph and the minimum value refers to the smallest y-value on a graph. The maximum value of f is 4 and the minimum value of g is 6 (f) A turning point on a graph is the point at which the graph changes from increasing to decreasing or decreasing to increasing. The turning point of f is (0 ; 4) The turning point of g is (0 ; 6) (g) The axis of symmetry of a parabola is a vertical line that divides the parabola into two congruent halves. The y-axis is the axis of symmetry for both graphs. The equation is 0x = . Finding the equation of a quadratic function EXAMPLE 10
(a) Determine the equation of the following graph in the form 2( )f x ax q= + .
Solution The y–intercept is 3 3q∴ = 2 3y ax∴ = + Substitute the point (2 ; 7) into 2 3y ax= + to get the value of a
27 (2) 37 3 44 4
1
aa
aa
∴ = +∴ − =∴ =∴ =
2( ) 1 3f x x∴ = +
(b) Determine the equation of the following graph in the form 2( )f x ax q= + .
Solution The x-intercept form of the equation of a parabola can be used: 1 2( )( )y a x x x x= − − where 1x and 2x represent the x-intercepts.
( ( 2))( 2)( 2)( 2)
y a x xy a x x
∴ = − − −∴ = + −
Substitute (1; 6) to get the value of a
6 (1 2)(1 2)6 (3)( 1)6 3
2
aa
aa
= + −∴ = −∴ = −∴ = −
2
2
2( 2)( 2)
2( 4)
( ) 2 8
y x x
y x
f x x
∴ = − + −
∴ = − −
∴ = − +
Notice that the x-intercept form of 22 8y x= − + is:
2
2
2 8
2( 4)2( 2)( 2)2( ( 2))( 2)
y x
xx xx x
= − +
= − −= − + −= − − − −

148
2( ) 2 2f x x= −
2( ) 9f x x= − +
2( )g x x= −
2( ) 9f x x= −
2( ) 1g x x= − −
EXERCISE 9
(a) In the diagram, the graph of 2( ) 2 2f x x= − is shown. The graph of f cuts the axes at
A, B and C. Line h is parallel to the x-axis and
passes through A. Determine:
(1) the coordinates of A, B and C (2) the values of x for which f is increasing (3) the values of x for which f is decreasing (4) the minimum value of f (5) the turning point of f (6) the equation of the axis of symmetry of f (7) the domain and range of f (8) the equation of h and the value of its gradient (9) the domain and range of h (b) In the diagram, the graphs of 2( ) 9f x x= − + 2( )g x x= − , h and p are shown. The graph of
f cuts the axes at A, B and C. Line p cuts the
x-axis at B and is parallel to the y-axis.
Determine:
(1) the coordinates of A, B, and C. (2) the values of x for which f is increasing (3) the values of x for which g is decreasing (4) the maximum value of f and g (5) the turning points of f and g (6) the equation of the axis of symmetry for f (7) the domain and range of f and g (8) the equation of h if ( ) ( ) 12h x g x= − + . Describe the transformations.
(9) the equation of p and the value of its gradient. (10) the domain and range of p (c) Given: 2( ) 9f x x= − and 2( ) 1g x x= − −
(1) Determine the coordinates of A, B, C and D (2) Determine the coordinates of E and F.

149
2
( 1; 6)−
3−( 2 ; 5)− −
3
1−(1; 2)−
4−
(1;15)
4 5− 5
25
y x q= +y x q= − +y x=y x= −
y q=q
ay qx
= +ayx
=
3 2yx
= +
(d) Determine the equation of each of the following parabolas in the form 2( ) .f x ax q= + (1) (2) (3) (4) (5) (6) THE HYPERBOLIC FUNCTION An interesting characteristic of the hyperbola is that it has two axes of symmetry. Each axis of symmetry has a gradient of 1 or 1− and a y-intercept of q. EXAMPLE 11
Given: 3( ) 2g xx
= +
Determine: (a) the equations of the asymptotes (b) the equations of the axes of symmetry (c) the values of x for which g is decreasing (d) the domain and range of g
2− 2
8−

150
3y = −
(3 ; 4)−
4y x= +
Solutions (a) Horizontal asymptote is 2y = Vertical asymptote is 0x = (b) 2y x= − + and 2y x= + (c) The graph of g is decreasing on the interval ( ; 0)x ∈ −∞ as well as the interval (0 ; )x ∈ ∞ . (d) Domain of g: 0x x∈ ≠ Range of g: 2y y∈ ≠ Finding the equation of a hyperbola EXAMPLE 12
Determine the equation of the following graph in the form ( ) af x qx
= + .
Solution The horizontal asymptote is 3y = −
3q∴ = −
3ayx
∴ = −
Substitute the point (3 ; 4)− :
4 33
13
33( ) 3
a
a
a
f xx
− = −
∴− =
∴− =−∴ = −
EXERCISE 10 (a) The line 4y x= + is an axis of symmetry of the
graph of 2( )f x qx
−= + . The graph of f cuts the
x-axis at A. (1) Write down the value of q (2) Write down the equation of f (3) State the domain and range of f (4) For which values of x is f increasing? (5) Write down the equations of the asymptotes (6) Write down the equation of the other axis of symmetry.

151
( 2 ; 6)− −
(4 ; 3)2y =
( 3 ; 5)−
(1; 2)−
3
( 8 ; 8)− −4−
(2 ; 6)−
2−
4−
1y x= − + 2y x= −
3−
( 1; 8)− −
3y x= −
( 2 ; 7)− −
3y = −(2 ; 4)−5y x= +
y
x( 4 ; 2)−
514 4( ; )
121−
(2 ; 6)−
1− 1
(2 ; 4)
(b) Determine the equation of each of the following hyperbolas in the form ( ) .af x qx
= +
(1) (2) (3) (4) (5) (6) (7) (8) (9) (10) (11) (c) For each function below, state the domain and range and determine the equation:
(1) (2) (3)

152
4−
8−
3
1−
13−
(2 ;1)
THE EXPONENTIAL FUNCTION Finding the equation of an exponential graph EXAMPLE 13 (a) Determine the equation of the given graph in the form ( ) .2xf x a q= + Solution The horizontal asymptote is 8y = − .2 8xy a∴ = − Substitute (0 ; 4)− :
04 .2 84 8
4
aa
a
− = −∴− = −∴ =
( ) 4.2 8xf x∴ = − (b) Determine the value of b and q if the
equation of the given graph is ( ) xg x b q= − + Solution The horizontal asymptote is 3y = 3xy b∴ = − + Substitute ( 1; 0)− :
10 310 3
0 1 33 1
13
b
bb
b
b
−= − +
∴ = − +
∴ = − +∴− = −
∴ =
1( ) 33
x
g x ∴ = − +
13
b = and 3q =
(c) Determine the equation of the given graph in the form . xy a b q= +
Solution
1.3
xy a b= −
The graph passes though the origin.

153
3−
4−
1−
( 1; 2)−
3
1
3(2 ;12)
13−
(2 ;1)
Substitute the point (0 ; 0) :
0 10 .3
103
13
a b
a
a
= −
∴ = −
∴ =
1 1.3 3
xy b∴ = −
Substitute the point (2 ;1) :
2
2
2
1 11 .3 3
3 1
0 40 ( 2)( 2)
2 or 2
b
b
bb b
b b
= −
∴ = −
∴ = −∴ = + −∴ = − =
Choose 2b = since 2b ≠ −
1 1.23 3
xy∴ = −
EXERCISE 11 (a) Determine the equation of the given graph in the form ( ) .2xf x a q= + (b) Determine the equation of the given graph in the form ( ) xg x b q= + (c) Determine the equation of the given graph in the form ( ) xh x b q= − + (d) Determine the equation of the given graph in the form ( ) . xf x a b q= +

154
18
2
16
4−
( 2 ; 60)−
11−
1
1−
Let 0x =Let 0y =
(e) Determine the equation of the given graph in the form ( ) . xf x a b q= + (f) Determine the equation of the given graph in the form ( ) . xg x a b q= + GRAPH INTERPRETATION This topic involves determining the lengths of line segments using the different functions you have studied thus far. It also discusses the graphical interpretation of inequalities, which is so important for matric. Determining the length of line segments using graphs The following information is extremely important for determining the length of line segments: ● The length of a line segment is always positive.
A 1x = and OA 1= unit B 1x = − and OB 1= unit C 1y = and OC 1= unit D 1y = − and OD 1= unit ● To determine a length OA along the y-axis, let 0x = The y-value will be the length of OA. To determine a length OB along the x-axis, let 0y = The positive x-value will be the length of OB. ● The point of intersection (B) is obtained by equating the equations of the functions ( ( ) ( )f x g x= ) and solving for x and hence for y. The value of x will give the horizontal length OA and the value of y will give the vertical length OB.

155
x
A BAB y y= −
D CCD x x= −
1− 1 2
2( ) 1f x x= − +( ) 1g x x= − −
● A vertical length between two graphs can be calculated using the formula: top graph bottom graphy y− (substitute the x-value into this formula to get the required length) A horizontal length between two graphs can be calculated using the formula: right end point left end pointx y− Using graphs to solve inequalities The diagram below shows the graph of a parabola and a line. A and B are the points of intersection of the two graphs. Both graphs cut the x-axis at 1− and the graph of the parabola cuts the x-axis at 1. We can use the graphs to solve the following inequalities graphically: (a) For which values of x is ( ) 0f x > ? We are required to determine the x-values for which the y-values of f are positive. Where the parabola lies above the x-axis will be where the y-values are positive. The solution lies between x-values of 1− and 1. 1 1x∴− < < or we can write ( 1;1)x∈ − (b) For which values of x is ( ) 0f x ≤ ? We are required to determine the x-values for which the y-values of f are negative. Where the parabola lies below the x-axis will be where the y-values are negative. 1 or 1x x∴ ≤ − ≥ or we can write ( ; 1] [1; )x ∈ −∞ − ∪ ∞ (c) For which values of x is ( ) 0g x > ? We are required to determine the x-values for which the y-values of g are positive. Where the line lies above the x-axis will be where the y-values are positive. 1x∴ < − or we can write ( ;1)x∈ −∞

156
( ) 3f x x= − +
( ) 3 3g x x= +
3−
4
(d) For which values of x is ( ) ( )f x g x≥ ? We are required to determine the values of x for which the y-values of f are greater than or equal to the y-values of g. This is where the graph of f is above the graph of g (between A and B). 1 2x∴− ≤ ≤ or we can write [ 1; 2]x ∈ − (e) For which values of x is ( ) ( )f x g x< ? We are required to determine the values of x for which the y-values of f are smaller than the y-values of g. This is where the graph of f is below the graph of g 1 or 2x x∴ < − > or we can write ( ; 1) (2 ; )x∈ −∞ − ∪ ∞ EXAMPLE 14 Two lines cut the y-axis at A. Determine: (a) the length of OA, OB, OC and BC (b) the length of OD, FE, OF and DE (c) the length of OJ, GH, OG and JH (d) the values of x for which ( ) 0f x ≥ (e) the values of x for which ( ) 0g x < (f) the values of x for which ( ) ( )f x g x≤ Solutions
(a) A(0 ; 3) For Bx OA 3∴ = units 0 3x= − + 3x∴ = OB 3∴ = units For Cx B CBC y y= − 0 3 3x= + BC 3 ( 1)∴ = − − 3 3x∴− = BC 4∴ = units 1x∴ = − OC 1∴ = unit (b) OD 4= units FE 4∴ = units (opp sides rectangle) Substitute 4x = into 3y x= − + 4 3 1y = − + = − E F 1y y∴ = = − OF 1∴ = units and DE 1= unit

157
2( ) 3 12f x x= −
( ) 3 6g x x= −( ) 3 6h x x= − +
(c) OJ 3= units (d) ( ) 0f x ≥ GH 3∴ = units (opp sides rectangle) 3x∴ ≤ or write ( ; 3]x∈ −∞ Substitute 3y = − into 3 3y x= + 3 3 3x− = + (e) ( ) 0g x < 3 6x∴− = 1x∴ < − or write ( ; 1)x∈ −∞ − 2x∴ = − OG 2∴ = units and JH 2= units (f) ( ) ( )f x g x≤ 0x∴ ≥ or write [0 ; )x ∈ ∞
EXAMPLE 15
The diagram below shows the graphs of 2( ) 3 12f x x= − , ( ) 3 6g x x= − and ( ) 3 6h x x= − + . The graphs of f , g and h share a common x-intercept (D). The graph of f and g intersect
at D and F. The diagram is not drawn to scale. Determine:
(a) the length of AB and CD.
(b) the length of OE and EF.
(c) the length of GH if OG 3= units
(d) the length of OI if IJ 6= units
(e) the length of KL if OR 1= unit
(f) the length of ON if MP 18= units
(g) the values of x for which ( ) 0f x ≥
(h) the values of x for which ( ) ( )f x g x<

158
Solutions
(a) A BAB 6 ( 12) 6y y= − = − − − = units Let 0y = in 23 12y x= −
2
2
0 3 12
0 40 ( 2)( 2)
2 or 2
x
xx x
x x
= −
∴ = −∴ = + −∴ = − =
D CCD 2 ( 2) 4x x= − = − − = units. (b) Determine the coordinates of E, the point of intersection of f and g
2
2
2
3 12 3 6
3 3 6 0
2 0( 1)( 2) 0
1 or 2
x x
x x
x xx x
x x
− = −
∴ − − =
∴ − − =∴ + − =∴ = − =
At E, 1x = − 3( 1) 6 9y = − − = − The coordinates of E are ( 1; 9)− − OE 1∴ = unit and EF 9= units (c) OG 3= which means that 3x = − at G. Substitute 3x = − into ( ) 3 6g x x= − to get y. ( 3) 3( 3) 6 15g − = − − = − GH 15∴ = units (d) IJ 6= which means that 6y = − at J. Substitute 6y = − into ( ) 3 6h x x= − + to get x
6 3 63 12
4
xx
x
− = − +∴ =∴ =
OI 4∴ = units (e) OR 1= which means that 1x = 2
K LKL (3 6) (3 12)y y x x= − = − − − Substitute 1x = 2KL (3(1) 6) (3(1) 12) 6∴ = − − − = units
(f) M PMP (3 6) ( 3 6) 3 6 3 6 6 12y y x x x x x= − = − − − + = − + − = − 18 6 12x∴ = − (since MP 18= ) 6 30x∴− = − 5x∴ = ON 5∴ = units (g) ( ) 0f x ≥ for 2 or 2x x≤ − ≥ or ( ; 2] [2 ; )x ∈ −∞ − ∪ ∞ (h) ( ) ( )f x g x< for 1 2x− < < or ( 1; 2)x∈ −

159
( ) 5f x x= +
( ) 2g x x= +
( ) 4f x x= − +
( ) 4f x x= − +
( ) 2g x x= −
2−1−
EXERCISE 12 (a) Two lines ( ) 4f x x= − + and ( ) 2g x x= − intersect at R. By using the information on
the diagram, determine: (1) the length of OA, OP, OB and OC (2) the length of AP and BC (3) the length of OD, EF, OF and DE (4) the length of OK, GH, OG and KH (5) the length of RS and OS (6) the values of x for which ( ) 0f x ≥ (7) the values of x for which ( ) 0g x < (8) the values of x for which ( ) ( )f x g x< (b) The diagram shows the line ( ) 5f x x= +
Determine: (1) the length of OP and OQ
(2) the length of AB if OB 2= units (3) the length of DC if OD 7= units
(4) the length of OF if EF 3= units
(5) the length of OH if HG 3= units
(6) the values of x for which ( ) 0f x < (c) Two lines ( ) 4f x x= − + and ( ) 2g x x= + intersect at E.
Determine: (1) the length of AB, CD and DF
(2) the length of PQ if OR 3= units
(3) the length of OU if ST 8= units
(4) the length of GH if 12HK 1=
(5) the values of x for which ( ) 0f x >
(6) the values of x for which ( ) 0g x ≤
(7) the values of x for which ( ) ( )g x f x<

160
2( ) 9f x x= −
( ) 3g x x= −
2( ) 2f xx
= −
( ) 2g x =
1( ) 22
x
f x = −
(d) The diagram shows the graphs of 2( ) 9f x x= − and ( ) 3g x x= − intersecting at E and D. The graph of f cuts the axes at B, C and D.
Determine: (1) the length of AB, CT and CD (2) the length of OF and EF (3) the length of GH if OH 1= unit (4) the length of OV if VW 8= units (5) the length of JL if OK 1= unit (6) the length of OQ if PR 8= units (7) the values of x for which ( ) 0f x >
(8) the values of x for which ( ) ( )f x g x≥
(e) The graph of 2( ) 2f xx
= − and ( ) 2g x = is shown.
Determine:
(1) the length of OA.
(2) the length of BC if OB 4 units=
(3) the length of OD and OE
(4) the coordinates of F
(5) the values of x for which ( ) 0f x ≥
(6) the values of x for which ( ) 0f x <
(7) the values of x for which ( ) 2f x > −
(8) the values of x for which ( ) ( )f x g x>
(f) The graph of 1( ) 22
xf x = −
is shown.
Determine:
(1) the length of OA and CD.
(2) the values of x for which ( ) 0f x >
(3) the values of x for which ( ) 0f x ≤
(4) the values of x for which ( ) 2f x > −
(5) the values of x for which ( ) 1f x > −
(6) the values of x for which ( ) 1f x ≤ −

161
(1; 3)
CONSOLIDATION AND EXTENSION EXERCISE
(a) Given: 2( ) 1f x x= − and ( ) 1g x x= −
(1) Sketch the graph of f and g on the same set of axes.
(2) Determine the domain and range of f.
(3) If ( ) ( ) 3h x f x= + , write down the coordinates of the turning point of h.
(4) Determine the maximum value of p if ( ) ( )p x h x= − .
(5) Sketch the graphs of h and p on the same set of axes.
(6) Determine the y-intercept of the graph of ( )y g x= − .
(7) Determine the x-intercept of the graph of ( 2)y g x= + .
(b) Given: ( ) 3xf x = and 3( )g xx
=
(1) Sketch the graph of h if ( ) 3 ( ) 1h x f x= − and describe the transformations.
(2) Sketch the graph of p if ( ) ( ) 1p x g x= − + and describe the transformations.
(3) Write down the range of h.
(4) Write down the domain of p.
(c) In the diagram below, the graphs of f and g are shown. The graphs intersect at (1; 3) . Determine:
(1) the equation of f
(2) the coordinates of the turning point of f.
(3) the equation of the axis of symmetry of f.
(4) the equation of the horizontal asymptote of g
(5) the equation of g and the coordinates of A
(6) the domain and range of f and g
(7) the values of x for which f is decreasing?
(d) The graph of 1( )2
x
f x q = +
passes through
the origin. Determine:
(1) the value of q
(2) the length of AB of OA 2= units
(3) the length of OC if 78CD = units
(4) the length of OT if MN 2= units
(5) the equation of g , the image when the graph of f is translated downwards so that the image of M lies on the x-axis.
f

162
H( 1; 4)−
f
g
T(4 ; 1)−
G(1; 8)−
( 2 ; 12)− −
2( ) 3 12f x x= − +
( ) 3 6g x x= − +
(e) The graph of ( )f x mx c= + and 2( )g x ax b= + intersect at D and on the x-axis at A.
H and T lie on line f . Determine:
(1) the equation of f
(2) the coordinates of A and hence C
(3) the equation of g
(4) the length of AC and OB
(5) the length of DE and DF
(6) the length of ST
(7) the length of OM if 454QR =
(8) the values of x for which ( ) 0g x ≥
(9) the values of x for which ( ) ( )g x f x<
(f) The graph of ( ) . xf x a b q= + and ( ) 6ag xx
= +
cut the x-axis at A. The graph of f passes through the point ( 2 ; 12)− − and cuts the y-axis at 4.
Determine:
(1) the range of f
(2) the equation of f
(3) the equation of g
(4) the equation of h if the graph of f is reflected in the x-axis
(5) the values of x for which f is increasing *(g) Given: 2( ) 3 12f x x= − + and ( ) 3 6g x x= − +
Determine:
(1) the values of x for which ( ) 0f x ≥
(2) the values of x for which ( ) ( )f x g x>
(3) the values of x for which ( ) 9f x ≥
(4) the values of x for which ( ). ( ) 0f x g x <
(5) the values of x for which ( ). ( ) 0f x g x ≥
(6) the possible values of t if the graph of
2( ) 3 12f x x t= − + −
(i) does not cut or touch the x-axis.
(ii) cuts the x-axis in two distinct points.

163
CHAPTER 7 EUCLIDEAN GEOMETRY Revision of lines, angles, triangles and polygons
Corresponding angles Corresponding angles lie either both above or both below the parallel lines and on the same side as the transversal. They are the angles in matching corners and are equal. Always look out for the F shape.
Alternate angles Alternate angles lie on opposite sides of the transversal and between the parallel lines. They are equal in size. Always look out for the Z or N shape.
Line property 1 Adjacent angles on a straight line are supplementary. • If ABC is a straight line, then 1 2
ˆ ˆB B 180+ = ° or • If 1 2
ˆ ˆB B 180+ = ° then ABC is a straight line
Line property 2 If two lines AB and CD cut each other (intersect) at E, then the vertically opposite angles are equal.
1 3ˆ ˆE E= and 2 4
ˆ ˆE E= .
Line property 3 The angles around a point add up to 360° .
1 2 3 4ˆ ˆ ˆ ˆB B B B 360+ + + = °

164
Co-interior angles Co-interior angles lie on the same side of the transversal between the parallel lines. These angles are supplementary. Always look out for the U shape.
Acute-angled triangles Right-angled triangles All three interior angles are smaller The largest interior angle is equal to 90° . than 90° (acute). The other two angles are acute. Obtuse-angled triangles The largest interior angle is greater than90° . The other two angles are acute. Scalene triangle Isosceles triangle
No sides are equal. Two sides are equal and the angles opposite the equal sides are equal. We can say that: AB AC= if ˆB C= (sides opp s= ∠ ) ˆB C= if AB AC= ( s∠ opp equal sides) Equilateral triangle Properties of triangles
Three sides are equal and the interior angles are equal to 60° .
2
ˆ ˆˆA B C 180+ + = ° (sum of the s∠ of Δ)
1ˆ ˆ ˆC A B= + (ext ∠ of Δ )
1 1ˆ ˆG H 180+ = ° 1 1
ˆ ˆG H 180+ = °
1 1ˆ ˆG H 180+ = °
1 1ˆ ˆG H 180+ = °
60°60°
60°
From Pythagoras: 2 2 2AB AC BC= + 2 2 2AC AB BC= − 2 2 2BC AB AC= −

165
Congruency of triangles (four conditions) Condition 1 Two triangles are congruent if three sides of one triangle are equal in length to the three sides of the other triangle. Condition 2 Two triangles are congruent if two sides and the included angle are equal to two sides and the included angle of the other triangle. Condition 3 Two triangles are congruent if two angles and one side of a triangle are equal to two angles and a corresponding side of the other triangle. Condition 4 Two right-angled triangles are congruent if the hypotenuse and a side of the one triangle is equal to the hypotenuse and a side of the other triangle.
Similar Triangles If two triangles are similar (equiangular), then their corresponding sides are in the same proportion.
If ABC||| DEFΔ Δ , then AB BC ACDE EF DF
= =
EXERCISE 1 (Revision) (a) In the diagram, ABCG||FD, ABCG GH⊥ The reflex angle ˆBFE 200= ° and ˆCGD 50= ° . (1) Calculate the size of all angles indicated by small letters. (2) Show that DF FE⊥ .
(b) In ABCΔ , EF||BC. BA is produced to D. (1) Calculate a and hence show that AE AF= .
(2) Calculate, with reasons, the value of b, c, d and e.
200°2 50a − °
50°
5 40a − ° 2a
80°
≡ ≡

166
(c) In the diagram, CD||EF, ˆDEF 28= ° , ˆABD 48= ° and ˆBDE 160= ° . Prove that AB||CD.
(d) In the diagram, PU||QT, T 42= ° , ˆRQS 82= ° , ˆPQT y= , ˆUPT x= and ˆQPT 40x= + ° . (1) Prove that PT||QS. (2) Calculate y. (e) ABCD is a parallelogram, ABEΔ is equilateral and DECΔ is isosceles. (1) Show that AE ED⊥ (2) Show that ED bisects D
(f) In the diagram, AB 7 cm= , AD 12 cm= , CE 8 cm= and DE 17 cm= . Calculate the length of BC. (g) ABCD is a kite in which
AB AD= and BC CD= . Prove that: (1) ABC ADCΔ ≡ Δ (2) Why is ˆ ˆB D= ? (h) AB||DE and DC CB= .
Prove that: (1) AC CE=
(2) AB DE= (i) Prove that ABC ADCΔ ≡ Δ using two different conditions of congruency. (j) In the figure below, sides PR
and QS of triangles PQR and SQR intersect at T. PQ SR= and ˆP S 90= = ° . Prove that PQR SRQΔ ≡ Δ .
x
48°160°
28°
82°
42°40x + °
A B
C
D E
12
D
EB
A
C1 2 3
1 2 12

167
(k) In the diagram, O is the centre of the circle. BO bisects ˆAOC . Prove that: (1) OB bisects AC at B. (2) OB ⊥ AC (l) In the diagram, O is the centre of the circle passing through A, B and C. AB AC= and AO ⊥ BC. Prove that: (1) 1 2
ˆ ˆO O= (2) ABCΔ is a right-angled triangle.
(m) Show that the following triangles (n) If ABC||| DECΔ Δ , are similar. calculate x and y.
(1) (2)
QUADRILATERALS A polygon is a two-dimensional figure with three or more straight sides. A quadrilateral is a polygon with four straight sides.
90°
90°
y
5
15
12
x
A
BC
D
E
133

168
Summary of the properties of quadrilaterals (Revision of Grade 8 and 9)
Quadrilateral Diagonals Angles Sides
The diagonals of a parallelogram bisect each other.
The opposite angles of a parallelogram are equal. The interior angles add up to360° .
The opposite sides of a parallelogram are parallel and equal.
The diagonals of a rhombus bisect each other at right angles. The diagonals bisect the vertex angles.
The opposite angles of a rhombus are equal. The interior angles add up to 360° .
The opposite sides of a rhombus are parallel and all sides are equal.
The diagonals of a rectangle bisect each other and are equal in length.
The interior angles of a rectangle are equal to 90° . The interior angles add up to 360° .
The opposite sides of a rectangle are parallel and equal.
The diagonals of a square bisect each other at right angles and are equal in length. The diagonals bisect the vertex angles.
The interior angles of a square are equal to 90° . The interior angles add up to 360° .
The opposite sides of a square are parallel and all sides are equal.
The diagonals of a trapezium intersect but don’t bisect each other. They lie between parallel lines and therefore the alternate angles are equal.
The interior angles add up to 360° .
One pair of opposite sides are parallel.
The diagonals are perpendicular and one diagonal bisects the other. One of the diagonals bisects the vertex angles.
One pair of opposite angles are equal. The interior angles add up to 360° .
Two pairs of adjacent sides are equal.
45°45°
45° 45
45°45°
45°45°

169
The concept of a theorem and its converse A theorem is a statement that can be demonstrated to be true by accepted mathematical operations and arguments. In general, a theorem is an embodiment of some general principle that makes it part of a larger theory. The process of showing a theorem to be correct is called a proof. In Grade 10, we introduce the concept of a theorem and its proof. A converse of a theorem is a statement formed by interchanging what is given in a theorem and what is to be proved. For example, the isosceles triangle theorem states that if two sides of a triangle are equal then the two base angles are equal. In the converse, the given (that two sides are equal) and what is to be proved (that two angles are equal) are swapped, so the converse is the statement that if two angles of a triangle are equal then two sides are equal. In Grade 10, we will discuss and then prove three theorems relating to parallelograms. PARALLELOGRAMS Statement of theorem Diagrams Theorem 1 The opposite sides and angles of a parallelogram are equal. (opp sides of parm equal) (opp s∠ of parm equal)
If ABCD is a parallelogram (AD||BC and AB||DC)
then AD BC= , AB DC= , ˆ ˆA C= and ˆ ˆB D=
Theorem 1 (Converse) (a) If the opposite sides
of a quadrilateral are equal, then the quadrilateral is a parallelogram.
(opp sides of quad equal)
(b) If the opposite
angles of a quadrilateral are equal, then the quadrilateral is a parallelogram.
(opp s∠ of quad equal)
If AD BC= and AB DC= If ˆ ˆA C= and ˆ ˆB D=
then ABCD is a parm
then ABCD is a parm
Theorem 2 The diagonals of a parallelogram bisect each other. (diags of parm bisect)
If ABCD is a parallelogram
then AE EC= and BE ED=
> >
A
B C
D
> >
A
B C
D
> >
A
B C
D
E

170
Theorem 2 (Converse) If the diagonals of quadrilateral bisect each other, then the quadrilateral is a parallelogram. (diags of quad bisect)
If AE EC= and BE ED=
then ABCD is a parm
Theorem 3 If one pair of opposite sides of a quadrilateral are equal and parallel, then the quadrilateral is a parallelogram. (one pair opp sides equal and ||)
If AD||BC and AD BC=
then ABCD is a parm
The following is information for use in the examples and exercises on parallelograms which follow. The proofs of theorems (excluding the converses) are presented after the basic exercises. If ABCD is a parallelogram, you may assume the following: EXAMPLE 1
DELM is a parallelogram. (a) Calculate the value of x and hence the sizes of the interior angles. (b) If DE 2DM= and ML 10 cm= , determine the length of the other sides of DELM. Solutions
Statement Reason (a) co-int s∠ ; DM||EL
3 180x∴ = ° 60x∴ = ° E 60∴ = ° and M 60= ° opp s∠ of parm equal D 2(60 ) 120= ° = ° L 120= ° opp s∠ of parm equal (b) DE 10 cm= opp sides of parm DM 5 cm∴ = DE 2DM= EL 5 cm∴ = opp sides of parm
2 180x x+ = °
A
B C
D
E
D E
LM
2x x
10 cm
=
= 1 2 2 1 1 2 2 1
AD||BC ; AB||DCAD BC ; AB DCAE EC ; BE ED
ˆ ˆ ˆ ˆˆ ˆ ˆ ˆD B ; D B ; C A ; C Aˆ ˆ ˆ ˆA C ; B D
= == =
= = = =
= =

171
EXAMPLE 2 In the diagram, PQRS is a parallelogram. PT TQR⊥ , PT 5 cm= , TQ 2 cm= and PS 10 cm= . Calculate the length of VR. Solution
Note: In order to prove that a quadrilateral is a parallelogram, you will need to prove at least one of the following: EXAMPLE 3 In trapezium ABCD, AD||BC with ˆ ˆA D 70= = ° and EC DC= . Prove that ABCE is a parallelogram. Solution
Statement Reason QR 10 cm= opp sides of parm equal TQ 2 cm= given
TR 12 cm∴ = PT 5 cm= given
2 2 2PR (5) (12)= + Pythagoras ; ˆPTQ 90= ° 2PR 169=
PR 13 cm∴ = PV VR= diags of parm bisect
VR 6,5 cm∴ =
Statement Reason
2E 70= ° s∠ opp = sides
1C 70= ° alt s∠ ; AD||BC
70° 70°
=
=
A
B C
D
E
AD||BC and AB||DC Opp sides ||AD BC and AB DC Opp sidesAE EC and BE ED Diagonals bisectˆ ˆ ˆ ˆA C and B D Opp angles AB||DC and AB DC One pair opp sides and ||AD||BC and AD BC One pair opp sides and ||
= = == =
= = == == =

172
EXAMPLE 4 Diagonals AC and BD of parallelogram ABCD intersect at M. AP QC= and AC 600 mm= , AB 500 mm= and AP 150 mm= . Prove that PBQD is a parallelogram.
EXERCISE 2 (a) Determine the sizes of the interior angles of parallelogram ABCD. (b) PQRS is a parallelogram with P 60= ° and PQ PS= . Calculate the sizes of 1 1 2
ˆ ˆ ˆR , S , Q , Q and 2S .
(c) KLMN is a parallelogram. Calculate the size of the interior angles. (d) In ABCΔ , A 80= ° and C 35= ° . Calculate the interior angles of parallelogram MENB.
1ˆ ˆA C∴ =
1E 110= ° adj s∠ on a line
B 110= ° co-int s∠ ; AD||BC
1ˆ ˆE B∴ =
Therefore, ABCE is a parallelogram opp s∠ of quad equal
Statement Reason AM MC= diagonals of a parm But AC 600 mm= given
AM MC 300 mm∴ = = AP QC 150 mm= = given PM MQ 150 mm= = Also BM MD= diagonals of parm
PM MQ∴ = and BM MD= PBQD is a parallelogram diags of quad bisect ∴
2 30x − ° 2 10x + °
60°
3 18x + °
5 12x − °

173
(e) In parallelogram ABCD, AB AD= and C 110= ° . Calculate the size of all interior angles.
(f) ABCΔ is an equilateral triangle.
Determine the interior angles of parallelogram LMCN.
(g) ABCD is a parallelogram. AM bisects A .
AB AM= . C 120= ° . Calculate the sizes of all interior angles.
(h) In parallelogram ABCD, AB BE DE= = .
Calculate the size 1D if 1D x= and
1A 28= ° (i) In parallelogram ABCD, AB 50 cm= and
E is a point on AD such that AB AE= and CD DE= . Determine: (1) DE (2) the perimeter of ABCD.
(j) In parallelogram PQRS, Q 114= ° ,
PT bisects P and TS bisects S . Prove that PT ST⊥ .
(k) ABDΔ and BCDΔ are two isosceles
triangles. C 75= ° and ˆADB 30= ° . Prove that ABCD is a parallelogram.
(l) In quadrilateral LMNP, 1E 62= ° , 1P 68= ° ,
2P 56= ° , FP FN= and LE LM= . Prove that: (1 LP||MN (2) LMNP is a parallelogram.
(m) In quadrilateral ABCD, AB 5 cm= , BC 10 cm= , FD 3 cm= , BE FD= and AE FC= . AE BC⊥ and CF AD⊥ Prove that ABCD is a parallelogram.
A D
CB
1 2
1 2M
A D
CB
x
E
12 12
1 2 3
P S
RQT
12 21
1
A
B
D
12
12
C
A
B
D
CE
F
5 cm
3 cm
10 cm

174
(n) ABCΔ is an equilateral triangle. D, E and F are the midpoints of the sides of the triangle and DE||BFC . Prove that DECF is a parallelogram. (o) In the diagram, BCDF, EDCF and ABCF are parallelograms. BC 4 units= and CD 6 units= . Prove that ABDE is a parallelogram. PROOFS OF THEOREMS THEOREM 1 The opposite sides and angles of a parallelogram are equal.
Required to prove: ˆ ˆ ˆ ˆAB CD ; AD BC ; A C ; B D= = = = Proof Draw parallelogram ABCD and join the diagonals AC and BD. In ABCΔ and CDAΔ : (a) 2 1
ˆ ˆA C= alt s∠ ; AB||DC (b) 1 2
ˆ ˆA C= alt s∠ ; AD||BC (c) AC AC= common side
ABC CDA∴ Δ ≡ Δ SAA AB CD∴ = and AD BC=
Also ˆ ˆB D= Similarly, it can be proved that ABD CDBΔ ≡ Δ
ˆ ˆA C∴ =
THEOREM 2 The diagonals of a parallelogram bisect each other. Required to prove: AE EC= and BE ED= Proof Draw parallelogram ABCD and join the diagonals AC and BD. In ABEΔ and CDEΔ : (a) 2 1
ˆ ˆA C= alt s∠ ; AB||DC (b) 1 2
ˆ ˆB D= alt s∠ ; AB||DC (c) AB DC= opp sides of a parm
ABE CDE∴ Δ ≡ Δ SAA BE ED∴ = and AE EC=
A
B
D E
F C
12
3
12 3
1 2 3

175
THEOREM 3 If one pair of opposite sides of a quadrilateral are equal and parallel, then the quadrilateral is a parallelogram. Required to prove: ABCD is a parallelogram Proof: In ABCΔ and CDAΔ : (a) 1 2
ˆ ˆA C= alt s∠ ; AD||BC (b) AC AC= common side (c) AD BC= given
ABC CDA∴ Δ ≡ Δ SAS
2 1ˆ ˆA C∴ = AB||DC∴ alt s∠ =
∴ABCD is a parallelogram since the opposite sides are parallel EXAMPLE 5 ABCD is a parallelogram with ED BF= . Prove that BEFD is a parallelogram.
Solution
EXERCISE 3
(a) Parallelograms ABCD and ABDE are given with DF DB= .
Prove that BCFE is a parallelogram. (b) ABCD is a parallelogram. DM BP= and DC BN= . Prove that:
(1) APNM is a parallelogram. (2) PN MC=
(c) PQRS is a parallelogram. PR and QS intersect at T. QT RM and SM PT= = . Prove that: (1) RTSM is a parallelogram. (2) QR RN= [Hint: Prove PQR SRNΔ ≡ Δ ]
Statement Reason AD||BC opp sides of parm parallel
AED and BFC are straight lines and ED BF= given ∴BEFD is a parm one pair of opp sides equal and parallel
ED||BF∴

176
(d) ABCD is a parallelogram with AE FC= . Prove that BEDF is a parallelogram.
(e) BCDE and ABCG are parallelograms.
Prove that ABGE is a parallelogram. (f) AC and DB are diagonals of quadrilateral
ABCD. AO OC= and BO OD= . Prove: (1) AOD COBΔ ≡ Δ (2) AOB CODΔ ≡ Δ (3) ABCD is a parallelogram in two different ways. RECTANGLES, RHOMBUSES, SQUARES, TRAPEZIUMS AND KITES The following is information for use in the exercise which follows. This exercise involves the properties of rectangles, rhombuses, squares, trapeziums and kites. Familiarise yourself with the properties of these quadrilaterals before attempting the exercise. RECTANGLE If ABCD is a rectangle, you may assume the following properties: In order to prove that a quadrilateral is a rectangle, you will need to prove one of the following: (a) The quadrilateral is a parallelogram with at least one interior angle equal to 90° . (b) The diagonals of the quadrilateral are equal in length and bisect each other. RHOMBUS If ABCD is a rhombus, you may assume the following properties:
A
B C
D
E
121
2
1 21
2
==
1 2 2 1 1 2 2 1
AD||BC ; AB||DCAD BC ; AB DCAE EC BE ED
ˆ ˆ ˆ ˆˆ ˆ ˆ ˆD B ; D B ; C A ; C Aˆ ˆ ˆ ˆA C B D 90
= == = =
= = = =
= = = = °
> >
A
B C
D
E
12 12
12
12
=
=
1
1 2 1 2
1 2 1 2
1
AD||BC ; AB||DCAD BC AB DCAE EC ; BE EDˆ ˆ ˆ ˆD D B Bˆ ˆ ˆ ˆ ˆ ˆ ˆ ˆA A C C ; A C ; B D
E 90 ; AC BD
= = == =
= = =
= = = = =
= ° ⊥
=
=

177
In order to prove that a quadrilateral is a rhombus, you will need to prove one of the following: (a) The quadrilateral is a parallelogram with a pair of adjacent sides equal. (b) The quadrilateral is a parallelogram in which the diagonals bisect at right angles. SQUARE If ABCD is a square, you may assume the following properties:
In order to prove that a quadrilateral is a square, you will need to prove one of the following: (a) The quadrilateral is a parallelogram with an interior right angle and a pair of adjacent
sides equal. (b) The quadrilateral is a rhombus with an interior right angle. (c) The quadrilateral is a rhombus with equal diagonals. TRAPEZIUM If ABCD is a trapezium, you may assume the following properties:
In order to prove that a quadrilateral is a trapezium, you will need to prove that AD||BC. KITE If ABCD is a kite, you may assume the following properties: In order to prove that a quadrilateral is a kite, you will need to prove that the pairs of adjacent sides are equal in length.
A
B C
D
E
12 12
12
12
=
1 =
=
=
45°45°
45°45°
45°45°45°
45°
> >>>
>>
1 2 1 2 1 2 1 2
1
AD||BC ; AB||DCAD BC AB DCAE EC BE ED
ˆ ˆ ˆ ˆˆ ˆ ˆ ˆD D B B A A C C 45ˆ ˆ ˆ ˆA C B D 90
E 90 ; AC BD
= = == = =
= = = = = = = = °
= = = = °
= ° ⊥
2 2 1 2
AD||BCˆ ˆ ˆ ˆA C ; D B= =
1 2
1 2
2
AB ADBC DCBE EDˆ ˆA Aˆ ˆC Cˆ ˆB D
E 90AC BD
===
=
=
=
= °⊥

178
EXAMPLE 6 ABCD is a parallelogram. BH bisects ˆABC and HC bisects ˆBCD .
ˆABC 60 .= ° F 120= ° , BH||GC and BG||HC. AD is produced to E such that AB DE 30 cm= = . BC is produced to F. Prove that: (a) BGCH is a rectangle. (b) DCFE is a rhombus.
Solutions
Statement Reason (a) BCGH is a parallelogram BH||GC and BG||HC ; given ˆABC 60= ° given 1 2
ˆ ˆB B 30∴ = = ° BH bisects ˆABC ˆBCD 120= ° co-int s∠ ; AB||DC 1 2
ˆ ˆC C 60∴ = = ° HC bisects ˆBCD 2H 90∴ = ° int s∠ of Δ
∴BGCH is a rectangle BGCH is a parm with an interior 90∠ = ° (b) F 120= ° given 1 2
ˆ ˆC C 120+ = ° proved
1 2ˆ ˆF C C∴ = +
DC||EF∴ corr s∠ = AD||BC ABCD is a parallelogram ADE and BCE are straight lines given DE||CF∴ ∴DCFE is a parallelogram opp sides || DC 30 cm= opp sides of parm DC DE 30 cm= = ∴DCFE is a rhombus DCFE is a parm with adjacent sides equal
30°30° 60°
60°90°
120°

179
EXERCISE 4
(a) PQRS is a rhombus with 2S 35= ° . Calculate the size of all other interior angles.
(b) Diagonals AC and BD intersect at E. ABCD is a rectangle with AC 10 cm= and BC 8 cm= . 2D 20= ° . Calculate the following:
1 2 1 2 1 2 1ˆ ˆ ˆ ˆˆ ˆ ˆA ; A ; B ; B ; C ; C ; D , AD, AE and AB.
(c) ABCD is a square. ˆAEB 55= ° . Calculate 1F . (d) In rhombus PQRS, PQ 26 cm= and QS 48 cm= . Calculate the length of PR. (e) In rectangle ABCD, AB 3x= and BC 4x= . Find the length of AC and BD in terms of x. (f) The diagonals of parallelogram
LMNP intersect at T. LT LM= and ˆMTN 120= ° .
Prove that LMNP is a rectangle. (g) ABCD is a parallelogram. 1B 40= °
and 1C 50= ° . Prove that ABCD is a rhombus.
(h) ABCD is a square. DE DA=
and DF DC= . Prove that ACEF is a square.
20°
3x
4x
B
A
C
1 2
1 2
D
40°
12
12
50°E
12
34
35°

180
(i) In parallelogram PQRS, NR bisects ˆSRQ and NS bisects ˆPSR . SN||RT
and NR||ST. Prove that STRN is a rectangle.
(j) ABCD is a trapezium with AD||BC.
AB AD and BD BC= = . C 80= ° . Determine the unknown angles.
(k) ABCDE is an isosceles trapezium ( ˆ ˆA C= ). BD CD= and C 60= ° . Prove that:
(1) ABDE is a parallelogram. (2) BCDΔ is equilateral.
(l) ABCD is an isosceles trapezium
with A x= , BC BP= and AB DB= . Prove that:
(1) P x= (2) ABD PDBΔ ≡ Δ
(m) ABCD is a kite. The diagonals intersect at E.
BD 30 cm= , AD 17 cm= and DC 25 cm= .
Determine: (1) AE (2) AC (3) 1B if 1A 20= ° (n) Circle centre M intersects circle
centre N at C and D. Prove that: (1) MDNC is a kite. (2) ˆ ˆMCN MDN= by using
congruency.
BA C1 2
D
60°
12
E
B
A
C
D
80°
a
b
c
d
e

181
MORE ON POLYGONS A regular polygon is a polygon in which all the sides are equal in length and all the interior angles are equal in size. Equilateral triangles and squares are regular polygons since their sides and angles are equal. Pentagons, hexagons and octagons can be regular polygons if their interior angles and sides are equal. It is important to note a rhombus is not a regular polygon since its interior angles are not all equal. A rectangle is not a regular polygon since its sides are not equal in length. Polygons that are not regular are called irregular polygons.
The formula for calculating the sum of the interior angles of a polygon of n sides is given by the formula: 180 ( 2)n° −
The size of an interior angle of a regular polygon is given by the formula: 180 ( 2)nn
° −
Here are the regular polygons.
Polygon Regular polygon Interior angles 3 sides
Equilateral Triangle
The sum of the interior angles:
The size of an interior angle:
4 sides
Square
The sum of the interior angles:
The size of an interior angle:
5 sides
Pentagon
The sum of the interior angles: .
The size of an interior angle:
The five triangles in the pentagon are congruent isosceles triangles. The five angles at the centre each equal 72° since 72 5 360°× = ° . The base angles of each triangle all equal 54° .
6 sides
Hexagon
The sum of the interior angles: .
The size of an interior angle:
The six triangles in the hexagon are congruent equilateral triangles. The six angles at the centre each equal 60° since 60 6 360°× = ° .
180 (3 2) 180° − = °
180 (3 2) 603
° − = °
180 (4 2) 360° − = °
180 (4 2) 904
° − = °
180 (5 2) 540° − = °
180 (5 2) 1085
° − = °
180 (6 2) 720° − = °
180 (6 2) 1206
° − = °
60°
60° 60°
54°
72°
54°54°54°
54°54°
54°54°
54°54°
72°72°
72°72°
108°108°
108° 108°108°
120° 120°
120°120°
120°120°60° 60°
60°60°
60°60°
60°
60°
60°60°
60°
60°60° 60°
60°60° 60°
60°

182
8 sides
Octagon
The sum of the interior angles: 180 (8 2) 1 080° − = ° . The size of an interior angle:
The eight triangles in the octagon are congruent isosceles triangles. The eight angles at the centre each equal 45° since 45 8 360°× = ° . The base angles of each triangle all equal 67,5° .
Note:
Scalene and isosceles triangles, rectangles, kites and trapeziums are irregular polygons since their sides are not equal in length. Rhombuses are irregular polygons since their interior angles are not equal. EXERCISE 5 (a) ABCD is a polygon with four sides. (1) Calculate the value of x. (2) Hence show that ABCD is a
trapezium. (b) ABCD is a pentagon made up of five equal
sides and five equal interior angles. Calculate the size of ,θ β and α .
(c) In polygon ABCDE, C 90= ° , BC CD=
and ABDE is a parallelogram. Use TWO different methods to
determine the value of x. (d) Using the information provided on
the diagram, determine β .
180 (8 2) 1358
° − = °
135° 135°
135°135°
135°
135°
135°
135°
67,5° 67,5°
67,5°
67,5°67,5°
67,5°
67,5°
67,5°
67,5°
67,5°
67,5°67,5°67,5°
67,5°67,5°
67,5°
45°45°
45°45°
45°45°
45°45°
60°
θ
β
θ113°
132°
2x −
4 2x +8 2x +
5 2x −
A
B
C D
Eθ
βα
12

183
THE MIDPOINT THEOREM IN A TRIANGLE The Midpoint Theorem can be stated in the following two ways:
If AD DB= and AE EC= , If AD DB= and DE||BC,
then DE||BC and 1DE BC2
= then AE EC= and 1DE BC2
= .
EXAMPLE 7 In ABCΔ , AD DB= and AE EC= . DE is produced to F. DB||FC and BC 32 mm= . (a) Prove that DBCF is a parallelogram.
(b) Calculate the length of DE. Solutions
Statement Reason (a) AD DB and AE EC= = given DE||BC∴ midpoint theorem But DEF is a straight line DE is produced to F DF||BC∴ But DB||FC given ∴DBCF is a parallelogram opposite sides parallel (b) BC 32 mm= given DE 16 mm∴ = midpoint theorem

184
EXERCISE 6 (a) In ACDΔ , AB BC= , GE 15 cm= , AF FE ED= = .
Calculate the length of CE. (b) In ABCΔ , AE EB= and EF||BC.
In ACDΔ , FG||CD. Prove that AG GD= . (c) In DEFΔ , DS SE= , EU EF= and ST||EF.
Prove that SEUT is a parallelogram. (d) PQRS is a kite. A and B are the midpoints
of PQ and PS respectively. QD DR= and SC CR= . Let AB x= Prove that ABCD is a parallelogram CONSOLIDATION AND EXTENSION EXERCISE (a) In PQRΔ , PQ PR= and STRE is a parallelogram. Q x= and ˆP 2Q= . Calculate the sizes of the angles of STRE. (b) ABCD is a parallelogram. FD DC= and DE 2DO= . DO x= . Prove that BCEF is a parallelogram.

185
(c) ABCD is a parallelogram. BE AC⊥ and DF AC⊥ . Prove that EBFD is a parallelogram. (d) PQRS is a square. The diagonals intersect
at E. PA BS= . Prove that AEBΔ is an isosceles triangle.
(e) PQTΔ is inscribed in a circle. AO||QR, PA AQ= and PB BT= . Prove that: (1) AB||QT (2) O is the centre of the circle if PR is a diameter. (3) BORT is a trapezium. (f) FDCE is a parallelogram. CE is produced to A such that CE EA= and CD DB= .
Prove that BDF FEAΔ ≡ Δ
(g) ABCD is a rhombus. Diagonals intersect at E. EF FA= and EG GA= . Prove that AGEF is a rhombus.

186
(h) PQRS is a parallelogram. PQ PE ,= QE QR= , ER SR= and ˆPQE x= . Calculate the size of ˆQER . (i) ABCD is a rhombus. ˆDEC 3y= and C y= . Prove that EC bisects ˆACD . (j) LMNP is a square. LE EM= and
MF FN= . 1L x= . Prove that: (a) LMF PLEΔ ≡ Δ (b) 1G 90= °
(k) AFCE is a parallelogram. AB||DC and AF||BD. ˆF FAB x= = and FB BC= .
Prove that:
(1) ABCD is a rhombus
(2) 1A 90 x= ° − (l) ABCD is a trapezium, ABGH is a square, AG||DJ and 2 1
ˆB G= . Prove that:
(1) AEFD is a rectangle
(2) BGJC is a trapezium
3y
y

187
(m) PSRQ is a square. Diagonal PR and line SVT intersect at V and 2S 40= °
(1) Calculate 1V
(2) Prove that PR 2PS
=
(n) ABCD is a parallelogram with AE ED= and AD a= . GE EF BG r= = = and AB b= .
2 21DF 42
r a= −
(1) Prove that ABCD is a rectangle. (2) Express AG in terms of b and r.
(3) Prove that 2 24
8a br
b+=
(o) In the diagram, BCDE is a rhombus. The diagonals intersect at O and BD is produced to A. AE is joined. AE ED⊥
Prove that:
(1) 2 2 2AE 2a ab d= + +
(2) 2 2 2 2AE 4 4a ab b d= + + + (p) ABCD is a parallelogram. GF FH x= = and AD DE= . ADE is a straight line. Prove that: (1) DECB is a parallelogram. (2) AG 2GF=
(3) 1FH AF3
=
40°

188
CHAPTER 8 ANALYTICAL GEOMETRY Analytical Geometry is the study of Geometry, using the Cartesian plane. It is an algebraic approach to the study of Geometry. In this chapter, we will address the following concepts:
• The distance between two points (length of a line segment). • The midpoint of a line segment. • The gradient of a line.
THE DISTANCE BETWEEN TWO POINTS (LENGTH OF A LINE SEGMENT) Suppose that we wish to calculate the length of line segment AB, with endpoints A( 2 ; 2)− − and B(3 ; 2). Consider the diagram below. The movement from A to B has been indicated. A right-angled triangle ABC is formed, with lengths AC 4= (4 units up) and CB 5= (5 units right). We can generalise this concept to create what is known as the “Distance Formula”.
Consider any two points A A B BA( ; ) and B( ; ).x y x y From the diagram alongside:
B A
B A
BC horizontal movementAC vertical movement
x xy y
= = −= = −
B A B A
2 2 2
2 2 2B A B A
2 2
AB BC AC Pythagoras
AB =( ) ( )
AB ( ) ( )
x x y y
x x y y
∴ = +
∴ − + −
∴ = − + −
The formula to calculate the length of a line segment between points A and B, with A A B BA( ; ) and B( ; ),x y x y is:
B A B A2 2 2AB ( ) ( )x x y y= − + − or B A B A
2 2AB ( ) ( )x x y y= − + −
4 units up
5 units right B(3 ; 2)
A( 2 ; 2)− −
C
x
y
2 2 2
2 2 2
2 2 2
The theorem of Pythgoras can now be used to calculate the length of AB:
AB BC ACAB (horizontal movement) (vertical movement)AB 5 4 41
AB 41 6, 40
∴ = +∴ = +∴ = + =
∴ = ≈
B BB( ; )x y
A AA( ; )x y
A BC( ; )x y
x
y

189
EXAMPLE 1 Calculate the lengths of line segments AB and CD in the given diagram. Solutions
(a) B A B A2 2 2AB ( ) ( )x x y y= − + − (b) D C D C
2 2 2CD ( ) ( )x x y y= − + −
2 2 2
2 2 2
2
AB (5 2) (7 3)
AB (3) (4)
AB 25
AB 25 5 units
= − + −
= +
=
= =
2 2 2
2 2 2
2
CD ( 2 ( 5)) (1 6)
CD (3) ( 5)
CD 34
CD 34 5,83 units
= − − − + −
= + −
=
= ≈
APPLICATIONS OF THE DISTANCE FORMULA EXAMPLE 2 In the diagram, the vertices of ABCΔ are A(2 ; 3) , B(5 ; 7) and C( 2 ; 6).− (a) Show that ABCΔ is an isosceles triangle.
(b) Calculate the perimeter of ABCΔ correct to one decimal place.
Solutions
(a) We can show that ABCΔ is an isosceles triangle by proving two sides equal. From the diagram above, the obvious choice is to prove that AB AC= .
B A B A C A C A2 2 2 2 2 2
2 2 2 2 2 2
2 2
AB ( ) ( ) AC ( ) ( )
AB (5 2) (7 3) AC ( 2 2) (6 3)
AB 25 AC 25
AB 25 5 units AC 25 5 unitsAB AC
x x y y x x y y= − + − = − + −
= − + − = − − + −
= =
= = = =∴ =
(b) The perimeter of ABCΔ is the sum of its three sides: C B C B
2 2 2BC ( ) ( )x x y y= − + − 2 2 2
2
BC ( 2 5) (6 7)
BC 50
BC 50
= − − + −
=
=
Perimeter AB AC BC= + + Perimeter 5 5 50 17,071... 17,1 units∴ = + + = ≈
A(2 ; 3)
B(5 ; 7)C( 5 ; 6)−
D( 2 ;1)−
A(2 ; 3)
B(5 ; 7)C( 2 ; 6)−

190
EXAMPLE 3 Calculate the possible values of k, if the distance between A and B is 5 units, where A(2 ; 5)and B( 1; ).k− Solution
B B A2 2 2
A2 2 2
2
2
AB ( ) ( ) , with AB 5
5 ( 1 2) ( 5) [substitute into the distance formula]
25 9 10 25 [quadratic equation]
0 10 9 [solve by getting one side 0]0 ( 9)( 1)
9 or 1
x x y y
k
k k
k kk k
k k
= − + − =
∴ = − − + −
∴ = + − +
∴ = − + =∴ = − −∴ = =
EXAMPLE 4 (a) Show that the point Q( 6 ;1)− is equidistant from the points P( 4 ; 5)− and R( 2 ; 3).− (b) The point T( ;1)x is equidistant from the points A( 2 ; 1)− − and N(1; 2) . Determine
the value of x. Solutions (a) We are required to show that QP QR.=
P Q P Q R Q R Q2 2 2 2 2 2
2 2 2 2 2 2
2 2
QP ( ) ( ) QR ( ) ( )
QP ( 4 ( 6)) (5 1) QR ( 2 ( 6)) (3 1)
QP 20 QR 20
QP 20 QR 20QP QR and Q is therefore equidistant from P and R.
x x y y x x y y= − + − = − + −
= − − − + − = − − − + −
= =
= =∴ =
(b) It is given that TA TN= . Therefore 2 2TA TN .=
A T A T N T N T2 2 2 2
2 2 2 2
2 2
( ) ( ) ( ) ( )
( 2 ) ( 1 1) (1 ) (2 1)
4 4 4 1 2 16 6
1
x x y y x x y y
x x
x x x xx
x
∴ − + − = − + −
∴ − − + − − = − + −
∴ + + + = − + +∴ = −∴ = −
EXERCISE 1 (a) Calculate the lengths of the line segments in the given diagram.
A(2 ; 3)
B(5 ;1)C( 5 ;1)−
D( 1; 4)−
E( 5 ; 2)− −
F(2 ;1)
G(1; 1)−
H(5 ; 4)−

191
(b) In the given diagram, two triangles have been drawn. (1) Show that ABCΔ is an isosceles triangle. (2) Determine the perimeter of ABD.Δ
(c) Show that C(2 ; 3) is equidistant from the points A(3 ; 6) and B( 1; 4)− . (d) C is the point (1; 2).− The point D lies in the second quadrant and has coordinates
( ; 5).x If the length of CD is 53 units, determine the value of x. (e) Given the points P( 3 ; 2), Q(2 ; 7) and R( 10 ; ).y− − Determine the values of y if P is
equidistant from Q and R. THE MIDPOINT OF A LINE SEGMENT The midpoint of a line segment is the halfway mark on the line segment. Consider the numbers 1 and 7 for example. Halfway between 1 and 7 is 4. How do we get to 4? One way is to take the difference between 1 and 7 (which is 6), half that (which is 3), and then add this 3 to the 1 to get to 4. (You could also subtract 3 from 7 to get to 4). The diagram on the right illustrates this approach.
A quicker approach is to add the two end values and then divide the answer by 2. This is basically working out the average of the two end values. If we apply this concept to a line segment joining two points on the Cartesian plane, we can easily find the midpoint of the line segment by calculating the average of the x-values and the average of the y-values.
( )M M
A B A BM M
M( ; ) M average of the -values ; average of the -values
M( ; ) M ;2 2
x y x y
x x y yx y
=
+ + ∴ =
The formula to calculate the midpoint of a line segment between points A and B,
with A A B BA( ; ) and B( ; ),x y x y is: A B A BM MM( ; ) M ;
2 2x x y yx y + + =
1 74
7 1 8 42 2+ = =
6 units
3 units 3 units
1 74
A(2 ; 6)
B( 2 ; 3)−
C( 5 ; 7)−
D(5 ; 0)
A AA( ; )x y
B BB( ; )x y
M MM( ; )x y

192
EXAMPLE 5 Determine the coordinates of M, if M is the midpoint of line segment AB, where A(2 ;1) and B(8 ; 3) . Solution
A B A BM ;2 2
2 8 1 3= M ;2 2
= M(5 ; 2)
x x y y+ +
+ +
EXAMPLE 6 Calculate the midpoints of line segments AB and CD in the given sketch. Solutions Midpoint of AB is M:
A B A BM MM( ; ) M ;
2 21 5 3 7M ;
2 2M(3 ; 5)
x x y yx y + + =
+ + ∴
∴
Midpoint of CD is N:
C D C DN NN( ; ) N ;
2 25 ( 1) 6 2N ;
2 2N( 3 ; 4)
x x y yx y + + =
− + − + ∴
∴ −
APPLICATIONS OF THE MIDPOINT FORMULA EXAMPLE 7 Determine the values of x and y if M(5 ; 2) is the midpoint of the line segment joining the points A( ;1)x and B(8 ; )y . Solution
A B A BM M2 2
8 15 22 2
10 8 4 12 3
x x y yx y
x y
x yx y
+ += =
+ +∴ = ∴ =
∴ = + ∴ = +∴ = ∴ =
A(2 ;1)
B(8 ; 3)M
A(1; 3)
B(5 ; 7)C( 5 ; 6)−
D( 1; 2)−
MN
A( ;1)x
B(8 ; )yM(5 ; 2)

193
EXAMPLE 8 The following sketch shows parallelogram ABCD, with P the point where the diagonals intersect. (a) Determine the coordinates of P, giving a reason. (b) Determine the coordinates of D. Solutions (a) P is the midpoint of both AC and BD, because the diagonals of a parallelogram bisect
each other. A C A C
P PP( ; ) P ;2 2
1 2 3 1P ;2 2
1P ; 22
x x y yx y + + =
− + + ∴ ∴
(b) B D B DP PP( ; ) P ;
2 2x x y yx y + + =
B D B DP P
D D
D D
D D
and 2 2
4 11 and 22 2 21 4 and 4 1
5 and 5D(5 ; 5)
x x y yx y
x y
x yx y
+ +∴ = =
− + − +∴ = =
∴ = − + = − +∴ = =∴
EXERCISE 2
(a) Determine the midpoints of the given line segments. Use the midpoint formula. (b) A circle has diameter AB with endpoints A( 1; 4)− and B(5 ; 2).−
(1) Determine the centre of the circle.
(2) Determine the radius of the circle.
A( 1; 3)−
x
y D
C(2 ;1)
B( 4 ; 1)− −
P
A(2 ; 3)
x
yD( 1; 3)−
C( 5 ;1)− B(6 ;1)
G(1; 1)−
H(5 ; 4)−
F(2 ;1)
E( 5 ; 2)− −

194
(c) Answer the following questions. You may want to draw a diagram to help you visualise the scenario. (1) If M( 3 ; 2)− is the midpoint of the line segment joining the points
A( ;1)x and B( 1; )y− , calculate the values of x and y. (2) If M( 1; 7)− is the midpoint of the line segment joining the points
A( ; 6)x and B(2 ; )y , calculate the values of x and y. (3) If M( 1; 5)− − is the midpoint of the line segment joining the points
A( ; )x y and B( 6 ; 3)− − , calculate the values of x and y. (d) Given below is rhombus FINE. Q is the point where the diagonals intersect. Determine the coordinates of F. (e) A( 2 ; 3), B( ; ), C(1; 4) and D( 1; 2)x y− − are the vertices of a quadrilateral. Find
B( ; )x y if ABCD is a parallelogram. THE GRADIENT OF A LINE SEGMENT Gradient (or slope) measures the steepness and direction of a line. A line can either slant up (gradient is positive), slant down (gradient is negative), be horizontal (gradient is zero) or be vertical (gradient is undefined). The symbol used for gradient is m. In Grade 9 we calculated the gradient of a line using the concept of “rise over run”. In other
words: change in -values vertical movementGradientchange in -values horizontal movement
yx
= = .
This can easily be translated into a formula. For any two points A AA( ; )x y and B BB( ; )x y : B A B AVertical movement and Horizontal movement .y y x x= − = −
B BB( ; )x y
A AA( ; )x y
x
y
veri
cal m
ovem
ent
horizontal movement
F
x
y E(3 ; 4)
N(8 ; 1)−I(1; 2)−
Q

195
A formula to calculate the gradient of a line joining two points A and B, with
A A B BA( ; ) and B( ; ),x y x y is: B AAB
B A
y ymx x
−=−
EXAMPLE 9 Calculate the gradients of the following lines using the formula for gradient. Solutions
B AAB
B A
1 3 2 1 (slopes down from left to right)6 2 4 2
y ymx x
− − −= = = = −− −
D CCD
D C
3 1 2 1 (slopes up from left to right)1 ( 5) 4 2
y ymx x
− −= = = =− − − −
F EEF
F E
1 ( 2) 3 (slopes up from left to right)2 ( 5) 7
y ymx x
− − −= = =− − −
H GGH
H G
4 ( 1) 3 3 (slopes down from left to right)5 1 4 4
y ymx x
− − − − −= = = = −− −
GRADIENTS OF HORIZONTAL AND VERTICAL LINES Between any two points on a horizontal line there is no vertical movement (the vertical movement is zero). Thers is only a horizontal movement.
The gradient of a horizontal line is always zero.
horizontal linechange in values 0gradient 0.change in values horizontal movement
yx
∴ = = =
Between any two points on a vertical line there is no horizontal movement (the horizontal movement is zero). There is only a vertical movement.
The gradient of a vertical line is always undefined.
vertical linechange in values vertical movementgradient which is undefined.change in values 0
yx
∴ = =
A(2 ; 3)
x
yD( 1; 3)−
C( 5 ;1)− B(6 ;1)
G(1; 1)−
H(5 ; 4)−
F(2 ;1)
E( 5 ; 2)− −

196
APPLICATIONS OF GRADIENT Parallel lines Parallel lines slope in the exactly the same direction and will therefore never intersect. Differently stated: Lines that are parallel have equal gradients. For any pair of parallel lines AB and CD: AB CDm m= EXAMPLE 10 Given are the points A( 1; 5), B( 2 ; 3), C(9 ;10) and D(5 ; 2).− − Show that AB||CD. Solution
B AAB
B A
3 5 2 2 22 ( 1) 2 1 1
y ymx x
− − − −= = = = =− − − − − + −
D CCD
D C
2 10 8 25 9 4
y ymx x
− − −= = = =− − −
AB CDm m∴ = ∴AB||CD Collinear points Points are said to be collinear when they lie on the same line. Refer to the diagram. A, B and C lie on the same line and are therefore collinear. This implies that the gradients between each pair of points are the same.
A( 5 ; 1)− −
x
y
B(3 ; 5)
C( 3 ; 4)− −
D(5 ; 2)
3 3
4 4
A( 5 ; 3)− −
x
y
B( 2 ; 1)− −
C(4 ; 3)
4
2
6
3 . 6
9

197
When points A, B and C are collinear: AB AC BCm m m= = In other words: AB ACm m= and AB BCm m= and AC BCm m= EXAMPLE 11 Show that the points A, B and C are collinear if the coordinates of the points are: A(2 ; 2), B(1;1)− and C( 1; 7)− .
Solution We will consider the gradients of AB and BC, but any other pair could have been used.
C BB AAB BC
B A C B
AB BC
1 ( 2) 3 7 1 63 and 31 2 1 1 1 2
y yy ym mx x x x
m m
−− − − −= = = = − = = = = −− − − − − − −
∴ =
Therefore A, B and C are collinear. Perpendicular lines Perpendicular lines intersect at a 90° angle. The gradients of perpendicular lines have a particular property. Consider the diagram on the right. Firstly: The gradients of the lines have opposite signs. AB has a positive gradient whereas CD has a negative gradient. Secondly: The gradients (ignoring signs) are reciprocals of one another. In other words, the horizontal movement of AB is the vertical movement of CD and vice versa. This can be summarised by the following relationship: The product of the gradients of AB and CD will equal 1− when AB is perpendicular to CD.
For any pair of perpendicular lines AB and CD: AB CD 1m m× = −
EXAMPLE 12 Given are the points A(3 ; 3), B(6 ; 7), C( 5 ; 0) and D( 1; 3).− − − − Show that AB is perpendicular to CD. Solution
B AAB
B A
7 ( 3) 7 3 46 3 3 3
y ymx x
− − − − − + −= = = =− −
D CCD
D C
3 0 3 31 ( 5) 1 5 4
y ymx x
− −= = = =− − − − − +
AB CD4 3 1
3 4m m −∴ × = × = −
∴ AB CD⊥
A( 5 ; 1)− −
x
y
B(3 ; 5)
C(2 ; 2)−
D( 4 ; 6)−
3
4
4
3

198
EXAMPLE 13 In the diagram, ABCD is a rhombus. F is the point where the diagonals intersect. (a) Determine the value of q. (b) Calculate the area of CFDΔ . (c) What is the area of the rhombus?
Solutions
(a) AC BD⊥ because the diagonals of a rhombus are perpendicular to each other.
AC BD FC FD
C F D FFC FD
C F D F
FD
1 which implies that 13 ( 1) ( 1) 12 and 3 2 4 2 6
1 1But ( 2 1)2 2
1 16 2
2 2 6 cross multiplication4
m m m my y y y q qm mx x x x
m
q
∴ × = − × = −− −− − − − − +∴ = = = − = = =− − − − − −
∴ = − × = −
+∴ =−
∴ + = −∴ = −
(b) 1 1Area of CFD (FD)(FC)2 2
b hΔ = × =
D F D F C F C F2 2 2 2 2 2
2 2 2 2 2 2
2 2
2
FD ( ) ( ) FC ( ) ( )
FD ( 4 2) ( 4 ( 1)) FC (3 2) ( 3 ( 1))
FD 45 FC 5
FD 45 FC 51 1Area of CFD (FD)(FC) ( 45)( 5) 7,5 units2 2
x x y y x x y y= − + − = − + −
= − − + − − − = − + − − −
= =
= =
∴ Δ = = =
(c) 2Area of Rhombus 4 7,5 30 units= × = EXERCISE 3
(a) Calculate the gradients of the lines joining the following points. (1) A(1; 3) and B(5 ; 7) (2) A(1; 3) and B( 5 ; 7)− − (3) A( 1; 3) and B( 5 ; 7)− − − − (4) A( 1; 3) and B(5 ; 7)− − (b) Calculate the gradients of the line segments in the given diagram.
x
y
AB
D( 4 ; )q−
C(3 ; 3)−
F(2 ; 1)−
A(2 ; 3)
x
y D(1; 4)
C( 6 ; 1)− −
B(4 ; 3)−
G( 2 ; 1)− −
H(5 ; 1)−
F( 1; 3)− −
E( 1;1)−

199
(c) Determine whether line segments AB and CD are parallel, perpendicular or neither, in each of the following cases.
(1) A( 1; 3), B(2 ;1)− − and C(4 ; 1), D(7 ; 3)− . (2) A(1; 3), B(2 ;1)− and C(4 ; 1), D(7 ; 3)−
(3) A(1; 3), B(2 ;1)− and C( 3 ;1), D(1; 0)− (d) (1) Line segment AB is parallel to line segment CD. A( 5 ; 1)− − and
B( 3 ; )a− are points on AB. C( 4 ; 3) and D( 1; 3)− − − are points on CD. Calculate the value of a.
(2) Line segment AB is perpendicular to line segment CD. A( 5 ; 2)− and B( ; 1)b − are points on AB. C( 4 ; 3)− − and D( 1; 3)− are points on CD. Calculate the value of b.
(e) Show that points F, R and N are collinear if F(3 ; 2), R(4 ; 2) and N(7 ; 14).− − (f) Calculate the value(s) of x if R ,( ; 4), U( 1; 4) and N(0 ;13)x x x− + are collinear. (g) A(3 ; 4), B( 1; 7), C( ; 1)x− − and D(1; 8) are points on the Cartesian plane.
Calculate the value of x in each case if: (1) AB||CD (2) AB CD⊥ (3) B, C and D are collinear
(h) Determine the x-intercept A, and the y-intercept B of lines LI and VE respectively. (i) Rhombus ABCD is drawn with A( 1; 2) and C(3 ; 4).− −
Determine the gradient of BD. (j) In the diagram below, a circle with centre P is drawn. A, B and C are points on the circle, with AC the diameter. (1) Determine the length of the radius. (2) Determine the coordinates of P. (3) Show that AB BC⊥ .
(4) Hence determine the area of ABC.Δ
L( 6 ; 5)−
I(8 ; 2)−V( 4 ; 3)− −
E(1; 7)
x
y
A
B
A(4 ; 3)B( 1; 2)−
C( 2 ; 7)−
P( ; )a b
x
y
.
B
D
C(3; 4)
A( 1; 2)− −

200
MORE ON QUADRILATERALS We will now discuss some of the most effective ways to show that a quadrilateral is a parallelogram, rhombus, rectangle or square, using the methods of Analytical Geometry. Proving that a quadrilateral is a parallelogram If the diagonals of a quadrilateral bisect each other, then the quadrilateral is a parallelogram. To demonstrate this on a Cartesian plane we will show that the diagonals share the same midpoint. EXAMPLE 14 Quadrilateral TIME is drawn on the Cartesian plane. Prove that it is a parallelogram. Solution
E I E IMidpoint of IE: ;2 2
2 5 3 5 ;2 2
3 ;12
x x y y+ +
− + − + = =
M T M TMidpoint of TM: ;2 2
3 0 0 2;2 2
3 ;12
3P ;1 is the midpoint of both diagonals.2
x x y y+ +
+ + = =
∴
Quadrilateral TIME is a parallelogram, because its diagonals bisect each other. Proving that a quadrilateral is a rhombus A rhombus can be defined as a parallelogram in which the adjacent sides are equal, OR as a parallogram in which the diagonals are perpendicular (i.e. a parallelogram in which the diagonals bisect at a 90° angle). The latter will be quicker to prove and will be the approach that we will use. EXAMPLE 15 H(4 ; 0), E( 1 ; 2), A( 3 ; 7) and R(2 ; 5)− − are the vertices of quadrilateral HEAR. (a) Prove that quadrilateral HEAR is a parallelogram. (b) Prove that quadrilateral HEAR is a rhombus.
Take note: Proving that both pairs of opposite sides are parallel, OR that both pairs of opposite sides are equal, OR that one pair of opposite sides are parallel and equal could have also been used.
x
y I(5 ; 5)
E( 2 ; 3)− −
T(0 ; 2)
M(3 ; 0)
P
yA( 3 ; 7)−
E( 1; 2)−
R(2 ; 5)
H(4 ; 0)
M
x

201
Solutions (a) We are required to prove that diagonals HA and ER share the same midpoint.
A H A H E R E RMidpoint of HA: ; Midpoint of ER: ;2 2 2 2
3 4 7 0 1 2 2 5 ; ;2 2 2 2
1 7 1 7 ; ;2 2 2 2
1 7M ; is the midpoint of both diagonals.2 2
x x y y x x y y+ + + +
− + + − + + = = = =
∴
Quadrilateral HEAR is a parallelogram because its diagonals bisect. (b) We are required to prove that the diagonals bisect at a 90° angle. We have already
proven that they bisect. We need to prove that HA ER⊥ , in other words prove that HA ER 1.m m× = −
A H R EHA ER
A H R E
HA ER
0 7 5 21 and 14 ( 3) 2 ( 1)
( 1) (1) 1HA ER
y y y ym mx x x x
m m
− −− −= = = − = = =− − − − − −
∴ × = − × = −∴ ⊥
Quadrilateral HEAR is a rhombus because its diagonals bisect at 90°. Proving that a quadrilateral is a rectangle A rectangle can be defined as a parallelogram of which the diagonals are equal, OR as a parallelogram with one interior angle equal to 90°. The latter will be quicker to prove and will be the approach that we shall use. EXAMPLE 16 Quadrilateral LAND is shown in the given diagram. (a) Prove that quadrilateral LAND is a parallelogram. (b) Prove that quadrilateral LAND is a rectangle. Solutions (a) We are required to prove that diagonals NL and DA share the same midpoint.
N L N L D A D AMidpoint of NL: ; Midpoint of DA: ;2 2 2 2
6 ( 5) 6 3 3 4 0 9 ; ;2 2 2 2
1 9 1 9 ; ;2 2 2 2
x x y y x x y y+ + + +
+ − + − + + = = = =
x
y
L( 5 ; 3)−
N(6 ; 6)
D( 3 ; 0)−
M
A(4 ; 9)

202
1 9M ;2 2
∴
is the midpoint of both diagonals.
Quadrilateral LAND is a parallelogram, because its diagonals bisect each other. (b) We are required to prove that one interior angle of parallelogram LAND is 90°. We
need to prove that LA LD⊥ , in other words prove that LA LD 1.m m× = −
A L D LLA LD
A L D L
LA LD
9 3 2 0 3 3 and 4 ( 5) 3 3 ( 5) 2
2 3 1.3 2
LA LD
y y y ym mx x x x
m m
− −− −= = = = = = −− − − − − − −
∴ × = × − = −
∴ ⊥
Quadrilateral LAND is a rectangle because it is a parallelogram with one interior angle equal to 90°.
Proving that a quadrilateral is a square, trapezium or kite Square Several approaches can be used to prove that a quadrilateral is a square. We will discuss two approaches. First approach: A square is a rhombus with one interior angle 90°.
First prove that the quadrilateral is a rhombus and then prove one interior angle 90°.
Second approach: A square is a rectangle of which the adjacent sides are equal. First prove that the quadrilateral is a rectangle, and then prove one pair of adjacent sides equal.
Trapezium Simply prove that one pair of opposite sides are parallel. Kite Simply prove that two pairs of adjacent sides are equal OR prove that one diagonal is bisected by the other at 90°. EXERCISE 4 (a) Quadrilateral DEFG is formed by the points D( 5 ; 3), E(3 ; 5), F(2 ;1)− and
G( 6 ; 1)− − . Show that DEFG is a parallelogram. (b) Given: A( 4 ; 3), B(3 ; 4), C(8 ; 1) and D(1; 2)− − − . Show that ABCD is a rhombus.
(Hint: First show that it is a parallelogram) (c) Given: A(0 ; 3), B(4 ; 0), C( 2 ; 8) and D( 6 ; 5)− − − . Show that ABCD is a rectangle. (d) M( 3 ; 2), N(3 ; 6), O(9 ; 2) and P(3 ; 6)− − − are the points of quadrilateral MNOP.
Show that: (1) MNOP is a parallelogram. (2) MNOP is not a rectangle. (e) A( 2 ; 3), B( ; ), C(1; 4) and D( 1; 2)x y− − are the vertices of a quadrilateral. Determine
B( ; )x y if ACDB is a parallelogram. Drawing a diagram will be useful.

203
E( 10 ; 5)− −
R(8 ; 6)−
A(2 ;11)
U
A( 3 ; 4)− −
B(4 ; 0)
C(1,5 ; 5)
(f) In the following sketch ABCD is a parallelogram. The diagonals AC and BD intersect in P( 1,5 ; 3).− D is a point on the x-axis. The gradient of BD is 6.
(1) Determine the coordinates of C and D. (2) Use Analytical techniques to determine whether or not ABCD is a rhombus.
CONSOLIDATION AND EXTENSION EXERCISE (a) A(4 ; 3) and B(10 ; 5) are two points on a Cartesian plane. (1) Calculate the length of AB. Round off your answer to one decimal place.
(2) Determine the coordinates of M, the midpoint of AB. (3) Determine the coordinates of P if B is the midpoint of AP.
(b) ABCΔ has coordinates A( 4 ; 2), B(1; 2) and C( 1; 6)− −
(1) Determine the perimeter of ABCΔ (2) What kind of triangle is ABC?Δ (3) Explain why ABCΔ cannot be right-angled. Show all workings.
(c) Points F( 3 ; 4), A(1; ) and N(3 ; 5)b− − are collinear. Determine the value of b. (d) Refer to the diagram alongside.
(1) Determine the gradient of AC. (2) Determine the length of BC
(one decimal place). (3) Determine the coordinates of M,
the midpoint of line AB. (4) Determine the coordinates of D. (5) Show that BD AC⊥ .
(e) Refer to figure alongside. RU doesn’t necessarily go through the origin. U is the midpoint of AE and RU AE⊥ .
(1) Determine the coordinates of U. (2) Determine the gradient of RU. (3) Show that the origin lies on the line RU. (4) Calculate the area of AREΔ .
(f) On the Cartesian plane below M( ;1)a is the midpoint of line AB with A( 2 ; 4)− and B(5 ; )k . Point D lies on the x-axis. The length of MD is 21,25 . This graph is not sketched according to scale.
(1) Determine the values of a and k. (2) Determine the coordinates of D. Show all calculations.
A( 2 ; 4)−
B(5 ; )kD
M( ;1)a
x
y
21, 25
C
x
P
A(3 ; 2)
D
B

204
P( 3 ; 1)− −
R(6 ; 8)
Q( ;1)b x
y
(g) The sketch alongside is a circle with centre V through points S, A and E. (1) Determine the length of the radius of the circle. (2) Determine the coordinates of V. (3) Show that SE SA⊥ .
(h) Use analytical methods to show that PQRS is a parallelogram if P( 3 ; 2)− , Q(3 ; 6) , R(10 ; 1)− and S(4 ; 5)− . (i) L( 1 ; 1)− − , M( 2 ; 4)− , N( ; )x y and P(4 ; 0) are the vertices of parallelogram
LMNP. (1) Determine the coordinates of N. (2) Show that MP LN⊥ and state what type of quadrilateral LMNP is
other than a parallelogram. (3) Show that LMNP is a square. (j) SRQP is a parallelogram. S lies on the y-axis.
Determine the value of b and the coordinates of S. (k) In the diagram below, two circles centres M(2 ; 2) and C respectively are drawn such
that they are tangential (touching) at P. B is a point on the larger circle such that MBC
is a right-angled triangle. If the radius of the smaller circle is 2 with MB 4= units and BC r= .
Determine: (1) the co-ordinates of B. (2) the co-ordinates of C in terms of r. (3) the length of the radius of the larger circle.
E( 7 ;15)−
A(3 ; 9)−
S( 15 ; 3)− V
y
x.
P( 3 ; 2)−
Q(3; 6)
R(10 ; 1)−
S(4 ; 5)−

205
(l) In this Chapter, the gradient of a line using the formula B A
B A
y yx x
−−
was used.
In Chapter 6, you determined the equation of a line given the y-intercept and another point on the line. The coefficient of x in the equation y ax q= + represents the
gradient or slope of the line and q represents the y-intercept. Use this information to determine the equation of each of the following lines. (1) (2)
A( 4 ; 1)− −
B(1; 4) A( 7 ; 2)−
B( 2 ; 3)− −

206
CHAPTER 9 FINANCIAL MATHEMATICS
In any financial situation in the real-world, the interest rate is the percentage charged, or paid, for the use of money. It is charged when money is being borrowed, and paid when it is being loaned. The function of banks is to grant loans or hold deposits. Banks convince people to make deposits by paying interest to them. They are paying depositors for the right to use their money. They then use that money to grant loans. The interest rate for borrowers is higher than the interest rate for depositors. Banks want to charge as much interest as possible on loans, and pay as little as possible on deposits, so they can be more profitable. There are two main types of interest rates that you were introduced to in previous grades: simple interest and compound interest. If interest is calculated using only the original amount of money saved or borrowed, then it is called simple interest. Simple interest is used for short-term loans (hire-purchase accounts) and investments. If interest is calculated on the original sum plus interest already earned, then it is called compound interest. Compound interest is used with long-term loans and investments. Saving money over a long term-period (five or more years) with a compound interest rate well above the inflation rate, will help you to accumulate wealth. Compounding can be your friend if you are saving money over a long-term period. It can also be your worst enemy if you are paying back a bank loan over a long-term period. Let’s revise simple and compound interest in the following examples. EXAMPLE 1 R5 000 is invested in a bank. Calculate the accumulated amount after three years if the interest rate is: (a) 3,75% per annum simple interest (b) 3,75% per annum compound interest Solutions (a) After 1 year: (b) After 1 year:
A 5 000 3,75% of 5 000A 5 000 0,0375 5000
A 5 000 187,50A R5 187,50
= += + ×
∴ = +∴ =
A 5 000 3,75% of 5 000A 5 000 0,0375 5 000
A 5 000 187,50A R5 187,50
= += + ×
∴ = +∴ =
After 2 years: After 2 years:
A 5 187,50 0,0375 5 000
A 5 187,50 187,50A R5 375
= + ×∴ = +∴ =
A 5 187,50 0,0375 5 187,50
A 5 187,50 194,53A R5 382,03
= + ×∴ = +∴ =
After 3 years: After 3 years:
A 5 375 0,0375 5 000
A 5 375 187,50A R5 562,50
= + ×∴ = +∴ =
A 5 382,03 0,0375 5 382,03
A 5 382,03 201,83A R5 583,86
= + ×∴ = +∴ =
Notice that after 1 year, the amount accumulated is the same for both the simple and compound interest rates. After this, the amount accumulated using the compound interest rate will always be higher than the amount accumulated using the simple interest rate.

207
This method of calculation is somewhat tedious. Let’s revise the formulae for simple and compound interest rate calculations that you dealt with in Grade 9.
Simple interest formulae Compound interest formulae
A P 1100rn = +
or A P(1 )in= + A P 1
100
nr = +
or A P(1 )ni= +
where: A = accumulated amount P = original amount borrowed or invested n = number of years r = interest rate as a percentage
100ri = = interest rate as a decimal Note: 100r i= ×
Let’s now use these formulae to verify the answers in Example 1 and focus on some further examples.
EXAMPLE 2 (Calculating the value of A)
R5 000 is invested in a bank. Calculate, using the appropriate formulae, the accumulated amount after three years and the total interest received, if the interest rate is: (a) 3,75% per annum simple interest (b) 3,75% per annum compound interest Solutions
A ?= P 5 000= 3,75 0,0375100
i = = 3n =
(a) A P(1 )in= + (b) A P(1 )ni= +
A 5 000(1 0,0375 3)A R5 562,50
∴ = + ×∴ =
3A 5 000(1 0,0375)
A R5 583,86∴ = +∴ =
Interest received over 3 years Interest received over 3 years
R5 562,50 R5000R562,50
= −=
R5 583,86 R5 000R583,86
= −=
R562,50 R187,50 each year3
=
EXAMPLE 3 (Calculating the value of P)
Five years ago, a certain amount of money was invested in a bank. The value of the investment is currently R200 000. Calculate the original amount invested (P) if the interest rate was: (a) 5% per annum simple interest (b) 5% per annum compound interest Solutions
A 200 000= P ?= 5 0,05100
i = = 5n =
(a) A P(1 )in= + (b) A P(1 )ni= +
200 000 P(1 0,05 5)200 000 P(1,25)200 000 P(1,25)
P R160 000
∴ = + ×∴ =
∴ =
∴ =
5
5
5
200 000 P(1 0,05)
200 000 P(1,05)200 000 P(1,05)
P R156 705,23
∴ = +
∴ =
∴ =
∴ =

208
Alternative method for (b): 5200 000 P(1,05)=
5200 000 P(1,05)
∴ =
5200 000(1,05) P−∴ = 5P 200 000(1,05)−∴ =
P R156 705,23∴ = The compound interest formula can therefore be written in the form P A(1 ) ni −= + . This new formula can be used to calculate P when given A, i and n. With this formula, the interest is removed from A to get back to P. In the previous example, you can calculate P directly as follows:
5P 200 000(1 0,05)P R156 705,23
−= +∴ =
EXAMPLE 4 (Calculating the value of P using the new formula) Rachel has just opened a small business and takes out a loan to provide for the initial start-up costs. She agrees to repay the loan four years later by means of a payment of R1 200 000. The bank charges her an interest rate of 18% per annum compounded annually. What was the amount of money she originally borrowed? Solution
A 1 200 000= P ?= 18 0,18100
i = = 4n =
4
P A(1 )
P 1 200 000(1 0,18)P R618 946,65
ni −
−
= +
∴ = +∴ =
EXAMPLE 5 (Calculating the value of n) How long would it take for an investment of R40 000 to increase by R5 000 if the interest rate is 4,5% per annum simple interest? Solution
A 45 000= P 40 000= 4,5 0,045100
i = = ?n =
A P(1 )45 000 40 000(1 0,045 )45 000 1 0,04540 0001,125 1 0,0451,125 1 0,0450,125 0,045
0,125 2,7777..... years0,045
inn
n
nn
n
n
= +∴ = + ×
∴ = +
∴ = +∴ − =∴ =
∴ = =
This is the same as 2 years and approximately 9 months
1[apply the exponent rule ]mm a
a−=
[0,7777.... 12 9,3333333....]× =
Note: Calculating the value of n in the compound interest formula is not part of the Grade 10 syllabus since this requires the use of logarithms which are studied in Grade 12.

209
EXAMPLE 6 (Calculating the value of i) Joseph invests R18 000 and it grows to R25 000 over a period of two years. Calculate the interest rate to one decimal place if the investment earned: (a) simple interest (b) compound interest Solutions A 25 000= P 18 000= ?r = 2n = (a) A P(1 )in= + (b) A P(1 )ni= +
25 000 18 000(1 2)25 000 18 000(1 2 )25 000 1 218 00025 1 2187 2
187 1 12
18 2 27
360,194444...0,194444... 10019, 4%
ii
i
i
i
i
i
irr
∴ = + ×∴ = +
∴ = +
∴ − =
∴ =
∴ × = ×
∴ =
∴ =∴ = ×∴ =
EXERCISE 1 (a) Trevor invests an amount of R20 000 in a bank. Calculate, using appropriate formulae, the accumulated amount after six years and the total interest he will receive, if the interest rate is:
(1) 4,5% per annum simple interest (2) 4,5% per annum compound interest
(b) Refilwe wants to purchase a stove costing R12 000. She wants to pay back this amount with interest in two years’ time. The interest rate is 24% per annum simple interest. (1) Calculate the amount that she will repay in two years’ time. (2) If she wants to pay the loan off in monthly payments over the two-year period,
what will her monthly payments be? (c) Nceba invested R500 000 in the share market. He managed to secure an average
compound interest rate of 14% per annum during the first two years. (1) Calculate the value of his investment at the end of the two-year period. (2) During the next three years, he managed to secure an average compound
interest rate of 12% per annum. What was his investment then worth at the end of the next three years?
(d) Seven years ago, a certain amount of money was invested in a bank. The value of the investment is currently R350 000. Calculate the original amount invested (P) if the interest rate was:
(1) 3,25% per annum simple interest (2) 3,25% per annum compound interest
2
2
2
25 000 18 000(1 )25 000 (1 )18 00025 (1 )18
25 118
25 118
0,178511302....0,178511302.... 10017,9%
i
i
i
i
i
irr
∴ = +
∴ = +
∴ = +
∴ = +
∴ = −
∴ =∴ = ×∴ =
210
(e) What amount must be invested now in order to receive R650 000 in five years’ time if the compound interest rate is 6% per annum? (f) How long would it take for an investment of R50 000 to increase to R65 000 if the interest rate is 5,5% per annum simple interest? (g) Calculate how long it would take for an investment of R9 000 to double if the simple interest rate is 11% per annum. (h) Paul invests R35 000 and it accumulates to R55 000 over a period of five years. (1) What simple interest rate would you need to secure? (2) What compound interest rate would you need to secure? (i) Janet invests R80 000 and it accumulates to R90 000 over a period of two years. (1) What simple interest rate will she need to receive in order to achieve this? (2) What compound interest rate will she need to receive in order to achieve this? HIRE-PURCHASE AGREEMENTS A Hire Purchase Agreement (HP) is a short-term loan. Household appliances and furniture are often bought on HP. The buyer signs an agreement with the seller to pay a specified amount per month. The interest paid on a hire purchase loan is simple interest and it is calculated on the full value of the loan over the repayment period. Normally a deposit is paid initially and the balance is paid over a short time period. The buyer will be required to pay the total interest charged on the loan even if the loan can be paid off in a shorter time period.
EXAMPLE 7 Vanessa buys a laptop costing R16 000. She pays a 10% deposit and then takes out a twenty four month hire-purchase loan on the balance. The interest rate charged on the loan is 22% per annum simple interest. Calculate her monthly payments and what she will actually pay for the computer. Solution Deposit 10% of 16 000= 0,1 16 000 R1 600= × = Balance 16 000 1 600 R14 400= − = (P) Interest is charged on R14 400 for a period of 24 months or 2 years (n). HP loan amount (A): A P(1 )in= +
A 14 400(1 0, 22 2)∴ = + × A R20 736∴ =
Monthly payments:
R20 736 R86424
∴ =
She will pay R20 736 plus the deposit of R1 600 for the laptop, which is a total amount of R22 336.

211
EXAMPLE 8 Mike buys a mobile phone costing R8 000 on HP, pays a deposit of R800, and then pays 36 monthly payments of R344. Calculate the simple interest rate. Solution Balance after deposit has been paid is: R8 000 R800 R7 200− = (P) Amount repaid over 3 years: R344 36 R12 384× = (A) Simple interest rate: 12 384 7 200(1 3)i= + ×
12 384 1 37 200
12 384 1 37 20018 32518 1 1325 3 3
0,2424%
i
i
i
i
ir
∴ = +
∴ − =
∴ =
∴ × = ×
∴ =∴ =
EXERCISE 2 (a) David buys a computer which costs R17 000. He takes out a 36-month hire purchase
agreement. He pays a deposit of 10% and the interest charged on the balance is 14% per annum simple interest. What will his monthly payments be and what will he actually pay for the laptop?
(b) Patricia wants to buy a furniture suite for R38 000. She decides to take out a hire-purchase loan involving equal monthly payments over five years. The deposit is 20% and the simple interest rate charged per annum is 15%. Calculate:
(1) how much must be paid each month (2) the amount of interest paid (3) the actual amount paid for the furniture suite
(c) Shaun buys a smartphone on HP which costs R11 799,90. He will have to pay R639 per month for 24 months. No deposit will be required. Calculate the simple interest rate.
(d) A tablet with WiFi costs R10 579. Mark buys a tablet on HP and agrees to pay a deposit of R1 500 and 36 monthly payments of R350. Calculate the total simple interest paid and the rate of simple interest.
(e) A hire purchase contract for a sound system requires James to pay a deposit of R2 000 and to then make six monthly payments of R3 375. If the price of the sound system is R20 000, calculate the total simple interest paid and the rate of simple interest. (f) Belinda buys a flat screen plasma television costing R20 000 on hire purchase. She
traded in an old television for R3 000 and paid a deposit of R 2000. The balance was paid by means of monthly instalments of R900 over two years. Calculate the total simple interest paid and the rate of simple interest.

212
(g) Jeremy wants to buy a motorbike. He can only afford to pay R3 000 per month. He wants to take out a hire purchase loan over 24 months at an interest rate of 12% per annum simple interest. Calculate the price of the computer that he can afford to buy.
(h) Ayanda wants to buy a new car and can afford to pay R4 899 per month. A car dealership offers her a payment plan over 72 months at a simple interest rate of 10,5% per annum. What is the price of the car she can afford to buy?
INFLATION IN THE ECONOMY Inflation is the steady increase in the prices of goods and services over time throughout the economy. It is measured by defining a ‘shopping basket’ of goods and services used by a typical South African household and then keeping track of the cost of the basket. The consumer price index, or CPI, is the cost of a shopping basket. For example, in one year, the cost of the basket may rise by 4%. This increase of 4% in the CPI is referred to as the inflation rate. The rate of inflation is therefore the percentage of money you’ll need more every year to buy the same things you were able to buy the previous year. Inflation eats away at the value of people’s money. With the same amount of money, fewer goods can be bought than before. Inflation is caused by a wide range of factors. A few of them are: An increase in the demand for goods due to shortage, which leads to prices going up. If there are 100 consumers wanting to buy a product, but only 90 products are available, the price of the product will increase. Increases in production charges due to such factors as exchange rates, oil and petrol prices will cause the producer to pass on the higher prices to the consumer in order to stay in business. A higher petrol price has both an impact on the general price level, as it not only impacts on the price we pay for petrol, but also on the whole range of goods and services that are subject to transport costs. EXAMPLE 9 In January 1985, the average home cost about R72 000. Assuming an average annual inflation rate of 8,6% from 1985 up to 2015, which is a period of thirty years, what did the same house cost in January 2015? Solution
30
A P(1 )
A 72 000(1 0,086)A R855 514,26
ni= +
∴ = +∴ =
EXAMPLE 10 The average salary of a computer programmer in South Africa in 1995 was R4 500. Assuming an annual average rate of inflation of 6,1%, would a salary of R9 000 have the same buying power in 2015? Solution
20
A P(1 )
A 4 500(1 0,061)A R14 706,87
ni= +
∴ = +∴ =
A salary of R9 000 would be way below the buying power of a salary of R14 706,87.

213
EXERCISE 3
(a) Arnold paid R2 599,99 for a car sound system in 1997. Assuming an average inflation rate of 7% per annum, what did he pay for a sound system with the equivalent value in 2014?
(b) The average price of a hamburger and milkshake in 1991 was R6,60. Assuming an average inflation rate of 8% per annum, what did hamburger and milkshake cost in 2006?
(c) The average salary of a domestic worker in South Africa in the year 2000 was R2 000. Assuming an annual average rate of inflation of 5,7%, would a salary of R3 000 have the same buying power in 2015?
(d) University fees for a student stuying a bachelor’s degree are, on average, about R34 000 per year. Assuming an average inflation rate of 5% per annum, what will the fees be in twenty years’ time?
(e) Forty years ago, John deposited R5 000 in a bank paying him 3% per annum compound interest. The average inflation rate over the forty years was 6%.
(1) How much money will he have saved after forty years? (2) Calculate the buying power of R5 000 after forty years. (3) Comment on the value of John’s savings after forty years. (f) If salaries double every seven years, what will the rate of inflation be? (g) Suppose that a person earns a monthly salary of R20 000. What would this salary have
been 30 years ago, assuming an annual average rate of inflation of 4,5%? (h) Suppose that a cold drink costs R4,50 now but will cost double in eight years’ time.
What will the average inflation rate be? EXCHANGE RATES
There are different money systems in different countries. Currency is the term used to describe the particular money system of a country. Here are the currencies of a few countries.
Country Currency used Symbol for the currency
South Africa Rand R United States of America US dollar $
United Kingdom British Pound £ Several European countries Euro €
In every country, in order to purchase goods and services, you would need to use their currency. In the USA, you would not be able to use rands to pay for things. This is because the USA uses the dollar. Therefore, you would need to convert rands to dollars before you can spend money in America. Because the rand is much weaker than the American dollar or British pound, you will need to exchange a lot more rands for dollars and even more for pounds. For example, say you want to buy an item online costing one pound in England. You would therefore need about R18 to buy that item because the pound is much stronger than the rand.
EXAMPLE 11
Sean wants to buy the latest DJ equipment, which has been advertised in a US catalogue for $4 000. He wants to order and pay for the equipment online. The current rand/dollar exchange rate is R12,56 to the US dollar. Calculate the cost in rands of the DJ equipment. Solution
$1 R12,56= ∴$1 4 000× R12,56= 4 000×

214
∴$4 000 R50 240= The DJ equipment will cost R50 240.
EXAMPLE 12 Simone is on a trip to the UK to visit her mom. The current rand/pound exchange rate is R18,50 to the British pound. She has R40 000 to spend in the UK. How many pounds does she have to spend? Solution £1 R18,50=
£1 R18,5018,50 18,50
∴ =
£1 R118,50
∴ =
£1 40 000 R1 40 00018,50£2162,16 R40 000
∴ × = ×
∴ =
Judy has £2 162,16 to spend in London.
EXERCISE 4 (a) The latest Playstation game costs $645 in New York. What would it cost in South
Africa if the rand/dollar exchange rate is R12,25 to the US dollar? (b) Conrad wants to buy a fitness book costing £30 in London. How much will it cost him in rands? The rand/pound exchange rate is R17 to the British pound. (c) Mark wants to buy Japanese sweets costing 50 yen (¥). If the rand/yen exchange rate is
one rand to 17,76 yen, calculate the cost of the sweets in rands. (d) Jill is visiting a friend in California for a week. She has R3 000 to spend and will
exchange the money for US dollars. How many dollars will she have to spend if the rand/dollar exchange rate is R11,28 to the US dollar?
(e) Nathan wants to purchase electric drums from a music dealership in England. The drums cost £4 000 and Nathan has saved R75 000. The rand/pound exchange rate is R18,24 per one pound. Will he have enough money, in rands, to buy the drums? Show your reasoning.
(f) One yen costs R0,22. How much yen can you spend in Japan if you have R4 500 available to you?
(g) A married couple living in England, having saved £4 000, decided to have a holiday in South Africa. The airfare cost £1 100 and they converted the balance of their money into rand which they intended to spend in South Africa. They actually spent R23 000 in South Africa and converted their remaining rands back into pounds when they returned to England. The exchange rate on arrival in South Africa was R18,24 to the pound and R18,46 to the pound when they departed from South Africa.
(1) How much, in rands, had the couple planned to spend in South Africa? (2) How many pounds did they take back to England? (h) A certain watch costs €350 in Germany or £245 in England. Which price is better for
the South African buyer if the exchange rates are R11,24 to the euro and R18,06 to the pound?
(i) A South African teacher works in England for two years. He saves £400 every month. How much money in rand would he save in this time if the average exchange rate during the two years is R18,54 to the pound?

215
(j) Brenda won a competition where she can fly to three international destinations free of charge with spending money. The destinations she chose were Germany, Japan and England. For Germany, she was allocated €9 000. For Japan, she was allocated ¥30 000. For England, she was allocated £2 500. Use the exchange rates in the table on the next page to calculate the total amount she had been allocated in rands.
Exchange Rates
Germany (€) Japan (¥) England (£) R10,46 R0,29 R17,12
POPULATION GROWTH Population growth is the increase in the number of individuals in a population. The population growth rate is the rate at which the number of individuals in a population increases in a given time period as a fraction of the initial population. It measures how the size of the population is changing over time. In the first few years, a population grows exponentially in the same way that money grows through compounding. As time progresses, any population of living creatures is constrained by the availablility of food, water, land or other important resources. Populations therefore don’t always grow exponentially. In this section, we will focus on the early years of exponential growth of populations. There are other models of population growth that are studied at university which take into consideration changing population growth rates due to the constraining factors mentioned. The formula for calculating exponential growth of a population is similar to the compound interest formula:
future presentP P 1100
nr = +
where:
presentP = present size of the population
futureP = future size of the population average population growth rater = expressed as a percentage
n = the number of years EXAMPLE 13 The mid-year population in South Africa in 2014 was 54 002 200. Calculate the size of the population in five years’ time if the average population growth rate is 1,56%.
Solution
future presentP P 1100
nr = +
5
future1,56P 54 002 200 1100
∴ = +
futureP 58 347 857,54∴ =
The population size will be approximately 58 347 857 people in five years’ time.

216
EXERCISE 5 (a) The mid-year population in South Africa in 2008 was 48 910 000. Calculate the size of
the population in two years’ time if the average population growth rate was 1,34%. (b) The number of people in the USA as at June 2014 was estimated at 318 857 056. If the
average population growth rate was 1,42%, calculate the estimated population size of the USA in June 2017.
(c) The number of black rhinos in Africa during 2012 was estimated at 5 487. If the average population growth rate of black rhinos is 4,9% per annum, calculate how many rhinos were there in Africa in 2007.
(d) The world population during the year 2015 was estimated to be 7 320 248 940. If the average annual exponential growth rate was 1,14%, what was the population in the year 2000?
(e) A family of 6 mice can multiply into a family of 60 mice in 3 months. (1) Calculate the estimated monthly growth rate for the mice population. (2) If not controlled, how many mice will there possibly be in one year if the initial
population is 6 mice? (f) You are studying the population growth of a species of frog. In a pond constructed for
the frogs, you start off with 50 frogs and notice that after 10 months, the number of frogs has increased to 61. What is the average monthly growth rate? SITUATIONS INVOLVING CHANGING INTEREST RATES EXAMPLE 14 R8 000 is deposited into a savings account. The interest rate for the first three years is 3% per annum compounded annually. Thereafter, the interest rate changes to 4% per annum compounded annually. Calculate the value of the investment at the end of the eighth year. Solution Time lines are useful when dealing with interest rate changes. Method 1 Method 2
33A 8 000(1 0,03) (at T )= +
A 8 741,816∴ =
58A 8 741,816(1 0,04) (at T )= +
A R10 635,76∴ =
0T 1T 2T 3T 4T 5T 6T 7T 8T
Instead of actually calculating the value of 38 000(1,06) , you can do both calculations in one line as follows:
3 5A 8 000(1,03) . (1,04)= A R10 635,76∴ =

217
EXAMPLE 15 A certain amount of money was invested ten years ago and is now worth R200 000. The interest rate during the first 6 years was 3,5% per annum compounded annually and for the remaining four years, the interest rate was 4,6% per annum compounded annually. How much money was invested ten years ago? Solution Method 1 Method 2
46P 200 000(1 0,046) (at T )−= +
P 167 071,8407∴ =
60P 167 071,8407(1 0,035) (at T )−= +
P R135 913,05∴ = EXERCISE 6 (a) R24 000 is deposited into a bank account. The interest rate for the first seven years is
2,25% per annum compounded annually. Thereafter, the interest rate changes to 3,5% per annum compounded annually. Calculate the value of the investment at the end of the thirteenth year.
(b) Portia invests R500 000 in the share market. Over a fifteen-year period, the average interest rate was 6% per annum compounded annually for the first eight years and 7% per annum compounded annually for the remaining seven years. How much money will she have saved at the end of the fifteen-year period?
(c) David invested R50 000 for nine years. The interest rate changed three times during the nine-year period. At the start, the interest rate was 4,35% per annum compounded annually. After two years, it increased by 1% and four years later, it decreased by 2%.
How much was David’s investment worth at the end of the investment period? (d) A certain amount was invested in the share market seven years ago and is now worth
R1 300 000. The average interest rate during the first five years was 9% per annum compounded annually and for the remaining two years, 10% per annum compounded annually. How much money was originally invested?
(e) Sibongile wants to travel to New York in five years’ time. She estimates that, by then, the cost of the trip will be R250 000. Suppose that the bank will give her a fixed compound interest rate of 5% for the first year and 6% per annum for the remaining four years, how much will she need to invest now in order to save R250 000?
(f) Thembi invested R6 000 at the beginning of the year 2010. The interest rate then was 2% per annum compounded annually. At the beginning of the following year, the interest rate increased to 2,5%. One year later, the interest rate increased by 0,8%. One year after this, the interest rate dropped by 2%. How much money did Thembi save at the beginning of the year 2015?
0T 1T 2T 3T 4T 5T 6T 7T 8T 9T 10T
Instead of actually calculating the value of 4200 000(1,046)− , you can do both calculations in one line as follows:
4 6P 200 000(1,046) . (1,035)− −= P R135 913,05∴ =

218
CONSOLIDATION AND EXTENSION EXERCISE (a) Sam invests R28 000 for two years ands earns 4,7% per annum compound interest. (1) Calculate the accumulated value at the end of the two-year period. (2) He leaves the money in the account for a further two years. The interest rate
changes to 6% per annum simple interest. How much money will he then have saved?
(b) What amount must Tanisha invest now if she wishes to accumulate R1 000 000 in ten years’ time given that the interest rate is:
(1) 13% per annum simple interest? (2) 13% per annum compound interest? (c) Theresa believes that she has the potential to double her money in three years by
investing in the share market. If she deposits R60 000 into a share-market investment account,
(1) what simple interest rate will be required in order for her to do this? (2) what compound interest rate will be required in order for her to do this? (d) Manhatten Island is said to have been bought from the Indians in 1626 for $24. If,
instead of making this purchase, the buyer had put the money in a savings account drawing compound interest at 6% per annum, what would that account be worth in the year 2015?
(e) On his trip to New York, Robert booked into a hotel for three nights. The cost per night was $450. How much did Robert spend in rands for the three nights if the exchange rate at that time was $1 R12,12= .
(f) On his trip to London, Mark decides to buy a tablet from a computer store. The tablet costs R10 000 in South Africa. How much is this in pounds if the exchange rate on the day is ?
(g) Ernest wants to buy a car costing R240 000. He wants to pay cash for this model of car but can only do this in one and a half years’ time. If the inflation rate is running at 6% per annum, calculate the cost of this car in one and a half years’ time.
(h) A population of Canadian swans doubles every seven years. Calculate the average annual growth rate of this swan population.
(i) One pair of German cockroaches can theoretically produce enough offspring in one year to carpet the floors of the average home to a depth of 1 metre per year. Reasearch has found that one female cockroach give birth to 400 000 offspring in one year! What is the annual growth rate for this population? [http://www.stephentvedten.com/27_Roaches.pdf]
(j) An investment of R9 000 earns 6% per annum compounded annually for a period of four years. Thereafter, the interest rate changes to 7% per annum compounded annually for a further two years. Calculate the future value of the investment at the end of the six-year period.
(k) Peter invests a certain sum of money for five years at 12% per annum compounded annnually for the first two years and 14% per annum compounded annually for the remaining term. The money grows to an amount of R65 000 at the end of the five-year period. How much did Peter originally invest?
(l) R6000 is deposited into a savings account. Four years later, R7000 is added to the savings. The interest rate for the first three years is 8% per annum compounded annually. Thereafter, the interest rate changes to 9% per annum compounded annually. Calculate the value of the savings at the end of the seventh year.
(m) Christo invests R12 000 in a savings account in order to save up for an overseas trip in five years’ time. The interest rate for the five-year period is 11% per annum compounded annually. At the end of the third year, Christo runs into financial difficulty and withdraws R5 000 from the account. How much money will he have saved at the end of the five-year period?
R1 0£1 7,3=

219
CHAPTER 10 STATISTICS
REPRESENTING UNGROUPED DATA Ungrouped data is a set of individual values or observations. The data is discrete since the values are distinct values. For example, the set of final examination marks of thirty university students is referred to as ungrouped data. Another example could be the number of goals scored by Kaizer Chiefs. Ungrouped data can be represented in different ways. The three most common ways are: frequency tables, bar graphs and stem-and-leaf plots. EXAMPLE 1 The American company Deloitte made a prediction that in 2014, the increase in the number of smartphones being used world-wide would be the greatest for people over 55 years. In a survey conducted in a shopping mall during 2014, different people were approached and asked what type of phone they were using. The following table shows the ages of thirty people between the ages of 15 and 60 using smartphones. [www2 deloitte com/content/dam/Deloitte/global/Documents/Technology-Media-Telecommunications/gx-tmt-2014prediction-smartphone pdf]
(a) Draw a frequency table for this ungrouped, discrete data. (b) Represent the data in a stem-and-leaf plot. (c) Draw a frequency bar graph for this data. (d) Do the results of the survey prove that Deloitte was correct in their prediction? Solutions (a) A frequency table shows the different observations and how many times they occur.
16 17 17 17 17 18 18 25 25 27 28 28 28 28 28 28 32 34 34 34 46 46 48 54 55 56 56 56 56 56
Age Tally Frequency 16 | 1 17 | | | | 4 18 | | 2 25 | | 2 27 | 1 28 | | | | | 6 32 | 1 34 | | | 3 46 | | 2 48 | 1 54 | 1 55 | 1 56 | | | | 5 30n =

220
(b) In a stem-and-leaf plot, the tens digit is used as a “stem” and the units as a “leaf”. Ensure that the “leaves” are equally spaced.
(c) The individual ages are on the horizontal axis and the frequencies on the vertical axis.
It might be useful to place the ages into age groups rather than individual ages. (d) Although the bar graphs indicate that there were a high number of over-55’s using smartphones, there is not enough data to prove this prediction. The sample was too small. It would be far more feasible to increase the number of people surveyed to well in the millions to get a better idea. Also, one would have needed to compare sales in previous years.
1 6 7 7 7 7 8 8 2 5 5 7 8 8 8 8 8 8 3 2 4 4 4 4 6 6 8 5 4 5 6 6 6 6 6

221
EXERCISE 1 (a) The manager of a computer store assessed the quality of
service at his store based on the feedback from thirty customers. The rating scale was as follows:
Extremely poor (0) Poor (1) Average (2) Good (3) Very good (4) Outstanding (5) The scores of the thirty customers are provided below.
0 3 4 3 4 1 4 2 4 5 4 2 4 4 2 3 4 4 5 3 4 2 1 1 3 4 3 5 2 4
(1) Draw a frequency table for this ungrouped, discrete data. (2) Draw a frequency bar graph for this data.
(b) A number of seeds of a particular variety of flower were sown. All germinated, but not
all at the same time. The following bar graph shows how many seeds germinated after various number of days.
(1) How many seeds were sown? (2) After how many days did the first seed germinate? (3) What percentage of seeds germinated within the first 8 days? (c) Donating blood can help to save the life of someone and even
yours should you be in an accident one day and require blood. The ages of forty people who donated blood on a particular day are provided below.
(1) Draw a stem-and-leaf plot for this data. (2) Draw a frequency bar graph for this data. Group the data into appropriate age
groups (10-19 year olds, 20-29 year olds, etc). (3) Which age group donated the most blood?
18 42 17 35 19 35 20 39 35 26 41 53 42 50 57 43 35 24 55 54 64 22 35 17 65 18 47 19 48 53 27 35 63 24 66 34 39 27 66 35

222
(d) The number of air conditioners sold by fifty sales representatives in the year 2015 are recorded below:
25 22 19 27 27 19 23 21 14 12 13 13 9 4 21 18 30 31 28 21 20 3 7 14 14 9 7 27 21 39 18 22 27 30 23 14 14 14 8 1 3 14 4 18 5 24 20 8 10 8
(1) Draw a stem-and-leaf plot for this data. (2) Draw a frequency bar graph for this data. (3) How many agents sold twenty or more air conditioners? (4) What percentage of the agents sold less than 20 air conditioners? (e) An app is a type of software that allows you to perform specific
tasks on your laptop or mobile phone. The word “app” is an abbreviation for “application”. By the year 2016, there will be almost 310 billion downloaded apps generating close to $74 billion in revenue. With nearly two million apps already developed, competition for someone wanting to develop a successful app is fierce. Having an app in the top 25 will require at least 33 downloads per hour. Two companies recorded the number of downloads per hour for one of their new apps over a period of 15 hours.
Company A 23 30 32 11 33 13 42 41 14 22 33 22 22 33 44 Company B 10 20 11 23 44 24 34 35 43 33 29 32 33 43 43
(1) Using today’s exchange rates, convert $74 billion to rands, pounds and euros. (2) Draw a back-to-back stem-and-leaf diagram for the two companies. (3) What percentage of Company A’s downloads were more than 33 per hour? (4) What percentage of Company B’s downloads were less than 33 per hour? (5) In your opinion, which company has the better chance of success with their new app? State a reason for your answer. (f) The following back-to-back stem-and-leaf diagram shows the average number of hours spent per week on social networking websites by learners from two different classes.
CLASS A CLASS B 8 7 7 7 5 5 5 1 1 0 0 1 2 3 3 4 6 6 7 8 9 1 1 0 0 0 1 0 0 0 1 9 2 1 3 0
(1) How many learners are there in Class A? (2) How many learners are there in Class B? (3) How many learners in Class A spend exactly one hour per week on a social networking website? (4) How many learners in Class B spend more than five hours per week on a social networking website? (5) Which class spends more time, in total, on a social networking website?

223
(g) The following bar graph shows the weekly social networking usage on smartphones by different age groups in developed countries.
[Source: Deloitte Global Mobile Consumer Survey, Developed countries, May-July 2014] (1) In which age group does 44% use smartphones for social networking? (2) What percentage of the over 65-year olds do not use smartphones for social
networking? (3) If there are 200 000 people in the 25-34 year age group, how many will be using smartphones for social networking? (4) If there are 375 000 people in the 18-24 age group using smartphones for social
networking, how many people in this age group are not using smartphones for social networking?
MEASURES OF CENTRAL TENDENCY Central tendency is the clustering of data around a central or middle value. A measure of central tendency is a single value that attempts to describe a set of data by identifying the central position within that set of data. As such, measures of central tendency are sometimes called measures of central location. They are also classed as summary statistics. The mean (often called the average) is most likely the measure of central tendency that you are most familiar with, but there are others, such as the median and the mode. THE MEAN The mean or average of the data (referred to as x-bar or x ), is the sum of the data values divided by the total number of data values (n). We refer to the data values as the x-values.
sum of all -valuestotal number of -values
xxxx n
= =
Whenever the number of data values is large and there are no extreme values (outliers), then the mean is a good measure of central tendency. EXAMPLE 2 Calculate the mean for the following data:
1 3 3 3 3 4 5 9 9 9
Solution
1 (3 4) 4 5 (9 3) 49 4,910 10
xx
n+ × + + + ×= = = =

224
THE MEDIAN The median is the middle-most number when the data values are written in ascending order. In order to determine the correct position of the median in the data, use the following formula: Position of median 1
2 ( 1)n= + where n represents the number of data values. If the data set contains an odd number of values, then the median will be part of the data set. 12 ( 1)n + will be an integer. If the data set contains an even number of values, then the median
will not be part of the data set. 12 ( 1)n + will not be an integer. The median will be the average
between the two middle numbers in the data set. EXAMPLE 3 Determine the median for the following data set: 2 9 5 12 10 Solution First arrange the values in ascending order: 2 5 9 10 12 There is an odd number of values and therefore the median will be part of the data set.
The position of the median 1 12 2(5 1) (6) 3rd position.= + = =
The data value in the 3rd position is 9. The median is therefore 9 and it divides the data into two equal halves.
lower half upper half2 5 10 1 2
EXAMPLE 4 Determine the median for the following data set: 3 9 10 12 15 18 Solution The data is arranged in ascending order. There is an even number of values and therefore the median will be not part of the data set.
The position of the median 1 1(6 1) (7) 3,5th position.2 2
= + = =
This means that the median is the average between the 3rd and 4th data values.
Median 10 12 22 112 2+= = =
3 9 10 12 15 18
The median is 11 and it divides the data into two equal halves. It is not a value in the data set.
9
11↑

225
The median may be a better indicator of the most typical value if a data set has an outlier, which is an extreme value that differs greatly from the other values. EXAMPLE 5 Consider the following data set: 5 12 7 36 8 9 7 (a) Determine the mean and the median. (b) Which value is an outlier? (c) Which measure of central tendency is more representative of the data set?
Solutions (a) Arrange the data in ascending order: 5 7 7 8 9 12 36
5 7 7 8 9 12 36 84 12
7 7x + + + + + += = =
There is an odd number of values and therefore the median will be part of the data set.
The position of the median 1 1(7 1) (8) 4th position.2 2
= + = =
The median is 8 and it divides the data into two equal halves. It is a value in the data set.
5 7 7 9 12 36
(b) 36 is an extreme value compared to the other values and is an outlier. (c) The outlier has inflated the mean. It is therefore not a good value to use as a measure of central tendency. The median is not affected by the outlier and is therefore a much better measure than the mean. THE MODE The mode of a data set is the value that occurs most frequently. If two numbers tie for the most frequent occurrence, the data set has two modes and is called bimodal. If three numbers tie for the most frequent occurrence, the data set has three modes and is called trimodal. If a data set has an outlier, the mode, like the median, may also be a better indicator of the most typical value. EXAMPLE 6 Calculate the mode for the following data: 1 2 2 2 2 3 5 6 6 7 8 8 8 8 9 10 12 Solution There are two modes: 2 and 8 These values occur four times each in the data set. The data set is therefore bimodal.
8

226
EXAMPLE 7 Consider the data collected in Example 1. The ages of thirty people using smartphones between the ages of 15 and 60 were recorded.
The stem-and-leaf diagram of this data is provided below:
(a) Calculate the mean for this data. (b) Determine the median. (c) Determine the mode. Solutions
(a) 16 (17 4) (18 2) (25 2) 27 (28 6) 32 (34 3) (46 2) 48 54 55 (56 5)30 34,27x + × + × + × + + × + + × + × + + + + ×= =
(rounded off to two decimal places) (b) There is an even number of data values.
The position of the median 1 12 2(30 1) (31) 15,5th position.= + = =
The median is the average between the 15th and 16th data values. It is not part of the original data set but it divides the data set into two equal halves.
16 17 17 17 17 18 18 25 25 27 28 28 28 28 28 28 32 34 34 34 46 46 48 54 55 56 56 56 56 56
The median 28 282+= = 28
(c) The most frequently-occuring value is 28. The mode is therefore 28.
16 17 17 17 17 18 18 25 25 27 28 28 28 28 28 28 32 34 34 34 46 46 48 54 55 56 56 56 56 56
1 6 7 7 7 7 8 8 2 5 5 7 8 8 8 8 8 8 3 2 4 4 4 4 6 6 8 5 4 5 6 6 6 6 6
1 6 7 7 7 7 8 8 2 5 5 7 8 8 8 8 8 8 3 2 4 4 4 4 6 6 8 5 4 5 6 6 6 6 6

227
EXERCISE 2 (a) Find the mean, median and mode of the following sets of data values: (1) 4 ; 13 ; 5 ; 7 ; 9 ; 6 ; 5 (2) 8 ; 22 ; 3 ; 18 ; 4 ; 14 ; 8 ; 5 ; 10 ; 8 ; 10 (3) 13 ; 2 ; 11 ; 2 ; 10 ; 4 ; 5 ; 10 ; 8 ; 10 (4) 9 ; 1 ; 4 ; 4 ; 2 ; 8 ; 5 ; 2 ; 5 ; 5 (b) The mean weight of ten people entering in a lift is 75 kg. The lift has a weight limit of 1 000 kg. Approximately how many more people can get into the lift assuming that the mean weight remains at 75 kg? (c) The monthly salaries of nine employees in a small business are: R15 400 R16 800 R86 300 R13 200 R16 900 R11 900 R17 100 R16 200 R16 900 (1) Calculate the mean, median and mode for this data. (2) Which measure of central tendency is a sensible measure of the “typical”
monthly salary of an employee in this business? Explain. (d) A salesman at a shoe store sold eight pairs of men’s shoes one morning. The sizes of the eight pairs of shoes were as follows: 1 1 1 1
2 2 2 28 6 10 8 8 7 9 8
Which measure of central tendency best describes the typical shoe size for this data?
(e) A teacher records the following results for an examination out of 100: 98 63 79 76 58 71 86 78 91 87 89 41 19 88 41 99 97 83 78 90 Which measure of central tendency best describes these results? (f) A dairy farmer has 32 cows for sale. The weights of these cows in kilograms are
recorded below. The total weight of the cows is 5 060 kg.
80 82 83 83 84 85 85 86 86 87 87 88 88 89 90 92 92 93 94 95 97 153 153 154 155 321 371 376 377 381 382 391
(1) Calculate the mean and the median. (2) The farmer describes the cows to a buyer and states that the average weight is
over 158 kg. Which measure of central tendency did the farmer use to describe the cows and does this measure describe the cows fairly?
(g) The following stem-and-leaf diagram represents the ages of forty people who donated blood. Refer to Exercise 1 no (c). The total of all the ages is 1 544.
1 7 7 8 8 9 9 2 0 2 4 4 6 7 7 3 4 5 5 5 5 5 5 5 9 9 4 1 2 2 3 7 8 5 0 3 3 4 5 7 6 3 4 5 6 6
(1) Calculate the mean, median and mode for this data. (2) Comment on the usefulness of these measures of central tendency.

228
(h) The following stem-and-leaf diagram represents the number of air conditioners sold by fifty sales representatives. Refer to Exercise 1 no (d). The total number of air conditioners is 843.
0 1 3 3 4 4 5 7 7 8 8 8 9 9 1 0 2 3 3 4 4 4 4 4 4 4 8 8 8 9 9 2 0 0 1 1 1 1 2 2 3 3 4 5 7 7 7 7 8 3 0 0 1 9
(1) Calculate the mean, median and mode for this data. (2) Comment on the usefulness of these measures of central tendency. (i) Research was done on families having six children. The table
below shows the number of families in the study with the indicated numbers of boys.
Number of boys 0 1 2 3 4 5 6 Frequency 1 24 45 54 50 19 7
(1) Calculate the mean, median and mode for this data. (2) Comment on the usefulness of these measures of central tendency. (j) (1) The mean of 3 ; 4 ; 8 ; 9 ; x is 7. Determine x. (2) The median of five consecutive natural numbers is 12. What is the mean? (3) The numbers 4 ; 6 ; 8 ; 9 ; x are arranged from smallest to biggest. If the mean and the median are equal, determine x. (4) The mean of five numbers is 27. The numbers are in the ratio 1 : 2 : 3 : 4 : 5. Determine the five numbers. (5) Write down three possible sets of five numbers such that the median is 4, the
mean is 5 and the mode is 3. (6) The mean of six numbers is 44 and the mean of five of these numbers is 46.
What is the sixth number? MEASURES OF POSITION
Measures of position divide a set of data into equal groups. There are two measures of position that we will discuss: Quartiles: which divide the data set into four equal parts Percentiles: which divide the data set into one hundred equal parts Quartiles
Consider an ordered set of numbers whose median is m. The lower quartile is the median of the numbers that occur before m and the upper quartile is the median of the numbers that occur after m. The lower quartile is also called the first quartile ( 1Q ). The median is called the second quartile ( 2Q or M ) and the upper quartile is called the third quartile ( 3Q ). The three quartiles divide the data into four quarters. One quarter of the data values are less than the lower quartile and three quarters of the data values are less than the upper quartile. The following steps may be used to determine the lower and upper quartiles:
(1) Order the data (from smallest to biggest) and find the median ( 2Q or M ). (2) Find the median of the lower half of the data (exclude the median of the entire set). This is the lower quartile ( 1Q ). (3) Find the median of the upper half of the data (exclude the median of the entire set). This is the upper quartile ( 3Q ).

229
EXAMPLE 8 Calculate the quartiles for the following sets of data:
(a) 1 3 4 5 6 7 8 8 9 9 10 (b) 2 3 4 5 5 5 6 7 7 8 9 10 10
(c) 95 120 125 140 105 12 142 60 135 130
Solutions (a) 1 3 4 5 6 7 8 8 9 9 10 (11 values)
The position of the median 12 (11 1) 6= + =
The median is 7 (the 6th value). It is a value in the data set. 1 3 4 5 6 7 8 8 9 9 10 The lower half of the data set is: 1 3 4 5 6 The lower quartile is the median of the lower half (consisting of 5 values). The position of the lower quartile 1
2 (5 1) 3= + = The lower quartile is 4 (the 3rd value). It is a value in the lower half. 1 3 4 5 6 The upper half of the data set is: 8 8 9 9 10 The upper quartile is the median of the upper half (consisting of 5 values). The position of the upper quartile 1
2 (5 1) 3= + = The upper quartile is 9 (the 3rd value). It is a value in the upper half. 8 8 9 9 10 Let’s consider the quartiles together:
(b) 2 3 4 5 5 5 6 7 7 8 9 10 10 (13 values)
Solution
The position of the median 12 (13 1) 7= + =
The median is 6 (the 7th value). It is a value in the data set. 2 3 4 5 5 5 6 7 7 8 9 10 10 The lower half of the data set is: 2 3 4 5 5 5 The lower quartile is the median of the lower half (consisting of 6 values). The position of the lower quartile 1
2 (6 1) 3,5= + = The lower quartile is the average between the 3rd and 4th values. It is not a value in the lower half.
14 5Q 4,5
2+∴ = =
1Q 2Q 3Q

230
The upper half of the data set is: 7 7 8 9 10 10 The upper quartile is the median of the upper half (consisting of 6 values). The position of the upper quartile 1
2 (6 1) 3,5= + = The upper quartile is the average between the 3rd and 4th values. It is not a value in the upper half.
38 9Q 8,5
2+∴ = =
Let’s consider the quartiles together:
(c) Arrange the data values in ascending order: 12 60 95 105 120 125 130 135 140 142
The position of the median 12 (10 1) 5,5= + =
2120 125Q 122,5
2+∴ = = (the average between the 5th and 6th values)
The lower half of the data set is: 12 60 95 105 120 The lower quartile is the median of the lower half (consisting of 5 values). The position of the lower quartile 1
2 (5 1) 3= + = The lower quartile is the 3rd value. It is a value in the lower half. 1Q 95∴ = The upper half of the data set is: 125 130 135 140 142 The upper quartile is the median of the upper half (consisting of 5 values). The position of the upper quartile 1
2 (5 1) 3= + = The upper quartile is the 3rd value. It is a value in the upper half. 3Q 135∴ =
EXERCISE 3 (a) Find the quartiles for the following sets of data: (1) 2 3 5 8 10 12 13 (2) 1 4 6 7 11 13 15 15 20 (3) 3 6 7 9 14 18 20 21 (4) 5 6 8 9 16 19 23 25 28 30 (5) 6 7 9 9 10 12 16 21 23 26 27 28 30 32
1Q
2Q
3Q
1Q2Q
3Q

231
(b) The number of matches played by Argentina in past world cups are recorded below. Determine the quartiles for the number of matches.
Year 1934 1958 1962 1966 1974 1978 1982 Number of matches 1 3 3 4 6 7 5
Year 1986 1990 1994 1998 2002 2006 2010 Number of matches 7 7 4 5 3 5 8
(c) A salesman at a shoe store sold eight pairs of men’s shoes one morning. The sizes of the
eight pairs of shoes were as follows: 1 1 1 1
2 2 2 28 6 10 8 8 7 9 8
Determine the quartiles for this data. (d) A teacher records the following results for an examination out of 100: 98 63 79 76 58 71 86 78 91 87 89 41 19 88 41 99 97 83 78 90
Determine the quartiles for this data. (e) The estimated overall population percentage growth rates of South Africans over the
past 14 years are given below. 1,27 1,29 1,32 1,35 1,38 1,40 1,43 1,46 1,49 1,52 1,55 1,57 1,58 1,59
Determine the quartiles for this data. (f) Refer to Exercise 2 no (f). Determine the quartiles for this data. (g) Refer to Exercise 2 no (g). Determine the quartiles for this data. (h) Five data values are represented as follows: 22 ; 3 ; 2 ; 1 ; 2 −−++ xxxxx
(1) Determine the value of x if the mean of the data set is 15. (2) Calculate the quartiles.
Percentiles Percentiles are often used by academic institutions to compare student marks. Defining and determining percentiles is not that straightforward as there are many different approaches. There is no universally accepted definition of a percentile. Using the 65th percentile as an example, the 65th percentile can be defined as the lowest score that is greater than 65% of the scores. The 65th percentile can also be defined as the smallest score that is greater than or equal to 65% of the scores. Percentiles are more appropriate with data sets containing a large number of values. Note that the lower quartile is also the 25th percentile, the median is the 50th percentile and the upper quartile is the 75th percentile. We will use the following method to determine percentiles.
Arrange the data in ascending order. Compute index i , the position of the pth percentile using the formula: 100 ( )pi n= If i is not an integer, round up. The pth percentile is the value in the i th position.
If i is an integer, the pth percentile is the average of the values in positions i and 1i + . The following example involves a small number of data values. In the exercise which follows, you will be given data sets with a large number of data values.

232
EXAMPLE 9 A Maths professor at a university posted a list of marks, without names, on the notice board outside his office. The students were informed as to the percentile they were in. There are 45 students in his class and the marks are as follows: 66 86 65 78 32 52 69 85 87 28 90 98 73 64 56 58 78 65 50 36 67 55 72 57 64 70 92 95 33 32 24 42 54 55 54 68 65 88 80 84 68 61 75 76 82 (a) Jaco scored in the 70th percentile. What is his mark? (b) Michael scored in the 20th percentile. What is his mark? (c) Dimpho scored in the 50th percentile. What is her mark? Solutions (a) Arrange the marks in ascending order: 24 28 32 32 33 36 42 50 52 54 54 55 55 56 57 58 61 64 64 65 65 65 66 67 68 68 69 70 72 73 75 76 78 78 80 82 84 85 86 87 88 90 92 95 98
70100 (45) 31,5i = × =
All we now do is round this number up to 32 and the 70th percentile is the 32nd mark which is 76%. Jaco therefore obtained 76% and scored better than 70% of all students.
(b) 20100 (45) 9i = × =
The 20th percentile is the average between the 9th and 10th mark: 52 542 53+ =
There is no score of 53 in the data and therefore Michael will have obtained 54% and will have scored better than 20% of all students.
(c) 50100 (45) 22,5i = × =
The 50th percentile is the 23rd mark which is 66. Dimpho obtained 66% and scored better than 50% of all students. EXERCISE 4 (a) Tobacco use is a leading cause of death in the United States. Nicotine found in tobacco
is rapidly metabolised in the liver to a substance called cotinine. The levels of cotinine in the body are measured in nanograms per millilitre (ng/ml). A nanogram is one-billionth of a gram. Consider the following cotinine levels of 50 smokers:
5 6 6 8 22 40 43 44 48 86 88 103 113 122 123 130 131 149 165 168
174 174 198 208 210 223 224 227 233 245 249 250 253 265 267 277 280 284 286 289 290 313 313 314 350 360 401 460 476 490
(1) Calculate the 25th, 50th and 75th percentiles. (2) Calculate the 30th percentile. (3) Calculate the 65th percentile. (4) Calculate the 80th percentile. (b) A research survey was conducted to investigate how long people live, on average, in
different countries of the world. The table on the next page has the average life expectancies of people in 216 different countries. [Source: CIA World Factbook]

233
1 Chad 48,49 73 Bangladesh 70,06 145 United Arab Emirates 76,71 2 Guinea-Bissau 49,11 74 Iran 70,35 146 New Caledonia 76,94 3 South Africa 49,41 75 Honduras 70,71 147 Saint Lucia 77,04 4 Swaziland 49,42 76 Iraq 70,85 148 Argentina 77,14 5 Afghanistan 49,72 77 Cape Verde 71,00 149 Kuwait 77,28 6 Cent Afr Republic 50,48 78 Suriname 71,12 150 Georgia 77,32 7 Zimbabwe 51,82 79 Guatemala 71,17 151 Czech Republic 77,38 8 Somalia 50,80 80 Greenland 71,25 152 Dominican Republic 77,44 9 Lesotho 51,86 81 Azerbaijan 71,32 153 Slovenia 77,48 10 Mozambique 52,02 82 The Bahamas 71,44 154 Albania 77,59 11 Nigeria 52,05 83 Belarus 71,48 155 Libya 77,83 12 Namibia 52,17 84 Fiji 71,59 156 Cuba 77,87 13 Gabon 52,29 85 Indonesia 71,62 157 Costa Rica 77,89 14 Malawi 52,31 86 Trinidad 71,67 158 British Virgin Islands 77,95 15 Zambia 52,57 87 Micronesia 71,80 159 Panama 77,96 16 Mali 53,06 88 Philippines 71,94 160 Chile 78,10 17 Tanzania 53,14 89 Marshall Islands 72,03 161 Bahrain 78,29 18 Uganda 53,45 90 Palau 72,06 162 Taiwan 78,48 19 Niger 53,80 91 Nicaragua 72,18 163 United States 78,49 20 Burkina Faso 54,07 92 Vietnam 72,41 164 Guam 78,50 21 Angola 54,59 93 Samoa 72,66 165 Portugal 78,70 22 Cameroon 54,71 94 Peru 72,73 166 Denmark 78,78 23 Congo 55,27 95 Turkey 72,77 167 Gibraltar 78,83 24 Botswana 55,74 96 Uzbekistan 72,77 168 Saint Helena 78,91 25 Sierra Leone 56,55 97 Brazil 72,79 169 Bosnia 78,96 26 Ethiopia 56,6 98 Egypt 72,93 170 Puerto Rico 79,07 27 Cote d’Ivoire 57,25 99 Latvia 72,93 171 Wallis and Futuna 79,12 28 Liberia 57,41 100 Grenada 73,30 172 South Korea 79,30 29 Rwanda 58,44 101 Montserrat 73,41 173 Finland 79,14 30 Guinea 58,61 102 Jamaica 73,43 174 Virgin Islands 79,47 31 Burundi 59,24 103 Armenia 73,49 175 Belgium 79,65 32 Senegal 60,18 104 Estonia 73,58 176 Luxembourg 79,75 33 Benin 60,26 105 El Salvador 73,69 177 Malta 79,85 34 Ghana 61,45 106 Seychelles 73,77 178 Faroe Islands 79,85 35 Western Sahara 61,52 107 Bulgaria 73,84 179 Austria 79,91 36 Mauritania 61,53 108 Malysia 74,04 180 Saint Pierre 80,00 37 Djibouti 61,57 109 Gaza Strip 74,16 181 Greece 80,05 38 Haiti 62,51 110 Romania 74,22 182 United Kingdom 80,17 39 Sudan 62,57 111 Saudi Arabia 74,35 183 Jordan 80,18 40 Comoros 62,74 112 Solomon Islands 74,42 184 Germany 80,19 41 Equatorial Guinea 62,75 113 American Samoa 74,44 185 Ireland 80,32 42 Laos 62,77 114 Oman 74,47 186 Norway 80,32 43 Eritrea 62,86 115 Barbados 74,52 187 New Zealand 80,71 44 Cambodia 63,04 116 Serbia 74,56 188 Isle of Man 80,76 45 Kenya 63,07 117 Maldives 74,69 189 Cayman Islands 80,80 46 Togo 63,17 118 Mauritius 74,71 190 Bermuda 80,82 47 Sao Tome 63,49 119 Algeria 74,73 191 Netherlands 80,91 48 Madagascar 64,00 120 Columbia 74,79 192 Anguilla 80,98 49 Yemen 64,11 121 China 74,84 193 Iceland 81,00 50 Kiribati 64,76 122 Syria 74,92 194 Israel 81,07 51 Vanuatu 65,06 123 Cook Islands 74,92 195 Switzerland 81,17 52 Tuvalu 65,11 124 Hungary 75,02 196 Sweden 81,18 53 Burma 65,24 125 Lebanon 75,23 197 Spain 81,27 54 Nauru 65,70 126 West Bank 75,24 198 France 81,46 55 Pakistan 66,35 127 Tunisia 75,24 199 Jersey 81,47 56 Tajikistan 66,38 128 Macedonia 75,36 200 Canada 81,48 57 Russia 66,46 129 Tonga 75,38 201 Liechtenstein 81,50 58 Papua New Guinea 66,46 130 Lithuania 75,55 202 Italy 81,86 59 Nepal 66,51 131 Antigua 75,69 203 Australia 81,90 60 India 67,14 132 Aruba 75,93 204 Hong Kong 82,12 61 Guyana 67,39 133 Sri Lanka 75,94 205 Guernsey 82,24 62 Bhutan 67,88 134 Ecuador 75,94 206 Andorra 82,50 63 Bolivia 67,90 135 Croatia 75,99 207 Northern Mariena 82,51 64 East Timor 68,27 136 Slovakia 76,03 208 Saint Kitts 82,53 65 Belize 68,28 137 Morocco 76,11 209 Gambia 82,54 66 Mongolia 68,63 138 Dominica 76,18 210 Scotland 82,55 67 Ukraine 68,74 139 Poland 76,25 211 Wales 83,01 68 Turkmenistan 68,84 140 Brunei 76,37 212 San Marino 83,07 69 North Korea 69,20 141 French Polynesia 76,39 213 Singapore 83,75 70 Kyrgyzstan 69,45 142 Paraguay 76,40 214 Japan 83,91 71 Moldova 69,51 143 Uruguay 76,41 215 Macua 84,43 72 Kazakhstan 69,63 144 Mexico 76,66 216 Monaco 89,68

234
(1) Calculate the 25th, 50th and 75th percentiles. (2) Calculate the 90th percentile. (3) Calculate the 60th percentile. (4) Calculate the 45th percentile. (5) To what factors would you attribute high life expectancy averages in the top ranking countries? FIVE-NUMBER SUMMARIES AND BOX-AND-WHISKER PLOTS A five-number summary is a method for summarising a distribution of data. The five numbers are the minimum, the first quartile, the median, the third quartile, and the maximum. These values have been selected to give a summary of a data set because each value describes a specific part of a data set: the median identifies the centre of a data set; the upper and lower quartiles span the middle half of a data set; and the highest and lowest observations provide additional information about the actual dispersion of the data. This makes the five-number summary a useful measure of spread. In 1977, John Tukey published an efficient method for visually displaying a five-number summary referred to as the box-and-whisker plot. A box-and-whisker plot is a visually effective way of viewing a clear summary of one or more sets of data. It is particularly useful for quickly comparing different data sets. EXAMPLE 10 Determine the five-number summary and draw a box-and-whisker plot for the following data: 1 2 2 2 3 3 4 4 4 6 7 8 8 9 10 10 10 Solution Five number summary: Minimum: 1 Maximum: 10
Lower Quartile ( 1Q ): 12 3Q 2,5
2+= =
Median ( 2M or Q ): 2Q 4=
Upper Quartile ( 3Q ): 38 9Q 8,5
2+= =
Box-and-whisker plot:
1Q 2Q 3Q
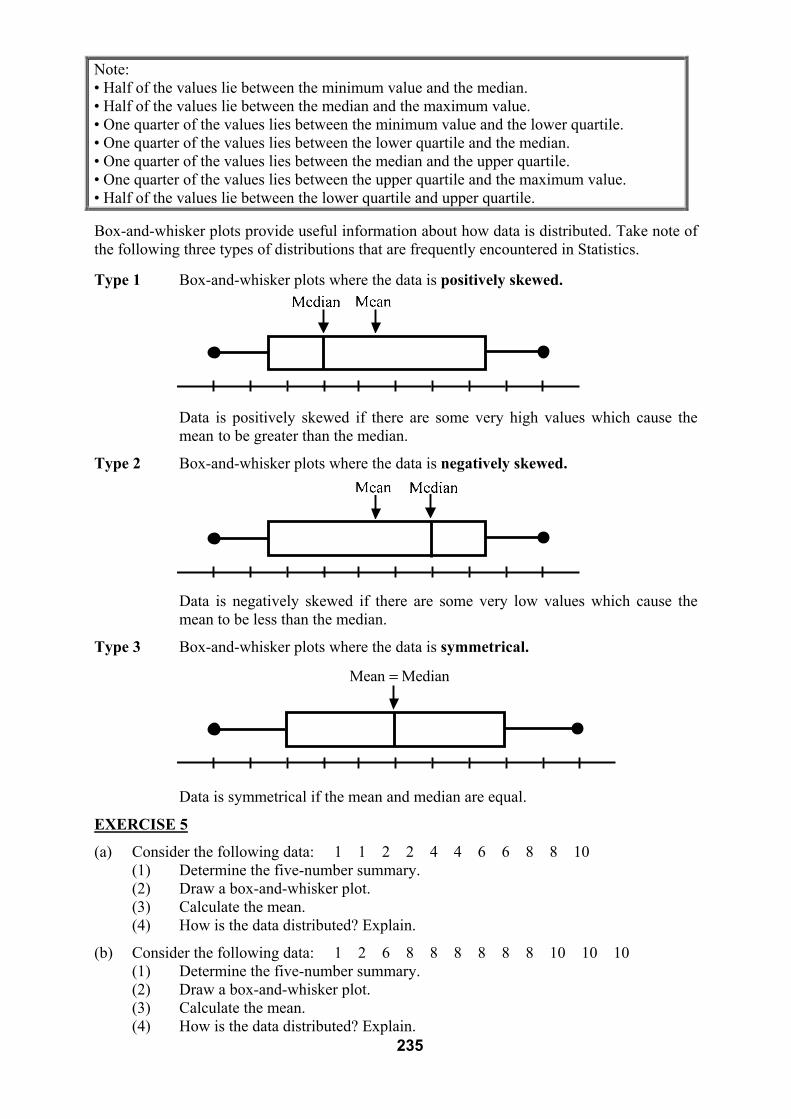
235
Note: • Half of the values lie between the minimum value and the median. • Half of the values lie between the median and the maximum value. • One quarter of the values lies between the minimum value and the lower quartile. • One quarter of the values lies between the lower quartile and the median. • One quarter of the values lies between the median and the upper quartile. • One quarter of the values lies between the upper quartile and the maximum value. • Half of the values lie between the lower quartile and upper quartile.
Box-and-whisker plots provide useful information about how data is distributed. Take note of the following three types of distributions that are frequently encountered in Statistics. Type 1 Box-and-whisker plots where the data is positively skewed.
Data is positively skewed if there are some very high values which cause the mean to be greater than the median.
Type 2 Box-and-whisker plots where the data is negatively skewed.
Data is negatively skewed if there are some very low values which cause the mean to be less than the median.
Type 3 Box-and-whisker plots where the data is symmetrical.
Data is symmetrical if the mean and median are equal.
EXERCISE 5
(a) Consider the following data: 1 1 2 2 4 4 6 6 8 8 10 (1) Determine the five-number summary. (2) Draw a box-and-whisker plot. (3) Calculate the mean. (4) How is the data distributed? Explain.
(b) Consider the following data: 1 2 6 8 8 8 8 8 8 10 10 10 (1) Determine the five-number summary. (2) Draw a box-and-whisker plot. (3) Calculate the mean. (4) How is the data distributed? Explain.
Mean Median=

236
(c) Consider the following data: 2 5 7 9 12 13 15 (1) Determine the five-number summary. (2) Draw a box-and-whisker plot. (3) Calculate the mean. (4) How is the data distributed? Explain. (d) Consider the following data: 2 2 2 4 4 6 6 8 8 10 10 10 (1) Determine the five-number summary. (2) Draw a box-and-whisker plot. (3) Calculate the mean. (4) How is the data distributed? Explain. (e) A salesman at a shoe store sold eight pairs of men’s shoes one morning. The sizes of the
eight pairs of shoes were as follows: 1 1 1 1
2 2 2 28 6 10 8 8 7 9 8
Draw a box-and-whisker plot for this data.
(f) A teacher records the following results for an examination out of 100: 98 63 79 76 58 71 86 78 91 87 89 41 19 88 41 99 97 83 78 90
Draw a box-and-whisker plot for this data.
(g) The estimated overall population percentage growth rates of South Africans over the past 13 years are given below.
1,27 1,29 1,32 1,35 1,38 1,40 1,43 1,46 1,49 1,52 1,55 1,57 1,58 1,59
Draw a box-and-whisker plot for this data.
(h) The prize money allocated to the first ten positions in the 2015 Comrades Marathon were as follows:
Position 1 Position 2 Position 3 Position 4 Position 5 R350 000 R175 000 R130 000 R65 000 R50 000 Position 6 Position 7 Position 8 Position 9 Position 10R30 000 R25 000 R22 000 R18 500 R16 500
[http://www.comrades.com/marathoncentre/faq/2-race-info/322-medals-and-prizes] (1) Draw a box-and-whisker plot. (2) How is the data distributed in the box-and-whisker plot? Explain. (i) Refer to Exercise 3 no (f). Draw a box-and-whisker plot for this data. (j) Refer to Exercise 3 no (g). Draw a box-and-whisker plot for this data. (k) The box and-whisker plots below summarise the final test scores for two Mathematics classes from the same grade.
(1) Describe the features in the scores that are the same for both classes. (2) The Head of Department considers the median of each class and reports that there
is no significant difference in the performance between them. Is this conclusion valid? Support your answer with reasons.

237
(l) Consider the following box-and-whisker plot:
The data set contains a total of nine numbers. The second and third number of the data set are the same. The seventh and eighth numbers are different. The mean for the data set is 40. Write down a possible list of nine numbers which will result in the above box-and- whisker plot.
MEASURES OF DISPERSION Measures of dispersion help us to determine how data is spread around the mean or median. This enables one to establish whether the data is grouped closely or scattered more widely. There are three measures of dispersion that we will consider: range, interquartile range and semi-interquartile range. The range The range is the difference between the highest and lowest scores in a data set and is the simplest measure of spread. We calculate the range as follows: Range =maximum value −minimum value The disadvantage of the range is that a great deal of information is ignored when calculating the range, since only the largest and smallest data values are considered. The range is greatly influenced by the presence of just one unusually large or small value (outlier). The interquartile range (IQR) The interquartile range is the difference between the upper and lower quartiles. It spans 50% of a data set and eliminates the influence of outliers because, in effect, the highest and lowest quarters are removed. It is a good measure of the spread of the data either side of the median. The semi-interquartile range The semi-interquartile range is the half the difference between the upper and lower quartiles and is also not affected by extreme scores. It is a good measure of spread for skewed distributions. EXAMPLE 11 Consider the following data: 1 2 2 2 3 3 4 4 4 6 7 8 8 9 10 10 30 (a) Determine the range, interquartile range and semi-interquartile range. (b) Which measure of dispersion is more suitable for this data, the range or interquartile range?

238
Solutions (a) Range 30 1 29= − =
Lower Quartile: 12 3Q 2,5
2+= =
Upper Quartile: 38 9Q 8,5
2+= =
IQR 3 1Q Q 8,5 2,5 6= − = − =
Semi-IQR 1 13 12 2(Q Q ) (6) 3= − = =
(b) The range is too inflated due to the influence of the maximum value 30. The interquartile range is a more realistic measure of dispersion. EXERCISE 6 [Use your work done in Exercise 5 to save you time in this exercise] Determine the range, interquartile range and semi-interquartile range for the following sets of data. Refer to Exercise 5 (a)-(d). (a) 1 1 2 2 4 4 6 6 8 8 10 (b) 1 2 6 8 8 8 8 8 8 10 10 10 (c) 2 5 7 9 12 13 15 (d) 2 2 2 4 4 6 6 8 8 10 10 10 (e) Determine the range, interquartile range and semi-interquartile range for the shoe sizes
in Exercise 5 (e). (f) Determine the range, interquartile range and semi-interquartile range for the marks in Exercise 5 (f). (g) Determine the range, interquartile range and semi-interquartile range for the population growth rates in Exercise 5 (g). (h) Determine the range, interquartile range and semi-interquartile range for the prize
money in Exercise 5 (h). (i) Determine the range, interquartile range and semi-interquartile range for the data in Exercise 5 (i). Which measure of dispersion is more suitable for the data? (j) Determine the range, interquartile range and semi-interquartile range for the data in Exercise 5 (j). Which measure of dispersion is more suitable for the data? (k) Consider the two classes A and B in Exercise 5 (k). (1) Compare the classes in terms of the range and interquartile range. (2) Compare the classes in terms of the semi-interquartile range. (l) Six data values are represented as follows: 3 ; 4 ; 2 2 ; 5 ; 4 1; 6 2x x x x x x+ + + + (1) Calculate the value of x if the mean is 12. (2) Determine the interquartile range. (m) In a data set made up of five numbers, the mean, median, mode and range are all equal.
Determine this data set. (n) The table below contains the mean, median and range of the Mathematics final exam for
a large group of students.
The Mathematics teacher added 3 marks to each of the students’ marks. Write down the mean, median and range for the new set of Mathematics.
Mean Median Range 56 51 86

239
REPRESENTING GROUPED DATA
In the section on representing ungrouped data, the values we dealt with were discrete. Discrete data can only take on certain values. For example, the number of goals scored by a football team is discrete since the team can score 1, 2, 3 or more goals, but not 2,5 goals. The data is restricted to natural numbers. However, data can also be continuous and take on an infinite number of real values within a range. For example, data containing the heights of people is continuous since heights are not restricted to integer values. One person may be 1,63 m tall, while another may be 1,64 m tall. It is also possible for someone to have a height of say 1,6399999 metres which lies between 1,63 m and 1,64 m.
Large sets of continuous data are grouped into class intervals. A class interval has a given range and consists of class boundaries. The upper class boundary is the maximum possible value which could be in the class interval and the lower class boundary is the minimum value which could be in the class interval. Since the data we are dealing with is continuous, the class intervals will overlap since there are no “gaps” in the data as in the case of discrete data. We will work with continuous grouped data and discuss the following concepts: the estimated mean, the median class interval and the modal class interval. These concepts will be explained in the following example.
EXAMPLE 12
Medical science has always recognised human growth and height as an important measure of the health and wellness of individuals. Research into the average height of people in different countries revealed that the tallest race of humans is the Nilotic peoples of Sudan having an average height of 1,83 m.
The tallest man currently living is Sultan Kösen from Turkey who measures 2,51 m. The average heights (ranging from 150-185 cm) of people in 135 countries have been grouped into class intervals. [Source: https://en.wikipedia.org/wiki/Template:Average_height_around_the_world]
(a) Calculate an estimated value for the mean. (b) What is the modal class? (c) In which class interval does the median lie? Solutions (a) The data is continuous and the actual average heights per class interval are not known. It is therefore impossible to calculate the actual mean for this data. We can, however, calculate an estimated value for this mean using the following method.
Calculate the midpoint of each class interval, which represents the average of all heights in that class interval. Simply calculate the average of the lower and upper class boundaries. Then multiply the frequencies with the corresponding midpoint. Add up the results, divide by the total frequencies and calculate the estimated mean for the data.
Class intervals (average heights in cm)
Frequency (number of countries)
150 155x≤ < 12 155 160x≤ < 15 160 165x≤ < 19 165 170x≤ < 25 170 175x≤ < 33 175 180x≤ < 22 180 185x≤ < 9

240
Estimated mean 22 707,5 168, 2037037 cm135
= =
Note: The upper boundary of the class interval 150 155x≤ < can have a value that is extremely close to 155. There may be a height of 154,999999… It therefore makes sense that the average of the class interval is the average of the lower and upper boundaries.
(b) Since 170 175x≤ < contains the highest frequency of heights, this class interval will be the modal class.
(c) It is not possible to determine the actual median. There are 135 values and therefore the position of the median is 1
2 (135 1) 68+ = . The 68th value lies in the class interval 165 170x≤ < (there are 46 values below 165 and 71 below 170). This class interval is called the median class.
Please take note that with discrete data represented in class intervals, some difficulties arise, especially when the actual data values are not known and just the frequencies are available. Consider the class interval 150 155x≤ < . Suppose that the actual unknown data values are whole numbers. Then the possible values in the class interval will be 150, 151, 152, 153 and 154. This means that the upper boundary will be 154 rather than 155. The midpoint would then be 150 154
2 152+ = rather than 150 1552 152,5+ = since 155 is excluded. If
154 is not in the class interval, then the upper boundary will be one of the other values. This complicates the calculation of the midpoint. Statisticians have developed advanced formulae to calculate estimated values for the mean, mode and median in grouped data with discrete values. This is not part of the school curriculum and therefore we will focus on estimating the mean in continuous grouped data.
EXERCISE 7
(a) A stopwatch was used to find the times that it took a group of athletes to run 100 m.
Class intervals (Time in seconds)
Frequency (number of athletes)
10 15x≤ < 6 15 20x≤ < 16 20 25x≤ < 21 25 30x≤ < 8
(1) Calculate the estimated mean. (2) What is the modal class? (3) In which class interval does the median lie?
Class intervals Frequency Midpoint Freq× Midpt 150 155x≤ < 12 150 155
2 152,5+ = 12 152,5 1 830× =
155 160x≤ < 15 155 1602 157,5+ = 15 157,5 2 362,5× =
160 165x≤ < 19 160 1652 162,5+ = 19 162,5 3 087,5× =
165 170x≤ < 25 165 1702 167,5+ = 25 167,5 4 187,5× =
170 175x≤ < 33 170 1752 172,5+ = 33 172,5 5 692,5× =
175 180x≤ < 22 175 1802 177,5+ = 22 177,5 3 905× =
180 185x≤ < 9 180 1852 182,5+ = 9 182,5 1 642,5× =
Totals 135 22 707,5

241
(b) In a research survey, a gym measured the weights (in kg) of a number of members.
Class intervals (weights in kg)
Frequency (number of members)
30 35x≤ < 11 35 40x≤ < 13 40 45x≤ < 15 45 50x≤ < 17 50 55x≤ < 19 55 60x≤ < 26 60 65x≤ ≤ 36
(1) Calculate the estimated mean. (2) What is the modal class? (3) In which class interval does the median lie?
(c) The raw data below shows an athlete’s different times in seconds in the 400 m. 43,0 43,1 45,3 44,8 44,9 46,3 44,8 46,3 46,1
45,4 44,7 43,1 44,9 45,3 45,2 45,5 45,6 45,0 45,1 46,2 45,9 43,2 43,3 43,8 43,9 43,7 45,3 45,7 44,7 46,2 45,7 44,9 45,0 45,5 46,0 46,9
(1) Draw a stem-and-leaf diagram for this data.
(2) Complete the following table:
Class interval Frequency 43,0 44,0x≤ < 44,0 45,0x≤ < 45,0 46,0x≤ < 46,0 47,0x≤ <
(3) Calculate the actual mean, median and mode for this data. (4) Calculate the range and interquartile range. (5) Draw a box-and whisker plot for the data. (d) The number of litres of diesel purchased by 30 truck drivers at a petrol station is
presented below (litres are rounded off to the nearest whole number). 82 64 55 50 49 44 52 59 68 74 71 78 88 98 96 77 75 54 57 56 64 66 80 84 88 72 71 65 68 97
(1) Draw a stem-and-leaf display for this data. (2) Organise the data into class intervals of your choice.
(3) Calculate the actual mean and median for this data. (4) Calculate the interquartile range.
CONSOLIDATION AND EXTENSION EXERCISE (a) A small company pays their employees hourly rates. The hourly rates of eight
employees are as follows: R36 R270 R90 R72 R54 R90 R54 R54 (1) Calculate the mean, median, mode and range for this data. (2) Which measure would the employer use to claim that the staff were well-paid? (3) Which measure would the employee use to claim that the staff were badly-paid?

242
(b) A gardener buys ten packets of seeds from two different companies. Each pack contains
25 seeds. The gardener records the number of plants which grow from each pack. Company A: 25 25 10 25 11 25 25 25 13 25 Company B: 22 23 20 21 23 23 22 20 22 23 (1) Which company does the mode suggest is best? (2) Which company does the mean suggest is best? (c) A fisherman records the number of fish caught over a number of fishing trips: 3 0 0 5 0 0 13 0 2 0 0 4 16 0 2 0 1 Why does the fisherman object to the mode and median of the number of fishes caught? (d) A school has to select one learner to take part in a Mathematics Quiz. Sandy and Paul
took part in six trial quizzes and the following are their scores: Sandy: 29 25 22 28 25 27 Paul: 34 20 17 33 35 19 By using the mean and range, which learner qualifies to represent the school in your
opinion? (e) The following frequency bar graph shows the number of laptops sold at a computer
store per week for six weeks. Calculate the mean number of laptops sold per week.
(f) A traffic officer is trying to work out the mean number of parking tickets she has issued
per day. She produced the table below, but some of the data has been erased.
Tickets per day Frequency No of tickets× frequency 0 1 1 1 2 10 3 7 4 20 5 2 6
Totals 26 72 Complete the table for her and then calculate the mean, median and mode.

243
(g) In a certain school, 60 learners wrote examinations in Maths and Science. Information for each subject is provided below.
Maths Science Minimum 30 Minimum 30 Maximum 85 Range 55 Median 45 Upper quartile 70 Lower quartile 40 Interquartile range 30 Upper quartile 50 Median 55 (1) Draw a box-and-whisker plot for both subjects. (2) The teacher argues that the number of learners who scored between 30 and 45 in
Maths is smaller than the number who scored between 30 and 55 in Science. Does she have a valid argument? Explain.
(h) The following table represents the percentage of monthly income spent on petrol and
car expenses by fifty people. Calculate the estimated mean, modal class and the interval containing the median.
Percentage Frequency 12 18p≤ < 8 18 24p≤ < 20 24 30p≤ < 12 30 36p≤ < 8 36 42p≤ ≤ 2
(i) The mean height of a class of 30 learners is 164 cm. A new boy of height 148 cm joins the class. Calculate the mean height of the class now. (j) After five matches, the mean number of goals scored by Orlando Pirates per match is
1,8. If Pirates scores three goals in their next match, what is the mean then? (k) The mean weight of 27 learners in a class is 62 kg. The mean weight of a second class
of 30 learners is 59 kg. Calculate the mean weight of all the learners. (l) The mean monthly salary of the eight people who work for a small company is R18 000.
When an extra employee is hired, this mean drops to R17 000. How much does the new employee earn?
(m) Consider the following set of data values: ; 2 1; 2 ; 2 2 ; 3 1x x x x x− + − The inter-quartile range is 6. Determine the value of x.

244
CHAPTER 11 MEASUREMENT
In Grade 9 you studied the surface area and volume of cubes, cuboids (rectangular prisms), triangular prisms as well as cylinders. You also discussed the effect on surface area and volume when the dimensions are multiplied by a scale factor (k). In Grade 10, we will revise this Grade 9 work and then we also study the surface area and volume of right pyramids, cones and spheres. SUMMARY OF FORMULAE FOR SURFACE AREA AND VOLUME OF PRISMS
Prism Surface area Volume Cuboid (Rectangular prism)
Sum of the areas of the six rectangles: Surface area
Area of a chosen base multiplied by the distance moved by the base (height). Volume
Cube Sum of the areas of the six squares:
Surface area
2
2( )( ) 2( )( ) 2( )( )
6
a a a a a a
a
= + +
=
Area of a chosen base multiplied by the distance moved by the base (height). Volume
Triangular prism
Sum of the areas of two triangles and three rectangles.Surface area
Area of a chosen base multiplied by the distance moved by the base (height). Volume
Cylinder
Sum of the areas of two circles and a curved surface. If the cylinder is closed: Surface area If open on top (or bottom): Surface area 2 2r rh= π + π If open on top and bottom: Surface area 2 rh= π
Area of a chosen base multiplied by the distance moved by the base (height). Volume 2r h= π
2 2 2ab ac bc= + +( )ab cabc
= ×=
3a=
12 ( )2
b h ad bd cd
bh ad bd cd
= × + + + = + + +
( )bh d a b c= + + +
1 ( )212
b h d
bhd
= × ×
=
22 2r rh= π + π

245
Converting between units Converting between lengths
Converting between areas
Converting between volumes
Converting between capacities
EXAMPLE 1 A closed hollow prism made of sheet metal is shown. Calculate: (a) the external surface area
(b) the volume in 3m (c) the volume in 3cm Solutions (a) Let’s first calculate the external surface area of the top triangular prism ABCDEF
which is open at the bottom. We need the length of AC: 2 2 2AC (1,96) (2,12)= + 2AC 8,336∴ = AC 8,336 2,887213189 m∴ = = Draw a net of the prism. The triangular prism is made up of two triangles and two rectangles (bottom of prism is open)
Area of 21ABC (2,12)(1,96) 2,0776 m2
Δ = =
Area of 21EFD (2,12)(1,96) 2,0776 m2
Δ = =
Area ABFE 2(5,13)(1,96) 10,0548 m= = Area ACDE 2(5,13)( 8,336) 14,81140366 m= =
km m cm mm
×
÷
10 10 10 1010 10
×
÷
100 100 100 100100 1002km 2m 2cm 2mm
×
÷
10003km 3m 3cm 3mm
1000 1000 1000 1000 1000
×
÷
1000
kl l3cm
ml
10003m
3
3
11
1 m cm1 k m
l
l
=
=
ABCΔ
EFDΔ

246
Surface area of top triangular prism
2 2 2 2
2
2,0776 m 2,0776 m 10,0548 m 14,81140366 m
29,02140366 m
= + + +
=
Now let’s calculate the surface area of the bottom rectangular prism (open on top) Area BHGF = Area CIJD 2(5,13)(2,79) 14,3127 m= = Area FGJD = Area BHIC 2(2,79)(2,12) 5,9148 m= = Area HIJC 2(5,13)(2,12) 10,8756 m= = Surface area of rectangular prism 2 2 22 14,3127 m 2 5,9148 m 10,8756 m= × + × + 251,3306 m= Therefore, the surface area of the entire prism
2 2
2
29,02140366 m 51,3306 m
80,35 m
= +
=
(b) Let’s first calculate the volume of the top triangular prism ABCDEF. The base in this prism is ABCΔ . Volume
3
area of base distance moved by basearea of base height1 (2,12)(1,96) 5,13210,658088 m
= ×= ×
= ×
=

247
Now let’s calculate the volume of the bottom rectangular prism. Volume
3
area of base distance moved by basearea of base height(2,79)(2,12) 5,13
30,342924 m
= ×= ×= ×
=
The volume of the entire prism
3 3
3
10,658088 m 30,342924 m
41,001012 m
= +
=
(c) The volume in 3cm is 3 341,001012 m 1000 1000 41 001 012 cm× × = EXAMPLE 2 A cylindrical drinking glass is made up of a solid glass base and a top curved part made of glass and which is hollow and open on top. Calculate: (a) the total volume of the drinking glass (b) the capacity of the drinking glass in l (c) the internal surface area of the glass Solutions Remember that the volume is the amount of space occupied by the prism whereas the capacity is the amount of substance that the prism can hold. (a) Convert 16 mm to cm: 16 mm 10 1,6 cm÷ = Volume (space occupied by entire glass)
2
3
area of base distance moved by base
π(4) 10,6
532,81 cm
= ×
= ×
=
(b) Capacity (amount of liquid that the glass can contain)
2
3
area of base distance moved by base
π(4) 9
452,3893421 cm0,4523893421 l
= ×
= ×
==
(c) Internal surface area (open on top and therefore excludes the top circle)
2
2
π(4) 2π(4)(9)
276,46 cm
= +
=

248
EXERCISE 1 (Revision) In this exercise, answers must be rounded off to two decimal places where appropriate.
(a) Consider the following three closed hollow prisms:
(1) Calculate the volume ( 3cm ) of each of the three prisms. (2) Calculate the surface area ( 2cm ) of each of the three prisms.
(3) If the cylinder and cuboid (rectangular prism) are open on top, calculate the surface area of these prisms.
(b) Three solid wooden objects, a rectangular prism (A), a cube (B) and a cylinder (C), are shown below. (1) Show that A and B have the same volume.
(2) Calculate the value of r for which C has the same volume as A and B.
(3) Assuming that the radius of C is the same as the value calculated in (2), which prism will have the largest surface area? (c) A company manufacturing solid chocolate bars has two new packaging containers that will have same amount of chocolate inside. The one container is a triangular prism with an equilateral triangle as a base. The other is a rectangular prism. The company wants to cut down on the cost of the cardboard used for making a container. Determine which container will be the least expensive to wrap.
(d) (1) The surface area of a rectangular prism is 136 2cm . If the length is 80 mm and the width is 4 cm, calculate the height of the prism. (2) If the volume of a triangular prism is 1 400 3cm and the height is 20 cm, then calculate the area of the base.
(3) The surface area of a cube is 384 2cm . Calculate the length of a side. (4) The surface area of a closed cylinder is 2(120 ) cm .π If the height is 7 cm, calculate the radius.
20 cmπ

249
(e) The holes on a minigolf course consist of a variety of designs. An example is shown alongside. The diagram below shows a hole consisting of a triangular prism made of cement (A), a rectangular prism made of wood (B) and a larger hollow rectangular prism made of steel which is open on top (C) and is filled with water. Area D is a flat rectangle with the small hole for the ball to be putted into.
The external surface area of the structure (excluding the bottom of A, B and C and the top of C) as well as the rectangle D (excluding the small hole) is covered with a green material.
(1) Calculate the volume of the structure (A, B and C) in 3cm and l.
(2) Calculate the capacity of the structure (the total amount of water that can be contained in C) in ml and l. (3) Calculate the amount of green material used to cover the external surface area
of the structure and the area D. Express your answer in 2cm . THE EFFECT OF MULTIPLYING DIMENSIONS BY A SCALE FACTOR
In Grade 9, you studied the effect on volume and surface area when multiplying any dimension by a scale factor. You will have discovered that when the dimensions of a prism are multiplied by a number k (called the scale factor), then the relationship between the surface area and volume is as follows:
The surface area of the new prism formed after multiplying the dimensions of the original prism by a scale factor k is equal to 2k ×surface area of original prism. (See Ex 2 no (a)) The volume of the new prism formed after multiplying the dimensions of the original prism by a scale factor k is equal to 3k × volume of original prism. (See Ex 2 no (a))
If 1k > then the new prism formed is an enlargement of the original prism. If 0 1k< < then the new prism formed is a reduction of the original prism. The original prism and the enlarged (or reduced) prism are similar to each other.
EXAMPLE 3
The surface area of a cube is 22 400 cm and its volume is 38 000 cm . Determine the surface area and volume of the cube formed if the dimensions of the original cube are multiplied by a scale factor of 3.
Solution
Surface area of larger cube 2 2 23 2 400 cm 21 600 cm= × = Volume of larger cube 3 2 23 8 000 cm 216 000 cm= × =
1m
250
EXERCISE 2 (a) A cylinder has a height of 6 cm and a diameter of 8 cm. The dimensions are doubled.
(1) What is the scale factor?
(2) Show that the surface area of the enlarged cylinder is 2k × surface area of original.
(3) Show that the volume of the enlarged cylinder is 3k × surface area of original.
(b) The surface area of a cuboid is 20,0292 m and its volume is 324 cm . (1) Determine the surface area (in 2cm ) and volume (in 3cm ) of the cuboid formed if the dimensions of the original cuboid are multiplied by 5.
(2) Suppose that the volume of the original cuboid is increased by 8 times its value. What is the surface area of the enlarged cuboid? (c) The surface area of a cube is 296x and its volume is 364x . Determine, in terms of x:
(1) the surface area and volume of the cube formed if the dimensions of the original cube are halved.
(2) the length of a side of the reduced cube. (d) A cylinder has a height of 8 cm and a radius of 7 cm. The height remains constant but the radius is doubled.
(1) What is the volume of the enlarged cylinder?
(2) How does the volume of the larger cylinder relate to the volume of the original cylinder?
(3) What is the surface area of the enlarged cylinder?
(4) How does the surface area of the larger cylinder relate to the surface area of the original cylinder? (e) A cylinder has a height of b units and a diameter of 2a units.
(1) Determine the volume and surface area in terms of a and b.
(2) If you want to double the volume but keep the radius the same, by what scale factor will the height increase?
(3) If the radius is doubled but the height stays the same, by what number will the area of the base of the cylinder increase?
(4) If the radius is doubled but the height stays the same, by what number will the area of the side surface of the cylinder increase?
(f) Cylinder A and B are similar. The volume of A is 3240 cm . (1) Calculate the scale factor and hence the volume of B. (2) Calculate the ratio of the surface areas of A and B. (g) Two soup tins are similar. Tin P can hold 500 grams of soup while tin Q can hold 750 grams of soup. The height of tin P is 11 cm. (1) Calculate the height of tin Q. (2) Calculate the ratio of the areas of the circular bases. (h) The heights of two similar cuboids are in the ratio 4:5. (1) Calculate the ratio of the surface areas of the cuboids. (2) Calculate the the ratio of the volumes of the cuboids.
3240 cm
500 g 750 g

251
PYRAMIDS, SPHERES AND CONES A pyramid is a polyhedron in which three or more triangles are based on the sides of the polygonal base and meet in one point called the apex of the pyramid. Right pyramids are such that the apex is perpendicularly above the centre of the regular base. The right pyramid shown has a square base and four congruent triangles meeting at the apex of the pyramid. A sphere is a perfectly round object in three-dimensional space that resembles the shape of a completely round ball. It is not a polyhedron. The points on the surface of the sphere are the same distance from the centre. The radius is the straight line from any point on the sphere to its centre. A right circular cone is similar to a pyramid in that it has an apex. The difference is that it has a circular base. Formulae for the surface area and volume of right pyramids, spheres and cones In the CAPS curriculum, we focus on the surface area and volume of right pyramids with bases that are either equilateral triangles or squares, cones and spheres.
Solid Surface area Volume Right triangular pyramid
Sum of the area of the base (equilateral triangle) and three congruent triangles.
1V (A H)3
= ×
where: A area of base= H height=
Right square pyramid
Sum of the area of the base (square) and four congruent triangles.
1V (A H)3
= ×
where: A area of base= H height=

252
Sphere
2S 4 r= π where r is the radius of the sphere
34V3
r= π
Cone
2S rl r= π + π where:
l is the slant height
rlπ is the area of the curved surface
2rπ is the area of the circular base
21V3
r h= π
EXAMPLE 4
The Louvre Pyramid located in Paris is a large right square pyramid made of metal and glass. It serves as the main entrance to the Louvre Museum which houses famous paintings such as the Mona Lisa. The length of one side of the base is 35,4 m and the height is 21,6 m. The base of the pyramid is open. Calculate: (a) the exterior surface area of the pyramid (metal and glass). (b) the volume of the pyramid.
Solutions (a) The exterior surface area consists of the sum of the areas of the four congruent triangles: ABC , ACD , AED and ABEΔ Δ Δ Δ
Area of 1 1ABC (BC)(AG) (35,4)(AG)2 2
Δ = =
Now 1 1GF CD (35,4) 17,7 m2 2
= = =
2 2 2AG (17,7) (21,6)= + 2AG 779,85∴ = AG 27,92579453 m∴ =
∴Area of 21ABC (35,4)(27,9257953) 494,2865631 m2
Δ = =
35,4 m35,4 m
A
B
C
D
E
FG
17,7 m
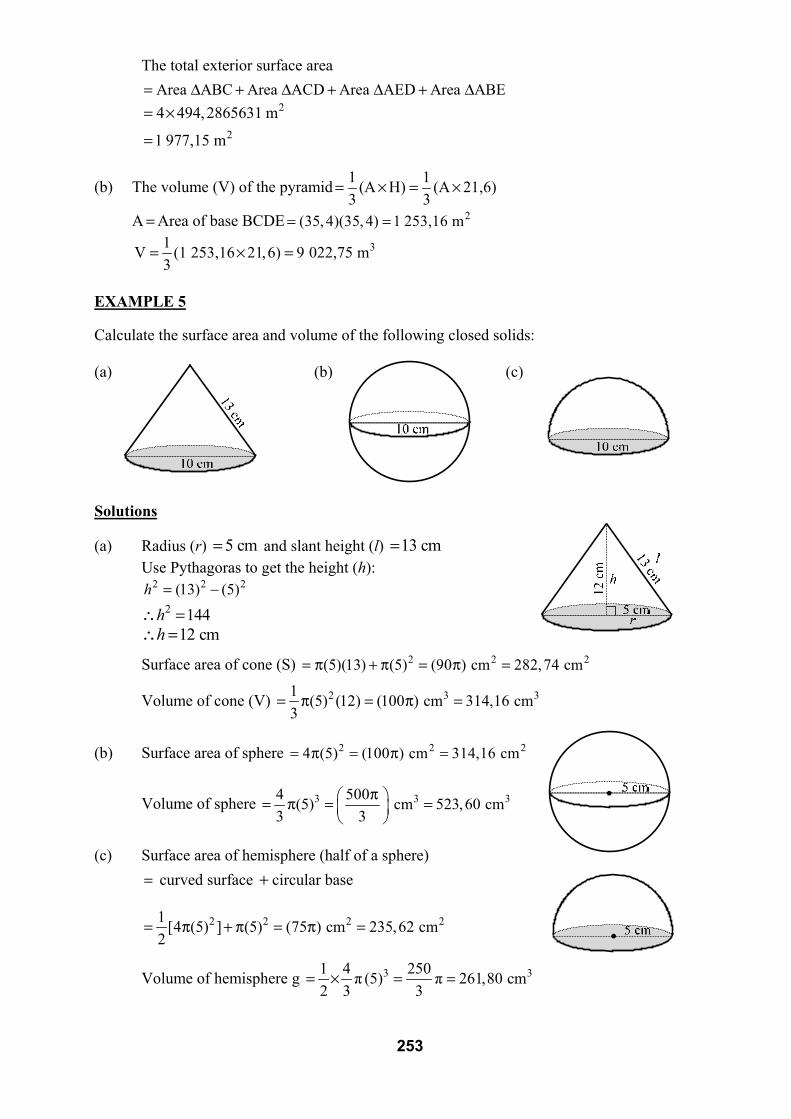
253
The total exterior surface area
Area ABC Area ACD Area AED Area ABE= Δ + Δ + Δ + Δ
2
2
4 494,2865631 m
1 977,15 m
= ×
=
(b) The volume (V) of the pyramid 1 1(A H) (A 21,6)3 3
= × = ×
A = Area of base BCDE 2(35, 4)(35, 4) 1 253,16 m= =
31V (1 253,16 21,6) 9 022,75 m3
= × =
EXAMPLE 5 Calculate the surface area and volume of the following closed solids:
(a) (b) (c)
Solutions (a) Radius (r) 5 cm= and slant height (l) 13 cm=
Use Pythagoras to get the height (h): 2 2 2(13) (5)h = − 2 144h∴ = 12 cmh∴ =
Surface area of cone (S) 2 2 2(5)(13) (5) (90 ) cm 282,74 cm= π + π = π =
Volume of cone (V) 2 3 31 (5) (12) (100 ) cm 314,16 cm3
= π = π =
(b) Surface area of sphere 2 2 24 (5) (100 ) cm 314,16 cm= π = π =
Volume of sphere 3 3 34 500(5) cm 523,60 cm3 3
π = π = =
(c) Surface area of hemisphere (half of a sphere)
= curved surface + circular base
2 2 2 21 [4 (5) ] (5) (75 ) cm 235,62 cm2
= π + π = π =
Volume of hemisphere g 3 31 4 250π (5) π 261,80 cm2 3 3
= × = =

254
EXERCISE 3 (a) Calculate the surface area and volume of the following closed solids. Round your answers off to two decimal places. (1) (2) (3) (4) (5) (6) (b) The base of the given triangular prism is an equilateral triangle. The height of the prism is 12 cm and the length of a side of the triangular base is 10 cm. Calculate: (1) the area of the triangular base ( BCDΔ ) (2) the area of ABCΔ (3) the surface area of the prism (4) the volume of the prism (c) A frustum is formed by removing a small cone from a similar larger cone. The height of the small cone is 20 cm and the height of the larger cone is 40 cm. The diameter of the larger cone is 30 cm. Calculate: (1) the radius of the small cone (2) the volume of the frustum

255
(d) The given solid made of clay consists of a cone and a cylinder. The dimensions are shown in the diagram. The solid is re-moulded into a sphere. Calculate the radius of the sphere. (e) A solid right circular cone is placed centrally within a container in the shape of a hemisphere. The radius of the hemisphere is 20 cm and the distance from the circular base of the cone to the top of the hemisphere is 2 cm. Calculate the volume of the right circular cone. Round off your answer to the nearest whole number. (f) A barn is constructed as follows: The room space is constructed as a right rectangular prism with a square base. The length of one side of the base of the prism is equal to 15 metres. The height of the wall of the room is 20 metres. The roof is constructed in the form of a right triangular pyramid with a height of 10 metres. The base of the roof is open. Calculate: (1) the total exterior surface area of the barn. (2) the volume of the barn.
CONSOLIDATION AND EXTENSION EXERCISE (a) A closed hollow prism is made up of a rectangular prism and a prism with a trapezium base. The formula for the area of a trapezium is:
12 (sum of the || sides) height× ⊥
Calculate, rounded off to two decimal places: (1) the volume of the prism (2) the external surface area of the prism
20 c
m70
cm

256
(b) A closed prism of height 8 cm has a regular hexagonal base with each side equal to 5 cm. The hexagonal base is made up of six equilateral triangles. Calculate: (1) the area of the hexagonal base ABCDEF. (2) the volume of the hexagonal prism. (c) A cardboard sweet box has the form of a cylindrical wedge. The dimensions are shown in the diagram. The depth of the box is 7 cm. (1) Calculate the area of top face ABC. (2) Calculate the volume of the box. (3) If a new similar box is created to be twice the volume of the original box, calculate the depth of the new box. (d) A rectangular water tank is 12 m long, 11 m wide and 10 m high. The water depth is 8 m. A large metal ball of diameter 7 m is dropped into the water and it sinks to the bottom. Calculate the rise in the water level (rounded off to three decimal places). (e) A right cone is fits exactly into a right square pyramid. The radius of the cone’s base is r units. The height of both prisms is h units. (1) Determine the ratio of the area of the circle base to the area of the square base. (2) Hence write down the ratio of the cone’s volume to the square pyramid’s volume? (3) What is the square pyramid’s volume in terms of r and h?
(4) Hence show that the cone’s volume is 213
r hπ
60°
rA
B
C
D
F
E
h

257
CHAPTER 12 PROBABILITY
THE PROBABILITY SCALE In Grade 8 and 9 you were introduced to the concept of probability and the probability scale. Remember that the probability of an event happening is a number in the interval [0 ;1] . We may regard an event with a probability of 0 as impossible and events with probabilities close to 0 as unlikely. Events with a probability of 1 are certain to happen and events with probabilities close to 1 are likely to happen. We can express probabilities as fractions, decimals or percentages. EXPERIMENTS, SAMPLE SPACES AND EVENTS An experiment is a natural or man-made occurrence that can have different possible outcomes. Examples include: tossing a coin, rolling a die or tomorrow’s weather. An event is a collection of outcomes that satisfy a certain condition. If you roll a die, the die can land on 1, 2, 3, 4, 5 or 6. These are the six outcomes of the experiment. The outcomes can be described as ‘the die lands on an even number’. The probability of an event occuring The probability of an event can be calculated as follows:
number of outcomes in the eventProbability of eventtotal number of outcomes in the experiment (sample space)
=
EXAMPLE 1 A six-sided die is rolled. What is the probability that it lands on an even number? Solution Outcomes: { 1 ; 2 ; 3 ; 4 ; 5 ; 6} Outcomes in event: { 2 ; 4 ; 6 }
Probability 3 16 2
= =
EXAMPLE 2 A coin is tossed twice. What is the probability of getting heads twice? Solution Outcomes: { HH ; HT ; TH ; TT} Outcomes in event: { HH }
Probability 14
=
16 10
20 C− °
12
34

258
The relative frequency of an event When an experiment is repeated many times, the number of times a certain event takes place is called its frequency. When this is divided by the number of times the experiment was repeated, the result is called the relative frequency of the event:
Relative frequency of event frequency of eventTotal number of times experiment is repeated
=
When the experiment is repeated many times, the relative frequency should eventually approach the calculated or theoretical probability of the event. EXAMPLE 3 A coin is tossed 100 000 times. The coin lands on heads 49 996 times. Calculate the relative frequency of this event and establish whether it approximates the theoretical probability. Solution
Probability that the coin lands on heads 1 0,52
= =
Relative frequency frequency of event 49 996 0,49996Total number of times experiment is repeated 100 000
= = =
Since 0, 49996 0,5≈ , the relative frequency approximates the theoretical probability. EXAMPLE 4 A die is rolled 12 000 times. Approximately how many times do you expect the die to land on a factor of 6. Solution Outcomes: { 1 ; 2 ; 3 ; 4 ; 5 ; 6 } Factors of 6: { 1 ; 2 ; 3 ; 6 }
Theoretical probability 4 26 3
= =
Relative frequency frequency 2number of repetitions 12 000 3
f= = ≈
2 12 000 8 0003
f∴ ≈ × = times
EXAMPLE 5 The letters of the word EXCELLENCE are written on different cards and placed in a box. (a) Determine the probability of taking out, at random, the letter E. (b) Determine the probability of taking out, at random, the letter X or C. (c) Suppose that the letter N is taken out of the box and not placed back into the box. What is the probability of now taking out one letter E? Solutions
(a) Probability 4 210 5= = [there are 4 E’s out of a total of 10 letters in the given word]
(b) Probability of X or C 31 210 10 10= + =
(c) If the letter N is not replaced, then there will be 9 letters to choose from. Probability 4
9=

259
EXERCISE 1 (a) 70 tickets were sold in a competition. The prize is a smartphone. Mpho decided to buy
12 tickets. What is the probability that he will: (1) win the prize? (2) not win the prize? (b) A six-sided die is thrown. Determine the probability of: (1) throwing a 6 (2) throwing a 3 or a 4 (3) throwing an even number (4) not throwing a 2 (c) A container is filled with 5 blue blocks, 8 red blocks, 6 green blocks and 9 white
blocks. A block is taken out of the container at random. Find the probability of taking out:
(1) a blue block (2) a white block (3) a red or green block (4) a brown block (5) any block that is not white (d) A cupboard contains 5 shirts, 3 pairs of jeans and 8 pairs of socks. (1) What is the probability of taking out, at random, one pair of socks? (2) What is the probability of taking out, at random, a shirt or pair of jeans? (3) What is the probability of not taking out a pair of jeans? (4) Assuming that you have already taken out a pair of socks from the cupboard and
put them on your feet. What will the probability now be of taking out a shirt? (e) There are 52 cards in a standard deck of cards of which 13 are hearts. A card is drawn
at random, returned, and then the deck is reshuffled. This is repeated 50 000 times. Which of the following do you consider to be the most reasonable answer for the number of times that a card of hearts was chosen? Motivate your answer.
A. 31 210 B. 2003 C. 12 685 D. 25 443 (f) The letters of the word IMAGINATION are written on different cards and placed in a
box. (1) Determine the probability of taking out, at random, the letter I. (2) Determine the probability of taking out, at random, the letter G or N. (3) Suppose that the letter T is taken out of the box and not placed back into the box. What is the probability of now taking out one letter A?
(g) A card is drawn from a pack of 52 cards. Determine the probability of drawing: (1) a heart (2) a jack of clubs (3) an ace (4) a king or queen (5) neither a heart or a spade
(h) Complete the following table. Determine the probabilities in common fraction form.
Scenario Additional information
Event Probability of event
A standard six-sided die is rolled.
No additional information.
The die lands on a number less than 3.
(1)
Two standard six-sided dice are rolled (one green and one red)
The number on the green is less than the number on the red.
The sum of the two numbers is seven.
(2)
A couple has two children
No additional information.
At least one of the children is female.
(3)
A couple has two children
The oldest child is male.
Both children are male. (4)
A couple has two children
At least one of the children is male.
Both children are male. (5)

260
(i) A dart is thrown at random onto a board that has the shape of a circle as shown in the figure. Calculate the probability that the dart will hit the shaded region. The two circles are concentric (have the same centre).
(j) An arrow is shot at random onto rectangle ABCD. E, F, G and H are the midpoints of the sides of rectangle ABCD. Let ED x= and DH y= . Calculate the probability of the arrow: (1) landing in AEFΔ . (2) landing in the shaded region. (3) landing in either in CGHΔ or the unshaded area. PROBABILITY IN TERMS OF SETS – VENN DIAGRAMS The set of all possible outcomes of an experiment is called the sample space and is denoted by the symbol S. When rolling a die, the sample space is given by the set
{ }S 1; 2 ; 3 ; 4 ; 5 ; 6= . An event is a subset of the sample space and is denoted by a given capital letter A, B, C and so forth. When rolling a die, if A is the event in which the die lands on an even number, then { }A 2 ; 4 ; 6= . We use a special diagram, called a Venn diagram to represent events in a sample space. The sample space is represented by a rectangle and the events by circles inside the rectangle. There are three types of Venn diagrams: (1) Venn diagrams showing the actual outcomes (2) Venn diagrams showing the number of outcomes (3) Venn diagrams showing probabilities EXAMPLE 6 A die is rolled. Let A be the event in which the die lands on an even number. Draw a Venn diagram showing the: (a) outcomes (b) number of outcomes (c) probabilities Solutions (a) (b) (c)
AS
33
AS
12 1
2
The actual outcomes are shown. The three even numbers 2, 4 and 6 are written in the circle with the odd numbers 1, 3, and 5 on the outside of the circle.
The number of outcomes are shown. The number 3 for there being 3 even numbers is written inside the circle and the number 3 for there being 3 odd numbers is written outside of the circle.
The probability of getting an even number is 1
2 . This is written inside the circle. The 1
2 outside the circle is for the odd numbers.

261
The formula for the probability of an event
The probability of event E occurring is given by the formula: (E)P(E)(S)
nn
=
where P(E) is the probability of event E occurring, (E)n is the number of outcomes in E and (S)n is the number of outcomes in the sample space.
EXAMPLE 7 The letters of the word ENGLISH are written on cards and placed in a hat. One card is drawn randomly. Let A be the event in which a consonant is drawn. (a) Draw a Venn diagram showing all outcomes. (b) Write down the outcomes of the sample space (S) and event A in set form. (c) Write down (A)n and (S)n (d) Calculate P(A) Solutions
(a) (b) Sample space { }S E ; N ; G ; L ; I ; S ; H= Event { }A N ; G ; L ; S ; H= (c) (A) 5n = (S) 7n =
(d) (A) 5P(A)(S) 7
nn
= =
Sometimes we can consider more than one event simultaneously. When doing this we must establish whether the events overlap (share outcomes or not). EXAMPLE 8 A 12-sided dodecahedral die is rolled. The following events are defined:
{ }A multiples of 3=
{ }B factors of 9=
{ }C multiples of 5= (a) List the outcomes in set form. (b) Draw a Venn diagram to represent these events. (c) Determine P(A) , P(B) and P(C) . Solutions
(a) { }A 3 ; 6 ; 9 ;12= { }B 1; 3 ; 9= { }C 5 ;10= Notice that A and B have outcomes 3 and 9 in common whereas C has no outcomes in common with A or B.
(b) (c) (A) 4 1P(A)(S) 12 3
nn
= = =
(B) 3 1P(B)(S) 12 4
nn
= = =
(C) 2 1P(C)(S) 12 6
nn
= = =

262
EXERCISE 2 (a) A six-sided die is rolled. Let A be the event “getting an odd prime number”. (1) Write down the set A, (A)n and P(A) . (2) Draw a Venn diagram showing the actual outcomes. (3) Draw a Venn diagram showing the number of outcomes. (4) Draw a Venn diagram showing the probabilities. (b) The letters of the word RANDOMLY are written on cards and placed in a hat. One card
is drawn randomly. Let A be the event in which a vowel is drawn. (1) Draw a Venn diagram showing all outcomes. (2) Write down the outcomes of the sample space (S) and event A in set form. (3) Write down (A)n and (S)n (4) Calculate P(A) (c) A twelve-sided die is rolled. The following events are defined: { }A the first five natural numbers= { }B the first two multiples of 5= (1) Write down the set A, (A)n and P(A) . (2) Write down the set B, (B)n and P(B) . (3) Draw a Venn diagram to represent the actual outcomes. (4) Draw a Venn diagram to represent the number of outcomes. (5) Draw a Venn diagram to represent the probabilities. (d) A twelve-sided die is rolled. The following events are defined: { }A the first five prime numbers= { }B the first two multiples of 6= (1) Write down the set A, (A)n and P(A) . (2) Write down the set B, (B)n and P(B) . (3) Draw a Venn diagram to represent the actual outcomes. (4) Draw a Venn diagram to represent the number of outcomes. (5) Draw a Venn diagram to represent the probabilities. (e) Consider the given Venn diagram. (1) Write down the sets S, A, B and C. (2) Write down (A)n , (B)n and (C)n . (3) Calculate P(A) , P(B) and P(C) . (4) Redraw the Venn diagram showing the number of outcomes. (5) Redraw the Venn diagram showing the probabilities. (f) In a survey conducted at a music store in Johannesburg, it was found that 120 people
bought only Trance music, 150 bought only Deep House music and 100 people bought both. Twenty people did not buy either Trance or Deep House music.
Let { }T Trance music= and { }D Deep House music= (1) Draw a Venn diagram to represent events T and D. (2) Determine (T)n , (D)n and (S)n . (3) Calculate the probability of selecting, at random, a person who likes only Deep
House music. (4) Calculate the probability of selecting, at random, a person who likes only Trance
music. (5) Calculate the probability of selecting, at random, a person who likes neither types
of music. (6) Calculate the probability of selecting, at random, a person who likes both types of
music.
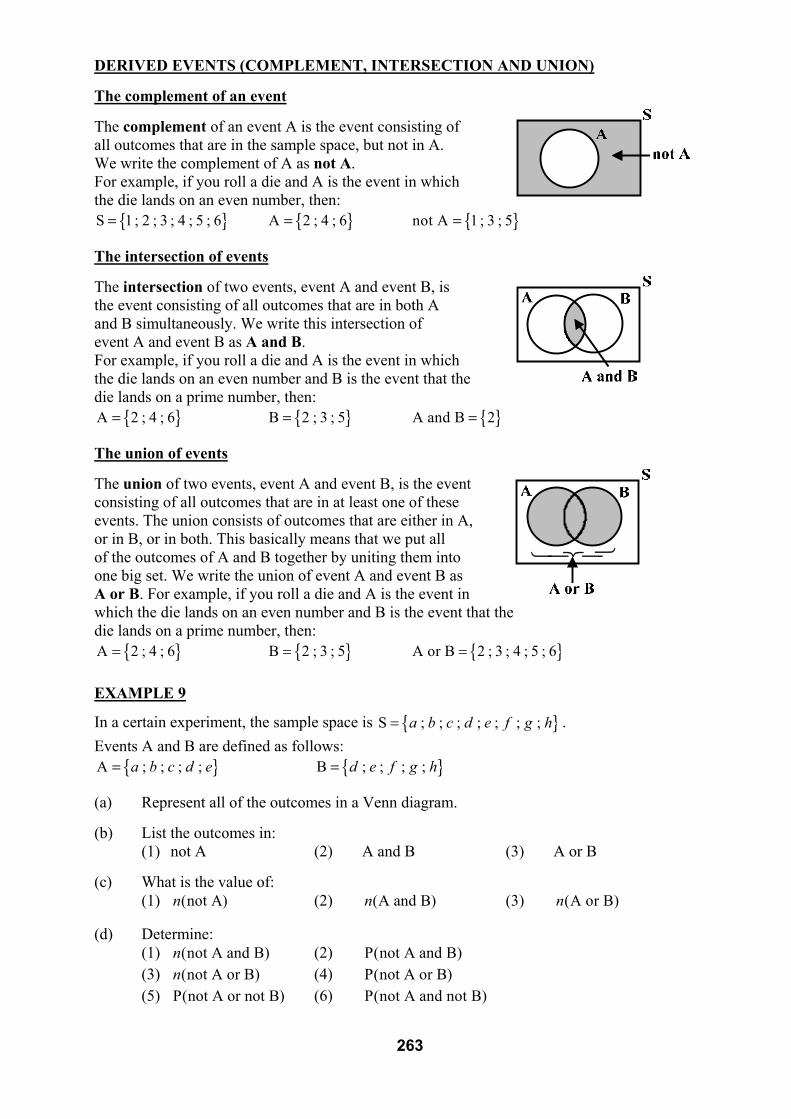
263
DERIVED EVENTS (COMPLEMENT, INTERSECTION AND UNION) The complement of an event The complement of an event A is the event consisting of all outcomes that are in the sample space, but not in A. We write the complement of A as not A. For example, if you roll a die and A is the event in which the die lands on an even number, then:
{ }S 1; 2 ; 3 ; 4 ; 5 ; 6= { }A 2 ; 4 ; 6= { }not A 1 ; 3 ; 5= The intersection of events The intersection of two events, event A and event B, is the event consisting of all outcomes that are in both A and B simultaneously. We write this intersection of event A and event B as A and B. For example, if you roll a die and A is the event in which the die lands on an even number and B is the event that the die lands on a prime number, then:
{ }A 2 ; 4 ; 6= { }B 2 ; 3 ; 5= { }A and B 2= The union of events The union of two events, event A and event B, is the event consisting of all outcomes that are in at least one of these events. The union consists of outcomes that are either in A, or in B, or in both. This basically means that we put all of the outcomes of A and B together by uniting them into one big set. We write the union of event A and event B as A or B. For example, if you roll a die and A is the event in which the die lands on an even number and B is the event that the die lands on a prime number, then:
{ }A 2 ; 4 ; 6= { }B 2 ; 3 ; 5= { }A or B 2 ; 3 ; 4 ; 5 ; 6= EXAMPLE 9
In a certain experiment, the sample space is { }S ; ; ; ; ; ; ;a b c d e f g h= . Events A and B are defined as follows:
{ }A ; ; ; ;a b c d e= { }B ; ; ; ;d e f g h= (a) Represent all of the outcomes in a Venn diagram. (b) List the outcomes in: (1) not A (2) A and B (3) A or B (c) What is the value of: (1) (not A)n (2) (A and B)n (3) (A or B)n (d) Determine: (1) (not A and B)n (2) P(not A and B) (3) (not A or B)n (4) P(not A or B) (5) P(not A or not B) (6) P(not A and not B)

264
Solutions (a)
(b) (1) not A { }; ;f g h= (2) A and B { };d e= (3) A or B { }; ; ; ; ; ; ;a b c d e f g h= (c) (1) (not A) 3n = (2) (A and B) 2n = (3) (A or B) 8n =
(d) (1) not A { }; ;f g h= (2) 38P(not A and B) =
{ }B ; ; ; ;d e f g h= ∴not A and B { }; ;f g h=
(3) not A { }; ;f g h= (4) 58P(not A or B) =
{ }B ; ; ; ;d e f g h= ∴not A or B { }; ; ; ;d e f g h=
(5) not A { }; ;f g h= (6) { }not A and not B = not B { }; ;a b c= 0
8P(not A or not B) 0= = { }not A or not B ; ; ; ; ;a b c f g h=
6 38 4P(not A or not B) = =
EXAMPLE 10 The diagram shows the subjects taken by the matric group in Kwazamakuhle FET school with respect to Geography (G) and Accounting (A). (a) How many learners take: (1) both Geography and Accounting? (2) neither Geography nor Accounting? (3) at least one of the subjects? (4) Geography but not Accounting? (b) If a learner is chosen at random from this group, determine: (1) P(not A) (2) P(G or (not A)) (3) P((not G) and A) (4) P(not(G and A)).
Solutions (a) (1) 30 learners (2) 90 learners (3) 10 30 20 60+ + = learners (4) 10 learners

265
(b) (1) (not A) 10 90 100n = + = (S) 150n =
100 2P(not A)150 3
∴ = = (b) (2) Mark G with and (not A) with × Take all numbers marked with either or × or both. This is a total of: 10 30 90 130+ + = learners
130 13P(G or (not A))150 15
∴ = =
(3) Mark (not G) with and A with × Take the number with both markings. ((not G) and A) 20n∴ = learners
20 2P((not G) and A)150 15
∴ = = (4) (G and A) 30n = (not(G and A)) 10 20 90 120n∴ = + + =
120 4P(not(G and A))150 5
∴ = =
EXAMPLE 11 In a group of 50 people, 30 can speak Afrikaans (A) and 40 can speak IsiZulu (I). There are 25 of these people that can speak both languages. (a) Draw a Venn diagram showing this information. (b) How many of these 50 people cannot speak either of the two languages? (c) If a person is chosen from this group at random, find the probability that this person can speak: (1) at least one of the two languages (2) IsiZulu but not Afrikaans Solutions (a) Start in the middle with the intersection and then work your way outwards. (b) 5 people
(c) (1) Probability 5 25 15 45 950 50 10
+ += = =
(2) Probability 15 350 10
= =
×
×
× ×
30 25− 40 25−
50 5 25 15− − −

266
EXERCISE 3
(a) A twelve-sided die is rolled. (1) Write down the sample space in set form. (2) Determine the probability that the die will land on an even number. (3) Determine the probability that the die will land on a prime number. (4) Determine the probability that the die will land on an even and prime number. (5) Determine the probability that the die will land on an even or prime number. (6) Determine the probability that the die will land on a prime number, given that the
number is greater than 8. (b) You are given the sample space { }S ; ; ; ; ; ;a b c d e f g= with the following events:
{ }A ; ;a b c= { }B ;e f= { }C ; ;c d e= Determine: (1) P(A) (2) P(A and C) (3) P(A or C) (4) P(B or C) (5) P(not A) (6) P(not B) (c) { }A ; ; ; ;a b c d e= , { }not A ; ;f g h= and { }B ; ; ;c d e f= are given. Determine: (1) the sample space S (2) P(A) (3) P(A and B) (4) P(A or B) (5) P(not A) (6) P(not B) (d) A twelve-sided die is rolled. Suppose that the following events are given: { }A multiples of 3= { }B factors of 12= Determine: (1) (A and B)n (2) (A or B)n (3) (not A)n (4) (not B)n (5) P(A and B) (6) P(A or B) (7) P(not A) (8) P(not B) (9) ((not A) and B)n (10) P((not A) and B) (11) (A and (not B))n (12) P(A and (not B)) (13) ((not A) or B)n (14) P((not A) or B) (15) (A or (not B))n (16) P(A or (not B)) (17) (not(A and B))n (18) P(not(A and B)) (19) (not(A or B))n (20) P(not(A or B)) (21) (e) In a recent sports survey, it was found that 120 people enjoy watching cricket only, 95
people enjoy watching rugby only and 45 people enjoy watching both sports. There were 40 people who don’t watch either sport.
(1) Draw a venn diagram to illustrate this information. (2) How many people watch cricket in total? (3) How many people watch rugby in total? (4) How many people were there in the survey?
(5) Determine the probability that a person selected watches both sports. (6) Determine the probability that a person selected watches none of the sports. (7) Determine: (i) P(C or (not R)) (ii) P(R and (not C))
(f) In a survey on brain diseases conducted by medical researchers, it was found that of a total of 1 520 genes, 454 are associated with Alzheimer’s disease, 1 091 are associated with Multiple Sclerosis and 40 genes are associated with both diseases.
(1) Draw a venn diagram to illustrate this information. (2) How many genes are not associated with either of the diseases? (3) Determine the probability that a gene, selected at random, will be associated with
Alzheimer’s disease and Multiple Sclerosis. (4) Determine the probability that a gene, selected at random, will be associated with
at least one of the diseases. (5) Determine the probability that a gene, selected at random, will be associated with
only one of the diseases.
P((not A) and (not B))

267
(6) Determine: (i) P((not A) or (not M)) (ii) P((not A) and (not M)) (g) A travel agency recorded the travel destinations of 60 South African tourists last month.
Of the 60 tourists, 30 visited Europe, 28 visited the UK, 9 visited America and 12 visited both Europe and the UK. Five tourists did not visit America, Europe or the UK.
(1) Draw a Venn diagram to represent this information. (2) Determine the probability that a tourist, selected at random, visited Europe only. (3) Determine the probability that a tourist, selected at random, visited America. (4) Determine the probability that a tourist, selected at random, visited both Europe
and the UK. (5) Determine: (i) P((not E) or A) (ii) P((not A) and UK) (h) The probability that Tumi will not see a movie today is 0,3. The probability that he will
go to a restaurant today is 0,6. The probability of him seeing a movie and going to a restaurant today is 0,4. Determine the probability that he: (1) doesn’t go to a movie or a restaurant. (2) only goes to a movie. (3) only goes to a restaurant. (4) doesn’t go to a movie. (5) doesn’t go to a restaurant. (6) goes to either one or the other.
(i) 100 boys – 60 from school P and 40 from school K – were included in a survey in which they were asked whether or not they liked Mathematics. The results were as follows:
Like Mathematics Don’t like Mathematics School K 16 24 School P 40 20
A learner is chosen at random from this group. Suppose that the following events are
defined: { }A learners from school P= and { }B learners who don't like Maths= (1) Describe the event (not A) and B in words. (2) Calculate: (i) P(A) (ii) P(A or B) (iii) P(A and (not B)) (j) The following diagram shows the gender and qualification of 10 applicants for a job.
A stands for Accounting, E stands for Economics and M stands for Management.
A M E A M A E M E M
(1) Determine the probability that a randomly selected applicant is female and has an Economics qualification. (2) In order to appoint a candidate for the job, the company demands that the person
is female or has a qualification in Management. How many applicants qualify for appointment?
(3) A person is selected randomly from the applicants. Let event A be the event in which a male applicant is chosen and event B the event in which an applicant with an Accounting qualification is chosen. Determine:
(i) (A or B)n (ii) (not (A or B))n (iii) P(A and B) (iv) P(A and (not B)) (v) P(not A or B)
[Hint: A Venn diagram is useful for the questions in (3)]

268
FURTHER PROBABILITY QUESTIONS USING VENN DIAGRAMS The following events represented by shaded regions in a Venn diagram are useful:
A and (not B) A or (not B) not (A and B) (not A) and B (not A) or B not (A or B)
EXAMPLE 12 Given two events, A and B, with P(A) 0, 4= , P(B) 0,5= and P(A and B) 0,1= Determine P((not A) and B) . Solution Now mark (not A) with and B with × Take the number marked with both and ×
P((not A) and B) 0, 4∴ =
EXAMPLE 13 If P(A) 0,3= ; P(B) 0,6= and P(A or B) 0,7= , find P(A or (not B)) . Solution We are not given the intersection (A and B) so let P(A and B) x= P(A or B) 0,7=
(0,3 ) (0,6 ) 0,70,9 0,7
0,2
x x xx
x
∴ − + + − =∴ − =∴ =
Now update the Venn diagram. To locate A or (not B): Mark A with and (not B) with × Take all numbers marked with either or × or both.
P(A or (not B)) 0,1 0, 2 0,3 0,6∴ = + + =
0,5 0,1−0,4 0,1−1 0,3 0,1 0,4− − −
××
Remember that all probabilities add up to 1
x0,3 x− 0,6 x−
0,20,1 0,4
0,3
×
×

269
EXERCISE 4
(a) Consider the following Venn diagrams: A: C: B: D:
In each case, choose the diagram in which the shaded region represents the event: (1) (not X) and Y (2) not (X and Y) (3) (not X) or Y (4) (not X) and (not Y) (5) (not X) or (not Y) (6) not (X or Y)
What can you conclude about [not (X or Y)] and [(not X) and (not Y)]? What can you conclude about [not (X and Y)] and [(not X) or (not Y)]? (b) X and Y are events such that P(X) 0,6= ; P(Y) 0,3= and P(X and Y) 0,2= . Draw a Venn diagram and hence find the value of P((not X) or (not Y)) . (c) X and Y are events such that P(X) 0,35= ; P(Y) 0,7= and P(X and Y) 0,2= . Draw a Venn diagram and hence find the value of P((not X) and (not Y)) . (d) Two events, A and B, are such that P(A) 0,5= ; P(not B) 0,7= and P(A and B) 0,2= Draw a Venn diagram and hence determine P((not A) or B) . (e) If P(A) 0,6= ; P(B) 0,5= and P(A or B) 0,9= , determine: (1) P(A and B) (2) P((not A) and B) (3) P(A or (not B)) (f) In a class of 28 learners, 20 take Science and 15 take Biology. There are 3 learners who don’t take either of these two subjects. Draw a learner at random. Let C be the event in which the learner chosen takes Science and B the event in which the learner takes Biology. Determine: (1) P(C or B) (2) P(C and B) (3) P((not C) and B) (4) P((not B) or (not C))
THE FUNDAMENTAL LAWS OF PROBABILITY The following two laws are always valid and form the basis of probability theory. When used correctly, they can make many probability problems much easier to solve. Consider the following Venn diagram:
6P(A)10
= 5P(B)10
= 2P(A and B)10
=
9P(A or B)10
=
Now 6 5 2 9P(A) P(B) P(A and B)10 10 10 10
+ − = + − =
Therefore we can conclude that P(A or B) P(A) P(B) P(A and B)= + −
Also 4P(not A)10
= and 6 41 P(A) 110 10
− = − =
Therefore we can conclude that P(not A) 1 P(A)= −

270
Summary of the two rules of probability P(A or B) P(A) P(B) P(A and B)= + −
or P(A and B) P(A) P(B) P(A or B)= + −
P(not A) 1 P(A)= − or
P(A) 1 P(not A)= −
EXAMPLE 14
If P(A) 0,7= ; P(B) 0,5= and P(A and B) 0,4= , determine: (a) P(A or B) (b) P(not A) (c) P(not (A or B))
Solutions
(a) P(A or B) P(A) P(B) P(A and B)= + − (b) P(not A) 1 P(A)= − P(A or B) 0,7 0,5 0,4 0,8∴ = + − = P(not A) 1 0,7 0,3∴ = − =
(c) P(not (A or B)) 1 P(A or B)= − P(not (A or B)) 1 0,8 0,2∴ = − =
EXAMPLE 15
If P(not A) 0,25= ; P(A or B) 0,8= and P(A and B) 0,15= , determine: (a) P(A) (b) P(B) (c) P(A and (not B)) (d) P((not A) or B) Solutions
(a) P(A) 1 P(not A)= − (b) P(A) 1 0,25 0,75∴ = − = 0,8 0,75 P(B) 0,15∴ = + − P(B) 0,2∴ =
(c) Use a Venn diagram: (d) Use a Venn diagram: P(A and (not B)) 0,6∴ =
Mutually exclusive events Two events are mutually exclusive if they do not share any common outcomes and can therefore never both take place at the same time. If events A and B are mutually exclusive, then A and B = ∅ (the empty set). Also P(A and B) 0= which means that: P(A or B) P(A) P(B) P(A and B)= + −
P(A or B) P(A) P(B) 0∴ = + − P(A or B) P(A) P(B)∴ = +
For mutually exclusive events: P(A and B) 0= and P(A or B) P(A) P(B)= +
(A and B) 0n = P(A and B) 0=P(A or B) P(A) P(B)= +
×
×
××
P((not A) or B) 0,15 0,05 0,2 0,4∴ = + + =
P(A or B) P(A) P(B) P(A and B)= + −

271
Exhaustive and complementary events Two events A and B are said to be exhaustive if, together, they cover all elements of the sample space, i.e. P(A or B) 1=
6P(M or N) 16
= = 8P(X or Y) 18
= =
Two events, A and B, are said to be complementary if they are both exhaustive and mutually exclusive.
P(A or B) 1∴ = and P(A and B) 0= P(A or B) P(A) P(B) P(A and B)= + −
1 P(A) P(B) 0∴ = + − 6P(A or B) 16
= = 0P(A and B) 06
= =
P(A) P(B) 1∴ + =
For complementary events: P(A and B) 0= (mutually exclusive) and P(A or B) 1= (exhaustive) and P(A) P(B) 1+ = EXAMPLE 16 If P(A) 0,3= and P(B) 0,4= where A and B are mutually exclusive events, determine: (a) P(A and B) (b) P(A or B) (c) P(not (A or B)) Solutions (a) P(A and B) 0= (c) P(not (A or B)) 1 P(A or B)= − P(not (A or B)) 1 0,7 0,3∴ = − = (b) P(A or B) P(A) P(B) 0,3 0,4 0,7= + = + = EXAMPLE 17 A and B are mutually exclusive events with P(not A) 0,3= and P(A or B) 0,8= (a) Determine P(B) . (b) Explain why A and B are not complementary. Solutions (a) P(A) 1 P(not A) 1 0,3 0,7= − = − = P(A or B) P(A) P(B)= + 0,8 0,7 P(B)∴ = + P(B) 0,1∴ = (b) P(A) P(B) 0,7 0,1 0,8 1+ = + = ≠ Also P(A or B) 0,8 1= ≠ which means that A and B are not exhaustive. Therefore A and B are not complementary (mutually exclusive but not exhaustive)

272
EXAMPLE 18
If P(A) 0,6= and P(B) 0,5= , prove that A and B cannot be mutually exclusive.
Solution If A and B are mutually exclusive then: P(A or B) P(A) P(B) 0,6 0,5 1,1= + = + = This is impossible since probabilities can never exceed 1. Therefore the events can never be mutually exclusive.
Note: If two events are not mutually exclusive then there will be an intersection and P(A and B) 0≠ . The two events are then said to be inclusive. In Example 18, the two events are inclusive. There is an intersection and P(A and B) 0,1 0= ≠
EXERCISE 5
(a) If P(A) 0,5= ; P(B) 0,7= and P(A and B) 0,3= , determine: (1) P(A or B) (2) P(not A) (3) P(not B) (4) P(not (A or B)) (5) P(not (A and B)) (6) P((not A) and B)
(b) If 47P(A) = ; 6
7P(A or B) = and 17P(A and B) = , determine:
(1) P(B) (2) P(not A) (3) P(not (A or B)) (4) P((not A) or B) (5) P(A or (not B)) (6) P((not A) and B) (c) If P(not A) 0, 4= ; P(A or B) 0,9= and P(A and B) 0, 2= , determine:
(1) P(A) (2) P(B) (3) P(A and (not B)) (4) P((not A) or B) (5) P(A or (not B)) (6) P((not A) and B)
(d) If P(A) 0,38= ; P(B) 0,45= and P(not(A or B)) 0, 4= , determine: (1) P(A or B) (2) P(A and B) (3) P(A and (not B)) (e) If P((not B) and A) 0,3= ; P(A and B) 0,1= and P(not (A or B)) 0, 2= , determine (1) P(A or B) (2) P(B or (not A)) (3) P(B and (not A)) (f) A and B are mutually exclusive events such that P(A) 0,6= and P(B) 0,3= . Determine P(A and B) and P(A or B) . (g) A and B are mutually exclusive events such that P(A) 0, 25= and P(not B) 0,58= . Determine P(A or B) . (h) The events C and D are mutually exclusive with P(not C) 0,3= and P(C or D) 0,8= . Determine P(D) . (i) If P(A) 0, 4= and P(A or B) 0,5= , determine P(B) if: (1) A and B are mutually exclusive (2) P(A and B) 0,3= (j) Determine whether the following events are complementary if (1) { }A ; ; ;a b c d= and { }B ; ; ;d e f g= (2) { }A ; ; ;a b c d= and (3) { }A ; ; ;a b c d= and { }B ; ;e f g= (k) If P(A) 0, 25 ; P(B) 0,5= = and P(A or B) 0,625= (1) Calculate P(A and B) (2) Are events A and B are complementary? Give reasons. (l) A smoke detector system in a large warehouse uses two devices, A and B. If smoke is present, the probability that it will be detected by device A is 0,95. The probability that it will be detected by device B is 0,98 and the probability that it will be detected by both devices simultaneously is 0,94. What is the probability that the smoke will not be detected?
{ }S ; ; ; ; ; ; :a b c d e f g={ }B ;e f=

273
CONSOLIDATION AND EXTENSION EXERCISE (a) In a survey on internet usage, it was found that out of a total of 27 people, 16 use ADSL lines, 15 use wireless internet and 3 use neither of the two. What is the probability that a person chosen at random uses both internet connections? (b) Simon and his girlfriend decide to go out one evening. They can see a movie, go to a restaurant or do both. The probability of them seeing a movie is 0,6. The probability of them going to a restaurant is 0,7. The probability of them seeing a movie without going to a restaurant is 0,2. What is the probability of them not seeing a movie and not going to a restaurant? (c) If (S) 46n = , (A) (B) 19n n= = and (not (A or B)) 11n = , determine: (1) P(A and B) (2) P(A or B) (3) P((not A) and B) (d) Determine whether the following events are complementary: (1) A and B, if 2
5P(A) P(not B)= = (2) C and D, if 1
2P(C) = , 23P(D) = and P(not (C or D)) 0=
(3) F and G, if 911P(not F) = , 8
11P(G) = and F and G are mutually exclusive. (e) G and H are inclusive events in a sample space S. If it is given that 3
4P(G or H) = , 2
5P(G) = and 12P(H) = , determine P(G and H) and the value of P(not G) .
(f) Two events, K and L, are such that P(K) 0,7= ; P(L) 0, 4= and P(K or L) 0,8= . Determine: (1) P(K and L) (2) P(K and (not L)) (3) (L)n if { }K ; ; ; ; ; ;a b c d e f g= (g) Given event { }A 1; 2 ; 3 ; 4= , event { }B 5 ; 6= and 2
3P(A or B) = . (1) Determine the values of P(A) and P(B) . (2) A third event C is mutually exclusive with A as well as B and 1
3P(B or C) = . Determine P(A or C) . (h) The diagrams below represent a class of learners. A is the set of girls and B is the set of learners that like rugby. Indicate the diagram representing: (1) the girls who like rugby (2) the boys who like rugby (3) the girls who dislike rugby (4) the boys who dislike rugby (5) P(A and B) (6) P((not A) and B) (7) P(A and (not B)) (8) P((not A) and (not B)) (i) You are given a group of eight students studying different degrees in Management.
Consider the gender and degree in Logistics (L), Marketing (M) or Human Resources (HR)) that a student from this group is registered for:
L M HR L M L HR M
Calculate the probability that a student selected at random from this group: (1) is male (2) is female and studies Marketing (3) studies Logistics or is male (4) must be female and studies Logistics

274
2− 7
0 1 2 3 4 5 6 7
0 1 2 3 4 5 6 7 8 9 10 11 12
4−
124
1− 0 1 2 3 4 5 6 7
CHAPTER 13 SOLUTIONS TO EXERCISES
CHAPTER 1 (ALGEBRAIC EXPRESSIONS)
EXERCISE 1
(a) (1) 2; 9 (2) 0;2; 9 (3) 3;0;2; 93 3(4) 3; ;0;2; 9 (5) 2 (6) 3; ; 2 ; 9 ;0;24 4
−
− −
(b) (1) Irrational (2) Irrational (3) Rational (4) Rational (5) Neither (6) Irrational (7) Rational (8) Irrational (c) (1) Mixed (2) Mixed (3) Natural (4) Integer (5) Terminating (6) Terminating
(d) (1) 49
(2) 733
(3) 1390
(4) 175190
(5) 28225
(6) 124999
(7) 371330
− (8) 10645
−
EXERCISE 2
(a) (1) 7 and 8 (2) 5 and 6 (3) 3 and 4 (4) 8− and 7− (5) 1 and 2 (6) 3 and 4
(b) (1) 19 (There are other possibilities)30
(2) 3,1409 (There are other possibilities)
(c) (1) 9,236 (2) 67,24 (3) 4,3769 (4) 17,24740 (5) 80,000 (6) 34,2785 (7) 5,55556 (8) 9, 425
EXERCISE 3
(a) (1) (2) (3) (4) (5) (6) (7)
(8)
(b) (1) { : 0 4 ; }x x x≤ ≤ ∈ (2) { : 6 4 ; }x x x− ≤ < ∈
{ : 7 ; }x x x< − ∈ (4) { : 5 ; }x x x≥ ∈ (3)
(c) (1) (2) (3) (4) (5) (6) (7) (8)
(d) (1) [ )7 ;9− (2) ( ]2;11− (3) [ 6; )− ∞ (4) 1;12
−∞
3− 10
1− 45− 5
6−7
346
3 8
0 1 2 3 4 5 6 7
2
3− 1

275
EXERCISE 4
(a) (1) 23 9x x+ (2) 4 3 29 18 3a a a− + − (3) 2 7 10x x+ + (4) 2 7 10x x− + (5) 2 3 10x x+ − (6) 2 3 10x x− −
(7) 26 7 3x x+ − (8) 2 221 22 8m m n+ − (9) 8 4 2 46 5 6x x y y− − (10) 8 4 3 4 5 88 16 6 12x x y x y y− + −
(b) (1) 3 23 5 3x x x+ + + (2) 3 23 5 3x x x− + − (3) 3 22 2 10 4x x x− − + (4) 3 22 10 14 4x x x− + − (5) 3 2 2 36 10 7x x y xy y+ − + (6) 3 2 2 34 5 5 2a a b ab b+ − + (7) 3 327 8x y− (8) 3 327 8x y+ (c) (1) 2 6x xy− − (2) 234 16 7y y+ − (3) 2 24 16 19x xy y− + −
(4) 6 22 9x y− (5) 3 2 2 318 45 2 5a a b ab b+ − −
EXERCISE 5
(a) (1) 2 49x − (2) 2 9x − (3) 24 1x − (4) 281 16x − (5) 2 29 4x y− (6) 6 216 9a b −
(7) 8 236 9x y− (8) 2 29 12 4x x y− + − (9) 4 81 2a a− +
(b) (1) 2 10 25x x+ + (2) 2 10 25x x− + (3) 24 12 9a a+ + (4) 24 12 9a a− + (5) 2 28 16a ab b− + (6) 2 26 9a ab b+ + (7) 2 29 30 25a ab b− + (8) 2 23 18 27x xy y− + (9) 2 24 32 64m mn n− +
(10) 6 3 6 126 9x x y y− + (11) 3 2 2 38 36 54 27a a b ab b+ + +
(12) 3 2 2 38 36 54 27a a b ab b− + − EXERCISE 6
(a) (1) 26 ( 2)x x + (2) 22 (3 2)x x + (3) 25 ( 1)x x + (4) 26 (2 3)x x − (5) 23( 3 4 )x y xy− + (6) 8 ( 8)ab ab − (7) 2 3 2 5 44 (4 2 9)m n m n mn− + (b) (1) ( )( )a b x y+ + (2) ( )( )x y k p+ + (3) ( )(3 4 )q r p m+ − (4) ( 3 )(7 3 )m n k p− − (5) ( )( 3)x y x y− − − (6) [ ]4( ) 1 ( )a c a c+ + +
(7) 2 4( ) ( ) 1m n m n − − + (8) ( 3 )(7 4 )m n x y− + (9) ( 3 )(7 4 )m n x y− −
(10) ( 3 )(7 4 )m n x y+ − (11) 2(3 )( 2 )p q x y+ − (12) ( )(1 )a b p− + (13) 3( 2)(4 1)a x− − (14) 2 (3 )( 6)x a b x− + (15) ( 3 )(1 )a b c d− + −
EXERCISE 7
(a) (1) ( 4)( 4)x x+ − (2) ( 6)( 6)x x+ − (3) (3 2)(3 2)x x+ − (4) ( 1)( 1)x x− + (5) (13 10)(13 10)x x+ − (6) (4 11 )(4 11 )a b a b+ − (7) 4 3 4 3(10 )(10 )x y x y+ − (8) 2 ( 1) 1)x x x− + (9) 2( 4)( 2)( 2)a a a+ + − (b) (1) 4 2 2( 9)( 3)( 3)n n n+ + − (2) 3(2 5 )(2 5 )x y x y+ − (3) (9 7 )(9 7 )a a b a b+ − (4) 3 (3 )(3 )a a b a b+ − (5) 2 4 44 ( 2)( 2)y x x+ − (6) 4 4 325 100p q p q− (7) ( )( )a b c a b c+ + + − (8) 4 ( )x x y+ (9) (9 4 )( 4 )a b a b− +
EXERCISE 8 (a) (1) ( 7)( 4)x x− − (2) ( 12)( 7)x x− + (3) ( 3)( 3)x x+ + (4) ( 6)( 2)x x− + (5) ( 5)( 4)a a− − (6) ( 12)( 1)a a− + (7) ( 7)( 5)a a− − (8) ( 8)( 6)a a− + (9) ( 3)( 2)m m+ + (10) ( 6)( 1)m m− + (11) ( 6)( 1)m m+ − (12) ( 3)( 2)m m− − (13) ( 4)( 3)x x+ + (14) ( 4)( 3)x x− − (15) ( 6)( 2)x x+ − (b) (1) 2( 3)( 2)x x− + (2) 3( 9)( 2)x x− + (3) 4( 5)( 2)a a+ − (4) 6( 5)( 1)a a+ − (5) ( 4)( 2)x x x+ − (6) 5( 6)( 3)x x− −

276
(c) The only product option for the last term is 5 1× . The signs in the brackets have to be the same. There is no
way to obtain the middle term 4 x using the option of 5 1× . (d) (1) The product of the lasts is not 6+ . The signs in the brackets are supposed
to be the same. (2) The product option 6 4× is incorrect because 6 4 10+ − ≠ .
EXERCISE 9
(a) (1) (3 1)( 1)x x+ + (2) (2 1)( 1)x x− − (3) (4 1)(3 1)x x− − (4) (6 1)(3 1)x x− + (5) (2 1)( 3)x x+ − (6) (5 4)( 2)x x+ + (7) (2 3)( 2)x x− − (8) (3 2)(2 5)x x+ − (9) (3 7)(2 3)x x− + (10) (10 3)(2 3)x x− + (11) (6 5)(3 2)x x− + (12) (5 3 )(3 2 )x x+ − (b) (1) 2(2 1)( 3)x x− + (2) 3(5 1)( 1)x x− − (3) ( 3 )( 2 )x y x y− + (4) (4 )( 2 )p q p q− + (5) (5 )(2 3 )m n m n+ − (6) (4 5 )(3 2 )a b a b+ + (c) (1) 10( 4 )( 3 )x y x y− + (2) ( 3 )( 3 )a a b a b− − (3) 2( 8)( 2)( 2)x x x− + − (4) 2 2 2 2( 3 )( 2 )x y x y+ + (5) ( 8)( 4)a b a b+ + + −
EXERCISE 10
(a) (1) ( )( )x y p k+ + (2) ( )( )x y r t− + (3) ( )(2 )p q n− + (4) ( 2)( )a a b− + (5) 2( 1)(4 5)x x+ + (6) ( )( )x y b a− − (7) ( )( )x y b a+ − (8) ( )(1 )a b c− − (9) ( )(3 1)x y a− − (10) ( )(3 1)x y a+ − (11) 2( 2)( 2)x x− − (12) 2( 2)( 2)x x+ − (13) 2(2 3)( 3)x x− − (14) 3( 1)( 1)( 3)( 3)x x x x+ − + − (15) ( 1)( 1)b a+ − (16) 2 (3 2 )( )ap a p x y+ − (b) (1) 2(3 1)( 3)( 3)x x x− + − (2) ( )( )x b x a− − (3) ( 3)(3 2)x x− + (4) ( )( 1)a b a b+ − − (5) ( 2 4 )( 2 4 )a b x a b x− + − −
EXERCISE 11
(a) (1) 2(3 1)(9 3 1)x x x− + + (2) 2(2 1)(4 2 1)x x x+ − + (3) 2 2(4 )(16 4 )x y x xy y− + + (4) 2(5 9 )(25 45 81 )x x x− + +
(5) 2 21 1 12 2 4
ab a b ab − + +
(6) 25( 2)( 2 4)x x x+ − +
(7) 28 ( 2)( 2 4)a a a a− + + (8) 2( 3)( 3 9)x x x− + − +
(9) 21 16 2 363 9
x x x + − +
(10)
2(3 )(3 )a a− +
(11) 22
1 11x xx x
+ − +
(12) 22
1 11x xx x
− + +
(b) (1) 4 2( 2)( 2)( 4 16)x x x x− + + + (2) 2 2( 2)( 2 4)( 2)( 2 4)x x x x x x− + + + − +
EXERCISE 12
(a) (2 5)( 3)a a+ − (b) 5( 3)( 1)a a− − (c) 2 (1 )(1 )x x x− + (d) 2(2 3)(4 6 9)x x x− + + (e) ( 3)( 2)x x− − (f) 2(3 5)( 2)x x+ − (g) (2 1)(2 1)( 1)x x x− + − (h) ( 2)( 1)x x− + (i) 2 22(2 )(4 2 )a b a ab b− + + (j) 7 7 7 77 ( 2 )x y y x− (k) 4(2 5)(2 5)x x− + (l) 2(1 )(1 )x x x− + + (m) 2 6(2 3 1)x xy− + (n) 6(2 )( )x y x y− − (o) 3(2 3)( 2)y y+ − (p) 2 4 2 44 (2 1)x y x y − (q) (2 )(2 3)x y x y− + − (r) ( 1)(2 6)(2 6)y x x− − + (s) (5 )(5 )x y x y− + + − (t) ( )( 3)a b a b− − + (u) 2( )( 4 )x a x a x+ − +
EXERCISE 13
(a) (1) 1x − (2) 2a − (3) 22
p − (4) 1mm+
277
(5) 2( 1)a − (6) 2xx+ (7) 2
2x − (8) 3
2 1xx++
(9) 3( 9)2p
p− (10) 3 2
3p − (11) 3 k
k− − (12) 3
3 2k −
(13) 2− (14) 2x − (15) 33
xx
−+
(b) (1) ( 3)( 4)2
x xx
+ + (2) 2
1x
x + (3) ( 2 )( 2)( 2)
8x y x x− − +
(4) 16
k− − (5) 2 32
k + (6) 73( 1)x
−−
EXERCISE 14
(a) (1) 4 16
x + (2) 2 2
321 4 6
18x y x y
x y− + (3) 2
3 2xx+ (4) 3
2
(5) 5 3 66xy yxy
− − (6) 22 3 10
2 ( 2)x x
x x− + −
− (7) 7 2
( 1)x
x x++
(8) 2
25 4 8
( 2)( 2)x x
x x− + −
+ +
(9) 12( 3)( 3)
xx x
−+ −
(10) 2
22 3 3(2 1)x x
x− − +
+ (11)
3 2 2
211 1 5 4
4x x y x y
x y+ − +
(12) 16
(13) 23 4
3 2x x
x−−
(b) (1) 29 19
x − (2) 2 2366
x y− (3) 216 8 1
16x x− +
(4) 4
21x
x− (5)
6
31x
x+ (6)
4 2
28 164
x xx
+ +
(c) (1) 22x x+ (2) 2 3xx−
EXERCISE 15
(a) (1) 23
xx
−−
(2) 23
xx
−+
(3) 22 5 1
( 3)( 3)x x
x x+ −
− + (4)
2 2 4( 4)( 1)x xx x
+ +− +
(5) 9 5(2 1)( 5)
xx x− −+ +
(6) 6xx
− − (7) 2 2 26 ( 1)
x xx x+ −
+ (8)
3
22 8
( 2)x xx x
− −−
(9) 2
22 3 1
(2 1)(4 2 1)x x
x x x− +
+ − +
(b) (1) Line 1: Identified the LCD incorrectly Line 2: 3 ( 1)x× + is not equal to 3 1x + (2)
23 6 2
3 (3 1)x xx x
− −+
CONSOLIDATION AND EXTENSION EXERCISE (a) (1) Rational (2) Rational (3) Rational (4) Irrational (5) Rational (6) Irrational (7) Rational (8) Rational (9) Rational (10) Rational (11) Rational (12) Rational (b) (1) 7 and 8 (2) 8− and 7− (3) 2 and 3
(c) 11 ; 2 ; 32
(d) (1) (2) (3) (4) (e) (1) 2 26 5 6x xy y− − (2) 8 1x − (3) 212 60 75x x− + −
2− 1− 0 1 2 3 42− 1− 0 1 2 3
5 6 74 5− 5

278
(4) 3 327 64x y− (5) 22x− (6) 2 2( 3) 4a b+ −
(7) 4 2 3 610 24 12x x y y− + (8) 3 2 2 3125 150 60 8a a b ab b− + − (9) 4125x
(f) (1) (3 4)( 3)x x+ − (2) 3( 4)( 1)x x− + (3) (3 2)( 6)x x− − + (4) ( 8)( 8)x x x− + (5) 2( 4)( 4 16)x x x− + + (6) ( 8)( 8)x x− + (7) 4( 5)( 5)x x− + (8) 4 ( 25)x x − (9) 21( 64)x + (10) ( 3)( 2)( 2)x x x− − + (11) 2( 3)( 4)x x− + (12) ( 8)( 8)x x− − + (13) 2(3 1)( 2)x x− + (14) 2(3 1)( 2)x x− − (15) 22(1 2 )(1 2 4 )x x x− + +
(g) (1) 22
x + (2) 227 24 68
12y xy x
xy− − − (3)
3
233 6
12x x
x+ +
(4) 2 22
xx− (5) 2
94x
(6) 25 3 4( 2)
x xx x
− +−
(7) 2
2(2 )
2 4x
x x− −
+ + (8)
2
22 8 3
( 3) ( 2)x x
x x− +
− − (9) ( 2)( 2)
16x x x− +
(h) (1) 3,141592654.....π = Irrational (2) 227
(3) π is an irrational number but 227
is rational. In fact, 227
is a rational approximation of π .
(i) (1) 4 29 21 4x x− + − (2) 2 2(3 3 2)(3 3 2)x x x x− + + − (j) 2( 1)( 1)x x x+ + +
(k) 2xx− (l) (1) ( 8)( 4)p p− − (2) ( 4)( 8)a b a b+ − + −
(m) (1) 22
1 51xx
+ = (2) 364
(n) (1) 2 2 14a b+ = (2) 18a b− = ± (o) 2 (p) 2, 3, 12a b p= = = (q) 2009
(r) (1) 1 ( 4)( 2)2
x x− + (2) 1 (3 2)(2 1)2
x x− − (3) 1 (2 3)( 2)14
x x− −
(s) y xxy− (t) 1
2
CHAPTER 2 (EXPONENTS) EXERCISE 1 (a) (1) 516 p (2) 3 736x y (3) 512 (4) 263
(5) 16 807 (6) 105 (7) 155 (8) 1312 (9) 253 (10) 168 (11) 36 (12) 32
(13) 6 109x y (14) 616a (15) 22 36a b
(16) 1372x
(17) 15 212 . 6 (18) 10 93 . 2 (19) 2x (20) 41x
(21) 64 (22) 1256
(23) 82
3a (24)
4
4xy
(25) 6
52ba
− (26) 2
2xy
(27) 4 21
4a b
(b) (1) 2 (2) 1 (3) 18 (4) 51x
(5) 41a
(6) 164
(7) 14
(8) 121 (9) 24x
(10) 21
16x

279
(11) 33
a (12) 3
127a
(13) 1 (14) 164
(15) 4x
(16) 49 (17) 18 (18) 92
(19) 36 (20) 4
2x
(21) 416x (22) 27125
(23) 8125
(24) 2 187 (25) 5
4yx
(26) 7ab c (27) 2 21
3x y (28) 3
5 (29)
11
6yx
(30) 43
2x
(31) 5
1632a cb
(32) 12
(33) 12
22xy
(c) (1) 1 (2) 1 (3) 1 (4) 1 (5) 1− (6) 1 (7) 1− (8) 16 (9) 32− (10) 9a− (11) 12a (12) 64− (13) 128 (14) 2 187 (15) 2 187− (16) 1216a (17) 1532a− (18) 90 30a b (19) 99 33a b− (20) 4 481x y− (21) 5 5243x y (22) 8 1216x y− (23) 14 21128x y (24) 15243x−
(d) (1) 36x (2) 55x (3) 4x− (4) 3 46x y (5) 10 916 3x x+
(6) 5 58a b− (7) 10 105 10a b+ (8) 74x− (9) 4 22x y (10) 628a− (11) 5 612 4x x− EXERCISE 2
(a) (1) 73 (2) 72 (3) 1125
(4) 8 (5) 3
(6) 1125
(7) 425
(8) 827
(9) 63 (10) 49
(11) 32
(12) 49 (13) 274
(14) 1253
(15) 2
(b) (1) 22 x (2) 52 x (3) 33 x (4) 32x+ (5) 3 55 . 3x x (6) 43 x (7) 103 x (8) 1 (9) 1 (10) 1
(11) 5 (12) 1 (13) 12
(14) 32 x (15) 22 x
(c) (1) 3 (2) 8 (3) 15
(4) 4 (5) 36
(6) 8 (7) 7 (8) 9 (9) 2p (10) 1125
(11) 34
(12) 16 (13) 1
25 (14) 15
(15) 118
EXERCISE 3 (a) (1) 3 (2) 5 (3) 2 (4) 3 (5) 2a (6) 3y
(b) (1) 22x (2) 52x
(3) 5m (4)
2
7x (5) 1
3
(6) 1 EXERCISE 4
(a) (1) 1 (2) 12
(3) 25
(4) 1 (5) 12
(6) 8 (7) 32
(8) 14
(9) 16
(b) (1) 3 1x − (2) 2 3x + (3) 5 6x − (4) 6 6x − (5) 6 x (6) 4 7x − (7) 3 2x + (8) 2 3x − (9) 5 1x +

280
EXERCISE 5
(a) (1) 0x = (2) 1x = (3) 3x = (4) 2x = (5) 12
x =
(6) 4x = (7) 73
x = (8) 18
x = (9) 3x = (10) 5x =
(11) 4x = (12) 2x = (13) 2x = − (14) 2x = − (15) 3x = −
(16) 2x = − (17) 2x = − (18) 3x = (19) 3x = (20) 32
x =
(b) (1) 1x = (2) 32x = − (3) 3
2x = − (4) 4x = − (5) 5x =
(6) 32
x = (7) 4x = (8) 3x = (9) 9x = − (10) 2x =
(11) 2x = (12) 1x = − (13) 2x = − (14) 15
x = (15) 0x =
(c) (1) 2x = (2) 2x = (3) 2x = (4) 1x = (5) 32
x =
EXERCISE 6 (a) (1) 25x = (2) 8x = (3) 1x = (4) 32x = (5) 8x = (6) 9x = (7) 4x = (8) 64x = (9) 3x = (b) (1) 256x = (2) 256x = (3) 2 401x = (4) 256x = (5) 142 x = 81x = 1x = 16x = 1x = (6) 36x = 9x =
CONSOLIDATION AND EXTENSION EXERCISE
(a) (1) 29
4x (2) 3 (3) b a
ab+ (4) 1
a b+ (5) 1−
(6) 1618x (7) 811x (8) 9216x (9) 10 51024x y− (10) 6
894
yx
(11) 6258
(12) 12
(13) 83
(14) 2 (15) 1
(16) 11 2x − (17) 2 9x − (18) 5x
(b) (1) 1x = − (2) 53
x = (3) 16x = (4) 25x = (5) 625 81x x= =
(6) 23x =
(c) (1) 34 x (2) 3 . 4 x (3) 213 . 2
(d) (1) 232 (2) 356 (e) (1) 262 (2) 30 203 4>
CHAPTER 3 (NUMBER PATTERNS)
EXERCISE 1
(a) (1) T 3 3n n= + ; 100T 303= (2) T 4 5n n= + ; 100T 405= (3) T 5 2n n= − ; 100T 498= (4) T 4 1n n= − ; 100T 399= (5) T 6 4n n= + ; 100T 604= (6) T 7 3n n= − ; 100T 697= (7) T 5 10n n= − + ; 100T 490= − (8) T 3 3n n= − + ; 100T 297= − (9) T 5 1n n= − − ; 100T 501= − (10) T 4 9n n= − + ; 100T 391= − (11) T 6 1n n= − + ; 100T 599= − (12) 1
2T 3n n= + ; 100T 53=
(13) 12T 2n n= + ; 1
100 2T 200= (14) 3 14 2Tn n= − ; 1
100 2T 74=
(15) T 0, 2 0,3n n= + ; 100T 20,3= (16) T 6 19n n= − ; 100T 581= (17) T 10 11n n= − + ; 100T 989= − (18) T 14n n= − + ; 100T 86= −

281
(b) (1) T 7 3n n= − ; 45T 311= (2) 90n = ; 90T 627= (c) (1) T 3 22n n= − + ; 65T 173= − (2) 45n = ; 45T 113= − (d) (1) 1T 5= ; 2T 14= ; 3T 23= ; 4T 32= (2) 110n = ; 110T 996= (e) (1) T (3 1)(8 1)n n n= + − (2) 50T 60 249=
EXERCISE 2
(a) (1) 1T 2 2nn
−= × ; 10T 1 024= (2) 1T 1 3nn
−= × ; 10T 19 683= (3) 1T 4 3n
n−= × ; 10T 78 732= (4) 11
2T 32 ( )nn
−= × ; 110 16T =
(5) 1T ( 2) (3)nn
−= − × ; 10T 39 366= − (6) 112T ( ) (2)n
n−= × ; 10T 256=
(7) 114T 16 ( )n
n−= × ; 1
10 16 384T = (8) 11 12 2T ( ) ( )n
n−= × ; 1
10 1 024T =
(9) 114T 28 ( )n
n−= × ; 7
10 65 536T =
(b) (1) 2Tn n= ; 100T 10 000= (2) 2T 1n n= + ; 100T 10 001= (3) 2T 3n n= + ; 100T 10 003= (4) 2T 4n n= + ; 100T 10 004=
(5) 2T 1n n= − ; 100T 9 999= (6) 2T 2n n= − ; 100T 9 998=
(c) 1
21 3T
4
n
n n
−×=+
CONSOLIDATION AND REVISION EXERCISE
(a) (1) T 9 2n n= − ; 300T 2 698= (2) 50n = ; 50T 448= (b) (1) T 3 1n n= − + ; 145T 434= − (2) 130n = ; 130T 389= − (c) (1) Figure 4: 14 (2) Figure 4: 20 (3) Figure 8: 26 (4) Figure 8: 40 (5) Figure n: T 3 2n n= + (6) 186T 560= (7) 90n = Figure 90 will contain 272 dots (8) Figure n: T 5n n= (9) 900T 4 500= (10) 130n = Figure 130 will contain 650 lines. (d) (1) Design 1: 2
12 T (1) (1)= = + Design 2: 226 T (2) (2)= = +
Design 3: 2312 T (3) (3)= = + Design 4: 2
420 T (4) (4)= = + Design 5: 2
530 T (5) (5)= = + (2) Design n: 2Tn n n= + (3) 2
20T (20) (20) 420= + =
(e) (1) 4 2T5 2n
nn
+=−
(2) 2041T49
=
(f) 999T 1= 1000T 1500= (g) (1) E (2) W (3) 497
CHAPTER 4 (EQUATIONS AND INEQUALITIES)
EXERCISE 1
(a) (1) 32x = − (2) 8x = − (3) 8p = − (4) 4x =
(5) 2m = (6) 3x = (b) (1) 24x = − (2) 6x = − (3) 1
2x = − (4) 23y =
(5) 8a = (6) 24m = (7) 57x = − (8) 1k =
EXERCISE 2
(a) (1) 3 ; 6x x= = − (2) 4 ; 8x x= − = (3) 0 ; 3x x= = − (4) 5 12 3 ; x x= = −
(5) 325x =
(b) (1) 3 ; 3x x= = − (2) 7 ; 7x x= = − (3) 10 ; 10x x= = − (4) 0 ; 9x x= = (5) 1
90 ; x x= = (6) 520 ; x x= = (7) 2 ; 2x x= − = (8) 0 ; 4x x= =
(9) 4 ; 2x x= = − (10) 2 ; 3x x= = (11) 13 ; 2x x= − = (12) 5
2 ; 2x x= = − (13) 8 ; 1x x= − = (14) 6 ; 1m m= = − (15) 6 ; 2x x= − = (16) 32
3 2 ; x x= = −

282
(17) 9 ; 5p p= = − (18) non-real solution (19) 3 12 2 ; x x= − = (20) non-real solution
(21) non-real solution (22) 4 ; 2x x= = − (23) 2 ; 1x x= = − (24) 3 ; 3x x= = − (25) 1
2x = (26) 4x =
EXERCISE 3
(a) (1) 18x = − (2) no solution (3) no solution (4) 0x = (5) 5x = − (6) 15
4x = (7) 54x = (8) 1x = − (b) (1) 6 ; 3x x= = − (2) 13 ; 1x x= = − (3) real numbers (4) no solution (5) 4x = (6) 24
90 ; x x= = (7) 0x =
EXERCISE 4
(a) 4 ; 1x y= = (b) 2 ; 4x y= − = − (c) 1 ; 2x y= = (d) 1 ; 1x y= = (e) 8 ; 2x y= = (f) 1
2 ; 3x y= =
EXERCISE 5
(a) (1) 6 ; 2x y= = − (2) 4 ; 10x y= = (3) 1 ; 1x y= = (4) 5 ; 2x y= = − (b) (1) 1 ; 0x y= = (2) 2 ; 4x y= − = (3) 2 ; 3x y= = (4) 7 ; 14x y= = (5) 4 ; 3x y= = − (6) 7 ; 14x y= = (c) R24 EXERCISE 6
(a) (1) v uat−= (2)
2 2
2v us
a−=
(b) (1) c bxa−= (2)
3 2cx
a b=
− (3) 0 ; bx x
a= = − (4) 1 1 ;
2 2x y x y= − =
(5) 3 ; 2x y x y= = (6) 3 3 ; 2 2
x y x y= − =
(c) (1) 2S Lnan−= (2) 5F 160C
9−= (3)
2
Fmvg
r=
(d) (1) ufvu f
=−
(e) (1) Em
c = (2) 2 2u v as= − (3) Fgrvm
=
EXERCISE 7
(a) (1) 3x ≤ − (2) 8x > − (3) 1x <
(4) 5x ≥ (b) (1) 6x < − (2) 6x ≥ − (3) 1
2y ≤ −
(4) 6y > − (5) 0x ≥
(c) (1) 1 6x− ≤ < (2) 5 2x− < < (3) 3 2x− ≤ ≤
(4) 2 2x− < < (5) 4 2x− ≤ < (6) 0 4x< ≤
3− 8−
12−
6−
3− 2
4− 2 0 4
1
5
0
1− 6 5− 2
2− 2
6−6−

283
CONSOLIDATION AND EXTENSION EXERCISE
(a) (1) 1x = − (2) 12x = − (3) 0 ; 4x x= = (4) 2 ; 2x x= = −
(5) 5 ; 2x x= = − (6) 322 ; x x= = − (7) 2x = − (8) 1
20 ; x x= = (9) 4
17x = (10) 5 ; 5x x= = − (11) 2x = − (12) 52 ; 3x x= = −
(13) 6x > − (14) 2 5x− < ≤ (15) 1733x ≥
(b) (1) 2x = (2) 3x = (3) 3x = ± (4) 0 ; 9x x= = (c) 12 6x− < < (d) (1) 8 ; 3p p= = (2) 4 ; 2 ; 3 ; 1x x x x= = − = = − (e) (1) 1 ; 2x y= = − (2) 1 ; 2x y= = − (3) (f) (1) 56 ; 90x y= = (2) 56 ; 90x y= =
(g) 103x ≤ −
(h) (1) real numbers (2) 12x =
(i) (1) 23 (2) 21 (3) 120 (j) (1) 0 ; 1x x= = − (2) 2x =
(k) (1) 1x = − (2) 2 5 ; 44
yx yy
−= ≠−
(l) 152 (m) 200 of the R200 tickets were sold and 50 of the R300 tickets were sold. (n) 10 metres (o) 3x = CHAPTER 5 (TRIGONOMETRY) EXERCISE 1
(a) (b) (1) sin K km
= (2) cos K gm
=
(3) tan K kg
= (4) sin G gm
=
(5) cos G km
= (6) tan G gk
=
(c) (1) sin rq
θ = (2) cos pq
θ = (3) tan rp
θ = (4) sin pq
α =
(5) cos rq
α = (6) tan pr
α =
(d) (1) EF 676 26= = (2) 10 5sin26 13
θ = = 24 12cos26 13
θ = = 10 5tan24 12
θ = =
(e) (1) 8sin N17
= (2) 3 3tan C4 4kk
= =
(f) (1) 24 4cos L30 5
= = 16 4cos B20 5
= = (2) Both equal 45
(3) Triangles are similar
EXERCISE 2 (a) (1) 0,92 (2) 0,93 (3) 2,05 (4) 0,69 (5) 1,41 (6) 4,53 (7) 11,2 (8) 2− (9) 0,31 (10) 0,04 (11) 0,04 (12) 5,14 (13) 1,84 (14) 2,26− (15) 0,57 (b) (1) 1 (2) 1 (3) 1 (4) 1 (c) (1) 0,05 (2) 1,43 (3) 2,91 (4) 0,62 (5) 0,19 (6) 0,73
–2 2 4 6
6
–
–4
–3
–2
1
1
2
3
x
y >
>
>>
θ
opposite
adjacent
hypotenuse opposite adjacent
hypotenuseθ

284
EXERCISE 3
(a) (1) 60θ = ° (2) 30θ = ° (3) 59,58θ = ° (4) 90θ = ° (5) 0θ = ° (6) 45θ = ° (b) (1) 23,6θ = ° (2) 83,7θ = ° (3) 15,7θ = ° (4) 12,9θ = ° (5) 19,0θ = ° (6) 11,3θ = ° (c) (1) 62,7x = ° (2) 15,0x = ° (3) 29,6x = ° (4) 38,7x = ° (d) 23,2θ = ° EXERCISE 4
(a) (1) 1 (2) 3 32
(3) 13
(4) 14
−
(5) 3 32
(6) 32
(7) 12
− (8) 12
(9) 0 (10) 72
(c) (1) 30x = ° (2) 60x = ° (3) 60x = ° (4) 45x = ° (5) 60x = ° (6) 30x = ° (7) 45x = ° (8) 15x = ° (9) 25x = ° (10) 22,5x = ° (11) 30x = ° (12) 11,25x = ° EXERCISE 5
(a) PQ 2,2= (b) (1) AB 5,2= (2) BC 2,2= (c) (1) 37,9θ = ° (2) AC 11,4 = (d) (1) 53,1α = ° (2) 36,9θ = ° (e) (1) AC 20,5= (2) AB 18,8= (f) AC 70,4 m= (g) 41,8θ = ° (h) BC 28,7mm= (i) (1) BC 6= (2) B 33,7= ° (3) AB 7,2=
(j) (1) sin P hm
= (2) sin R hn
= (4) P 47,6= ° EXERCISE 6
(a) 0,8 kmh = (b) (1) DE 5,8 m= (2) 44,4θ = ° (3) AC 4,9 m= (c) (1) 20θ = ° (2) No (d) BC 18,5 m=
EXERCISE 7
(a) Quad 1 (b) Quad 3 (c) Quad 3 (d) Quad 2 (e) Quad 3 (f) Quad 2
EXERCISE 8
(a) (1) 1625
(2) 32
(b) (1) 12 (2) 1
(c) (1) 169
(2) 43
(d) (1) 717
(2) 38
(e) (1) 1 (2) 144 (f) (1) 4925
(2) 1
(g) (1) 3 (2) 27 (h) 7,5b = (i) 2
2 2a
b a+
EXERCISE 9
(a) (1) 53
(2) 34
(3) 54
(4) 43
(5) 53
(6) 54
(b) (1) kg
(2) jk
(3) gj
(4) gj
(5) jk
(6) kg

285
(c) (1) 23
(2) 2 (3) 1 (4) 13
(5) 2
(6) 4 (7) 1 (8) 43
(9) 2
(d) (1) 1,47 (2) 4,81 (3) 0,49 (4) 2,22 (5) 1,27 (6) 3,64 (e) (1) 60x = ° (2) 60x = ° (3) 30x = ° (f) (1) 56,44θ = ° (2) 77,16x = ° (3) 13,28x = °
Trigonometric functions
EXERCISE 10
(a) (1) (2) 3sin θy = : max 3= min 3= − 2sin θy = − : max 2= min 2= − (3) 3sin θy = : range: [ 3 ; 3]y ∈ − amplitude 3= period 360= ° 2sin θy = − : range: [ 2 ; 2]y ∈ − amplitude 2= period 360= ° (b) (1) (2) 2cosθy = : max 2= min 2= − 3cosθy = − : max 3= min 3= − (3) 2cosθy = : range: [ 2 ; 2]y ∈ − amplitude 2= period 360= ° 3cosθy = − : range: [ 3 ; 3]y ∈ − amplitude 3= period 360= ° (c) (1) (2) 1
2 cosθy = : max 12= min 1
2= − sin θy = − : max 1= min 1= − (3) 1
2 cosθy = : range: 1 12 2[ ; ]y ∈ −
amplitude 12=
period 360= ° sin θy = − : range: [ 1 ;1]y ∈ − amplitude 1= period 360= °
EXERCISE 11
(a) (1) (2) sin θ 2y = + : max 3= min 1= cosθ 1y = − : max 0= min 2= − (3) sin θ 2y = + : range: [1 ; 3]y ∈ amplitude 1= period 360= ° cosθ 1y = − : range: [ 2 ; 0]y ∈ − amplitude 1= period 360= °
(b) (1) (2) sin θ 2y = + : max 3= min 1= cosθ 1y = − : max 0= min 2= − (3) sin θ 2y = + : range: [1 ; 3]y ∈ amplitude 1= period 360= °
90 180 270 360
- 4
- 3
- 2
- 1
1
2
3
° ° °
y
°
2siny = − θ
3siny = θ
θ
4
90 180 270 360
- 4
- 3
- 2
- 1
1
2
3
° ° °
y
°
2cosy = θ
3cosy = − θ
θ
4
90 180 270 360
- 2
- 1
1
2
° ° °
y
°
1 cos2
y = θ
siny = − θ
θ
2
90 180 270 360
- 4
- 3
- 2
- 1
1
2
3
4
° ° °
y
°
cos 1y = θ −
sin 2y = θ +
θ
4
90 180 270 360
- 4- 3- 2- 1
1234
° ° °
y
°
sin 2y = − θ −
cos 3y = − θ +
θ
5
cosθ 1:y = − range: [ 2 ; 0]y ∈ −amplitude 1=period 360= °

286
y 90θ = ° 270θ = °
.. .. θ45° 90° 135° 180° 225° 270° 315° 360°
(135 ; 3)° − (180 ; 2)° −
(135 ; 1)° −
(315 ; 3)° −
tanθ 2y = −
123
3−4−5−
2−1−
45 90 135 180 225 270 3 5 360
- 6- 5- 4- 3- 2- 1
123
y
2tan 1y = − θ −
90θ = ° 270θ = °
(45 ; 3)° −.. .
.
(135 ;1)°
(225 ; 3)° −
(315 ;1)°
θ
4
° ° ° ° ° ° ° °45 90 135 180 225 2 0
- 7- 6- 5- 4- 3- 2- 1
123456
y 2 tany = θ 90θ = ° 270θ = °
(45 ; 2)°.(135 ; 2)° −
(225 ; 2)°
θ
6
° ° ° ° ° °.3sin 3y = − θ −
.
(c) (1) (2) 2sin θ 4y = + : max 6= min 2= 3cosθ 1y = − − : max 2= min 4= − (3) 2sin θ 4y = + : range: [2 ; 6]y ∈ amplitude 1= period 360= ° 3cosθ 1y = − − : range: [ 4 ; 2]y ∈ − amplitude 3= period 360= ° EXERCISE 12
(a) (b) (c) (d) (e) (f) (g) (g) 2 tan θy = : 180° 3sin θ 3y = − − : 360°
EXERCISE 13
(a) (1) Amplitude 1= Range is [0 ; 2]y ∈ (2) Amplitude 2= Range is [ 2 ; 2]y ∈ − (3) 1a = 1q = (4) 2m = − 0n = (b) (1) Amplitude 1= Range is [ 3 ; 1]y ∈ − − Period 360= ° (2) Amplitude 2= Range is [ 1 ; 3]y ∈ − Period 360= ° (3) 1a = − 2q = − (4) 2m = − 1n =
90 180 270
- 5- 4- 3- 2- 1
1234567
° °
y
°
3cos 1y = − θ −
2sin 4y = θ +
θ
7
45 90 135 180 225 2 0 3 5 360
- 3
- 2
- 1
1
2
y
tany = − θ
90θ = ° 270θ = °
(45 ; 1)° −.
. ..
(135 ;1)°
(225 ; 1)° −
(315 ;1)°
θ
3
° ° ° ° ° ° ° 45 90 135 180 225 270 3 5 360
- 5- 4- 3- 2- 1
1234
y
3tany = θ
90θ = °270θ = °
(45 ; 3)°.
. .
.
(135 ; 3)° −
(225 ; 3)°
(315 ; 3)°
θ
5
° ° ° ° ° ° ° °
45 90 135 180 225 270
- 2
- 1
1
y
1 tan2
y = − θ
90θ = °270θ = °
1(45 )2
° −. .
. 1(135 ; )2
°
1(225 )2
° −
θ
2
° ° ° ° ° ° 45 90 135 180 225 270 3 5 360
- 5- 4- 3- 2- 1
1234
y
tan 1y = θ +
90θ = ° 270θ = °
(45 ; 2)° . ..
(135 ; 0)°(225 ; 2°
(315 ; 0)°θ
5
° ° ° ° ° ° ° °

287
(c) (1) 2 tany x= for [0 ; 270 )x ∈ ° ° 3cos 1y x= − + for [0 ; 270 ]x ∈ ° ° (2) 2 tany x= : Range is ( ; )y ∈ −∞ ∞ No Amplitude Period 180= ° 3cos 1y x= − + Range is [ 2 ; 4]y ∈ − Amplitude 3= Period 360= °
EXERCISE 14
(a) (1) OA 2= OB 1= (2) CD 3= (3) EF 2= (4) (i) 90 ; 270° ° (ii) 90 ; 270° ° (iii) 0 ; 360° ° (iv) 0 ; 360° ° (v) 90 270x° < < ° (vi) 0 90 ; 270 360x x° ≤ ≤ ° ° ≤ ≤ ° (vii) 0 90 ; 270 360x x° ≤ ≤ ° ° ≤ ≤ ° (viii) 90 270x° < < ° (5) 60x = ° (6) 180 360x° < < ° (7) 180 360x° < < ° (8) 1 or 1k k< − > (9) 2t = (b) (1) 4− (2) 135x = ° (3) 0 90 ; 135 270x x° ≤ < ° ° ≤ < ° (4) 0 ; 180x x= ° = ° (c) (1) 90 ; 180x x= ° = ° (2) 0 90 ; 180 360x x° ≤ ≤ ° ° ≤ ≤ ° (3) 180 360x° ≤ ≤ ° (4) 0 360 ; 180x x° < < ° ≠ ° (5) 0 ; 360x x= ° = ° (6) 0 180 ; 360x x° ≤ ≤ ° = °
CONSOLIDATION AND EXTENSION EXERCISE
(a) (1) 0,72− (2) 1,27 (3) 1,28 (4) 3,69 (b) (1) 11,79θ = ° (2) 11,54θ = ° (3) 53,13θ = ° (4) 47,16θ = ° (5) 23,58θ = ° (c) (1) 21,14θ = ° (2) 33,69θ = ° (3) 75,52θ = ° (4) 98,60θ = ° s (5) 60θ = ° (6) 71,52θ = ° (d) (1) 0,39 (2) 0,88 (3) 1,96
(e) (1) 0 (2) 14
(3) 12
(4) 3
(5) 2 (6) 12
(f) (1) 30θ = ° (2) 45θ = ° (3) 30θ = ° (4) 30θ = ° (5) 45θ = ° (6) 60θ = ° (7) 30θ = ° (8) 60θ = ° (g) (1) PQ 25, 41= (2) K 49,18= ° PR 18,88= (h) (1) 5x = (2) 14,59x = (3) 68,68x = ° (4) 41, 27x = ° (i) CD 3,91 m= (j) (1) QR 30= (2) QR 30= (k) (1) EA 19,5cm= (2) YS 3,125= YA 21,125cm= (l) (1) 30θ = ° (2) 8,66 m (m) (1) 60θ = ° (2) OQ 4= (n) 3,13 mh = CHAPTER 6 (FUNCTIONS)
EXERCISE 1
(a) (1) 32y x= (b) (1) 3
2y x= − (c) (1) The graph of y x= is reflected in (2) (2) the x-axis and then translated 4
units up.
(2) The graph of y x= is stretched vertically by a factor of 3 and
then translated down by 6 units. (3)
(d) (1) F (2) D (3) G (4) A (5) E (6) H (7) B (8) C
32(1 ; )
32y x=
y x=
14y x=(1 ; 1)
14(1 ; )
32(1 ; )−
32y x= −
y x= −
14y x= −
(1 ; 1)−
14(1 ; )−
3 6y x= −4y x= − +
2
44
6−

288
EXERCISE 2 (a) (1) 24y x= (b) (1) 2y x= − (c) (1) 24y x= − (2) (2) (2)
(3) concave up ( 0a > ) (3) concave down ( 0a < ) (d) (1) (2) 2 3y x= + : (3) First two concave up y-int: (0 ; 3) Third one convave down
x-int: none 2 4y x= − : y-int: (0 ; 4)− x-int: ( 2 ; 0)− (2 ; 0) (e) (1) (2) 24 4y x= − + (f) (1) y-int: (0 ; 4) x-int: ( 1 ; 0)− (1 ; 0)
2 2y x= − − y-int: (0 ; 2)− x-int: none
(2) y-int: (0 ; 8) (g) (1) C x-int: (2) E ( 4 ; 0) (4 ; 0)− (3) D (4) F (5) B (6) A EXERCISE 3
(a) (1) 5yx
= ( 5 1> ) (b) (1) 0 ; 2x y= = (c) (1) 0 ; 1x y= = −
(2) (2) ( 1 ; 0)− (2) ( 4 ; 0)− (3) (3)
(3) see (2)
y
x
2y x=
23y x=
24y x=
2y x= −
212
y x= − 214
y x= − 24y x= −
232
y x=
214
y x=
2 3y x= +
2 4y x= −
2− 2
4−
3 (1 ; 4)
2 2y x= − −
24 4y x= − +
2−
1− 1
4y
x
21 82
y x= − +
4− 4
8
5yx
=
1yx
=
5yx
= −
2 2yx
= +
2y =
(1 ; 4)
( 1 ; 0)−
4 1yx
= − −
1y = −
( 4 ; 0)−
(1 ; 5)−

289
(d) (e) (1) B (2) A (3) C (4) D
EXERCISE 4
(a) (1) 6xy = (largest base) (b) (1) 6xy = (smallest base) (2) 0y = (2) 0y = (3) (3)
(c) (1) 2.2xy = y-int: (0 ; 2) (3) 4.2xy = y-int: (0 ; 4)
132
x
y =
y-int: (0 ; 3)
(2) 0y =
(d) (1) 12
x
y = −
: y-int: (0 ; 1)− (3)
132
x
y = −
: y-int: (0 ; 3)−
(2) 0y =
(4) 12
x
y =
is vertically stretched to form
the graph of 132
x
y =
and then
132
x
y =
is reflected in the y-axis to form the graph of 132
x
y = −
(e) (1) x-int: (1 ; 0) (3) y-int: (0 ; 1)− (2) 2y = −
(4) 2 2xy = − is the graph of 2xy = shifted 2 units down. (5) see diagram (6) The equation 0 2 1x= + has no solution.
3 2yx
= +
2y =
(1 ; 5)
12( 1 ; 0)−
6xy =
(1 ; 2)
(1 ; 4)
(1 ; 6)
4xy =
2xy =
( 1 ; 2)−
( 1 ; 4)−12
x
y =
14
x
y =
16
x
y =
( 1 ; 6)−
2
(1 ; 4)
(1 ; 8) 2 2xy =
4
4 2xy =
312(1 ;1 )
132
x
y =
( 1 ; 2)− −
12
x
y = −
1−
( 1 ; 6)− −
132
x
y = −
3−
(0 ; 1)−
2y = −
(1 ; 0)
1y =(0 ; 2)
2 2xy = −
2 1xy = +

290
(f) (1) y-int: (0 ; 3)− (3) x-int: ( 1 ; 0)− (2) 4y = −
(4) 1 44
x
y = −
is the graph of 14
x
y =
shifted 4 units down. (g) (1) (2) (3) (4)
(h) (1) B (2) A (3) E (4) F (5) D (6) G (7) C EXERCISE 5
(a) (1) (2) (3) (4) (5) (6) (7) (8) (9) (10) (11) (12)
(b) (1) (2) (3) (4)
(5) (6) (7) (8)
(0 ; 3)−
1 44
x
y = −
( 1 ; 0)−
4y = −
2y =
(1 ;10)
2 4 2xy = +
(0 ; 4)
(0 ; 0)
2y = −
(1 ; 6)
2 4 2xy = −
(0 ; 0)
2y = −
( 1 ; 6)−
12 24
x
y = −
2y =
( 1 ;10)−
12 24
x
y = + (0 ; 4)
(1 ; 2)
2y x=
(1 ; 2)2yx
=
( 1 ; 2)− −
(1 ; 2)
22y x=
( 1 ; 2)− 2y =
(1 ; 2)
2xy =
(0 ;1)(1 ; 3)
2 2y x= +
( 1 ; 3)−
(0 ; 2)(1 ; 0)
22 2y x= − +
( 1 ; 0)−
(0 ; 2)
(2 ; 0)
2 1yx
= − +( 1 ; 2)−
1y =
12(1 ; )
1 12
x
y = − +
(0 ; 0)
1y =
(0 ; 2)−
2 2y x= − −
( 1 ; 0)−
2x =
(1 ; 2)
2y = −
(0 ; 0)
13(1 ; )
13
y x=
(1 ; 3)3yx
=
( 1 ; 3)− −
13(1 ; )
13
y x=
13(1 ; )
213
y x=
13( 1 ; )−
(0 ;1)
1 13
y x= − +
(3 ; 0)(3 ; 0)
1y = −
( 1 ; 4)− −
3 1yx
= −
(1 ; 2)
1y =
13(0 ;1 )
(3 ; 0)
2 9y x= − +
( 3 ; 0)−
(0 ; 9)

291
(9) (10) (11) (12)
EXERCISE 6 (a) (1) 2 (2) 4 (3) 7 (4) 11 (5) 1 (6) 2 (7) 22 1a a− + (8) 28 2 1x x− + (9) 24 2 2x x− + (10) 22 3x x− + (11) 22 1x x+ + (12) 22 5 4x x− + (13) 24 10 5x x− + (14) 2 22 4 2 1x xh h x h+ + − − + (15) 24 2xh h h+ − (b) (1) 3 or 3x x= − = (2) 5 or 5x x= − = (3) 6 or 1x x= − = (4) 3x = (c) (1) 2 6p− + (2) 7
2− (d) (1) f is vertically stretched by a factor of 3 to form g (2) f is reflected in the x-axis to form g (3) f is shifted 2 units up to form g (4) f is shifted 4 units down to form g (5) f is vertically stretched by a factor of 4 to form g (6) f is reflected in the x-axis to form g EXERCISE 7 (a) ( 3 ;1]x ∈ − [ 4 ; 2)y ∈ − (b) ( ; )x ∈ −∞ ∞ ( ; )y ∈ −∞ ∞ (c) f : ( ; )x ∈ −∞ ∞ [0 ; )y ∈ ∞ g : ( ; )x ∈ −∞ ∞ ( ; 3]y ∈ −∞ − (d) ( ; ) 0x x∈ −∞ ∞ ≠ ( ; ) 0y y∈ −∞ ∞ ≠ (e) ( ; ) 0x x∈ −∞ ∞ ≠ ( ; ) 2y y∈ −∞ ∞ ≠ (f) f : ( ; )x ∈ −∞ ∞ ( ;1)y ∈ −∞ g : ( ; )x ∈ −∞ ∞ (2 ; )y ∈ ∞ EXERCISE 8 (a) (1) A(2 ; 0) B(0 ; 4)− (2) C(0 ; 1) D( 1; 0)− − (3) 2 (4) 1− (5) E(1 ; 2)− (6) 4 2 8x y− = increases for all real values of x 1x y+ = − decreases for all real values of x (b) (1) (c) (1) 3y x= + (2) 5y x= − − (3) 2 6y x= + (4) 3
2 6y x= − − (5) 2y x= + (6) 1
2 6y x= − + (d) (1) 1y = − Gradient is 0 (2) 1x = − Gradient is undefined
(2) ( 1 ; 7)− − EXERCISE 9 (a) (1) A(0 ; 2)− (2) 0x > (3) 0x < (4) 2−
B( 1 ; 0)− (5) A(0 ; 2)− (6) 0x = (7) ( ; ) [ 2 ; )x y∈ −∞ ∞ ∈ − ∞ C(1 ; 0) (8) 2y = − Grad 0= (9) ( ; ) { 2}x y∈ −∞ ∞ ∈ −
(0 ; 4)
1 33
x
y = +
3y =
( 1 ; 6)−(1 ; 6)
3y = −
(0 ; 0)
3.3 3xy = −(1 ; 3)
3y = −
(0 ; 0)
3.2 3xy = −(1 ; 0)
2 2xy = −
(0 ; 1)−
2y = −
(0 ; 4)−
3 4x y− =
13(1 ; 0)
(0 ; 5)−
2 5x y− =
( 1 ; 7)− −
12(2 ; 0)

292
(b) (1) A(0 ; 9) (2) 0x < (3) 0x > (4) 2− B( 3 ; 0)− (5) 9 ; 0 (6) (0 ; 9) ; (0 ; 0) C(3 ; 0) (7) For f : ( ; )x ∈ −∞ ∞ For g: ( ; )x ∈ −∞ ∞ ( ; 9]y ∈ −∞ ( ; 0]y ∈ −∞ (8) 2( ) 12h x x= + h is the graph of g reflected in the x-axis and then shifted 12 units up. (9) 3x = − Gradient is undefined (10) { 3}x ∈ − ( ; )y ∈ −∞ ∞ (c) (1) A(0 ; 1)− B(0 ; 9)− C( 3 ; 0)− D(3 ; 0) (2) E( 2 ; 5)− − F(2 ; 5)− (d) (1) 2( ) 4 2f x x= + (2) 2( ) 1f x x= − − (3) 2( ) 9f x x= − (4) 2( ) 16f x x= − + (5) 2( ) 2 8f x x= − (6) 2( ) 25f x x= − + EXERCISE 10
(a) (1) 4q = (2) 2( ) 4f xx
−= + (3) ( ; ) 0x x∈ −∞ ∞ ≠ ( ; ) 4y y∈ −∞ ∞ ≠
(4) ( ; 0)−∞ ; (0 ; )∞ (5) 0x = 4y = (6) 4y x= − +
(b) (1) 12( )f xx
= (2) 4( ) 2f xx
= + (3) 15( )f xx
−= (4) 5( ) 3f xx
−= +
(5) 32( ) 4f xx
= − (6) 8( ) 4f xx
−= − (7) 5( ) 3f xx
= − (8) 4( ) 1f xx
= +
(9) 6( ) 2f xx
−= − (10) 1( ) 12
f xx
= − + (11) 4( ) 2f xx
= +
(c) (1) ( ; 0)x ∈ −∞ (2) ( ; 0)x ∈ −∞ (3) (0 ; )x ∈ ∞ (0 ; )y ∈ ∞ ( ; 3)y ∈ −∞ − ( ; 5)y ∈ −∞
8( ) 0f x xx
−= < 8( ) 3 0f x xx
= − < 18( ) 5 0f x xx
−= + >
EXERCISE 11
(a) ( ) 2 4xf x = − (b) 1( ) 13
x
g x = −
(c) ( ) 3 3xh x = − +
(d) ( ) 3.2xf x = (e) ( ) 2.3 18xf x = − + (f) 1( ) 4. 44
x
g x = −
EXERCISE 12 (a) (1) OA 2= OP 4= OB 2= OC 4= (2) AP 6= BC 2= (3) OD 2= EF 2= OF 4= DE 4= (4) OK 1= GH 1= OG 5= KH 5= (5) RS 1= OS 3= (6) 4x ≤ (7) 2x < (8) 3x > (b) (1) OP 5= OQ 5= (2) AB 7= (3) DC 2= (4) OF 2= (5) OH 8= (6) 5x < − (c) (1) AB 6= CD 2= DF 2= (2) PQ 4= (3) OU 5= (4) GH 3= (5) 4x < (6) 2x ≤ − (7) 1x < (d) (1) AB 12= CT 6= CD 6= (2) OF 4= EF 7= (3) GH 4= (4) OV 11= (5) JL 10= (6) OQ 4= (7) 3 or 3x x< − > (8) 4 or 3x x≤ − ≥
(e) (1) OA 1= (2) 12BC 2= (3) O D 2= OE 2=
(4) 12F( ; 2) (5) 0 1x< ≤ (6) 0 or 1x x< > (7) 0x >
(8) 120 x< <
(f) (1) OA 1= CD 1= (2) 1x < − (3) 1x ≥ − (4) All real values of x (5) 0x < (6) 0x ≥

293
CONSOLIDATION AND EXTENSION EXERCISE
(a) (1) (2) ( ; )x ∈ −∞ ∞ (3) (0 ; 2) (4) 2− [ 1 ; )y ∈ − ∞ (5) (6) (0 ;1) (7) ( 1 ; 0)− (b) (1) (2) (3) ( 1 ; )y ∈ − ∞ (4) ( ; ) 0x x∈ −∞ ∞ ≠
h is the graph of f stretched p is the graph of g reflected in vertically by a factor of 3 and the x-axis and then shifted 1 then shifted 1 unit down. unit up.
(c) (1) 2( ) 2f x x= + (2) (0 ; 2) (3) 0x = (4) 2y =
(5) 1( ) 2g xx
= + ; 12A( ; 0)−
(6) f : ( ; )x ∈ −∞ ∞ [2 ; )y ∈ ∞ g : ( ; ) 0x x∈ −∞ ∞ ≠ ( ; ) 2y y∈ −∞ ∞ ≠ (7) 0x <
(d) (1) 1q = − (2) 3AB4
= (3) OC 3= (4) OT 1=
(5) 1( ) 22
x
g x = −
(e) (1) ( ) 3f x x= − + (2) A(3 ; 0) ; C( 3 ; 0)− (3) 2( ) 9g x x= − (4) AC 6= (5) DE 7= ; DF 4= (6) ST 8= (7) 3
2OM = (8) 3 or 3x x≤ − ≥ (9) 4 3x− < <
(f) (1) ( ; 6]y ∈ −∞ (2) 1( ) 2 63
x
f x = − +
(3) 6( ) 6g xx
= +
(4) (5) All real values of x
(g) (1) 2 2x− ≤ ≤ (2) 1 2x− < < (3) 1 1x− ≤ ≤ (4) 2x < − (5) 2x ≥ − (6) 12t > (7) 12t <
CHAPTER 7 (EUCLIDEAN GEOMETRY)
EXERCISE 1
(a) (1) 70a = ° 70b = ° 70c = ° 110d = ° 70e = ° 20f = ° 40g = ° 100h = ° 60i = ° (b) (1) 40a = ° (2) 20b = ° 80c = ° 100d = ° 80e = ° (d) (2) 56y = ° (f) BC 674 cm=
EXERCISE 2
(a) A 70= ° B 110= ° C 70= ° D 110= ° (b) 1 1 2 2ˆ ˆ ˆ ˆR S Q Q S 60= = = = = °
(c) K 63= ° L 117= ° M 63= ° N 117= °
2( ) 1f x x= −
1− 1
1−
( ) 1g x x= − (1 ; 3)
2 2y x= +
( 1 ; 3)−
(0 ; 2)
2 2y x= − −
(0 ; 2)−
( 1 ; 3)− − (1 ; 3)−
1y = −
(0 ; 2)
3.3 1xy = −
( 1 ; 0)−(3 ; 0)
3 1yx
= − +( 1 ; 4)−
1y =
1( ) 2 63
x
h x = −

294
(d) B 65= ° 2E 65= ° 2M 115= ° 1N 115= °
(e) A 110= ° 1 1ˆ ˆB D 35= = ° 2 2
ˆ ˆB D 35= = ° (f) 2
ˆ ˆC L 60= = ° 2 2ˆ ˆM N 120= = °
(g) 2ˆ ˆC M 120= = ° 1 2
ˆ ˆA A 60= = ° 1ˆ ˆ ˆD B M 60= = = °
(h) 1D 68= ° (i) DE 50 cm= (2) 300 cm EXERCISE 4 (a) 2 1 1
ˆ ˆ ˆQ S Q 35= = = ° ˆ ˆR P 110= = ° (b) 1A 70= ° 2A 20= ° 1B 20= ° 2B 70= ° 1C 70= ° 2C 20= ° 1D 70= ° AD 8 cm= AE 5 cm= AB 6 cm= (c) 1F 80= ° (d) PR 20 cm= (e) AC BD 5 x= = (j) 80a = ° 20b = ° 20c = ° 20d = ° 140e = ° (m) (1) AE 8 cm= (2) AC 28 cm= (3) 1B 70= ° EXERCISE 5 (a) (1) 20x = ° (b) θ 108= ° β 36= ° α 72= ° (c) 45x = ° (d) β 115= ° EXERCISE 6
(a) CE 60 cm= CONSOLIDATION AND EXTENSION EXERCISE (a) R 45= ° 2S 45= ° 2E 135= ° 2T 135= ° (h) 2
ˆ ˆQER E 72= = ° (m) (1) (n) (2) CHAPTER 8 (ANALYTICAL GEOMETRY) EXERCISE 1
(a) AB 13= ; CD 5= ; EF 58= ; GH 5= (b) (1) AB BC= (2) 19,3 (c) AC BC= (d) 1x = − (e) 3 or 1y y= = EXERCISE 2
(a) Midp AB (4 ; 2)= Midp CD ( 3 ; 2)= − 3 1Midp EF ;2 2
− − =
5Midp GH 3 ;2
− =
(b) (1) (2 ;1) (2) 4,2 (c) (1) 5 ; 3x y= − = (2) 4 ; 8x y= − = (3) 4 ; 7x y= = − (d) F( 4 ; 3)− (e) B(0 ; 5) EXERCISE 3 (a) (1) ABgrad 1= (2) 5
AB 3grad = (3) ABgrad 1= (4) 5AB 3grad = −
(b) ABgrad 3= − 5CD 7grad = EFgrad is undefined GHgrad 0=
(c) (1) Parallel (2) Neither (3) Perpendicular (d) (1) 3a = (2) 1b = (e) FR RNm m= (f) 3x = ±
(g) (1) 13x = (2) 234x = − (3) 17x = −
(h) 4x = ; 5y = (i) 2BD 3m = −
(j) (1) 3,6 (2) P(1 ; 5) (3) 1AB BC 5 5 1m m× = × − = − (4) 13

295
EXERCISE 4
(a) Diagonals bisect (b) Diagonals bisect at right angles (c) Diagonals bisect and one interior angle is a right angle (d) (1) Diagonals bisect (2) Interior angle is not 90° (e) B( 4 ;1)− (f) (1) C( 6 ; 4)− ; D( 2 ; 0)− (2) AP is not perpendicular to DP
CONSOLIDATION AND EXTENSION EXERCISE
(a) (1) AB 6,3= (2) M(7 ; 4) (3) P(16 ; 7) (b) (1) 14,5 (2) Isosceles (3) No pair of sides form a right angle (c) 2b = (d) (1) ACgrad 2= (2) BC 5, 6= (3) ( )1
2M ; 2− (4) D(0 ; 2) (5) 1
BD AC 2grad ×grad 2 1= − × = − (e) (1) U( 4 ; 3)− (2) 3
RU 4grad = − (3) 3UO UR 4grad grad= = − (4) 150
(f) (1) 32a = ; 2k = − (2) D( 3 ; 0)−
(g) (1) 12 (2) V( 2 ; 3)− (3) 3 2SE AS 2 3grad grad 1× = × − = −
(h) Diagonals bisect (i) (1) N(3 ; 5) (2) 32
MP LN 3 2grad grad 1× = − × = − ; LMNP is a rhombus
(3) 1LM MN 5grad grad 5 1× = − × = − ; ˆ ˆ ˆ ˆM N L P 90= = = = °
(j) 3b = ; S(0 ; 6) (k) (1) B(6 ; 2) (2) C(6 ; 2 )r+ (3) 3r = (l) (1) 3y x= + (2) 1y x= − −
CHAPTER 9 (FINANCIAL MATHEMATICS)
EXERCISE 1
(a) (1) R 5 400 (2) R6 045,20 (b) (1) R17 760 (2) R740 (c) (1) R649 800 (2) R912 922,21 (d) (1) R285 132,38 (2) R279 793,50 (e) (1) R485 717,81 (f) 5 years, 5 months (g) 9 years, 1 month (h) (1) 11,4% (2) 9,5% (i) (1) 25% (2) 6,1%
EXERCISE 2
(a) R603,50 ; R23 426 (b) (1) R886,67 (2) R22 800 (3) R60 800 (c) 15% (d) 12,9% (e) R2 250 ; 25% (f) R6 600 ; 22% (g) R58 064,52 (h) R216 397,55
EXERCISE 3
(a) R8 212,89 (b) R20,94 (c) No (d) R90 212,12 (e) (1) R16 310,19 (2) R51 428,59 (f) 10,5% (g) R5 340 (h) 9,1%
EXERCISE 4
(a) $645 R7 901,25= (b) 30£ R510= (c) R2,82 = ¥50 (d) $265,96 R3 000= (e) £4 000 R72 960= (f) ¥20 454,55 R4 500= (g) (1) 1£ R18,24= (2) £1 619,50
296
(h) Germany
(i) R177 984 (j) R145 640
EXERCISE 5
(a) R50 229 570 (b) R332 634 162 (c) R4 319 (d) R6 175 634 873 (e) (1) 115,4% (2) R60 000 (f) 2% EXERCISE 6
(a) R34 474,39 (b) R1 279 685,86 (c) R74 032,86 (d) R698 273,39 (e) R188 593,73 (f) R6 564,25
CONSOLIDATION AND EXTENSION EXERCISE
(a) (1) R30 693,85 (2) R34 377,11 (b) (1) R434 782,61 (2) R294 588,35 (c) (1) R=33,3% (2) 26% (d) R167 568 672 700 (e) R 16 362 (f) $578,03 R10 000= (g) R261 920,83 (h) 10,4% (i) 39 900 000% (j) R13 008,69 (k) R34 975,41 (l) R19 734,32 (m) R14 060,20
CHAPTER 10 (STATISTICS)
EXERCISE 1
(a) (1) (2) (b) (1) 16 seeds (2) 5 days (3) 75% (c) (1) (2) (3) 30-39 year olds (d) (1)
Score Frequency 0 1 1 3 2 5 3 6 4 12 5 3 30n =
1 7 7 8 8 9 9 2 0 2 4 4 6 7 7 3 4 5 5 5 5 5 5 5 9 9 4 1 2 2 3 7 8 5 0 3 3 4 5 7 6 3 4 5 6 6
0 1 3 3 4 4 5 7 7 8 8 8 9 9 1 0 2 3 3 4 4 4 4 4 4 4 8 8 8 9 9 2 0 0 1 1 1 1 2 2 3 3 4 5 7 7 7 7 8 3 0 0 1 9
297
(2) (3) 21 agents (4) 58% (e) (1) Check the current exchange rates using GOOGLE. (2) (3) 20% (4) 46,7% (5) Company B. (f) (1) 16 (2) 16 (3) 2 (4) 11 (5) Class B (g) (1) 45-54 (2) 72% (3) 132 000 (4) 125 000
EXERCISE 2
(a) (1) 7x = Median 6= Mode 5= (2) 10x = Median 8= Mode 8= (3) 7,5x = Median 9= Mode 10= (4) 4,5x = Median 4,5= Modes 2 ; 4=
(b) 3 people (c) (1) R23 411,11x = Median R16 800= Mode R16 900=
(2) The mean has been inflated by the outlier (R86 300). The median and mode are better measures. (d) Median and mode (e) Mean (f) (1) 158x = Median 92= (2) Mean (g) (1) 38,6x = Median 35= Mode 35= (2) All three measures are useful since most of the ages are in the 30-year old group. (h) (1) 16,86x = Median 18= Mode 14= (2) The mean and median are probably the best measures. The mode is too low. (i) (1) 3x = Median 3= Mode 3= (2) All three measures are the same indicating that 3 boys are typical of a family with six children. (j) (1) 11x = (2) 12x = (3) 13x = (4) 9 ; 18 ; 27 ; 36 ; 45 (5) 3 ; 3 ; 4 ; 5 ; 10 3 ; 3 ; 4 ; 6 ; 9 3 ; 3 ; 4 ; 7 ; 8 (6) 34
EXERCISE 3
(a) (1) M 8= 1Q 3= 3Q 12= (2) M 11= 1Q 5= 3Q 15= (3) M 11,5= 1Q 6,5= 3Q 19= (4) M 17,5= 1Q 8= 3Q 25= (5) M 18,5= 1Q 9= 3Q 27=
(b) M 5= 1Q 3= 3Q 7= (c) M 128= 3
1 4Q 7= 33 4Q 8=
(d) M 81= 1Q 67= 3Q 89,5= (e) M 1, 445= 1Q 1,35= 3Q 1,55= (f) M 92= 1Q 86= 3Q 154,5= (g) M 35= 1Q 25= 3Q 51,5= (h) (1) 11x = (2) M 13= 1Q 10= 3Q 21=
EXERCISE 4
(a) (1) The 25th percentile is the 13th value which is 113. The 50th percentile is the average of the 25th and 26th values: 216,5
The 75th percentile is the 38th value which is 284. (2) The 30th percentile is the average of the 15th and 16th values: 126,5
COMPANY A COMPANY B 4 3 1 1 0 1 3 2 2 2 2 0 3 4 9
3 3 3 2 0 3 2 3 3 4 5 4 2 1 4 3 3 3 4

298
(3) The 65th percentile is the 33rd value which is 253. (4) The 80th percentile is the average of the 40th and 41st values: 289,5
(b) (1) The 25th percentile is the average of the 54th and 55th values: 66,03 The 50th percentile is the average of the 108th and 109th values: 74,1 The 75th percentile is the average of the 162nd and 163rd values: 78,485
(2) The 90th percentile is the 195th value which is 81,17. (3) The 60th percentile is the 130th value which is 75,55. (4) The 60th percentile is the 98th value which is 72,93.
(5) The top ranking countries tend to have better medical facilities and the employment figures are higher, meaning less poverty.
EXERCISE 5
(a) (1) Minimum 1= Maximum 10= 2M Q 4= = 1Q 2= 3Q 8= (2) (3) 4,7x = (4) Mean > Median (positively skewed)
(b) (1) Minimum 1= Maximum 10= 2M Q 8= = 1Q 7= 3Q 9= (2) (3) 7, 25x = (4) Mean < Median (negatively skewed)
(c) (1) Minimum 2= Maximum 15= 2M Q 9= = 1Q 5= 3Q 13= (2) (3) 9x = (4) Mean = Median (symmetrical)
(d) (1) Minimum 2= Maximum 10= 2M Q 6= = 1Q 3= 3Q 9= (2) (3) 6x = (4) Mean = Median (symmetrical)
(e)
(f)
(g)
1Q 2Q 3Q
1Q 2Q 3Q
1Q 2Q 3Q
1Q 2Q 3Q
1Q 2Q 3Q
127 1
28 348
1Q 2Q 3Q
1Q 2Q 3Q
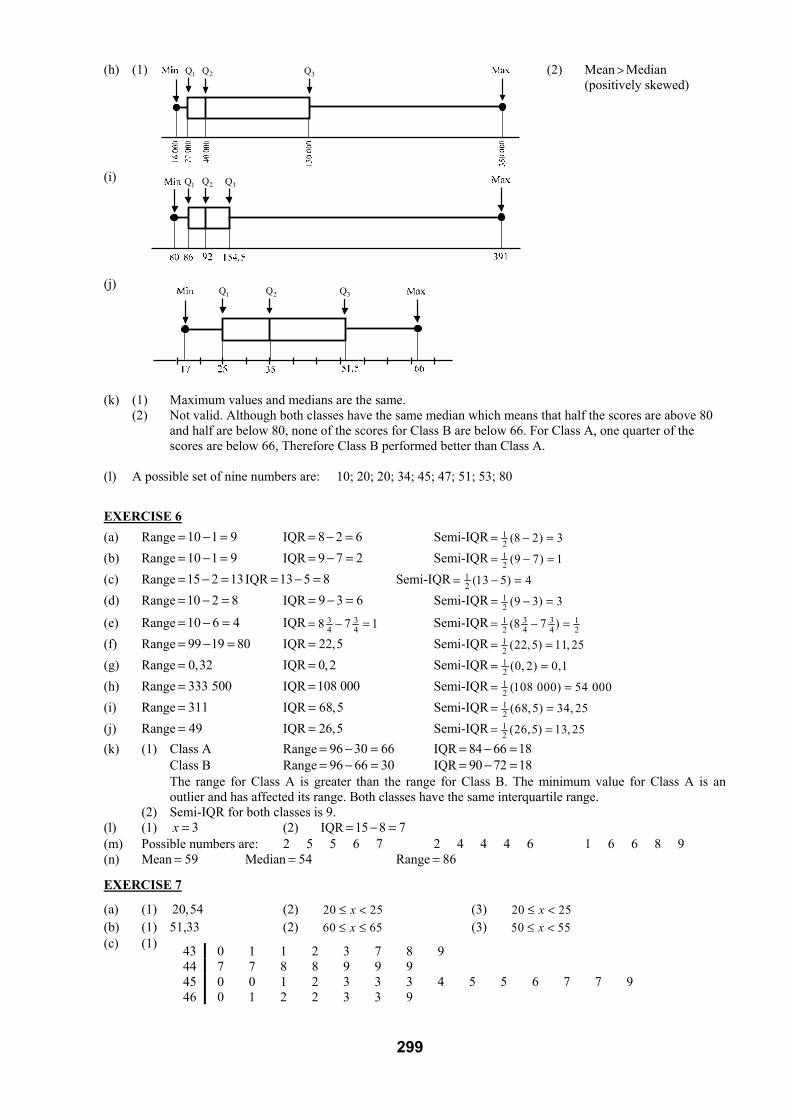
299
(h) (1) (2) Mean > Median (positively skewed) (i)
(j)
(k) (1) Maximum values and medians are the same.
(2) Not valid. Although both classes have the same median which means that half the scores are above 80 and half are below 80, none of the scores for Class B are below 66. For Class A, one quarter of the scores are below 66, Therefore Class B performed better than Class A. (l) A possible set of nine numbers are: 10; 20; 20; 34; 45; 47; 51; 53; 80
EXERCISE 6
(a) Range 10 1 9= − = IQR 8 2 6= − = Semi-IQR 12 (8 2) 3= − =
(b) Range 10 1 9= − = IQR 9 7 2= − = Semi-IQR 12 (9 7) 1= − =
(c) Range 15 2 13= − = IQR 13 5 8= − = Semi-IQR 12 (13 5) 4= − =
(d) Range 10 2 8= − = IQR 9 3 6= − = Semi-IQR 12 (9 3) 3= − =
(e) Range 10 6 4= − = IQR 3 34 48 7 1= − = Semi-IQR 3 31 1
2 4 4 2(8 7 )= − = (f) Range 99 19 80= − = IQR 22,5= Semi-IQR 1
2 (22,5) 11, 25= = (g) Range 0,32= IQR 0,2= Semi-IQR 1
2 (0, 2) 0,1= = (h) Range 333 500= IQR 108 000= Semi-IQR 1
2 (108 000) 54 000= = (i) Range 311= IQR 68,5= Semi-IQR 1
2 (68,5) 34, 25= = (j) Range 49= IQR 26,5= Semi-IQR 1
2 (26,5) 13, 25= = (k) (1) Class A Range 96 30 66= − = IQR 84 66 18= − = Class B Range 96 66 30= − = IQR 90 72 18= − =
The range for Class A is greater than the range for Class B. The minimum value for Class A is an outlier and has affected its range. Both classes have the same interquartile range.
(2) Semi-IQR for both classes is 9. (l) (1) 3x = (2) IQR 15 8 7= − = (m) Possible numbers are: 2 5 5 6 7 2 4 4 4 6 1 6 6 8 9 (n) Mean 59= Median 54= Range 86=
EXERCISE 7
(a) (1) 20,54 (2) 20 25x≤ < (3) 20 25x≤ < (b) (1) 51,33 (2) 60 65x≤ ≤ (3) 50 55x≤ < (c) (1)
43 0 1 1 2 3 7 8 9 44 7 7 8 8 9 9 9 45 0 0 1 2 3 3 3 4 5 5 6 7 7 9 46 0 1 2 2 3 3 9
1Q 2Q 3Q
1Q 2Q 3Q
1Q 2Q 3Q

300
(2)
(3) Actual mean =45,01 Median 45,15= The modes are 44,9 and 45,3 (4) Range 3,9= IQR 1= (5)
(d) (1)
(3) Actual mean 70,07= Median 69,5= (4) IQR 80 57 23= − =
CONSOLIDATION AND EXTENSION EXERCISE
(a) (1) R90x = Median R63= Mode R54= Range R234= (2) The mean since it is the highest measure of central tendency. (3) The mode since it is the lowest measure of central tendency. (b) (1) Company A since its mode of 25 is higher and more frequent than the mode for Company B. (2) Mean for Company A 20,9= Mean for Company B 21,9= The mean suggests that Company B is the best since the mean is the higher of the two. (c) Mode 0= Median 0= The mode and median suggest that he caught no fish. (d) Sandy: 26x = Range 7= Paul: 26,3x = Range 18=
For Paul, the mean is slightly higher than the mean for Sandy. The range is significantly higher for Paul indicating that Sandy tends to be more consistent than Paul. This suggests that Sandy is the best to consider.
(e) 6,5x = (f) 2,77x = Median 3= Mode 2= (g) (1) Maths: Science: (2) No, the argument is invalid. 50% of the learners scored between 30% and 55% in Science. 50% of the learners scored between 30% and 45% in Maths. Therefore, the numbers will be equal.
Class interval Frequency 43, 0 44, 0x≤ < 8 44,0 45,0x≤ < 7 45,0 46,0x≤ < 14 46,0 47,0x≤ < 7
4 4 9 5 0 2 4 5 6 7 9 6 4 4 5 6 8 8 7 1 1 2 4 5 7 8 8 0 2 4 8 8 9 6 7 8
Tickets per day Frequency No of tickets×frequency 0 1 0 1 1 1 2 10 20 3 7 21 4 5 20 5 2 10 6 0 0
Totals 26 72
1Q 2Q 3Q
1Q 2Q 3Q 1Q 2Q 3Q

301
(h) Estmated mean 24,12= Median class: 18 24p≤ < Modal class: 18 24p≤ <
(i) 163, 48x = (j) 2x = (k) 60, 42x = (l) R9 000 (m) 5x =
CHAPTER 11 (MEASUREMENT) EXERCISE 1
(a) (1) Cuboid: 3V 126 cm= Cylinder: 3V 318,09 cm= Triangular prism: 3V 18 cm= (2) Cuboid: 2S 162 cm= Cylinder: 2S 268,61 cm= Triangular prism: 2S 63 cm=
(3) Cylinder: 2S 204,99 cm= Cuboid: 2S 120 cm= (b) (1) Volume of A and B is 38 000 cm (2) 20 cmr = (3) C (c) The triangular prism (d) (1) 3 cm (2) 270 cm (3) 8 cm (4) 5 cm (e) (1) 37 875 000 cm 7 875 l= (2) 3000 000 m 3 000 l l= (3) 2189 105,63 cm EXERCISE 2
(a) (1) 2k = (2) Original: 2S (64 ) cm= π Enlarged: 2 2S (2) (64 ) cm= × π (3) Original: 3V (96 ) cm= π Enlarged: 3 3V (2) (96 ) cm= × π (b) (1) 27 300 cm ; 33 000 cm (2) 21 168 cm (c) (1) 224x ; 38x (2) 2x (d) (1) 3(1 568 ) cmπ (2) new originalV 4 V= × (3) 2(616 ) cmπ (4) new originalS 4, 2 S= × (e) (1) 2V a b= π ; 2S 2 2a ab= π + π (2) scale factor of 2 (3) 4 times (4) 2 times
(f) (1) 32
k = ; 3810 cm (2) A BS :S 4 : 9= (g) (1) Q 12,59 cmh = (2) Area of base P : Area of base Q = 1 : 1,31 (h) (1) enlarged originalS : S 25 :16= (2) enlarged originalV : V 125 : 64= EXERCISE 3
(a) (1) 2684,00 cm ; 31 045,33 cm (2) 27 539,82 cm ; 337 699,11 cm (3) 226,62 m ; 312,57 m (4) 21 809,56 cm ; 37 238,23 cm (5) 284,82 m ; 356,55 m (6) 21 403,07 cm ; 319 893,61 cm
(b) (1) 243,30127019 cm (2) 263,78675411 cm (3) 2234,66 cm (4) 3173, 21 cm (c) (1) 7,5 cm (2) 38 246,68 cm (d) 30,81 cm (e) 31 432,57 cm (f) (1) 21800 m (2) 35250 m
CONSOLIDATION AND EXTENSION EXERCISE
(a) (1) 364 000 cm (2) 29 740,62 cm (b) (1) 264,95190528 cm (2) 3519,62 cm (c) (1) 2209, 4395102 cm (2) 31 466,08 cm (3) 8,82 cm (d) 1,361 cm
(e) (1) 4π (2)
4π (3) 24V
3r h=

302
CHAPTER 12 (PROBABILITY) EXERCISE 1
(a) (1) 635
(2) 58 2970 35
=
(b) (1) 16
(2) 2 16 3
= (3) 3 16 2
= (4) 56
(c) (1) 528
(2) 928
(3) 14 128 2
= (4) 0 028
= (5) 1928
(d) (1) 8 116 2
= (2) 8 116 2
= (3) 1316
(4) 5 115 3
=
(e) 12 500 C is the closest answer
(f) (1) 311
(2) 311
(3) 2 110 5
=
(g) (1) 13 152 4
= (2) 152
(3) 4 152 13
= (4) 8 252 13
= (5) 26 152 2
=
(h) (1) 2 16 3
= (2) 3 115 5
= (3) 34
(4) 12
(5) 13
(i) 192 3256 4
π =π
(j) (1) 18
(2) 12
(3) 58
EXERCISE 2
(a) (1) { }A 3 ; 5= (A) 2n = 2 1P(A)6 3
= =
(2) (3) (4) (b) (1) (2) { }S R ; A ; N ; D ; O ; M ; L ; Y= Event A { }A ; O=
(3) (A) 2n = ; (S) 8n = (4) 2 1P(A)8 4
= =
(c) (1) { }A 1 ; 2 ; 3 ; 4 ; 5= (A) 5n = 5P(A)12
= (2) { }B 5 ; 10= (A) 2n = 2 1P(B)12 6
= = (3) (4) (5)
(d) (1) { }A 2 ; 3 ; 5 ; 7 ; 11= (A) 5n = 5P(A)12
= (2) { }B 6 ; 12= (A) 2n = 2 1P(B)12 6
= = (3) (4) (5) (e) (1) { }S ; ; ; ; ; ; ; ; ; ; ; ; ;a b c d e f g h i j k l m n=
{ }A ; ; ; ;a b c d e= { }B ; ; ; ; ;d e f g h i= { }C ;j k= (2) (A) 5n = (B) 6n = (C) 2n =
(3) 5P(A)14
= 6 3P(B)14 7
= = 2 1P(C)14 7
= = (4) (5)
A S3
5
1 24
6
26
46
412
112
112 6
12
512
512
212
S
AB
C3
14
214
414
2143
14

303
(f) (1) (2) (T) 220n = (D) 250n = (S) 390n =
(3) 150 5390 13
= (4) 120 4390 13
= (5) 20 2
390 39=
(6) 100 10390 39
=
EXERCISE 3
(a) (1) { }S 1 ; 2 ; 3 ; 4 ; 5 ; 6 ; 7 ; 8 ; 9 ; 10 ; 11 ; 12= (2) 6 112 2
= (3) 512
(4) 112
(5) 512
(6) 112
(b) (1) 37
(2) 17
(3) 57
(4) 47
(5) 47
(6) 57
(c) (1) { }S ; ; ; ; ; ; ;a b c d e f g h= (2) 58
(3) 38
(4) 6 38 4
=
(5) 38
(6) 4 18 2
=
(d) (1) 3 (2) 7 (3) 8 (4) 6 (5) 3 112 4
=
(6) 712
(7) 8 2
12 3= (8) 6 1
12 2= (9) 3 (10) 3 1
12 4=
(11) 1 (12) 112
(13) 11 (14) 1112
(15) 9
(16) 9 312 4
= (17) 9 (18) 9 312 4
= (19) 5 (20) 512
(21) 512
(e) (1) (2) 165 (3) 140 (4) 300
(5) 45 3
300 20= (6) 40 2
300 5=
(7) (i) 205 41
300 60= (ii) 95 19
300 60=
(f) (1) (2) 15 (3) 40 1
1 520 38=
(4) 1 505 3011 520 304
= (5) 1 465 2931 520 304
=
(6) (i) 1 480 371 520 38
= (ii) 15 31 520 1 024
=
(g) (1) (2) 18 360 10
= (3) 9 360 20
=
(4) 12 160 5
=
(5) (i) 30 160 2
= (ii) 28 760 15
=
(h) (1) 0,1 (2) 0,3 (3) 0,2 (4) 0, 2 0,1 0,3+ = (5) 0,3 0,1 0,4+ = (6) 0,3 0, 4 0, 2 0,9+ + =

304
(i) (1) Learners that are not in School P that dislike Maths. In other words, learners in School K that dislike Maths.
(2) (i) 60 3100 5
= (ii) 84 21100 25
= (iii) 40 2100 5
=
(j) (1) 2 110 5
= (2) 6 1 710 10 10
+ =
(3) (i) 5 (ii) 5 (iii) 2 110 5
=
(iv) 2 110 5
= (v) 8 410 5
=
EXERCISE 4
(a) (1) B (2) C (3) D (4) A (5) C (6) A
(b) (c) (d)
0,8 0,15 0,7
(e) (1) 0,2 (2) 0,3 (3) 0,7
(f) (1) 2528
(2) 10 528 14
= (3) 528
(4) 18 928 14
=
EXERCISE 5
(a) (1) 0,9 (2) 0,5 (3) 0,3 (4) 0,1 (5) 0,7 (6) 0,4
(b) (1) 37
(2) 37
(3) 17
(4) 47
(5) 57
(6) 27
(c) (1) 0,6 (2) 0,5 (3) 0,4 (4) 0,6 (5) 0,7 (6) 0,2 (d) (1) 0,6 (2) 0,23 (3) 0,15 (e) (1) 0,8 (2) 0,7 (3) 0,4 (f) 0,9 (g) 0,67 (h) 0,1 (i) (1) 0,1 (2) 0,4 (j) (1) not complementary (2) not complementary (3) complementary (k) (1) 0,125 (2) not complementary (l) 0,01
CONSOLIDATION AND EXTENSION EXERCISE
(a) 727
(b) 0,1 (c) (1) 346
(2) 3546
(3) 16 846 23
=
(d) (1) complementary (2) not complementary (3) not complementary
(e) 35
(f) (1) 0,3 (2) 0,4 (3) 4
(g) (1) 4P(A)9
= ; 2P(B)9
= (2) 59
(h) (1) Diagram 2 (2) Diagram 1 (3) Diagram 4 (4) Diagram 3 (5) Diagram 2 (6) Diagram 1 (7) Diagram 4 (8) Diagram 3
(i) (1) 38
(2) 2 18 4
= (3) 4 18 2
= (4) 18
× × ×