alkalieffectonalkali-surfactant-polymer(asp)flooding
TRANSCRIPT

Research ArticleAlkali Effect on Alkali-Surfactant-Polymer (ASP) FloodingEnhanced Oil Recovery Performance: Two Large-Scale FieldTests’ Evidence
Chen Sun,1 Hu Guo ,1,2,3 Yiqiang Li ,1 Guipu Jiang,4 and Ruicheng Ma5
1State Key Laboratory of Petroleum Resources and Prospecting, China University of Petroleum-Beijing, Beijing 102249, China2Institute of Computer Physics, Stuttgart University, Stuttgart 70569, Germany3School of Petroleum and Environment Engineering, Yan’an, Shaanxi 716000, China4No. 4 Oil Production Plant, Daqing Oilfield Company Ltd., Daqing 163511, China5Department of Middle East E&P, Research Institute of Petroleum Exploration and Development (RIPED), Beijing 100083, China
Correspondence should be addressed to Hu Guo; [email protected] and Yiqiang Li; [email protected]
Received 20 December 2019; Revised 22 February 2020; Accepted 28 February 2020; Published 27 May 2020
Academic Editor: Patricia E. Allegretti
Copyright © 2020 Chen Sun et al. ,is is an open access article distributed under the Creative Commons Attribution License,which permits unrestricted use, distribution, and reproduction in any medium, provided the original work is properly cited.
Alkali-surfactant-polymer (ASP) flooding is very promising chemical enhanced oil recovery (EOR) technology which canmake anincremental oil recovery factor (IORF) of 30% original oil in place (OOIP). How to choose alkali in ASP flooding remains aquestion for a long time. As the world’s only and largest ASP flooding application place, Daqing Oilfield has always adhered to thestrategy of parallel development of strong alkali ASP flooding (SASP) and weak alkali ASP flooding (WASP), but SASP is in adominant position, indicated by more investments and more project numbers. ,is leaves an impression that SASP is better thanWASP. However, WASP is drawing more interest than SASP recently. Moreover, as the ASP flooding in Daqing went from fieldtests to commercial applications since 2014, how to comprehensively consider the benefit and cost of ASP flooding has become anew focus at low oil prices. ,is paper compares two typical large-scale field tests (B-1-D SASP and B-2-X WASP) completed inDaqing Oilfield and analyzes and discusses the causes of this difference.,e injection viscosity and interfacial tension (IFT) for thetwo field test areas are substantially equivalent under the conditions of Daqing Oilfield, and WASP is better than SASP whenreservoir geological conditions are considered. WASP exhibits the same IORF of 30% as SASP while having a much bettereconomic performance. For the SASP field test, the injected strong alkali NaOHmakes the test behave unlike a typical strong ASPflooding due to the presence of CO2 in the formation fluid, which well explains why IORF is much higher than all the other SASPsbut scaling is less severe than others. ,is paper confirms that under Daqing Oilfield reservoir conditions, it is the alkali differencethat caused the performance difference of these two tests, although some minor uncertainties exist. WASP is better than the SASPproviding the same conditions . In addition, the detailed information of the two ASP field tests provided can give reference for theimplementation of ASP flooding in other oilfields. After all, the study of ASP flooding enhanced oil recovery technology under lowoil prices requires great foresight and determination.
1. Introduction
Surfactants are important surface-active chemicals with ahydrophobic tail and a hydrophilic head [1, 2]. Two types ofsurfactants, natural and synthetic [3, 4], are both well studiedand widely used. Surfactants are used in different branchesof science and technology.,ey are used as catalysts [5–7] inbioremediation of toxic metals [8, 9], hydroformylation
reaction [10], and enhanced oil recovery (EOR) [11–14].EOR involves multidisciplinary collaboration of researchersin physics, chemistry, and reservoir engineering. ,e mostimportant two aspects of EOR are to increase displacementefficiency by reducing oil/water interfacial tension (IFT) toultralow with addition of surfactant and to increase sweepefficiency by increasing displacing phase viscosity withaddition of polymer. ,e former is major mechanism in
HindawiJournal of ChemistryVolume 2020, Article ID 2829565, 22 pageshttps://doi.org/10.1155/2020/2829565

surfactant flooding, while the latter is the key idea in polymerflooding [15, 16]. ,e combination of polymer and sur-factant, surfactant-polymer (SP) flooding, can make veryhigh oil recovery factor. In order to improve oil recovery,alkali is added to SP flooding, which becomes alkali-sur-factant-polymer (ASP) flooding [17–20]. Alkali-surfactant-polymer (ASP) flooding is an important chemical floodingenhanced recovery technology [21, 22] with wide range ofapplications [23, 24]. It can be used in sandstone reservoirs[23, 25, 26], fault block reservoirs [27–29], conglomeratereservoir [30], and carbonate reservoir [31]. It can be used inmedium-high permeability reservoirs [23, 25, 26] and also alow permeability reservoir [32]. It can be used to recoverlight oil [33, 34] and heavy oil [31]. Completed field testsshowed that ASP flooding can produce additional 15–33%[25] original oil in place (OOIP) upon water flooding. ASPflooding in China is very attractive [35]. As of 2014, amongthe 32 ASP flooding field tests surveyed, 21 were in China[24], and the majority is strong alkali (NaOH) based. Itshould be noted that some of China’s new ASP floodingprojects are not included in the literature [24], like one inhigh reservoir temperature started in 2011 in Henan Oilfield(81°C) [36] and the first weak ASP demonstration blockstarted in 2013 in Daqing Oilfield [37]. ,e incremental oilrecovery factor (IORF) of ASP flooding can be as high as33% OOIP and the average IORF is 21.8% [24]. Most of ASPflooding in China is conducted in Daqing Oilfield, which issummarized in our previous publication [38]. ASP floodinghas been put into commercial use in 2014 in Daqing [39].ASP flooding oil production in Daqing is 3.5 million tons,accounting for 9% total oilfield production, covering 22blocks and 7273 wells [37]. In 2016, 3 new ASP floodingblocks were put into use and the annual oil production fromASP flooding is more than 4 million tons [39]. ASP floodingoil production and percentage to total oilfield production aregiven in Figures 1 and 2 [40], respectively. Although bothstrong ASP flooding (SASP) and weak ASP flooding (WASP)have been developed in Daqing Oilfield and huge amount ofmoney has been invested to this EOR technology, thenumber of SASP completed in Daqing Oilfield is much morethan WASP according to a previous summary [24]. How-ever, the ASP flooding in Daqing is going toward WASP[37]. A study of ASP flooding cost in Daqing Oilfield showsthat the ASP flooding is economically feasible in Daqingwhen the cost of oil is 22–35 USD/bbl [35]. Since more SASPflooding tests were conducted in Daqing than WASP, it isnecessary to think why SASP gives way to WASP. Con-sidering the scale and stage of ASP flooding in DaqingOilfield, this issue is of great significance. If ultralow acidvalue oil in Daqing can be well produced by ASP, for manyother reservoirs with much high acid value of oil and higherpermeability than Daqing, ASP flooding has great potential.Our previous publication [40, 41] has investigated ASPflooding; however, due to lack of geology information, it isless convincing to conclude that WASP is better than SASPand less informative for other fields where ASP flooding maybe used. In this paper, the technical and economic differ-ences between the SASP and WASP field tests completed inDaqing Oilfield are analyzed and compared. It is confirmed
by the field test performance that the WASP is better thanSASP. At the same time, it provides more detailed geological,reservoir physical, and formation fluid information, which isconvenient for other similar blocks to carry out ASPflooding. After all, it is necessary to have the courage anddetermination to invest in ASP flooding technique underlow oil price. As for typical screening of surfactants andpolymers as well as ASP in China, one may refer to otherreferences [42–48].
2. Comparison of Test Blocks
,e two ASP flooding field tests compared in this paper areboth industrial tests in Daqing Oilfield. Compared with theearlier pilot tests, the industrial test scale in Daqing Oilfieldis much larger, which includes generally dozens of injectionwells (or injectors) and production wells (or producers),while a pilot test mostly contains 4 injection wells and 9production wells. ,e screening of ASP flooding involvesmultiple factors [23, 24, 26, 47, 49], especially the geo-chemical properties of the reservoir [50–55], properties ofcrude oil [56–59], properties of the formation water and theinject water [60–63], and the interaction between ASPsystem and the stratum minerals as well as oil-water[25, 51, 53, 60, 61, 64–71]. To make it easier for readers tounderstand the differences between the two field tests and tomake it convenient to provide a reference for the imple-mentation of ASP flooding in other potential reservoirs, wecompared the geology and reservoir properties of the twofield tests in detail in this paper. And some key indicators ofthe two test fields are shown in Table 1. Table 1 is collectedfrom various references above. Since the injection andproduction in the central well area are relatively complete, ifnot specifically stated, the IORF from ASP flooding in manypublications mainly refers to the central well area. However,it is easy to get confused because some researchers just usedthe higher value without special note.
For convenience, the weak ASP flooding (WASP) refersspecifically to the ASP field test using Na2CO3 as alkali inB-2-X block and the strong ASP flooding (SASP) refers tothe ASP field test using NaOH as alkali in B-1-D block in thispaper unless specially stated. To be simple, in this paperWASP refers to B-2-X and SASP refers to B-1-D.
Table 1 indicates that B-1-D and B-2-X have mostcomparable parameters. In this table, the same parametersare in roman while significant parameters are in italics.Underlined values are estimated because no data areavailable. ,e same parameters include well pattern and wellspacing, as well as well density in central well area. For-mation temperature and brine are regarded as engineeringlythe same based on its influence to EOR. ,ree parameters,average permeability, average sandstone thickness, and ef-fective sandstone thickness, are different. Average reservoirpermeability of B-1-D is much higher than B-2-X, althoughthey both remain in the medium permeability range which isgood to conduct chemical EOR. Average formation thick-ness of B-1-D is higher than B-2-X too. It is worth to notethat average permeability can only partly reflect the reservoirpermeable property but is one key parameter to learn about a
2 Journal of Chemistry

0.197 0.241 0.224 0.238 0.29 0.294 0.4390.824 0.959
1.2431.476
1.28 1.13 1.17
2.25
3.5
4.06
0.0
0.5
1.0
1.5
2.0
2.5
3.0
3.5
4.0
4.5
2000 2001 2002 2003 2004 2005 2006 2007 2008 2009 2010 2011 2012 2013 2014 2015 2016
ASP
floo
ding
pro
duct
ion
(mill
ion
ton)
Year
Asp flooding oil production in Daqing
Figure 1: ASP flooding oil production in Daqing Oilfield [40].
0.00 0.00 0.45 0.49 0.63 0.63 0.98 1.98 2.40
3.11 3.67
3.20 2.83 2.93
5.63
9.14
11.13
0
2
4
6
8
10
12
2000 2001 2002 2003 2004 2005 2006 2007 2008 2009 2010 2011 2012 2013 2014 2015 2016Year
Asp flooding oil production percentage in Daqing
ASP
floo
ding
pro
duct
ion
perc
enta
ge (%
)
Figure 2: ASP flooding production share in Daqing Oilfield [40].
Table 1: Comparison of basic reservoir physical properties.
ParametersWhole test area Central well area
B-1-D B-2-X B-1-D B-2-XArea, km2 1.92 1.21 1.13 0.79Injectors/producers 49/63 35/44 49/36 35/24Well density (1/km2) 58.33 65.28 75.22 74.68Average sandstone thickness (m) 10.6 8.1 11.8 8.8Average effective thickness (m) 7.7 6.6 8.4 7.1Average effective permeability(D) 0.670 0.533 0.675 0.529OOIP (104 ton) 240.71 116.31 143.41 75.64Pore volume(104m3) 505.11 219.21 298.44 142.66Well pattern Five-spot Five-spot Five-spot Five-spotWell spacing (m) 125 125 125 125Formation water type NaHCO3 NaHCO3 NaHCO3 NaHCO3Formation brine salinity (mg/L) 5611 6037 5611 6037Calcium ion (mg/L) 35.97 20–40 35.97 20–40Magnesium ion (mg/L) 9.44 10–20 9.44 10–20Target formation SII1-9 SII10-12 SII1-9 SII10-12Formation depth (m) 838–870 872–883 838-870- 872–883Formation-oil viscosity (cP) 8.2–9.3 8.2–10.4 8.2–9.3 8.2–10.4Dead oil viscosity (cP) 17.55 16.6 17.55 16.6Formation temperature (°C) 42.4 43–48 42.4 43–48
Journal of Chemistry 3

reservoir. Table 1 shows that these two blocks are verysimilar and comparable, while B-1-D is better than B-2-X.
2.1. Geological Comparison. ,e two target reservoirs are allsecond-class layer (SCL) [72–76]. In lots of literatures aboutDaqing Oilfield, the second-class layer (SCL) [26] is ofteninvolved, but many researchers even in China are not clearabout this concept. It is necessary to introduce this conceptwell to help understand the geological parameters. SCL is aconcept proposed during the process of analyzing differentlayer geological features of each reservoir in Daqing Oilfield.Specific criteria for the classification are shown in Table 2[72]. It is obvious from Table 2 that the physical properties ofthe SCL are worse than those of the first-class layer (FCL)and better than those of the third-class layer (TCL) fromreservoir engineering perspective. Figure 3 [77] shows thephotograph of cores from FCL and SCL. Table 3 [72] showsthe comparison of the pore structure of FCL and SCL. ,istable indicted that SCL pores are smaller and heterogeneousthan FCL pores. ,e classification of three layers is based onboth geological and reservoir engineering considerations.
,e sedimentary environment of the Saertu-Putaohua(S-P) layer in Daqing Oilfield is river delta, which belongs toclastic reservoirs. ,e lithology is mainly fine sandstone, finesiltstone, and argillaceous siltstone. Sandstone compositionis mainly feldspar (27–55%) and quartz (29–40%). ,e grainsize is mainly fine sand, the median grain size is between 0.08and 0.175mm, and the sorting coefficient is 2.1–4.8. ,eroundness of grit is mostly subcircle to subpoint. Loosecementation is dominated by contact and pore contactcementation. ,e cement is mainly muddy (muddy content6–16%), followed by carbonate (less than 6%). ,e main claymineral composition of the cement is kaolinite, followed byillite, and the secondary rock is weak. ,e storage space ofthe reservoir is mainly composed of primary pores andintergranular pores, the reservoir depth is 700–1200m, theporosity is 22–26%, original oil saturation is 56–76%, andpermeability to air is 0.2–1.6 μm2.
SASP B-1-D block is located on the top of the Saertuanticline structure in Daqing Oilfield.,e structure is gentle,the formation dip is 1°–2°, and there are no faults in the area.From the top to bottom, there are three oil-bearing strata,Saltu (S), Putaohua (P), and Gaotaizi (G). ,e target for-mation of B-1-D is SII-9. It is river delta sedimentation. ,emain component of the cement is kaolinite, followed byillite. ,e clay mineral composition of SASP and WASP isshown in Tables 4 and 5, respectively. ,ese data indicatedthat the clay content of these two test formation is quitesimilar, while the clay content of WASP is higher. And thegranularity size is smaller too. ,is is consistent with per-meability data shown in Table 1. Higher clay content maylead to high chemical adsorption in chemical EOR. Nev-ertheless, there is no criteria of clay content for ASP flooding.WASP B-2-X is located on the west side of the North Sartuanticline structure in Daqing Oilfield. ,e structure has arelatively gentle stratification angle of 1°–3°. Only one fault isdeveloped, and the breakpoint is mudstone, which has noeffect on the position of the reservoir. ,e reservoir
conditions of Daqing Oilfield can be found in references[78, 79]. Clay content of SASP is shown in Table 6. However,clay content data ofWASP are not available. High content ofkaolinite results in water sensitivity. Daqing Oilfield reser-voir is shown in Figure 4. In Figure 4, the largest red partcontains most reserves.,e well patterns for the two tests areshown in Figure 5.
3. Sedimentary Characteristics
A deep understanding of the reservoir is helpful to conduct afield test. ,e relative location of these two tests in Daqing isshown in Figure 6 [40]. ,ese two blocks are not far awayfrom each other. However, their geology may differ.According to the anatomical results of subdivided sedi-mentary facies, the SII1-9 layers in the test area are mainlydominated by delta facies deposits. ,e plane distribution iscomplex, and the channel sand body width is small. Het-erogeneity is obvious. ,e sand bodies with various depo-sition characteristics in the longitudinal direction of ASPflooding appear alternately and can be divided into 4 types ofdeposition, as shown in Table 7 [72]. Table 8 [72] shows thethickness and permeability of each layer in the strong alkalitest area.
WASP layer SII is developed with plain delta depositwith main reservoir sand body dominated with low bendingdistributary plain facies sand body. SII9 to SII13 + 14b aredivided into six deposition units, and the number of unitsand deposition characteristics are shown in Table 9 [74]. ,etarget layer SII10-12 sublayer thickness and permeabilitydistribution are shown in Table 10 [54].
It can be seen from these tables that the effective per-meability of SASP layers is much higher than that of WASP.But WASP has fewer layers, which are easier for polymerinjection. Previous studies indicated that variation coeffi-cient between 0.6 and 0.8 is best for polymer flooding. Andthese two blocks fall in this range. It is worth to note thatthese two blocks belong to different operators. Too manylayers in B-1-D make it more difficult to select injectionways, separate layer injection, or overall injection. In view ofsublayer number of these two blocks, it appears that B-2-X isrelatively better than B-1-X.
4. Fluid Comparison
Crude oil composition has an important effect on interfacialtension (IFT) [56, 60, 61, 82]. Research shows that thecontent of active materials of different components in crudeoil is different, and their contributions to the formation ofultralow IFTare different [83]. ,e crude oil is extracted intofour components of saturated hydrocarbons, aromatic hy-drocarbons, asphaltene, and pectin. ,e detailed process ofseparation can be found in the literature [83]. ,e ability ofthe crude oil composition to reduce the IFT in presence ofsurfactant ORS-41 and alkali NaOH ispectin> asphaltene> aromatic hydrocarbon> saturated hy-drocarbon, as shown in Figure 7 [83]. Some scholars believethat asphaltenes in heavy oil have a higher ability to reduceinterfacial tension than pectin for heavy oil [60]; this may be
4 Journal of Chemistry

Table 2: Reservoir classification [72].
Reservoirclassification Distribution Monosandbody
Basic reservoirs characteristicsEffective
thickness, H(m)
Permeability, K(mD) Scale
First-classlayer(FCL) PI group River sand
Flood plain facieschannel sand, highlycurved divertingchannel sand
≥4m ≥500Formation developed withlarge area, with a widthgreater than 1000m
Second-classlayer (SCL)
S group and PIIgroup River sand
Low-bend diversionchannel sand,
underwater dendriticchannel sand
H≥ 1.0m ≥100Formation developedconnected with a widthgreater than 200m
Nonriver sand H≥ 1.0m with oil layer assisted
,ird-classlayer (TCL)
S group, PIIgroup, and Gao
group
Nonriversand
,in layer for reserves H< 1.0m <100 Typically formation is sheetedbroken like, loose, small size,two-phase mixed staggered
distribution
Nonreserve layer(Biaowai layer) 0 0
(a) (b)
Figure 3: ,e polarized light micrograph of reservoir core [77]: (a) FCL; (b) SCL.
Table 3: Pore structure parameter of FCL and SCL in Daqing Oilfield [72]].
No. Sampleno.
,roatmercury
saturation (%)
Pore mercurysaturation (%)
Mean poreradius(μm)
Meanthroatradius(μm)
Mean pore-throat
radius ratio
Microhomogeneitycoefficient
Sortingcoefficient
Mainthroatradius
1 FCL 1 25.06 51.89 242.12 15.433 18.6 0.702 1.799 13.4632 FCL 2 28.44 56.6 195.77 10.907 21.3 0.545 2.216 19.856Average 26.75 54.245 218.945 13.17 19.95 0.6235 2.0075 16.65953 SCL 1 33.91 30.66 166.11 8.231 32.9 0.633 2.482 7.2614 SCL 2 28.11 35.15 168.85 9.327 34.4 0.717 3.127 9.1275 SCL 3 33.06 31.93 161.1 8.287 32.3 0.592 2.551 7.3316 SCL 4 48.96 28.12 129.48 8.155 35.7 0.627 2.861 7.403Average 36.0 31.5 156.4 8.5 33.8 0.6 2.8 7.8
Table 4: SASP granularity analysis data from checking wells.
Layers Big sand content (%) Fine sand content (%) Silt content (%) Clay content (%) Sorting coefficient Median size (mm)SII3-4 1.0 49.8 37.7 9.7 3.0 0.105SII7-8 21.1 49.0 21.3 8.6 3.6 0.161SII8-9 20.1 66.1 13.8 4.1 0.062SII8-9 5.2 48.9 35.3 9.0 3.3 0.117Average 9.1 42.0 40.1 10.3 3.5 0.111
Journal of Chemistry 5

related to the difference between different crude oils, es-pecially the definition of pectin and asphaltenes, and theseparation method.
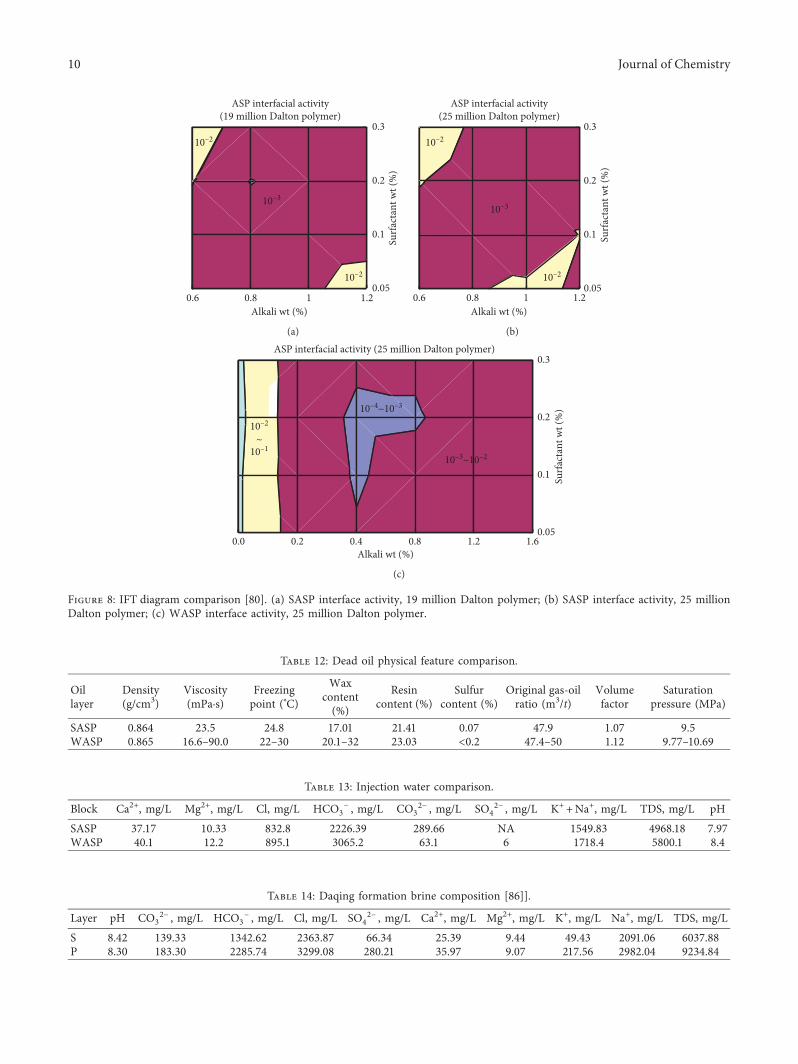
Deep understanding of this issue requires further study[60].,e crude oil composition of the two blocks is shown inTable 11 [84]. ,e content of pectin and asphaltene in B-2-Xis higher than that in B-1-D, which is beneficial for reducingthe interfacial tension. It is worth mentioning that the waxcontent in crude oil in S formation in Daqing is relativelyhigh. ,e wax content of the dead oil is 29.61%, and thefreezing point is 22.55°C. ,e total acid number (TAN) ofcrude oil in both test areas is very low, which makes itdifficult to select for surfactants. ,e TAN of Daqing oil wasso low that it was once believed impossible to employ ASPflooding according to preliminary screening report by someexperts. For Daqing crude oil, when alkali is not added, thesurfactant and crude oil cannot form ultralow IFT (10−3mN/m). After adding alkali, ultralow interfacial tension can beattained. Figure 8 [80] shows the ASP system interfaceactivity diagram for two field tests. ,e figure shows that theASP system can form ultralow IFT with crude oil at sur-factant concentration (0.3%) and alkali concentration(1.2%). ,e surfactants used in these two blocks were
produced locally in Daqing. SASP used heavy oil alkybenzoylsulfonate (HABS), while WASP used Daqing petroleumsulfonate (DPS), which was not as mature as the HABStechnology then. However, the performance of the surfac-tant fully meets the requirements of Daqing Oilfield. Moreinformation on surfactants and field tests in Daqing Oilfieldis given in our publication [85]. Table 12 shows the crude oilproperties of the two test areas. Table 13 [84] shows theinjected water composition of the tests, where producedwater was used to prepare polymers after simple treatment.,e content of calcium and magnesium ions in the injectedwater in WASP was slightly higher than that in SASP, butboth were relatively low. Table 14 [86] shows the compo-sition of the formation water in Daqing Oilfield, whichprovides valuable information when conducting ASP else-where.,ere aremany publications regarding chemical EORabout Daqing Oilfield, but the detailed information aboutbrine and oil is seldom provided.
5. Injection Scheme
In both tests were employed four slug design. During theimplementation of the plan, dynamic adjustments weremade according to the actual situation. ,e plan and theactual plan are different. Details are shown in Tables 15 and16. ,e implementation plan adopted the same technicalstandards and received review and technical guidance ofexperts from Daqing Oilfield and China National PetroleumCorporation (CNPC). ,e operators of the two test areas arefrom different oil production plants of Daqing Oilfield. Formore ideas on viscosity selection and fluidity control of theternary compound flooding in Daqing Oilfield, please referto the literature [25, 26, 33, 56, 57, 67, 68, 87–94]. ,e ASPformulas used in the two tests are as follows.
Tables 15 and 16 show that these two tests have verysimilar injection parameters. For instance, the surfactant (S)and alkali (A) concentration are the same. Designed fourslugs are the same. According to previous introduction,ultralow IFT is required for both ASP chemicals.WASP has aslight lower polymer concentration in ASP main slug andvice slug, while its preslug polymer concentration is a bithigher. Injection viscosity in SASP is a bit higher thanWASP. However, the largest difference between these twotests is alkali. Strong alkali NaOH is used in SASP, whileweak alkali Na2CO3 is used in WASP. ,e other big
Table 5: WASP granularity analysis data from checking wells.
Layer Average air permeability(μm2)
Fine sand content(%)
Silt content(%)
Clay content(%)
Sortingcoefficient
Median size(mm)
Reserved layer 0.365 38.6 47.6 13.8 3.0 0.088Unreservedlayer 0.023 10.3 66.9 22.8 4.2 0.049
Table 6: Clay minerals from one well in SASP.
Item Smectite (S) Illite (I) Kaolinite (K) Chlorite (C) Imon mixed layer (I/S)Content (%) 1.41 29.67 47.95 13.83 7.35
Daqing Oilfield
XinzhaoOilfield
Daqing city
Figure 4: Daqing Oilfield [78].
6 Journal of Chemistry
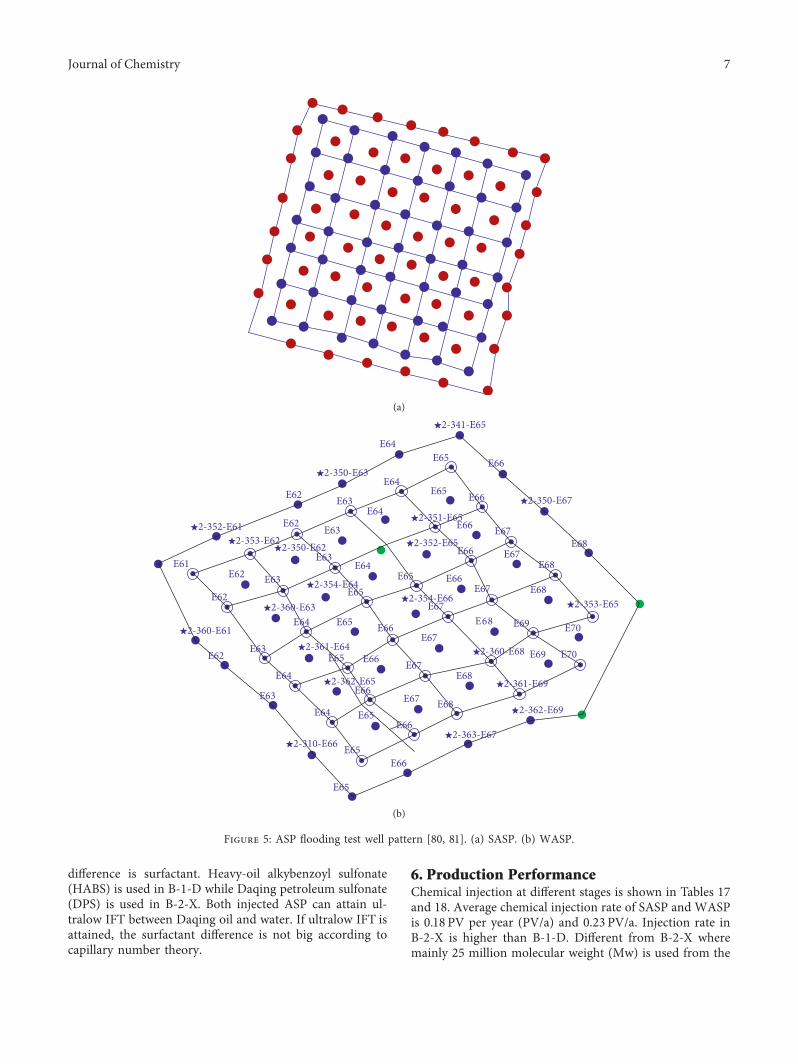
difference is surfactant. Heavy-oil alkybenzoyl sulfonate(HABS) is used in B-1-D while Daqing petroleum sulfonate(DPS) is used in B-2-X. Both injected ASP can attain ul-tralow IFT between Daqing oil and water. If ultralow IFT isattained, the surfactant difference is not big according tocapillary number theory.
6. Production PerformanceChemical injection at different stages is shown in Tables 17and 18. Average chemical injection rate of SASP and WASPis 0.18 PV per year (PV/a) and 0.23 PV/a. Injection rate inB-2-X is higher than B-1-D. Different from B-2-X wheremainly 25 million molecular weight (Mw) is used from the
(a)
E64E65 E66
★2-341-E65
★2-350-E67E66E65E64
E64
★2-350-E63
E63
E63
E62
E62
E63
E63E62
E62
E61
E62 E63
E64
E64
E65
E65E65
E66
E66
E66
E67
E67
E67E67
E67E66
E66 E67
E67E66
E66
E66
E63
E64
E64
E65
E65
E65
E65
E68
E68
E68
E68
E68
E68
E69
E69 E70
E70
★2-351-E65
★2-352-E65
★2-353-E65★2-354-E66★2-354-E64
★2-350-E62★2-353-E62★2-352-E61
★2-360-E61
★2-360-E63
★2-361-E64
★2-362-E65
★2-310-E66★2-363-E67
★2-362-E69
★2-361-E69
★2-360-E68
(b)
Figure 5: ASP flooding test well pattern [80, 81]. (a) SASP. (b) WASP.
Journal of Chemistry 7

B-2-X WASP35Inj./44Pro.
Start:0cto.2008
B-1-D SASP49Inj./63Pro.Start:July2008
Figure 6: B-1-D and B-2-X location in Daqing [40].
Table 7: B-1-D sediment unit [72].
No. Deposition type Sublayers Unit number1 Distributary plain sand body with low bending distributary SII21, SII22, SII81 32 Distributary plain facies direct distributary sand body SII7, SII82 23 Delta front facies with lump-like sand SII1, SII3, SII4, SII5+61, SII5+62 54 Leading edge dendritic transitional sand body in the delta SII9 1
In total 11
Table 8: SASP perforated layer thickness and permeability distribution [72].
Number SublayerAverage perforation
thickness(m) Perforated layer thickness ratio (%) Effective permeability(D)Sandstone Effective
1 SII1 0.03 0.02 0.3 0.1592 SII21 1 0.6 7.9 0.4663 SII22 1.2 0.8 10.7 0.5484 SII3 0.3 0.2 3.1 0.5155 SII4 1 0.6 8 0.4996 SII5 + 61 0.4 0.2 3.2 0.6297 SII5 + 62 0.2 0.1 1.2 0.4898 SII7 1.6 1.3 16.4 0.6639 SII81 2.7 2.2 28 0.76610 SII82 1.8 1 13.5 0.75411 SII9 0.8 0.6 7.7 0.769Sum 10.6 7.7 100 0.67
Table 9: B-2-X sediment unit [74].
Number Deposition type Number of units Sublayers1 Twig transitional delta deposition 1 SII92 Low-bend tributary plain facies delta deposition 3 SII10 + 11a, SII10 + 11b, SII123 Delta deposition with subtree front 1 SII13 + 14a4 Delta deposition with lump front 1 SII13 + 14b
8 Journal of Chemistry

beginning to the end, three different Mw (15, 19, and 25million Dalton) polymers are used in B-1-D. ,e slug vis-cosity of SASP in B-1-D increased correspondingly. How-ever, during ASP vice slug in B-1-D, the ASP slug viscositywas reduced from 72 cP to 48 cP. ,is was not scheduled.Since polymer viscoelasticity benefit to recovery was verypopular in China at that time, it is unusual to reduce vis-cosity unless they have to. ,is is actually due to someinjectivity problems as well as too much production abilityreduction. ,is will be discussed later. ,e most significantdifference between implementation is reference waterflooding (RW) injection. In B-1-D, 0.095 PV water slug isinjected. However, 0.7236 PV water slug was injected in B-2-X. ,is has very significant influence on the incremental oilrecovery factor (IORF). Water cut after reference waterflooding of SASP and WASP was 95.2% and 98.7%, re-spectively [81]. ,e water cut difference is actually very largeaccording to actual oil production practice in Daqing sincethese are large-scale blocks. Since water cut in B-2-X is muchhigher than B-1-D before chemical flooding started, onlywhen IORF of SASP is much higher than WASP, and SASPcan be regarded better than WASP in terms of IORF. ,iswill be discussed more later. Table 19 shows average wellproduction in these two blocks. It is obvious that average
well production rate of WASP is lower than SASP but theincrease is larger.
6.1. InjectionPressure. ,e average injection pressure duringdifferent stages of the two blocks is shown in Figure 9. At theend of the reference water flooding, the average single welldaily injection volume in B-1-D is 57m3, and the averageinjection pressure and formation pressure are 7.96MPa and5.92MPa, respectively [80, 81]. When RW finished, thesingle well daily average injection volume in B-2-X is 42m3,the average single well injection pressure is 4.92MPa, andthe formation pressure is 7.55MPa.,is indicated that waterinjectivity ability of B-2-X is smaller than B-1-D. At the endof RW, the injection pressure of B-1-D is lower than B-2-X,which may be related to the average permeability. Perme-ability especially the average effective permeability of themain water-absorbing layer (SII7, SII81, SII82) of B-1-D is0.7 μm2, which is significantly higher than that of B-2-X. Inaddition, water flooding injection pressure is also related towater cut, but the effect of permeability on the difference ininjection pressure is greater than the effect of water cut. Inchemical flooding stage (polymer and ASP injection), theformation pressure increased due to the increased viscosity
Table 10: B-2-X perforation thickness and permeability distribution [74].
No. SublayerAverage perforation thickness (m) Effective permeability (D)
Sandstone Effective1 SII10 + 11a 2.47 1.92 0.4232 SII10 + 11b 2.49 2.08 0.5043 SII12 2.70 2.29 0.570
In total 7.66 6.29 0.503
1
0.6 0.8 1.0 1.2 1.4 1.6
10–1
10–2
10–3
10–4
IFT
(mN
·m–1
)
ResinsAsphaltenes
AromaticsSaturates
NaOH concentration (%)
Figure 7: IFT affected by different oil groups [83].
Table 11: Oil composition comparison [84].
Block Total hydrocarbons Saturatedhydrocarbon
Aromatichydrocarbon Pectin Asphaltene Pectin + asphaltene TAN, mgKOH/g
SASP 81.83 69.12 12.71 13.16 5.01 18.17 0.031WASP 76.97 64.84 12.13 16.39 6.64 23.03 0.034
Journal of Chemistry 9
0.6 0.8 1 1.20.05
0.1
0.2
0.3
ASP interfacial activity(19 million Dalton polymer)
Alkali wt (%)
Surfa
ctan
t wt (
%)
10–2
10–2
10–3
(a)
ASP interfacial activity(25 million Dalton polymer)
Surfa
ctan
t wt (
%)
10-2
0.6 0.8 1 1.20.05
0.1
0.2
0.3
Alkali wt (%)
10–2
10–2
10–3
(b)
Surfa
ctan
t wt (
%)
ASP interfacial activity (25 million Dalton polymer)
Alkali wt (%)
10–2
~10–1
10–4~10–3
0.0 0.2 0.4 0.8 1.2 1.60.05
0.1
0.2
0.3
10–3~10–2
(c)
Figure 8: IFT diagram comparison [80]. (a) SASP interface activity, 19 million Dalton polymer; (b) SASP interface activity, 25 millionDalton polymer; (c) WASP interface activity, 25 million Dalton polymer.
Table 12: Dead oil physical feature comparison.
Oillayer
Density(g/cm3)
Viscosity(mPa·s)
Freezingpoint (°C)
Waxcontent(%)
Resincontent (%)
Sulfurcontent (%)
Original gas-oilratio (m3/t)
Volumefactor
Saturationpressure (MPa)
SASP 0.864 23.5 24.8 17.01 21.41 0.07 47.9 1.07 9.5WASP 0.865 16.6–90.0 22–30 20.1–32 23.03 <0.2 47.4–50 1.12 9.77–10.69
Table 13: Injection water comparison.
Block Ca2+, mg/L Mg2+, mg/L Cl, mg/L HCO3− , mg/L CO3
2− , mg/L SO42− , mg/L K+ +Na+, mg/L TDS, mg/L pH
SASP 37.17 10.33 832.8 2226.39 289.66 NA 1549.83 4968.18 7.97WASP 40.1 12.2 895.1 3065.2 63.1 6 1718.4 5800.1 8.4
Table 14: Daqing formation brine composition [86]].
Layer pH CO32− , mg/L HCO3
− , mg/L Cl, mg/L SO42− , mg/L Ca2+, mg/L Mg2+, mg/L K+, mg/L Na+, mg/L TDS, mg/L
S 8.42 139.33 1342.62 2363.87 66.34 25.39 9.44 49.43 2091.06 6037.88P 8.30 183.30 2285.74 3299.08 280.21 35.97 9.07 217.56 2982.04 9234.84
10 Journal of Chemistry

and the adsorption and retention of the injected polymermolecules in the formation. In the stage of chemicalflooding, the average pressure in B-1-D is significantlyhigher than that in B-2-X, as shown in Figure 9. However,injection pressure in vice polymer injection is not muchhigher than that of main ASP slug. Note that 25 millionDalton polymer is injected in B-2-X while 15, 19, and 25million Dalton polymer is injected in B-1-D. Four reasonsare accounted for this. First, injection pressure increased toomuch in main ASP slug compared with prepolymer stagedue to increased polymer viscosity. Second, during vice ASPslug, the injection viscosity of slug is reduced due toinjectivity and fluid production ability loss. More impor-tantly, many fracturing measures have been taken during
ASP injection stage to improve performance. Finally, scalingdue to alkali may account for too much pressure increaseduring main ASP stage.
Compared with the reference water flooding, the max-imum pressure increase in SASP and WASP was 109% and82%, respectively, and the increase in the SASP was higher.Since the injection pressure is too high and the fluid pro-duction declined greatly, fracturing measures are adopted inASP flooding tests. A total of 61 fracturing times and wellsfor producers were conducted in B-1-D, and the fracturingwell ratio accounted for 96.8% of the total production wells.For central well area, 40 wells/times were fractured forproducers, and the fracturing ratio reached 111% [80, 81]. InB-2-X, wells were fractured 19 wells/times, and the frac-turing ratio of the production wells was 43.2%. ,e numberand proportion of fracturing wells in the B-2-X were sig-nificantly lower than that in B-1-D. ,e difference infracturing ratios also proves that SASP is less injectable thanWASP. Fracturing adds significant labor amount and costs.,e average permeability in B-1-D is higher than that of B-2-
Table 15: Designed ASP scheme.
Test Pre-slug concentration(mg/L) 0.0375 PV
ASP main slug ASP vice slugPost P slug concentration
(mg/L) 0.2 PVInjection rate
(PV/a)Predicted IORF
(%OOIP)0.3 PV 0.15 PV
A S P A S P(%) (%) (mg/L) (%) (%) (mg/L)
SASP 1300 1.2 0.3 2000 1 0.1 1800 1000 0.2 21.7WASP 1350 1.6 0.3 1800 1.4 0.1 1800 1350 0.2 22.2
Table 16: Actual injection scheme.
Preslug ASP main slug ASP vice slug PostslugSize P Size A S P Size A S P Size P(PV) (mg/L) (PV) (%) (%) (mg/L) PV (%) (%) (mg/L) (PV) (mg/L)
SASP 0.054 1300 0.351 1.2 0.3 2000 0.285 1 0.8 0.2 0.1 2000 0.233 1500WASP 0.0801 1350 0.4284 (0.3501) 1.2 0.3 1750 1980 0.2203 1.0 0.1 1940 1980 0.25 1500
Table 17: SASP time table.
Stage Time Polymer Mw (million Dalton) Well head viscosity (cP) Slug size (PV)RW 12.2005–06.2006 — — 0.095Prepolymer 07.2006–10.2006 15 30 0.054ASP main 11.2006–06.2007 15 31 0.108ASP main 07.2007–12.2007 19 65 0.084ASP main 01.2008–12.2008 25 77 0.159ASP vice 01.2009–04.2010 25 72–48 0.285Postpolymer 05.2010–12.2011 25 52–63 0.233
Table 18: WASP time table.
Stage Time Polymer Mw (Million Dalton) Well head viscosity (cP) Slug size (PV)RW 11.2005–10.2008 — — 0.7236Prepolymer 10.2008–03.2009 25 22 0.0801ASP main 03.2009–05.2011 25 58 0.4284ASP vice 05.2011–03.2012 25 60 0.2203Postpolymer 03.2012–04.2013 25 69 0.2384
Table 19: Average well production comparison.
Block Water Prepolymer ASP main ASP vice PostpolymerSASP 2.3 2.7 9 5.5 4.4WASP 1 0.75 8.86 5.68 4.11
Journal of Chemistry 11

X, but the injection rate is lower, and the average injectionviscosity of main ASP slug in B-1-D is lower than that of B-2-X. Both have the same well pattern spacing, and scaling is apossible reason for the poor injection capacity. ,e polymerflooding and ASP flooding field tests under similar condi-tions in Daqing showed that before the main plug of the ASPflooding, the water absorption index is similar to that of thepolymer flooding, sometimes even slightly higher, but theinjection pressure after the ASP flooding significantly in-creases. Scaling and emulsification caused by alkaliaccounted for this. ,e injection pressure increase degree inSASP field tests was much higher than that in WASP[80–82, 84]. Sealed coring analysis confirmed the formationof scale [95]. Laboratory experiments have also confirmedthat the stronger emulsifying ability of strong alkali com-pared to weak alkali will also increase the injection pressure[56]. Two wells (27.7m apart) were drilled and cored beforeand after one ASP flooding test in Daqing Oilfield. Afterinjection of ASP, the cores’ porosity and permeability de-creased by 4.9% and 49.6%, respectively, andmedian particlesize decreased from 0.141mm to 0.103mm [96]. Otherlaboratory experiments [51, 52, 55, 65, 97] have also con-firmed the harmful effects of alkali on the reservoir, and thestrong alkali has a greater harmful effect.
6.1.1. IORF. IORFs of these two tests are shown in Figure 10.As of October 2015, the injection of the chemical system hasbeen completed in both test areas. B-1-D was cumulativelyinjected a chemical system of 0.937 PV, and IORF uponwater flooding is 30% OOIP. B-2-X was cumulatively in-jected a chemical system of 0.910PV, and the IORF is 29.4%OOIP [98]. ,e total recovery of B-1-D and B-2-X is 66.88%OOIP and 75.04% OOIP, respectively. Since the subsequentwater flooding in both B-2-X is still underway, the ultimateIORF ofWASP is expected to exceed SASP. Considering thatthe injection timing of the two tests is different, the com-prehensive water cut of whole test area at the end of the RWin B-1-D and B-2-X is 96.7% and 98.45%, and the water cutin central well area is 95.2% and 98.8% OOIP, respectively
[99]. Before chemical injection, the recovery of SASP andWASP was 36.88% and 45.64 OOIP%, respectively [99].
A recovery difference of 8.76%OOIP between B-1-D andB-2-X is really great.,e remaining oil or residual oil in B-2-X is more scatted, as verified by coring data analysis in B-2-X[80], and it is thus more difficult to enhance oil recovery inB-2-X. Statistics of 12 ASP flooding field tests completed inDaqing Oilfield, combined with laboratory experiments andnumerical simulations, show that the sooner the ASP isinjected in high water cut stage, the better the effect [98]. Inother words, since the water cut of SASP before the injectionof the chemical is lower than that of WASP, IORF of SASPshould have been much higher. Studies have shown thateven if the comprehensive water cut is 0.5% different, forinstance, 100% and 99.5%, the displacement efficiency willbe significantly different [100]. In respect of water cut dif-ference and initial oil recovery, it can be considered thatSASP and WASP have the same IORF, or even WASP IORFis higher.
6.2. High IORF Explanations. Full understanding of thereservoir geology is the foundation of possible high oilrecovery. ,is is why we compared the two tests’ geologicalinformation so much, which is quite different from otherEOR publications. Geological characteristics and reservoirphysical properties have a great impact on recovery andIORF. In this respect, we have previously compared thegeological conditions of the two field tests in detail. Fromthe geological situation, it can be seen that the depositionconditions and reservoir physical properties in B-1-D aresignificantly better than those in B-2-X, which are char-acterized by larger effective thickness, higher permeability,and good reservoir development. Daqing Oilfield testsurveys show [95] that the greater the effective thickness ofthe formation, the better the development effect of the ASP.,e polymer flooding in Daqing, which is currently theworld’s largest commercial polymer flooding block, hasproven in practice that polymer connectivity factor orpolymer controlling degree affects the polymer floodingeffect [101]. Higher polymer flooding connectivity factormakes better IORF performance. Compared with the B-1-D, one advantage of B-2-X is that the polymer flooding
0
2
4
6
8
10
12
SASP WASP
Inje
ctio
n pr
essu
re (M
Pa)
WaterPre-PMain ASP
Vice ASPPost-P
Figure 9: Injection pressure in different stages [41].
0
5
10
15
20
25
30
SASP WASP
Incr
emen
tal o
il re
cove
ry (%
OO
IP)
Figure 10: Incremental oil recovery factor.
12 Journal of Chemistry

control degree (90.02%) is a bit higher than that of B-1-D(86.7%). However, according to the relationship betweenthe polymer flooding control degree and IORF [101], whenpolymer flooding control degree is greater than 80%,further increase in polymer flooding control degree hasmarginal effect on IORF. It can be considered that thedifference in the polymer flooding control degree in twotests may have a limited impact on the range of IORF.However, it is important to note that many ASP floodingcore flooding tests completed under Daqing Oilfield con-dition have shown that SASP IORF is greater than that ofWASP [56]. In addition, the divalent ion content is very lowin Daqing formation water (less than 50 pp). ,us, SASPflooding has been given more attention in the early time inDaqing [25, 26, 33, 67, 88, 91, 92, 94]. ,e number of SASPflooding field tests is three times that of the weak alkali testarea. Another main reason is that the production tech-nology of low-cost surfactant for weak ASP flooding hasnot been mastered.
7. Laboratory Study Limitations
Compared with the WASP, due to the higher pH value, thestrong alkali (NaOH) has stronger emulsifying ability whichforms more stable emulsion, and the IFT is lower [61, 97].Furthermore, the ability of NaOH to change wettability isalso more prominent [24].,is makes NaOH perform betterin laboratory evaluation and flooding experiments. With theprogress of research, especially the better understanding ofthe mechanism of emulsification (moderate emulsification)and the formation of ultralow IFT of low-acid-based par-affin-based Daqing crude oil (average molecular equivalentsand different effects of different components) [35] and scaleand formation damage [80, 102–104], the researchers re-alized that although NaOH’s fast interaction with crude oilcan reduce the IFT, long-term effects of Na2CO3 interactionwith crude oil will also form ultralow IFT.More importantly,Na2CO3 reduces the adsorption of surfactants and decreasesthe degree of polymer hydrolysis which helps to reduce theadsorption in the formation. ,e damage to the formationby Na2CO3 is not as large as that of NaOH. In the coreflooding tests in laboratory, the core’s clay minerals are smalldue to the small scale. In addition, many synthetic cores usedin China are different from real core in clay content, and it isdifficult to effectively simulate the adverse effect of scaling onthe displacement effect. ,e scale of laboratory experimentsis too small to reflect the influence of clay minerals onscaling, and thus there are significant limitations in usingcores to guide field applications [51, 52, 55]. ,e success ofB-2-X is far beyond researchers’ expectations [25]. ,e otherWASP test in B-3-X was also so technically and economi-cally successful that it makes people to think whether SASP isreally better than WASP.
8. Key Observations
More importantly, IORF of SASP in B-1-D is higher than allthe other completed SASP in Daqing Oilfield. ,is isprobably due to the high content of CO2 in B-1-D formation
water, which makes the injected strong alkali NaOHtransform into weak alkali Na2CO3. After ASP was injectedinto B-1-D, the concentration of carbonate (CO3
2− ) andbicarbonate (HCO3
− ) in production wells continued to rise,and the content of CO2 in natural gas produced in this testarea keeps dropping [80]. Different from other SASP fieldtests, no hydroxide (OH−) appeared in the production wells,which explained lack of alkali data in the production fluid[41]. Figure 11 [80] shows the CO2 content in the producedgas from three production wells and one inspection well inB-1-D. Figure 12 [80] shows the change of CO3
2− andHCO3
- in the produced liquid in B-1-D, where the hori-zontal axis denotes time. 0607 represents “July 2006.” ,isfigure shows that after the ASP injection, CO2 in the for-mation is continuously consumed, and as the ASP sluginjection ceases, CO2 is continuously generated.,e cause ofCO2 generation remains unclear and may be related to theformation pressure decrease. ,e effect of CO2 makes someor most strong alkali become weak alkali, thereby slowingdown the scaling, which is reflected in the scaling ratio andscale-like composition changes. Proportion of silica scale inB-1-D is much lower than that of L-B-D and N-5 ASPflooding tests in Daqing which also employed NaOH asalkali [95]. ,is CO2 production and ion production ob-servations provide key evidences to account for highest EORperformance in B-1-D. ,is also makes it possible to useNaOH as alkali for ASP flooding in CO2-rich reservoirs.
9. Water Cut
In the field test, the characteristics of water cut change aremainly affected by reservoir heterogeneity, injection-pro-duction well spacing, initial water cut, remaining oil, in-jection parameters, measures, and dynamic g adjustments[95]. Interwell connectivity also has a greater impact onwater cuts [101]. Among these complex factors, the rela-tionship between water cut change and initial water cut is theeasiest to verify and correlate. A comparison of water cutbefore and after chemical injection in central well area isshown in Figure 13. ,is figure shows that average water cutdrop in B-1-D is much larger than WASP. However, theinitial water cut in B-1-D is also much lower than B-2-Xfrom actual production consideration. Minimum water cutin B-1-D is much lower than B-2-X, which indicated betterproduction performance. Strong emulsification at leastpartly accounted for this. It is interesting that the water cutdrop between two tests differs so much while IORF does not.,e other key parameter about water cut is low water cutduration time. Low water cut duration time of SASP andWASP is 28 months and 25 months, respectively [60, 61].SASP has a bit longer low water cut duration time. Con-sidering its much more fracturing measures [52–55] duringASP flooding stage, this longer time cannot be regarded asevidence of SASP superiority. Field data [52–55] about thesetwo tests indicated that higher oil saturation in B-1-D makesit quick to get possible response. Laboratory study verifiedthat more emulsification and higher emulsion viscosity isseen where the initial water cut is lower and remaining oilsaturation is higher for chemical flooding [98].
Journal of Chemistry 13

Emulsification contributes to EOR [24, 82] and contributionof emulsification to IORF is even as high as 30% [35]. SASPin B-1-D took effect earlier than WASP. ,is is probablycaused by fast interaction of NaOH with oil as well as rockwhich leads to emulsification. Emulsification mechanism inASP flooding as well as chemical flooding is the verymechanism to be further investigated.
10. Injection-Production Ability
Injection capacity and liquid production capacity reflectreservoir energy supplement ease. Generally, the injectivityindex is used to characterize water absorption capacity andinjectivity. However, since it is time-consuming and labor-intensive to get water injectivity index, the apparent waterinjectivity index is commonly used in China [93, 101].Compared with the water absorption index, the apparentwater absorption index test is relatively simple. Figure 13compared apparent water injectivity index drop in twoblocks. ,e maximum apparent injectivity index drop inB-2-X and B-1-D was 23.1% and 59.0%, respectively. ,edecrease of the apparent injectivity index in B-2-X was lowerthan that of B-1-D, indicating that the weak alkali systeminjectivity was better than the strong alkali one. Figures 14and 15 [40] shows the liquid production index drop in twoblocks. Compared with water flooding, the SASP andWASPproduction fluid indexes decreased by 31.3% and 54.5%,respectively, indicating B-2-X production loss is much lessthan that in B-1-D. However, compared with other strongASP field test areas where fluid production index decreasedby 68%–85% [41], B-1-D had the smallest decrease inproduction fluid index. Due to the high CO2 content information, some NaOH were converted to Na2CO3, whichexplains why after the injection of alkali into B-1-D, nohydroxide ion (OH-) was detected in the produced liquid
0
1
2
3
4
5
6
7
8
200701 200703 200705 200707 200708 200710 200712 200802 200804 200806
CO2 c
onte
nt (%
)
Time
Producer1Producer3
Producer2Inspection well
Figure 11: CO2 content in natural gas from B-1-D oil producers [80].
0
2
4
6
8
10
12
0
1000
2000
3000
4000
5000
0607 0701 0708 0802 0807 0901 0907 1001
PH v
alue
Carb
onat
e/bi
carb
onat
e (m
g·L)
Time (year-month)
CarbonateBicarbonatePH
Figure 12: SASP produced fluid ion concentration [80].
50
60
70
80
90
100
SASP WASP
Water cut beforeWater cut after
Figure 13: Water cut comparison.
14 Journal of Chemistry
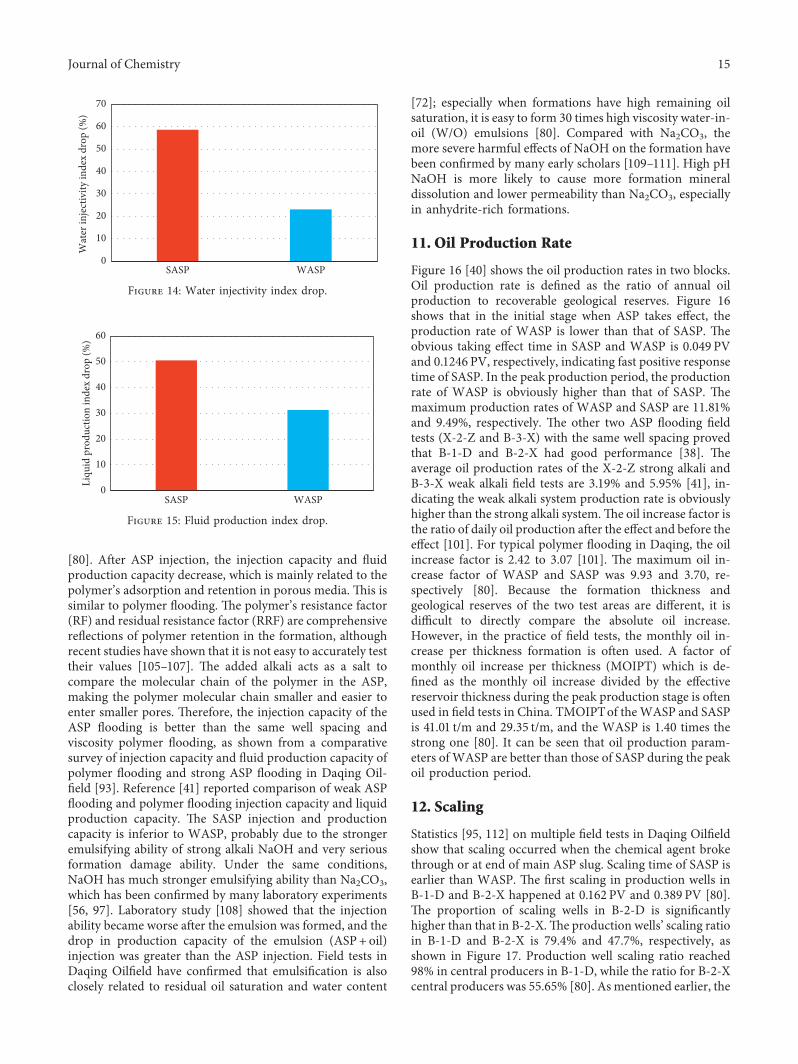
[80]. After ASP injection, the injection capacity and fluidproduction capacity decrease, which is mainly related to thepolymer’s adsorption and retention in porous media. ,is issimilar to polymer flooding. ,e polymer’s resistance factor(RF) and residual resistance factor (RRF) are comprehensivereflections of polymer retention in the formation, althoughrecent studies have shown that it is not easy to accurately testtheir values [105–107]. ,e added alkali acts as a salt tocompare the molecular chain of the polymer in the ASP,making the polymer molecular chain smaller and easier toenter smaller pores. ,erefore, the injection capacity of theASP flooding is better than the same well spacing andviscosity polymer flooding, as shown from a comparativesurvey of injection capacity and fluid production capacity ofpolymer flooding and strong ASP flooding in Daqing Oil-field [93]. Reference [41] reported comparison of weak ASPflooding and polymer flooding injection capacity and liquidproduction capacity. ,e SASP injection and productioncapacity is inferior to WASP, probably due to the strongeremulsifying ability of strong alkali NaOH and very seriousformation damage ability. Under the same conditions,NaOH has much stronger emulsifying ability than Na2CO3,which has been confirmed by many laboratory experiments[56, 97]. Laboratory study [108] showed that the injectionability became worse after the emulsion was formed, and thedrop in production capacity of the emulsion (ASP + oil)injection was greater than the ASP injection. Field tests inDaqing Oilfield have confirmed that emulsification is alsoclosely related to residual oil saturation and water content
[72]; especially when formations have high remaining oilsaturation, it is easy to form 30 times high viscosity water-in-oil (W/O) emulsions [80]. Compared with Na2CO3, themore severe harmful effects of NaOH on the formation havebeen confirmed by many early scholars [109–111]. High pHNaOH is more likely to cause more formation mineraldissolution and lower permeability than Na2CO3, especiallyin anhydrite-rich formations.
11. Oil Production Rate
Figure 16 [40] shows the oil production rates in two blocks.Oil production rate is defined as the ratio of annual oilproduction to recoverable geological reserves. Figure 16shows that in the initial stage when ASP takes effect, theproduction rate of WASP is lower than that of SASP. ,eobvious taking effect time in SASP and WASP is 0.049 PVand 0.1246 PV, respectively, indicating fast positive responsetime of SASP. In the peak production period, the productionrate of WASP is obviously higher than that of SASP. ,emaximum production rates of WASP and SASP are 11.81%and 9.49%, respectively. ,e other two ASP flooding fieldtests (X-2-Z and B-3-X) with the same well spacing provedthat B-1-D and B-2-X had good performance [38]. ,eaverage oil production rates of the X-2-Z strong alkali andB-3-X weak alkali field tests are 3.19% and 5.95% [41], in-dicating the weak alkali system production rate is obviouslyhigher than the strong alkali system.,e oil increase factor isthe ratio of daily oil production after the effect and before theeffect [101]. For typical polymer flooding in Daqing, the oilincrease factor is 2.42 to 3.07 [101]. ,e maximum oil in-crease factor of WASP and SASP was 9.93 and 3.70, re-spectively [80]. Because the formation thickness andgeological reserves of the two test areas are different, it isdifficult to directly compare the absolute oil increase.However, in the practice of field tests, the monthly oil in-crease per thickness formation is often used. A factor ofmonthly oil increase per thickness (MOIPT) which is de-fined as the monthly oil increase divided by the effectivereservoir thickness during the peak production stage is oftenused in field tests in China. TMOIPTof theWASP and SASPis 41.01 t/m and 29.35 t/m, and the WASP is 1.40 times thestrong one [80]. It can be seen that oil production param-eters of WASP are better than those of SASP during the peakoil production period.
12. Scaling
Statistics [95, 112] on multiple field tests in Daqing Oilfieldshow that scaling occurred when the chemical agent brokethrough or at end of main ASP slug. Scaling time of SASP isearlier than WASP. ,e first scaling in production wells inB-1-D and B-2-X happened at 0.162 PV and 0.389 PV [80].,e proportion of scaling wells in B-2-D is significantlyhigher than that in B-2-X.,e production wells’ scaling ratioin B-1-D and B-2-X is 79.4% and 47.7%, respectively, asshown in Figure 17. Production well scaling ratio reached98% in central producers in B-1-D, while the ratio for B-2-Xcentral producers was 55.65% [80]. As mentioned earlier, the
0
10
20
30
40
50
60
70
SASP WASP
Wat
er in
ject
ivity
inde
x dr
op (%
)
Figure 14: Water injectivity index drop.
0
10
20
30
40
50
60
SASP WASP
Liqu
id p
rodu
ctio
n in
dex
drop
(%)
Figure 15: Fluid production index drop.
Journal of Chemistry 15

high CO2 content in the strong alkali test area (B-1-D)makesthe injected strong alkali change to weak alkali, which re-duces the degree of scaling to a certain extent. ,is is wellreflected in the fact that the type of scale and the proportionof scaling wells in B-1-D are lower than other strong ASPflooding field tests. ,e scaling ratio of production wells inthe N-5 ASP flooding in Daqing is significantly higher thanthat in B-1-D. ,e type of scale in B-2-X is always carbonatescale, and the proportion of silica scale is very low. Generally,in the early stage of strong ASP flooding, loose carbonatescale formed. In the later stage of scaling, mixed scale ofcarbonate scale and silica scale formed. In the later stage ofscaling, a dense and hard silica scale is found [113, 114].However, unlike other strong ASP tests characterized byearly scale type of calcium carbonate scale and the middleand late stages of silica scale, B-1-D is mainly dominated bycarbonate scale from the early stage to the late stage[72, 75, 80, 81]. Carbonate scale is always higher than silicascale. ,e content of calcium carbonate and silica scale is76.9% and 3.48% during the initial stage of scale formation.Mixed scale formed in the middle scaling stage, with car-bonate scale reducing to 49.42% and silica scale increasing to18.08%. Mixed scale is found in the later scaling stage, andcarbonate scale decreased to 41.29% and the silica scaleincreased to 35.11% [80]. However, in other strong ASP testblocks, the proportion of silica scale in the late stage of N-5and B-1-X was as high as 60% and 67.7%, respectively.
Another 120-meter strong ASP test L-B-D scale behavedquite different from B-1-D [95]. In the initial scaling stage,carbonate scale ratio was 70% and silicon scaling was around10%. In the middle stage of scaling, the content of carbonateand silicate scale is about 40% and 50%. In scaling peak stage,the content of carbonate scale is about 10%, while thecontent of silicate scale is about 70%. According to the fieldtest experience of Daqing Oilfield, the smaller the wellspacing, the lighter the scaling. ,us, scaling in B-1-D ismuch severe than B-2-X but less severe than other strongASP flooding field tests. It is worth to note that smaller wellspacing helps to reduce scaling content [115, 116].
13. Chromatographic Separation
During the ASP migration process, due to effects of com-petitive adsorption, ion exchange, and retention loss, thechromatographic separation of polymers, alkalis, and sur-factants will occur. Chromatographic separation is regardedto have negative effect on oil recovery. ,e time of eachcomponent to reach the production wells is different. ,erelative output ratio to injected chemical concentration isalso different [95]. Laboratory tests have shown that theadsorption loss of the surfactant is the largest, the polymer isthe smallest, and the alkali is between them. ,e break-through order of the three chemical agents is polymer first,alkali second, and surfactant last [117]. ,e order in whichthe components appear in the field test is basically the sameas the order in which the components appear in the labo-ratory. Although the chromatographic separation in the fieldtest is not as severe as in the laboratory [117], the field testalso confirmed that the adsorption of surfactants is related tothe clay content. Compared with the strong base ternarycomplex flooding, the weak base ternary complex floodinghas a weaker chromatographic separation [41], which showsthat the polymer-alkali interval and the alkali-surfactantinterval are smaller. In addition, the chemical agentbreakthrough time interval in these two test areas is smallerthan that in other early strong alkali field tests [113]. Studies[95, 118]also show that the relative recovery of chemicalagents (polymer 0.67, surfactant 0.058) during the peakperiod of the B-1-D ASP flooding is higher than that of theother three strong alkali test zones (L-B-D, N-5, and X-2)and may be related to the higher content of CO2 in this testblock. It should be noted that OH− was not detected in theproduction liquid of B-1-D. ,e chromatographic separa-tion of the ASP flooding is very complicated. It not onlyinvolves the interaction between various components butalso the interaction between various components and clayminerals, which requires in-depth research.
14. Economic Performance
,e economic issues of ASP flooding have always attractedmuch attention. One important reason is that ASP com-pound flooding significantly increases costs compared topolymer flooding.,erefore, it is not appropriate to evaluatethe ASP flooding solely from the oil production increase orIORF, especially in a low oil price era, and thus the
14
12
10
8
6
4
2
00 0.1 0.2 0.3 0.4 0.5 0.6 0.7 0.8 0.9
Injection volume (PV)
Oil
prod
uctio
n ra
te (%
)
SASPWASP
Figure 16: Oil production rate [40].
0
20
40
60
80
100
SASP WASP
Scal
ing
wel
l rat
io (%
)
Figure 17: Scaling well ratio comparison.
16 Journal of Chemistry

relationship between cost and benefit is more important.,ethree factors that determine ASP flooding economic benefitsare cost, crude oil price, and incremental oil productionwhich is related to IORF, but the only controllable factors arecost and incremental oil production. Several successful casescompleted in Daqing show that the cost of ASP flooding canbe controlled at US 24–35$/bbl [35]. Even under low oilprice conditions, ASP flooding can be profitable. Generallyspeaking, before the field tests, the economic benefit eval-uation is carried out based on the numerical simulationpredicted oil recovery factor and oil production. ,ecommonly used indicators in the economic benefit evalu-ation are the input-output ratio (IR), return on investment(ROF), and financial internal rates of return (FIRR) after tax.Because the accuracy of numerical simulation is affected by avariety of factors, especially uncontrollable risks, coupledwith the operator’s technical and management level limi-tations, the prior economic benefit evaluation is only ap-plicable to the case to case study. Based on the actual crudeoil sales price and the field test input, the economic benefitindicators of the two tests are compared in Table 20 [20].,eFIRR of SASP and WASP is 18.0% and 22.3%, which aremuch higher than the local oil industry’s benchmark value of12%. ,e economic benefit evaluation reflected that theeconomic benefit indicators of WASP in B-2-X are betterthan that of B-1-D, although the incremental oil productionin the SASP is more than that of WASP. ,e cost analysis ofthe two tests shows that the comprehensive cost of WASP inB-2-X is lower than that of SASP in B-1-D. More costcomparison is given in reference [119]. It is worth men-tioning that even oil price was low in the past three years,latest information indicated that ASP flooding in Daqing ishigher than 4 million tons [84].
15. Conclusions
(1) From geological and petrophysical comparison ofSASP in B-1-D and WASP in B-2-X, it is believedthat reservoir conditions in B-1-D are better thanB-2-X, which is characterized by higher perme-ability, larger formation thickness, and better de-position condition. ,ere are more layers in B-1-Dthan B-2-X, which is less beneficial to waterflooding but may be more suitable to employ ASPflooding. Some uncertainties exist regarding geol-ogy. Both ASP flooding tests are conducted in SCLwhich is defined different from both geology anddevelopment aspects.
(2) Parameters of reservoir temperature, oil viscosity,and formation brine salinity in B-1-D and B-2-X areso similar that they can be regarded as the samefrom EOR perspective. Asphaltene and resin con-tent in B-2-X block is a bit higher than that in B-1-
D. ,e average formation permeability of B-2-X islower than B-1-D, and this is evidenced by high claycontent which is more likely to lead to chemicaladsorption.
(3) Both ASP flooding field tests have the same wellpattern and well spacing. Central well area hasthe same well configuration. Chemical injectionschemes in these two blocks are quite similar.Polymer concentration of SASP is slightly higherthan that in WASP but with smaller polymermolecular weight in some chemical floodingstages. Both injected ASP can meet the ultralowoil-water IFT requirement. Ultralow IFT regionof SASP is larger than that of WASP. ,e sur-factant HABS used in SASP is a bit more maturethan the surfactant DPS used in WASP. Polymercontrol degree in B-2-X is slightly higher thanthat in B-1-D.
(4) ,ese two large-scale ASP flooding field tests inDaqing indicated that ASP flooding can get a IORFof 30% OOIP. Considering the global reservoirs’average recovery is 33% OOIP, this is greatachievement. ,e IORF in these two blocks ishigher (10% OOIP) than other ASP flooding tests inDaqing. ,ese two tests conducted in similar res-ervoir conditions convinced that WASP can havethe same and even higher IORF than SASP, which isdifferent from previous conclusion. Since the res-ervoir condition (geology, permeability, andremaining oil saturation) of SASP is better thanWASP, the IORF in B-1-D should have been higherthan that in B-2-X. In addition, this strong ASPflooding has displayed some characteristics of weakASP flooding, which partly accounts for its higherIORF than other strong ASP flooding tests.
(5) Before chemical slugs are injected, comprehensivewater cut in central well area in B-1-D and B-2-Dwas 95.2% and 98.7%, respectively. ,is 3% watercut difference is very large from EOR perspective.Compared with WASP, water cut drop in SASP islarger and responding time is earlier, which may becaused by faster interaction of strong alkali overweak alkali with formation rock and fluids. Al-though SASP has three months longer low water cutduration than WASP, this may be attributed to itslower initial water cut before chemical flooding andmuch more fracturing measures. Better water cutperformance in B-1-D than B-2-X does not show itssuperiority except for emulsification.
(6) Injection pressure increase degree in B-2-X issmaller than B-1-D, indicating better injectivity andfluid production ability of WASP over SASP. ,einjection pressure performance difference is causedby scaling resulted from alkali, which reducedformation permeability. Both laboratory studiesand field coring analysis proved the permeabilityloss due to alkali injection. Although scaling well
Table 20: Economical benefit comparison.
Block Input-output ratio ROI FIRRSASP 1 : 2.3 12.9 18.0WASP 1 : 3.7 19.1 22.3
Journal of Chemistry 17

ratio in B-1-D is much higher than that in B-2-X,the scaling is much less severe than other strongASP tests. Compared with WASP test, more frac-turing measures were taken in SASP test.
(7) It is observed that production wells have positiveeffects earlier in B-1-D than in B-2-X and largeremulsification capacity. ,e stronger emulsificationability of NaOH over Na2CO3 partly resulted inlarger fluid production capacity loss. Strongemulsification may harm injectivity and produc-tivity. ,e higher remaining oil saturation in B-1-Dmakes emulsification more easy to happen. Al-though emulsification is believed to contribute toIORF, it also has negative effect on fluid productioncapacity. Further investigation is needed onemulsification mechanisms in ASP flooding.
(8) ,e scaling ratio and extent in production wells inB-1-D are much higher than that in B-2-X. ,escaling increased the development cost. Due tohigh CO2 content in formation in B-1-D, someNaOH are transformed into Na2CO3, whichhelped to reduced scaling degree. ,e scaling inB-1-D is quite different from other strong ASPflooding field tests and showed some character-istics of weak ASP flooding. ,is makes it possibleto used NaOH as alkali for ASP flooding in CO2-rich reservoirs. IORF of SASP in B-1-D is muchhigher than all the other strong ASP flooding fieldtests in Daqing, which is partly due to discountedscaling effect.
(9) Both of these two tests are very successful fromtechnical and economic aspects.,e incremental oilrecovery in these two blocks are the same, and SASPin B-1-D produced more oil due to larger reserves,however, input-output ratio, ROI, FIRR of SASP areall lower than WASP. ,us, it is prudential to get aconclusion that WASP is better than SASP. ,esuccess of these two tests may help to develop ASPflooding.
(10) Alkali plays a vital important role in ASP flooding.Although some differences (oil layers number,surfactant type and performance, polymer controldegree, and reservoir management level) may leadto some uncertainties, taking geological condition,injection scheme, chemicals, recovery performance,economic parameters, and other field test resultsinto account, it is believed that it is the alkali dif-ference that most causes the performance differenceand WASP is better than SASP under Daqingreservoir condition.
(11) ASP flooding is the most attractive chemicalflooding which has been tested in many oilfields.After huge effort, ASP flooding was put intocommercial application in Daqing Oilfield. From2016 to 2018, annual ASP flooding oil production inDaqing exceeded 4 million tons and had sharehigher than 10.28%.
Nomenclature
EOR: Enhanced oil recoveryASP: Alkali-surfactant-polymerWASP: Weak alkali-surfactant-polymerSASP: Strong alkali-surfactant-polymerIORF: Incremental oil recovery factorIR: Input-output ratioOOIP: Original oil in placeFCL: First-class layerSCL: Second-class layerTCL: ,ird-class layerIFT: Interfacial tensionROI: Return on investmentROF: Return on investmentFIRR: Financial internal rates of returnHABS: Heavy-oil alkybenzoyl sulfonateDPS: Daqing petroleum sulfonateTDS: Total dissolved solidsTAN: Total acid numberRW: Reference water floodingRF: Resistance factorRRF: Residual resistance factorMOIPT: Monthly oil increase per thickness.
Data Availability
,e data used to support the findings of this study are in-cluded within the article.
Conflicts of Interest
,e authors declare no conflicts of interest.
Authors’ Contributions
Chen Sun and Hu Guo contributed equally to this work.
Acknowledgments
,e authors wish to express their appreciation for thefunding provided by the National Science and TechnologyMajor Project of China (nos. 2016ZX05025-001-005 and2016ZX05025-003-010), Natural Science Foundation(51834005), Yan’an University Start-Up Fund (YDBK2018-52), China Scholarship Council (201806440187), andDeutscher Akademischer Austauschdienst (91737128).
References
[1] G. Georgiou, S.-C. Lin, and M. M. Sharma, “Surface-activecompounds from microorganisms,” Nature Biotechnology,vol. 10, no. 1, pp. 60–65, 1992.
[2] S. K. Nandwani, M. Chakraborty, and S. Gupta, “Adsorptionof surface active ionic liquids on different rock types underhigh salinity conditions,” Scientific Reports, vol. 9, no. 1,pp. 1–16, 2019.
[3] S. De, S. Malik, A. Ghosh, R. Saha, and B. Saha, “A review onnatural surfactants,” RSC Advances, vol. 5, no. 81,pp. 65757–65767, 2015.
18 Journal of Chemistry

[4] M. H. Mondal, S. Malik, A. Roy, R. Saha, and B. Saha,“Modernization of surfactant chemistry in the age of geminiand bio-surfactants: a review,” RSC Advances, vol. 5, no. 112,pp. 92707–92718, 2015.
[5] M. H. Mondal, S. Malik, S. De, S. S. Bhattacharyya, andB. Saha, “Employment and resurrection of surfactants inbipyridine promoted oxidation of butanal using bivalentcopper at NTP,” Research on Chemical Intermediates, vol. 43,no. 3, pp. 1651–1670, 2017.
[6] K. Mukherjee, R. Saha, A. Ghosh, S. K. Ghosh, and B. Saha,“Efficient combination of promoter and catalyst for chromicacid oxidation of propan-2-ol to acetone in aqueous acidmedia at room temperature,” Spectrochimica Acta Part A:Molecular and Biomolecular Spectroscopy, vol. 101,pp. 294–305, 2013.
[7] A. K. Das, A. Roy, and B. Saha, “Kinetics and mechanism ofthe picolinic acid catalysed chromium(VI) oxidation ofethane-1,2-diol in the presence and absence of surfactants,”Transit Met Chem, vol. 26, pp. 630–637, 2001.
[8] R. Nandi, S. Laskar, and B. Saha, “Surfactant-promotedenhancement in bioremediation of hexavalent chromium totrivalent chromium by naturally occurring wall algae,” Re-search on Chemical Intermediates, vol. 43, no. 3, pp. 1619–1634, 2017.
[9] K.Mukherjee, R. Saha, A. Ghosh, S. K. Ghosh, P. K.Maji, andB. Saha, “Surfactant-assisted bioremediation of hexavalentchromium by use of an aqueous extract of sugarcane ba-gasse,” Research on Chemical Intermediates, vol. 40, no. 4,pp. 1727–1734, 2014.
[10] C. De, R. Saha, S. K. Ghosh et al., “A review of biphasichydroformylation for long chain substrates,” Research onChemical Intermediates, vol. 39, no. 8, pp. 3463–3474, 2013.
[11] W. R. Finnerty and M. E. Singer, “Microbial enhancement ofoil recovery,” Nature Biotechnology, vol. 1, no. 1, pp. 47–54,1983.
[12] Z. Wu, X. a. Yue, T. Cheng, J. Yu, and H. Yang, “Effect ofviscosity and interfacial tension of surfactant-polymerflooding on oil recovery in high-temperature and high-sa-linity reservoirs,” Journal of Petroleum Exploration andProduction Technology, vol. 4, no. 1, pp. 9–16, 2014.
[13] Z. Ma, F. Ge, Q.Wang, and X. Li, “,e behavior of interfacialfilm thinning in oil-in-water emulsion from the producedwater from ASP flooding,” Separation Science and Tech-nology, vol. 55, no. 1, pp. 155–164, 2020.
[14] W. Yun, S. Chang, D. A. Cogswell et al., “Toward reservoir-on-a-chip: rapid performance evaluation of enhanced oilrecovery surfactants for carbonate reservoirs using a calcite-coated micromodel,” Scientific Reports, vol. 10, no. 1,pp. 1–12, 2020.
[15] K. Xie, X. Lu, Q. Li, W. Jiang, and Q. Yu, “Analysis ofreservoir applicability of hydrophobically associating poly-mer,” SPE Journal, vol. 21, no. 1, pp. 001–009, 2016.
[16] K. Xie, B. Cao, X. Lu et al., “Matching between the diameterof the aggregates of hydrophobically associating polymersand reservoir pore-throat size during polymer flooding in anoffshore oilfield,” Journal of Petroleum Science and Engi-neering, vol. 177, pp. 558–569, 2019.
[17] J. Li, L. Niu, and X. Lu, “Performance of ASP compoundsystems and effects on flooding efficiency,” Journal of Pe-troleum Science and Engineering, vol. 178, pp. 1178–1193,2019.
[18] X. Han, I. Kurnia, Z. Chen, J. Yu, and G. Zhang, “Effect of oilreactivity on salinity profile design during alkaline-
surfactant-polymer flooding,” Fuel, vol. 254,pp. 115738-115739, 2019.
[19] X. Sui, Z. Chen, I. Kurnia, X. Han, J. Yu, and G. Zhang,“Alkaline-surfactant-polymer flooding of active oil underreservoir conditions,” Fuel, vol. 262, p. 116647, 2020.
[20] R. Farajzadeh, B. L. Wassing, and L. W. Lake, “Insights intodesign of mobility control for chemical enhanced oil re-covery,” Energy Reports, vol. 5, pp. 570–578, 2019.
[21] L. Sun, X. Wu, W. Zhou, X. Li, and P. Han, “Technologies ofenhancing oil recovery by chemical flooding in DaqingOilfield, NE China,” Petroleum Exploration and Develop-ment, vol. 45, pp. 636–645, 2018.
[22] S. Yuan and Q. Wang, “New progress and prospect of oil-fields development technologies in China,” Petroleum Ex-ploration and Development, vol. 45, pp. 657–668, 2018.
[23] A. A. Olajire, “Review of ASP EOR (alkaline surfactantpolymer enhanced oil recovery) technology in the petroleumindustry: prospects and challenges,” Energy, vol. 77,pp. 963–982, 2014.
[24] J. J. Sheng, “A comprehensive review of alkalin-e–surfactant–polymer (ASP) flooding,” Asia-Pacific Journalof Chemical Engineering, vol. 9, pp. 471–489, 2014.
[25] Z. Wang, R. Pang, X. Le, Z. Peng, Z. Hu, and X. Wang,“Survey on injection-production status and optimized sur-face process of ASP flooding in industrial pilot area,” Journalof Petroleum Science and Engineering, vol. 111, pp. 178–183,2013.
[26] Y. Zhu, Q. Hou, G. Jian, D. Ma, and Z. Wang, “Currentdevelopment and application of chemical combinationflooding technique,” Petroleum Exploration and Develop-ment, vol. 40, no. 1, pp. 96–103, 2013.
[27] Z. Qu, Y. Zhang, X. Zhang, and J. Dai, “A successful ASPflooding pilot in gudong oil field,” in Proceedings of the SPE/DOE Improved Oil Recovery Symposium, pp. 107–119, Tulsa,OK, USA, April 1998.
[28] W. Song, C. Yang, Z. Qu, and B. Wen, “Alkaline-surfactant-polymer combination flooding for improving recovery,” inProceedings of the International Meeting on Petroleum En-gineering, pp. 1–7, Beijing, China, November 1995.
[29] Y. Zhu, X. Liu, and J. Fan, “Developments of ASP/SPflooding formulations for Huabei fault block reservoir,” inProceedings of the SPE/IATMI Asia Pacific Oil & Gas Con-ference and Exhibition, pp. 1–9, Nusa Dua, Bali, Indonesia,October 2015.
[30] Q. Qi, G. Hongjun, L. Dongwen, and D. Ling, “,e pilot testof ASP combination flooding in Karamay oil field,” inProceedings of the International Oil and Gas Conference andExhibition in China, Beijing, China, November 2000.
[31] K. Panthi, H. Sharma, and K. K. Mohanty, “ASP flood of aviscous oil in a carbonate rock,” Fuel, vol. 164, pp. 18–27,2016.
[32] S. A. Shedid, “Experimental investigation of alkaline/sur-factant/polymer (ASP) flooding in low permeability het-erogeneous carbonate reservoirs,” in Proceedings of the SPENorth Africa Technical Conference and Exhibition, Cairo,Egypt, September 2015.
[33] S. Pingping,W. Jialu, Y. Shiyi, Z. Taixian, and J. Xu, “Study ofenhanced-oil-recovery mechanism of alkali/surfactant/polymer flooding in porous media from experiments,” SPE J,vol. 14, no. 2, pp. 237–244, 2009.
[34] Y. Zhu, “Current developments and remaining challenges ofchemical flooding EOR techniques in China,” in Proceedingsof the SPE Asia Pacific Enhanced Oil Recovery Conference,pp. 1–18, Kuala Lumpur, Malaysia, August 2015.
Journal of Chemistry 19

[35] C. Jiecheng, W. Junzheng, and H. Junqing, “Key theories andtechnologies for enhanced oil recovery of alkali/surfactant/polymer flooding,” Acta Ecologica Sinica, vol. 35, pp. 310–318, 2014.
[36] Y. Li, B. Kong, and C. Li, “Dynamic characteristics ofsynergistic effect between profile control technologythroughout flooding and ASP flooding,” Acta EcologicaSinica, vol. 39, pp. 697–702, 2018.
[37] L. Bo and J. Hu, Daqing Oilfield Overcomes WorldclassDifficulty Producer Scaling in ASP Flooding, China PetroleumDaily, Daqing, China, 2016.
[38] H. Guo, Y. Li, D. Kong, R. Ma, B. Li, and F. Wang, “Lessonslearned from alkali/surfactant/polymer-flooding field tests inChina,” SPE Reservoir Evaluation & Engineering, vol. 22,no. 01, pp. 078–099, 2019.
[39] Y. Liu and L. W. Yu, “Reducing pump checking rate researchand application for ASP flooding in Sanan oilfield,” inProceedings of the Proceeding of China Oil Gas Conference,pp. 737–744, Beijing, China, October 2018.
[40] H. Guo, Y. Li, F. Wang, and Y. Gu, “Comparison of strong-alkali and weak-alkali ASP-flooding field tests in daqing oilfield,” SPE Production & Operations, vol. 33, no. 2,pp. 353–362, 2018.
[41] H. Guo, S. Hu, H. Yan et al., “Emulsification mechanisms inalkali-surfactant-polymer (ASP) flooding enhanced oil re-covery,” in Proceedings of the IOR 2019–20th EuropeanSymposium on Improved Oil Recovery, Tulsa, OK, USA, April2019.
[42] R.-S. Feng, X.-M. Zhang, J. Hu, H.-B. Li, and H. B. Li,“Alkali/surfactant/polymer flooding in the daqing oilfieldclass II reservoirs using associating polymer,” Journal ofChemistry, vol. 2013, Article ID 275943, 6 pages, 2013.
[43] N. Lai, X. Qin, Z. Ye, Q. Peng, Y. Zhang, and Z. Ming,“Synthesis and evaluation of a water-soluble hyperbranchedpolymer as enhanced oil recovery chemical,” Journal ofChemistry, vol. 2013, Article ID 824785, 11 pages, 2013.
[44] D. Zhu, J. Zhang, Y. Han, H.Wang, and Y. Feng, “Laboratorystudy on the potential EOR use of HPAM/VES hybrid inhigh-temperature and high-salinity oil reservoirs,” Journal ofChemistry, vol. 2013, Article ID 927519, 8 pages, 2013.
[45] Y. Du, G. Zhang, J. Ge, G. Li, and A. Feng, “Influence of oilviscosity on alkaline flooding for enhanced heavy oil re-covery,” Journal of Chemistry, vol. 2013, Article ID 938237,8 pages, 2013.
[46] J. Li, W. Liu, G. Liao, L. Sun, S. Cong, and R. Jia, “Chemicalmigration and emulsification of surfactant-polymer flood-ing,” Journal of Chemistry, vol. 2019, Article ID 3187075,8 pages, 2019.
[47] D. Yin, D. Zhao, J. Gao, and J. Gai, “Experimental study ofenhancing oil recovery with weak base alkaline/surfactant/polymer,” International Journal of Polymer Science, vol. 2017,Article ID 4652181, 7 pages, 2017.
[48] B. Huang, T. Dai, H. Liu, C. Fu, T. Zhu, and W. Zhang, “Astudy on the adjustment of emulsification degree to inter-layer interference in class III reservoir,” International Journalof Polymer Science, vol. 2019, Article ID 6186018, 11 pages,2019.
[49] D. W. Green and G. P. Willhite, Enhanced Oil Recovery,Society of Petroleum Engineers, Richardson, TX, USA, 2stedition, 2018.
[50] M. Delshad, C. Han, F. K. Veedu, and G. A. Pope, “Asimplified model for simulations of alkaline-surfactant-polymer floods,” Journal of Petroleum Science and Engi-neering, vol. 108, pp. 1–9, 2013.
[51] M. Kazempour, C. S. Gregersen, and V. Alvarado, “Miti-gation of anhydrite dissolution in alkaline floods throughinjection of conditioned water,” Fuel, vol. 107, pp. 330–342,2013.
[52] M. Kazempour, E. J. Manrique, V. Alvarado, J. Zhang, andM. Lantz, “Role of active clays on alkaline-surfactant-poly-mer formulation performance in sandstone formations,”Fuel, vol. 104, pp. 593–606, 2013.
[53] A. Kazemi Nia Korrani, K. Sepehrnoori, and M. Delshad, “Amechanistic integrated geochemical and chemical-floodingtool for alkaline/surfactant/polymer floods,” SPE Journal,vol. 21, no. 1, pp. 032–054, 2016.
[54] H. Sharma, S. Dufour, G. W. P. P. Arachchilage,U. Weerasooriya, G. A. Pope, and K. Mohanty, “Alternativealkalis for ASP flooding in anhydrite containing oil reser-voirs,” Fuel, vol. 140, pp. 407–420, 2015.
[55] M. Kazempour, E. Sundstrom, and V. Alvarado, “Geo-chemical modeling and experimental evaluation of high-pHfloods: impact of Water-Rock interactions in sandstone,”Fuel, vol. 92, no. 1, pp. 216–230, 2012.
[56] M. Li, M. Lin, Z. Wu, and A. A. Christy, “,e influence ofNaOH on the stability of paraffinic crude oil emulsion,” Fuel,vol. 84, no. 2-3, pp. 183–187, 2005.
[57] G. Jixiang, L. Mingyuan, L. Meiqin, and W. Zhaoliang,“Investigation in the reaction of daqing crude oil with alkali,”Acta Ecologica Sinica, vol. 23, pp. 20–24, 2007.
[58] S. Gang, L. Zhiwei, L. Meiqin, X. Xueqin, L. Minyuan, andW. Rongjian, “Effect of Reaction of Na2CO3and Daqingcrude oil/water inferfacial properties and stability of emul-sion,” J Northeast Pet Univ, vol. 37, pp. 73–77, 2013.
[59] J. J. Sheng, “Investigation of alkaline-crude oil reaction,”Petroleum, vol. 1, no. 1, pp. 31–39, 2015.
[60] L. He, F. Lin, X. Li, H. Sui, and Z. Xu, “Interfacial sciences inunconventional petroleum production: from fundamentalsto applications,” Chemical Society Reviews, vol. 44, no. 15,pp. 5446–5494, 2015.
[61] S. Solairaj, C. Britton, D. H. Kim, U. Weerasooriya, andG. A. Pope, “Measurement and analysis of surfactant re-tention,” in Proceedings of the SPE Improved Oil RecoverySymposium, pp. 1–17, Tulsa, OK, USA, April 2012.
[62] G. Y. Chen, X. L. Wu, Z. Y. Yang, F. L. Yu, J. B. Hou, andX. J. Wang, “Study of the effect of injection water quality onthe interfacial tension of ASP/crude oil,” Journal of CanadianPetroleum Technology, vol. 46, no. 2, 2007.
[63] S. Huang and M. Dong, “Alkaline/surfactant/polymer (ASP)flood potential in southwest saskatchewan oil reservoirs,”Journal of Canadian Petroleum Technology, vol. 43, no. 12,2004.
[64] J. Hou, Z. Liu, S. Zhang, X. a. Yue, and J. Yang, “,e role ofviscoelasticity of alkali/surfactant/polymer solutions in en-hanced oil recovery,” Journal of Petroleum Science and En-gineering, vol. 47, no. 3-4, pp. 219–235, 2005.
[65] J. R. Hou, Z. C. Liu, M. Z. Dong, X. A. Yue, and J. Z. Yang,“Effect of viscosity of alkaline/surfactant/polymer (ASP)solution on enhanced oil recovery in heterogeneous reser-voirs,” Journal of Canadian Petroleum Technology, vol. 45,no. 11, pp. 27–33, 2006.
[66] A. Kamel and S. N. Shah, “Effects of salinity and temperatureon drag reduction characteristics of polymers in straightcircular pipes,” Journal of Petroleum Science and Engineering,vol. 67, no. 1-2, pp. 23–33, 2009.
[67] M. H. Sedaghat, A. Hatampour, and R. Razmi, “Investigatingthe role of polymer type and dead end pores’ distribution on
20 Journal of Chemistry

oil recovery efficiency during ASP flooding,” EgyptianJournal of Petroleum, vol. 22, no. 2, pp. 241–247, 2013.
[68] Y. Assef, D. Arab, and P. Pourafshary, “Application ofnanofluid to control fines migration to improve the per-formance of low salinity water flooding and alkalineflooding,” Journal of Petroleum Science and Engineering,vol. 124, pp. 331–340, 2014.
[69] Y. Li, W. Zhang, B. Kong et al., “Mixtures of anionic/cationicsurfactants: a new approach for enhanced oil recovery inlow-salinity, high-temperature sandstone reservoir,” SPEJournal, vol. 21, no. 4, pp. 1164–1177, 2016.
[70] W. Fang, H. Jiang, J. Li et al., “A new experimental meth-odology to investigate formation damage in clay-bearingreservoirs,” Journal of Petroleum Science and Engineering,vol. 143, pp. 226–234, 2016.
[71] S. Khorsandi, C. Qiao, and R. T. Johns, “Displacement ef-ficiency for low salinity polymer flooding including wetta-bility alteration,” SPE Journal, vol. 22, no. 2, pp. 417–430,2017.
[72] Y. E. Wang, “Second class layer characterics and ASPflooding field test in daqing oilfield sazhong district,” Masterthesis, Zhejiang University, Hangzhou, China, 2014.
[73] Li Yan, “Technical research on ASP flood for poor reservoirsin eastern fault of B-1 region,” Master ,esis, Daqing pe-troleum institute, Daqing, China, 2008.
[74] Y. Fu, “A study on dynamic development regulation of weakbase ASP flooding in beierxi sub-layers,” Master thesis,Northeast Petroleum University, Daqing, China, 2011.
[75] J. Wang, “,e research of triple compund flooding devel-opment effect evaluation in the east of the fault block in Beiyidistrict,” Master thesis, Northeast Petroleum University,Daqing, China, 2013.
[76] Y. Yan, “Study the formulation of alkaline/surfactant/poly-mer flooding system for the Gaotaizi second reservoir,”Master thesis, Daqing Petroleum Insitute, Daqing, China,2006.
[77] L. Bailin, Z. Yingying, D. Sujuan, J. Yong, and L. Zhang,“Adsorption properties of asp flooding system for the centralreservoir in daqing,” J Northeast Pet Univ, vol. 38, 2014.
[78] H. Pu and Q. Xu, “An update and perspective on field-scalechemical floods in daqing,China,” in Proceedings of the SPEMiddle East Oil and Gas Show and Conference, pp. 1–8,Manama, Bahrain, March 2009.
[79] O. Abib, F. J. Moretti, C. Mei, and Y. Yang, “Application ofgeological modeling and reservoir simulation to the westSaertu area of the daqing oil field,” SPE Reservoir Engi-neering, vol. 6, no. 1, pp. 99–106, 2011.
[80] C. Jiecheng, W. Junzheng, and W. Di, ASP FloodingTechnlogy, China Petroleum Industry Press, Beijing, China,1st edition, 2013.
[81] J. Cheng, ASP Flooding Technology, Petroleum IndustryPress, Beijing, China, 2019.
[82] J. J. Sheng, Modern Chemical Enhanced Oil Recovery:theoryand Practice, 2011.
[83] Y. Zhu and M. Lei, “Effects of crude oil components on theinterfacial tension between oil and surfactant solutions2015,” in Proceedings of the SPE Asia Pacific Enhanced OilRecovery Conference, Kuala Lumpur, Malaysia, August 2015.
[84] X. Wu, “Research progress in the surfactants for complexflooding in Daqing Oilfield,” Petroleum Geology & OilfieldDevelopment in Daqing, vol. 38, no. 5, pp. 183–188, 2019.
[85] C. Huaqing, Daqing Oilfield EOR Feory and Practice, Pe-troleum Industry Press, Beijing, China, 2006.
[86] F. Huang, T. Wei, and F. Zhihui, “Physicochemical prop-erties and characteristics of the formation water in thenorthern part of songliao basin,” Pet Geol Oilf DevDaqing(PGOD), vol. 16, pp. 23–25, 1997.
[87] Y. Zhu, Y. Zhang, J. Niu, W. Liu, and Q. Hou, “,e researchprogress in the alkali-free surfactant-polymer combinationflooding technique,” Petroleum Exploration and Develop-ment, vol. 39, no. 3, pp. 371–376, 2012.
[88] D. Wang, P. Han, Z. Shao, W. Hou, and R. S. Seright,“Sweep-improvement options for the daqing oil field,” SPEReservoir Evaluation & Engineering, vol. 11, no. 1, pp. 22–26,2008.
[89] D. Wang, C. Jiecheng, W. Junzheng, Y. Zhenyu, andY. Yuming, “Summary of ASP pilots in Daqing oil field,” inProceedings of the SPE Asia Pacific Improved Oil RecoveryConference, Kuala Lumpur, Malaysia, October 1999.
[90] D. Wang, C. Jiecheng, L. Qun, L. Lizhong, Z. Changjiu, andH. Jichun, “An Alkaline bio-surfactant polymer floodingpilots in daqing oil field,” in Proceedings of the SPE AsiaPacific Improved Oil Recovery Conference, p. 12, KualaLumpur, Malaysia, October 1999.
[91] D. Wang, C. Jiecheng, W. Junzheng, W. Fenglan, I. Huabin,and G. Xiaohong, “An alkaline/surfactant/polymer field testin a reservoir with a long-term 100% water cut,” in Pro-ceedings of the SPE Annual Technical Conference andExhibition, New Orleans, LA, USA, September 1998.
[92] W. Demin, Z. Zhenhua, C. Jiecheng, Y. Jingchun,G. Shutang, and L. Li, “Pilot test of alkaline surfactantpolymer flooding in daqing oil field,” SPE Reservoir Engi-neering, vol. 12, no. 4, pp. 229–233, 1997.
[93] G. Shutang, L. Huabin, and L. Hongfu, “Laboratory inves-tigation of combination of alkali/surfactant/polymer tech-nology for Daqing EOR,” SPE Reservoir Engineering, vol. 10,no. 3, pp. 194–197, 1995.
[94] F. Zhao, Y. Ma, J. Hou, J. Tang, and D. Xie, “Feasibility andmechanism of compound flooding of high-temperaturereservoirs using organic alkali,” Journal of Petroleum Scienceand Engineering, vol. 135, pp. 88–100, 2015.
[95] L. Jie, C. Jinfeng, and H. Mengqu, “Production performancecharacteristics of the strong alkali ASP flooding,” Pet GeolOilf Dev Daqing (PGOD), vol. 34, pp. 92–97, 2015.
[96] S. Rue, Z. Dong, X. Cong et al., “An evaluation on strong baseASP flooding efficiency of multiple layers the oil layer de-veloped degree after ASP flooding,” in Proceedings of the SPEAsia Pacific Enhanced Oil Recovery Conference, KualaLumpur, Malaysia, August 2015.
[97] C. S. Gregersen, M. Kazempour, and V. Alvarado, “ASPdesign for the Minnelusa formation under low-salinityconditions: impacts of anhydrite on ASP performance,” Fuel,vol. 105, pp. 368–382, 2013.
[98] C. Jinfeng, L. Jie, and L. Zhang, “Injection opportunity ofASP flooding in daqing oilfield,” Pet Geol Oilf DevDaqing(PGOD), vol. 34, pp. 91–96, 2015.
[99] L. Xiuping, “Exploration characteristics and influencingfactors of weak base ASP flooding,” Unconventional Oil andGas, vol. 1, pp. 37–42, 2014.
[100] R. Reichenbach-Klinke, A. Stavland, D. Strand, B. Langlotz,and G. Brodt, “Can associative polymers reduce the residualoil saturation?” in Proceedings of the SPE EOR Conference atOil and Gas West Asia, Muscat, Oman, March 2016.
[101] W. Dongmei, D. Huanzhong, L. Changsen, F. Xiaofei, andN. Jun, “Review of practical experience of polymer floodingat daqing,” SPE Reservoir Evaluation & Engineering, vol. 12,no. 3, pp. 470–476, 2009.
Journal of Chemistry 21

[102] C. Jiecheng, Q.Wang, J. Wang, C. Li, andW. Shi, “Ca/Si scalesedimentary modelin the strong-base ASP flooding blockand scaling prediction,” Acta Ecologica Sinica, vol. 37,pp. 653–659, 2016.
[103] C. Jiecheng, Z. Wan-Fu1, W. Qing-Guo, C. Tie-Xin, andZ. Guang-Dong, “Morphology and crystallization characterof calcium carbonate in scaled sample formed during al-kaline-surfactant-polymer(ASP) flooding in daqing oilfield,”Chemical Research in Chinese Universities, vol. 33, pp. 5–9,2012.
[104] Q. Gao, Research on Chemistry of Scaling and DescalingProcess in Concentrated Alkali ASP Flooding, NortheastPetroleum Univeristy, Heilongjiang, China, 2013.
[105] R. N. Manichand and R. Seright, “Field vs. Laboratorypolymer-retention values for a polymer flood in the tam-baredjo field,” SPE Reservoir Evaluation & Engineering,vol. 17, no. 3, pp. 314–325, 2014.
[106] G. Zhang and R. S. Seright, “Hydrodynamic retention andrheology of EOR polymers in porous media,” in Proceedingsof theSPE International Symposium on Oilfield Chemistry,pp. 13–15, ,e Woodlands, Tx, USA, April 2015.
[107] R. S. Seright, “How much polymer should Be injected duringa polymer flood? Review of previous and current practices,”SPE Journal, vol. 22, no. 1, pp. 1–18, 2017.
[108] Z. Weiyao, J. Yan, and L. Yunqian, Enhanced ChemicalFlooding Complex Percolation and Development Method,China Science Press, Beijing, China, 1st edition, 2013.
[109] M. Baviere, Basic Concepts in Enhanced Oil Recovery Pro-cesses, Springer, Berlin, Germany, 1991.
[110] L. Huang, P. Yang, and T. Qin, “A study of caustic con-sumption by clays,” in Proceedings of the SPE/DOE fifthEnhanced Oil Recovery Symposium, Tulsa, OK, USA, April1986.
[111] K. H. Cheng, “Chemical consumption during alkalineflooding: a comparative evaluation,” in Proceedings of theSPE Enhanced Oil Recovery Symposium, pp. 1–14, Tulsa, OK,USA, April 1986.
[112] K. Song, X. Dong, J. He, and J. Yang, “Scaling phenomenonin base ASP flooding,” Journal of Chinese Universities, vol. 27,pp. 73–78, 2014.
[113] C. Jiecheng, W. Qingguo, Z. Tianfu, L. Su, C. Tiexin, andZ. Guangdong, “Synthesis and application of silicon scaleinhibitor SY-KD under the ASP flooding system,” ChemicalJournal of Chinese Universities, vol. 35, pp. 332–337, 2014.
[114] C. Jiecheng, Z. Wanfu, Z. Yusheng et al., “Scaling principleand scaling prediction in ASP flooding producers in daqingoilfield,” in Proceedings of SPE Enhanced Oil RecoveryConference, pp. 1–6, Kuala Lumpur, Malaysia, July 2011.
[115] J. Cheng, W. Zhou, Q. Wang et al., “Technical breakthroughin production engineering ensures economic development ofASP flooding in daqing oilfield,” in Proceedings of the SPEAsia Pacific Oil & Gas Conference and Exhibition, Adelaide,Australia, October 2014.
[116] H. Guo, Y. Q. Li, Y. Shu, F. Wang, D. Kong, and R. C. Ma,“Comparison of scaling in strong alkali and weak alkali ASPflooding pilot tests,” in Proceedings of the 19th EuropeanSymposium on Improved Oil Recovery, Stavanger, Norway,April 2017.
[117] D. Li, M. Shi, W. Demin, Z. Li, and H. Fei, “Chromato-graphic separation of chemicals in alkaline surfactantpolymer flooding in reservoir rocks in the daqing oilfield,” inProceedings of the SPE International Symposium on OilfieldChemistry, pp. 1–11, ,e Woodlands, TX, USA, April 2009.
[118] Y. Wang, “,e field test result of ASP flooding with weakalkalin in the secondary reservoir of northern daqing oil-field,” Inn Mongulia Petrochemical Ind, vol. 135–9, 2014.
[119] H. Guo, Y. Li, R. C. Ma, F. Y. Wang, and Z. Shihu, “Eval-uation of three large scale ASP flooding field tests,” inProceedings of the 19th European Symposium on ImprovedOil Recovery, Stavanger, Norway, April 2017.
22 Journal of Chemistry