alignment of molecules induced by long and short laser pulses
TRANSCRIPT

Alignment of molecules induced by longand short laser pulses
PhD thesis
Mikael D. Poulsen
April, 2005
Department of Chemistry
University of Aarhus, Denmark

Publications
Most of the work presented in this thesis1 is (or will be) published in:
[1] M. D. Poulsen, E. Skovsen, and H. StapelfeldtPhotodissociation of laser aligned iodobenzene: Towardsselective photoexcitationJ. Chem. Phys., 117 (2002), 2097–2102
[2] E. Peronne, M. D. Poulsen, C. Z. Bisgaard, H. Stapelfeldt, andT. SeidemanNonadiabatic Alignment of Asymmetric Top Molecules:Field-Free Alignment of IodobenzenePhys. Rev. Lett. 91 (2003), 043003
[3] E. Peronne, M. D. Poulsen, C. Z. Bisgaard, H. Stapelfeldt,E. Hamilton, and T. SeidemanNonadiabatic alignment of iodobenzenePhys. Rev. A 70 (2004), 063410
1Except for the results presented in sect. 4.5.2 and sect. 6.4
ii

iii
[4] C. Z. Bisgaard, M. D. Poulsen, E. Peronne, S. S. Viftrup, andH. StapelfeldtObservation of Enhanced Field-Free Molecular Alignment byTwo Laser PulsesPhys. Rev. Lett. 92 (2004), 173004
[5] M. D. Poulsen, E. Peronne, H. Stapelfeldt, C. Z. Bisgaard,S. S. Viftrup, E. Hamilton, and T. SeidemanNonadiabatic alignment of asymmetric top molecules:Rotational revivalsJ. Chem. Phys. 121 (2004), 783–791
[6] T. Ejdrup, M. D. Poulsen, C. Z. Bisgaard, S. S. Viftrup,H. Stapelfeldt, E. Hamilton, and T. SeidemanLaser induced alignment of symmetric top moleculesManuscript in preparation
[7] M. D. Poulsen, T. Ejdrup, H. Stapelfeldt, E. Hamilton,and T. SeidemanAlignment of molecules by a long and a short laser pulseManuscript in preparation
Contents
Preface ix
Outline xi
1 Introduction 1
1.1 Why control molecular orientation? . . . . . . . . . . . . . . 11.2 Methods to control molecular orientation . . . . . . . . . . 3
1.2.1 Orientation and alignment by electric field . . . . . . 41.2.2 Collision induced alignment . . . . . . . . . . . . . . 10
1.3 Advantages and disadvantages of laser induced alignment . 11
2 Theory of alignment 13
2.1 Definition of Alignment . . . . . . . . . . . . . . . . . . . . 132.1.1 Molecular coordinates . . . . . . . . . . . . . . . . . 132.1.2 Linear alignment . . . . . . . . . . . . . . . . . . . . 152.1.3 3-D alignment . . . . . . . . . . . . . . . . . . . . . 17
2.2 Quantum Mechanical theory of alignment . . . . . . . . . . 182.2.1 Angular dependence of the interaction . . . . . . . . 192.2.2 Time dependence of the interaction . . . . . . . . . . 222.2.3 Methods of calculation . . . . . . . . . . . . . . . . . 26
iv

CONTENTS v
2.3 Classical theories of alignment . . . . . . . . . . . . . . . . . 282.3.1 Boltzmann distribution . . . . . . . . . . . . . . . . 282.3.2 Classical kicked rotor . . . . . . . . . . . . . . . . . 30
3 Experimental Setup 31
3.1 The molecular beam . . . . . . . . . . . . . . . . . . . . . . 323.1.1 Gas flow system . . . . . . . . . . . . . . . . . . . . 323.1.2 Vacuum chambers . . . . . . . . . . . . . . . . . . . 34
3.2 Laser pulses . . . . . . . . . . . . . . . . . . . . . . . . . . . 353.2.1 Alignment and probe pulses . . . . . . . . . . . . . . 353.2.2 Optical setup . . . . . . . . . . . . . . . . . . . . . . 37
3.3 Data acquisition and treatment . . . . . . . . . . . . . . . . 423.3.1 Ion imaging . . . . . . . . . . . . . . . . . . . . . . . 423.3.2 Abel inversion . . . . . . . . . . . . . . . . . . . . . 44
4 Adiabatic alignment of iodobenzene 48
4.1 Idea . . . . . . . . . . . . . . . . . . . . . . . . . . . . . . . 494.2 Resonantly enhanced multi photon ionization of iodine . . . 514.3 Photodissociation of iodobenzene . . . . . . . . . . . . . . . 52
4.3.1 The n → σ? dissociation channel . . . . . . . . . . . 534.3.2 The π → π? dissociation channel . . . . . . . . . . . 554.3.3 Promptness of the dissociation . . . . . . . . . . . . 55
4.4 Linear alignment . . . . . . . . . . . . . . . . . . . . . . . . 564.4.1 Ion images . . . . . . . . . . . . . . . . . . . . . . . 564.4.2 Kinetic energy distributions . . . . . . . . . . . . . . 584.4.3 Angular distributions . . . . . . . . . . . . . . . . . 594.4.4 Obtaining fmol(θ) and 〈cos2 θ〉 . . . . . . . . . . . . 614.4.5 Assumptions made for obtaining 〈cos2 θ〉 . . . . . . . 63
4.5 Controlling the photodissociation . . . . . . . . . . . . . . . 66

vi CONTENTS
4.5.1 Control using linear Alignment . . . . . . . . . . . . 664.5.2 Improving the control with 3-D alignment . . . . . . 69
4.6 Conclusion . . . . . . . . . . . . . . . . . . . . . . . . . . . 71
5 Non-adiabatic alignment – short time dynamics 73
5.1 Alignment with one pulse . . . . . . . . . . . . . . . . . . . 755.1.1 Experiment . . . . . . . . . . . . . . . . . . . . . . . 755.1.2 Ion images and 〈cos2 θ〉 . . . . . . . . . . . . . . . . 775.1.3 Dependence on intensity and rotational temperature 795.1.4 Alignment pulse duration . . . . . . . . . . . . . . . 82
5.2 Alignment with two pulses . . . . . . . . . . . . . . . . . . . 865.2.1 Idea . . . . . . . . . . . . . . . . . . . . . . . . . . . 865.2.2 Experiment . . . . . . . . . . . . . . . . . . . . . . . 875.2.3 Alignment dynamics . . . . . . . . . . . . . . . . . . 875.2.4 Pulse to pulse delay . . . . . . . . . . . . . . . . . . 905.2.5 Intensity ratio, I1/I2 . . . . . . . . . . . . . . . . . . 915.2.6 Discussion . . . . . . . . . . . . . . . . . . . . . . . . 91
5.3 Conclusion . . . . . . . . . . . . . . . . . . . . . . . . . . . 92
6 Non-adiabatic alignment – Rotational revivals 94
6.1 Experiment . . . . . . . . . . . . . . . . . . . . . . . . . . . 966.2 Symmetric top molecules . . . . . . . . . . . . . . . . . . . 97
6.2.1 Ion images . . . . . . . . . . . . . . . . . . . . . . . 976.2.2 Revival spectra . . . . . . . . . . . . . . . . . . . . . 986.2.3 Duration of the alignment pulse . . . . . . . . . . . . 105
6.3 Asymmetric top molecules of C2v type . . . . . . . . . . . . 1086.3.1 Revival spectra . . . . . . . . . . . . . . . . . . . . . 1086.3.2 Molecular asymmetry . . . . . . . . . . . . . . . . . 113
6.4 Asymmetric top molecules of general type . . . . . . . . . . 116

CONTENTS vii
6.4.1 Angle of detection . . . . . . . . . . . . . . . . . . . 117
6.4.2 Ion images . . . . . . . . . . . . . . . . . . . . . . . 119
6.4.3 Revival spectra . . . . . . . . . . . . . . . . . . . . . 120
6.5 Conclusion . . . . . . . . . . . . . . . . . . . . . . . . . . . 124
7 Combining adiabatic and non-adiabatic alignment 126
7.1 Coulomb explosion probe . . . . . . . . . . . . . . . . . . . 126
7.2 Experiment . . . . . . . . . . . . . . . . . . . . . . . . . . . 128
7.3 Comparing adiabatic and non-adiabatic alignment . . . . . 129
7.3.1 Ion images . . . . . . . . . . . . . . . . . . . . . . . 129
7.3.2 〈cos2 θ2D〉 measurements . . . . . . . . . . . . . . . . 130
7.4 Combining adiabatic and non-adiabatic alignment . . . . . 132
7.4.1 Short time dynamics . . . . . . . . . . . . . . . . . . 132
7.4.2 Rotational revivals . . . . . . . . . . . . . . . . . . . 136
7.5 Conclusion . . . . . . . . . . . . . . . . . . . . . . . . . . . 136
8 Outlook 138
8.1 Experimental improvements . . . . . . . . . . . . . . . . . . 139
8.1.1 New pulsed valve . . . . . . . . . . . . . . . . . . . . 139
8.1.2 Velocity mapping using slice imaging . . . . . . . . . 139
8.1.3 Crossed laser beams . . . . . . . . . . . . . . . . . . 141
8.1.4 Programmable pulse shaper . . . . . . . . . . . . . . 141
8.2 New experiments . . . . . . . . . . . . . . . . . . . . . . . . 142
8.2.1 Improving alignment . . . . . . . . . . . . . . . . . . 142
8.2.2 Combining alignment and orientation . . . . . . . . 143
8.2.3 Applications of alignment . . . . . . . . . . . . . . . 145
8.2.4 Alignment in the liquid phase . . . . . . . . . . . . . 146
8.3 Final words . . . . . . . . . . . . . . . . . . . . . . . . . . . 147

viii CONTENTS
A Molecular data 149A.1 Symmetric top molecules . . . . . . . . . . . . . . . . . . . 150A.2 Asymmetric top molecules of C2v-type . . . . . . . . . . . . 151A.3 Asymmetric top molecules of general type . . . . . . . . . . 152
B Laser beam parameters 153
C Dissociation probabilities of iodobenzene 157C.1 Dissociation probability and the Beer-Lambert law . . . . . 157C.2 Angular dependence of the dissociation . . . . . . . . . . . . 159
C.2.1 The n → σ? channel . . . . . . . . . . . . . . . . . . 160C.2.2 The π → π? channel . . . . . . . . . . . . . . . . . . 161
Summary 163
Bibliography 166

Preface
This thesis is submitted to the Faculty of Science at the University ofAarhus, in order to fulfill the requirements for the PhD degree. The workpresented in the thesis has been carried out in the years 2000–2004 inthe Femtogroup at the Department of Chemistry under the supervision ofHenrik Stapelfeldt.
Acknowledgements
That my five years in the femtogroup have been such an exciting experienceis largely due to the excellent people I have had the pleasure of workingwith. In my first experimental work I benefited greatly from collaborationwith Esben Skovsen, together with whom I enjoyed many cups of coffeeand hard rock working in the lab. Later I had a very fruitful teamworkwith Emmanuel Peronne. We were joined in our efforts by Christer Z.Bisgaard and Simon Viftrup. Together we have shared many late hoursof data acquisition and big boxes of candy. Recently I have also had thepleasure of working with Tine Ejdrup.
I also need to thank Jan Thøgersen for his invaluable help wheneverthe lasers behaved strangely. The mechanics workshop at the Departmentof Chemistry and Per Strand in particular have always been very helpful
ix

x Preface
designing ingenious technical solutions. Credits are also due to Jeppe Olsenand Tina D. Poulsen for helping me getting started with the polarizabilitycalculations.
Our collaborators abroad Tamar Seideman and Edward Hamilton aregratefully acknowledged for many fruitful and enlightening discussions.I am very grateful to Christer Z. Bisgaard for proofreading the entiremanuscript and giving numerous insightful comments. I am also very grate-ful to Tina D. Poulsen for improving my scientific English and correctingmy grammar.
I am deeply grateful to my supervisor Henrik Stapelfeldt, who has con-stantly helped and guided me through my years as a Ph.D. student. He isdefinitely a very recommendable supervisor.
Finally but definitely not the least I need to thank my children, Saraand Rasmus, for the unmeasurable joy they bring and my wife, Malene, forher constant love, patience, support, and a gentle push when needed.
Outline
Chapter 1: IntroductionIn the first chapter, I will motivate our work and explain why control ofmolecular motion is important. To bring our work into a broader context,other methods of controlling molecular rotation are briefly reviewed andcompared to our method, laser induced alignment.
Chapter 2: TheoryIn this chapter the molecular coordinates and the different types of align-ment are defined. The quantum mechanical theory of alignment and twoclassical theories applying to special cases are presented.
Chapter 3: Experimental SetupThis chapter gives a description of the experimental apparatus used in ourexperiments.
Chapter 4: Adiabatic alignment of iodobenzene – control of thephoto dissociationIn this chapter the photo dissociation of iodobenzene is explained in detailand our method for obtaining the 〈cos2 θ〉measure of alignment is described.
xi
xii Outline
Our results on adiabatic (long pulse) alignment and the use of alignmentto control the photo dissociation are presented.
Chapter 5: Non-adiabatic alignment – post pulse behaviorThis chapter deals with the short time alignment dynamics of iodobenzenemolecules subject to one or two short non-adiabatic alignment pulses. Thepresented results show how the alignment depends on the rotational tem-perature of the molecules and the intensity and duration of the alignmentpulse. Enhanced alignment obtained by using two rather than one align-ment pulse is demonstrated.
Chapter 6: Non-adiabatic alignment – rotational revivalsThis chapter is concerned with the alignment dynamics induced by a shortnon-adiabatic alignment pulse on a longer timescale. Rotational revivalspectra are presented for both symmetric and asymmetric top molecules.
Chapter 7: Combining adiabatic and non-adiabatic alignmentIn this chapter the alignment obtained with a long (adiabatic) pulse is com-pared to the alignment obtained with a short (non-adiabatic) pulse. It isshown that by combining adiabatic and non-adiabatic pulses the inducedalignment is enhanced beyond the alignment obtained with either pulsealone.
Chapter 8: OutlookThis last chapter is concerned with our future research in the field of laserinduced alignment.

xiii
AppendicesAppendix A: Molecular data lists relevant data for the molecules studied inthe experiments.Appendix B: Laser beam parameters describes how the various laser beamparameters are defined and how we measure them.Appendix C: Dissociation probabilities of iodobenzene presents the math-ematical derivation of the expressions for the dissociation probabilities ofiodobenzene used in chapter 4.

xiv Outline

Chapter 1
Introduction
1.1 Why control molecular orientation?
Controlling the orientation of molecules in space has been a long standinggoal in spectroscopy as well as in chemistry in general.
The crucial role of molecular orientation in chemistry is readily under-stood by looking at a basic chemical reaction such as the SN2 reaction1[8]between OH− and CH3Br shown in fig. 1.1. When separated by long dis-tances the reagent molecules are two separate entities (fig. 1.1 a). However,if the molecules come close enough they might start to react and form atransition state (fig. 1.1 b). From the transition state the reaction can pro-ceed to form the product molecules, in this case CH3OH and Br− (fig. 1.1 c).
From the example shown in fig. 1.1 it is evident that for a chemicalreaction to occur, the distance between the molecules must be small enough.Besides distance the relative orientation of the reagent molecules is alsocrucial for the probability that a transition state is formed. In the example,
1SN2 stands for nucleophilic substitution reaction of 2nd order
1

2 Introduction
Figure 1.1: The chemical reaction between OH− and CH3Br forming CH3OHand Br−. a) The reagent molecules, b) transition state, c) product molecules.
OH− must approach CH3Br with the O atom first and react opposite theBr atom. This dependence on the relative orientation is not restricted toSN2 reactions but is a general feature of almost all chemical reactions.2 Inmany cases the relative orientation also determines which transition stateis formed and thus which chemical reaction will occur.
Replacing one of the two reagent molecules in the chemical reaction withone or more photons, the reaction becomes photochemistry or spectroscopy.In this case the relative orientation of the reagents, ie. the polarization ofthe photon(s) relative to the orientation of the molecule is also impor-tant. The probability of the different processes that can occur: absorption,Raman-scattering, multi-photon ionization, etc. all depend on the relativeorientation of molecule and photon polarization.
Different types of absorptions may depend differently on the molecularorientation, as for example parallel and perpendicular electronic transitionsin a linear molecule. A means to control molecular orientation can thus beused to favor one absorption channel against another. If the absorptionleads to bond breakage, it is called a photochemical reaction, the controlof molecular orientation is therefore a means to control photochemical re-
2The only exception is the combination of two atomic species to form a diatomic
molecule

1.2 Methods to control molecular orientation 3
actions.
For many spectroscopic methods a uniform distribution of moleculesblurs or hides information about the molecular structure that would beobtainable if the molecules had a specific orientation in space. An exampleis photo electron spectroscopy. The trajectories of electrons ejected from amolecule reveal information about the structure of the molecular orbitals.However, if the molecules are uniformly distributed, orientational averagingconceals the effect.
1.2 Methods to control molecular orientation
There are many ways to control the (translational) motion and orientation(rotational motion) of molecules.
One obvious way to control molecular motion is to crystallize the samplethereby severely confining both the translational and rotational degrees offreedom. Using x-ray diffraction the fixed molecular orientation in a crystalcan be used to gain information about the molecular structure, a techniqueknown as crystallography.
If the goal is control of bimolecular chemical reactions such as the oneshown in fig. 1.1 the most applicable method to control molecular motionis attachment to a surface. Besides fixing the translational motion attach-ment to a surface usually causes all the molecules to have the same specificorientation relative to the surface. The surface may be a metal catalyst, apolymer or a boundary between two liquid phases.
Crystallization or surface attachment drastically change the spectro-scopic properties of molecules. For spectroscopy one often wish a moleculeto remain free of external perturbations while controlling the orientation.To put our work on laser induced alignment of molecules into a broader con-

4 Introduction
text, I will briefly review the related methods of controlling the rotationalmotion of free molecules. The orientation of free molecules can be con-trolled either through an applied external field or through collision inducedalignment.
1.2.1 Orientation and alignment by electric field
The most common method of controlling the orientation of free moleculesis to use an external electric3 field. An applied electrical field interacts withthe dipole or induced dipole moments of the molecule.
The effect of an external electric field on molecules with a permanentdipole moment is illustrated in fig. 1.2. The applied field induces a torqueon the polar molecules (fig. 1.2 a). If the induced torque is large enough toovercome the rotational energy of the molecules, the molecules are orientedalong the direction of the electric field (fig. 1.2 b). An applied field canalso affect molecules without a permanent dipole moment. If the field isstrong enough it induces a dipole moment in the molecules and cause theinduced dipoles to align along the field direction. In this case there is noup-down selection, only confinement of a molecular axis, and we use theterm alignment instead of orientation (fig. 1.2 c).
The external electric field can be supplied either from electrodes withan applied DC or AC voltage or from a laser pulse. It is also possible tocombine the two. The methods using charged electrodes include brute forceorientation, hexapole focusing, and AC electrokinetics. The methods usinglaser fields include resonant and nonresonant laser induced alignment andoptical spanner and tweezers.
3In principle a magnetic field could also be used. Magnetic forces are however for
most molecules far too weak to be useful in practice

1.2 Methods to control molecular orientation 5
Figure 1.2: a) Molecules with a permanent dipole moment placed in an externalfield will experience a torque. b) The torque causes the molecules to orient accord-ing to the field. c) Molecules can also be aligned via an induced dipole momentcreated by the applied field, in this case there is no up-down selectivity
Brute force orientation
“Brute force orientation” experiments utilize a pair of highly charged ca-pacitor plates with a narrow spacing between them[9]. The electric fieldsaffects molecules with permanent dipole moments as illustrated in fig. 1.2.Typical field strengths are 10-20 MV/m and the generated fields are tooweak to align via an induced molecular dipole moment. If the interac-tion between the permanent dipole moment and the static field is strongenough to overcome the rotational motion, the molecules will orient alongthe direction of the electric field. To obtain significant orientation at therelatively modest field strengths available, the molecules have to be cooledto a rotational temperature of a few Kelvin. Therefore a supersonic ex-pansion is used to create a beam of cold gas phase molecules[10], whichis directed between the capacitor plates. The important parameters forobtaining well oriented molecules are: Low rotational temperature, highelectric field strength and high molecular dipole moment.
The degree of orientation achieved in brute force experiments is rela-tively weak. Kong and coworkers calculated that for ICN molecules rota-

6 Introduction
tionally cooled to 1.5 K subject to an orientation field of 5 MV/m 84% will“point the right way”, be within 90◦ of the field axis and 40% will be within45◦ of the field axis[11] (for a uniform molecular distribution 15% is within45◦ of a given axis)
Kong and coworkers used brute force orientation to find the directionof transition dipoles by polarization spectroscopy[12, 13]. Molecules weredissociated by a laser pulse polarized either parallel or perpendicular tothe external field. The ratio of the photoproduct yields with parallel andperpendicular polarizations (the polarization ratio) was measured. Thepolarization ratio can be translated to an angle between permanent dipoleand transition dipole given that the distribution of molecular orientationsis known.
Hexapole focusing
Besides creating a uniform linear electric field between two capacitor platesother electrode configurations resulting in inhomogeneous electric fields arealso useful for orientation. One common configuration is the hexapole,which consists of six circular rods placed in a hexagon and charged withvoltages that alternate in sign (see fig. 1.3).
Hexapole focusing is applicable to symmetric tops, asymmetric topswith a dipole moment along the A or C axis, linear polyatomic molecules ex-cited in bending vibrations, and diatomics with electronic angular momentum[14].
A molecular beam originating from a supersonic expansion is travellingdown the center of the hexapole. Some of the molecules will follow thecenterline closely (fig 1.3 i). These molecules are usually blocked. Moleculeswhich initially diverge from the centerline with a small angle are affectedby the inhomogeneous field. Symmetric top molecules with KM < 0 areattracted towards the centerline. The “half wavelength” of the trajectories
1.2 Methods to control molecular orientation 7
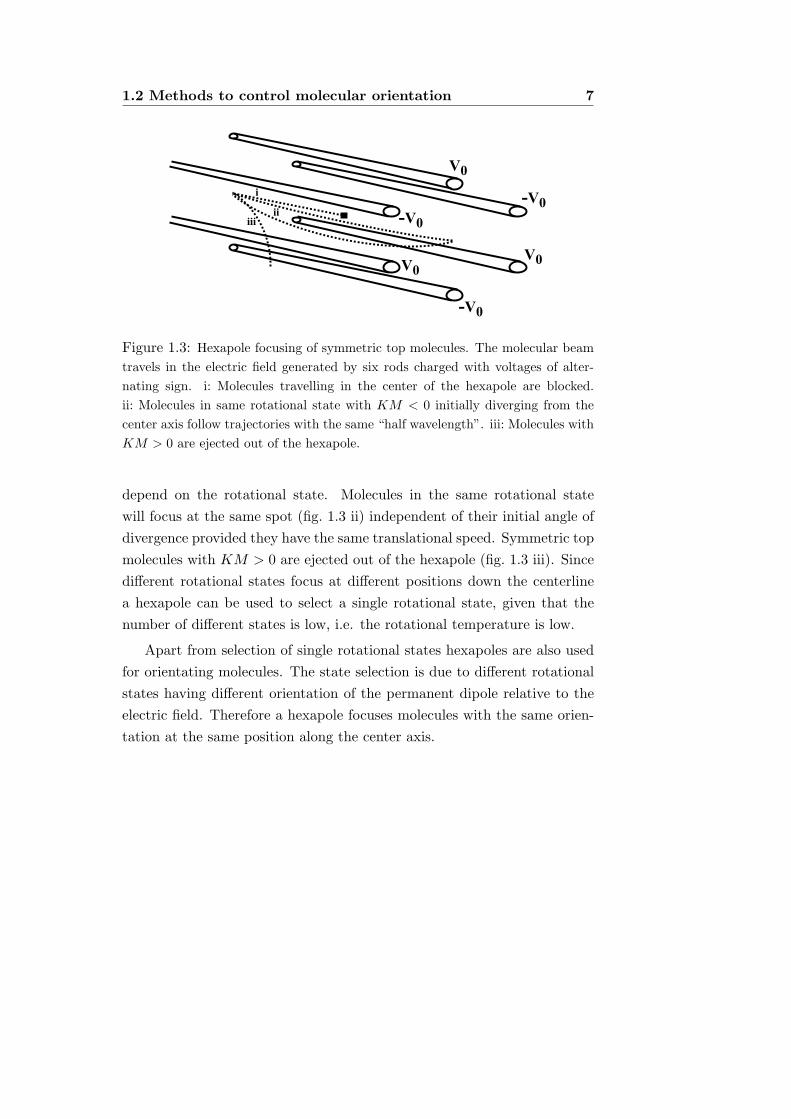
Figure 1.3: Hexapole focusing of symmetric top molecules. The molecular beamtravels in the electric field generated by six rods charged with voltages of alter-nating sign. i: Molecules travelling in the center of the hexapole are blocked.ii: Molecules in same rotational state with KM < 0 initially diverging from thecenter axis follow trajectories with the same “half wavelength”. iii: Molecules withKM > 0 are ejected out of the hexapole.
depend on the rotational state. Molecules in the same rotational statewill focus at the same spot (fig. 1.3 ii) independent of their initial angle ofdivergence provided they have the same translational speed. Symmetric topmolecules with KM > 0 are ejected out of the hexapole (fig. 1.3 iii). Sincedifferent rotational states focus at different positions down the centerlinea hexapole can be used to select a single rotational state, given that thenumber of different states is low, i.e. the rotational temperature is low.
Apart from selection of single rotational states hexapoles are also usedfor orientating molecules. The state selection is due to different rotationalstates having different orientation of the permanent dipole relative to theelectric field. Therefore a hexapole focuses molecules with the same orien-tation at the same position along the center axis.

8 Introduction
An example of the use of hexapole orientation is the work of Harland andBrooks[15], in which they bombarded hexapole orientated CF3Br moleculeswith alkali metal atoms to study the orientational dependence of the elec-tron transfer from the atoms to CF3Br.
AC electrokinetics
If the subject of interest is macromolecules or micrometer particles in solu-tion rather than single gas phase molecules, AC fields are normally used. Ina DC field any net charge of the molecule or particle will attract the subjectto one electrode (electrophoretic force)[16]. A common method for aligningand stretching macromolecules or particles is to use an inhomogeneous fieldcreated by an array of electrodes with an applied AC voltage, a techniqueknown as dielectrophorese. The AC field interacts with the polarizability ofthe subject to create an induced dipole which is aligned in the eletric field.Since the polarizability for micrometer sized objects is much larger than forsingle gas phase molecules the interaction can be strong enough to producea significant effect even for field strengths on the order of 0.1–1 MV/m.
Dielectrophorese has been used to stretch DNA molecules to ∼15 µm(∼70% of their full elongated length)[17]. The DNA molecules were at-tached at one end to an array of 20 µm gold electrodes and an AC electricfield of 0.2–0.8 MV/m with a frequency of 100–1000 kHz was applied. Atlower frequencies electrophoretic forces cause fluid flow and electrothermalreactions. At higher frequencies the reorientation of the induced dipoleon the DNA starts lagging behind the switch in the electric field sincethe magnitude of the induced dipole moment for the very non-rigid DNAmolecules depend on nuclear displacement along a vast number of inter-nal coordinates. Weaker fields are not sufficient to overcome the thermalrandomization and stronger fields cause electrophoretic forces to dominate.

1.2 Methods to control molecular orientation 9
Laser induced alignment
Electrode generated electric fields rarely exceeds 20 MV/m[9]. The elec-trical field strength at the focus of a pulsed laser can however be muchhigher – a moderately high laser intensity of 1012 W/cm2 corresponds toa field strength of 3 GV/m. The oscillatory nature of the laser field pre-vents molecules from orienting via their permanent dipole moment but ifthe field is non-resonant with absorptions in the molecules, the field alignsthe molecules through an induced dipole moment. Since non-resonant laserinduced alignment is the subject of the rest of this thesis I will not elaboratefurther here but move on to the case where the laser field is resonant withabsorption.
Transition dipole moments depend on the orientation of the moleculewith respect to the polarization of the exciting pulse. Therefore, absorptionof polarized light generates an anisotropy in the distribution of orientationsboth in the initial (ground) state and the excited state of the molecule. Thealignment obtained through a resonant transition is weak compared to thealignment achievable through non-resonant alignment.
If the alignment is induced by a short laser pulse, both resonant and non-resonant alignment can be used for time-resolved rotational spectroscopy.This type of spectroscopy, known as Rotational Coherence Spectroscopy(RCS)[18, 19], is discussed in chapter 6.
Alignment can also be induced in a liquid. Since a liquid cannot becooled below the freezing point and stay liquid, rotational temperaturesare high and alignment effects correspondingly weak. The induced align-ment is however strong enough to induce a measurable birefringence of theliquid, known as the optical Kerr effect[20]. The decay rates of the inducedbirefringence contain information about the molecular dynamics of the so-lution or pure liquid. Time resolved optical Kerr effect studies are useful

10 Introduction
for testing the validity of models for solvent-solute interactions[21, 22].
Optical tweezers and optical spanner
When the subject of interest is macromolecules the laser analogs to di-electrophorese are the optical tweezers and the optical spanner describedbelow.
In the case of the optical tweezers the inhomogeneous electric field of afocused laser beam creates a gradient force towards the center of the focus.A small object such as a polystyrene bead will therefore follow a slowlymoving laser focus, thereby the name: optical tweezers. By attaching abead to one end of a protein, the motion and stretching of the protein canbe studied by moving the laser focus[23, 24].
Circularly polarized light can make small objects (such as a 2 µm Teflonparticle) rotate due to the spin angular momentum of the photons, thisis known as the “optical spanner”. Changing the laser mode from theusual plane wave front to a helical ‘corkscrew-shaped’ wave front createsorbital angular momentum, which can add to or cancel the spin-angularmomentum, causing the objects to rotate faster or stop rotating[25].
Whereas the optical tweezers are a widely used tool for studying cellularbiology the optical spanner has so far only been sparsely used. A searchon the Web of Science yields 739 hits on “optical tweezers” and only sevenhits on “optical spanner”.
1.2.2 Collision induced alignment
Supersonic expansion of a gas into vacuum through a narrow nozzle isvery useful as a source of translationally and rotationally cold molecules.Besides a general lowering of the rotational temperature a supersonic ex-

1.3 Advantages and disadvantages of laser induced alignment 11
pansion sometimes also causes molecular alignment. In 1974, Zare andcoworkers[26] showed experimentally that Na2 molecules emerging from asupersonic expansion preferred rotation about an axis perpendicular to thebeam axis, corresponding to alignment of the molecular bond axis alongthe beam direction. Other molecules have also been observed to exhibitcollision induced alignment. Pirani et. al[27] showed that planar moleculessuch as benzene prefer to travel as a frisbee, ie. with the molecular planeparallel to the beam axis.
1.3 Advantages and disadvantages of laser induced
alignment
Before moving on to discuss the theoretical and experimental details ofour experiments. I will briefly address the advantages and disadvantagesof laser induced alignment of gas-phase molecules compared to the othermethods of orientation and alignment of free molecules presented.
As stated in the previous section the alignment induced by non-resonantlaser pulse is stronger than alignment induced by a resonant pulse. Collisioninduced alignment is usually only observed to a significant degree in thevery center of the molecular beam, which means that severe skimming ofthe beam must be done, resulting in loss of sample. Even with severeskimming the observed degrees of alignment are much weaker than what isobtainable through laser induced alignment.
Non-resonant laser induced alignment is a very general method appli-cable to all molecules, except spherical tops. Unlike brute force orienta-tion and hexapole focusing no permanent dipole moment is required. Fur-thermore, the confinement of molecular axes achievable with laser inducedalignment is much narrower than what can be achieved through brute force

12 Introduction
orientation or hexapole focusing.There are some problems extending laser induced alignment to really
big molecules. As mentioned in the previous section the induced dipolemoment of DNA molecules starts lagging behind the oscillations of thefield when the frequency exceeds ∼1 GHz. Therefore the near-infraredwavelengths used in this thesis are not suitable for alignment of very bignon-rigid molecules.
Unlike static fields laser induced alignment does not distinguish be-tween ‘heads’ and ‘tails’ of the molecules, therefore some authors claimthat “alignment experiments miss the main steric effect”[14]. However,when the aligned molecules are subject to some kind of polarized lightpulse of few or more optical cycles, the oscillatory nature of the light willaverage out any ”heads vs. tails” orientation – this is the case in most spec-troscopic applications, such as the polarization experiments by Kong andcoworkers[12]. These experiments could just as well have been performedon aligned rather than oriented molecules, in fact the narrower confinementavailable in alignment experiments would result in higher polarization ra-tios. Apart from special cases such as nonlinear processes due to half cyclepulses, the situations in which “heads vs. tails” orientation are important,are bimolecular reactions such as the example of electron transfer betweenCF3Br and alkali atoms.
In conclusion non-resonant laser induced alignment is the preferablemethod whenever a narrow confinement of molecular axes is wanted with-out the need of “heads vs. tails” orientation. In this thesis laser inducedalignment is demonstrated using either a long (adiabatic) pulse, one or twoshort (non-adiabatic) pulses, or a long and short pulse combined.
Chapter 2
Theory of alignment
2.1 Definition of Alignment
Alignment is the confinement of one or more molecular axes to labora-tory fixed axes. The situation is illustrated in fig. 2.1 for iodobenzenemolecules. Confinement of one molecular axis is called linear or 1-D align-ment (fig. 2.1 b). If two axes of a rigid molecule are confined, the third axisis necessarily also confined, this is known as 3-D alignment (fig. 2.1 c).
2.1.1 Molecular coordinates
To be more quantitative than the pictorial presentation of fig. 2.1 it is nec-essary to define which molecular axes are confined and how well. For thatmolecular coordinates and the transformation to laboratory fixed coordi-nates must be introduced.
As explained in sect. 2.2 laser induced alignment is due to an interac-tion with the polarizability of the molecule. The molecule fixed coordinatesystem is therefore defined so that the polarizability tensor is diagonal,
13

14 Theory of alignment
Figure 2.1: Alignment of iodobenzene molecules. a) Uniform distribution. b) Lin-ear alignment: The C–I bond axis is confined to the vertical axis, the molecularplane is free to rotate. c) 3-D alignment: The molecule is confined in all threedimensions.
αmol =
αxx 0 00 αyy 00 0 αzz
. (2.1)
For linear and symmetric top molecules the symmetry axis is the moleculefixed z-axis. For asymmetric top molecules the major axis of polarizabilityis the z-axis. Transformation from molecule fixed (x,y,z) to laboratory fixed(X,Y,Z) coordinates can be done with the unitary Euler angle transforma-tion matrix[28], Φ,

2.1 Definition of Alignment 15
X
Y
Z
= Φ−1
x
y
z
Φ−1 = ΦT
Φ(θ, φ, χ) =
cφcθcχ− sφsχ sφcθcχ + cφsχ −sθcχ−cφcθsχ− sφcχ −sφcθsχ + cφcχ sθsχ
cφsθ sφsθ cθ
.
(2.2)
In eq.2.2 cos and sin are abbreviated to c and s respectively. The definitionof the (θ, φ, χ) Euler angles is illustrated in fig. 2.2. θ ∈ [0, π) is the anglebetween the molecule fixed z-axis and the space fixed Z-axis, φ ∈ [0, 2π) isthe angle of rotation of the z-axis around the Z-axis and χ ∈ [0, 2π) is theangle of rotation of the molecule around the z-axis.
The distribution of orientations, fmol, of a non-linear molecule is ingeneral a function of all three Euler angles. The χ angle has no meaning forlinear molecules. For a uniform distribution of all angles, fmol(θ, φ, χ) = 1
8π2
(for a linear molecule fmol(θ, φ) = 14π ). The distribution of a given angle is
obtained by integrating over the other angles,
fmol(θ) =∫ 2π
0
∫ 2π
0fmol(θ, φ, χ)dχdφ. (2.3)
2.1.2 Linear alignment
In the case of linear or 1-D alignment the molecule fixed z-axis is confinednear the laboratory fixed Z-axis, which is equivalent to a localization in theθ-angle close to 0 and π. A commonly used measurement of the degree oflinear alignment is the average value of cos2 θ[29], 〈cos2 θ〉, defined as

16 Theory of alignment
Figure 2.2: Euler angles illustrated with an iodobenzene molecule. θ is the anglebetween the molecule fixed z-axis and the space fixed Z-axis, φ is the angle ofrotation of the z-axis around the Z-axis, and χ is the angle of rotation around thez-axis.
〈cos2 θ〉 =∫ π
0cos2 θfmol(θ) sin θdθ. (2.4)
A uniform distribution has 〈cos2 θ〉 = 13 . A distribution of aligned
molecules has 〈cos2 θ〉 > 13 . 〈cos2 θ〉 < 1
3 is referred to as “planar delocalization”[30]or “anti-alignment”[31], the latter is in a way a misnomer since the moleculesare still aligned, as the molecular z-axis is now confined to the lab-fixed(X,Y)-plane.
The 〈cos2 θ〉measure is used throughout this thesis but it is by no meansthe only way to measure linear alignment. Other measures such as theaverage value of cos θ to any even order or the percentage of molecule withina cone of a given angle could also be used. The molecular distribution in theθ-angle, fmol(θ), is not uniquely defined by 〈cos2 θ〉. Two different angular

2.1 Definition of Alignment 17
distributions may have the same 〈cos2 θ〉 as illustrated for two distributionsof aligned I2 molecules in table. 2.1. Which molecular distribution is deemedmost aligned thus depend on which measurement is chosen.
Rotational temp. Trot = 1.4 K Trot = 4 K UniformIntensity I0 = 2× 10¹¹ W/cm2 I0 = 5× 10¹¹ W/cm2 distribution〈cos2 θ〉 0.75 0.75 1/3
Within 15◦ cone 25.1% 28.7% 3.4%Within 30◦ cone 63.6% 63.4% 13.4%Within 60◦ cone 94.0% 93.2% 1/2
Table 2.1: Calculated molecular distribution of I2 molecules subject to adiabaticalignment.
2.1.3 3-D alignment
In the case of 3-D alignment all three principal axis of the molecule are con-fined in space. Therefore both fmol(θ), fmol(φ), and fmol(χ) are localized.So far there is only a few papers concerned with 3-D alignment[32, 33], andthere is no commonly used measure as for linear alignment. For planarmolecules one obvious choice would be to use 〈cos2 θ〉 as a measure of theconfinement of the major axis and measure the alignment of the molecularplane as 〈cos2 γ〉, with γ being the angle between the vector ~n perpendicu-lar to the plane (eq. C.6) and the laboratory fixed X-axis. This measure isused in [33].

18 Theory of alignment
2.2 Quantum Mechanical theory of alignment
An external electric field changes the environment of a molecule. Expandingthe energy in a power series of the electric field the Hamiltonian becomes[34]
H = H0 − ~µ · ~E − 12
~Eα~E + . . . , (2.5)
where H0 is the field free Hamiltonian, ~E is the electric field vector, ~µ
is the permanent dipole moment, and α is the polarizability tensor. Theinteraction between the field and permanent dipole moment is the term−~µ · ~E in eq. 2.5. The interaction between field and induced dipole momentis −1
2~µind · ~E = −12~Eα~E.
If an electric field of a laser pulse with a duration longer than a fewoptical cycles (τpulse À ν) is considered, averaging over the optical periodwill quench interaction with the permanent dipole moment and higher mo-ments that interact with odd orders of E. Assuming a linear polarized fieldand averaging over an optical period ~Eα~E can be replaced by 1
2~ε(t)α~ε(t),where ~ε(t) is the pulse envelope. Higher order (4th,6th,. . . ) interactionsare negligible at field strengths below the onset of multi photon ionization.The interaction with the laser field can thus be written as
Hint = −14~ε(t)Φ−1αmolΦ ~ε(t). (2.6)
In eq. 2.6, the polarizability tensor in laboratory fixed coordinates, α, hasbeen replaced by its diagonal expression in molecular coordinates, αmol,(eq. 2.1). The Φ-matrix (eq. 2.2) transforms from laboratory to moleculefixed coordinates.

2.2 Quantum Mechanical theory of alignment 19
2.2.1 Angular dependence of the interaction
It is the angular dependence of the interaction between field and polariz-ability that is the cause of alignment.
For a linearly polarized laser field it is customary to choose the labo-ratory fixed Z-axis as the field axis, ~ε(t) = ε(t)(0, 0, 1). Depending on thesymmetry of the molecule different expressions for Hint are obtained fromeq. 2.6, see table 2.2.
Molecular Eigenfunctions Hint = Conditions for
symmetry φ < φ2 |Hint |φ1 >6= 01
Linear | JM > − 14ε2( (α‖ − α⊥) cos2 θ + α⊥) ∆M = 0, ∆J = 0,±2
Symmetric top | JKM > ∆M = 0, ∆K = 0
α‖ = αzz , α⊥ = αxx = αyy ∆J = 0,±12,±2
Asymmetric top − 14ε2( αzx cos2 θ+ ∆M = 0,
of C2v type | JτM >= αyx sin2 θ sin2 χ + αxx ) ∆K = 0,±2∑cK | JKM > ∆J = 0,±1,±2 3
General K αzx = αzz − αxx ∆M = 0
asymmetric top αyx = αyy − αxx ∆K = 0,±1,±2
∆J = 0,±1,±2 3
Table 2.2: Hint and selection rules for a linear polarized field.
Note that the projection of the angular momentum on the laboratoryfixed Z-axis, the M quantum number, is always conserved.
Linear molecules
For linear molecules α‖ > α⊥. From table 2.2 it is seen that the energy isminimized at θ = 0 and θ = π. The effect of the field is thus a torque onthe molecules towards θ = 0 and θ = π, causing alignment.
1Selection rules for a rotational Raman transition. See [3, 33]2If K 6= 0.3In the basis of symmetric top eigenstates

20 Theory of alignment
Symmetric top molecules
Since Hint is the same as for linear molecules, prolate symmetric top molecules(α‖ > α⊥) will align like linear molecules. For oblate symmetric topmolecules (α‖ < α⊥) in a linear field, the energy is minimized at θ = π
2 ,which means that the symmetry axis is confined to the plane perpendicularto the field axis. Oblate symmetric top molecules are thus not effectivelyaligned in a linear field (the symmetry axis is only confined to a plane andnot to an axis). Using two perpendicular linear polarized fields or a circu-lar polarized field the symmetry axis of an oblate symmetric top is alignedtowards the third axis (the beam axis of a circular polarized beam), sincethe energy is minimized when the symmetry axis is perpendicular to bothfield axes.
The circular symmetry of the polarizability means that 3-D alignmentis not possible for symmetric tops.
Asymmetric top molecules
The angular confinement achieved for asymmetric top molecules subject tolinear or elliptical fields are illustrated in fig. 2.3, which shows a calculationof fmol of aligned 3,4-dibromothiophene molecules.
For asymmetric top molecules subject to a linear field the energy isminimized at θ = 0 and θ = π, which means the major axis of polarizability,the z-axis, aligns along the field axis. Hint also depends on the χ-angle.This χ-angle dependence causes molecules that are not perfectly aligned inthe θ-angle to rotate to minimize the angle between the second principalaxis of polarizability and the field axis corresponding to a localization inthe χ-angle (fig. 2.3 LP). For iodobenzene molecules, this means that theaxis perpendicular to the plane is localized perpendicular to the alignment

2.2 Quantum Mechanical theory of alignment 21
Figure 2.3: fmol(θ), fmol(φ), and fmol(χ) of 3,4-dibromo thiophene subject toan alignment field with linear (LP), circular (CP), or elliptical (EP) polarization.Reprinted from [32].
field axis.If the alignment field has circular polarization the minor axis of polar-
isability will align along the laser beam axis as for oblate symmetric tops.In this case there will also be a localization in the χ-angle (fig. 2.3 CP).
If the alignment field has elliptical polarization[32], or consist of twoperpendicular linear fields[33], 3-D alignment of asymmetric top moleculescan be achieved. Averaging over an optical period, the interaction with thelaser field can be expressed as
Hint = −14
(~εX(t)Φ−1αmolΦ ~εX(t) + ~εY (t)Φ−1αmolΦ ~εY (t)
), (2.7)
where ~εX(t) and ~εY (t) are the field envelope along the X and Y coordinatesrespectively.
The energy is minimized when the major axis of polarizability is aligned

22 Theory of alignment
along the major axis of the field and the minor axis of polarizability isaligned perpendicular to the field, corresponding to a confinement of allthree Euler angles (fig. 2.3 EP).
2.2.2 Time dependence of the interaction
Since αmol is constant for rigid molecules the time dependence of Hint
is determined by the time dependence of ε(t). If ε(t) is varying slowlycompared to molecular rotation, i.e. the pulse duration of the alignmentpulse is longer than the rotational period of the molecules, the field can betreated as constant in time. This is the adiabatic alignment regime. Theother situation, in which the alignment pulse duration is shorter than therotational period of the molecules is the non-adiabatic alignment regime.Non-adiabatic alignment can also result from fast truncation of a slow (adi-abatic) pulse[35, 36].
Adiabatic alignment
The word adiabatic in this context means that each field-free eigenstateprogress to an eigenstate of the field-on Hamiltonian: H0+Hint. Uponadiabatic (i.e. slow) field turn-off each molecule returns to its original fieldfree eigenstate[37].
A calculation of adiabatic alignment of I2 molecules is shown in fig. 2.4.The initial uniform distribution has 〈cos2 θ〉 = 1/3. The degree of alignmentfollows the shape of the alignment pulse and peaks at the peak of thealignment pulse. When the alignment pulse is over the original uniformdistribution is recreated.
From fig. 2.4 it is clear that a low rotational temperature corresponds toa high degree of alignment. The obtained degree of alignment is obviously

2.2 Quantum Mechanical theory of alignment 23
Figure 2.4: Calculation of adiabatic alignment of I2 molecules resulting from alinear polarized pulse peaking at t = t0 with a duration of 3.5 ns. The differentcurves correspond to different rotational temperatures. Reprinted from [38].
also dependent on the intensity of the alignment pulse – a higher intensitycorresponds to a higher degree of alignment. The limit to the intensity is theonset of multi photon ionization. The third parameter that determines howwell the molecules align is the anisotropy of the molecular polarizability.
Non-adiabatic alignment
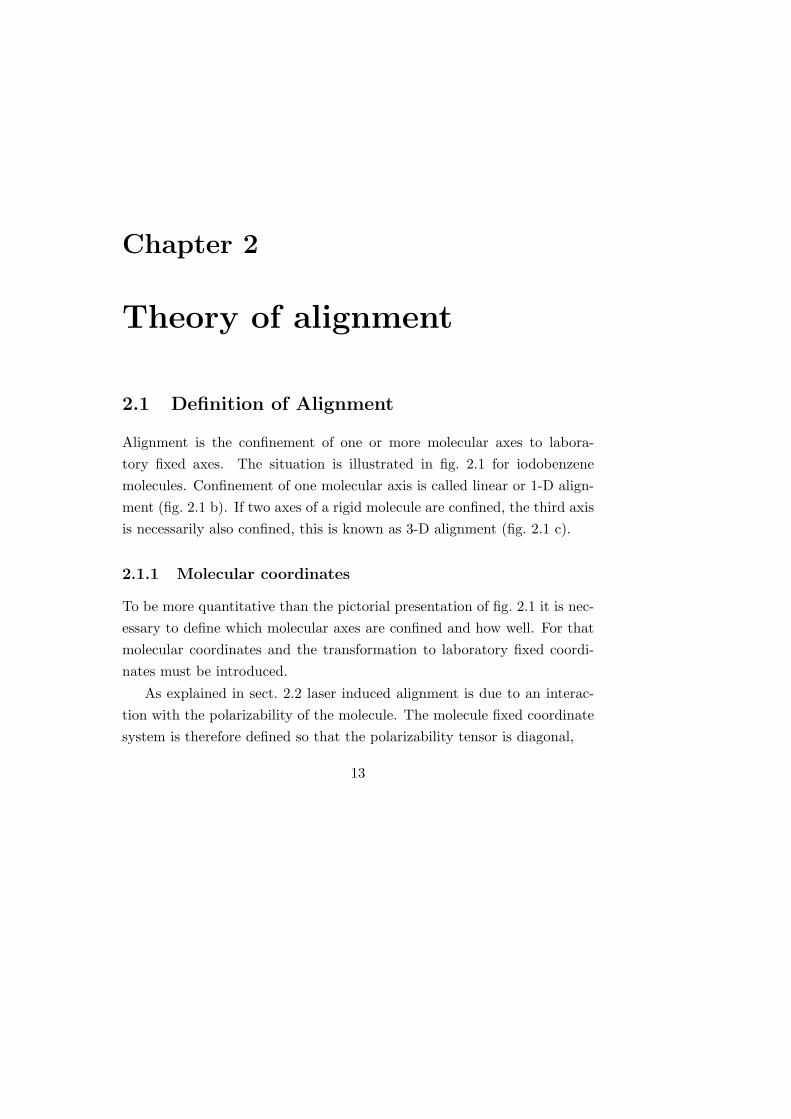
Non-adiabatic alignment can be viewed as a sequence of rotational Ramantransitions (illustrated for a linear molecule in fig. 2.5). Each Raman cycleis limited by the selection rules of a pure rotational Raman transition (ta-ble 2.2 for linear fields). In a typical alignment experiment the moleculesundergo 10–100 cycles and the resulting wave packet can be very broad[3].
Unlike the adiabatic case the induced non-adiabatic alignment does not
24 Theory of alignment
Figure 2.5: Linear non-adiabatic alignment of a linear molecule initially in the|JM >=|4 2> state. Each Raman cycle broadens the wave packet.
follow the shape of the alignment pulse. A typical development of 〈cos2 θ〉induced by a linearly polarized non-adiabatic alignment pulse is shownin fig. 2.6. The alignment peaks after the peak of the alignment pulse(fig. 2.6 a) and if the pulse turn-off is sufficiently short the molecules arealigned without the presence of an electric field – field free alignment. Theobtained degree of alignment is, like the adiabatic case, dependent on therotational temperature, anisotropy of molecular polarizability, and intensityof the alignment pulse; but now additional parameters such as the shapeand duration of the alignment pulse are also important.
After the peak 〈cos2 θ〉 will drop, go through a few damped oscillationsand stabilize at a permanent value between 1/3 and 1/2[39, 5].
This permanent alignment can be explained with a classical argument inthe following way: For the molecules to align along the field axis they mustnecessarily rotate about an axis perpendicular to the field axis. When thealignment pulse is over, there are no other forces that can move the axis

2.2 Quantum Mechanical theory of alignment 25
Figure 2.6: Typical development of 〈cos2 θ〉 in a non-adiabatic alignment exper-iment. a) On a short timescale 〈cos2 θ〉 (grey curve) peaks after the peak of thealignment pulse (black curve) and goes through a few damped oscillations. b) Ona longer timescale rotational revivals occur with regular intervals.
of rotation, which means that the rotation axis is permanently confinedto the plane perpendicular to the alignment axis. The probability for amolecule to have a θ-angle close to 0 or π is therefore higher than for auniform distribution. If the axis of rotation is completely confined to theplane perpendicular to the field axis for all molecules then 〈cos2 θ〉 = 1/2.
From a quantum mechanical viewpoint the permanent alignment can beexplained from the composition of states in the wave packet. As illustratedin fig. 2.5 the conserved M quantum number restricts the possible valuesof J downwards since J ≥ M . J is however not restricted upwards andthe effect of the Raman-cycles is an increase of the average value of J , 〈J〉.Since J is the quantum number of the total angular momentum and M
is the projection on the field axis, increasing J while keeping M constantcorresponds to moving the rotation axis towards the plane perpendicularto the field axis[5].
On a longer timescale (fig. 2.6 b) transients in 〈cos2 θ〉 are observed.These transients are known as rotational revivals of alignment. The ro-

26 Theory of alignment
tational revivals appear because the rotational eigenstates comprising thewave packet rephase. Considering the simple case of a linear molecule theenergies of the rotational eigenstates are all multiples of 2B, with B beingthe rotational constant. As a result rotational revivals for a linear moleculeoccur at times that are integer multiples of 1/2B.
2.2.3 Methods of calculation
Numerical calculations of molecular alignment range from relatively simplecalculations to quite complicated cases depending on the duration of theinteraction, the polarization of the field, and the symmetry of molecule.
An adiabatic alignment calculation comes down to solving the time in-dependent Schrodinger equation, i.e. finding the eigenstates of the Hamil-tonian H0 + Hint[29]. In the case of non-adiabatic alignment the timedependent Schrodinger equation must be solved. Here, it is advantageousto split the calculation in two parts: An interaction part and a field freepropagation[3].
A linear field is easier to handle than an elliptical field, as Hint is simplerand more selection rules are imposed (see table 2.2). The M quantumnumber is always conserved for linear fields.
Hint for linear and symmetric top molecules only depends on the θ-angle. A calculation can be done in the basis of field free eigenfunc-tions. The interaction conserves the K quantum number (for symmetric topmolecules) and thus only mixes states with different J quantum number.
Asymmetric top molecules can be divided into two groups: Moleculesbelonging to the pointgroups D2, C2v, or D2h and molecules belonging toother pointgroups (C1, CS , Ci, C2, or C2h). The first group of moleculeshas coinciding principal axes of polarizability and inertia due to symmetry.I will refer to these molecules as C2v-type asymmetric tops, since C2v is a

2.2 Quantum Mechanical theory of alignment 27
subgroup of D2h and very few molecules belong to D2.
The coincidence of polarizability and inertia molecular coordinates sim-plifies calculations on the C2v-type asymmetric tops. For asymmetric topsin linear fields the interaction is most easily treated in the basis of symmet-ric top eigenfunctions. The coupling terms then have analytical expressionsand are limited by selection rules. In a calculation of non-adiabatic align-ment the subsequent field free propagation is then handled by projectionback onto the basis of asymmetric top eigenfunction[3].
The simplest calculation is thus adiabatic alignment of a linear or sym-metric top molecule, for which the solutions are known as pendular states.Furthermore 〈cos2 θ〉 of pendular states can be found directly from theeigenvalues (the energies) without calculation of the eigenfunctions (fmol(θ))using the Hellman-Feynman theorem[29, 40]. A calculation of 〈cos2 θ〉 istherefore not very time consuming and can be done quickly on a standardPC.
Calculations of non-adiabatic alignment are more time consuming, espe-cially for asymmetric top molecules, where the created wave packets consistof a very large number of states[3].
A simple way of calculating non-adiabatic alignment was proposed byLeibscher, Averbukh, and Rabitz[41, 42] (for linear alignment of a linearrotor). They assumed that the alignment pulse was very short comparedto molecular rotation, and the molecules therefore could be assumed to befrozen during the interaction with the short ‘δ-kick’ pulse. For alignmentpulses too long to be characterized as ‘δ-kick’ pulses, there are no suchshortcuts to the solution and the interaction must be treated by solving aset of coupled differential equations for the expansion coefficients[3].

28 Theory of alignment
2.3 Classical theories of alignment
2.3.1 Boltzmann distribution
At high (room) temperatures the molecular distribution, fmol, obtained inadiabatic alignment approaches a Boltzmann distribution,
fmol(θ, φ, χ) ∝ exp(−E(θ, φ, χ)
kBT
), (2.8)
where kB is the Boltzmann constant. The classical energy E(θ, φ, χ) isequal to Hint. For a linear or prolate symmetric top in a linear field, Hint
from table 2.2 can be written as
E(θ) = Hint = −2π
cI(∆α′ cos2 θ + α′⊥) , ∆α = α‖ − α⊥. (2.9)
Equation 2.9 was obtained by changing from ε2 to intensity (ε2 = 2Icε0
)and from polarizability to polarizability volume (α′ = α
4πε0).
Assuming this angular dependence of the energy the Boltzmann distri-bution (eq. 2.8) becomes[20]
fmol(θ) =exp( 2π
ckBT I∆α′ cos2 θ)∫ π0 exp( 2π
ckBT I∆α′ cos2 θ) sin θdθ. (2.10)
The α⊥ term of Hint does not enter eq. 2.10 as it is a constant energyshift independent of θ.
〈cos2 θ〉 is obtained from fmol using the definition in eq. 2.4. Assumingthat 2π
c I∆α′ ¿ kBT the exponentials in eq. 2.10 can be replaced by theirfirst order expansions and a simple formula for 〈cos2 θ〉 is obtained,
〈cos2 θ〉 =13
+8π
45∆α′IckBT
. (2.11)
2.3 Classical theories of alignment 29
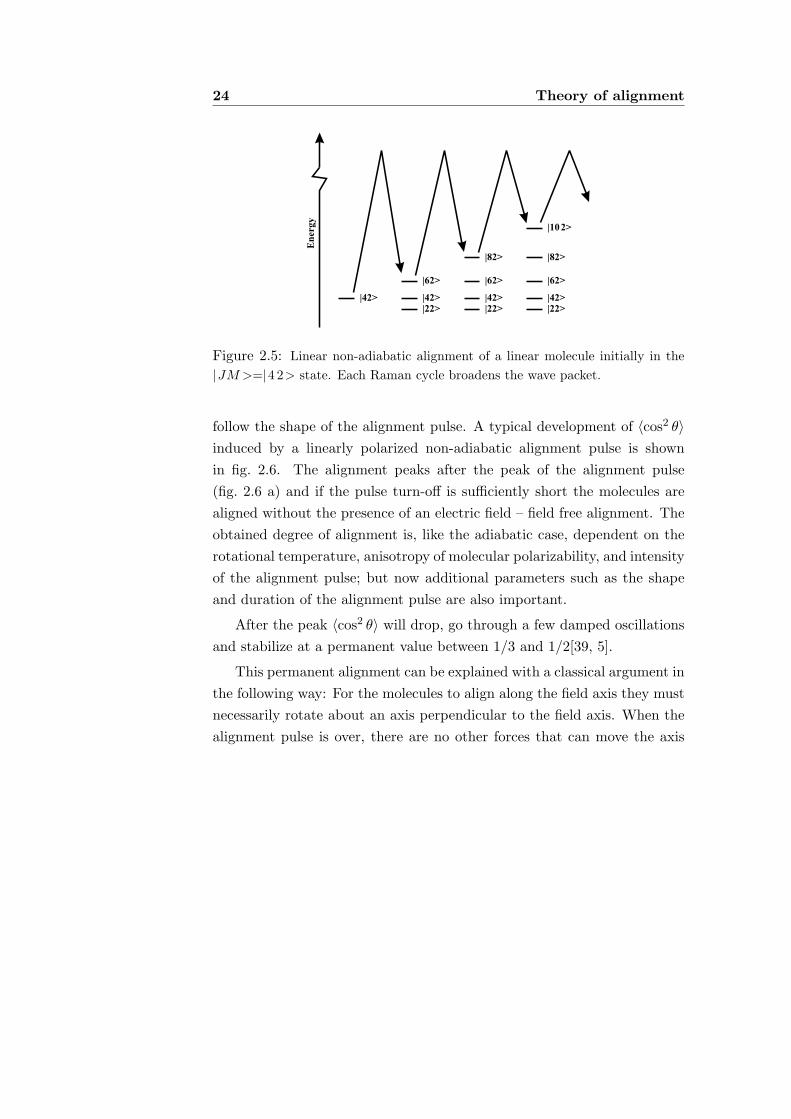
The calculations of adiabatic alignment of CS2 molecules at two dif-ferent temperatures shown in fig. 2.7 illustrate when the assumption ofa Boltzmann distribution is appropriate. At low rotational temperatures(fig. 2.7 a) the Boltzmann distribution is only a good fit at very low inten-sities. At high (room) temperature (fig. 2.7 b) the Boltzmann distributionis a good fit at the intensities usually employed in adiabatic alignmentexperiments.
Figure 2.7: Linear adiabatic alignment of CS2 molecules at two different rota-tional temperatures. The full curve is from a quantum mechanical calculationsolving the time-independent Schrodinger equation, the dashed curve is the Boltz-mann distribution, and the dotted curve is its first order approximation (eq. 2.11).a) T = 4 K, the inset is a blow up of the low intensity part, b) T = 298 K.
The Boltzmann distribution is thus a good fit at low intensities or hightemperatures, which is also the regime where the simple first order approx-imation (eq. 2.11) is applicable for linear or symmetric top molecules in alinear field.

30 Theory of alignment
2.3.2 Classical kicked rotor
Besides the quantum mechanical version of their ‘δ-kick’ model, Leibscher,Averbukh, and Rabitz[41, 42] also proposed a classical model for an ensem-ble of linear rotors subject to a fast kick by an alignment pulse. This modelillustrates some key points of non-adiabatic alignment.
In the model, the angular velocity of the linear rotors in the ensembleafter the interaction is
ω = ω0 − P sin(2θ0). (2.12)
In eq. 2.12, ω0 is the angular velocity before the interaction, θ0 is theθ-angle before the interaction, and P is the “kick strength” defined as
P =14I∆α
∫ ∞
−∞ε(t)2dt =
8πB
h∆α′φ. (2.13)
In eq. 2.13, I is the moment of inertia, B is the rotational constant (incm−1), and φ is the fluence (photon energy per unit area).
After the kick each rotor evolves freely and assuming that the initialangular velocity ω0 is negligible compared to the angular velocity gainedby the kick,
θ(t) = θ0 − Pt sin(2θ0). (2.14)
From eq. 2.14 it is seen that rotors, for which sin(2θ0) ≈ 2θ0, all reachθ = 0 at t = 1
2P . This model thus predicts that the alignment peaksshortly after the pulse at t = 1
2P and that the obtained degree of alignmentis improved if more molecules obey sin(2θ0) ≈ 2θ0. This is the case if themolecules are prealigned so that a larger fraction has a small θ0.

Chapter 3
Experimental Setup
In this chapter our experimental setup is explained in detail. Since thechapter is also meant to serve as a reference for future students in thegroup some technical information is included.
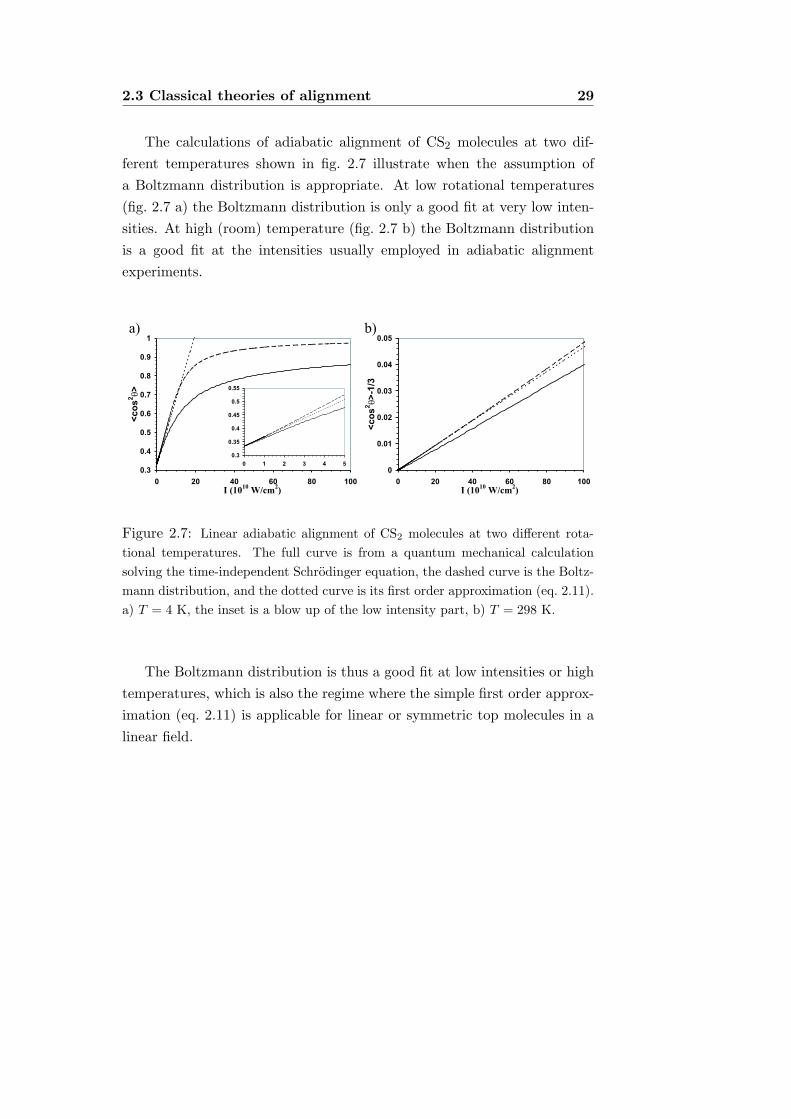
In our experiments we wish to align gas phase molecules with one or twolaser pulses and subsequently probe the alignment with one or two probepulses. A schematic overview of our experimental setup is shown in fig. 3.1.The molecular beam consisting of gas phase sample molecules seeded inhelium or argon is crossed at 90◦ with the laser pulses. The probe pulse(s)create ions. The velocity distribution of the ions, which contain informationabout the molecular alignment, is obtained by accelerating the ions with astatic extraction field towards a detector, where a 2-D ion image is created.
In the following sections the different parts of the experiment, the molec-ular beam, the laser pulses, and the ion imaging, are explained in detail.
31
32 Experimental Setup
Figure 3.1: Schematic overview of the experimental setup.
3.1 The molecular beam
The molecular beam is obtained by expanding a gas of the sample moleculesseeded in helium or argon into vacuum. The expansion cools the moleculesrotationally to a few degrees Kelvin.[10]
3.1.1 Gas flow system
The gas flow system illustrated in fig. 3.2 is used for obtaining a gas ofsample molecules seeded in helium or argon.
Helium or argon at moderate pressure (1-4 bar) is bubbled through apure liquid sample of the molecule under study. The temperature of someof the liquids was kept low with a cold bath, consisting either of ice ora mixture of ethylene glycole and ethanol cooled with dry ice. Therebythe liquid was kept at a temperature where the vapor pressure was 0.5–15 mbar (see appendix A). The main purpose of the cooling was to avoid

3.1 The molecular beam 33
Figure 3.2: Schematic drawing of the gas flow system used for obtaining a gas ofsample molecules seeded in helium or argon.
the sample container emptying too fast. In the case of tert-butyl iodide thelow temperature was necessary to reduce clustering in the molecular beam.
Along the ∼60 cm long path from the liquid sample to the pulsed valvethe sample molecules can condensate and revaporize several times. Thispath cannot be temperature controlled and as a result there is no directrelation between the vapor pressure in the sample container and the amountof molecules exiting the valve. Increasing the vapor pressure of iodobenzenefrom 1 to 10 mbar only result in an increase of ∼25% in total ion signal.
The needle valve is used to control the gas flow rate in the system. Wehave not observed any dependence of the molecular beam on the flow rateand have therefore used a minimum flow to save seed gas and sample.

34 Experimental Setup
The pulsed supersonic valve
The pulsed valve is a commercially available apparatus (PSV C-211 fromR. M. Jordan Company). It opens when a high current electrical pulsecause two conductors to repel and can be operated with a repetition rateof 20 Hz[43]. A jet of gas is ejected through a 0.5 mm nozzle into thevacuum chamber at supersonic speed. As a result of the expansion bothtranslational and rotational motions of the molecules are cooled. A higherbacking pressure makes a more efficient cooling but also reduces sampledensity in the molecular beam. We have used both helium and argon asseed gasses. Argon cools most effectively but also significantly reduces thedensity of sample molecules in the molecular beam.
3.1.2 Vacuum chambers
Figure 3.3: The vacuum chambers. The molecular beam travels from the pulsedsupersonic valve (PSV) down through the center of the chambers. After interactionwith the focused laser beams ions are created. The ions are accelerated downtowards the detector by the static electric field of the extraction plates.
The vacuum chamber (fig. 3.3) is split in three to ensure a low back-ground pressure in the interaction region. The pulsed supersonic valve

3.2 Laser pulses 35
(PSV) ejects a jet of gas into the source chamber. The molecules passthrough a 1 mm skimmer into the intermediate chamber. After travel-ling through the intermediate chamber another 1 mm skimmer is placedat the entrance to the target chamber. The skimmers serve to select thecentral, coldest part of the molecular beam and provide a well definedsample volume. The source and intermediate chambers are pumped by dif-fusion pumps. The target chamber is pumped by a turbo pump and twocold traps filled with liquid nitrogen ensures a low background pressure(∼ 7×10⁻⁸ mbar). A detailed drawing of the pumping system, valves, andpressure gauges is found in [44].
In the target chamber the molecular beam is crossed at 90◦ with thefocused laser beams. The experiments are performed on the front (earlypart) of the molecular pulse where the rotational cooling is best and thechance of clusters is minimal. The ions created in the experiment are accel-erated by the static field between the extraction plates and travel towardthe detector.
3.2 Laser pulses
3.2.1 Alignment and probe pulses
Our alignment experiments employ one or two alignment pulses and one ortwo probe pulses. The involved pulses are summarized in table 3.1.
The adiabatic alignment pulses were obtained as the fundamental (1064 nm)output of an injection seeded Q-switched Nd:YAG nanosecond laser. Thenon-adiabatic alignment pulses originate from a regenerative amplified Ti-Sapphire femtosecond laser system. The ∼100 fs pulses were stretched tothe desired durations (0.5–3.5 ps).
We have used two different probe schemes. The first probe scheme

36 Experimental Setup
Alignment pulsesPulse Wavelength Duration, τFWHM Peak intensity, I0
Non-adiabatic 800 nm 0.5–3.5 ps 1–13×1012 W/cm2
alignment
Adiabatic 1064 nm 3.5 ns or 1–9×10¹¹ W/cm2
alignment 9 ns
Probe pulsesPulse Wavelength Duration, τFWHM Peak intensity, I0
Dissociation 266 nm 0.3–1.5 ps 0.5–2×10¹² W/cm2
Ionization 304 nm 2 ns or 5 ns 1–10×108 W/cm2
Coulomb 800 nm ∼20 fs ∼2×10¹⁴ W/cm2
explosion
Table 3.1: The laser pulses used in our experiments. Pulse durations and peakintensities vary in the experiments.
employs two laser pulses. A 266 nm pulse breaks the C-I bond. Thevelocity vector of the I fragment reflect the position of the C-I bond axis.The iodine atom is subsequently ionized through a resonantly enhancedmulti photon ionization (REMPI) process by a tunable nanosecond pulseat 304 nm. This probe scheme is explained in more detail in sect. 4.2.
The other probe scheme employes an ultra-short intense ∼20 fs 800 nmpulse that strips one or more electrons from the molecule causing themolecule to fragment into ions, a process known as a Coulomb explosion.The velocity vectors of the ions reflect the molecular distribution of orien-tations and can be used as a qualitative measure of alignment. This probescheme is explained in more detail in sect. 7.1.

3.2 Laser pulses 37
3.2.2 Optical setup
Nanosecond pulses
The optical setup of the nanosecond pulses is illustrated in fig. 3.4.
Figure 3.4: Schematic overview of the optical setup of the nanosecond pulses.
An injection seeded Q-switched Nd:YAG laser is frequency doubled in aBBO crystal to 532 nm. We use the residual 1064 nm as adiabatic alignmentpulse and the 532 nm to produce the ionization pulse (the BBO crystal isremoved in experiments that do not use the ionization pulse). We have usedtwo different Nd:YAG lasers: A Coherent Infinity and a Spectra PhysicsQuanta Ray laser. The main difference is in the duration of the producedpulses. The duration of the 1064 nm pulses is 3.5 ns for the Infinity laserand 9 ns for the Quanta Ray laser.
Adiabatic alignment pulse
The 1064 nm beam meets two polarizers and a λ/2-plate that ensurea linear polarization and give the option of tuning the power by rotatingthe λ/2-plate. For the Quanta Ray laser the beam size was reduced with atelescope before passing through the polarizers. The subsequent λ/2- andλ/4-plates controls the polarization of the pulse. By rotating the secondλ/2 plate the polarization can be: linear (vertical or horizontal), circular,

38 Experimental Setup
or elliptical with a vertical major axis.The collimator consisting of a diverging and a focusing lens serve to
increase the beam size thereby decreasing the focal spot size. Furthermorethe beam can be made slightly diverging or converging by tuning the dis-tance between the two lenses.
Ionization pulseThe 532 nm pulses from the Nd:YAG laser pump a dye laser (Lambda
Physik Scanmate 2). We use the Rhodamin 640 dye and methanol assolvent. With this dye the output wavelength can be tuned in range 605–620 nm. The output from the dye laser is frequency doubled in a KDPcrystal to yield ultra violet pulses around 304 nm. The duration of the304 nm pulses is 2 ns (Infinity Nd:YAG laser) or 5 ns (Quanta Ray Nd:YAGlaser). The 304 nm pulse is optically delayed to 10 ns after the 1064 nmpulse. A collimator like the one in the 1064 nm beam path is also placedin this beam and serve the same purpose.
Femto- and picosecond pulses
The optical setup of the femto- and picosecond pulses is illustrated infig. 3.5.
The short pulses originate from a regenerative amplified modelockedTi:Sapphire femtosecond laser system. The output pulses from the lasersystem have a duration of approximately 100 fs. Our old amplification sys-tem (Clark) was capable of pulse energies up 0.8 mJ. The new (Spitfire)system used in the most recent experiments delivers up to 2 mJ per pulse.

3.2 Laser pulses 39
Figure 3.5: Schematic overview of the optical setup of the femto- and picosecondpulses (BS=beamsplitter, CL=cylindrical lens).
Non-adiabatic alignment pulse
A beamsplitter (BS) transmits most of the pulse energy (∼ 70%) to thebeam path of the non-adiabatic alignment pulses. The pulses are stretchedto the desired pulse duration (0.5–3.5 ps).
In our first experiments [2, 3] the stretching was done by a double passthrough a pair of SF11 Brewster prisms. In that case the pulse durationis determined by the distance between the prisms. In our more recentexperiments the prisms were replaced by a grating stretcher[4, 5, 6, 7]. Thediffracted beam from the grating is collimated by a cylindrical lens (CL)and directed on the 0◦ end mirror. A second 0◦ mirror sends the beamon an extra roundtrip through the stretcher. The beam thus passes thegrating four times. The grating stretcher has the advantage that the pulse

40 Experimental Setup
duration is easily tuned by changing the distance from the grating to thecylindrical lens while keeping the distance from lens to end mirror constantat the focal length of the lens. When the distance between the grating andthe lens is equal to the focal length of the lens, the pulses are not stretched.Making the distance from grating to lens longer or shorter corresponds tostretching with a negative or positive chirp.
In the two pulse non-adiabatic alignment experiments the stretchedpulse passes into a modified Mach-Zender interferometer. By rotating theλ/2-plate before the polarizing beamsplitter the energy ratio between thetwo pulses can be tuned while keeping the total pulse energy constant.For experiments that only require one non-adiabatic alignment pulse thebeamsplitter is removed and the first λ/2-plate used for controlling thepulse energy.
As for the adiabatic alignment pulse, λ/2- and λ/4-plates and a colli-mater are placed after the interferometer, to control polarization and beamsize.
Dissociation pulse
200–250 µJ of the 100 fs laser pulse are used to create the 266 nmdissociation pulse. Third harmonic generation (THG) of the 800 nm beamis obtained by frequency doubling in a BBO crystal and subsequent sumfrequency mixing of the residual 800 nm and the created 400 nm in a secondBBO crystal, resulting in 266 nm.
In the non-adiabatic alignment experiments, the created 266 nm pulseswere compressed with a prism pair to 250–400 fs. In the adiabatic alignmentexperiment the distance between the prisms was minimized to stretch thepulses to 1.5 ps. The pulses were stretched to avoid direct multi photonionization from the combined 266 nm and 1064 nm fields.

3.2 Laser pulses 41
The Schneeberger delay stage used in the non-adiabatic alignment ex-periments can be translated up to 50 cm corresponding to a double passdelay of up to 3.3 ns. The stage position is measured with a precision of0.01 mm corresponding to 0.07 ps.
The pulse energy was 9 µJ in the adiabatic alignment experimentsand 4 µJ in the non-adiabatic alignment experiments. With the λ/2-plateplaced before the collimator the linear polarization can be changed fromhorizontal to vertical.
Coulomb explosion pulseRemoving the mirror that couples into the 266 nm beam, the 800 nm
pulse is focused by a lens on a hollow core waveguide filled with argon. Thepassage through the waveguide increases the spectral width of the pulse,making it possible to compress it with a prism pair to 20 fs or shorter[45].The translation stage is the same Schneeberger stage used for the 266 nmbeam. The λ/4-plate enables a choice between vertical linear polarizationand circular polarization.
Combining the laser pulses
The different beams are combined colinearly using dichromatic 0◦ mirrors(fig. 3.6). When using the Coulomb explosion probe, which has the samecolor (800 nm) as the non-adiabatic alignment pulse, a 50/50 beamsplitteris used instead of the first dichromatic mirror. The beams are focusedwith an achromatic lens (focal length 30 cm) on the molecular beam. Theachromatic lens is designed to make the involved colors focus at the samedistance from the lens. The collimators installed in the various beam pathscan make the beams slightly diverging or converging and thus allow fineadjustments to the focal distance. In some cases some beams were slightly

42 Experimental Setup
defocused to increase the spot size.
Figure 3.6: The beams are made colinear with dichromatic mirrors (DM) andfocused on the molecular beam with an achromatic lens.
The spatial overlap of the beams was ensured by inserting a broadbandmirror before the vacuum chamber window and focus the beams on a 20 µmpinhole. A replica of the chamber window is placed in the path. An overlapin the pinhole corresponds to an overlap on the molecular beam. Finallythe spatial overlap is fine tuned on the molecular beam by optimizing anion signal.
The temporal overlap of the short pulses is found by replacing the pin-hole with a BBO crystal and monitoring the produced 400 nm from eitherdifference frequency mixing of 266 nm and 800 nm or from sum frequencymixing of the two different 800 nm pulses. The timing of the nanosecondpulses is controlled electronically.
3.3 Data acquisition and treatment
3.3.1 Ion imaging
To project the ions onto the detector we use the velocity imaging setup ofEppink and Parker[46]. This setup consists of three plates with circular

3.3 Data acquisition and treatment 43
apertures as illustrated in fig. 3.1. Different voltages are applied to the firsttwo plates, the third is grounded. The electric field accelerates the ionstoward the detector. If the ratio of the applied voltages is chosen correctly,ions created different places in the laser focus with the same velocity vectorare projected to the same spot on the detector. The positions of the ionhits on the detector are therefore a map of the velocity vectors of the ions,or more precisely a map of the 2-D projections of the ion velocity vectors.
The time of flight (TOF ) from the ions are created to they hit thedetector is proportional to the square root of the ratio of mass (m) andcharge (Z) of the ions: TOF ∝ √
m/Z. Ions with different masses willthus arrive at the detector at different times.
The detector consists of a micro channel plate (MCP) and a phosphorscreen. When an ion hits the MCP it triggers an electron avalanche. Thiselectron avalanche is guided so that the electrons leave the MCP from thesame point as it was hit by the ion. The electrons hit the phosphor screenand excite the phosphor in a localized spot which subsequently emits light.The position of this ‘blob’ of light on the phosphor screen thus correspondsto the position of the ion hit. The voltages on the detector can be timegated so that only ions with certain flight times (typically I+) are seen onthe screen. A CCD camera records images of the phosphor screen.
Each image from the CCD camera is immediately analysed by a com-puter and the center of each blob of light is found and stored[47]. The iden-tification of the position of each blob means that all ion hits are countedwith the same weight regardless of the size of the resulting blob of light,which can vary because the detector does not have uniform sensitivity. Italso gives a better resolution, in principle sub-pixel resolution. From thestored blob-positions angular and radial distributions can be calculated.Assuming a gaussian shape of each blob an ion image can be constructed

44 Experimental Setup
as illustrated in fig. 3.7.
Figure 3.7: a) Ion image of I+ ions from aligned iodobenzene molecules, b) radialdistribution, c) angular distribution.
The pixel scale in the radial distribution is easily converted to mm andsince the flight time is known, the projected ion velocity can be calculated.As the ion image is a two dimensional projection, it only contains infor-mation about the ion velocity in the detector plane. From the angulardistribution 〈cos2 θ2D〉 can be calculated, θ2D is the angle to the verticalaxis. We often use 〈cos2 θ2D〉 as a qualitative measure of the degree of align-ment. In general it is mathematically impossible to extract the complete3-D velocity distribution from its 2-D projection unless certain assumptionsregarding the initial 3-D distribution can be made.
3.3.2 Abel inversion
If the ion velocity distribution has cylindrical symmetry around an axis inthe detector plane a transformation from the 2-D projection back to theinitial 3-D distribution exists. This transformation is known as the inverseAbel transformation or Abel inversion. Mathematically the transformationis simple[48],
3.3 Data acquisition and treatment 45
f3D(r, z) = − 1π
∫ ∞
r
ddx
f2D(x, z)√x2 − r2
dx . (3.1)
In eq. 3.1 the original distribution f3D is a function of two coordinates: z
is the symmetry axis coordinate and r =√
x2 + y2 is the distance from thesymmetry axis. f2D is the projected distribution and (x, z) is the projectionplane.
In principle the original distribution can be obtained through eq. 3.1.In practice it is not very useful on ion images with finite resolution since itrequires the derivative of the noisy projected image and has a singularity(for x → r).
Until a few years ago the numerical methods for Abel inversion producedquite bad representations of the original distribution, sometimes with nega-tive densities. Then two very different methods of obtaining a reliable Abelinversion was proposed: Vrakking’s iterative method[49] and the basis-setexpansion (BASEX) method of Reisler’s group[48].
The idea of the iterative method by Vrakking is to compare the pro-jection of a trial 3-D distribution with the ion image and correct the 3-Ddistribution with the differences between the projection and the ion image.After 30–40 iterations the projection is indistinguishable from the originalion image.
The BASEX method expands the ion image in a basis of gaussian-typefunctions. These basis functions are ”well behaved”, that is they can beinverted easily as they are projections of known functions. The inverteddistribution is then found by using the set of expansion coefficients on theinverted basis. The ability of the BASEX method to recreate the originaldistribtion thus depends on how well the ion image is expandable in thebasis.
46 Experimental Setup
The computational time required for the BASEX inversion is ∼50 timesshorter than for the iterative inversion. Computational time is however nota big issue since the iterative inversion can be done in 10–30 minutes on aslightly outdated 1 GHz PC.
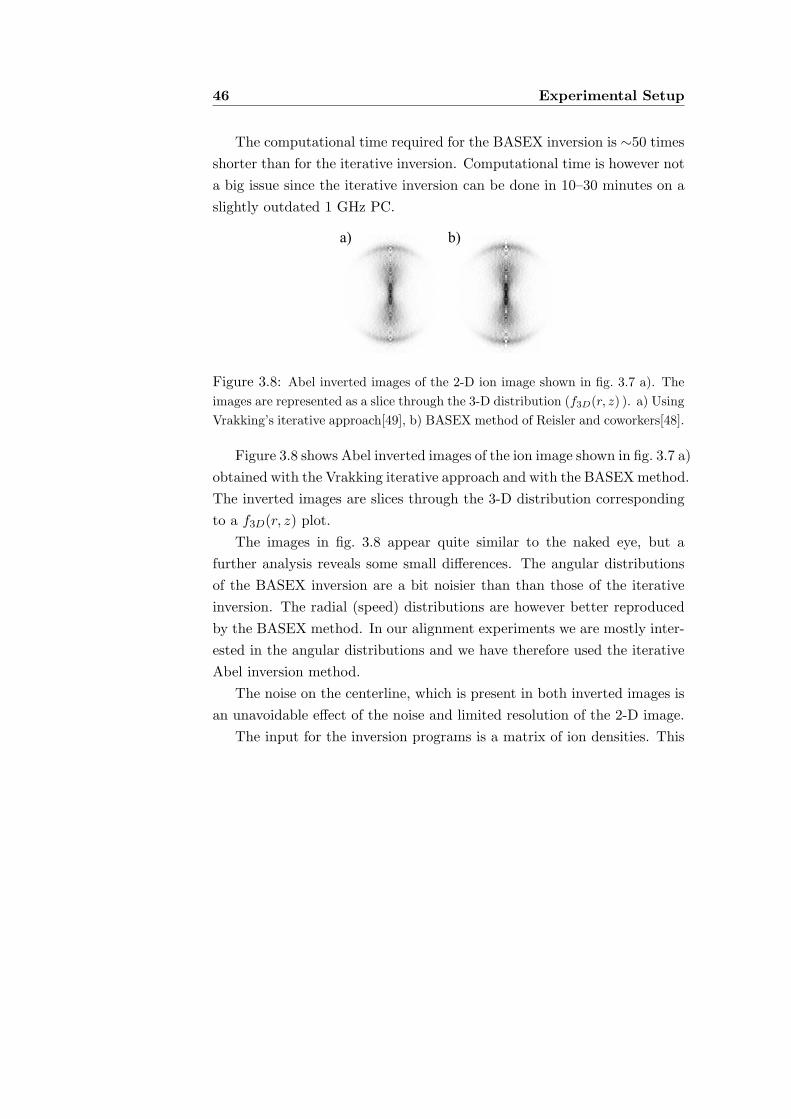
Figure 3.8: Abel inverted images of the 2-D ion image shown in fig. 3.7 a). Theimages are represented as a slice through the 3-D distribution (f3D(r, z) ). a) UsingVrakking’s iterative approach[49], b) BASEX method of Reisler and coworkers[48].
Figure 3.8 shows Abel inverted images of the ion image shown in fig. 3.7 a)obtained with the Vrakking iterative approach and with the BASEX method.The inverted images are slices through the 3-D distribution correspondingto a f3D(r, z) plot.
The images in fig. 3.8 appear quite similar to the naked eye, but afurther analysis reveals some small differences. The angular distributionsof the BASEX inversion are a bit noisier than than those of the iterativeinversion. The radial (speed) distributions are however better reproducedby the BASEX method. In our alignment experiments we are mostly inter-ested in the angular distributions and we have therefore used the iterativeAbel inversion method.
The noise on the centerline, which is present in both inverted images isan unavoidable effect of the noise and limited resolution of the 2-D image.
The input for the inversion programs is a matrix of ion densities. This

3.3 Data acquisition and treatment 47
matrix is constructed like the 2-D ion image by assuming a gaussian shapeof each ion hit. We have found that a gaussian width of 3 pixels is usu-ally a good choice for insuring a relatively smooth distribution suitable forinversion. Since each ion hit is determined with sub-pixel accuracy it ispossible to enlarge the ion image, so that it covers a larger matrix than theone determined by the camera resolution. This way the centerline pixelscover a smaller fraction of the image.
Chapter 4
Adiabatic alignment of
iodobenzene – control of the
photodissociation
The idea of using an intense adiabatic laser pulse to obtain a high degreeof alignment of rotationally cold molecules was first presented in 1995 byFriedrich and Herschbach[29]1. Kim and Felker[51] presented the first ex-perimental evidence of adiabatic alignment, a change of Raman bands in-dicating transitions between pendular states in the presence of a stronglaser field. More direct evidence was presented in 1999 by Stapelfeldtand coworkers[52]. They used ion imaging to show that I2 molecules sub-ject to an adiabatic alignment pulse obtained a high degree of alignment(〈cos2 θ〉 = 0.81). They also demonstrated alignment of a range of other
1Zon and Katsnel’son[50] solved the quantum mechanical equations for a symmetric
top molecule in an intense non-resonant field as early as 1975. The implications in terms
of alignment was however not addressed
48

4.1 Idea 49
molecules including iodobenzene[53].
The alignment was used to control the photodissociation of I2 at 485 nm[54].At this wavelength the photodissociation of I2 can either go through a per-pendicular transition resulting in two ground state I (2P3/2) atoms or aparallel transition resulting in one ground state I atom and one spin ex-cited I? (2P1/2) atom. By polarizing the 485 nm dissociation pulse eitherparallel or perpendicular to the alignment axis one transition could thus befavored over the other.
Our work on adiabatic alignment of iodobenzene was a continuation ofthis work. We wanted to demonstrate a new probe scheme, photodissocia-tion at 266 nm followed by selective ionization of the iodine photofragment.This probe scheme allowed us to obtain the distribution of molecular orien-tations prior to the photodissociation. We also wanted to use alignment tocontrol the photodissociation of iodobenzene as it had been demonstratedfor I2. Most of the results presented here are published in [1].
4.1 Idea
The experimental idea is illustrated in fig. 4.1. The experiment involvesthree different linearly polarized pulses. The adiabatic alignment pulsealigns the major axis of polarization, which is the C–I bond axis. Atthe peak of the alignment pulse (where the degree of alignment peakscf. sect. 2.2.2) a 1.5 ps 266 nm pulse cleaves the C–I bond of some ofthe aligned molecules, producing phenyl radicals and iodine atoms in theground (I) and spin excited (I?) states. The 266 nm pulses are stretched to1.5 ps to avoid direct multi photon ionization from the combined 266 nmand 1064 nm fields. When the alignment pulse is over, a third (304 nm)pulse selectively ionizes either ground state or spin-excited iodine atoms.

50 Adiabatic alignment of iodobenzene
Figure 4.1: Photodissociation of adiabatically aligned iodobenzene molecules.Top: The laser pulses involved. Bottom: Cartoon showing the experimental idea:Molecules, initially with a uniform distribution (i) are subject to a linearly (verti-cally) polarized adiabatic alignment pulse, which aligns the major axis of polariz-ability (the C–I bond axis) (ii). The aligned molecules are then dissociated by the266 nm pulse (iii), which cleaves the C–I bond and produces phenyl radicals andiodine atoms in the ground (I) and spin excited (I?) states. When the alignmentpulse is over the iodine photofragments are ionized by the ionization pulse (iv).By tuning the wavelength of the ionization pulse we can select to ionize either Ior I?.
As explained below (sect. 4.3), the dissociation of iodobenzene can gothrough two different channels. These two dissociation channels have dif-ferent dependencies on the relative orientation of molecule and polarization

4.2 Resonantly enhanced multi photon ionization of iodine 51
of the dissociation pulse. This difference means that alignment can be usedas a control tool for the photodissociation.
4.2 Resonantly enhanced multi photon ionization
of iodine
Figure 4.2: Resonantly enhanced multi photon ionization (REMPI) of iodineatoms
To ionize the photofragment iodine atoms we use a nanosecond pulsewith a wavelength close to 304 nm. As illustrated in fig. 4.2 the ionizationprocess is a 2+1 resonantly enhanced multi photon ionization (REMPI).Two photons promote ground state (2P3/2) I-atoms or spin-excited (2P1/2)I?-atoms to highly excited (6p) states, from which a third photon ionize theatom. By tuning the wavelength the ionization of either I or I? is resonantlyenhanced, see table 4.1.
For iodobenzene and the other molecules studied the absorption crosssection at 304 nm is much smaller than at 266 nm (see appendix A). Thecontribution of I+ ions from dissociation and subsequent ionization by the304 nm pulse is therefore small. Absorption at 304 nm leads almost ex-

52 Adiabatic alignment of iodobenzene
Initial state Resonance state[55] Wavelength2
I (2P3/2) 6p 4D7/2 304.59 nm
I? (2P1/2) 6p 4D1/2 303.96 nm
Table 4.1: The wavelengths used for making resonantly enhanced multi photonionization (REMPI) of iodine. The tabulated wavelengths are calibrated againstthe spectral lines of Ne using an optogalvanic lamp[56].
clusively to the formation of ground state I (for iodobenzene the relativequantum yield of I? is 0.005[57]).
We have (so far) only used the scheme of dissociation and subsequentionization on molecules with C–I bonds. The reason is that the REMPIwavelengths of other photofragments such as Br or OH are close to 260 nm,where the absorption cross sections of molecules are usually much bigger.
A minor problem with the ionization pulse is that the spectral widthis almost too narrow. If the spectral width is narrower than the Dopplerprofile of the iodine atoms, the REMPI-probe will only select part of theDoppler profile. To overcome this we have either scanned the wavelengthover the Doppler profile or used a pulse so intense that the resonance issufficiently power broadened.
4.3 Photodissociation of iodobenzene
The group of El-Sayed has shown that photodissociation of iodobenzene inthe range 220-305 nm occurs through two main channels[58]. One channelis the excitation from a non-bonding orbital on the iodine atom to an anti-bonding orbital along the C–I bond. This n → σ? transition leads to a
2Eppink and Parker[55] report these wavelengths as 304.55 nm (I) and 304.02 nm (I?).

4.3 Photodissociation of iodobenzene 53
fast breakage of the C–I bond. The other channel is an excitation froma bonding to an anti-bonding orbital (π → π?) of the aromatic π-system.The energy of this transition is quickly redistributed to the C–I bond, sothat the end result of both channels is the breaking of the C–I bond.
Dissociation through the π → π? channel leaves the phenyl radical highervibrationally excitated than the direct dissociation through the n → σ?
channel. Fragments produced by dissociation through the π → π? chan-nel will thus have less kinetic energy than fragments originating from then → σ? dissociation. The detected I+ ions can therefore be separated inthe two dissociation channels.
4.3.1 The n → σ? dissociation channel
The n → σ? dissociation channel only involves bond-localized orbitals. Itis therefore common to all molecules with a C–I bond. Figure 4.3 showsthe potential surfaces involved in the transition for CH3I. The precise en-ergies and absorption cross sections are molecule dependent but the basicmechanism is common to all molecules with a C–I bond.
Eppink and Parker [59] report the mechanism to be as follows: Theparallel 1Q0→ 3Q0 transition is the most dominant. Molecules excited to the3Q0 surface will either dissociate into CH3 and I? or make a curve crossingto the 1Q1 surface resulting in CH3 and I. The perpendicular transitions1Q0→ 1Q1 and 1Q0→ 3Q1 that lead to CH3 and I have smaller cross sectionsbut are also present (1Q0→ 1Q1 much more than 1Q0→ 3Q1). The n → σ?
excitation will thus either result in I? through a pure parallel transition(1Q0→ 3Q0) or I through a transition that is mainly parallel but has aminor perpendicular component.
Assuming the transition is not saturated (cf. appendix C.1) the proba-bility of dissociation through a combined parallel and perpendicular tran-

54 Adiabatic alignment of iodobenzene
Figure 4.3: Schematic diagram showing the potential surfaces involved in thephotodissociation of CH3I at 266 nm. Reprinted from [59].
sition, such as the n → σ? channel has the dissociation probability3,
Pn→σ?
diss = σn→σ?Φ03
2−A
(A cos2 θ + (1−A) sin2 θ
). (4.1)
In eq. 4.1, Φ0 is the photon flux, σn→σ? is the orientation averaged ab-sorption cross section, θ is the angle between the C–I bond axis and thedissociation polarization, and the A parameter designates how parallel orperpendicular the transition is: A = 0 corresponds to a pure perpendiculartransition and A = 1 corresponds to a pure parallel transition. Equation 4.1is derived in appendix C.2.
3eq. 4.1 is equivalent to Pdiss ∝ 1 + βP2(cos θ) (see appendix C.2).

4.3 Photodissociation of iodobenzene 55
4.3.2 The π → π? dissociation channel
The π → π? channel involve the aromatic ring and is similar to the sametransition of benzene (1A1g→ 1E1u). The transition perpendicular to theplane is symmetry forbidden (the bonding (π) and anti-bonding (π?) or-bitals of the aromatic ring have the same symmetry with respect to thesymmetry operation of mirroring in the plane of the molecule). The tran-sition dipole moments along the other two coordinates are equal due tosymmetry.
In conclusion the π → π? channel is a planar transition, which meansthat the transition dipole moment is proportional to sin2 γ with γ being theangle between the dissociation laser polarization and the axis perpendicularto the molecular plane.
Transforming to Euler angles and once again assuming that the transi-tion is not saturated, the probability of dissociation is (eq. C.14)
P π→π?
diss = σπ→π?Φ032(1− sin2 θ sin2 χ). (4.2)
4.3.3 Promptness of the dissociation
Since the velocity vectors of the iodine fragments are used as a measure ofthe molecular alignment, it is important to ensure that the molecules donot rotate during the photodissociation. This assumption is known as theaxial recoil approximation. After the dissociation the rapid increase of themoment of inertia and the conservation of angular momentum cause thefragmented molecule to stop its rotation.
Zewail and coworkers[60] found that dissociation through the n → σ?
channel occurs within 0.7 ps and dissociation through the π → π? chan-nel within 2.2 ps. The rotational period of iodobenzene (perpendicular to

56 Adiabatic alignment of iodobenzene
the C–I bond axis) is ∼700 ps (see appendix A), rotation of iodobenzenemolecules during the dissociation is thus negligible except for highly ex-cited rotational states. The same assumption can be made for the othermolecules studied. The fastest molecule, methyl iodide, has a rotationalperiod of 66.7 ps, two orders of magnitude slower than the dissociation.
4.4 Linear alignment
4.4.1 Ion images
Figure 4.4 shows I+ ion images recorded with and without the presence ofthe alignment pulse.
Focusing first on the images recorded without the presence of the align-ment pulse, the image in fig. 4.4 a) shows I+ ions from REMPI of groundstate I. The image has two main features: An outer ring of high kineticenergy ions (7–10 mm) which is angularly confined along the vertical po-larization of the dissociation pulse and a region of low kinetic energy ions(0–7 mm) with a more uniform distribution. We identify the high kineticenergy ions in the outer ring as ions originating from the mainly paralleln → σ? channel, and the low kinetic energy ions as ions originating fromthe π → π? channel.
The image in fig. 4.4 c) shows I+ ions from REMPI of I?. This imagehas the same main features as the previous image. The image is smallersince some of the energy is now stored in the excitation of the I atom. Theouter ring (n → σ? channel) is slightly more confined since the transitionis now a pure parallel transition with no perpendicular component. Theyield of I? from the π → π? channel is low and concentrated in the centerof the image. When the 1064 nm alignment pulse is included a confinementof the I+ ion distribution along the polarization of the pulse is observed,

4.4 Linear alignment 57
Figure 4.4: Ion images of I+ ions from REMPI of iodine photofragments usinga vertically polarized 266 nm pulse. Top row: 2-D ion images, bottom row: Abelinverted images represented as a slice through the 3-D distribution. a+b) REMPIwavelength set to ionize ground state I, c+d) REMPI wavelength set to ionize I?.a+c) Without alignment pulse, b+d) With a vertically polarized alignment pulse.
which we interpret as molecular alignment.
The confinement in the distribution is visible for both I (fig. 4.4 b) andI? (fig. 4.4 d). In the latter case an extra ring of high kinetic energy ionsalso appears. We identify this extra ring as I? fragments from a dissociationchannel involving the absorption of both a 266 nm photon and a 1064 nmphoton. This channel does not produce ground state I. The extra ring inthe image of fig. 4.4 d) illustrates a major problem in the application ofadiabatic alignment. The molecules are only aligned in the presence of thealignment field and that field can interfere with the process, one wish to

58 Adiabatic alignment of iodobenzene
study.In the aligned ion image of ground state I (fig. 4.4 b) there is no extra
ring and we assume that the presence of the alignment field changes themolecular distribution without otherwise affecting the photodissociationleading to I. For all the images an image recorded without the ionizationpulse is subtracted to account for the small (∼10%) background of I+ ionsproduced directly by dissociative ionization.
Since all laser pulses have vertical linear polarization there is cylindricalsymmetry in the ion velocity distribution and the images can therefore beAbel inverted (cf. sect. 3.3.2). From the Abel inverted images radial andangular distributions can be extracted.
4.4.2 Kinetic energy distributions
The radial (velocity) distributions can be converted to kinetic energy dis-tributions. The kinetic energy distributions shown in fig. 4.5 are extractedfrom the Abel inverted ion images in fig. 4.4.
Comparing the kinetic energy distributions without alignment pulse(fig. 4.5 a and b), it is seen that the kinetic energy difference between Iand I? photofragments of the n → σ? channel is 0.23 eV corresponding toa difference in total kinetic energy (of both iodine and phenyl radical) of0.61 eV. This difference is smaller than the energy difference between I andI?, which is 0.943 eV. We therefore conclude that the phenyl radical is mostexcited vibrationally when the n → σ? excitation leads to ground state I.
As seen from the (ground state) I kinetic energy distribution of alignedmolecules (fig. 4.5 c) the yield of both dissociation channels is increasedwhen the molecules are aligned. Figure 4.5 d) shows the I? kinetic energydistribution of aligned molecules. The I+ ions in the new high kinetic energychannel have an additional kinetic energy of up to ∼0.4 eV corresponding

4.4 Linear alignment 59
Figure 4.5: Kinetic energy distributions of I+ ions from REMPI of io-dine photofragments. a+c) REMPI wavelength set to ionize ground state I,b+d) REMPI wavelength set to ionize I?. a+b) Without alignment pulse, c+d)With alignment pulse.
to a total extra energy (of both fragments) of ∼1.1 eV, which is the energyof a 1064 nm photon.
4.4.3 Angular distributions
Angular (θ) distributions (shown in fig. 4.6) can also be obtained from theAbel inverted images. The noise in the distributions stems from the Abelinversion.
Assuming the axial recoil approximation (sect. 4.3.3) and that the tran-

60 Adiabatic alignment of iodobenzene
Figure 4.6: Angular distributions of I+ ions, fions(θ), from REMPI of I and I?
photofragments. Top row: Ions originating from the π → π? channel, bottom row:ions originating from the n → σ? channel. The black curves are the distributionsobtained from the Abel inverted images, the gray curves are the dissociation prob-abilities derived in appendix C.2. a) REMPI of I, no alignment pulse, b) REMPIof I?, no alignment pulse, c) REMPI of I, with alignment pulse.
sition is not saturated, the ion angular distributions originating from a uni-form distribution of molecules must reflect the angular dependence of thedissociation probability. The expressions for the angular dependence werepresented in the previous section and derived in appendix C.2. The graycurves in fig. 4.6 a) and b) show the distributions calculated with thoseexpressions.

4.4 Linear alignment 61
For the n → σ? channel (leading to ground state I) A = 0.84 is obtainedby fitting to the experimental distribution4. This corresponds to a transi-tion, which is mainly parallel but has a minor perpendicular component, inagreement with the predictions of sect. 4.3.1.
The n → σ? angular distribution of I? shown in fig. 4.6 b) is close toa pure parallel transition (gray curve). The deviations are due to noise,saturation, and deviation from the axial recoil approximation (moleculesrotating slightly during dissociation).
The dissociation probability of the π → π? channel (eq. 4.2), whichdoes not contain any fitting parameters, is reasonable close to the angulardistributions of I and I?. When the alignment pulse is included (fig. 4.6 c) adramatic narrowing of the angular distributions of both dissociation chan-nels is observed.
4.4.4 Obtaining fmol(θ) and 〈cos2 θ〉Assuming that the dissociation is not saturated the distribution of photofrag-ments, fions, is proportional to the product of the molecular distributionprior to dissociation, fmol, and the dissociation probability, Pdiss,
fions(θ, φ, χ) ∝ fmol(θ, φ, χ)Pdiss(θ, φ, χ). (4.3)
For the n → σ? channel the dissociation probability only depends onthe θ-angle and eq. 4.3 can be reduced to
fn→σ?
ions (θ) ∝ fmol(θ)Pn→σ?
diss (θ). (4.4)
We assume that the molecular distribution of the θ-angle, fmol(θ), isuniform when the alignment is not present and obtain Pn→σ?
diss (θ) from the
4A = 0.84 correspond to β = 1.17 (see eq. C.12)

62 Adiabatic alignment of iodobenzene
ion angular distribution of the n → σ? channel of the unaligned image(fig. 4.6 a). fmol(θ) of the aligned molecules is obtained by dividing theangular distribution of the ions, fn→σ?
ions (θ), with the dissociation probability,Pn→σ?
diss (θ), and normalizing.
Knowing the molecular distribution, fmol(θ), 〈cos2 θ〉 can be found us-ing definition 2.4. Figure 4.7 shows 〈cos2 θ〉 obtained at different intensitiesof the alignment pulse and different backing pressures of the seed gas, he-lium. A higher backing pressure corresponds to a lower rotational temper-ature. The degree of alignment improves at lower rotational temperatureand higher intensities as expected (sect. 2.2.2). It is evident in fig. 4.7that the degree of alignment saturates at high intensities so that a furtherincrease of the intensity does not cause a significant increase in 〈cos2 θ〉.
In principle 〈cos2 θ〉 can also be calculated directly from the increase ofion yield in the n → σ? channel when the molecules are aligned. The ionyield, Y , is proportional to the dissociation probability averaged over allangles, 〈Pdiss〉 (once again assuming that the transition is not saturated).Dividing the ion yield of aligned molecules with that from a uniform dis-tribution gives
Y n→σ?
align,para
Y n→σ?noalign
=〈P n→σ?
diss,para〉〈P n→σ?
diss,noalign〉 = 3
2−A
(A〈cos2 θ〉+ (1−A)(1− 〈cos2 θ〉))
⇓〈cos2 θ〉 = 2−A
6A−3
Y n→σ?
align,para
Y n→σ?noalign
+ A−12A−1 .
(4.5)However, experimental drift of the dissociation pulse energy, saturation,and the slight overlap of the two channels have so far excluded us fromobtaining the yield ratio, Y n→σ?
align,para/Y n→σ?
noalign, with the precision requiredfor eq. 4.5 to be useful.

4.4 Linear alignment 63
Figure 4.7: 〈cos2 θ〉 as a function of the peak intensity of the adiabatic alignmentpulse, IY AG, for iodobenzene molecules seeded in helium. Values for differentbacking pressures of helium are shown, a higher backing pressure corresponds to alower rotational temperature. The lines between the points serve to guide to eye.
4.4.5 Assumptions made for obtaining 〈cos2 θ〉
Our method of obtaining 〈cos2 θ〉 is based on three basic assumptions:(1) That the molecular distribution is uniform when no alignment pulseis present, (2) that the n → σ? transition is not saturated, and (3) thatthe axial recoil approximation holds. We furthermore assume that the dis-sociation pulse is too fast and too weak to induce any significant degree ofalignment during the pulse. Considering the intensity of the dissociationpulse, this is a good approximation even if the anisotropy of the molecu-lar polarizability is a factor of 2–3 higher at 266 nm than at near infraredwavelengths.

64 Adiabatic alignment of iodobenzene
Collision induced alignment
As discussed in sect. 1.2.2 the molecules may be prealigned due to collisioninduced alignment in the supersonic expansion. Collision induced alignmentis a confinement of the molecular rotation axis to the plane perpendicularto the molecular beam axis (fig. 4.8).
Figure 4.8: If the molecules experience collision induced alignment, the axis ofrotation will be confined perpendicular to the beam axis.
If such a confinement is present the distribution in the θ-angle, fmol(θ),is still uniform, when the laboratory fixed Z-axis is perpendicular to themolecular beam axis (vertical polarization). The anisotropy caused by col-lision induced alignment is only affecting the distribution in the φ-angle,fmol(φ). When all laser polarizations are parallel along the Z-axis, the φ-angle anisotropy is averaged out. Any degree of collision induced alignmentis therefore not affecting the linear alignment experiments, in which all laserpulses have parallel polarizations perpendicular to the molecular beam.
For the sake of the following section on the control of the photodisso-ciation, it is worth noting that if the laboratory fixed Z-axis is along thebeam axis (horizontal polarization) there will be a weak confinement of theθ-angle: 1
3 < 〈cos2 θ〉 < 12 . An increase in the yield of the mainly parallel
n → σ? channel is therefore expected when changing from vertical to hor-izontal polarization of the dissociation pulse. We do not observe any such

4.4 Linear alignment 65
yield increase for iodobenzene and therefore conclude that no significantdegree of collision induced alignment is present for iodobenzene.
Saturation
The next important assumption we have made is the assumption that thetransition is not saturated. This assumption is equivalent to
σΦ0 ¿ 1, (4.6)
where σ is the absorption cross section and Φ0 is the photon flux of thedissociation pulse. In the experiment the peak intensity of the dissociationpulse was 5×10¹¹ W/cm2. With a pulse duration of 1.5 ps, this correspondsto a (focal averaged) photon flux of 42 A−2. The gas-phase absorption crosssection (of iodobenzene) at 266 nm is 2.3×10⁻² A2 (appendix A). However,the cross section that should be considered for the 〈cos2 θ〉 determinationis the cross section for the n → σ? transition leading to ground state I,which is less than 40% of the total cross section. So in our experimentσn→σ?(I)Φ0 ≈ 0.4. This is high enough for weak saturation effects. Anysaturation will be more pronounced for aligned than for uniformly dis-tributed molecules since the yield is higher when the molecules are aligned.The angular distributions of ions from aligned molecules are thus broad-ened more than angular distributions of ions from a uniform distribution.The effect of saturation is therefore a lowering of the experimental 〈cos2 θ〉value. The obtained 〈cos2 θ〉 values are thus lower estimates, the real valuesmight be slightly higher.

66 Adiabatic alignment of iodobenzene
Axial recoil approximation
The last important assumption is that the axial recoil approximation holds,i.e. that the molecules do not rotate during the dissociation.
As stated in sect. 4.3.3 highly excited rotational states can rotate slightlyduring the fast n → σ? dissociation, causing broadening of the angulardistributions and thus a slight lowering of the experimental 〈cos2 θ〉 values.Highly excited rotational states are mainly present in the very broad wavepackets created by intense non-adiabatic alignment pulses. Deviations fromthe axial recoil approximation will lower the 〈cos2 θ〉 values most whenthe wave packets are broadest, which is also where the obtained degree ofalignment is highest.
4.5 Controlling the photodissociation
The two dissociation channels have different geometry. The photodisso-ciation can therefore be controlled by aligning the molecules to favor onedissociation channel over the other. By controlling the dissociation pathwaythe vibrational excitation of the phenyl radical is controlled. Dissociationthrough the π → π? channel gives the phenyl radical more vibrational ex-citation than dissociation through the n → σ? channel.
4.5.1 Control using linear Alignment
The ion images in fig. 4.9 a) and b) show what happens when the polariza-tion of the dissociation pulse is changed from parallel to perpendicular tothe linear alignment pulse polarization. Since the molecules are aligned theions are still confined to the vertical alignment axis even though the disso-ciation pulse has horizontal polarization (fig. 4.9 b). The ions can therefore

4.5 Controlling the photodissociation 67
still be separated in the two dissociation channels. The ion image with theperpendicular polarizations cannot be Abel inverted since it does not havecylindrical symmetry.
Figure 4.9: a+b) 2-D ion images of I+ ions from REMPI of I atoms producedby the photodissociation of iodobenzene seeded in 2 bar helium. a) Parallel polar-izations of the alignment and dissociation pulses, b) Perpendicular polarizationsof the alignment and dissociation pulses. c) Radial distributions of the 2-D ionimages shown in the top row, d) Radial distributions obtained when seeding in1 bar argon (images not shown).
The radial distributions of the two 2-D images are shown in fig. 4.9 c).Comparing the radial distributions it is seen that the ion yield of bothdissociation channels is decreased going from parallel to perpendicular ge-

68 Adiabatic alignment of iodobenzene
ometry. The ion yield is however decreased more in the mainly paralleln → σ? channel (a factor of 2.7) than in the planar π → π? channel (a fac-tor of 2.0). When the iodobenzene molecules are seeded in argon insteadof helium a lower rotational temperature is obtained, resulting in strongeralignment. The decreases in ion yield going from parallel to perpendiculargeometry are therefore higher (factors of 3.4 and 2.6) when using argon asseedgas (fig. 4.9 d).
How much we the ion yields are expected to be decreased can be calcu-lated using the experimentally obtained distribution of aligned molecules,fmol(θ). The number of ion hits in the images with argon as seedgas islow and the image therefore too noisy for Abel inversion. fmol(θ) can thusonly be obtained when helium is used as seedgas. The peak intensity of thealignment pulse was 9× 10¹¹ W/cm2 and 〈cos2 θ〉=0.68 (fig. 4.7).
The ion yield, Y , is proportional to the dissociation probability averagedover the three Euler angles. Assuming fmol to be uniform in φ and χ,
Y ∝ 〈Pdiss〉 =∫ π
0fmol(θ)Pdiss(θ) sin θdθ. (4.7)
The expressions for dissociation probability, Pdiss, of the two dissocia-tion channels (averaged over φ) are shown in table 4.2 and derived inappendix C.2. Using the experimentally determined fmol(θ) and the dis-sociation probabilities of table 4.2 we calculate that going from parallel toperpendicular dissociation polarization the yield is decreased by a factor of2.2 in the n → σ? channel and by a factor of 1.4 in the π → π? channel.The experimental factors were 2.7 and 2.0.
The discrepancies between the calculated values and the experimentalresults have two different causes. As mentioned in the previous section therequirement that the transition is not saturated is not completely fulfilled.This leads to an underestimate of the alignment and less difference between

4.5 Controlling the photodissociation 69
n → σ? channelParallel σn→σ?Φ0
32−A
(A cos2 θ + (1−A) sin2 θ
)
Perpendicular σn→σ?Φ03
2−A
(12A sin2 θ + (1−A)(1− 1
2 sin2 θ))
π → π? channelParallel σπ→π?Φ0
32(1− sin2 θ sin2 χ)
Perpendicular σπ→π?Φ032
(12 + 1
2 sin2 θ sin2 χ)
Table 4.2: Dissociation probabilities (averaged over φ) of the two dissociationchannels of iodobenzene. The dissociation pulse polarization is either parallel orperpendicular to the linear alignment pulse polarization (lab fixed Z-axis). As-suming a uniform χ-distribution for all θ, sin2 χ can be replaced by 1
2 .
parallel and perpendicular geometry. For the π → π? channel another factoralso plays a role, the assumption of a uniform distribution of χ for all θ
is not correct. A molecule at a given θ ∈ (0, π) tends to align so thatthe alignment axis is in the molecular plane rather than out of the planebecause the polarizability is higher in the plane than perpendicular to it.Therefore, there will be a weak localization of χ around 0 and π (fig. 2.3 LPin sect. 2.2.1). This localization of χ leads to higher yield in the π → π?
channel for the parallel geometry and lower yield for the perpendiculargeometry (cf. table 4.2).
4.5.2 Improving the control with 3-D alignment
As shown in the previous section we have obtained an amount of controlof the photodissociation with linear alignment. However the best way tofavor the π → π? channel is to use 3-D alignment to fix both the C–I bondaxis and the molecular plane and then polarize the dissociation pulse in themolecular plane, perpendicular to the C–I bond axis. In that way the yield

70 Adiabatic alignment of iodobenzene
of the n → σ? channel is minimized and the yield of the π → π? channel ismaximized.
Alignment (seedgas) Yπ→π?
Yn→σ?
Yπ→π?
Yn→σ?
Parallel Perpendicular
Uniform distribution 1.21
Adiabatic, Linear (2 bar He) 1.01 1.35
Adiabatic, Linear (1 bar Ar) 1.04 1.64
Non-adiabatic, Linear (3 bar He) 0.99 1.39
Non-adiabatic, 3-D (3 bar He) 1.11 1.94
Table 4.3: Ratio of yields of the two dissociation channels of iodobenzene withthe dissociation pulse polarization either parallel or perpendicular to the (major)alignment axis.
We have later5 performed 3-D control experiments using an ellipti-cally polarized 800 nm non-adiabatic alignment pulse (τFWHM = 1.6 ps,I0 = 5× 10¹² W/cm2). The results are compared with linear alignment intable 4.3. Using linear alignment and parallel dissociation polarization theyields in the two dissociation channels are the same. Using 3-D alignmentand perpendicular dissociation polarization the yield of the π → π? channelis ∼2 times the yield of the n → σ? channel. We are thus able to tweak theratio of yields from the two channels by a factor of 2.
In principle the n → σ? channel can be favored more by aligning themolecular plane (with circular alignment pulse polarization) and polarizingthe dissociation pulse perpendicular to the alignment plane. With thisscheme the planar π → π? channel is suppressed while the n → σ? channelsurvives due to its minor perpendicular component. As shown in fig. 4.10
5Unpublished data (2004).

4.6 Conclusion 71
this scheme is superior to linear alignment if a high degree of alignment isachievable. We can (currently) not perform this experiment as it requirestwo laser beams crossing at 90◦.
Figure 4.10: Calculation of the ratio of yields of the two dissociation channels ofiodobenzene. Black curve: Alignment of the plane, dissociation polarization per-pendicular to the alignment plane. Gray curve: Linear alignment of the C–I bondaxis, dissociation polarization parallel to the the alignment axis (χ-distributionassumed uniform for all θ). Note that 〈cos2 θ〉 is a measure of the alignment of twodifferent axes: The C–I bond axis (linear alignment) or the axis perpendicular tothe plane (planar alignment).
4.6 Conclusion
We have demonstrated a probe of molecular alignment that allow us toobtain the distribution of molecular orientations, fmol(θ), and thus 〈cos2 θ〉prior to dissociation by the probe. With this probe scheme we have mea-

72 Adiabatic alignment of iodobenzene
sured the alignment of iodobenzene induced by an adiabatic alignment pulseat different rotational temperatures. The alignment improves with lowerrotational temperature of the molecules and higher intensity of the align-ment pulse. At high intensities the alignment saturates so that a furtherincrease of the intensity only weakly enhances the alignment. The intensityis limited by the onset of multi photon ionization.
The iodobenzene molecule can be dissociated at 266 nm through twodifferent channels. We have shown that linear alignment can be used as toolfor controlling which channel the dissociation goes through and thereby theamount of vibrational excitation of the phenyl radical. The control can beimproved by using 3-D alignment.

Chapter 5
Non-adiabatic alignment –
short time dynamics
For many applications of alignment the unavoidable presence of the adia-batic alignment laser field is a major drawback. The alignment field mightinterfere in the process one wish to study. An example of this was presentedin the previous chapter. The presence of the alignment field opened a newchannel in the photodissociation of iodobenzene leading to the formationof I? (sect. 4.4). With a short, non-adiabatic alignment pulse it is possibleto have molecules aligned under field-free conditions. Field-free alignmentis observed both immediately after the alignment pulse and at subsequentrotational revivals. This chapter will focus on the alignment observed im-mediately after the alignment pulse. The rotational revivals are treated inthe next chapter.
In 1995, Seideman[61] published the first calculations on non-adiabaticalignment of linear molecules induced by a short intense laser pulse. Thata short laser pulse can induce alignment was known long before but had
73

74 Non-adiabatic alignment – short time dynamics
only been treated in the weak field limit, where the created wave packet islimited by the selection rules of the transition that produced it. Since thenmany theoretical papers have been published on strong laser field non-adiabatic alignment. Among them are quantum mechanical calculationson the dependence on alignment pulse duration[35, 37] and the effect ofthermal averaging[35, 37, 39].
The first experimental observation of strong field non-adiabatic align-ment was presented by Rosca-Pruna and Vrakking in 2001[62, 63, 64]1.They used a short intense probe pulse to Coulomb explode aligned I2molecules and velocity map imaging to study the angular distribution of theion fragments. Later, other groups also presented strong field non-adiabaticalignment experiments. Dooley et al.[31] used a similar probe to study thenon-adiabatic alignment of N2 and O2 and Renard et al.[30] probed thenon-adiabatic alignment of CO2 by measuring transient birefringence.
Common to all the works mentioned above is that they pertain to linearmolecules. We wished to apply non-adiabatic alignment on a much moregeneral class of molecules, asymmetric top molecules. The results presentedin this chapter are all concerned with the asymmetric top iodobenzenemolecule. The short time dynamics are especially important for asymmetrictop molecules since the alignment of asymmetric top molecules is strongestimmediately after the alignment pulse[5].
At first the possibility of obtaining field-free alignment was our main rea-son to study non-adiabatic alignment. It was therefore important for us tofind the conditions where the highest degree of alignment is obtained under
1In 1999 and 2000 Frey et. al.[65, 66] presented degenerate four-wave mixing (DFWM)
experiments that can be viewed as strong field laser induced alignment. However, the
authors did not interpret the data as strong field alignment but used weak field, pertur-
bative methods.

5.1 Alignment with one pulse 75
field-free conditions. Another attractive feature of the non-adiabatic align-ment regime compared to adiabatic alignment is that there are more pa-rameters available for improving the alignment. In an adiabatic alignmentexperiment there is essentially only one parameter for a given ensemble ofmolecules at a given rotational temperature – the intensity. In the previouschapter it was shown that the alignment saturates at higher intensities,so that an increase of intensity only gives a small increase of the degree ofalignment (fig. 4.7). Furthermore, the intensity cannot be increased beyondthe threshold for multi photon ionization2. In the non-adiabatic case usinga sequence of alignment pulses can enhance the alignment beyond the limitto the alignment obtainable by a single alignment pulse.
5.1 Alignment with one pulse
5.1.1 Experiment
The probe scheme of the experiment is the same as the adiabatic alignmentexperiment: dissociation of aligned iodobenzene molecules by a 266 nmpulse and subsequent selective ionization of either I or I? with a 304 nmREMPI pulse. The adiabatic alignment pulse is replaced by a picosecondnon-adiabatic alignment pulse. The pulses involved in the experiment areillustrated in fig. 5.1.
The alignment pulses used in the first experiments were stretched to1.9–2.7 ps by double passage through two prisms. In the later experimentsthe prisms were replaced by a grating stretcher, which produced smoothertemporal profiles and facilitated an easy adjustment of the pulse duration
2Since the multi photon ionization process is highly non-linear (at least six 800 nm
photons are required to ionize iodobenzene), it scales with a high order of the intensity
and thus has a threshold like behavior.

76 Non-adiabatic alignment – short time dynamics
Figure 5.1: The pulses involved in the non adiabatic alignment experiments oniodobenzene.
(sect. 3.2.2).Since the alignment depends on the delay between the alignment and
dissociation pulses, adequate time-resolution is needed. The 266 nm dis-sociation pulses were therefore compressed to 260 fs. The peak intensitywas 2×10¹² W/cm2. In the adiabatic alignment experiment the pulses werestretched to 1.5 ps because the presence of the alignment pulse enhanceddirect dissociative ionization. In this experiment the alignment and dissoci-ation pulses do not coincide in time. The 266 nm pulses were later stretchedto 400–500 fs to minimize ions produced by dissociative ionization of the266 nm pulse alone.
The ionization pulse wavelength was initially set to ionize I? (303.96 nm).The absorption cross section is smaller for the n → σ? transition leading toI? than for the n → σ? transition leading to I, the transition is therefore notsaturated even though the intensity of the dissociation pulse is high. Forthe later experiments (pulse duration, two pulse alignment, and rotationalrevivals) the ionization pulse wavelength was set to ionize I (304.59 nm). Inthose experiments the 266 nm pulses were longer (∼400 fs) and the intensitylower, ensuring saturation could be avoided.

5.1 Alignment with one pulse 77
5.1.2 Ion images and 〈cos2 θ〉Figure 5.2 shows ion images recorded at different delays between the 1.9 psalignment pulse and the dissociation pulse. The intensity of the alignmentpulse was kept under the threshold for multi photon ionization. When themolecules are dissociated prior to the alignment pulse (fig. 5.2 b), the imageis similar to the image without the alignment pulse (fig. 5.2 a). When thealignment and dissociation pulses coincide in time (fig. 5.2 c) the ion imageis dominated by high kinetic energy ions. The high kinetic energy ions areproduced in an ionization process involving photons from both alignmentand dissociation pulses. In the ion image recorded immediately after thealignment pulse is over (fig. 5.2 d), a significant angular confinement alongthe (vertical) alignment axis is observed. We interpret this confinement asmolecular alignment. Note that this alignment occurs under field-free con-ditions. At longer delays the alignment goes to a local minimum (fig. 5.2 e)and a weak local maximum (fig. 5.2 f) before stabilizing at a weak perma-nent level. Much later rotational revivals are observed as demonstrated inthe next chapter.
As described in sect. 4.4.3 the molecular distribution prior to dissoci-ation, fmol(θ), and 〈cos2 θ〉 can be obtained from the ion images. As insect. 4.4.3, a background image recorded without the ionization pulse issubtracted to account for the ions produced directly by the dissociationpulse. When the alignment and dissociation pulses do not coincide in timethis background is small, 10–15%. However, when there is temporal over-lap the ‘background’ ions comprise up to 75% of the total ion hits. Toaccount for experimental fluctuations of the dissociation pulse energy, thebackground images were scaled so that the high-kinetic energy part of im-age and background image matched (only background ions reside in thehigh kinetic energy part of the image). The background subtracted images

78 Non-adiabatic alignment – short time dynamics
Figure 5.2: Ion images of I? photo fragments of iodobenzene dissociated at dif-ferent times, t, compared to the peak of the 1.9 ps non-adiabatic alignment pulse.a) No alignment pulse, b) t = −2.3 ps, c) t = −0.3 ps, d) t = 2.2 ps, e) t = 5.7 ps,f) t = 7.7 ps.
were Abel inverted and divided by the probe selectivity to obtain fmol(θ),from which 〈cos2 θ〉 was obtained.
Figure 5.3 shows both the fmol(θ) distribution and the obtained 〈cos2 θ〉values. Note that during the alignment pulse (-1.5 to 1.5 ps) the calculationsignificantly underestimates 〈cos2 θ〉 since direct ionization from the com-

5.1 Alignment with one pulse 79
Figure 5.3: Alignment of iodobenzene by a 1.9 ps (FWHM) 800 nm pulse witha peak intensity of 3.4×10¹² W/cm2. a) Cross correlation trace of the alignmentpulse (full curve) and 〈cos2 θ〉 values obtained from the ion images (squares, linesbetween points included to guide the eye). During the alignment pulse the 〈cos2 θ〉values are significantly underestimated, these are marked with circles and con-nected with dotted lines. b) fmol(θ) calculated from the ion images.
bined dissociation and alignment pulses depletes the best aligned molecules.The small dip of 〈cos2 θ〉 in the beginning of the alignment pulse is an arte-fact created by this effect. The strongest alignment in terms of 〈cos2 θ〉is reached at t ≈ 2.1 ps with 〈cos2 θ〉=0.59. The most pronounced con-finement of fmol(θ) is reached slightly earlier at t ≈ 1.8 ps. The exactdetermination of the timing of the peak of alignment is thus dependent onwhich measure is used (cf. sect. 2.1.2).
5.1.3 Dependence on intensity and rotational temperature
Figure 5.4 illustrates how non-adiabatic alignment depends on the intensityof the alignment pulse and on the rotational temperature of the samplemolecules.

80 Non-adiabatic alignment – short time dynamics
Figure 5.4: 〈cos2 θ〉 values from ion images of aligned iodobenzene moleculesseeded in 3 bar helium (circles connected by solid lines) and 1 bar helium (squaresconnected by dotted lines). The connecting lines serve to guide the eye. A higherseedgas pressure corresponds to a lower rotational temperature. Also shown isthe cross correlation trace of the alignment pulse (full curve). a) Alignment pulsepeak intensity, I0 = 1.0 × 10¹² W/cm2, b) Alignment pulse peak intensity, I0 =3.4× 10¹² W/cm2.
Intensity dependence
Comparing fig. 5.4 a) and b) it is seen that a lowering of the intensitydecreases the maximum obtained degree of alignment. Furthermore, thedynamics become slower, the alignment reaches its maximum later, andthe molecules are aligned for a longer time.
These result agree with the argument that a higher intensity of thealignment pulse creates a broader wave packet resulting in stronger align-ment. With more states in the wave packet the dephasing becomes faster.In classical terms the increased angular momentum corresponds to an in-creased angular velocity.
Figure 5.5 shows a quantum mechanical calculation of the alignment
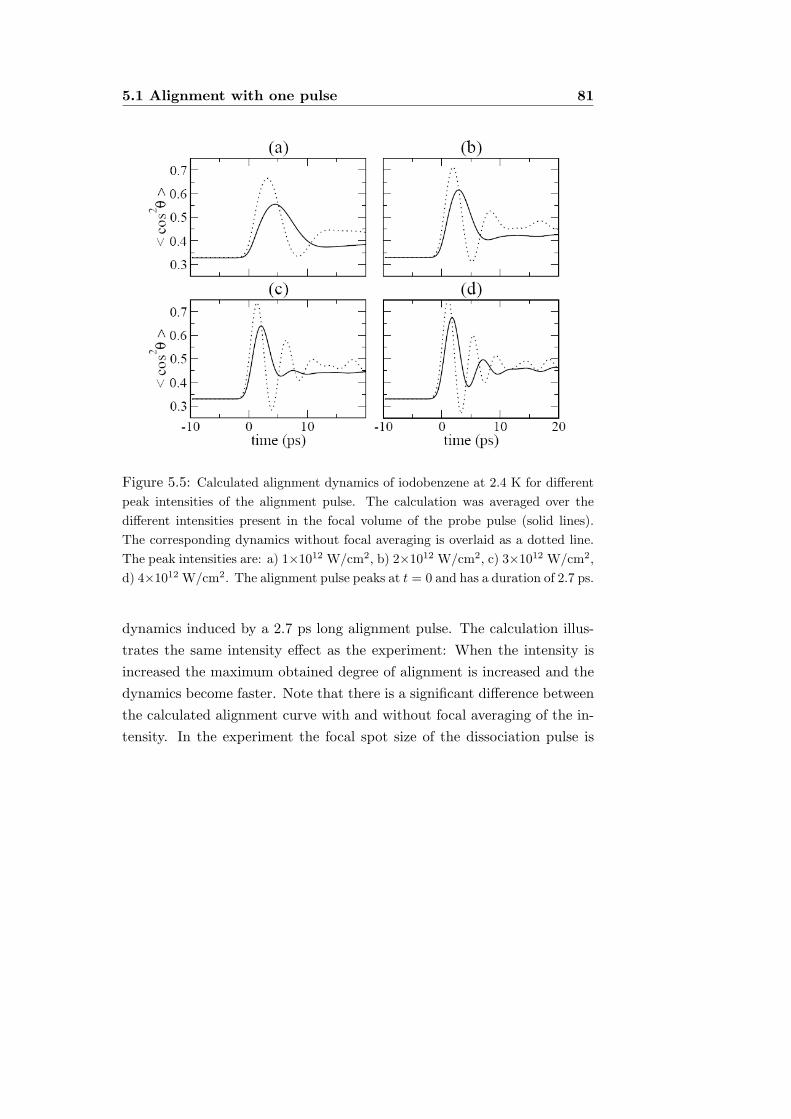
5.1 Alignment with one pulse 81
Figure 5.5: Calculated alignment dynamics of iodobenzene at 2.4 K for differentpeak intensities of the alignment pulse. The calculation was averaged over thedifferent intensities present in the focal volume of the probe pulse (solid lines).The corresponding dynamics without focal averaging is overlaid as a dotted line.The peak intensities are: a) 1×10¹² W/cm2, b) 2×10¹² W/cm2, c) 3×10¹² W/cm2,d) 4×10¹² W/cm2. The alignment pulse peaks at t = 0 and has a duration of 2.7 ps.
dynamics induced by a 2.7 ps long alignment pulse. The calculation illus-trates the same intensity effect as the experiment: When the intensity isincreased the maximum obtained degree of alignment is increased and thedynamics become faster. Note that there is a significant difference betweenthe calculated alignment curve with and without focal averaging of the in-tensity. In the experiment the focal spot size of the dissociation pulse is

82 Non-adiabatic alignment – short time dynamics
a factor of 1.5 smaller than the spot size of the alignment pulse. Averag-ing over the alignment intensities present in the focus of the dissociationpulse shortens the duration of the initial alignment peak and significantlydampens the oscillations following the first peak of alignment.
Dependence on the rotational temperature
The rotational temperature can be decreased by increasing the pressure ofthe seed gas. Comparing the 〈cos2 θ〉 values obtained at two different seedgas pressures, it is seen that a decrease of the rotational temperature givesa higher degree of alignment with only small changes to the dynamics. Thehighest degree of alignment is reached at the same time and drops off withthe same speed.
Figure 5.6 shows a quantum mechanical calculation of the alignmentdynamics at different rotational temperatures. The calculation shows thesame effect of an increase in the rotational temperature: a decrease of theobtained alignment and only small changes to the dynamics (the align-ment peak becomes slightly narrower at higher temperatures). The curvecorresponding to a rotational temperature of 2.4 K is quite close to the ex-perimental curve obtained when the molecules are seeded in 3 bar helium(fig 5.4 a). The rotational temperature of the experiment is not accuratelyknown. Comparing with the calculation we conclude that iodobenzeneseeded in 3 bar helium obtain a rotational temperature of 2–3 K.
5.1.4 Alignment pulse duration
Another very important parameter for the degree of alignment is the pulseduration. For a given pulse duration the peak intensity of the alignmentpulse must be low enough that direct multi photon ionization by the align-

5.1 Alignment with one pulse 83
Figure 5.6: Calculated Alignment dynamics of iodobenzene at different rotationaltemperatures following a 2.7 ps alignment pulse centered at t = 0 for a focalaveraged peak intensity of 1×10¹² W/cm2. The calculation was averaged over thedifferent intensities present in the focal volume of the probe pulse. The rotationaltemperature was: 0 K (solid), 0.4 K (dotted), 1.2 K (dashed), 2.4 K (dot-dashed).
ment pulse is negligible. Figure 5.7 shows the alignment dynamics ofiodobenzene following non-adiabatic alignment pulses with different pulsedurations. The intensity of each alignment pulse was chosen to be as highas the molecules could tolerate, i.e. just below the threshold for multi pho-ton ionization. In practice this was ensured by keeping the background ionsignal from multi photon ionization by the alignment pulse constant at avery low value. The pulse energy was higher for the longer pulses (thoughthe peak intensity was lower).
This experiment was done as part of the experiments regarding the com-parison and combination of adiabatic and non-adiabatic alignment (chap-ter 7). The probe pulse was therefore an ultrashort 20 fs intense 800 nm

84 Non-adiabatic alignment – short time dynamics
Figure 5.7: Alignment of iodobenzene, 〈cos2 θ2D〉, induced by alignmentpulses with different durations (the lines between the points serve to guidethe eye). Also shown are the cross correlation traces of the alignmentpulses (full curves). The peak intensity of the alignment pulses was cho-sen so that the background ion signal from multi photon ionization by thealignment pulse was kept constant at a very low level. The alignment wasprobed with a 20 fs Coulomb explosion pulse (see sect. 7.1), without align-ment pulse 〈cos2 θ2D〉 = 0.65. a) τFWHM = 1.1 ps, I0 = 6.9× 10¹² W/cm2,b) τFWHM = 1.5 ps, I0 = 6.2× 10¹² W/cm2, c) τFWHM = 2.1 ps,I0 = 5.8× 10¹² W/cm2, d) τFWHM = 3.1 ps, I0 = 4.9× 10¹² W/cm2.

5.1 Alignment with one pulse 85
pulse that Coulomb explodes the molecules (see sect. 7.1). With this probe〈cos2 θ〉 cannot be obtained and 〈cos2 θ2D〉 measured directly on the ionimage was therefore used as a qualitative measure of alignment. For thisprobe 〈cos2 θ2D〉 = 0.65 when no alignment pulse is present.
The maximum obtained degree of alignment is almost the same for allpulse durations in fig. 5.7, 〈cos2 θ2D〉 ≈ 0.81. Note that an even shorterduration (< 1 ps) will induce a weaker alignment as the pulse energy inthat case has to be significantly decreased to avoid multi photon ionization.It is only for the 2.1 ps pulse the peak occurs after the alignment pulseunder field-free conditions. For the other pulse durations the alignmentpeak occurs during the pulse (though close to field-free conditions for the1.5 ps pulse3). The timing of the peak of the alignment is not in agreementwith the predictions of the simple classical kicked rotor model (sect. 2.3.2).The reason is that the pulses at these high intensities are too long to beconsidered a “sudden kick”.
We conclude that a pulse duration of 1.5–2.5 ps is optimal for obtainingfield-free alignment of iodobenzene. Using a longer or shorter pulse, theintensity must be decreased to delay the alignment peak causing a lowerdegree of alignment4. Alternatively pulse shaping[67, 68] can be employedto ensure a steep decline of alignment pulse so that the alignment peaksunder field-free conditions.
In all the experiments presented in this thesis the alignment pulses
3The volume probed by the Coulomb explosion probe is much smaller than that of the
dissociation probe. Thus the average intensity is higher causing a slightly earlier peak
of alignment than observed with the dissociation probe. When the dissociation probe is
used the alignment induced by a 1.5 ps pulse peaks under field-free conditions.4For pulses shorter than those of this experiment the alignment peaks under field-
free conditions but the intensity has to be significantly decreased resulting in weaker
alignment.

86 Non-adiabatic alignment – short time dynamics
have had negative chirp. We do not expect the chirp to play a role asthe spectral width of the alignment pulse (∆ν ≈ 5 THz) is much largerthan required for the Raman transitions responsible for creating the wavepacket (∼1–500 GHz). This assumption was tested by investigating theshort time dynamics and the first rotational revival of alignment inducedby a 1.4 ps alignment pulse with either positive or negative chirp. Theobserved differences were well within the experimental uncertainties.
5.2 Alignment with two pulses
5.2.1 Idea
As stated in the last section the intensity of the alignment pulse is limited bythe onset of multi photon ionization. To overcome this problem Averbukhand coworkers[69, 41, 42] suggested to use a train of short pulses rather thanjust one alignment pulse. Using the quantum mechanical kicked rotor model(sect. 2.2.3) they calculated optimal delays and intensities for alignment ofa linear molecule using two or three alignment pulses. With two alignmentpulses the calculations for molecules initially at T = 0 K predicted that thesecond pulse should be fired close to the peak of the alignment induced bythe first pulse and the intensity of the second pulse should be approximatelya factor of 10 higher than the first pulse. At higher rotational temperaturesmore intensity is required in the first pulse.
The basic idea of using more than one alignment pulse is readily under-stood from the classical kicked rotor model (sect. 2.3.2). The first align-ment pulse forces a large number of molecules into the angular range wheresin(θ) ≈ θ. The second pulse ‘kicks’ the molecules with an impulse pro-portional to θ causing the molecules to align, i.e. reach θ = 0 at the sametime.

5.2 Alignment with two pulses 87
5.2.2 Experiment
The experiments presented here show that the non-adiabatic alignmentof iodobenzene can be strongly enhanced by using two alignment pulsesinstead of one. The results are published in [4].
The two alignment pulses have parallel linear polarizations and bothhave a duration of 1.4 ps. This is the shortest duration of the alignmentpulse, for which the alignment induced by an intense pulse is still peakingunder almost field-free conditions (cf. fig. 5.7). By choosing relatively shortalignment pulses interference effects at short delays between the pulses canbe avoided.
We use our usual probe scheme of dissociation with a 266 nm pulse fol-lowed by resonantly enhanced multi photon ionization and extract 〈cos2 θ〉from the ion images.
5.2.3 Alignment dynamics
We have mainly investigated the short time dynamics of the two-pulsealignment scheme, since our primary motivation for using two pulses isto enhance the alignment. The strongest alignment (for an asymmetrictop molecule) is found shortly after the alignment pulse[5]. Averbukh andcoworkers[41, 42] proposed to fire the second pulse at a rotational revival.Their calculations were done on a linear molecule, which has perfect recur-rences at the rotational revivals. This scheme was used in the two-pulseexperiment on N2 by Lee et al.[70], which was published simultaneous withour two-pulse experiment.
Figure 5.8 shows experimental 〈cos2 θ〉 values at different times ob-tained with one or two alignment pulses. The first (weak) alignment pulsehas a peak intensity of 1.4×10¹² W/cm2. The second (strong) alignment

88 Non-adiabatic alignment – short time dynamics
Figure 5.8: 〈cos2 θ〉 vs. time for the first pulse only (squares), the second pulseonly (triangles), and both pulses (filled circles). The lines serve to guide the eye.The intensity shapes (cross correlation traces) of the alignment pulses are givenby the dotted line (arb. units).
pulse is delayed 4.5 ps with respect to the first and has a peak intensityof 4.1×10¹² W/cm2. When only the first weak alignment pulse is used(squares) the degree alignment peaks at 〈cos2 θ〉 = 0.52 close to t = 5 ps,after which it drops off to a permanent level at 〈cos2 θ〉 ≈ 0.37. Whenonly the second strong alignment pulse is used the alignment dynamics isfaster and the degree of alignment peaks at 〈cos2 θ〉 = 0.56 only ∼2 psafter the peak of the alignment pulse, in agreement with the results pre-sented in the previous section. When both alignment pulses are used thealignment still peaks ∼2 ps after the peak of the second alignment pulsebut now 〈cos2 θ〉 = 0.66. The obtained degree of alignment is thus signifi-cantly higher with two alignment pulses than with the second strong pulsealone. Note that the high degree of alignment is reached under field-freeconditions.

5.2 Alignment with two pulses 89
Figure 5.9: The alignment dynamics due to a single pulse (centered at t = 4.5 ps)with a peak intensity of 5.5×10¹² W/cm2 (diamonds) and due to the two-pulsesequence illustrated in fig. 5.8 (filled circles). The lines between the points serveto guide the eye. The total energy of the two-pulse sequence as the same as theenergy of the single intense pulse.
To ensure that the enhancement of alignment is not an effect of the extrapulse energy of the two-pulse experiment we also investigated the dynam-ics following a single alignment pulse with peak intensity 5.5×10¹² W/cm2
(fig. 5.9). This pulse has the same pulse energy as the total energy ofthe two-pulse sequence. For the single intense pulse the alignment peaksat 〈cos2 θ〉 = 0.57, much lower than with the two-pulse scheme and only 0.01higher than the alignment obtained with a peak intensity of 4.1×10¹² W/cm2.The intensity cannot be increased more without causing multi photon ion-ization of the molecules. A stronger alignment can therefore not be ob-tained by increasing the intensity of the alignment pulse. By distributingthe available pulse energy in two pulses we have thus surpassed the limitto the alignment imposed by the maximum intensity a molecule can be

90 Non-adiabatic alignment – short time dynamics
exposed to without causing ionization.
5.2.4 Pulse to pulse delay
The calculations of Averbukh and coworkers[41, 42] predicted that the sec-ond pulse should be fired close to the peak of the alignment induced by thefirst. The timing of the pulse sequence in fig. 5.8 was therefore chosen sothat the second pulse was fired at the peak of the alignment induced by thefirst. To investigate the effect of the relative timing of the two alignmentpulses, we measured 〈cos2 θ〉 2 ps after the second pulse for different pulseto pulse delays. We chose to measure 2 ps after the second pulse becausethe strongest field-free alignment is found at this time (cf. fig. 5.8).
Figure 5.10: a) 〈cos2 θ〉 measured 2 ps after the second pulse as a function ofthe delay between the two alignment pulses. The peak intensity of the first pulseis 1.4×10¹² W/cm2, the peak intensity of the second pulse is 4.1×10¹² W/cm2.b) 〈cos2 θ〉 obtained with the first pulse only. The data displayed in this figurewere recorded at a higher rotational temperature than fig. 5.8 and 5.9 and theobtained degree of alignment is therefore lower.
Figure 5.10 a) shows the strongest field-free alignment obtained with atwo-pulse sequence as a function of the delay between the pulses. The best
5.2 Alignment with two pulses 91
degree of alignment is reached when the second pulse is fired approximately5.5 ps after the first. Figure 5.10 b) shows the alignment obtained with thefirst pulse only. The alignment induced by the first pulse peaks at 5.5 ps.The prediction that the second pulse should be fired close to the peak ofthe alignment induced by the first is thus confirmed.
5.2.5 Intensity ratio, I1/I2
For the data displayed in fig. 5.10 an intensity ratio of the alignment pulses,I1/I2 = 1/3, was used. We have also investigated the dependence of thepulse to pulse delay for other intensity ratios. In all cases we found thatthe optimal field-free alignment occurs approximately 2 ps after the peak ofthe second pulse and when the second pulse is sent at or slightly after thepeak of the alignment induced by the first pulse. These observations aresummarized in fig. 5.11 where the optimal degree of alignment at differentI1/I2 ratios are displayed. The total pulse energy is the same for all pulsesequences.
As seen from fig. 5.11 the highest degree of alignment is obtained whenthe second pulse is 3–5 times more intense than the first.
5.2.6 Discussion
By splitting the pulse energy in two pulses the alignment was enhancedto 〈cos2 θ〉 = 0.66 under field-free conditions. The strongest alignmentobtained in the adiabatic regime was 〈cos2 θ〉 = 0.68. Using two-pulse non-adiabatic alignment we have thus obtained molecules almost as stronglyaligned as in the adiabatic regime but under field-free conditions. Thismakes two-pulse non-adiabatic alignment the favorable choice for obtainingstrongly aligned molecules unless the molecules need to be aligned for longer

92 Non-adiabatic alignment – short time dynamics
Figure 5.11: Optimal degree of field-free double pulse alignment, measured 2 psafter the peak of the second pulse, as a function of the intensity ratio, I1/I2, fora fixed total energy. For I1/I2 = 0, I2 = 5.5 × 10¹² W/cm2 and for I1/I2 = 1,I1 = I2 = 2.6× 10¹² W/cm2.
time than a few picoseconds.The two-pulse scheme treated in this section can be regarded as one case
of a generalized pulse sequence with variable duration, timing, intensity,and polarization of the pulses tailored to achieve the strongest possiblealignment of one or more molecular axes. Efforts to optimize such pulsesequences are ongoing.
5.3 Conclusion
We have demonstrated field-free non-adiabatic alignment of the asymmetrictop iodobenzene molecule and investigated the dependence on the intensityand duration of the alignment pulse and on the rotational temperatureof the molecules. With higher intensity the molecular alignment becomes

5.3 Conclusion 93
stronger and the dynamics faster. The presence of different intensities inthe focus of the probe pulse significantly dampens oscillations after the firstalignment peak. To ensure that the alignment of iodobenzene peaks underfield-free conditions the duration of a high intensity alignment pulse shouldbe 1.5–2.5 ps. For a shorter or longer pulse the alignment peaks during thealignment pulse. Lowering the rotational temperature result in a higherdegree of alignment with only small changes to the dynamics.
We have have furthermore shown that the alignment can be significantlyenhanced by distributing the available pulse energy in two alignment pulsesinstead of one. The strongest alignment is obtained when the second pulseis timed at or slightly after the peak of the alignment induced by the firstpulse and when the second pulse is 3–5 times more intense than the first.

Chapter 6
Non-adiabatic alignment –
Rotational revivals
The revivals of alignment that appear in non-adiabatic alignment experi-ments bear strong similarities with the rotational recurrences of rotationalwave packets created by weak fields.
The ability of a short laser pulse to create a rotational wave packet thatexhibit revivals has been known the past 30 years. Already in the seventies,Lin and coworkers showed both theoretically[71] and experimentally[72]that a wave packet created by exciting CS2 molecules with a short pulseexhibits “susceptibility echoes”, rotational revivals, at regular intervalsspaced by 1/4B, B being the rotational constant (in MHz). Also non-linearmolecules exhibit rotational revivals at regular intervals determined by therotational constants. The spectrum of rotational revivals can thus be usedto measure rotational constants. This time resolved rotational spectroscop-ical method is known as Rotational Coherence Spectroscopy (RCS)[18, 19].
RCS has been performed on rotational wave packets both in an elec-
94

95
tronic excited state created through a resonant transition and on groundstate rotational wave packets created through a non-resonant Raman process[73,19], as it is done in strong laser field non-adiabatic alignment experiments.Until recently all RCS methods used weak fields to create the rotationalwave packet. Weak field induced wave packets are limited by the selectionrules of a single transition and the spectra can be simulated with perturba-tive methods. However, a recently developed method of RCS, time resolveddegenerate four wave mixing (TRDFWM)[65, 66, 19], employs strong fields.In TRDFWM experiments two simultaneous pump pulses are focused onthe sample at different angles generating a transient grating. The measuredsignal is the diffraction of a delayed probe pulse.
The number and complexity of the molecules studied with various weakfield RCS methods is high[18, 19]. In contrast rotational revivals in thestrong field limit have (except for our experiments) only been investigatedfor linear molecules. Our aim was to investigate the rotational revivals ofsymmetric and asymmetric top molecules and to bridge the gap betweenRotational Coherence Spectroscopy and strong field non-adiabatic align-ment.
The results on rotational revivals presented in this chapter pertain tothree different classes of molecules: symmetric tops, asymmetric tops ofC2v-type (where the principal axes of polarizability and inertia coincide),and asymmetric tops of general type. They are presented here in that order,although chronologically the experiments on asymmetric tops of C2v-typewere done first. Those results are published in [5]. The results on symmetrictops will be published as [6].

96 Non-adiabatic alignment – Rotational revivals
6.1 Experiment
The probe of alignment in the revival experiments is the same as in the pre-vious chapters, dissociation at 266 nm and subsequent ionization of groundstate iodine fragments.
Our usual method for obtaining 〈cos2 θ〉 is rather time consuming sinceit requires a background image without the ionization pulse and a highnumber of ion hits in both images to reduce the noise of the Abel inversion.To be able to measure alignment at a large number of different delays withina reasonable data acquisition time we have used another measure of align-ment, 〈cos2 θ2D〉. θ2D is measured directly on the 2-D image without Abelinversion. A uniform distribution of ion hits has 〈cos2 θ2D〉 = 1
2 . However,without Abel inversion it is impossible to deconvolute the probe selectivity.The measured 〈cos2 θ2D〉 values will thus also reflect the probe selectiv-ity. As a result the 〈cos2 θ2D〉 value obtained for a uniform distributionis molecule dependent. Furthermore, small differences in the experimen-tal conditions on different days might result in small differences betweenthe 〈cos2 θ2D〉 value obtained for a uniform distribution in different dataseries on the same molecule. Even with these reservations, 〈cos2 θ2D〉 isstill a good qualitative measure of the alignment in the sense that a higher〈cos2 θ2D〉 corresponds to a stronger alignment, a higher 〈cos2 θ〉. The stan-dard deviation of the measured 〈cos2 θ2D〉 values is small, ∼0.003. However,due to the long data acquisition times, a slight drift of the experimentalconditions is often observed.

6.2 Symmetric top molecules 97
6.2 Symmetric top molecules
We have studied two symmetric top molecules: methyl iodide (CH3I) andtert-butyl iodide ( (CH3)3I). The observed spectra of rotational revivalshave the same features for both molecules – transients at regular intervalsof 1/(4B), with B being the rotational constant.
6.2.1 Ion images
Figure 6.1 shows ion images of I photofragments from methyl iodide moleculesseeded in argon recorded at different times, t, with respect to the peak ofan alignment pulse with a duration of 0.75 ps and a peak intensity of1.3×1013 W/cm2.
Figure 6.1: Ion images of I photofragments from methyl iodide molecules recordedat different times, t, with respect to the peak of the alignment pulse (τFWHM =0.75 ps, I0 = 1.3 × 10¹³ W/cm2). a) No alignment pulse present, b) t = 0.8 ps,c) t = 32.8 ps, d) t = 34.2 ps.
The ion image recorded without alignment pulse (fig. 6.1 a) has tworings, both of which are angularly confined along the vertical laser polar-ization axis. The outermost ring originates from molecules dissociated bythe 266 nm pulse (n → σ? transition). The inner ring originates from
98 Non-adiabatic alignment – Rotational revivals
molecules dissociated by the 304 nm ionization pulse, which was kept ata high intensity. The appearance of this extra inner ring has no conse-quence for the experiment. Since the rings are clearly separable 〈cos2 θ2D〉and 〈cos2 θ〉 can be extracted from the radial region outside the inner ring.The number of ion hits in the ring originating from dissociation by the304 nm pulse is the same for all the images in fig. 6.1. The ring appearsto have different intensity in the images of fig. 6.1 because the images arescaled to the most intense part. When the alignment pulse is included, themolecules align immediately after the pulse (fig. 6.1 b). The two extra lowkinetic energy rings that appear in fig. 6.1 b) stem from dissociation andionization processes involving the alignment pulse, they are observed be-cause the alignment field is not completely gone. The alignment observedimmediately after the pulse quickly decays (within 2–3 ps) and the degreeof alignment is then constant at a low permanent level (〈cos2 θ〉 = 0.39) un-til the first rotational revival appear at t ≈ 34 ps. A physical explanationof this permanent alignment is given in sect. 2.2.2. At the first rotationalrevival the degree of alignment first reach a local maximum (fig. 6.1 c) afterwhich it quickly drops to a local minimum (fig. 6.1 d). Note that the imagein fig. 6.1 d) is less confined along the vertical axis than the image withoutalignment pulse (fig. 6.1 a) indicating that the molecules are confined tothe plane perpendicular to the alignment axis (due to the selectivity of thevertically polarized dissociation probe the density of the ring in the ionimage is highest at ∼ 45◦).
6.2.2 Revival spectra
To quantify the alignment dynamics and the rotational revivals 〈cos2 θ2D〉was calculated from ion images of aligned methyl iodide molecules seeded inhelium recorded at delays 1–75 ps (fig. 6.2 a). The transient at very early
6.2 Symmetric top molecules 99
time correspond to the alignment obtained immediately after the pulse.This alignment quickly dephases and the degree of alignment is then con-stant except for two rotational revivals observed close to 34 and 67 ps.Close to the transients of alignment we also measured 〈cos2 θ2D〉 on imagesrecorded with argon as seedgas (fig. 6.2 b–d). The rotational temperatureis lower with argon as seedgas. At selected times high statistics ion imageslike those shown in fig. 6.1 were recorded and 〈cos2 θ〉 extracted from thoseimages.
Since the molecules are field free from t > 1 ps the alignment dynamicshereafter are determined solely by molecular rotation. The timing of therotational revivals can readily be understood from the rotational energiesof a prolate symmetric top in the rigid rotor approximation,
Erot(J,K,M) = BJ(J + 1) + (A−B)K2, (6.1)
where A and B are the rotational constants and J , K, and M are thesymmetric top rotational quantum numbers. The energies are degeneratein M .
The selection rules for a rotational Raman transition in a symmetric topmolecule (table 2.2) are ∆J = 0,±1,±2 and ∆K = 0. All the states in therotational wave packet created by the alignment pulse will thus share thesame K quantum number. The energy difference between different statesin the wave packet is therefore always a multiple of 2B. A full rephasingof the wave packet is thus expected at regular intervals of tJ = 1/(2B)1.Halfway between these revivals the wave packet is localized in the oppositedirection causing a local minimum of the alignment. For methyl iodidetJ = 66.655 ps (appendix A). We can thus identify the transient at ∼67 ps
1tJ = 1/(2B) with B in MHz, tJ = 1/(2Bc) with B in cm−1, and tJ = π/(2B) in
atomic units.

100 Non-adiabatic alignment – Rotational revivals
Figure 6.2: Alignment of methyl iodide seeded in helium (black squares), mea-sured as 〈cos2 θ2D〉 as a function of time after the peak of the alignment pulse.Lines between points included to guide the eye. a) Long time scan, b–d) Tran-sients in the alignment. In b–d) are also shown 〈cos2 θ2D〉 for methyl iodide seededin argon (grey circles). The 〈cos2 θ〉 values are calculated from high statistics ionimages (with argon as seedgas) recorded at selected times (some of them shown infig. 6.1). The cross correlation trace of the alignment pulse (τFWHM = 0.75 ps,I0 = 1.3× 10¹³ W/cm2) is shown in b) (full curve). The alignment pulse intensitywas the maximum, the molecules could tolerate. With no alignment pulse present〈cos2 θ2D〉 = 0.71.
as the first full revival and the transient at ∼34 ps as a half revival.The results presented in fig. 6.2 confirm that the alignment present

6.2 Symmetric top molecules 101
immediately after the pulse is fully reestablished at the full revival. Therelatively modest degree of alignment obtained, 〈cos2 θ〉 = 0.49, has twocauses: the polarizability anisotropy of methyl iodide is modest, ∆α = α‖−α⊥ = 2.6 A3 and the duration of the alignment pulse is not optimized forobtaining the strongest alignment (see sect. 6.2.3). Note that 〈cos2 θ〉 < 1
3
at the half revival, corresponding to the molecular axis being confined inthe plane perpendicular to the alignment axis.
Full recurrence of the alignment at the full rotational revivals requirestwo assumptions to be met: The molecules must travel in a collision-freeenvironment and the rigid rotor approximation must hold. The low trans-lational temperature and low density of the sample molecules ensure acollision-free environment. Deviation from the rigid rotor approximationdue to centrifugal distortion will change the shape and amplitude of therevivals but not affect the permanent alignment, which is due to a local-ization of the axis of rotation. To investigate the changes to the rotationalrevivals on a longer timescale, we measured the alignment close to selectedfull revival times (fig. 6.3).
The dynamics of the first two revivals (fig. 6.3 a–b) is essentially iden-tical. From the fourth revival (fig. 6.3 c) the amplitude starts to drop. Atthe eighth and 16th revivals (fig. 6.3 d–e) the amplitude drops even moreand small changes to the general shape of the transient are visible. Themaximum delay of the dissociation pulse in the optical setup is ∼3 ns, sothe last revival we could measure was the 42nd (fig. 6.3 f). At the 42ndrevival the amplitude has dropped even more and significant changes in theshape of the transient are observed, the rise and fall have become slower.No significant change of the permanent alignment was observed. We thusascribe the changes to the shape of the revivals to centrifugal distortion.
To confirm the generality of our results on the rotational revival spectra

102 Non-adiabatic alignment – Rotational revivals
Figure 6.3: Alignment dynamics of methyl iodide seeded in argon (black squaresconnected by lines to guide the eye) near selected full rotational revival times.a) 1st full revival, b) 2nd full revival, c) 4th full revival, d) 8th full revival, e) 16thfull revival f) 42nd full revival. The dotted vertical lines indicate predicted revivaltimes t = n/(2B) + 0.4 ps, n being the revival number.
of symmetric top molecules, we also performed the experiment on anotherprolate symmetric top molecule, tert-butyl iodide (fig. 6.4).
As seen in fig. 6.4 the rotational revival spectrum of tert-butyl iodideis very similar to the spectrum of methyl iodide. The alignment obtainedimmediately after the pulse quickly dephases to the level of the permanentalignment where it is constant except for two narrow transients occurringclose to 1/(4B) and 1/(2B), the half and full rotational revivals. The onlydifference from the methyl iodide spectrum is that the alignment is notfully reestablished at the full revival. We assume this difference is due tocentrifugal distortion playing larger role for this molecule than for methyl

6.2 Symmetric top molecules 103
Figure 6.4: Alignment of tert-butyl iodide seeded in helium (black diamondsconnected by lines to guide the eye) measured as 〈cos2 θ2D〉 as a function of timeafter the peak of the alignment pulse (τFWHM = 1.1 ps, I0 = 1.0× 10¹³ W/cm2).The dashed horizontal line indicates 〈cos2 θ2D〉 without alignment pulse. The〈cos2 θ〉 values are calculated from high statistics ion images.
iodide2. We have observed that the amplitude of the second full revival (notshown) is considerably lower than the first, which confirms this assumption.
The spectrum of rotational revivals of symmetric top molecules arevery similar to those of linear molecules. The rotational energies of lin-ear molecules are described by setting K = 0 in eq. 6.1. It is therefore notsurprising that linear molecules also have full revivals at regular intervalsof 1/(2B) and half revivals in between. Some linear molecules also exhibitquarter revivals at odd multiples of 1/(8B). The reason is that the Ra-
2Since tert-butyl iodide has a smaller rotational constant the average J, 〈J〉, is higher
compared to methyl iodide. The centrifugal distortion term, −DJJ2(J + 1)2, is very
sensible to J .

104 Non-adiabatic alignment – Rotational revivals
man selection rule for linear molecules is ∆J = 0,±2. The rotational wavepacket will thus only consist of states with either even or odd J . At quarterrevival times even-J and odd-J wave packets are oppositely localized[31].Quarter revivals will thus be averaged out in a sample with the same num-ber of molecules in even and odd J states. However, for molecules belongingto the D∞h pointgroup the population of odd or even J states is affectedby nuclear spin statistics and these molecules usually have an uneven dis-tribution of odd vs. even J states resulting in observable quarter revivals.That is the case for O2 and N2[31, 65], for CO2[30, 65], and for I2[62].
The revival spectra showed in fig. 6.2 and fig. 6.4 are similar to typi-cal weak field RCS spectra except for two important differences. The firstdifference is that the first alignment maximum is not reached at t = 0 butshortly after. The second difference is the permanent alignment observedbetween the transients. These effects are not present in the perturbativelimit. TRDFWM spectra have so far been simulated using weak field theory.However, a background signal constant in time but depending on the laserintensity has been observed in TRDFWM spectra recorded by Riehn andcoworkers[74, 75]. They accounted for this effect by introducing an ad hocparameter, k, whose “physical meaning is still unclear”[74]. We believe thisbackground signal is due to permanent alignment. The short delay betweenthe peak of alignment pulse and the first alignment maximum occurringimmediately after the pulse result in a small time-shift on the revivals com-pared to t = 0. Perturbative simulations of TRDFWM spectra do not ac-count for this time-shift and it seems to be negligible in those experiments,although it is striking that the rotational constants extracted from per-turbative simulations of TRDFWM experiments usually are slightly lowerthan those obtained from standard microwave spectroscopy[65, 66, 74, 75],as expected if a small time-shift is not accounted for.

6.2 Symmetric top molecules 105
6.2.3 Duration of the alignment pulse
The shape and amplitude of the rotational revivals depend very much onthe duration of the alignment pulse. To investigate how the duration of thealignment pulse affects the rotational revivals we measured the alignment ofmethyl iodide at the first full revival for different durations of the alignmentpulse (fig. 6.5). The pulse energy, Epulse, was kept constant at 120 µJ. Theproduct of the pulse duration and peak intensity, τI0, is thus the same forall alignment pulses. As seen from fig. 6.5 the difference between minimumand maximum alignment is highest for the shortest pulses (fig. 6.5 a–b).However, the strongest alignment is achieved for the somewhat longer du-ration of 1.1 ps (fig. 6.5 c). For even longer durations (fig. 6.5 d–e) thedynamics become slower and the alignment weaker.
The shortest alignment pulses approach the “sudden kick” limit wherethe molecules do not rotate during the interaction with the alignment. Inthis limit there is no phase lag between different states in the wave packetresulting in a rotational revival with a fast dynamic and high amplitude, i.e.high difference between minimum and maximum alignment. It is howeverinteresting that the strongest alignment is reached for a longer pulse. Webelieve this observation can be explained by the argument used to explainthe enhanced alignment obtained when the alignment pulse is split in two(sect. 5.2). When the alignment pulse is long enough that the moleculescan rotate during the interaction the first part of the alignment pulse canprealign the molecules and thereby enhance the alignment induced by theremaining part of the pulse. When the duration of the alignment pulsebecomes too long the adiabatic limit is approached. The slow decay of thealignment pulse will then destroy the alignment.
We can thus conclude that alignment with a very short pulse gives thenarrowest transient with the highest modulation. A short pulse is thus

106 Non-adiabatic alignment – Rotational revivals
Figure 6.5: Alignment of methyl iodide seeded in helium (black squares connectedby lines to guide the eye), measured as 〈cos2 θ2D〉 at times close to the first fullrotational revival. The durations of the alignment pulses, τFWHM, were: a) 0.5 ps,b) 0.75 ps, c) 1.1 ps, d) 1.7 ps, e) 2.6 ps. The energy, Epulse, of the alignment pulsewas kept constant at 120 µJ, this corresponds to a peak intensity of the shortest(0.5 ps) pulse of 1.6×10¹³ W/cm2. The horizontal lines indicate 〈cos2 θ2D〉 withoutalignment pulse.
preferable for spectroscopic purposes where one is interested in the timingof the revivals rather than the obtained degree of alignment. However, asomewhat longer pulse (1.1 ps) is preferable when the strongest alignmentis wanted. Note that the pulse energy was chosen so that the intensityof the shortest pulses were the maximum tolerable by molecules. For thelonger pulses the intensity can be increased slightly resulting in strongeralignment.
To confirm the generality of our results we performed a similar pulse

6.2 Symmetric top molecules 107
duration experiment on tert-butyl iodide (fig. 6.6). In this experiment theintensity was the maximum tolerable by the molecules for all durations ofthe alignment pulse. The pulse energy was therefore slightly increased forthe longer pulses.
Figure 6.6: Alignment of tert-butyl iodide seeded in helium (black squares con-nected by lines to guide the eye), measured as 〈cos2 θ2D〉 at times close to thefirst full rotational revival. The durations of the alignment pulses, τFWHM, were:a) 1.1 ps, b) 1.3 ps, c) 1.8 ps. The energy, Epulse, of the alignment pulse was in-creased slightly with the pulse duration, so that the intensity was kept at the max-imum tolerable by the molecules. The peak intensities were: a) 1.0×10¹³ W/cm2,b) 9 × 10¹² W/cm2, c) 6 × 10¹² W/cm2. The horizontal lines indicate 〈cos2 θ2D〉without alignment pulse.
The dependence of the alignment on the pulse duration for tert-butyliodide (fig. 6.6) is similar to the observations on methyl iodide. Themodulation of the transient is highest for the shortest alignment pulses(fig. 6.6 a–b) but a stronger alignment is achieved with a longer alignmentpulse (fig. 6.6 c).

108 Non-adiabatic alignment – Rotational revivals
6.3 Asymmetric top molecules of C2v type
The rotational energies of asymmetric top molecules cannot be describedby a simple formula like eq. 6.1 for symmetric top molecules. As a con-sequence the question of when revivals occur and how strong they are, isnon-trivial. To investigate the revival spectra of asymmetric top moleculesof C2v type, we performed alignment experiments on the iodobenzene andiodopentaflurobenzene molecules. The results are confirmed by quantummechanical calculations.
6.3.1 Revival spectra
To investigate the revival spectrum of an asymmetric molecule we recordedlow statistics ion images of iodobenzene molecules subject to a 2.7 ps align-ment pulse (I0 = 4× 10¹² W/cm2) with delays of the dissociation pulse inthe range 0–800 ps. The ion images were similar to those shown in fig. 5.2.〈cos2 θ2D〉 values calculated from the ion images are shown in fig. 6.7.
As seen before the alignment reached immediately after the pulse quicklydephases and the degree alignment drops to the level of the permanentalignment as for the symmetric top molecules. Hereafter the degree ofalignment is essentially constant except for three prominent and very nar-row transients. The strongest transients occur close to 378 and 756 ps. Aweak transient also appears close to 703 ps. In order to quantify the align-ment high statistics ion images were recorded close to the transients and〈cos2 θ〉 extracted from these images. The results are shown in fig. 6.8.
I will focus first on the timing of the revivals. The alignment maximumafter the pulse is reached at t = 2.0 ps (fig. 6.8 a) and the three subsequenttransients are centered at 378.8 ps, 702.7 ps, and 755.9 ps respectively(fig. 6.8 b–d). As the molecules are field free from ∼2 ps the timing of

6.3 Asymmetric top molecules of C2v type 109
Figure 6.7: 〈cos2 θ2D〉 determined from iodobenzene ion images. The images from400–800 ps (circles) are recorded with a slightly weaker alignment pulse than theimages from 0–400 ps (squares). A slight drift of the experimental conditions arethe cause of the weak long term changes. When no alignment pulse is present〈cos2 θ2D〉 = 0.69. Lines between the points are included to guide the eye.
the revivals is determined by the rotational motion of the molecules. Theprincipal axes of iodobenzene are shown in the inset in fig. 6.8. The a-axisis the molecular symmetry axis, the b-axis is the axis in the molecular planeperpendicular to the a-axis, and the c-axis is perpendicular to the molecularplane. The rotational constants are accurately known (see appendix A) andthe asymmetry parameter is κ = −0.965. Iodobenzene is therefore a near-prolate molecule (κ = −1 is the prolate symmetric top limit).
To simplify the connection with RCS methods, we classify the revivals

110 Non-adiabatic alignment – Rotational revivals
372 376 380 384
0.35
0.40
0.45
0.50
0.55
<cos
2 q>
time (ps)
a)
b) d)
c)
-2 0 2 4 6
0.35
0.40
0.45
0.50
0.55
0.60
0.65
<cos
2 q>
time (ps)696 700 704 708
0.35
0.40
0.45
0.50
0.55
time (ps)
752 756 760 764
0.35
0.40
0.45
0.50
0.55
time (ps)
Figure 6.8: 〈cos2 θ〉 calculated from Abel inverted images at different delays.a) Right after the pulse b)–d) At the revival times. In a) is also shown the shapeof the alignment pulse in arbitrary units on the ordinate axis. Lines between thepoints are included to guide the eye. Inset: The principal axes of iodobenzene.
with the RCS nomenclature introduced by Felker[73]. The time spacing be-tween the early alignment peak (fig. 6.8 a) and the first revival (fig. 6.8 b) is376.8 ps and the time spacing between the first and third revival (fig. 6.8 d)is 377.1 ps. Comparing with 1/(4C) = 377.29 ps we identify the first andthird revivals as the first and second C-type revivals. The separation be-tween the early alignment peak and the second revival (fig. 6.8 c) is 700.5 ps.
6.3 Asymmetric top molecules of C2v type 111
This is close to 1/(B + C) = 707.7 ps and we identify this transient as thefirst full J-type revival. The appearance of the J-type revival is due tothe fact that iodobenzene is a near-prolate. The rotational energies cantherefore with a good approximation by described by eq. 6.2,
Erot(J,K−1,M) = BJ(J + 1) + (A−B)K2−1, B =
B + C
2, (6.2)
where J , K−1, and M are the symmetric top quantum numbers. As for sym-metric tops states in the wave packet with the same K−1 differ in energy bymultiples of (B+C) causing full revivals spaced by 1/(B+C). Equation 6.2is only an approximation and especially for large J it underestimates theenergies. As stated before the wave packets of our experiments are verybroad (the average value of J , 〈J〉, is above 45 [2]), the J-type revival istherefore expected to appear slightly earlier than 1/(B+C), which is indeedthe case. Retaining the symmetric top analogy a half J-revival is expectedclose to 1/(2(B + C)). We could not resolve this transient in the aboveexperiment but later experiments performed under different experimentalconditions (shorter pulse duration) reveal a weak transient close to 356 ps.
The appearance of the C-type revivals is due to the polarizability tensorbeing significantly asymmetric. The mechanism can be explained with aclassical argument. The presence of the linear alignment field causes themolecule to experience a force that rotates the major axis of polarizability,the a-axis, closer to the field vector, i.e. the molecule experiences a torqueperpendicular to the a-axis. This is the cause of the alignment observedimmediately after alignment pulse. Since the polarizability tensor is asym-metric the molecule also experiences a force that rotates the second axisof polarizability, the b-axis, towards the plane spanned by the a-axis andthe alignment field vector, i.e. the molecule experiences a (smaller) torque

112 Non-adiabatic alignment – Rotational revivals
perpendicular to the b-axis. The only way to apply a torque that is perpen-dicular to both the a- and b-axes is to rotate around the c-axis. When thealignment field is gone there are no forces to move the axis of rotation andit will continue to be close to the c-axis. Since the molecules thus prefer torotate around the c-axis, strong C-type revivals are observed.
Next I will focus on the intensity of the transients. As seen in fig. 6.8 a)the strongest alignment is reached immediately after the pulse. The ob-served revivals are only partial revivals and the initial alignment is thereforenot completely reestablished. The C-type revivals are much stronger thanthe J-type revival. This observation is contrary to what is usually observedin RCS-spectra of near-prolate molecules: strong J-type revivals and weakC-type revivals[18]. It is an effect of the high laser intensity. High inten-sity causes a broad wave packet with high J values making the symmetrictop approximation (eq. 6.2) less valid. Furthermore, the displacement ofthe axis of rotation that gives rise to the C-type revivals becomes morepronounced.
Figure 6.9 shows a quantum mechanical calculation of the alignmentdynamics of iodobenzene subject to an alignment pulse with different in-tensities. The calculation was done at a much lower temperature than theexperiment and without averaging the intensity over the focal volume of theprobe pulse as it was done in the calculations presented in previous chapter.The calculated spectra in fig. 6.9 therefore have a much more oscillatorystructure at the transients compared to the experiment. The calculationsshow how the intensity affects the amplitudes of the J- and C-type revivals.At the lowest intensity (fig. 6.9 a) the J-type revival is strongest whereasthe C-type revival is dominant at the higher intensities (fig. 6.9 b–d). Thecalculation thus confirms that C-type revivals dominate at high intensities.

6.3 Asymmetric top molecules of C2v type 113
Figure 6.9: Quantum mechanical calculation of 〈cos2 θ〉 of iodobenzene initiallyat 0.4 K subject to a 2.6 ps alignment pulse with peak intensities: a) 6.0 ×10¹¹ W/cm2, b) 1.0× 10¹² W/cm2, c) 2.0× 10¹² W/cm2, d) 3.0× 10¹² W/cm2.
6.3.2 Molecular asymmetry
As stated the iodobenzene molecule is a near-prolate. To further inves-tigate the revival spectra of asymmetric top molecules we performed thesame experiment on the iodopentafluorobenzene molecule (C6F5I), whichis much more asymmetric than iodobenzene. There are no values for therotational constants of this molecule in the literature but assuming somestandard bond lengths the rotational constants can be estimated (see ap-pendix A). The asymmetry parameter is κ = −0.742, far from the prolatelimit. The polarizability of this molecule is approximately as asymmetric

114 Non-adiabatic alignment – Rotational revivals
as the polarizability of iodobenzene, C-type revivals are therefore expectedwith intervals of 1/(4C) ≈ 921.8 ps. Ion images were recorded close to theexpected revival times and 〈cos2 θ2D〉 extracted. At the local maxima andminima high statistic ion images were recorded, from which 〈cos2 θ〉 wasextracted. The results are shown in fig. 6.10.
Figure 6.10: 〈cos2 θ2D〉 calculated from ion images of iodopentafluorobenzeneat different delays (without alignment pulse 〈cos2 θ2D〉 = 0.65). a) Right afterthe pulse b)–c) At the C-type revival times. In a) is also shown the shape of thealignment pulse (τFWHM = 2.5 ps, I0 = 5×10¹² W/cm2) in arbitrary units on theordinate axis. At local minima and maxima 〈cos2 θ〉 values have been determinedfrom high statistic images.
From fig. 6.10 it is seen that this molecule also exhibit strong C-typerevivals. The delay between the two C-type revivals is 921.1±0.5 ps fromwhich we obtain a rotational constant C = 271.4±0.2 MHz, in perfect agree-ment with the estimated value (C = 271.2 MHz). A possible J-type revivalshould appear close to 1/(B + C) = 1563 ps. However, since iodopentaflu-orobenzene is far from near-prolate a J-type revival is not expected forthis molecule. We examined the interval 1547–1579 ps without finding anysignificant transient, consistent with expectation.
The quantum mechanical calculation shown in fig. 6.11 illustrate howthe revival spectrum changes with increasing molecular asymmetry. The

6.3 Asymmetric top molecules of C2v type 115
Figure 6.11: Quantum mechanical calculation of 〈cos2 θ〉 of an iodobenzene-like molecule initially at 0.4 K subject to a 2.6 ps alignment pulse (I0 =2.0× 10¹² W/cm2) for different values of the C rotational constant: a) symmetrictop limit, C = B (κ = −1), b) iodobenzene value (κ = −0.965), c) C = 500 MHz(κ = −0.90), d) C = 300 MHz (κ = −0.83). The A and B rotational constantswere kept constant at the iodobenzene values.
calculation was done on an iodobenzene-like molecule with different val-ues for the C rotational constants. In the prolate symmetric top limit(fig. 6.11 a) the spectrum is like the methyl iodide spectrum shown infig. 6.2 with full recurrences of the alignment at intervals of 1/(2B). Whenthe asymmetry increases (fig. 6.11 b) the revivals separate into J- and C-type revivals. With increasing asymmetry (fig. 6.11 c–d) the amplitude ofthe J-type becomes rapidly weaker compared to the C-type revivals. The

116 Non-adiabatic alignment – Rotational revivals
C-type revivals drop in amplitude and become broader.
The calculation confirms and generalizes our experimental results. Thealignment on the revivals is strongest in the symmetric top limit but alsovery asymmetric molecules like iodopentafluorobenzene have significant ro-tational revivals.
6.4 Asymmetric top molecules of general type
The principal axes of polarizability and inertia of the asymmetric topmolecules of the previous section coincided due to symmetry. However,for most asymmetric top molecules that is not the case. To investigate therevival spectrum of asymmetric top molecules belonging to this more gen-eral class we chose to perform alignment experiments on ethyl iodide andpropyl iodide (fig. 6.12).
Figure 6.12: a–c) Structure, asymmetry of the inertia tensor, κ, and angle be-tween the major axis of polarizability and the C–I bond axis, δpol for a) ethyliodide, b) gauche propyl iodide, c) trans propyl iodide. d) MOPAC molecularmechanics energy optimization of the conformers and transition states of propyliodide (the curve is an interpolation of these points).
At room temperature the propyl iodide molecule exists in two different

6.4 Asymmetric top molecules of general type 117
conformers. The trans conformer (fig. 6.12 c) where the iodine and carbonatoms are located in a plane is thermodynamically the most stable. Thegauche conformer is obtained from the trans by rotating the end-methylgroup 126.3◦ around the C1–C2 axis[76]3. Figure 6.12 d) shows a MOPACmolecular mechanics energy optimization of the conformers and transitionstates. The method of calculation is very simple, so the calculated valuesare only crude estimates. The energy barrier between the conformers islow (∼4 kJ/mole) and the conformers can therefore rapidly interconvert atroom temperature (where kT = 2.5 kJ/mole). A Boltzmann distributionat room temperature has ∼40% of the molecules in the gauche conformer4.
6.4.1 Angle of detection
For these molecules the detection axis, the C–I bond axis, is not coin-ciding with the major axis of polarizability but located at an angle, δpol
(fig. 6.13 a). The detection axis is thus different from the molecular axisthat is aligned.
To see how this would affect the experiment a calculation was made,in which experimentally obtained distributions or orientation of alignedmethyl iodide molecules, fmol(θ), were used to calculate the distribution ofa detection axis, fmol(θCI), for a given δpol. 〈cos2 θCI〉 was then calculatedfrom fmol(θCI) (fig. 6.13 b). In the calculation it was assumed that for agiven angle of the major axis of polarizability, θ, the detection axis couldbe located with equal probability anywhere on the circle described by δpol.
3The two conformers differ not only in the ICCC dihedral angle, the other internal
coordinates are slightly different4The MOPAC molecular mechanics calculation estimate the energy difference between
the conformers to 2.84 kJ/mole. Accounting for the two-fold degeneracy of the gauche
conformer this corresponds to 39% of the total population being in the gauche conformer
for molecules in thermal equilibrium at 298 K.

118 Non-adiabatic alignment – Rotational revivals
Figure 6.13: a) Ethyl iodide axes and angles: alignment pulse polarization (Z-axis), major axis of polarizability (z-axis), and C–I bond axis. Angle between C–Ibond axis and Z-axis (θCI), Angle between C–I bond axis and z-axis (δpol), andangle between Z- and z-axes (θ). b) Calculation of 〈cos2 θCI〉 as a function of δpol
for distributions of aligned molecules, fmol(θ), extracted from methyl iodide ionimages recorded at different delays corresponding to different degrees of alignment(when δpol = 0 〈cos2 θCI〉 = 〈cos2 θ〉).
This assumption requires the polarizability perpendicular to the major axisto be equal in all directions (symmetric top polarizability). For all threemolecules studied, αxx ≈ αyy (appendix A), i.e. almost symmetric toppolarizability.
From the calculation it is seen that alignment can be detected at allangles, δpol, away from the “magic angle”, arccos(
√13) = 54.7 ◦. The studied
molecules have small δpol < 20◦, for which the detection angle only resultin a slightly lower degree of observed alignment.

6.4 Asymmetric top molecules of general type 119
6.4.2 Ion images
Figure 6.14 shows ion images of I photofragments from ethyl iodide andpropyl iodide seeded in helium. Focusing first on the images without align-ment pulse (fig. 6.14 a and c), these images are similar to the methyl iodideimage (fig. 6.1 a) except that no sharp rings are observed. The kineticenergy distributions of the I fragment from these molecules are broad be-cause the ethyl and propyl fragments can be left in a very broad rangeof rotational and vibrational states. Figures 6.14 b) and d) show imagesrecorded 1 ps after the peak of the alignment pulse (τFWHM = 1.0 ps,I0 = 9 × 10¹² W/cm2). As in our previous alignment experiments a con-finement along the vertical axis is observed, which we interpret as molecularalignment. As for methyl iodide an extra ring of low kinetic energy frag-ments appears in the aligned images due to an ionization channel involvingthe alignment pulse (the alignment pulse is not completely off at t = 1 ps).
Figure 6.14: Ion images of I photofragments from ethyl iodide and propyl iodide.a+b) Ethyl iodide, c+d) propyl iodide. a+c) Without alignment pulse, b+d) 1 psafter the peak of the alignment pulse.

120 Non-adiabatic alignment – Rotational revivals
From the ion images 〈cos2 θCI〉 can be extracted, θCI being the detectedangle. We obtain 〈cos2 θCI〉 = 0.48 for ethyl iodide and 〈cos2 θCI〉 = 0.40for propyl iodide. The ion images thus confirm that a significant degree ofalignment can be obtained even though the molecular axes do not coincide.
6.4.3 Revival spectra
As for the other molecules the alignment is measured directly on the 2-Dion images as 〈cos2 θCI
2D〉.
Ethyl iodide
Figure 6.15 shows the alignment dynamics of ethyl iodide immediately afterthe pulse and at rotational revivals. All the rotational revivals are weak.Local minima appear at the predicted half J-type revival times5 (fig. 6.15 band d) and local maxima appear at the predicted full J-type revival times(fig. 6.15 c and e). At the predicted C-type revival times a complicatedpattern of weak oscillations is observed.
We believe the weakness of the revivals is at least partly due to the6◦ angle between the major axes of polarizability and inertia. Since bothinertia and polarizability of ethyl iodide are very near-prolate the J-typerevivals are expected to be stronger than the C-type revivals as observedin fig. 6.15. Since the two different revival types are very close in timeinterference between them is expected. We believe this is the cause of theoscillating patterns at the expected C-revival times. Interference mightalso partly be the cause of the low amplitude of the revivals. Oscillationsdue to interference depend strongly on the intensity of the alignment field.
5We assume the first alignment peak occurs ∼1 ps after the peak of the alignment
pulse.

6.4 Asymmetric top molecules of general type 121
Figure 6.15: Alignment dynamics of ethyl iodide seeded in helium immediatelyafter the alignment pulse and at rotational revivals measured as 〈cos2 θCI
2D〉. Thedashed horizontal lines indicate 〈cos2 θCI
2D〉 without the alignment pulse. The dot-ted vertical lines indicate expected half and full J-type revivals (t = n 1
2(B+C)+1 ps)and expected C-type revivals (t = n 1
4C + 1 ps). a) Alignment dynamics immedi-ately after the pulse, b) first half J-type revival, c) first full J-type revival, d) secondhalf J-type revival, e) second full J-type revival.
Averaging over different intensities in the focus of the probe pulse willtherefore reduce the amplitude of the oscillations. A way to reduce therange of intensities in the probed volume would be to use the Coulombexplosion probe pulse (sect. 7.1), which probes a smaller volume.

122 Non-adiabatic alignment – Rotational revivals
Propyl iodide
Figure 6.16 shows the alignment dynamics of propyl iodide immediatelyafter the pulse (fig. 6.16 a) and in the interval 140–206 ps (fig. 6.16 b).
Figure 6.16: Alignment dynamics of propyl iodide seeded in helium measured as〈cos2 θCI
2D〉. a) Immediately after the alignment pulse, b) The time interval 140–206 ps. The dotted vertical lines are the expected times for: the first half J-typerevival (t = 1
2(B+C) + 1 ps) of gauche propyl iodide (148 ps), first C-type revival(t = 1
4C + 1 ps) of gauche propyl iodide (156 ps), and first half J-type revival(t = 1
2(B+C) + 1 ps) of trans propyl iodide (195 ps).
The alignment dynamic immediately after the pulse is slower and thedegree of alignment lower for this molecule compared to ethyl iodide. Webelieve the lower degree of alignment is partly is due to a larger angle be-tween C–I bond axis and major axis of polarizability, δpol, compared toethyl iodide. Furthermore, the two propyl iodide conformers have differ-ent anisotropy of polarizability. As a consequence the trans conformer isexpected to align slightly earlier than the gauche conformer. The pres-ence of both conformers should thus result in a broader alignment peak as

6.4 Asymmetric top molecules of general type 123
observed.
The alignment spectrum in the interval 140–206 ps reveals three weaktransients. The first transient has a local minimum at 148.5 ps, very close tothe expected time for the first half J-type revival of the gauche conformer,
12(B+C) +1 ps. The second transient has a local minimum at 154.5 ps and avery weak local maximum at 157 ps, close to the expected time for the firstC-type revival of the gauche conformer, 1
4C +1 ps. The last transient has alocal minimum at 195.5 ps, very close to the expected time for the first halfJ-type revival of the trans conformer. The trans conformer is very closeto a symmetric top, κ = −0.997, and any possible C-type revival coincidewith the J-type revival.
The revival spectrum proves that both conformers are present in themolecular beam. The revivals are weak for the same reasons the ethyl iodiderevivals were weak. Furthermore, since only one conformer contribute tothe alignment the amplitude is lower.
The presence of both conformers indicate that the supersonic expansiondoes not convert the gauche conformer to the thermodynamically morestable trans conformer. The cooling of the internal motion of the moleculesand the lack of collisions mean that the molecules in the molecular beamdo not spontaneously convert from one conformer to the other.
Since the conformers are stable the rotational revivals may be used toselect one over the other. At the rotational revivals one conformer is betteraligned than the other. This could be exploited to favor the unwanted con-former in a photodissociation the same way alignment was used to controlthe photodissociation of iodobenzene (sect. 4.5). Another way of selectingone conformer is to use two pulses with wavelengths tuned to make a Ra-man transition between the conformers. This process also depend on therelative orientation of molecule and laser polarization and the rotational

124 Non-adiabatic alignment – Rotational revivals
revivals can therefore be used as a control tool as in the photodissociationscheme.
As seen in fig. 6.16 b) the revivals are very weak. We therefore suggest toenhance the alignment of one conformer by firing a second alignment pulsewhen the alignment of this conformer peaks. For example one could firea second pulse at t = 193.5 ps when the alignment of the trans conformerpeaks. The result should be an enhancement of the alignment of the transcompared to the gauche conformer.
6.5 Conclusion
We have shown that rotational revivals of alignment occur for all types ofmolecules. In the case of linear and symmetric top molecules the align-ment at the rotational revivals is as strong as the alignment immediatelyafter the peak of the alignment pulse (in the rigid rotor limit). For thesemolecules the rotational revivals are thus a suitable source of field freealigned molecules. For asymmetric top molecules the revivals are not fullrecurrences and the alignment here is weaker than immediately after thepulse. Applications requiring strong alignment should therefore employ thealignment obtained immediately after the pulse.
Since the revival times are determined by the rotational constants thespectrum of rotational revivals can be used for time resolved rotationalspectroscopy as it has been done with weak field induced alignment inRCS. As seen in sect. 6.3 the revival spectrum changes dramatically withincreasing intensity of the alignment pulse. The C-type revivals, whichare very weak in typical weak field RCS-spectra of near-prolate molecules,are very strong. It would therefore in many cases be advantageous tosupplement a weak field RCS-spectrum with a strong field spectrum.
6.5 Conclusion 125
Our method of recording revival spectra is not the most suitable forspectroscopic purposes. Due to the 20 Hz repetition rate of the molecularbeam and the need for ∼2000 laser shots to obtain a reliable 〈cos2 θ2D〉 value∼2 minutes of data recording time is needed at each delay. From the ion im-ages detailed information about the molecular distribution can be obtained(fmol(θ)). However, for rotational spectroscopy the relevant informationis the timing and shape of the revivals. This information can be gainedfaster and with more accuracy using other techniques such as degeneratefour-wave mixing[65] or time resolved birefringence measurements[72, 30].
Weak field spectra are well simulated with simple perturbative expressions[18]resulting in very precise determinations of the rotational constants. Strongfield spectra can be simulated with ab initio methods[5, 6]. However at ro-tational temperatures and intensities typically employed in the experimentsthe computational time for such calculations is many orders of magnitudetoo long for practical purposes. In order to obtain rotational constantsfrom strong field spectra with the same precision as weak field spectra anapproximative method of simulating these spectra would be appreciated.
For mixed samples consisting of different molecules, conformers, or iso-topes the rotational revivals present intriguing perspectives for selectingone species because the different species have rotational revivals at differ-ent times. With a proper method of simulation the revival spectrum couldalso be used analytically to find the composition of the sample.

Chapter 7
Combining adiabatic and
non-adiabatic alignment
The results presented in the previous chapters have shown adiabatic align-ment induced by a long pulse (chapter 4) and non-adiabatic alignmentinduced by a short pulse (chapters 5 and 6). In this chapter, the align-ment obtainable in the two regimes is compared and it is shown that thealignment is significantly enhanced when the two laser fields are combined.
7.1 Coulomb explosion probe
To make a direct comparison and to be able to combine adiabatic and non-adiabatic laser fields a probe is needed, which can be used in both types ofexperiments. This probe pulse must be short enough (≤ 0.5 ps) to provideadequate time-resolution in the non-adiabatic alignment experiment. Forthe adiabatic alignment experiments presented in chapter 4 it was necessaryto stretch the dissociation pulse to 1.5 ps to avoid direct ionization from the
126

7.1 Coulomb explosion probe 127
combined 266 nm and 1064 nm fields. Dissociation at 266 nm can thereforenot be used as a probe of alignment in this combination experiment.
Instead we chose to use a very short (∼20 fs), intense (I0 ≈ 2 ×10¹⁴ W/cm2) 800 nm pulse to probe the alignment. This very intensepulse strips one or more electrons of the molecule. The electronic repulsionbetween positive charges then causes the molecule to fragment. This pro-cess is known as a Coulomb explosion. The I+ ion is a common fragmentwhen Coulomb exploding molecules containing a C–I bond. The velocityvector of the I+ ion indicate the position of the C–I bond prior to theCoulomb explosion. It is thus possible to gain information about the dis-tribution of molecular orientations by making ion images of I+ ions as forthe dissociation probe scheme.
The two different probe schemes we have employed each have their ad-vantages and disadvantages. The Coulomb explosion probe is in principleapplicable to all molecules, not just molecules with C–I bonds. Further-more, since the intensity of the Coulomb probe is so much higher thanthat of the alignment pulse the probe process is usually not affected by thepresence of an alignment field1.
The Coulomb explosion is highly non-linear, which means that the prob-ability of the process scales with a high order of the intensity. This hasseveral effects. The effective volume probed by this pulse is much smallerthan that of the dissociation pulse, because only the molecules experiencingthe highest intensities in the focal volume are affected. Another effect of
1If the alignment and Coulomb explosion fields have different wavelengths an acci-
dental resonance might change the Coulomb ionization process. We have observed this
phenomena on methyl iodide when trying to use an 800 nm Coulomb probe in the pres-
ence of a 1064 nm adiabatic alignment field. We could therefore not use the Coulomb
explosion pulse to probe adiabatic alignment of methyl iodide. No such accidental reso-
nances were observed for iodobenzene.

128 Combining adiabatic and non-adiabatic alignment
the high non-linearity is that this probe has a very strong preference formolecules at small θ angles. As a result the intensity of the probe has to bereduced dramatically to avoid ‘saturation’ effects, i.e. the intensity is toohigh for the probability of ionization to be the product of the photon fluxand an angle dependent cross section, as it was assumed for the dissociationprobe (sect. 4.4.4). It is therefore not possible to divide by the selectivity ofthe probe to obtain the distribution of molecules prior to the probe pulse.The alignment was therefore measured directly on the 2-D ion images using〈cos2 θ2D〉 as a qualitative measure as in chapter 6. The standard deviationof the measured 〈cos2 θ2D〉 values is ∼0.006. The uncertainty is higher forthe Coulomb probe compared to the dissociation probe because the highnon-linearity makes it more vulnerable to intensity fluctuations.
Since Abel inversion was not relevant, the polarization of the Coulombprobe pulse was chosen to be circular. The difference between ion imagesrecorded with and without alignment pulse is greatest when the probe po-larization is circular. When the probe polarization is linear the ion imagewithout the alignment is already very confined along the vertical axis.
7.2 Experiment
We chose to use the iodobenzene molecule for this experiment for two rea-sons. The first reason is that we have extensive data on our “favoritemolecule”, iodobenzene, to compare our results to. The second reason isthat the presence of the 1064 nm adiabatic field does not affect the Coulombexplosion of this molecule (except through alignment).
The experiments are similar to those presented in chapters 4 and 5except that the dissociation and ionization pulses are replaced by the cir-cularly polarized Coulomb explosion probe pulse. The polarizations of both

7.3 Comparing adiabatic and non-adiabatic alignment 129
alignment pulses are linear and parallel.
7.3 Comparing adiabatic and non-adiabatic align-
ment
Since the obtained degree of alignment was quantified as 〈cos2 θ〉 in chap-ters 4 and 5 a comparison of adiabatic and non-adiabatic alignment canalready be made from those results even though the dissociation probepulse is different in the experiments. We found that the highest degreeof alignment obtained with an adiabatic pulse (〈cos2 θ〉 = 0.68) was sig-nificantly higher than the highest degree of alignment obtained with onenon-adiabatic pulse (〈cos2 θ〉 ≈ 0.62). To confirm that this result was notdue to other experimental differences such as rotational temperature, theexperiments were redone with the Coulomb explosion probe.
7.3.1 Ion images
Figure 7.1 a) shows a 2-D I+ ion image obtained with only the circularpolarized Coulomb explosion probe. Two rings are observed in the imagecorresponding to two different ionizations channels yielding I+ with differ-ent kinetic energies. In both rings an angular confinement along the verticalaxis is observed. This confinement is due to the selectivity of the probe,molecules with the C–I bond axis located close to the (vertical) polarizationplane of the circular polarized probe pulse have a higher chance of ioniza-tion. When the molecules are aligned with either a non-adiabatic pulse(fig. 7.1 b) or an adiabatic pulse (fig. 7.1 c) the usual confinement alongthe vertical axis is observed.
The images shown in fig. 7.1 b) and c) correspond to the strongest

130 Combining adiabatic and non-adiabatic alignment
Figure 7.1: 2-D ion images of I+ ions originating from Coulomb explosion ofiodobenzene. a) Circular polarized Coulomb explosion probe alone, b) Strongestalignment with a 2.1 ps non-adiabatic alignment pulse (I0 = 5.8 × 10¹² W/cm2),c) Strongest alignment with an adiabatic alignment pulse (I0 = 7.8×10¹¹ W/cm2),d) Strongest alignment with both adiabatic and non-adiabatic alignment pulses.
alignment obtained in either regime. From these images it is already evi-dent that the strongest alignment (narrowest confinement) is obtained inthe adiabatic regime. The ion image recorded with both alignment pulsespresent (fig. 7.1 d) reveal that the alignment can be significantly enhancedby including both pulses.
〈cos2 θ2D〉 calculated on either of the two rings can be used as a qualita-tive measure of alignment. The results presented in this thesis are measure-ments on the outer ring but equivalent results are obtained if a measurementof the inner ring is used.
7.3.2 〈cos2 θ2D〉 measurements
Figure 7.2 a) shows 〈cos2 θ2D〉 calculated from ion images recorded at differ-ent intensities of the adiabatic alignment pulse. The figure is in qualitativeagreement with fig. 4.7. The alignment improves with increasing inten-sity. At high intensities saturation is observed so that the alignment is only

7.3 Comparing adiabatic and non-adiabatic alignment 131
weakly enhanced with increasing intensity.
Figure 7.2: 〈cos2 θ2D〉 calculated on the outer ring of I+ ion images. a) Adiabaticalignment at different intensities, I0, of the alignment pulse. b) Non-adibaticalignment at different delays with respect to the peak of the 2.1 ps alignmentpulse (I0 = 5.8 × 10¹² W/cm2), also shown is the cross correlation trace of thealignment pulse (solid line). Lines between points included to guide the eye.
Figure 7.2 b) shows alignment measured as 〈cos2 θ2D〉 following a 2.1 psnon-adiabatic alignment pulse. This pulse duration was chosen because thealignment then peaks under field free conditions (cf. sect. 5.1.4). The inten-sity of the alignment pulse was the maximum tolerable by the molecules.The figure is identical to fig. 5.7 c).
These 〈cos2 θ2D〉 measurements confirm that a stronger alignment isobtained with an adiabatic alignment pulse compared to one non-adiabaticalignment pulse, as it was already evident in the ion images (fig. 7.1).

132 Combining adiabatic and non-adiabatic alignment
7.4 Combining adiabatic and non-adiabatic align-
ment
7.4.1 Short time dynamics
For this combined fields experiment the dynamics at short delays are mostinteresting because that is where an enhancement of the alignment is ob-served.
In sect. 5.2 it was shown that non-adiabatic alignment could be signifi-cantly enhanced by using a weak pulse to prealign the molecules. With thisscheme the obtained degree of alignment approached that obtained with anadiabatic pulse. The basic idea of the combination experiment is essentiallythe same as the two-pulse non-adiabatic alignment experiment. Now it isjust an adiabatic alignment pulse that is used to prealign the molecules andthus enhance the alignment induced by the short non-adiabatic pulse.
Figure 7.3 shows measured 〈cos2 θ2D〉 values of molecules aligned withthe non-adiabatic pulse alone or combined with an adiabatic pulse. Infig. 7.3 a) the intensities of both alignment pulses are relatively low. Withthe non-adiabatic pulse alone, the alignment maximum is 〈cos2 θ2D〉 = 0.81occurs under field free conditions at t ≈ 2.2 ps. When the adiabaticalignment pulse is included the alignment is dramatically enhanced to〈cos2 θ2D〉 = 0.87 and peaks earlier at t ≈ 1.6 ps. Note that the align-ment is enhanced beyond the level obtained with the adiabatic pulse alone(〈cos2 θ2D〉 = 0.82). After the peak the alignment in the combined fields ex-periment drops off and remain below the level obtained with the adiabaticpulse alone.
Going from fig. 7.3 a) to b) the intensity of the adiabatic alignmentpulse is increased. This increase enhances the alignment of the combinedfields to 〈cos2 θ2D〉 = 0.89 and causes a slightly earlier alignment peak

7.4 Combining adiabatic and non-adiabatic alignment 133
Figure 7.3: 〈cos2 θ2D〉 calculated from ion images of iodobenzene subject to:a 2.1 ps non-adiabatic alignment pulse centered at t = 0 (squares), an adiabaticalignment pulse (solid line), or both pulses (circles). Lines between points includedto guide the eye. The peak intensities were:a) I0(non-adiabatic) = 3.5× 10¹² W/cm2, I0(adiabatic) = 3.1× 10¹¹ W/cm2,b) I0(non-adiabatic) = 3.5× 10¹² W/cm2, I0(adiabatic) = 7.8× 10¹¹ W/cm2,c) I0(non-adiabatic) = 5.8× 10¹² W/cm2, I0(adiabatic) = 7.8× 10¹¹ W/cm2.
(t ≈ 1.4 ps). Going from fig. 7.3 b) to c) the intensity of the non-adiabaticalignment pulse is increased. This increase enhance the combined fieldsalignment even further to 〈cos2 θ2D〉 = 0.91 and causes an even earlier peakof the alignment at t ≈ 1.0 ps. Note that in all cases the combined fields

134 Combining adiabatic and non-adiabatic alignment
alignment after the peak drops off and remains below the level obtainedwith the adiabatic pulse alone.
We can thus conclude that by combining the fields the maximum align-ment is enhanced beyond the level obtained with either pulse alone. Anincrease of the intensity of either alignment pulse causes an enhancementof the combined fields alignment and displaces the alignment peak to anearlier time. After the peak the combined fields alignment drops and stabi-lize below the level obtained with the adiabatic pulse alone. The alignmentat long delays is governed by the presence of the adiabatic alignment field(which can be viewed as constant in time on this picosecond timescale). Atthese long delays the effect of the non-adiabatic pulse is just an increase ofthe average value of J , 〈J〉, similar to an increase of rotational temperature.
The quantum mechanical calculation on tert-butyl iodide shown in fig. 7.4confirms our experimental results. The calculation is done for anothermolecule and at a lower rotational temperature than the experiment, nonethe-less the same features are observed. The combined fields alignment isstronger than that obtained with either field. Furthermore, the effect ofan increase of the intensity of either alignment pulse is an enhancement ofthe maximum alignment and an earlier alignment peak, as observed in theexperiment. At longer delays the combined fields alignment remain belowthe level of the alignment obtained with the adiabatic pulse alone, as wasalso observed in the experiment.
The enhanced alignment observed in this experiment is by no meansobtained under field free conditions. Not only is the weak adiabatic fieldpresent but the alignment peaks so fast that a substantial part of the non-adiabatic field is also present. As commented earlier pulse shaping[67,68] can be employed to change the temporal profile of the non-adiabaticalignment pulse so that the decline of the pulse is fast enough that the non-

7.4 Combining adiabatic and non-adiabatic alignment 135
Figure 7.4: Alignment dynamics (〈cos2 θ〉) of tert-butyl iodide initially at T = 1 Ksubject to a 1.7 ps non-adiabatic pulse (dashed curve), an adiabatic pulse (dottedline), or both (solid curve). The intensities of the alignment pulses are quotedabove the panels. Calculation by E. Hamilton and T. Seideman appearing in [7].
adiabatic alignment field is off when the alignment peaks. Underwood etal. [36] demonstrated that also a long (125 ps) pulse could be truncated veryfast (within ∼100 fs). Such a truncated adiabatic alignment pulse togetherwith a properly shaped non-adiabatic alignment pulse would thus be idealfor obtaining very well aligned molecules under field free conditions. Notethat this scheme produces a stronger field free alignment than that achievedwith two-pulse non-adiabatic alignment.

136 Combining adiabatic and non-adiabatic alignment
7.4.2 Rotational revivals
We have so far not done more than preliminary investigations regarding ro-tational revivals in the combined fields experiment. The C-type rotationalrevivals observed in non-adiabatic alignment experiments are still observ-able when a weak (∼1×10¹¹ W/cm2) adiabatic field is included. However,the revivals are weaker than without the adiabatic field. When the intensityof the adiabatic field is increased to 5×10¹¹ W/cm2 the rotational revivalsare no longer experimentally observable.
If the eigenstates in the presence of the adiabatic field (pendular states)have a regular energy spacing new types of revivals may appear in thepresence of the adiabatic field. That is the case for linear molecules in astrong adiabatic field[29]. Pendular revivals are thus expected in a com-bined fields experiment on a linear molecule provided a sufficiently intenseadiabatic pulse is used. Since asymmetric top molecules do not gain sucha regular spacing of the energy levels, no pendular revival are expected forthe asymmetric top iodobenzene molecule.
We plan to investigate the rotational revivals of a planar asymmetric topmolecule in another type of combined fields experiment involving adiabaticand non-adiabatic pulses with orthogonal (linear) polarizations. The ideais to use a strong adiabatic field to ‘lock’ the major axis of polarizabilityand then align the molecular plane with the non-adiabatic pulse. After theshort pulse we expect to observe rotational revivals corresponding to themolecule spinning about the major axis.
7.5 Conclusion
We have shown that a higher degree of alignment can be obtained with along adiabatic pulse compared to one short non-adiabatic pulse. By com-

7.5 Conclusion 137
bining an adiabatic pulse with a non-adiabatic pulse the induced alignmentcan be enhanced beyond the level obtained with either pulse alone. Whenthe intensity of either alignment pulse is increased the combined field align-ment is improved and the alignment peak occur at an earlier time comparedto the peak of the non-adiabatic pulse. After the initial peak the combinedfields alignment drops and stabilize at a degree of alignment below thatobtained with the adiabatic pulse alone. The strongly enhanced alignmentobtained by this combination of laser pulses can be made field free with anappropriate shaping (sharp cut-off) of the temporal profiles of both align-ment pulses.

Chapter 8
Outlook
The results presented in this thesis represent our contribution to the de-velopment of the field of laser induced alignment of molecules in the pastfour years. In the future we wish to continue the development of align-ment techniques, to combine laser induced alignment with other methodsof molecular control, and explore some of the many possible applications ofalignment.
This chapter deals with some of the ideas we have for future experi-ments. Many of our future experiments are facilitated by a major upgradeof the experimental apparatus that is ongoing at the moment. The firstsection of this chapter deals with the improvements of this upgrade and thenew possibilities they enable. In the next section possible future experi-ments are discussed.
138

8.1 Experimental improvements 139
8.1 Experimental improvements
A new vacuum chamber is currently being installed. This new vacuumchamber contains many upgrades compared to the old. Furthermore, theoptical setup is expected to be upgraded with a programmable pulse shaperin the near future (provided sufficient funds). These upgrades will improvethe quality of our experimental data and facilitate experiments, which sofar have not been possible for us to perform.
8.1.1 New pulsed valve
The new vacuum chamber will be equipped with a pulsed supersonic valveof the Even-Lavie type[77, 78]. This new valve has several advantagescompared to the Jordan valve we have used so far. It can be run witha repetition rate of 40 Hz, twice as fast as the Jordan valve. The Even-Lavie valve has a conical nozzle design, which gives a more efficient coolingand thus a lower rotational temperature of the sample. Furthermore, itcan withstand a very high backing pressure (100 bar). An increase of thebacking pressure results in a more efficient cooling.
The nozzle design also provides a higher sample density because themolecules will be ejected in a very narrow cone. A detail in the design ofthe new vacuum chamber will also increase the sample density: In our oldvacuum chamber the molecules travel ∼70 cm from the nozzle to the laserfocus, in the new chamber this distance is reduced to ∼40 cm resulting ina higher sample density.
8.1.2 Velocity mapping using slice imaging
All the 2-D ion images presented in this thesis are made with the velocityimaging setup of Eppink and Parker[46]. In the new vacuum chamber this

140 Outlook
setup will be replaced by the slice imaging setup of Gebhardt et al.[79](fig. 8.1).
Figure 8.1: Schematic diagram of the slice imaging setup of Gebhardt et al.[79].
In this setup, the molecular beam is crossed with the laser beams mid-way between a repeller plate and a fine grid. The voltage of the repellerplate can be gated very fast from 0 to 1000 V. When the repeller plate ischarged the ions experience a uniform electric field (between the repellerplate and grid) that pushes them towards the detector. On the way to thedetector the ions pass through three plates with circular apertures. Thesethree plates act as a lens (an Einzel lens) and make a velocity mappingof the ions on the detector like the three plates of the Eppink and Parkersetup.
The idea of slice imaging is to use the time of flight as a measure of thevelocity perpendicular to the detector. In order to increase the differencein time of flight between ions moving towards the detector and ions movingaway from the detector the ions are allowed to propagate in a field freeenvironment for a time until the repeller is quickly gated to 1 kV. Withthis broader range of ion flight times it is possible to time-gate the detector
8.1 Experimental improvements 141
so that only ions with a specific time of flight, corresponding to a specificvelocity perpendicular to the detector, are detected. The ion image thuscorrespond to a slice through the 3-D ion velocity distribution.
If the ion velocity distribution has cylindrical symmetry (as in our linearalignment experiments) the 3-D ion velocity distribution can be obtaineddirectly as the central slice (zero velocity perpendicular to the detector).The Abel inversion and the problem of the inherent center-line noise canthus be avoided. If the ion velocity distribution does not have cylindricalsymmetry (as in 3-D alignment experiments) the 3-D ion velocity distri-bution is not obtainable with the Eppink and Parker setup. With sliceimaging the 3-D ion velocity distribution can be obtained by recordingslices corresponding to different velocities perpendicular to the detector.
8.1.3 Crossed laser beams
So far we have used colinear laser beams in our experiments. The polar-izations of the involved beams are therefore restricted to the plane per-pendicular to beam propagation axis. The new vacuum chamber has twoorthogonal entrance windows and it is therefore possible to cross two laserbeams in a 90◦ angle. With such crossed laser beam it will be possible toperform new experiments. An example is the control experiment discussedin sect. 4.5.2, in which the molecular plane of the iodobenzene molecule isaligned with a circular polarized alignment pulse and dissociated by a pulsewith a polarization perpendicular to the molecular plane.
8.1.4 Programmable pulse shaper
With the current grating stretcher mounted in the non-adiabatic alignmentpulse beamline, the pulses are stretched to a longer duration but retain

142 Outlook
an approximately gaussian temporal profile. With the purchase of an ex-tra grating and a liquid crystal spatial light modulator (SLM) the gratingstretcher can be rebuilt as a programmable pulse shaper[68]. With a pulseshaper it is possible to shape the alignment pulses to have a sharp cut-off,so that the resulting molecular alignment is always reached under field freeconditions. Furthermore, the results regarding alignment pulse duration(sect. 5.1.4 and 6.2.3) and the enhancement obtained by splitting the align-ment pulse in two subpulses (sect. 5.2) can be generalized to experimentsregarding the optimal pulse shape for obtaining the strongest alignment.
In principle the optimal pulse shape may be found with a an evolution-ary learning algorithm using a feed back from the alignment experiment[80].However, this solution requires a very fast way of measuring alignment, es-pecially because the exact timing of the alignment peak depends on theshape of the alignment pulse.
8.2 New experiments
There are many interesting aspects and applications of alignment we wishto investigate in the future.
8.2.1 Improving alignment
Results presented in this thesis show how linear alignment can be enhancedby using two short pulses (sect. 5.2) or by combining short and long pulses(sect. 7.4). We have shown that a high degree of alignment is obtainablewith these relatively simple pulse sequences. With more elaborate pulsesequences and general pulse shapes it may be possible to enhance the align-ment even more. Our most immediate efforts are however concerned with3-D alignment.

8.2 New experiments 143
Direct experimental evidence of 3-D alignment has only been presentedin the adiabatic limit[32]. The improved control of the photodissociationof iodobenzene obtained with a short elliptically polarized alignment pulsepresented in this thesis (sect. 4.5.2) is indirect evidence of 3-D alignment inthe non-adiabatic regime. In the near future we wish to demonstrate directevidence of 3-D alignment obtained with two orthogonal linearly polarizedalignment pulses. Either two short non-adiabatic pulses as suggested byUnderwood et al.[33] or a long and a short pulse as the experiment de-scribed in sect.7.4.2. The calculations by Underwood et al. show that ahigher degree of alignment is obtained with two orthogonal linearly polar-ized pulses compared to one elliptically polarized alignment pulse.
8.2.2 Combining alignment and orientation
Although alignment of molecular axes is sufficient for many applications,heads vs tails orientation is needed in some applications.
Different schemes have been suggested for obtaining net orientation withlaser fields alone. Sakai and Larsen[40] have suggested to use two laserfields with frequencies ω and 2ω. Averaging over an optical period of sucha combined field will average out interaction with the permanent dipolemoment but not the third order interaction with the hyperpolarizability.Unfortunately, this interaction is for most molecules very weak at laserintensities below the threshold for multi photon ionization. Theoreticalstudies by Machholm and Henriksen[81] showed that orientation could beinduced with a half-cycle pulse. The effect is however weak at feasibleintensities. Spanner et al.[82] showed that the orientational effect of the halfcycle pulse was greatly enhanced when it was fired at a fractional revival ofa rotational wave packet induced by a short non-adiabatic alignment pulse.Laser induced orientation has yet to be demonstrated experimentally.
144 Outlook
Another option for obtaining molecular orientation is a static electricfield, either a uniform field or a hexapole (sect. 1.2.1). As stated in sect. 1.3the axial confinement (alignment) obtained with static fields is weak com-pared to laser induced alignment. The idea of combining the orientationobtained with a static field with the strong alignment obtained with a laserfield was proposed by Friedrich and co-workers. They calculated how anadiabatic[83, 84] or non-adiabatic[85] laser field affects molecules orientedby a static field.
How much the laser field enhance the orientation induced by the staticfield strongly depends on which measure of orientation is used. The conven-tional measure of orientation is the average value of cos θ, 〈cos θ〉. Friedrichand co-workers show that 〈cos θ〉 obtained with a weak static field willbe strongly enhanced by a laser alignment field. However, a large partof this enhancement is simply due to the much stronger angular confine-ment. 〈cos θ〉 can be increased without changing the fraction of moleculesthat “point in the right direction”, are within 90◦ of the field axis, Pfield.However, if the rotational temperature is very low Pfield can also be signif-icantly enhanced by a strong laser field. This was demonstrated by Sakaiet al.[86], who used a strong adiabatic alignment pulse to enhance the veryweak orientation induced by the weak static extraction field (of the Eppinkand Parker velocity mapping setup (sect. 3.3.1)) to Pfield ≈ 60%.
In the near future we wish to combine a strong uniform static field anda strong laser field to obtain molecules that are both strongly aligned (high〈cos2 θ〉) and mainly “point in the right direction” (high Pfield). This can beachieved simply by placing highly charged electrodes above and below thepoint where the molecular beam is crossed with the laser beams. However,there are some experimental difficulties that have to be overcome. The elec-trodes must be time-gated, so that the static field is on until the molecules

8.2 New experiments 145
are dissociated but turned off before any ions are created. Furthermore, theextraction field will be affected by the presence of the electrode plates evenwhen they are not charged. The velocity mapping of the ions will thereforebe distorted.
8.2.3 Applications of alignment
As the work in the field of laser induced alignment has grown so has thenumber of applications of alignment. The applications fall in two categories:Those that take advantage of alignment as a tool for controlling molecularorientation and those that use the rotational wave packet created by a shortnon-adiabatic alignment pulse for other purposes.
Among the applications of the latter category is the use of the revivalsfor time resolved rotational spectroscopy as discussed in chapter 6. Therevivals can also be used to manipulate the phase and spectral content ofultrashort light pulses[87] because the index of refraction of the samplechanges rapidly at the very narrow revivals. Use of the rotational wavepacket as a quantum logic system has also been demonstrated[88].
Alignment can be used as a control tool for all processes dependingon the specific orientation of molecules compared to lab-fixed coordinates,except for the applications where head vs tail orientation is needed. Inthis thesis the use if alignment as a control tool for photodissociation wasdemonstrated (sect. 4.5). Just as weak-field photoabsorption depends onthe relative orientation of molecule and electric field so does strong-fieldionization[89]. The molecular symmetry play an important role in strong-field ionization[90]. In the near future we plan to use alignment as a controltool to demonstrate the role of symmetry experimentally as it has beenrecently done for a diatomic molecule[91]. Another application we wish toexplore in the near future is the use of alignment as a control tool for angle

146 Outlook
resolved photoelectron spectroscopy. Photoelectron angular distributionsprovide information on molecular structure, rotational perturbations, andpotentially on radiationless transitions[92]. Other applications of alignmentinclude the use in electron diffraction experiments[93] and enhancement ofhigh-order harmonic generation[94].
In the slightly more distant future we would also like to use alignment atrotational revivals to control and select molecular conformers as discussedin sect. 6.4.3. If the alignment field is combined with a static field we maypotentially be able to separate enantiomers1 of chiral molecules.
8.2.4 Alignment in the liquid phase
So far all our studies of laser induced alignment has taken place in the gasphase. From a chemical point of view the liquid phase is more interest-ing than the gas phase, since most chemical reactions in both nature andlaboratories take place in the liquid phase. It is well known that a strongpolarized non-resonant laser field will also align molecules in the liquidphase. An effect of the alignment is an induced birefringence in the liquid,known as the optical Kerr effect (sect. 1.2.1). The optical Kerr effect hasbeen used to study molecular dynamics in liquids and solutions for manyyears.
The degree of anisotropy needed to induce birefringence is very small.The main hindrance for obtaining a high degree of alignment in the liquidphase is that a liquid cannot be cooled without phase change (freezing).As a result the “rotational temperature” is high and not really well defineddue to the constant collisions between molecules. In the case of adiabaticalignment of a pure liquid, the molecules can be assumed to have a Boltz-
1Enantiomers are molecules that are mirror images of each other.

8.3 Final words 147
mann distribution (sect. 2.3.1). From fig. 2.7 it is seen that the alignmentof CS2 molecules is modest (〈cos2 θ〉 < 0.38) at feasible alignment pulseintensities (I0 < 1012 W/cm2).
However, sometimes it takes only a small change in the distribution oforientations to make an big effect. An example of this was recently givenby Garetz et al.[95]. They showed that alignment can induce nucleation ina supersaturated solution. Even though the the liquid was only affected bythe pulsed laser for a very short time (600 pulses of 6 ns each) and withrelatively low intensity (7×10¹¹ W/cm2) crystals appeared after 30 minutesin solutions which had been left for days without spontaneous nucleation.The structure of the appearing crystals could even be controlled by usingeither linear or circular polarization of the alignment pulse. Thus evensmall changes in the relative orientation of molecules can make big changesin chemical reactivity.
Since polarizability scales with the size of the molecule, a higher degreeof alignment is expected for larger molecules in solution. As discussed insect. 1.2.1 static fields are already being employed to control very large(DNA) molecules in solution. A potentially much stronger optical field isthus expected to induce strong alignment of large molecules in solution.The first very preliminary steps towards laser induced alignment in theliquid phase is currently being taken in our lab. We have great expecta-tions to these experiments and expect a whole new range of applications ofalignment to arise.
8.3 Final words
It has been fascinating to contribute to the development of the field of laserinduced alignment for the past five years. In that time both the field itself

148 Outlook
and the number of applications have grown rapidly. With the many newpossibilities emerging, I am confident that the field will continue to growin the future and alignment will be applied in many new and unforeseencontexts.

149

150 Molecular data
Appendix A
Molecular data
A.1 Symmetric top molecules
Names Methyl iodide Tert-butyl iodide
Iodomethane 2-iodo-2-methylpropane
Molecular formula CH3I C4H9I
Molecular weight (g/mole) 141.94 184.02
Structure
Bond lengths (A) r(CI)=2.139, r(CH)=1.11, r(CH)=1.093, r(CC)=1.54,
and angles 6 (ICH)=107.5◦[96] r(CI)=2.19, 6 (ICC)=107.4◦,6 (HCH)=arccos(− 1
3)[97]
Boiling temperature1 42.5◦C[98] 100◦C[99]
Seed temperature -40◦C -30◦CVapor pressure2 (mbar) 22 2
Gas phase absorption 266 nm: 1.0×10⁻² 266 nm: 2.2×10⁻²
cross section (A2) 304 nm: 1×10⁻⁴[100] 304 nm: 2×10⁻³[101]
Rotational constants (MHz) A=150262, B=7501.30[102] A=2950.2, B=1563.7[97]
Revival time3 (ps) tJ=66.655 tJ=319.8
Polarizability static: α‖=9.0, α⊥=6.4 static: α‖=15.0, α⊥=11.3
volumes4 (A3) 1064 nm: α‖=9.1, α⊥=6.5 1064 nm: α‖=15.1, α⊥=11.3
800 nm: α‖=9.2, α⊥=6.6 800 nm: α‖=15.3, α⊥=11.4

A.2 Asymmetric top molecules of C2v-type 151
A.2 Asymmetric top molecules of C2v-type
Name Iodobenzen Iodopentafluorbenzene
Molecular formula C6H5I C6F5I
Molecular weight (g/mole) 204.01 293.96
Structure
Bond lengths (A) r(CI)=2.08, r(CH)=1.101, r(CI)=2.08, r(CF)=1.32,
and angles r(CC)=1.399, 6 =120◦[96]5,6 r(CC)=1.399, 6 =120◦[96]5
Boiling temperature1 188◦C[98] 161◦C[98]
Seed temperature 23◦C 23◦CVapor pressure2 (mbar) 1.1 0.7
Gas phase absorption 266 nm: 2.3×10⁻²
cross section (A2) 304 nm: 1×10⁻³[103]
Rotational constants (MHz) A=5671.89, B=750.416, A=1027.5, B=368.8,
asymmetry parameter7 C=662.627, κ=-0.965[104] C=271.4, κ=-0.742
Revival times8 (ps) tC=377.3, tJ=707.7 tC=921.2, tJ=1562.0
Polarizability static: αaa=20.9, αbb=15.0, static: αaa=20.6, αbb=14.8,
volumes4 (A3) αcc=10.1 αcc=9.6
1064 nm: αaa=21.3, αbb=15.2, 1064 nm: αaa=20.9, αbb=15.0,
αcc=10.2 αcc=9.6
800 nm: αaa=21.5, αbb=15.3, 800 nm: αaa=21.1, αbb=15.1,
αcc=10.2 αcc=9.7
1At atmospheric pressure.2at seed temperature, calculated using the Claussius-Clayperon equation[105],
P (T ) = Patm exp(−∆vapH/R ∗ ( 1T− 1
Tboil), vaporization enthalpies obtained from [99].
3tJ = (2B)−1
4The polarizability volume α′ relates to the polarizability α as: α′ = α/(4πε0). The values
are obtained using an ab-initio linear response calculation on a HF wavefunction in the Sadlej
basisset using the Dalton Quantum Chemistry Program: www.kjemi.uio.no/software/dalton.
The molecular geometry was not optimized. For all the molecules the near-infrared wavelengths
are far off resonance and the polarizabilities close to the static values.5Characteristic (not molecule specific) bondlengths6C–I bondlength chosen to fit rotational constants.7κ = 2B−A−C
A−C, κ = −1 for a prolate and κ = 1 for an oblate symmetric top.
8tC = (4C)−1, tJ = (B + C)−1

152 Molecular data
A.3 Asymmetric top molecules of general type
Names Ethyl iodide Propyl iodide
Iodoethane 1-iodopropane
Molecular formula C2H5I C3H7I
Molecular weight (g/mole) 155.97 169.99
Structure
Bond lengths and angles [106] [76]9
Boiling temperature1 73◦C[98] 102◦C[98]
Seed temperature -25◦C 0◦CVapor pressure2 (mbar) 13 13
Gas phase absorption 266 nm: 1.4×10⁻² 266 nm: 1.8×10⁻²
cross section (A2) 304 nm: 4×10⁻⁴[101] 305 nm: 7×10⁻⁴[101]10
Rotational constants (MHz) A=29116.33, B=2979.566, trans: A=24710.74, B=1305.204,
asymmetry parameter7 C=2796.451, κ=-0.986 C=1269.366, κ=-0.997, δ=19.4◦
δ angle11 δ=19.7◦[106] gauche: A=10595.35, B=1781.651,
C=1614.186, κ=-0.963, δ=32.6◦
[107, 76]
Revival times (ps)8 tC=89.40, tJ=173.13 trans: tC=196.95, tJ=388.41
gauche: tC=154.88, tJ=294.48
Polarizability static: trans : gauche :
volumes4,12 (A3) αzz=11.2, αyy=8.0, static: αzz=14.3, αzz=13.2,
αxx=7.7, δpol=13.6◦ αyy = 9.5, αyy = 9.8,
800 nm: αxx = 9.1, αxx = 9.2,
αzz=11.5, αyy=8.2, δpol = 19.3◦ δpol = 19.3◦
αxx=7.8, δpol = 13.6◦ 800nm: αzz=14.6, αzz=13.8,
αyy = 9.6, αyy = 10.2,
αxx = 9.3, αxx = 9.6,
δpol = 19.3◦ δpol = 19.3◦
9Ref. [76] only report 23 out of the necessary 27 internal coordinates for gauche-propyl iodide.
Assumptions were made for the remaining four that fit with the reported rotational constants.10Values for isopropyl iodide11δ is the angle between the principal axis of inertia (a-axis) and the C–I bond axis.12The principal axes of polarizability are located so that the x-axis is perpendicular to the
I–C1–C2 plane and the z-axis is the axis closest to the C–I bond axis. δpol is the angle between
the z-axis and the C–I bond axis.

Appendix B
Laser beam parameters
This appendix contains a description of how we obtain the different param-eters characterizing the laser beams. I have used the definitions of [108].
Pulse Energy, Epulse
The pulse energy, Epulse, is measured with a standard laser powermeter.The measured power is divided by the repetition rate of the laser to obtainthe pulse energy.
Focal spot size, ω0
We have measured the focal spot sizes of the laser beams be inserting abroadband mirror before the chamber window and placing a 10 µm pinholeat the focus of the beams. A photo diode is placed after the pinhole. Bymeasuring the photo diode signal as a function of the pinhole position thefocal spot size can be measured.
This method depends on the pinhole being smaller than the focal spotsize of the laser beams. Figure B.1 shows the relation between measured
153

154 Laser beam parameters
Figure B.1: Relation between the measured and real focal spot size(FWHM1) for a 10 µm pinhole. The beam profile was assumed gaussianand it was assumed that all light passing through the pinhole meets thephoto diode.
and real spot size for a 10 µm pinhole. We have used the measured spot sizedirectly rather than using fig. B.1 to correct for the finite size of the pinhole.The reason is that the photo diode is only 0.5 mm wide and mounted 2 cmafter the pinhole. We are therefore not certain all the light transmitted(and diffracted) through the pinhole meets the photodiode. As a result theeffective size of the pinhole may be smaller than 10 µm.
Assuming a gaussian beam profile, I(r) = I0 exp(−2r2/ω20), r being
the distance from the center of the beam, ω0 can be calculated from theFWHM1 as
ω0 =FWHM√
2 ln 2. (B.1)
1FWHM is the Full Width at Half Maximum of the signal.

155
Since the molecular beam is only 1 mm across spot sizes can with agood approximation be assumed constant through the molecular beam.
Fluence, φ0
Assuming a gaussian beam profile we can calculate the peak fluence inte-grated over time (energy per unit area) as
φ0 =Epulse
π2 ω2
0
. (B.2)
The focal averaged fluence is 12 of the peak fluence.
Photon flux, Φ0
All the laser beams have sufficiently narrow spectra to calculate the photonflux integrated over time (photons per unit area) from the fluence as
Φ0 =φ0
hνlaser. (B.3)
Pulse duration, τ
The pulse durations of the nanosecond pulses are measured with a fastphotodiode. If the response time of the photodiode is much faster than theduration of the laser pulse, the time evolution of the photo diode signalreflects the time evolution of the intensity envelope of the pulse.
The pulse durations of the femto- and picosecond pulses are measured bymaking 400 nm light in a BBO crystal. Either through difference frequencymixing (800 nm and 266 nm) or sum frequency mixing (two 800 nm beams).The generated 400 nm light pass through a bandpass filter and is measuredby a photo diode. The photo diode signal as a function of the delay between

156 Laser beam parameters
the two involved pulses is the cross correlation signal. Assuming gaussianpulse envelope, I(t) = I0 exp(−2t2/τ2), the width of the cross correlationsignal is related to the duration of the pulses as
τ2measured = τ2
1 + τ22 . (B.4)
Assuming a gaussian pulse envelope the relation between τ and τFWHM is
τ =τFWHM√
2 ln 2. (B.5)
Peak intensity, I0
The peak intensity can be calculated from the peak fluence and the pulseduration (assuming gaussian pulse envelope),
I0 =φ0√π2 τ
=φ0√
π4 ln 2 τFWHM
. (B.6)
The main source of uncertainty in the peak intensities quoted in ourwork is in the determination of the focal spot size, which has an uncertaintyof ∼10% corresponding to an uncertainty of ∼20% on the peak intensity.
Appendix C
Dissociation probabilities of
iodobenzene
In this appendix the expressions for the dissociation probabilities of iodoben-zene are derived. The derivation is general and the expressions can be usedfor all molecules with the same dissociation channels.
C.1 Dissociation probability and the Beer-Lambert
law
The absorption cross section, σ, is defined so that the probability that amolecule absorbs a photon, Pabs, in the low field limit (no saturation) is
Pabs = σΦ0, (C.1)
where Φ0 is the photon flux (photons per unit area). A consequence ofeq. C.1 is the well known Beer-Lambert law[105] for absorption in a ran-
157

158 Dissociation probabilities of iodobenzene
domly distributed sample of molecules,
I
I0= exp(−σx
N
V) = exp(
−σN
A ). (C.2)
In eq. C.2 I0 and I are the intensity (energy per unit area and time) ofthe light before and after passing through the sample, x is the length ofthe sample, and N/V is the sample density (molecules per unit volume).V/x = A, where A is the considered area perpendicular to the beam di-rection. Replacing the exponential of the Beer-Lambert law with its firstorder expansion eq. C.1 is obtained.
So far a uniform distribution of the molecules have been assumed. Toaccount for the dependence of absorption on molecular orientation the an-gular dependence function, N(θ, φ, χ), is introduced. N(θ, φ, χ) is the tran-sition dipole moment in lab-fixed coordinates normalized to 1 for a uniformdistribution.
Taking the angular dependence into account eq. C.1 becomes
Pabs(θ, φ, χ) = σΦ0N(θ, φ, χ). (C.3)
As discussed in sect. 4.3 the photo dissociation of iodobenzene at 266 nmcan go through two different channels, the n → σ? and π → π? channels.The angular dependence function for these two pathways is different and itis therefore useful to recast eq. C.3 as
Pdiss = σn→σ?Φ0N(θ, φ, χ)n→σ?+ σπ→π?Φ0N(θ, φ, χ)π→π?
. (C.4)
In eq. C.4 Pabs is replaced by Pdiss since the transition of interest, theabsorption of a 266 nm photon always lead to dissociation of iodobenzene.
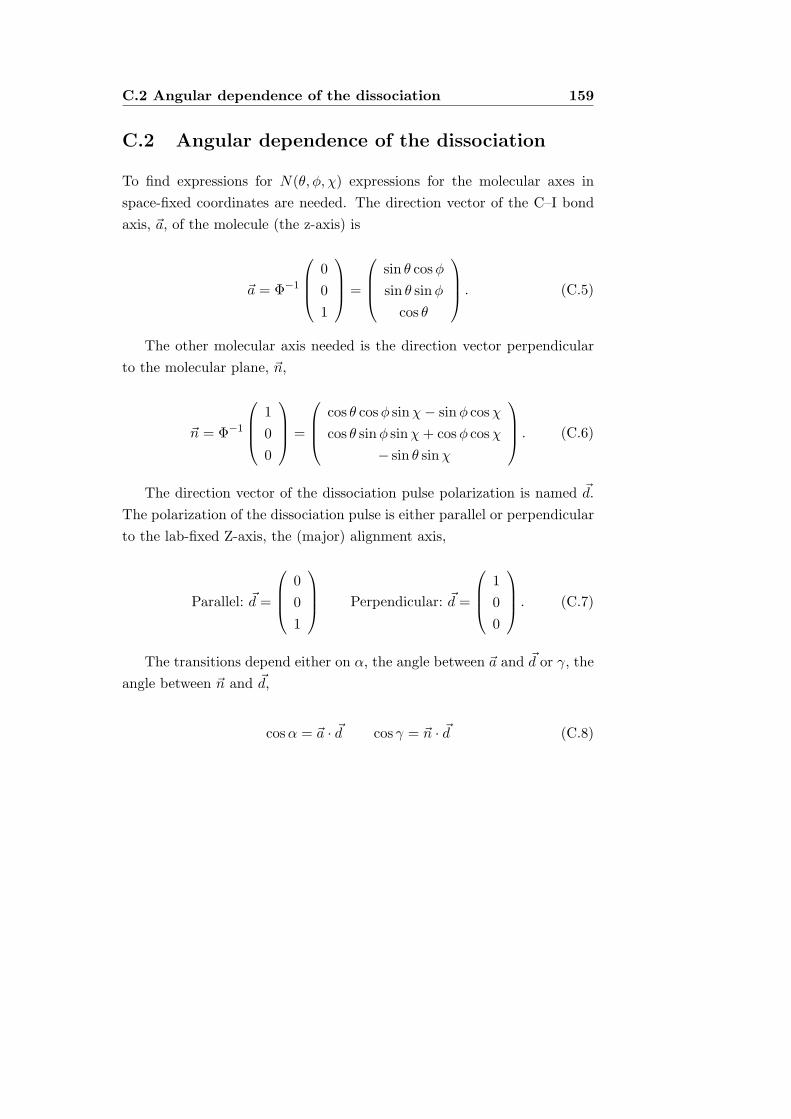
C.2 Angular dependence of the dissociation 159
C.2 Angular dependence of the dissociation
To find expressions for N(θ, φ, χ) expressions for the molecular axes inspace-fixed coordinates are needed. The direction vector of the C–I bondaxis, ~a, of the molecule (the z-axis) is
~a = Φ−1
001
=
sin θ cosφ
sin θ sinφ
cos θ
. (C.5)
The other molecular axis needed is the direction vector perpendicularto the molecular plane, ~n,
~n = Φ−1
100
=
cos θ cosφ sinχ− sinφ cosχ
cos θ sinφ sinχ + cos φ cosχ
− sin θ sinχ
. (C.6)
The direction vector of the dissociation pulse polarization is named ~d.The polarization of the dissociation pulse is either parallel or perpendicularto the lab-fixed Z-axis, the (major) alignment axis,
Parallel: ~d =
001
Perpendicular: ~d =
100
. (C.7)
The transitions depend either on α, the angle between ~a and ~d or γ, theangle between ~n and ~d,
cosα = ~a · ~d cos γ = ~n · ~d (C.8)

160 Dissociation probabilities of iodobenzene
C.2.1 The n → σ? channel
Direct excitation of the C–I bond, the n → σ? channel, is predominantlyparallel with a minor perpendicular component. The angular dependenceof the parallel part is cos2 α and the dependence of the perpendicular partis sin2 α,
N(θ, φ, χ)n→σ?=
32−A
(cos2 α + (1−A) sin2 α
). (C.9)
In eq. C.9 the A parameter is 1 for a pure parallel transition and 0 for apure perpendicular transition. The prefactor 3
2−A normalize the expression.When the dissociation pulse is polarized parallel to the Z-axis (using
eq. C.8)
N(θ, φ, χ)n→σ?
para =3
2−A
(cos2 θ + (1−A) sin2 θ
). (C.10)
It is worth noting that eq. C.10 is equivalent to the commonly usedexpression[28]
N(θ, φ, χ)n→σ?
para = 1 + βP2(cos θ) = 1 + β
(32
cos2 θ − 12
). (C.11)
In eq. C.11 β is 2 for a pure parallel transition and -1 for a pure per-pendicular transition. The relation between A and β parameters is
β =4A− 22−A
⇔ A =2 + 2β4 + β
. (C.12)
For dissociation pulse polarization perpendicular to the Z-axis the an-gular dependence function is
N(θ, φ, χ)n→σ?
perp =3
2−A
(A sin2 θ cos2 φ + (1−A)(1− sin2 θ cos2 φ)
).
(C.13)

C.2 Angular dependence of the dissociation 161
Assuming a uniform distribution of φ for all θ, eq.C.13 becomes
N(θ)n→σ?
perp =3
2−A
(12A sin2 θ + (1−A)(1− 1
2sin2 θ)
). (C.14)
C.2.2 The π → π? channel
The excitation of the aromatic ring, the π → π? channel, is a planar tran-sition. The angular dependence is therefore proportional to sin2 γ, whichmeans
N(θ, φ, χ)π→π?=
32(1− cos2 γ). (C.15)
For dissociation pulse polarization parallel to the Z-axis (using eq. C.8)
N(θ, φ, χ)π→π?
para =32(1− sin2 θ sin2 χ). (C.16)
Assuming a uniform distribution of χ for all θ eq. C.16 becomes
N(θ)π→π?
para =32(1− 1
2sin2 θ). (C.17)
For dissociation pulse polarization perpendicular to the Z-axis the an-gular dependence function is
N(θ, φ, χ)π→π?
perp =32
(1− cos2 θ cos2 φ sin2 χ− sin2 φ cos2 χ +
12
cos θ sin(2φ) sin(2χ))
.
(C.18)
The last term in eq. C.18 is always averaged to zero. Since the moleculesare aligned and not oriented, fmol(θ, φ, χ) = fmol(π − θ, φ, χ). The cos θ
factor is therefore averaged to zero.Assuming a uniform distribution of φ for all θ and χ, eq. C.18 becomes

162 Dissociation probabilities of iodobenzene
N(θ, χ)π→π?
perp =34(1 + sin2 θ sin2 χ). (C.19)
Furthermore assuming a uniform distribution of χ for all θ, eq. C.19 be-comes
N(θ)π→π?
perp =34(1 +
12
sin2 θ). (C.20)

Summary
The orientation of molecules with respect to space fixed axes play a centralrole in chemistry and spectroscopy. This thesis deals with an effectivemethod of controlling the rotational motion of gas-phase molecules, laserinduced alignment. When a molecule is subject to a strong nonresonantpolarized laser field, the rotational state of the molecule is changed so thatits principal axes of polarization are confined along the polarization of thelaser field – the molecule has become aligned.
Laser induced alignment is a very general method that can be applied toalmost all molecules and the molecular axes can become very well confined.The method does not distinguish between ‘head’ and ‘tail’ of the molecules,which is why the term ‘alignment’ rather than ‘orientation’ is used.
The duration of the alignment laser pulse is determining how the molec-ular alignment progress. If the alignment pulse is long compared to molec-ular rotation the alignment evolves adiabatically. In that case, the degreeof molecular alignment follows the intensity profile of the alignment pulse.If the alignment pulse is short compared molecular rotation the moleculescan be aligned under field-free conditions after the alignment pulse. Fur-thermore, the rotational wave packet created by a short (non-adiabatic)alignment pulse exhibits narrow revivals of alignment at regular intervals
163

164 Summary
long after the alignment pulse. The timing of these revivals is determined bythe rotational constants of the molecule. The work presented in this the-sis deals with both adiabatic and non-adiabatic laser induced alignment.Moreover, the effect of combining long and short pulses is treated.
Adiabatic alignment
Adiabatic alignment of the asymmetric top iodobenzene molecule was demon-strated. A method of obtaining the distribution of molecules prior to theprobe pulse and a quantitative measure of alignment was demonstrated.The degree of alignment increases with increasing laser pulse intensity andwith a decrease of the rotational temperature.
Alignment was used to control photodissociation pathways. The twodissociation channels of iodobenzene at 266 nm depend differently on therelative orientation of molecule and dissociation pulse polarizability. Con-trol of the molecular orientation therefore allows control of the photodisso-ciation.
Non-adiabatic alignment
Non-adiabatic alignment was demonstrated for several molecules. Field-freealignment was obtained both immediately after the alignment pulse andat rotational revivals. The degree of alignment increases with increasinglaser pulse intensity and with a decrease of the rotational temperature. Asignificant enhancement of alignment was obtained by using a sequence oftwo pulses rather than a single alignment pulse.
Spectra of rotational revivals were recorded for both symmetric andasymmetric top molecules. The effects of molecular asymmetry and laserintensity were investigated. The rotational revivals of non-adiabatic align-

165
ment are useful for time resolved rotational spectroscopy and supplementother such techniques. Furthermore, rotational revivals of individual con-formers of the propyl iodide molecule were observed. These revivals can beused to separate conformers.
Combining adiabatic and non-adiabatic alignment
It was demonstrated that molecular alignment is significantly enhancedwhen long and short alignment pulses are combined. The combined fieldsalignment was much stronger than that obtained by either field alone. Thedegree of combined fields alignment in increased with an increase of theintensity of either pulse.

Bibliography
[1] M. D. Poulsen, E. Skovsen, and H. Stapelfeldt, Photodissociationof laser aligned iodobenzene: Towards selective photoexcitation, J.Chem. Phys. 117 (2002), 2097–2102.
[2] E. Peronne, M. D. Poulsen, C. Z. Bisgaard, H. Stapelfeldt, and T. Sei-deman, Nonadiabatic alignment of asymmetric top molecules: Field-free alignment of iodobenzene, Phys. Rev. Lett. 91 (2003), 043003.
[3] E. Peronne, M. D. Poulsen, H. Stapelfeldt, C. Z. Bisgaard, E. Hamil-ton, and T. Seideman, Nonadiabatic laser-induced alignment ofiodobenzene molecules, Phys. Rev. A 70 (2004), 063410.
[4] C. Z. Bisgaard, M. D. Poulsen, E. Peronne, S. S. Viftrup, and H.Stapelfeldt, Observation of enhanced field-free molecular alignmentby two laser pulses, Phys. Rev. Lett. 92 (2004), 173004.
[5] M. D. Poulsen, E. Peronne, H. Stapelfeldt, C. Z. Bisgaard, S. S.Viftrup, E. Hamilton, and T. Seideman, Nonadiabatic alignment ofasymmetric top molecules: Rotational revivals, J. Chem. Phys. 121(2004), 783–791.
166

BIBLIOGRAPHY 167
[6] T. Ejdrup, M. D. Poulsen, C. Z. Bisgaard, S. S. Viftrup, H.Stapelfeldt, E. Hamilton, and T. Seideman, Laser induced alignmentof symmetric top molecules (Manuscript in preperation).
[7] M. D. Poulsen, T. Ejdrup, H. Stapelfeldt, E. Hamilton, and T. Sei-deman, Alignment of molecules by a long and a short laser pulse(Manuscript in preparation).
[8] J. McMurry, Fundamentals of organic chemistry, 3rd edition,Brooks/Cole Publishing Company, 1994.
[9] H. J. Loesch, J. Bulthuis, S. Stolte, A. Durand, J. C. Loison, and J.Vigue, Molecules oriented by brute force, Europhys. News 27 (1996),12–15.
[10] H. L. Bethlem and G. Meijer, Production and application of transla-tionally cold molecules, Int. Rev. Phys. Chem. 22 (2003), 73–128.
[11] K. J. Franks, H. Li, R. J. Hanson, and W. Kong, Selective excitationof ICN achieved via brute force orientation, J. Phys. Chem. A 102(1998), 7881–7884.
[12] W. Kong, Studies of electronic properties of medium and largemolecules oriented in a strong uniform electric field, Int. J. Mod.Phys. B 15 (2001), 3471–3502.
[13] J. E. Abbott, X. Peng, and W. Kong, Symmetry properties of elec-tronically excited states of nitroaromatic compounds, J. Chem. Phys.117 (2002), 8670–8675.
[14] D. H. Parker and R. B. Bernstein, Oriented molecule beams viathe electrostatic hexapole: Preparation, characterization, and reactivescattering, Annu. Rev. Phys. Chem. 40 (1989), 561–595.

168 BIBLIOGRAPHY
[15] P. W. Harland and P. R. Brooks, Dramatic steric behavior in electrontransfer from various donors to CF3Br, J. Am. Chem. Soc. 125(2003), 13191–13197.
[16] M. P. Hughes, AC electrokinetics: applications for nanotechnology,Nanotechnology 11 (2000), 124–132.
[17] W. A. Germishuizen, C. Walti, R. Wirtz, M. B. Johnston, M. Pepper,A. G. Davies, and A. P. J. Middelberg, Selective dielectrophoretic ma-nipulation of surface-immobilized DNA molecules, Nanotechnology14 (2003), 896–902.
[18] P. M. Felker and A. H. Zewail, Molecular structures from ultrafastcoherence spectroscopy, in Femtosecond Chemistry, (J. Manz and L.Woeste, eds.), VCH Weinhiem, 1995, pp. 193–260.
[19] C. Riehn, High-resolution pump-probe rotational coherencespec-troscopy – rotational constants and structure of ground and electron-ically excited states of large molecular systems, Chem. Phys. 283(2002), 297–329.
[20] Y. R. Shen, The Principles of Nonlinear Optics, John Wiley & Sons,Inc., 1984.
[21] R. Righini, Ultrafast optical kerr effect in liquids and solids, Science262 (1993), 1386–1390.
[22] A. Idrissi, M. Ricci, P. Bartolini, and R. Righini, Optical Kerr-effectinvestigation of the reorientational dynamics of CS2 in CCl4 solu-tions, J. Chem. Phys. 111 (1999), 4148–4152.

BIBLIOGRAPHY 169
[23] K. Visscher, M. J. Schnitzer, and S. M. Block, Single kinesinmolecules studied with a molecular force clamp, Nature 400 (1999),184–189.
[24] M. Irving and Y. E. Goldman, Motor proteins - another step aheadfor myosin, Nature 398 (1999), 463.
[25] N. B. Simpson, K. Dholakia, L. Allen, and M. J. Padgett, Mechanicalequivalence of spin and orbital angular momentum of light: an opticalspanner, Optics Lett. 22 (1997), 52–54.
[26] M. P. Sinha, C. D. Caldwell, and R. N. Zare, Alignment of moleculesin gaseous transport: Alkali dimers in supersonic nozzle beams, J.Chem. Phys. 61 (1974), 491–503.
[27] F. Pirani, D. Cappalletti, M. Bartolomei, V. Aquilanti, M. Scotoni,M. Vescovi, D. Ascenzi, and D. Bassi, Orientation of benzene in su-personic expansions, probed by IR-laser absorption and by molecularbeam scattering, Phys. Rev. Lett. 86 (2001), 5035–5038.
[28] R. N. Zare, Angular Momentum, John Wiley & Sons, 1988.
[29] B. Friedrich and D. Herschbach, Alignment and trapping of moleculesin intense laser fields, Phys. Rev. Lett. 74 (1995), 4623–4626.
[30] V. Renard, M. Renard, S. Guerin, Y. T. Pashayan, B. Lavorel, O.Faucher, and H. R. Jauslin, Postpulse molecular alignment measuredbe a weak field polarization technique, Phys. Rev. Lett. 90 (2003),153601.
[31] P. W. Dooley, I. V. Litvinyuk, K. F. Lee, D. M. Rayner, M. Spanner,D. M. Villineuve, and P. B. Corkum, Direct imaging of rotational

170 BIBLIOGRAPHY
wave-packet dynamics of diatomic molecules, Phys. Rev. A 68 (2003),023406.
[32] J. J. Larsen, K. Hald, N. Bjerre, H. Stapelfeldt, and T. Seideman,Three dimensional alignment of molecules using elliptically polarizedlaser fields, Phys. Rev. Lett. 85 (2000), 2470–2473.
[33] J. G. Underwood, B. J. Sussman, and A. Stolow Approaches to field-free three dimensional molecular axis alignment, 2005 (Preprint, toappear in Phys. Rev. Lett.).
[34] P. W. Atkins and R. S. Friedman, Molecular Quantum Mechanics,3rd edition, Oxford University Press, 1997.
[35] T. Seideman, On the dynamics of rotationally broad, spatially alignedwave packets, J. Chem. Phys. 115 (2001), 5965–5973.
[36] J. G. Underwood, M. Spanner, M. Y. Ivanov, J. Mottershead, B. J.Sussman, and A. Stolow, Switched wave packets: A route to nonper-turbative quantum control, Phys. Rev. Lett. 90 (2003), 223001.
[37] J. Ortigoso, M. Rodrıguez, M. Gupta, and B. Friedrich, Time evolu-tion of pendular states created by the intereaction of molecular polar-izability with a pulsed nonresonant laser field, J. Chem. Phys. 110(1999), 3870–3875.
[38] H. Stapelfeldt and T. Seideman, Aligning molecules with strong laserpulses, Rev. Mod. Phys. 75 (2003), 543–557.
[39] M. Machholm, Postpulse alignment of molecules robust to thermalaveraging, J. Chem. Phys. 115 (2001), 10724–10730.

BIBLIOGRAPHY 171
[40] J. J. Larsen, Laser Induced Alignment of Neutral Molecules, PhD the-sis, Institute of Physics and Astronomy, University of Aarhus, Den-mark, 2000.
[41] M. Leibscher, I. S. Averbukh, and H. Rabitz, Molecular alignment bytrains of short laser pulses, Phys. Rev. Lett. 90 (2003), 213001.
[42] M. Leibscher, I. S. Averbukh, and H. Rabitz, Enhanced molecularalignment by short laser pulses, Phys. Rev. A 69 (2004), 013402.
[43] W. R. Gentry and C. F. Giese, Ten-microsecond pulsed molecularbeam source and a fast ionization detector, Rev. Sci. Instrum. 49(1978), 595–600.
[44] M. D. Poulsen Guide to operation of the vacuum chamber, June 2003(Private circulation, Femtolab, University of Aarhus).
[45] J. Olsen Generation of sub 20 femtosecond laser pulses and coulombexplosion studies of D2 Master’s thesis, Department of Chemistry,University of Aarhus, 1999.
[46] A. T. J. B. Eppink and D. H. Parker, Velocity map imaging of ionsand electrons using eloctrostatic lenses: Application in photoelectronand photofragment ion imaging of molecular oxygen, Rev. Sci. In-strum. 68 (1997), 3477–3484.
[47] M. D. Poulsen User’s guide to data processing of ion images v3.1,August 2004 (Private circulation, Femtolab, University of Aarhus).
[48] V. Dribinski, A. Ossadtchi, V. A. Mandelshtam, and H. Reisler, Re-construction of Abel-transformable images: The basis-set expansionAbel transform method, Rev. Sci. Instrum. 73 (2002), 2634–2642.

172 BIBLIOGRAPHY
[49] M. J. J. Vrakking, An iterative procedure for the inversion of two-dimensional ion/photoelectron imaging experiments, Rev. Sci. In-strum. 72 (2001), 4084–4089.
[50] B. A. Zon and B. G. Katsnel’son, Nonresonant scattering of intenselight by a molecule, Soviet Phys. JETP 42 (1976), 595–599.
[51] W. Kim and P. M. Felker, Spectroscopy of pendular states in optical-field-aligned species, J. Chem. Phys. 104 (1996), 1147–1150.
[52] H. Sakai, C. P. Safvan, J. J. Larsen, K. M. Hillingsøe, K. Hald, andH. Stapelfeldt, Controlling the alignment of neutral molecules by astrong laser field, J. Chem. Phys. 110 (1999), 10235–10238.
[53] J. J. Larsen, H. Sakai, C. P. Safvan, I. Wendt-Larsen, and H.Stapelfeldt, Aligning molecules with intense nonresonant laser fields,J. Chem. Phys. 111 (1999), 7774–7781.
[54] J. J. Larsen, I. Wendt-Larsen, and H. Stapelfeldt, Controlling thebranching ratio of photodissociation using aligned molecules, Phys.Rev. Lett. 83 (1999), 1123–1126.
[55] A. T. J. B. Eppink and D. H. Parker, Methyl iodide A-band decompo-sition study by photofragment velocity imaging, J. Chem. Phys. 109(1998), 4758–4767.
[56] J. R. Nestor, Optogalvanic spectra of neon and argon in glow dischargelamps, Appl. Optics 21 (1982), 4154–4157.
[57] J. A. Griffiths, K.-W. Jung, and M. A. El-Sayed, Fluorine substitutioneffects on the photodissociation dynamics of iodobenzene at 304 nm,J. Phys. Chem. 100 (1996), 7989–7996.

BIBLIOGRAPHY 173
[58] J. E. Freitas, H. J. Hwang, and M. A. El-Sayed, Molecular rotationclocking of the subpicosecond energy redistribution in molecules fallingapart. 2. Excess energy dependence of the rates of energy redistribu-tion in the two photodissociation channels of iodobenzene, J. Phys.Chem. 97 (1993), 12481–12484.
[59] A. T. J. B. Eppink and D. H. Parker, Energy partitioning followingphotodissociation of methyl iodide in the A band: A velocity mappingstudy, J. Chem. Phys. 110 (1999), 832–844.
[60] P. Y. Cheng, D. Zhong, and A. H. Zewail, Kinetic-energy, femtosec-ond resolved reaction dynamics. modes of dissociation (in iodoben-zene) from time-velocity correlations, Chem. Phys. Lett. 237 (1995),399–405.
[61] T. Seideman, Rotational excitation and molecular alignment in in-tense laser fields, J. Chem. Phys. 103 (1995), 7887–7896.
[62] F. Rosca-Pruna and M. J. J. Vrakking, Experimental observation ofrevival structures in picosecond laser-induced alignment of I2, Phys.Rev. Lett. 87 (2001), 153902.
[63] F. Rosca-Pruna and M. J. J. Vrakking, Revival structures in picosec-ond laser-induced alignment of I2 molecules. I. Experimental results,J. Chem. Phys. 116 (2002), 6567–6578.
[64] F. Rosca-Pruna and M. J. J. Vrakking, Revival structures in picosec-ond laser-induced alignment of I2 molecules. II. Numerical modelling,J. Chem. Phys. 116 (2002), 6579–6588.
[65] H. M. Frey, P. Beaud, T. Gerber, B. Mischler, P. P. Radi, and A. P.Tzannis, Femtosecond nonresonant degenerate four-wave mixing at

174 BIBLIOGRAPHY
atmospheric pressure and in a free jet, Appl. Phys. B 68 (1999),735–739.
[66] H. M. Frey, P. Beaud, T. Gerber, B. Mischler, P. P. Radi, and A. P.Tzannis, Determination of rotational constants in a molecule by fem-tosecond four-wave mixing, J. Raman Spetrosc. 31 (2000), 71–76.
[67] M. M. Wefers and K. A. Nelson, Programmable phase and amplitudefemtosecond pulse shaping, Optics Lett. 18 (1993), 2032–2034.
[68] A. M. Weiner, Femtosecond pulse shaping using spatial light modula-tors, Rev. Sci. Instrum. 71 (2000), 1929–1960.
[69] I. S. Averbukh and R. Arvieu, Angular focusing, squeezing, and rain-bow formation in a strongly driven quantum rotor, Phys. Rev. Lett.87 (2001), 163601.
[70] K. F. Lee, I. V. Litvinyuk, P. W. Dooley, M. Spanner, D. M. Vil-leneuve, and P. B. Corkum, Two-pulse alignment of molecules, J.Phys. B 37 (2004), L43–L48.
[71] C. H. Lin, J. P. Heritage, and T. K. Gustafson, Susceptibility echosin linear molecular gases, Appl. Phys. Lett. 19 (1971), 397–400.
[72] J. P. Heritage, T. K. Gustafson, and C. H. Lin, Observation of coher-ent transient birefringence in CS2 vapor, Phys. Rev. Lett. 34 (1975),1299–1302.
[73] P. M. Felker, Rotational coherence spectroscopy: Studies of the geome-tries of large gas-phase species by picosecond time-domain methods,J. Phys. Chem. 96 (1992), 7844–7857.

BIBLIOGRAPHY 175
[74] V. V. Matylitsky, W. Jarzeba, C. Riehn, and B. Brutschy, Femtosec-ond degenerate four-wave mixing study of benzene in the gas phase,J. Raman Spec. 33 (2002), 877–883.
[75] W. Jarzeba, V. V. Matylitsky, C. Riehn, and B. Brutschy, Rotationalcoherence spectroscopy of jet-cooled molecules by femtosecond degen-erate four-wave mixing: non-rigid symmetric and asymmetric tops,Chem. Phys. Lett. 368 (2003), 680–689.
[76] Y. Niide, I. Ohkoshi, and M. Takano, Microwave spectrum, confor-mation, and quadrupole coupling constants of 1-iodopropane, J. Mol.Spec. 122 (1987), 113–129.
[77] U. Even, J. Jortner, D. Noy, N. Lavie, and C. Cossart-Magos, Coolingof large molecules below 1 K and He clusters formation, J. Chem.Phys. 112 (2000), 8068–8071.
[78] M. Hillenkamp, S. Keinan, and U. Even, Condensation limited coolingin supersonic expansions, J. Chem. Phys. 118 (2003), 8699–8705.
[79] C. R. Gebhardt, T. P. Rakitzis, P. C. Samartzis, V. Ladopoulos, andT. N. Kitsopoulos, Slice imaging: A new approach to ion imagingand velocity mapping, Rev. Sci. Instrum. 72 (2001), 3848–3853.
[80] R. S. Judson and H. Rabitz, Teaching laser to control molecules,Phys. Rev. Lett. 68 (1992), 1500–1503.
[81] M. Machholm and N. E. Henriksen, Field-free orientation ofmolecules, Phys. Rev. Lett. 87 (2001), 193001.
[82] M. Spanner, E. A. Shapiro, and M. Ivanov, Cohenrent control ofrotational wave-packet dynamics via fractional revivals, Phys. Rev.Lett. 92 (2004), 093001.

176 BIBLIOGRAPHY
[83] B. Friedrich and D. Herschbach, Manipulating molecules via combinedstatic and laser fields, J. Phys. Chem. A 103 (1999), 10280–10288.
[84] B. Friedrich and D. Herschbach, Enhanced orientation of polarmolecules by combined electrostatic and nonresonant induced dipoleforces, J. Chem. Phys. 111 (1999), 6157–6160.
[85] L. Cai, J. Marango, and B. Friedrich, Time-dependent alignment andorientation of molecules in combined electrostatic and pulsed nonres-onant laser fields, Phys. Rev. Lett. 86 (2001), 775–778.
[86] H. Sakai, S. Minemoto, H. Nanjo, H. Tanji, and T. Suzuki, Control-ling the orientation of polar molecules with combined electrostatic andpulsed, nonresonant laser fields, Phys. Rev. Lett. 90 (2003), 083001.
[87] R. A. Bartels, T. C. Weinacht, N. Wagner, M. Baertschy, C. H.Greene, M. M. Murnane, and H. C. Kapteyn, Phase modulation ofultrashort light pulses using molecular rotational wave packets, Phys.Rev. Lett. 88 (2002), 013903.
[88] K. F. Lee, D. M. Villeneuve, P. B. Corkum, and E. A. Shapiro, Phasecontrol of rotational wave packets and quantum information, Phys.Rev. Lett. 93 (2004), 233601.
[89] T. Seideman, M. Y. Ivanov, and P. B. Corkum, Role of electronlocalization in intense-field molecular ionization, Phys. Rev. Lett. 75(1995), 2819–2822.
[90] T. K. Kjeldsen, C. Z. Bisgaard, L. B. Madsen, and H. Stapelfeldt,Role of symmetry in strong-field ionization of molecules, Phys. Rev.A 68 (2003), 063407.

BIBLIOGRAPHY 177
[91] I. V. Litvinyuk, K. F. Lee, P. W. Dooley, D. M. Rayner, D. M. Vil-leneuve, and P. B. Corkum, Alignment-dependent strong field ioniza-tion of molecules, Phys. Rev. Lett. 90 (2003), 233003.
[92] T. Seideman, Time-resolved photoelectron angular distributions:Concepts, applications, and directions, Annu. Rev. Phys. Chem. 53(2002), 41–65.
[93] K. Hoshina, K. Yamanouchi, T. Ohshima, Y. Ose, and H. Todokoro,Alignmnet of CS2 in intense nanosecond laser fields probed by pulsedgas electron diffraction, J. Chem. Phys. 118 (2003), 6211–6221.
[94] R. Velotta, N. Hay, M. B. Mason, M. Castillejo, and J. P. Marangos,High-order harmonic generation in aligned molecules, Phys. Rev.Lett. 87 (2001), 183901.
[95] B. A. Garetz, J. Matic, and A. S. Myerson, Polarization switching ofcrystal structure in the nonphotochemical light-induced nucleation ofsupersaturated aqueous glycine solutions, Phys. Rev. Lett. 89 (2002),175501.
[96] (D. R. Lide, ed.), Handbook of Chemistry and Physics, 85th edition,GRC Press, 2004-2005.
[97] J. Q. Williams and W. Gordy, Microwave spectra and molecularconstants of tertiary butyl chloride, bromide, and iodide, J. Chem.Phys. 18 (1950), 994–995.
[98] Aldrich Catalogue, Sigma-Aldrich Chemical Company, 2001.
[99] NIST Chemistry WebBook webbook.nist.gov/chemistry.

178 BIBLIOGRAPHY
[100] A. Gedanken and M. D. Rowe, Magnetic circular dicroism spectra ofthe methyl halides. Resolution of the n→ σ? continuum, Chem. Phys.Lett. 34 (1975), 39–43.
[101] D. L. Philips, A. B. Myers, and J. J. Valentini, Investigation of solva-tion effects on short-time photodissociation dynamics of alkyl iodides,J. Phys. Chem. 96 (1992), 2039–2044.
[102] W. J. O. Thomas, J. T. Cox, and W. Gordy, Millimeter wave spectraand centrifugal stretching constants of the methyl halides, J. Chem.Phys. 22 (1954), 1718–1722.
[103] J. E. Freitas, M. El-Sayed, and H. J. Hwang, The wavelength depen-dence of the rates of internal energy redistribution during the pho-todissociation of 3-iodopyridine, J. Phys. Chem. 99 (1995), 7395–7406.
[104] A. M. Mirri and W. Caminati, Quadrupole hyperfine structure inthe rotational spectrum of iodobenzene, Chem. Phys. Lett. 8 (1971),409–412.
[105] P. Atkins and J. de Paula, Atkins’ Physical Chemistry, 7th edition,Oxford University Press, 2002.
[106] T. Inagusa, M. Fujitake, and M. Hayashi, Microwave spectrum, rs
structure, dipole moment, and nuclear quadrupole coupling constanttensor of ethyl iodide, J. Mol. Spec. 128 (1988), 456–468.
[107] M. Fujitake and M. Hayashi, Microwave spectrum of 1-iodopropane:The observation of the forbidden transitions, J. Mol. Spec. 127(1988), 112–124.

BIBLIOGRAPHY 179
[108] P. W. Milonni and J. H. Eberly, Lasers, John Wiley & Sons, Inc.,1988.