alight - investor presentation · 2021. 1. 25. · spac cash in trust $1,035 forward purchase...
TRANSCRIPT

1
Investor
PresentationJanuary 2021

2
DisclaimerForward-Looking StatementsThis presentation includes “forward-looking statements” within the meaning of the “safe harbor” provisions of the United States Private Securities Litigation Reform Act of 1995. These forward-looking statements are provided for illustrative purposes only and are not intended to serve as, and must not be relied on by any investor as, a guarantee, an assurance, a prediction or a definitive statement of fact or probability. Foley Trasimene’s and Alight’s actual results may differ from their expectations, estimates, and projections and, consequently, you should not rely on these forward-looking statements as predictions of future events. Words such as “expect,” “estimate,” “project,” “budget,” “forecast,” “anticipate,” “intend,” “plan,” “may,” “will,” “could,” “should,” “believes,” “predicts,” “potential,” “continue,” and similar expressions (or the negative versions of such words or expressions) are intended to identify such forward-looking statements. These forward-looking statements include, without limitation, Foley Trasimene’s and Alight’s expectations with respect to future performance and anticipated financial impacts of the proposed business combination, the satisfaction or waiver of the closing conditions to the proposed business combination, and the timing of the completion of the proposed business combination.
These forward-looking statements involve significant risks and uncertainties that could cause the actual results to differ materially, and potentially adversely, from those expressed or implied in the forward-looking statements. Most of these factors are outside Foley Trasimene’s and Alight’s control and are difficult to predict. Factors that may cause such differences include, but are not limited to: (1) the occurrence of any event, change, or other circumstances that could give rise to the termination of the definitive business combination agreement (the “Agreement”); (2) the outcome of any legal proceedings that may be instituted against Foley Trasimene and/or Alight following the announcement of the Agreement and the transactions contemplated therein; (3) the inability to complete the proposed business combination, including due to failure to obtain approval of the stockholders of Foley Trasimene, certain regulatory approvals, or satisfy other conditions to closing in the Agreement; (4) the occurrence of any event, change, or other circumstance that could give rise to the termination of the Agreement or could otherwise cause the transaction to fail to close; (5) the impact of COVID-19 on Alight’s business and/or the ability of the parties to complete the proposed business combination; (6) the inability to obtain or maintain the listing of the combined company’s common stock on the New York Stock Exchange following the proposed business combination; (7) the risk that the proposed business combination disrupts current plans and operations as a result of the announcement and consummation of the proposed business combination; (8) the ability to recognize the anticipated benefits of the proposed business combination, which may be affected by, among other things, competition, the ability of Alight to grow and manage growth profitably, and retain its key employees; (9) costs related to the proposed business combination; (10) changes in applicable laws or regulations; and (11) the possibility that Foley Trasimene or Alight may be adversely affected by other economic, business, and/or competitive factors. The foregoing list of factors is not exclusive. Additional information concerning certain of these and other risk factors is contained in Foley Trasimene’s most recent filings with the SEC and will be contained in the Form S-4, including the proxy statement/prospectus expected to be filed in connection with the proposed business combination. All subsequent written and oral forward-looking statements concerning Foley Trasimene or Alight, the transactions described herein or other matters and attributable to Foley Trasimene, Alight or any person acting on their behalf are expressly qualified in their entirety by the cautionary statements above. Readers are cautioned not to place undue reliance upon any forward-looking statements, which speak only as of the date made. Each of Foley Trasimene and Alight expressly disclaims any obligations or undertaking to release publicly any updates or revisions to any forward-looking statements contained herein to reflect any change in their expectations with respect thereto or any change in events, conditions, or circumstances on which any statement is based, except as required by law.
Additional Information about the Business Combination and Where to Find ItIn connection with the proposed business combination, a registration statement on Form S-4 (the “Form S-4”) is expected to be filed by Acrobat Holdings, Inc. (to be renamed Alight, Inc. at closing), a Delaware corporation (”Alight Pubco”), with the SEC. The Form S-4 will include preliminary and definitive proxy statements to be distributed to holders of Foley Trasimene’s common stock in connection with Foley Trasimene’s solicitation for proxies for the vote by Foley Trasimene’s stockholders in connection with the proposed business combination and other matters as described in the Form S-4, as well as a prospectus of Alight Pubco relating to the offer of the securities to be issued in connection with the completion of the business combination. Foley Trasimene and Alight Pubco urge investors, stockholders and other interested persons to read, when available, the Form S-4, including the proxy statement/prospectus incorporated by reference therein, as well as other documents filed with the SEC in connection with the proposed business combination, as these materials will contain important information about Alight Pubco, Foley Trasimene, and the proposed business combination. Such persons can also read Foley Trasimene’s final prospectus dated May 28, 2020 (SEC File No. 333-238135), for a description of the security holdings of Foley Trasimene’s officers and directors and their respective interests as security holders in the consummation of the proposed business combination. After the Form S-4 has been filed and declared effective, the definitive proxy statement/prospectus will be mailed to Foley Trasimene’s stockholders as of a record date to be established for voting on the proposed business combination. Stockholders will also be able to obtain copies of such documents, without charge, once available, at the SEC’s website at www.sec.gov, or by directing a request to: Foley Trasimene Acquisition Corp., 1701 Village Center Circle, Las Vegas, NV 89134, or (702) 323-7330. These documents, once available, can also be obtained, without charge, at the SEC’s web site (http://www.sec.gov).

3
Disclaimer (cont’d)Participants in the SolicitationFoley Trasimene and Alight and their respective directors, executive officers and other members of their management and employees, under SEC rules, may be deemed to be participants in the solicitation of proxies of Foley Trasimene’s stockholders in connection with the proposed business combination. Investors and security holders may obtain more detailed information regarding the names, affiliations and interests of Foley Trasimene’sdirectors and executive officers in Foley Trasimene’s final prospectus dated May 28, 2020 (SEC File No. 333-238135), which was filed with the SEC on May 28, 2020. Information regarding the persons who may, under SEC rules, be deemed participants in the solicitation of proxies of Foley Trasimene’s stockholders in connection with the proposed business combination will be set forth in the proxy statement/prospectus for the proposed business combination when available. Information concerning the interests of Foley Trasimene’s and Alight’s participants in the solicitation, which may, in some cases, be different than those of Foley Trasimene’s and Alight’s equity holders generally, will be set forth in the proxy statement/prospectus relating to the proposed business combination when it becomes available.
No Offer or SolicitationThis presentation is not a proxy statement or solicitation of a proxy, consent, or authorization with respect to any securities or in respect of the proposed business combination and shall not constitute an offer to sell or a solicitation of an offer to buy the securities of Foley Trasimene or Alight, nor shall there be any sale of any such securities in any state or jurisdiction in which such offer, solicitation, or sale would be unlawful prior to registration or qualification under the securities laws of such state or jurisdiction. No offer of securities shall be made except by means of a prospectus meeting the requirements of Section 10 of the Securities Act of 1933, as amended, or exemptions therefrom.
Non-GAAP Financial MeasuresThis presentation includes certain financial measures not presented in accordance with generally accepted accounting principles in the United States of America (“GAAP”). These non-GAAP financial measures are not measures of financial performance in accordance with GAAP and may exclude items that are significant in understanding and assessing Foley Trasimene’s and Alight’s financial results or position. Therefore, these measures should not be considered in isolation or as an alternative or superior to net income, cash flows from operations or other measures of profitability, liquidity or performance under GAAP. You should be aware that the Foley Trasimene’s and Alight’s presentation of these measures may not be comparable to similarly-titled measures used by other companies. Because of the limitations of non-GAAP financial measures, you should consider the non-GAAP financial measures presented in this presentation in conjunction with Alight’s audited financial statements and the related notes thereto.
TaxesExpected projected reduction in the amounts that would otherwise be paid in the future to various tax authorities as a result of the increase in tax basis due to common stock redeemed or exchanged and other qualifying transactions pursuant to the tax receivable agreement. These amounts are estimates and have been prepared for informational purposes only. The actual amount of deferred tax assets and related liabilities that will be recognized will differ based on, among other things, the timing of the redemptions or exchanges, the price of our shares of common stock at the time of the redemptions or exchanges and the tax rates then in effect.

4
Presenters
Richard Massey
Chief Executive Officer, Foley Trasimene
Stephan Scholl
Chief Executive OfficerChairman, Foley Trasimene
Bill Foley
• Richard serves as CEO of Foley Trasimene
• Over 30 years of industry experience
• Stephan is CEO of Alight Solutions
• Over 24 years of industry experience
Katie Rooney
Chief Financial Officer
• Katie is CFO of Alight Solutions
• Over 20 years of industry experience
• Bill serves as Founder and Chairman of Foley Trasimene
• Over 32 years of industry experience

5
Transaction Overview
Shares to SPAC19.2%
Shares to FPA5.6%
Shares to Pipe28.8%
Shares to Sponsor4.3%
Rollover Shares to Existing
Shareholders42.1%
Today Long Term
Revenue Growth
Today Long Term
Revenue per Employee
20%+
30%+
Today Long Term
Adjusted EBITDA Margin
Pro Forma Valuation ($M) Sources & Uses ($M)
Pro Forma Equity Value $5,385
Pro Forma Total Debt (Rollover Extended Term Loan B + Rollover Senior Secured Notes)
2,276
Cash (360)
Pro Forma Firm Value $7,300
SourcesSPAC Cash in Trust $1,035Forward Purchase Agreement 300PIPE Investment (incl. $250M from Cannae and $150M from FNF) 1,550Existing Alight Shareholders Rollover Equity 2,267Rollover Existing Debt 2,276Cash from Balance Sheet 448Total Sources $7,876
Alight’s Transformation Opportunity Will Create ValuePro Forma Ownership2
Foley Trasimene, Blackstone and Alight partnering to drive value____________________Note: See Appendix for non-GAAP reconciliation. 1 Illustrative transaction fees and expenses for both SPAC and target. Includes deferred u/w fee, PIPE fee, financing fees and advisory / legal / other fees but excludes breakage costs associated with the repayment of senior unsecured notes and hedges, 2 Assumes no redemptions. Share count includes 226.7 million seller shares, 103.5 million SPAC shares, 30.0 million FPA shares, 155.0 million PIPE shares (including 25.0 million PIPE shares to Cannae and 15.0 million PIPE shares to FNF) and 23.3 million founder shares. Excludes impact of 15.0 million seller earnout shares (50% earned at $12.50 and 50% earned at $15.00). Excludes impact of 59.6 million public, FPA and private placement warrants struck at $11.50. Includes shares issuable upon exchange of LLC interests underlying all vested and unvested PIUs.
6%
10%
$250K
UsesDebt Paydown $1,864Cash Consideration to Existing Alight Shareholders 1,000Existing Alight Shareholders Rollover Equity 2,267Rollover Existing Debt 2,276Cash to Balance Sheet 360Estimated Fees & Expenses1 109Total Uses $7,876
Alight is a leading healthcare, benefits and payroll services provider
$175K

6
Bill Foley’s Valuation Creation Playbook
$3M
$11.7B
$2.5B
$80.9B
$1.6B
$13.4B
$4.2B
$16.0B
$2.0B
$10.6B
1984LBO
CurrentMkt Cap
2006Spin-Off
CurrentMkt Cap
2015IPO
CurrentMkt Cap
2018IPO
CurrentMkt Cap
2019LBO
CurrentMkt Cap
William P. Foley IIFounder
Foley has achieved great success acquiring industry utilities with large total addressable markets at attractive values and driving transformation and multiple expansion. Common characteristics include:
Resulting in over $120B in market capitalization growth and a consistent track record of significant multiple expansion
____________________Sources: Public company filings and Factset. Market cap and stock price data as of January 15, 2021.1 Human Capital Management, 2 All multiples represent FV / NTM EBITDA with the exception of FNF which represents forward P/E, 3 Reflected on an absolute basis and does not represent incremental margin or multiple expansion, 4 Bill Foley currently owns no equity in FIS or CDAY.
4
Industry Served Real Estate
Blue Chip Customer
Recurring Revenue
Margin Expansion
Multiple Expansion
FinTech Mortgage HCMData &
AnalyticsWorkplace Benefits
& Payroll
P P P P P P
P P P P P P
~670 bps > Peers +2,000 bps +1,070 bps +590 bps +560 bps +30% LT Goal
~4x ~13x ~11x ~66x ~4xComp group
supports 20x+
Recently announced proposed ~$9B merger of Paysafe with Foley Trasimene Acquisition Corp. II
− Foley led the $2B PIPE in Paysafe
− Represents the largest common stock SPAC PIPE ever
− Stock is currently trading at $15.59, representing a 56% premium to $10.00 IPO share price
SPAC Sponsor4
1
2
2
3
3
7
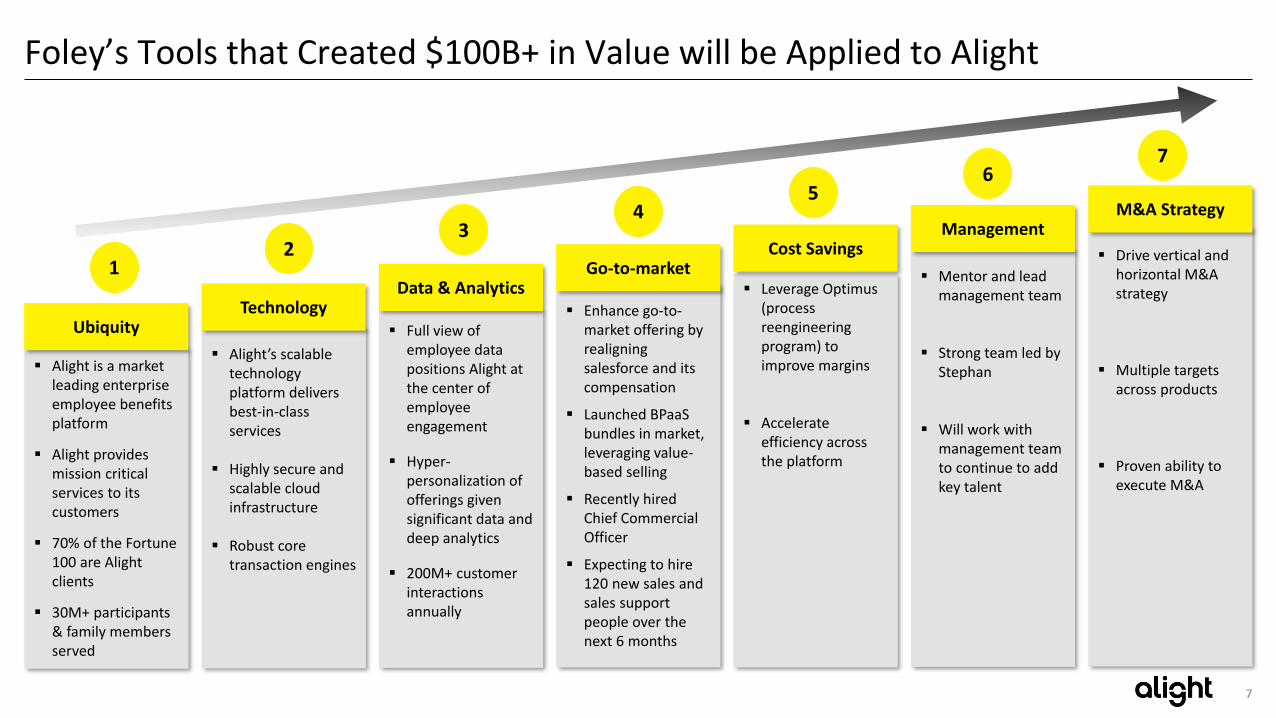
Foley’s Tools that Created $100B+ in Value will be Applied to Alight
Alight is a market leading enterprise employee benefits platform
Alight provides mission critical services to its customers
70% of the Fortune 100 are Alight clients
30M+ participants & family members served
Ubiquity
Alight’s scalable technology platform delivers best-in-class services
Highly secure and scalable cloud infrastructure
Robust core transaction engines
Technology Full view of
employee data positions Alight at the center of employee engagement
Hyper-personalization of offerings given significant data and deep analytics
200M+ customer interactions annually
Data & Analytics Enhance go-to-
market offering by realigning salesforce and its compensation
Launched BPaaS bundles in market, leveraging value-based selling
Recently hired Chief Commercial Officer
Expecting to hire 120 new sales and sales support people over the next 6 months
Go-to-market Mentor and lead
management team
Strong team led by Stephan
Will work with management team to continue to add key talent
Management
Drive vertical and horizontal M&A strategy
Multiple targets across products
Proven ability to execute M&A
M&A Strategy
12
34
67
Leverage Optimus (process reengineering program) to improve margins
Accelerate efficiency across the platform
Cost Savings
5

8
Foley + Alight Have The Tools To Accelerate Revenue and Margin Growth
Mission-critical business at
intersection of healthcare, benefits
& payroll
Foley Playbook
Transformation Initiatives Underway
Significant opportunity for value creation through revenue growth, margin improvement
and multiple expansion
Alight Solutions
Agenda
01. Alight Overview
03. Financial Overview
02. Business Details

1010
Confluence of Factors Influencing the Future of the Workplace
Worksite trends have been magnified due to the pandemic reverberating across all dimensions of wellbeing
Health & Personalization
Financial responsibility of healthcare shifting to employees while also facing increasing decision complexity, driving need for personalization
Healthcare deductibles are growing 8x faster than wages
25% of healthcare users find their current system so difficult to navigate that they just give up
Total WellbeingEmployees are increasingly looking to balance their health and financial wellness choices, driving a need for Total Wellbeing solutions
61% of workers say that they will never be able to retire at the age they want
1 in 6 Millennials can’t cover a $400 emergency expense
Gig EconomyEmployers increasingly look for specific talent on an episodic basis, leading to a global increase in the contingent workforce
36% of the U.S. labor market now have some sort of alternative/contingent work arrangement
GlobalizationCompanies face significant obstacles in their desire to be agile with their global workforce
83% of companies are planning to expand globally. 50% of them are expanding with the use of an external provider
RegulationsEver-changing workplace regulations are driving the need for tools to remain compliant
70+ updates passed since Affordable Care Act
Payroll compliance is the top concern of more than 50% of organizations
____________________Sources: Alight Solutions, Kaiser Family Foundation, WSJ, Upwork, Key Bank Capital Markets.

11
Our Vision: The Preeminent Employee Engagement Partner
Our Capabilities that Drive EngagementOur Mission Critical Solutions
Personalize Benefits & Payroll
Enable Financial Security and Wellness
BPaaS
SaaS Technology
Services
Personalization Data & AI
Achieve ~50% or more of bookings TCV1 starting in 2023 in high-value, cloud-based BPaaS offering____________________Sources: The World Bank (2020), CMS (2019), Kaiser Family Foundation (2020), Plansponsor (2020), PwC. 1 Total contract value of sales, which includes both one-time and recurring charges.
Our Business Process as a Service (BPaaS) model brings together SaaS capabilities and an automated service delivery model with data & AI to deliver superior outcomes for clients
~3.5B employees globally
U.S. healthcare spending: ~$3.8T
~155M members enrolled in
employer-sponsored health insurance
~61M Medicare beneficiaries
~$8.3T in Defined Contribution
assets across 111M participants
Payroll Outsourcing Services market
size: ~$20B
Total Addressable Market
Deliver and Administer Benefits & Payroll
Support Employers Globally
Help Consumers Navigate the Healthcare Ecosystem
12
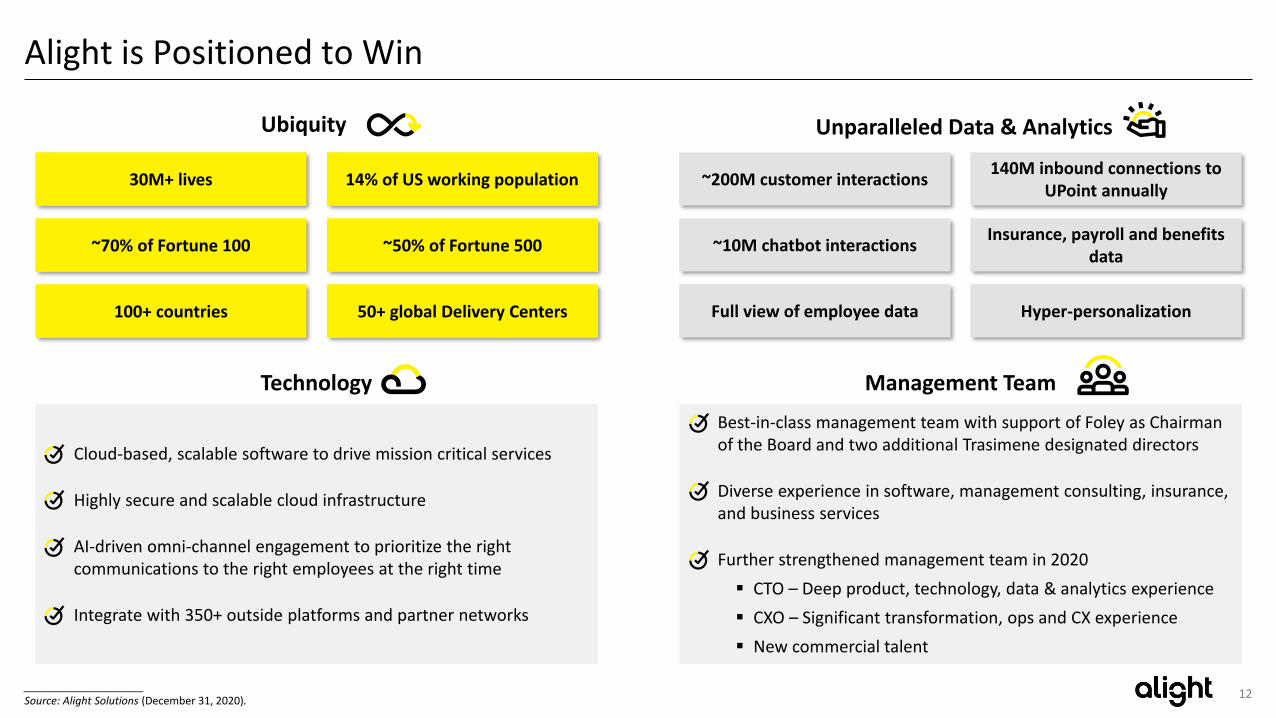
Alight is Positioned to Win
Cloud-based, scalable software to drive mission critical services
Highly secure and scalable cloud infrastructure
AI-driven omni-channel engagement to prioritize the right communications to the right employees at the right time
Integrate with 350+ outside platforms and partner networks
Unparalleled Data & Analytics
Technology Management Team
Ubiquity
30M+ lives 14% of US working population
~70% of Fortune 100 ~50% of Fortune 500
100+ countries
140M inbound connections to UPoint annually
~10M chatbot interactions
~200M customer interactions
Hyper-personalizationFull view of employee data
Insurance, payroll and benefits data
Best-in-class management team with support of Foley as Chairman of the Board and two additional Trasimene designated directors
Diverse experience in software, management consulting, insurance, and business services
Further strengthened management team in 2020
CTO – Deep product, technology, data & analytics experience
CXO – Significant transformation, ops and CX experience
New commercial talent
50+ global Delivery Centers
____________________Source: Alight Solutions (December 31, 2020).

13
Standardization & Automation of Services
Data & AI Capabilities
SaaS Capabilities
Consumer Engagement
Focused on Technology Transformation to Drive BPaaS-led Offerings
FinancialImpact of
Transformation Phase
Revenue Growth:
% BPaaS Revenue:2
EBITDA Margin:
Low-single-digits
7%3
Low 20%
Mid-single-digits
13%5
Low 20% (including investment)
High-single-digits
23%7
30%+6
Technology Transformation
Revenue per Employee:1 $150K $175K4 $250K6
(2017-2019)
(2020-2021)
(2021+)
Phase 0: FoundationBuild breadth and size
Phase II: Engagement PlatformNext Gen Cloud Launch and Integration
Phase I: Outcome & ROIAggregate products and services to BPaaS Offers
Market leading benefits platform
Significant data pools on 30M+ participants
Longstanding and embedded client relationships
One Alight – Engagement Model
5 New BPaaS offerings
Cost guarantee (ROI)
Data & AI capabilities
Software and AI-focused solutions
Standardized, scalable, next-generation platforms:
- Wealth Cloud
- Health Cloud
- Payroll Cloud
____________________Source: Alight Solutions.1 Excludes contractors 2 Excludes Hosted business, 3 2019A, 4 2020E, 5 2021E, 6 Long-term estimate, 7 2023E.

14
Our Next Generation Cloud Platforms
Global presence and scale unlocks the power of data and analytics
Consumer centric, single access point to full spectrum of services
Consultative guidance and strategy realization for clients
Continuous optimization and automation for service
Leading benefits navigation solutions –Human + AI
Modular platforms designed to provide a seamless experience across web, desktop, and mobile for any use case and workflow
Alight Engagement Platform
Next Generation Platforms
Health Cloud Wealth Cloud Payroll Cloud
Data & AI Engine
Open Architecture
Integrated offerings
Enables personalized
benefits & pay
Global capabilities
Highly configurable,
rapid deployment
Enabled by common data model and modules
Leverages public cloud
Ability to provide a seamless, integrated experience across health benefits, retirement benefits, and payroll
Employee-centric design with the ability to serve unique plan designs
Singular view of pay, taxes, and deductions across assignments
Compliance with local regulatory requirements
Deployed by clients and 3rd parties, not just Alight
Key Differentiators

15
BPaaS Bookings and Commercial Investments Support Revenue Acceleration
Success of BPaaS Evident in Bookings1
2
3 Signed largest ever contract on 11/20 with Federal Thrift Savings Plan (6.1M employees)
2020E2017A 2022E2018A 2023E2019A 2021E Future
$743M
BPaaS revenue projections 2017-2023E ($M)
3%% BPaaSrevenue3 4% 7% 13% 13% 17% 23% 50%+
$743M
$509M
$363M
$330M$158M
$88M$58M
____________________Source: Alight Solutions.1 Contracted and under contracting 2 Excludes Federal Thrift Savings Plan contract of $2.3B TCV won in November 2020 3 Excludes Hosted business.
$166MTCV of 2H’20
BPaaS Bookings
Key Wins include a number of large-cap energy and technology clients 1
TCV of Total Bookings2
2H’202H’19
$909M
$665M
+37%
4 Expecting to add 120 new sales and sales support roles by 1H’21

16
Attractive Financial Profile
Long term
embedded
contracts
3-5 yearContract length
97%Revenue
retention1
~15 yearsAvg. client
tenure2
Profitable and
sustainable growth
with significant
and clear BPaaS
upside
50%50%
BPaaSNon-
BPaaS
Bookings by 2023
Average uplift of 1.5x annual recurring revenue on bundled BPaaS deals3
Highly recurring
and diversified
revenue profile
81%
19%
2020Revenue$2,710M
Recurring
Project-based
21%
20%
19%
14%
13%
13%
FinancialHealth & Public Service Energy &
Resources
ConsumerTech & Media
Other
2019Revenue
Transformation
drives significant
operating leverage
Established
Platform with
Upside from M&A
Strong FCF generation and 3.1x leverage profile4 to
support opportunistic M&A
Large, global, and fragmented pool of acquisition targets
Proven ability to integrate and cross-sell new
solutions to Alight’s large client (e.g., Compass)
Seasoned team and unique culture with ability to integrate and empower
founders
22%
24%
Adjusted EBITDA Margin (%, $M)
35%
40%
Employer Solutions Gross Margin (%, $M)
____________________Source: Company financials (December 31, 2020).Note: See Appendix for non-GAAP reconciliation.1 Retention defined as prior year’s active client revenue compared to the following year, 2 Top 25 clients, 3 Based on sold BPaaS bundles, 4 Based on net debt of $1.9B and 2020E Lender Adj. EBITDA.
2023 Long Term
60%+
2021
802 1,099
2023 Long Term2021
30%+
600 768

17
3.7%
2.0%2.0%
1.4%
Significant Operating Leverage to Drive Scale
2023E2021E
33.4%
2019
(1.5%)
Investments
34.6%
38.7%
Optimus & Operating Leverage
(1.6%)
M&A Covid Impact New BPaaS Sales
BPaaS Conversions (existing book)
Optimus & Operating Leverage
(1.9%)
Phase I
Investments: Technology and product investments ($38M) 1
M&A: Integration of Hodges-Mace, NGA, and Choice Health at lower margins
Covid Impact: Covid impact on revenue ($95M)
Optimus & Operating Leverage: One Alight delivery model driving efficiencies (net $92M)
Phase II
Launch of cloud platforms will drive reduced implementation time and ongoing costs through standardization
Faster sales to revenue conversion with product licensing upfront
30% reduction in cost to serve through standardized, pre-configured next gen product suite – automated & self-serve capabilities & easier tooling
Gross Margin
1 2 3 4
1
2
3
4
5 6
5
6
____________________Source: Alight Solutions.Note: Revenue growth reflected on a year-over-year basis.1 Exclude $5m of capitalized investment.
RevenueGrowth
7% 2% 10%
18
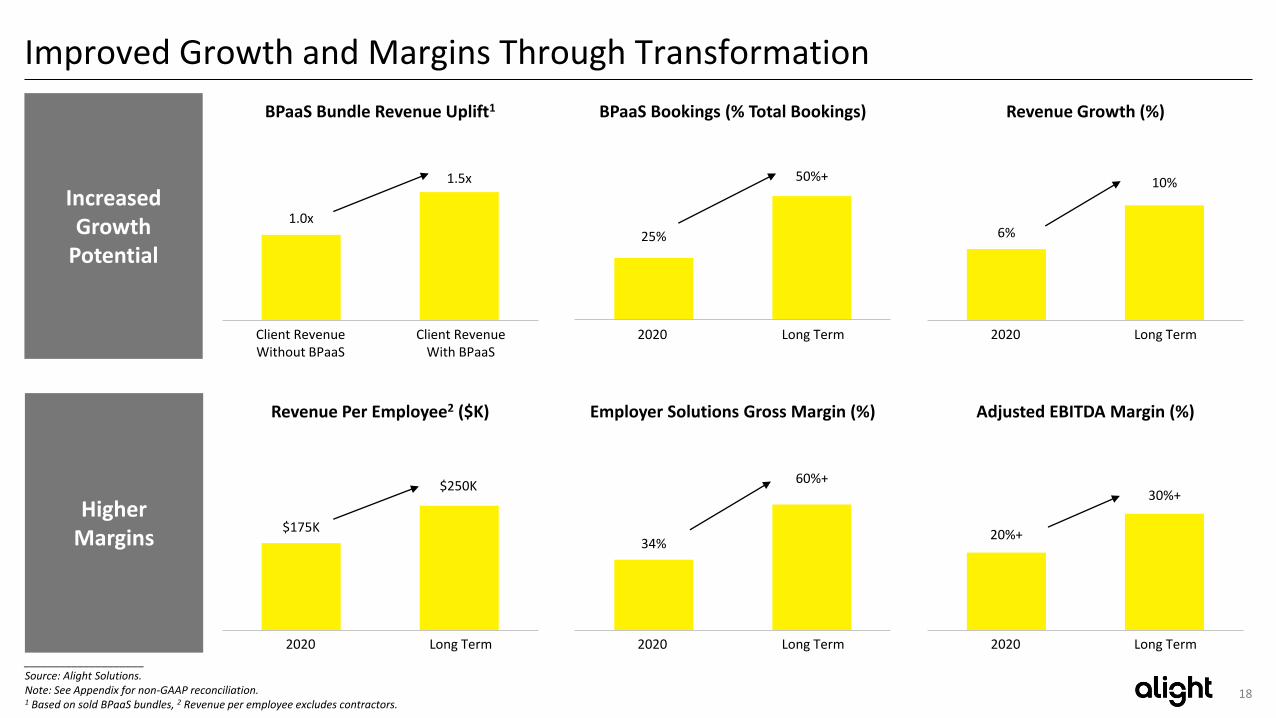
Improved Growth and Margins Through Transformation
IncreasedGrowth
Potential
HigherMargins
$175K
Long Term
$250K
2020
Revenue Per Employee2 ($K)
____________________Source: Alight Solutions.Note: See Appendix for non-GAAP reconciliation.1 Based on sold BPaaS bundles, 2 Revenue per employee excludes contractors.
Revenue Growth (%)
34%
Long Term2020
60%+
Employer Solutions Gross Margin (%)
20%+
2020
30%+
Long Term
Adjusted EBITDA Margin (%)
25%
50%+
Long Term2020
BPaaS Bookings (% Total Bookings)
1.0x
1.5x
Client RevenueWith BPaaS
Client RevenueWithout BPaaS
BPaaS Bundle Revenue Uplift1
6%
10%
Long Term2020

19
Transformation Will Drive Multiple Expansion
12.2x13.8x 14.2x
16.5x 18.0x 18.5x
27.1x
Alight BPO Brokers Broadridge ADP Paychex HealthEquity
Revenue per employee:
Revenue growth (CY21):
EBITDA margin (CY21):
Comparable Companies: FV / 21E Adjusted EBITDA
____________________Source: Company filings, Factset as of January 15, 2021, excludes primary comp CDAY.Note: See Appendix for non-GAAP reconciliation; Alight multiple based on $600m 2021E Adjusted EBITDA; comps reflected on a pre-SBC EBITDA basis; Brokers include AON, MMC and BPO includes ACN, G, WNS, EXLS.1 Represents CY20 revenue growth.
Reference Only Primary Comparables
Key Metrics Today LT
$175K $250K
6% 10%
20%+ 30%+
BPO Brokers
$44K
7%
22%
$220K
4%
28%
$389K
4%
24%
$252K
3%
26%
$256K
3%
42%
$182K
8%
33%
1

Alight Solutions
Agenda
01. Alight Overview
03. Financial Overview
02. Business Details

21
Mission-Critical Services That Help Employers Manage ~70% of Their Spend1
____________________1 As per Deloitte (2017), 50%-60% of total spend by Fortune 500 companies is on benefits and management estimates that an additional 10% is on payroll, 2 Based on FY20E Revenue. Excludes Hosted business (expected to be ~1% of total revenue in 2021 and is scheduled to sunset in 2023).
Payroll & HR Management
HR Data Management
HR Cloud Services
Global Payroll
Benefits Administration
Health Administration
Healthcare Navigation
Reimbursement Solutions
Dependent Verification Services
Defined Benefit and Contribution Administration
Participant Advisory & Wellbeing
Cloud Deployment Solutions (CDS)
Cloud Application Services (CAS)
Employer Solutions Professional Services
Solutions to manage health & wealth benefits, and payroll for employers and employees
Solutions to manage the workforce from the cloud
Integrated solutions driven by powerful technologies and data-led insights to help our clients grow
(84% of revenue2) (13% of revenue2)

22
Case Studies – Payroll & Health
Big box grocery – Payroll
~$10M in total payroll cost of compliance and penalties
High volume of payroll overpayments
Complex, manual payroll processes
Compliance risk
Alight Solution
Best-in-class, proven payroll processing in collaboration with Workday
Eloise (AI) and automation software to improve cycle time
Alight’s insights and client experiences for optimal payroll delivery
Centralized case tracking tool and detailed electronic tracking
Alight Value
• Reduction in payroll overpayments
• Increase in recovered overpayments
• Decrease in compliance penalties
• Improved employee experience
~$5MExpected total savings per year
~45% ROIExpected based on NPV of cash
flow / NPV of Alight fees
Big tech – Health
46% of team not confident they could find crucial health benefits information
Multiple vendors
Difficulty navigating
Little segmentation or personalization
Alight Solution
Personalized concierge solution utilizing Alight Benefit Pros
AI to identify care gaps and benefit program usage
Personalized campaigns to improve employees’ benefits utilization
Navigation solution to migrate employees to a single ID card
Alight Value
• Improvement in benefits perception
• Decrease in healthcare costs
• Increase in benefit program usage
• Improved service satisfaction
+76Benefits net promoter score
93%Service satisfaction
____________________Note: Analysis reflects NPV of estimated cash flow benefit divided by NPV of Alight fees, and assumes ROI NPV discount rate of 10%.
23
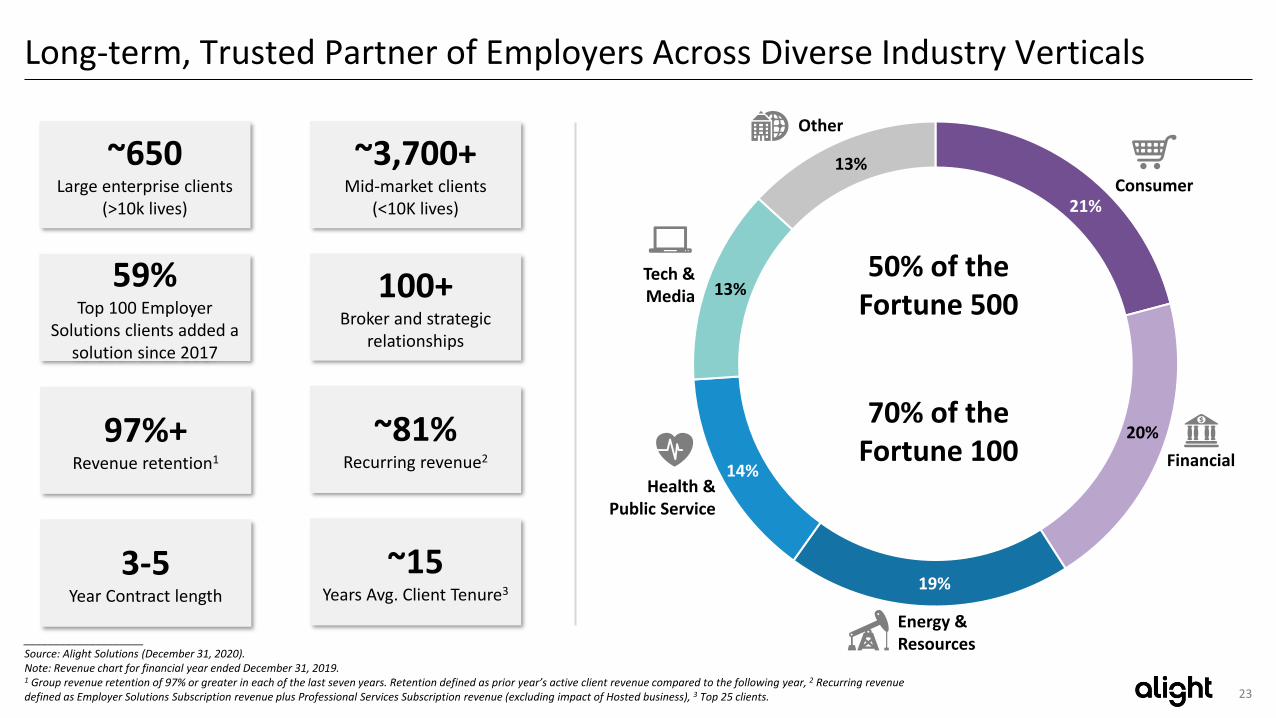
14%
Long-term, Trusted Partner of Employers Across Diverse Industry Verticals
____________________Source: Alight Solutions (December 31, 2020).Note: Revenue chart for financial year ended December 31, 2019.1 Group revenue retention of 97% or greater in each of the last seven years. Retention defined as prior year’s active client revenue compared to the following year, 2 Recurring revenue defined as Employer Solutions Subscription revenue plus Professional Services Subscription revenue (excluding impact of Hosted business), 3 Top 25 clients.
~650Large enterprise clients
(>10k lives)
~3,700+ Mid-market clients
(<10K lives)
97%+ Revenue retention1
100+Broker and strategic
relationships
59% Top 100 Employer
Solutions clients added a solution since 2017
~81%Recurring revenue2
Consumer
Other
Energy & Resources
Financial
Tech &Media
Health &Public Service
13%
13%
19%
21%
20%
3-5 Year Contract length
~15Years Avg. Client Tenure3
50% of the Fortune 500
70% of the Fortune 100
24
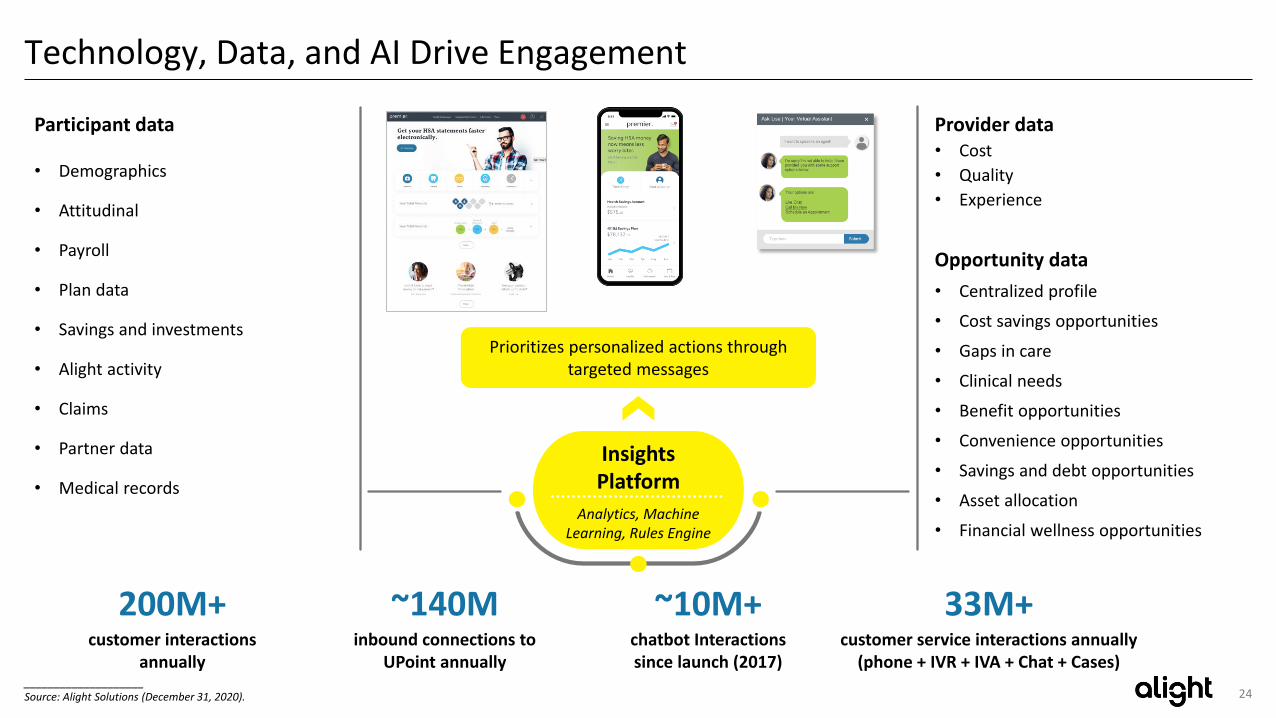
Technology, Data, and AI Drive Engagement
Participant data
• Demographics
• Attitudinal
• Payroll
• Plan data
• Savings and investments
• Alight activity
• Claims
• Partner data
• Medical records
Provider data• Cost
• Quality
• Experience
Opportunity data
• Centralized profile
• Cost savings opportunities
• Gaps in care
• Clinical needs
• Benefit opportunities
• Convenience opportunities
• Savings and debt opportunities
• Asset allocation
• Financial wellness opportunities
Prioritizes personalized actions through targeted messages
Insights Platform
Analytics, Machine Learning, Rules Engine
200M+customer interactions
annually
~140Minbound connections to
UPoint annually
~10M+chatbot Interactions since launch (2017)
33M+customer service interactions annually
(phone + IVR + IVA + Chat + Cases) ____________________Source: Alight Solutions (December 31, 2020).

25
Strategic Fit
Proven Track Record of Disciplined M&A
Strategic focus on innovation, scale, and market adjacencies that drive engagement and meaningful value for clients
~$20B in new TAM added
~2,500 new clients and ~2.5M+ participants added
New geographies – APAC, EMEA
Enhanced & new capabilities:
- Healthcare navigation
- Mid-market health ben admin
- Voluntary benefits
- Multi-country payroll
Business model alignment
BPaaS offering
- Competitive differentiation – offering provides another solution to add to BPaaS offering
Technology enabled
Data & analytics
Moving from Health Benefits to Total
Health
• Adding Clinical Navigation capabilities
• Engagement and digital wellness
• Medical cost containment and reference-based pricing
Helping employers with globalization
• Expanding Global Payroll in APAC & EMEA
• Adding Global Benefits
• New growth area: Global Employer of Record (EOR)
Entering New Markets
• Mid-market Defined Contribution Administration
• Mass market tech-enabled Financial Advisory
Consolidation of benefits providers
• Fragmented market: >50 vendors serving ~100M US lives
• Opportunity to acquire clients and cross-sell services through Alight Health Cloud
Strong Experience in M&A Significant Acquisition Opportunities Across Segments
____________________Source: Alight Solutions (December 31, 2020).

26
Experienced Management Team with a Proven Track Record
Years of Industry / Functional Experience
Stephan Scholl
Chief Executive Officer
24
Katie Rooney
Chief Financial Officer
20
Cathinka Wahlstrom
President & Chief Commercial Officer
25
Colin Brennan
Chief Product Strategy &Services Officer
24
Dinesh Tulsiani
Chief Strategy Officer
21
Greg Goff
Chief Product & Technology Officer
24
Michael Rogers
Chief HR Officer
17
Paulette Dodson
General Counsel
26
Cesar Jelvez
Chief Customer Experience Officer
22
Ed Auriemma
Chief Operations Officer
22

Alight Solutions
Agenda
01. Alight Overview
03. Financial Overview
02. Business Details
28
3%15%
12%
32%
37%
45%
20%
19%
13%
3%
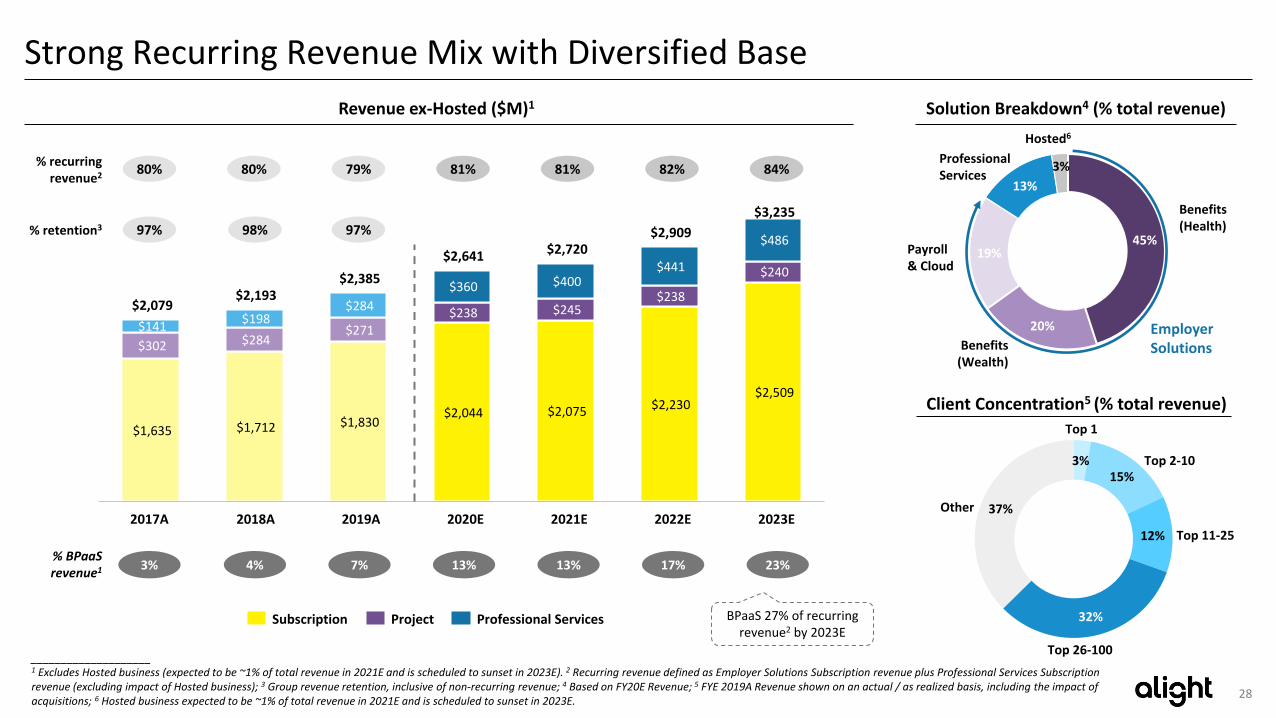
Strong Recurring Revenue Mix with Diversified Base
$1,635 $1,712 $1,830 $2,044 $2,075 $2,230
$2,509
$302 $284 $271
$238 $245 $238
$240
$141 $198
$284
$360 $400 $441
$486
$2,079 $2,193
$2,385
$2,641 $2,720 $2,909
$3,235
2017A 2018A 2021E2019A 2020E
Professional ServicesSubscription Project
2023E2022E
3%% BPaaSrevenue1 4% 7% 13% 13% 17% 23%
BPaaS 27% of recurring revenue2 by 2023E
80% 80% 79% 81% 81% 82% 84%% recurring
revenue2
97% 98%% retention3
Solution Breakdown4 (% total revenue)
Hosted6
Benefits(Health)
Payroll & Cloud
Professional Services
Benefits(Wealth)
EmployerSolutions
Top 1
Top 2-10
Top 11-25
Top 26-100
Client Concentration5 (% total revenue)
____________________1 Excludes Hosted business (expected to be ~1% of total revenue in 2021E and is scheduled to sunset in 2023E). 2 Recurring revenue defined as Employer Solutions Subscription revenue plus Professional Services Subscription revenue (excluding impact of Hosted business); 3 Group revenue retention, inclusive of non-recurring revenue; 4 Based on FY20E Revenue; 5 FYE 2019A Revenue shown on an actual / as realized basis, including the impact of acquisitions; 6 Hosted business expected to be ~1% of total revenue in 2021E and is scheduled to sunset in 2023E.
Revenue ex-Hosted ($M)1
Other
97%

29
One Alight BPaaS Driving GrowthGo-to-Market with five current BPaaS solutions:
• Health Bundle
• Cloud Application Services
• Global Payroll
• Payroll & Cloud Services
• Customer Care as a Service
Client 1 – Health Client 2 – Payroll Client 3 – Health
Current Future Current Future Current Future
ARR (Health) $1.2M $2.4M ARR (Payroll) $2.2M $3.8M ARR (Health) $3.4M $4.8M
Direct Margin % 16% 24% Direct Margin % 25% 25% Direct Margin % 39% 43%
ROI Guarantee 150% ROI Guarantee 150%
Offer Offer Offer
Services Current Future Services Current Future Services Current Future
Benefits Admin Global Payroll Benefits Admin
Navigation hrX Engagement Platform Navigation
Hype Hype
One-Card / BSR One-Card / BSR
1
2
3
4
5
____________________Source: Alight Solutions.Note: ARR: Annual Recurring Revenue, BSR: Benefit Smart Routing; ROI Guarantee is a multiple of Alight fees charged to the client, based on expected total cost savings to the client.
2021E 2023E~46% CAGR
$395M
$843M
BPaaS Bookings
Bookings (excl. BPaaS)
$1.4B $1.7B
BPaaS Bookings (TCV) Trajectory
30
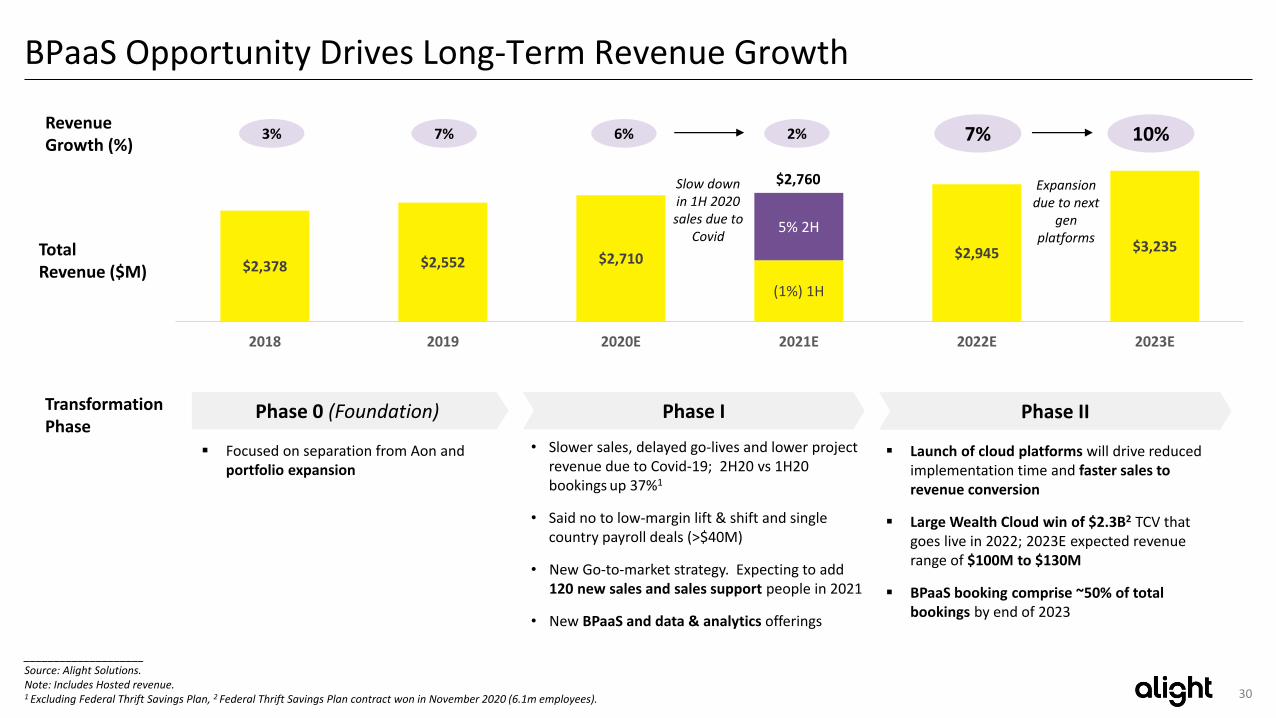
$2,378 $2,552 $2,710
(1%) 1H
$2,945 $3,2355% 2H
2018 2019 2020E 2021E 2022E 2023E
$2,760
BPaaS Opportunity Drives Long-Term Revenue Growth
TotalRevenue ($M)
Phase 0 (Foundation) Phase I Phase IITransformation Phase
Focused on separation from Aon and portfolio expansion
• Slower sales, delayed go-lives and lower project revenue due to Covid-19; 2H20 vs 1H20 bookings up 37%1
• Said no to low-margin lift & shift and single country payroll deals (>$40M)
• New Go-to-market strategy. Expecting to add 120 new sales and sales support people in 2021
• New BPaaS and data & analytics offerings
Launch of cloud platforms will drive reduced implementation time and faster sales to revenue conversion
Large Wealth Cloud win of $2.3B2 TCV that goes live in 2022; 2023E expected revenue range of $100M to $130M
BPaaS booking comprise ~50% of total bookings by end of 2023
Revenue Growth (%)
6% 2% 7% 10%3% 7%
Expansion due to next
gen platforms
Slow down in 1H 2020 sales due to
Covid
____________________Source: Alight Solutions.Note: Includes Hosted revenue.1 Excluding Federal Thrift Savings Plan, 2 Federal Thrift Savings Plan contract won in November 2020 (6.1m employees).
31
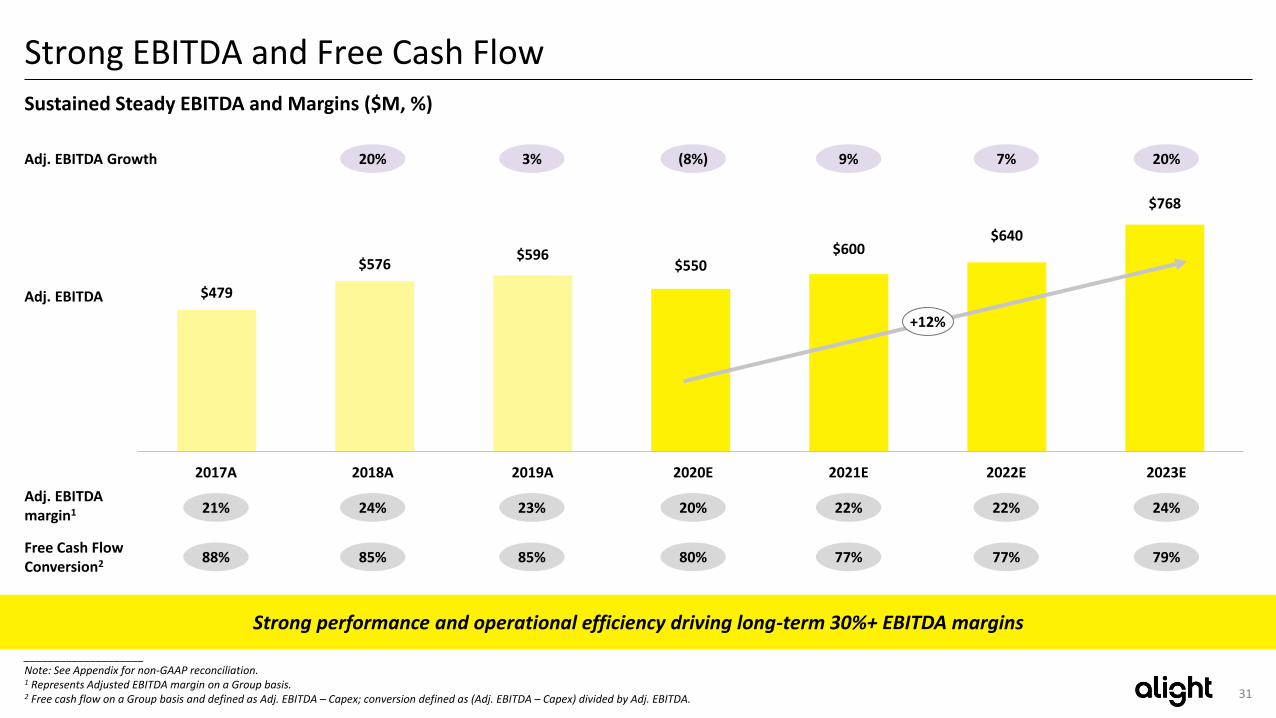
Strong EBITDA and Free Cash Flow
____________________Note: See Appendix for non-GAAP reconciliation.1 Represents Adjusted EBITDA margin on a Group basis.2 Free cash flow on a Group basis and defined as Adj. EBITDA – Capex; conversion defined as (Adj. EBITDA – Capex) divided by Adj. EBITDA.
Sustained Steady EBITDA and Margins ($M, %)
$479
$576$596
$550$600
$640
$768
2023E2017A 2018A
Adj. EBITDA
2020E 2022E2019A 2021E
+12%
Adj. EBITDA margin1 21% 20% 22% 22% 24%24% 23%
Adj. EBITDA Growth (8%) 9% 7% 20%20% 3%
Free Cash Flow Conversion2 88% 80% 77% 77% 79%85% 85%
Strong performance and operational efficiency driving long-term 30%+ EBITDA margins

32
M&A Case Study: Driving Success in Healthcare Navigation with Compass
Acquired in 2018
~$35M in revenue at acquisition, across 1,700+ clients, 2M+ members
Best-in-class healthcare navigation capabilities that deliver a unique, high-tech, and high-touch solution
Enhanced Alight’s solution set by adding capabilities to improve quality of care of consumers and reduce costs for employers
Platform for future expansion into fast-growing area of clinical care guidance
- ~$3B TAM, ~20% CAGR
Background Success in Integrating Solutions and Cross-Selling to Clients
Utilization when connected with Alight's Ben Admin
75-90%
Average standalone Compass utilization
25-35%
2-3x increase in utilization
Critical to delivering ROI savings from Alight’s Health BPaaS Bundle
Higher engagement with more touchpoints
Improved employee experience and healthcare decisions, leading to cost savings
Achieving cost savings that exceed 1.5x the price of the platform
• ~$60M in incremental cross-sell sales1 of Compass solution to 30 existing Alight clients since acquisition, including a number of large-cap telecommunication, technology and energy clients
• Cost synergies of ~20% of total cost base
____________________1 First year value of sales.

33
21.7% 28.4%
$175k
Business model alignment
HCM Solutions / Processors Brokers BPO
____________________Sources: Management estimates, company filings and FactSet as of January 15, 2021.Note: See Appendix for non-GAAP reconciliation; Brokers include AON, MMC and BPO includes ACN, G, WNS, EXLS; mean financial metrics exclude CDAY; FCF Yield defined as EBITDA – Capex / FV.
Proprietary Technology Enabled
Deep Domain Expertise
$269k $220k $44kRevenue per Employee (Last FY Mean)
6.4% 4.8% 6.6% 6.2%Free Cash Flow Yield (CY21E Mean)
Adjusted EBITDA Margin (CY21E Mean)
31.3% 21.5%
Reference Only Primary Comparables
Recurring Revenue / Transaction Based Model
34
2021E P/E Multiple 19.3x 34.5x 20.4x 26.9x
2021E P / E / G 1.5x 3.7x 2.2x 3.0x
12.2x
20.0x
14.2x 13.8x
11.4x
18.6x
13.3x 12.6x
1 2 3 4
2021E FV / Adjusted EBITDA 2022E FV / Adjusted EBITDA
Valuation Upside Relative to Peers
____________________Source: Management information, Factset as of January 15, 2021.Note: See Appendix for non-GAAP reconciliation; calendarized to a 12/31 year end; EBITDA metrics shown on a pre-SBC basis; peer multiples based on mean; Ceridian excluded from FV / EBITDA and P / E / G metrics; Broadridge excluded from P / E / G metrics; Brokers include AON, MMC and BPO includes ACN, G, WNS, EXLS.1 Alight Adjusted EPS is unburdened for tax-effected SBC and tax-effected amortization of intangibles, and burdened for tax-effected LTIP.2 Represents PF Equity Value / Adj. NI / CY19A – CY23E Adj. NI CAGR.
Reference OnlyPrimary Comparables
Brokers BPO
1
2
35
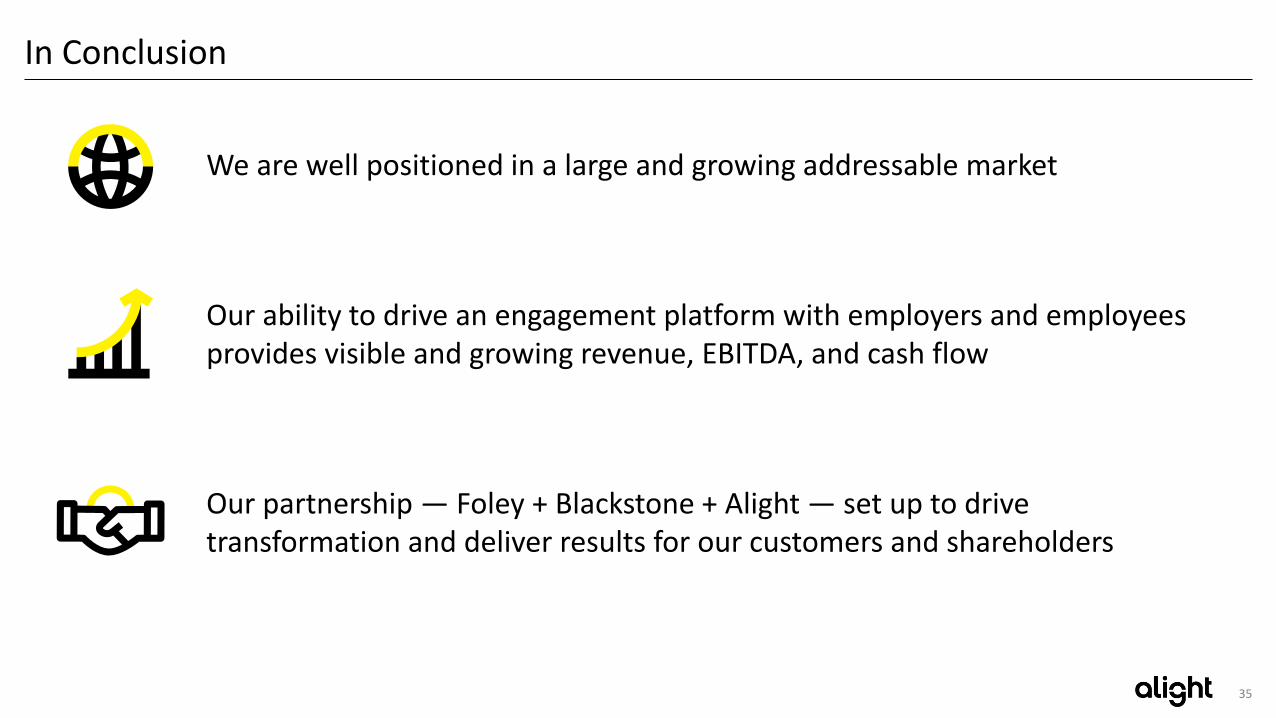
In Conclusion
We are well positioned in a large and growing addressable market
Our ability to drive an engagement platform with employers and employees provides visible and growing revenue, EBITDA, and cash flow
Our partnership — Foley + Blackstone + Alight — set up to drive transformation and deliver results for our customers and shareholders

Appendix

37
Financial Summary
Summary Revenue Build 2017-2023E ($M)
Historical Projected
$M, unless otherwise stated 2017A 2018A 2019A 2020E 2021E 2022E 2023E
Subscription 1,635 1,712 1,830 2,044 2,075 2,230 2,509
Project 302 284 271 238 245 238 240
Employer Solutions revenue 1,938 1,996 2,101 2,281 2,320 2,468 2,749
growth % 3.0% 5.3% 8.6% 1.7% 6.4% 11.4%
Subscription 23 33 55 108 138 168 199
Project 118 165 230 252 262 273 287
Professional Services 141 198 284 360 400 441 486
growth % 39.8% 43.8% 26.5% 11.2% 10.3% 10.1%
Revenue (ex-Hosted) 2,079 2,193 2,385 2,641 2,720 2,909 3,235
growth % 5.5% 8.7% 10.7% 3.0% 7.0% 11.2%
Plus: Hosted revenue 222 184 167 69 40 35 0
Total revenue 2,301 2,378 2,552 2,710 2,760 2,945 3,235
growth % 3.3% 7.3% 6.2% 1.9% 6.7% 9.9%
BPaaS revenue 58 88 158 330 363 509 743
Non-BPaaS revenue 2,243 2,290 2,394 2,380 2,397 2,436 2,492
Total revenue 2,301 2,378 2,552 2,710 2,760 2,945 3,235
growth % 3.3% 7.3% 6.2% 1.9% 6.7% 9.9%
____________________Source: Management model.
38
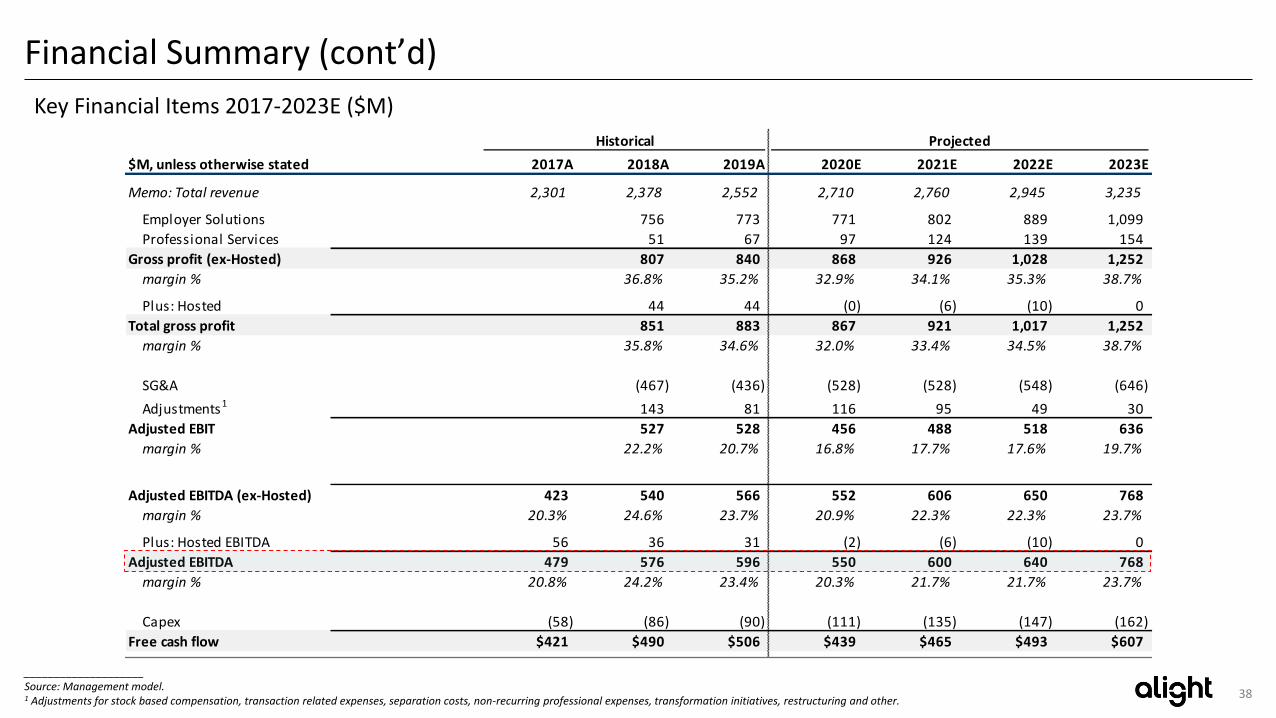
Historical Projected
$M, unless otherwise stated 2017A 2018A 2019A 2020E 2021E 2022E 2023E
Memo: Total revenue 2,301 2,378 2,552 2,710 2,760 2,945 3,235
Employer Solutions 756 773 771 802 889 1,099
Professional Services 51 67 97 124 139 154
Gross profit (ex-Hosted) 807 840 868 926 1,028 1,252
margin % 36.8% 35.2% 32.9% 34.1% 35.3% 38.7%
Plus: Hosted 44 44 (0) (6) (10) 0
Total gross profit 851 883 867 921 1,017 1,252
margin % 35.8% 34.6% 32.0% 33.4% 34.5% 38.7%
SG&A (467) (436) (528) (528) (548) (646)
Adjustments1 143 81 116 95 49 30
Adjusted EBIT 527 528 456 488 518 636
margin % 22.2% 20.7% 16.8% 17.7% 17.6% 19.7%
Adjusted EBITDA (ex-Hosted) 423 540 566 552 606 650 768
margin % 20.3% 24.6% 23.7% 20.9% 22.3% 22.3% 23.7%
Plus: Hosted EBITDA 56 36 31 (2) (6) (10) 0
Adjusted EBITDA 479 576 596 550 600 640 768
margin % 20.8% 24.2% 23.4% 20.3% 21.7% 21.7% 23.7%
Capex (58) (86) (90) (111) (135) (147) (162)
Free cash flow $421 $490 $506 $439 $465 $493 $607
Financial Summary (cont’d)
____________________Source: Management model.1 Adjustments for stock based compensation, transaction related expenses, separation costs, non-recurring professional expenses, transformation initiatives, restructuring and other.
Key Financial Items 2017-2023E ($M)

39
Historical
$M, unless otherwise stated 2017A 2018A 2019A
Net Income (Loss) $41 ($21) $22
Interest expense, net 114 208 224
Income tax expense 34 17 16
Depreciation 50 49 68
Intangible amortization 142 180 185
GAAP EBITDA $381 $433 $515
Adjustments to EBITDA
Share-based compensation 10 14 9
Adjusted EBITDA (pre-restructuring adjustments) $391 $447 $524
Adjustments to Adjusted EBITDA
Transaction-related expenses 36 1 0
Separation from Aon expenses 16 49 0
Non-recurring professional expenses 0 1 14
Transformation initiatives 28 52 37
Other 15 27 40
SEC Adjustment (7) (1) (19)
Adjusted EBITDA $479 $576 $596
Run-rate savings applied by lenders 53 30 70
Lender Adjusted EBITDA $532 $606 $666
Reconciliation of Historical Adjusted EBITDA
Key Commentary
1. Share based compensation awarded to employees
2. Includes expenses related to third-party consulting, financing costs, legal expenses and other incremental costs incurred to complete the separation
3. Expenses related to establishing Alight as a stand-alone company following the separation from Aon
4. Costs related to the postponed initial public offering
5. Severance and data center enhancement
6. Expenses related to M&A and other activities
7. SEC adjustment made to comply with PCAOB audit standards for historical periods
8. Run-rate savings include adjustments related to the New FCM Initiative, NGA and Project Optimus
1
2
3
4
5
1
2
3
4
5
6
7
6
7
____________________Source: Management model and compliance certificate.
Reconciliation of Historical Financials
8
8

40
Reconciliation of Projected Adjusted EBITDA Key Commentary
1. Projections exclude SBC; LTIP compensationprogram will continue to impact earnings per share going forward
2. Expenses related to the Optimus restructuring program, including:
• Consolidation of case management tools driving improved client engagement
• Write-downs of AI technology that is being replaced under new strategy
• Costs associated with moving to the Cloud
3. Costs related to data center enhancement
4. Severance, M&A integration and other charges related to the restructuring program that commenced in 2020
5. Expenses related to M&A and other activities
6. SEC adjustment made to comply with PCAOB audit standards for historical periods
7.
1
2
3
4
5
Projections
$M, unless otherwise stated 2020E 2021E 2022E 2023E
Net Income (Loss) pre-SBC1 ($101) $9 $121 $221
Interest expense, net2 237 112 112 111
Cost to extinguish debt3 0 76 0 0
Income tax expense 10 3 42 78
Intangible amortization 198 201 201 201
Depreciation 94 112 122 132
Unadjusted EBITDA $438 $513 $598 $743
Adjustments to EBITDA
LTIP Compensation 17 14 16 25
IT Optimus Investment 0 28 26 0
Adjusted EBITDA (pre-restructuring adjustments) $455 $555 $640 $768
Adjustments to Adjusted EBITDA
Transformation initiatives 9 0 0 0
Restructuring 76 44 0 0
Other 15 1 0 0
SEC Adjustment (5) 0 0 0
Adjusted EBITDA $550 $600 $640 $768
Run-rate savings applied by lenders 60 – – –
Lender Adjusted EBITDA4
610 – – –
Restructuring Detail
Severance 27 35 0 0
Advisor Costs 19 4 0 0
Real Estate 6 5 0 0
IBM Write-Off 7 0 0 0
M&A 16 0 0 0
12
345
4
Reconciliation of Projected Financials
____________________Note: Excludes incremental costs relating to management and administration as a publicly listed entity. 1 Net income before tax-affected SBC at tax rate of 0% in 2020E and 26% in 2021E-2023E; projected SBC has no dilutive impact on pro forma transaction; 2 Reflects estimated impact of annualized pro forma interest rates for 2021E as well as swap breakage costs arising from the transaction. A 0.125% variance in the weighted–average variable interest rates would result in a ~$3M change in income before income taxes annually. Actual interest rates may vary from those depicted; 3 Based on analysis of the treatment for the extinguishment of current TL/unsecured debt and hedges, excluding bond repurchase costs; 4 Expected lender compliance certificate.
6
6
41
____________________
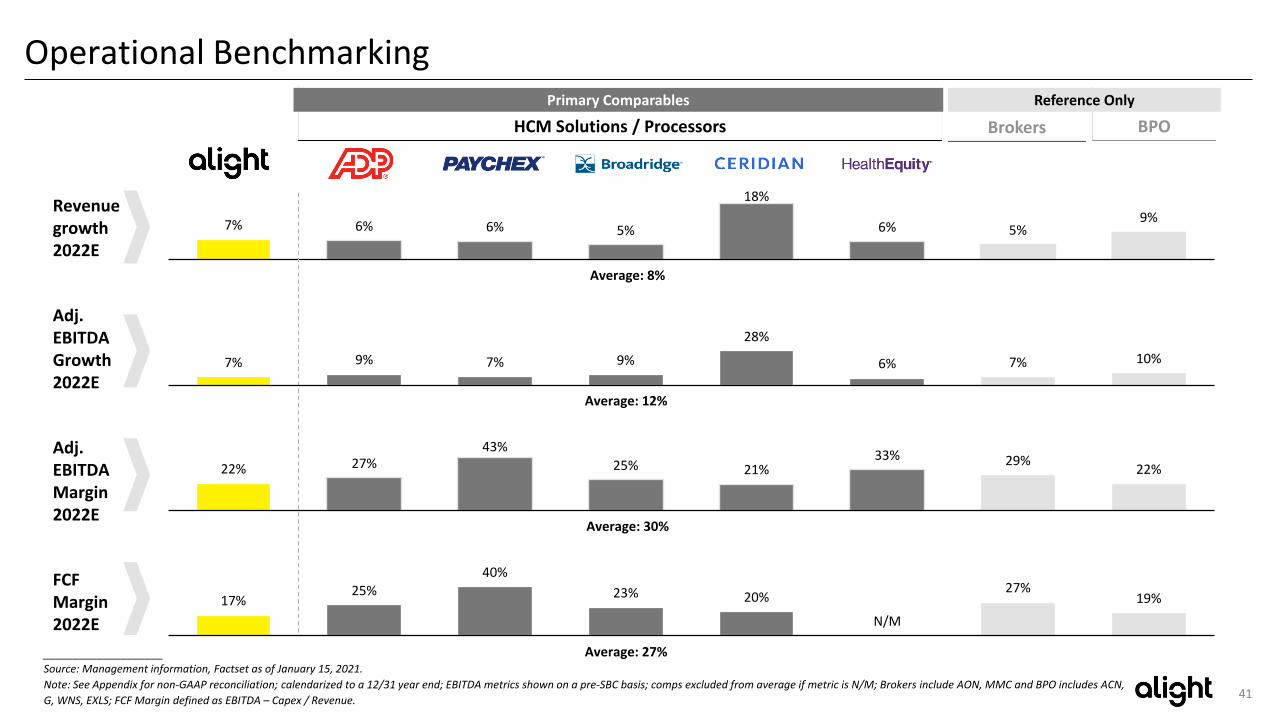
Source: Management information, Factset as of January 15, 2021.
Note: See Appendix for non-GAAP reconciliation; calendarized to a 12/31 year end; EBITDA metrics shown on a pre-SBC basis; comps excluded from average if metric is N/M; Brokers include AON, MMC and BPO includes ACN,
G, WNS, EXLS; FCF Margin defined as EBITDA – Capex / Revenue.
7% 6% 6% 5%
18%
6% 5%9%
Operational Benchmarking
Revenue growth 2022E
FCF Margin2022E
Adj.EBITDA Growth2022E
Average: 12%
Average: 27%
Average: 8%
7% 9% 7% 9%
28%
6% 7% 10%
17%25%
40%
23% 20%
N/M
27%19%
HCM Solutions / Processors Brokers BPO
Reference OnlyPrimary Comparables
Adj. EBITDA Margin2022E
Average: 30%
22% 27%43%
25% 21%33% 29%
22%

42
Valuation Benchmarking
FV/Adj. EBITDA2021E
FV/Adj. EBITDA 2022E
11.4x
16.5x 17.2x 15.2x
N/M
25.6x
13.3x 12.6x
Alight ADP Paychex Broadridge Ceridian HealthEquity IB / PS BPO
Average: 20.0x
Average: 18.6x
1
12.2x
18.0x18.5x
16.5x
N/M
27.1x
14.2x13.8x
Alight ADP Paychex Broadridge Ceridian HealthEquity IB / PS BPO
____________________
Source: Management information, Factset as of January 15, 2021.
Note: See Appendix for non-GAAP reconciliation; calendarized to 12/31; EBITDA metrics shown on a pre-SBC basis; comps excluded from average if metric is N/M; Brokers include AON, MMC and BPO includes ACN, G, WNS, EXLS.1 Alight metrics based on 2021E Adj. EBITDA of $600M and 2022E Adj. EBITDA of $640M; Assumes 518.5M fully diluted shares (which includes shares issuable upon exchange of LLC interests underlying all vested and unvested
PIUs), $2.1B net debt, $10 per share at closing.
HCM Solutions / Processors Brokers BPO
Reference OnlyPrimary Comparables

43
____________________Source: Management information.1 Point solutions defined as Alight services and technology products beyond core administration.
Integrated Solutions Across the Health Value Chain
Health Benefits Administration
Manage health benefits accurately and efficiently all year long
Healthcare Navigation Solutions
Provide comprehensive healthcare support throughout a person’s healthcare journey - online, via mobile or UPoint®, or with a personal Health Pro® consultant
Voluntary Benefits Solutions
Enable employees to shop for, enroll in, and manage their voluntary benefits
Smart-Choice Accounts
Give employees the support they need to save with health savings accounts (HSAs) and other benefit accounts
Dependent Verification Services & Compliance
Ensure employees’ dependents are eligible and correctly enrolled and support compliance with regulatory requirements
Integrated solutions that help consumers, enroll in, navigate, and pay for their healthcare benefits
700+ Health benefit administration clients
$100B+ in premiums managed annually
80%+ of health benefit administration clients also buy one or more point solutions1
2,700+ healthcare navigation clients
2M+ reimbursement accounts administered today
Health SolutionsAccess to a Significant Base of Potential Members in the Health Ecosystem
Key Health Solutions Competitors
200+ large market and 500+ mid-market Health benefit admin clients
12M+ participants on Health benefit admin platforms
120K estimated retirements / age-ins annually
Strong Position Across the Health Value Chain
44
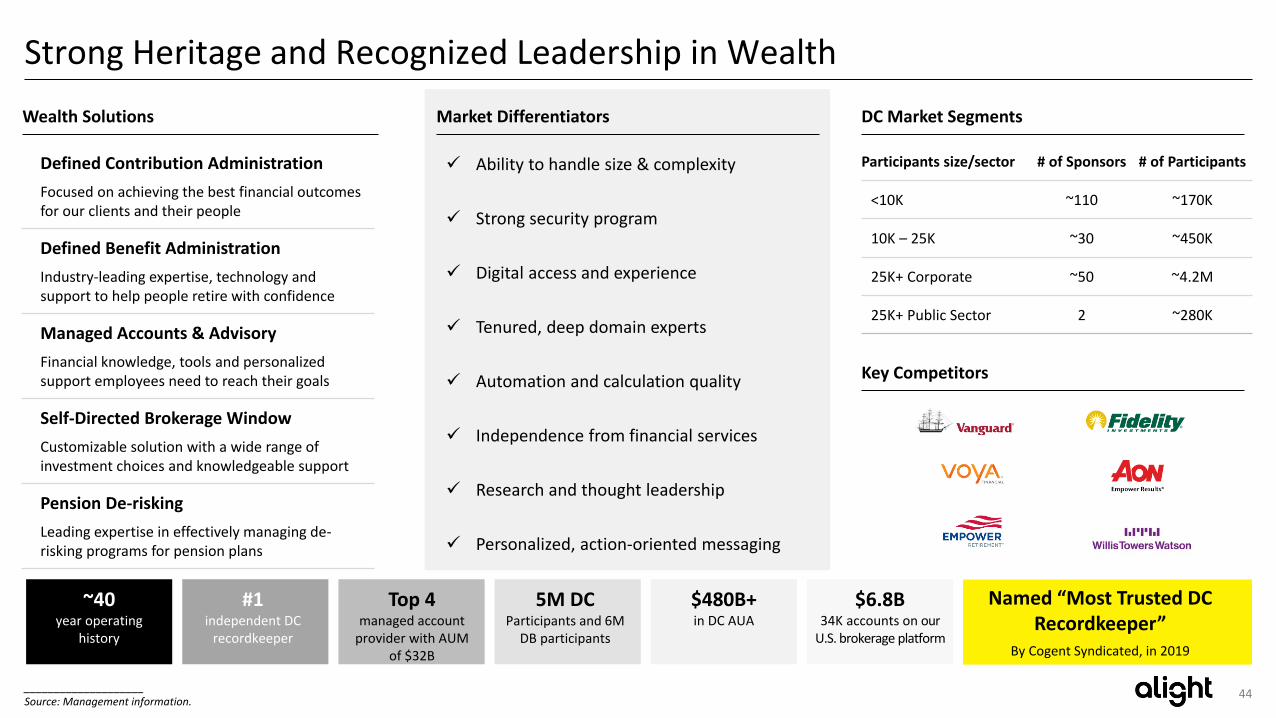
Strong Heritage and Recognized Leadership in Wealth
Defined Contribution Administration
Focused on achieving the best financial outcomes for our clients and their people
Defined Benefit Administration
Industry-leading expertise, technology and support to help people retire with confidence
Managed Accounts & Advisory
Financial knowledge, tools and personalized support employees need to reach their goals
Self-Directed Brokerage Window
Customizable solution with a wide range of investment choices and knowledgeable support
Pension De-risking
Leading expertise in effectively managing de-risking programs for pension plans
Wealth Solutions Market Differentiators DC Market Segments
Key Competitors
Ability to handle size & complexity
Strong security program
Digital access and experience
Tenured, deep domain experts
Automation and calculation quality
Independence from financial services
Research and thought leadership
Personalized, action-oriented messaging
____________________Source: Management information.
Participants size/sector # of Sponsors # of Participants
<10K ~110 ~170K
10K – 25K ~30 ~450K
25K+ Corporate ~50 ~4.2M
25K+ Public Sector 2 ~280K
#1DB recordkeeper
5M DCParticipants and 6M
DB participants
$6.8B34K accounts on our
U.S. brokerage platform
Top 4managed account
provider with AUM of $32B
$480B+in DC AUA
#1independent DC
recordkeeper
~40year operating
history
Named “Most Trusted DC Recordkeeper”
By Cogent Syndicated, in 2019

45
Leading Provider of Cloud-Based Payroll & HR Services Globally
Comprehensive Payroll
Global Payroll
HR Data Management
HR & Financial Application Management Services (AMS)
HR & Financial Cloud Services
Recognized for Our Market Leading Capabilities
Payroll & HR Solutions
Payroll & HR Competitors
Importance of Payroll
Payroll is one of the two highest expensesfor companies and is the focus of C-suite stakeholders
Payroll services drive increased online traffic and reinforce users' engagement with Alight’s products
Payroll solutions enable ownership of end-to-end HR and Benefits workflows
Strong and Unique Competitive Position
• The only truly international Payroll & HR service provider, serving 100+ countries
• 60+ million pay slips delivered per year
ADP
Capgemini
Capita
Conduent
Neeyamo
OSVRamco
SD Worx
Zalaris
Overall
Ability to meet further client requirements
Ab
ility
to
me
et
de
live
r im
me
dia
te b
en
efi
t
High Achievers
Leaders
Major Players Innovators
Cloud-Based HR Transformation (NelsonHall 2020)
____________________Source: NelsonHall.

46
Glossary
ACA – Affordable Care Act
Advisory – Personal financial advisory solution to aid in retirement
planning
CAS – Cloud Application Services: cloud-based application support
CBA – Core Benefits Administration: proprietary health administration
platform focused on the mid-market; back end for health exchange
CDS – Cloud Deployment Services: Alight’s cloud-based HR deployment
business
CE – Client Executive: relationship/account owner for largest client
relationships
Consumer Experience – Communications consulting and user experience
business
Customer Care – Call center team & capabilities
DB – Defined Benefit administration (pension)
DC – Defined Contribution administration (401(k))
HRMS – Human Resources Management Systems
HSA – Health Savings Account
LM – Large Market, generally >10,000 employees
Navigation – Solution to help consumers navigate the health care
environment
Point Solutions – Ancillary/complementary add-on solutions related to
health and retirement. Can be sold individually or as a bundle
PPPY – Per Participant, Per Year: typical pricing scheme for benefits
services
Ppt – Participant
SE – Sales Executive: quota-carrying sales colleague
SSO – Single sign-on
TBA – Total Benefit Administration: Platform used primarily for large
market benefits administration. Three-service integration.
UPoint – Consumer portal and interface to end user