algorithm foundations of data science and engineering
TRANSCRIPT

Algorithm Foundations of Data Science and EngineeringLecture 11: Sampling
MING GAO
DaSE @ ECNU(for course related communications)
Jun. 10, 2019

Outline
Motivation of Sampling
SamplingSimple Random SamplingSystematic SamplingStratified Sampling
2 / 22

Data volume in the world
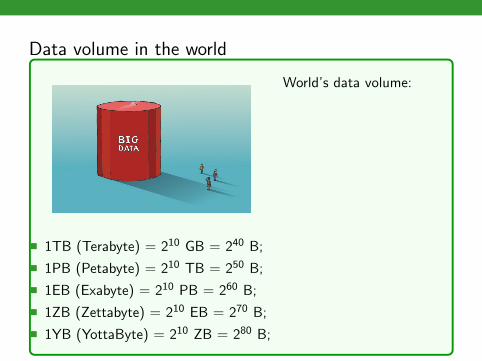
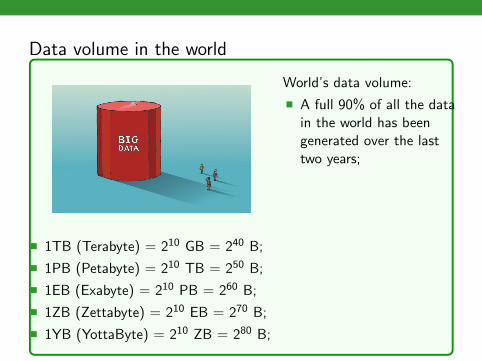
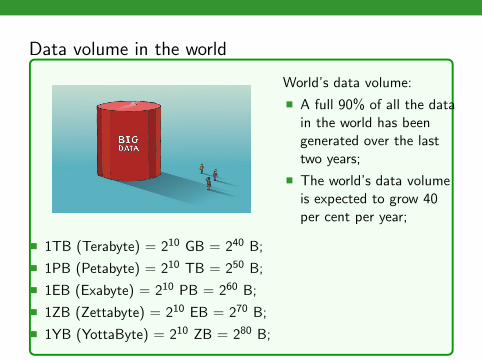
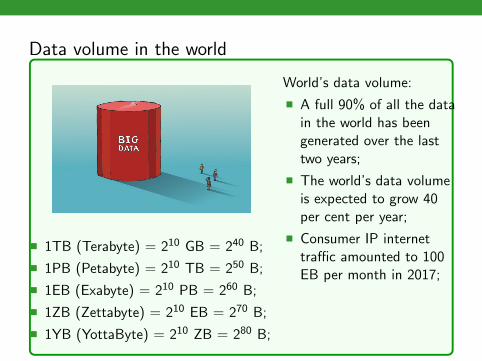
� 1TB (Terabyte) = 210 GB = 240 B;
� 1PB (Petabyte) = 210 TB = 250 B;
� 1EB (Exabyte) = 210 PB = 260 B;
� 1ZB (Zettabyte) = 210 EB = 270 B;
� 1YB (YottaByte) = 210 ZB = 280 B;
World’s data volume:
� A full 90% of all the datain the world has beengenerated over the lasttwo years;
� The world’s data volumeis expected to grow 40per cent per year;
� Consumer IP internettraffic amounted to 100EB per month in 2017;
� Data volume in the worldwill amount to 40 ZB by2020.
3 / 22

Data volume in the world
� 1TB (Terabyte) = 210 GB = 240 B;
� 1PB (Petabyte) = 210 TB = 250 B;
� 1EB (Exabyte) = 210 PB = 260 B;
� 1ZB (Zettabyte) = 210 EB = 270 B;
� 1YB (YottaByte) = 210 ZB = 280 B;
World’s data volume:
� A full 90% of all the datain the world has beengenerated over the lasttwo years;
� The world’s data volumeis expected to grow 40per cent per year;
� Consumer IP internettraffic amounted to 100EB per month in 2017;
� Data volume in the worldwill amount to 40 ZB by2020.
3 / 22

Hadoop: A brief history of big data processing
Hadoop was created byDoug Cutting, thecreator of ApacheLucene. Hadoop has itsorigins in Apache Nutch,which is a part of theLucene project.
� Nutch was started in 2002. However,they realized that it wouldn’t scale tothe billions of pages on the Web;
� Google published papers in 2003 and2004 that described GFS andMapReduce;
� In 2006, Doug Cutting joined Yahoo!,which provided a dedicated team andthe resources to turn Hadoop into asystem that ran at web scale;
� In February 2008, Yahoo! announcedthat its production search index wasbeing generated by a 10,000-coreHadoop cluster.
4 / 22

Hadoop: A brief history of big data processing
Hadoop was created byDoug Cutting, thecreator of ApacheLucene. Hadoop has itsorigins in Apache Nutch,which is a part of theLucene project.
� Nutch was started in 2002. However,they realized that it wouldn’t scale tothe billions of pages on the Web;
� Google published papers in 2003 and2004 that described GFS andMapReduce;
� In 2006, Doug Cutting joined Yahoo!,which provided a dedicated team andthe resources to turn Hadoop into asystem that ran at web scale;
� In February 2008, Yahoo! announcedthat its production search index wasbeing generated by a 10,000-coreHadoop cluster.4 / 22

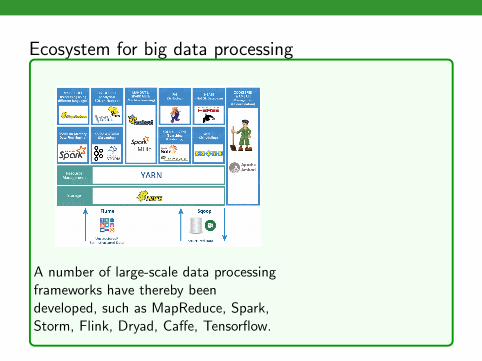
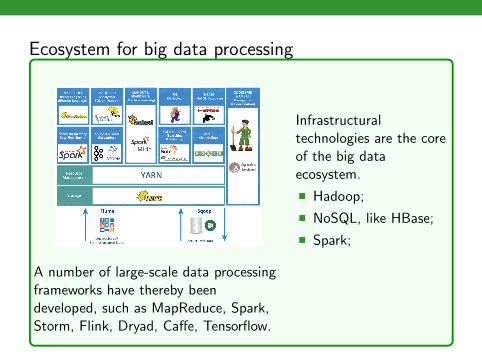
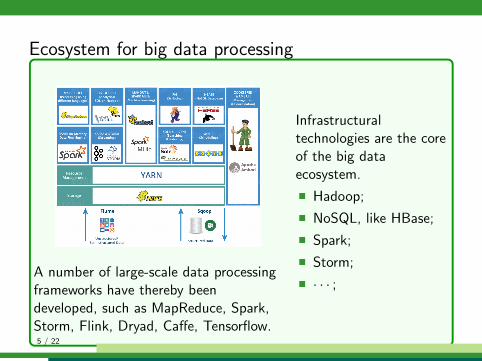
Ecosystem for big data processing
A number of large-scale data processingframeworks have thereby beendeveloped, such as MapReduce, Spark,Storm, Flink, Dryad, Caffe, Tensorflow.
Infrastructuraltechnologies are the coreof the big dataecosystem.
� Hadoop;
� NoSQL, like HBase;
� Spark;
� Storm;
� · · · ;
5 / 22
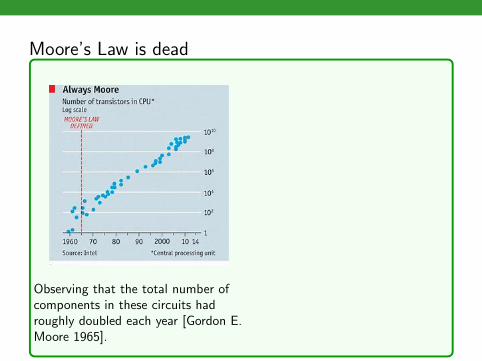
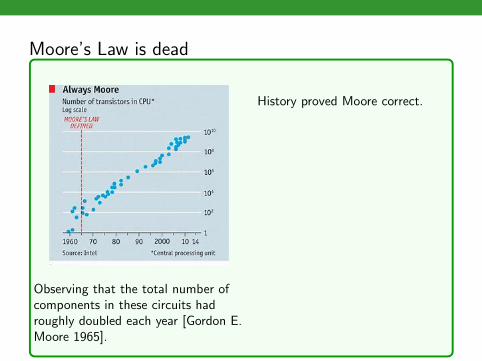
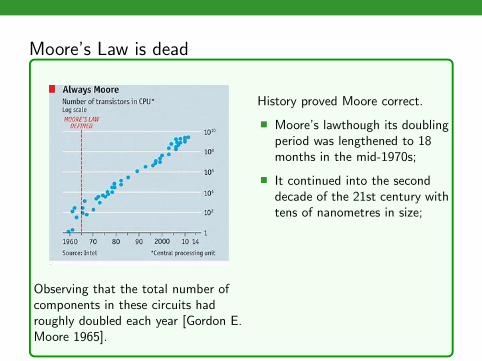
Moore’s Law is dead
Observing that the total number ofcomponents in these circuits hadroughly doubled each year [Gordon E.Moore 1965].
History proved Moore correct.
� Moore’s lawthough its doublingperiod was lengthened to 18months in the mid-1970s;
� It continued into the seconddecade of the 21st century withtens of nanometres in size;
� The processing power ofcomputers increasesexponentially every couple ofyears has hit its limit,according to Jensen Huang,CEO of Nvidia.
6 / 22

Choices of big data processing
Given the characteristics of theunprecedented amount of data,the speed of data production,and the multiple of thestructure of data, large-scaledata processing is essential toanalyzing and mining such bigdata timely. However, it is notthe only choice.
We don’t need to poll everysingle American of voting agewhenever these events occur.We may need only polling1,100 people randomlyselected. With that (relatively)small set of data, they areextrapolating how the rest ofthe public feels and is likely tovote.
7 / 22

Choices of big data processing
Given the characteristics of theunprecedented amount of data,the speed of data production,and the multiple of thestructure of data, large-scaledata processing is essential toanalyzing and mining such bigdata timely. However, it is notthe only choice.
We don’t need to poll everysingle American of voting agewhenever these events occur.We may need only polling1,100 people randomlyselected.
With that (relatively)small set of data, they areextrapolating how the rest ofthe public feels and is likely tovote.
7 / 22

Choices of big data processing
Given the characteristics of theunprecedented amount of data,the speed of data production,and the multiple of thestructure of data, large-scaledata processing is essential toanalyzing and mining such bigdata timely. However, it is notthe only choice.
We don’t need to poll everysingle American of voting agewhenever these events occur.We may need only polling1,100 people randomlyselected. With that (relatively)small set of data, they areextrapolating how the rest ofthe public feels and is likely tovote.
7 / 22

Sampling
Sample is a subset of the population on which observations aretaken for obtaining information about the population.
� Since studying a sample we wish to draw valid conclusionsabout the population, sample should desirably be“representative” of the target population;
� The most common sampling techniques used for officialsurveys are:� Simple random sampling;� Systematic sampling;� Stratified sampling;� Cluster sampling;� Multi-stage sampling;
� All are examples of probability sampling.
8 / 22

Sampling
Sample is a subset of the population on which observations aretaken for obtaining information about the population.
� Since studying a sample we wish to draw valid conclusionsabout the population, sample should desirably be“representative” of the target population;
� The most common sampling techniques used for officialsurveys are:
� Simple random sampling;� Systematic sampling;� Stratified sampling;� Cluster sampling;� Multi-stage sampling;
� All are examples of probability sampling.
8 / 22
Sampling
Sample is a subset of the population on which observations aretaken for obtaining information about the population.
� Since studying a sample we wish to draw valid conclusionsabout the population, sample should desirably be“representative” of the target population;
� The most common sampling techniques used for officialsurveys are:� Simple random sampling;
� Systematic sampling;� Stratified sampling;� Cluster sampling;� Multi-stage sampling;
� All are examples of probability sampling.
8 / 22
Sampling
Sample is a subset of the population on which observations aretaken for obtaining information about the population.
� Since studying a sample we wish to draw valid conclusionsabout the population, sample should desirably be“representative” of the target population;
� The most common sampling techniques used for officialsurveys are:� Simple random sampling;� Systematic sampling;
� Stratified sampling;� Cluster sampling;� Multi-stage sampling;
� All are examples of probability sampling.
8 / 22
Sampling
Sample is a subset of the population on which observations aretaken for obtaining information about the population.
� Since studying a sample we wish to draw valid conclusionsabout the population, sample should desirably be“representative” of the target population;
� The most common sampling techniques used for officialsurveys are:� Simple random sampling;� Systematic sampling;� Stratified sampling;
� Cluster sampling;� Multi-stage sampling;
� All are examples of probability sampling.
8 / 22

Sampling
Sample is a subset of the population on which observations aretaken for obtaining information about the population.
� Since studying a sample we wish to draw valid conclusionsabout the population, sample should desirably be“representative” of the target population;
� The most common sampling techniques used for officialsurveys are:� Simple random sampling;� Systematic sampling;� Stratified sampling;� Cluster sampling;
� Multi-stage sampling;
� All are examples of probability sampling.
8 / 22

Sampling
Sample is a subset of the population on which observations aretaken for obtaining information about the population.
� Since studying a sample we wish to draw valid conclusionsabout the population, sample should desirably be“representative” of the target population;
� The most common sampling techniques used for officialsurveys are:� Simple random sampling;� Systematic sampling;� Stratified sampling;� Cluster sampling;� Multi-stage sampling;
� All are examples of probability sampling.
8 / 22

Sampling
Sample is a subset of the population on which observations aretaken for obtaining information about the population.
� Since studying a sample we wish to draw valid conclusionsabout the population, sample should desirably be“representative” of the target population;
� The most common sampling techniques used for officialsurveys are:� Simple random sampling;� Systematic sampling;� Stratified sampling;� Cluster sampling;� Multi-stage sampling;
� All are examples of probability sampling.
8 / 22
Outline
Motivation of Sampling
SamplingSimple Random SamplingSystematic SamplingStratified Sampling
9 / 22
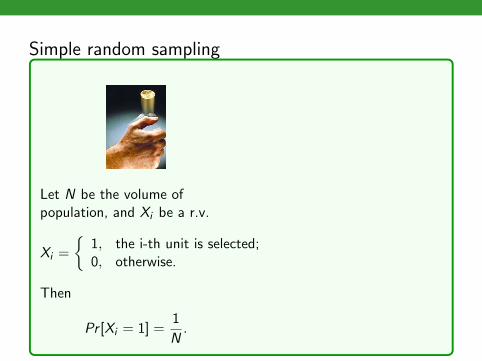
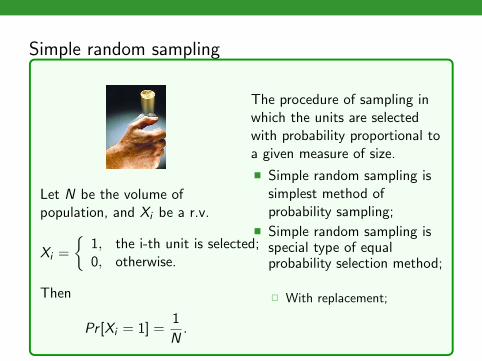
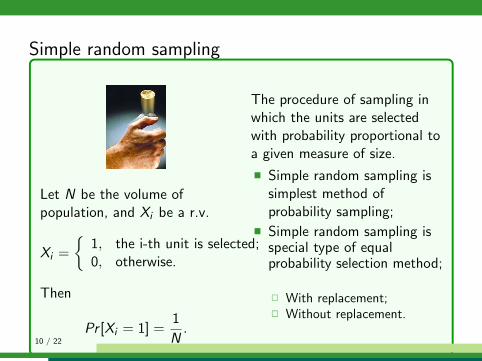
Simple random sampling
Let N be the volume ofpopulation, and Xi be a r.v.
Xi =
{1, the i-th unit is selected;0, otherwise.
Then
Pr [Xi = 1] =1
N.
The procedure of sampling inwhich the units are selectedwith probability proportional toa given measure of size.
� Simple random sampling issimplest method ofprobability sampling;
� Simple random sampling isspecial type of equalprobability selection method;
� With replacement;� Without replacement.
10 / 22
Simple random sampling
Let N be the volume ofpopulation, and Xi be a r.v.
Xi =
{1, the i-th unit is selected;0, otherwise.
Then
Pr [Xi = 1] =1
N.
The procedure of sampling inwhich the units are selectedwith probability proportional toa given measure of size.
� Simple random sampling issimplest method ofprobability sampling;
� Simple random sampling isspecial type of equalprobability selection method;
� With replacement;
� Without replacement.
10 / 22
Simple random sampling
Let N be the volume ofpopulation, and Xi be a r.v.
Xi =
{1, the i-th unit is selected;0, otherwise.
Then
Pr [Xi = 1] =1
N.
The procedure of sampling inwhich the units are selectedwith probability proportional toa given measure of size.
� Simple random sampling issimplest method ofprobability sampling;
� Simple random sampling isspecial type of equalprobability selection method;
� With replacement;� Without replacement.
10 / 22

Outline
Motivation of Sampling
SamplingSimple Random SamplingSystematic SamplingStratified Sampling
11 / 22

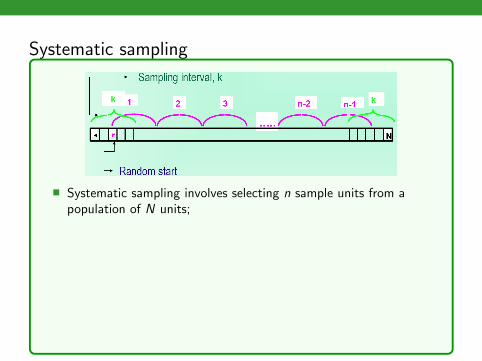
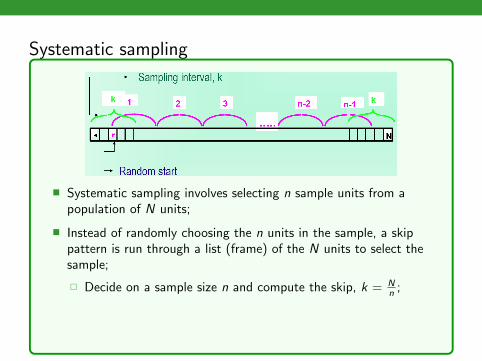
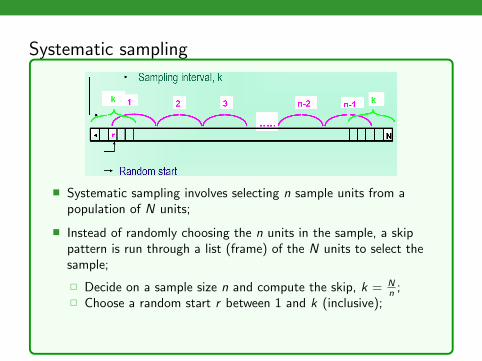
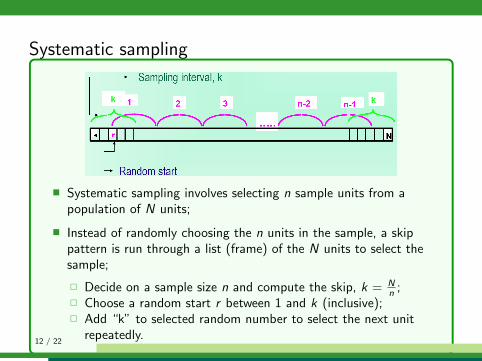
Systematic sampling
� Systematic sampling involves selecting n sample units from apopulation of N units;
� Instead of randomly choosing the n units in the sample, a skippattern is run through a list (frame) of the N units to select thesample;
� Decide on a sample size n and compute the skip, k = Nn ;
� Choose a random start r between 1 and k (inclusive);� Add “k” to selected random number to select the next unit
repeatedly.
12 / 22
Systematic sampling
� Systematic sampling involves selecting n sample units from apopulation of N units;
� Instead of randomly choosing the n units in the sample, a skippattern is run through a list (frame) of the N units to select thesample;
� Decide on a sample size n and compute the skip, k = Nn ;
� Choose a random start r between 1 and k (inclusive);
� Add “k” to selected random number to select the next unitrepeatedly.
12 / 22
Systematic sampling
� Systematic sampling involves selecting n sample units from apopulation of N units;
� Instead of randomly choosing the n units in the sample, a skippattern is run through a list (frame) of the N units to select thesample;
� Decide on a sample size n and compute the skip, k = Nn ;
� Choose a random start r between 1 and k (inclusive);� Add “k” to selected random number to select the next unit
repeatedly.12 / 22

Problem of linear systematic sampling
� If N is a multiple of n, then the number of units in each ofthe k possible systematic samples is n;
� In this case systematic sampling amounts to grouping the Nunits into k samples of exactly n units each in a systematicmanner and selecting one of them with probability 1
k� In this case, the sampling scheme is equal probability selection
method (epsem);
� But, if Nn is not an integer, then the number of units
selected systematically with the sampling interval
k ≈ nearest integer toN
n
� This problem may be overcome by adopting a device, knownas circular systematic sampling;
13 / 22

Problem of linear systematic sampling
� If N is a multiple of n, then the number of units in each ofthe k possible systematic samples is n;� In this case systematic sampling amounts to grouping the N
units into k samples of exactly n units each in a systematicmanner and selecting one of them with probability 1
k
� In this case, the sampling scheme is equal probability selectionmethod (epsem);
� But, if Nn is not an integer, then the number of units
selected systematically with the sampling interval
k ≈ nearest integer toN
n
� This problem may be overcome by adopting a device, knownas circular systematic sampling;
13 / 22

Problem of linear systematic sampling
� If N is a multiple of n, then the number of units in each ofthe k possible systematic samples is n;� In this case systematic sampling amounts to grouping the N
units into k samples of exactly n units each in a systematicmanner and selecting one of them with probability 1
k� In this case, the sampling scheme is equal probability selection
method (epsem);
� But, if Nn is not an integer, then the number of units
selected systematically with the sampling interval
k ≈ nearest integer toN
n
� This problem may be overcome by adopting a device, knownas circular systematic sampling;
13 / 22

Problem of linear systematic sampling
� If N is a multiple of n, then the number of units in each ofthe k possible systematic samples is n;� In this case systematic sampling amounts to grouping the N
units into k samples of exactly n units each in a systematicmanner and selecting one of them with probability 1
k� In this case, the sampling scheme is equal probability selection
method (epsem);
� But, if Nn is not an integer, then the number of units
selected systematically with the sampling interval
k ≈ nearest integer toN
n
� This problem may be overcome by adopting a device, knownas circular systematic sampling;
13 / 22
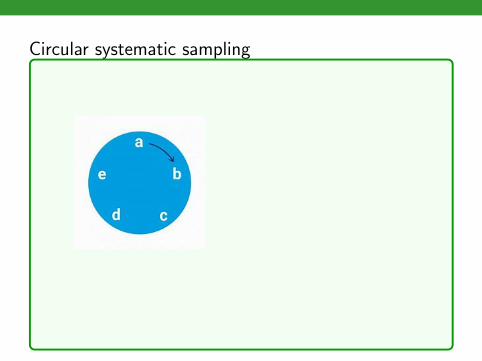
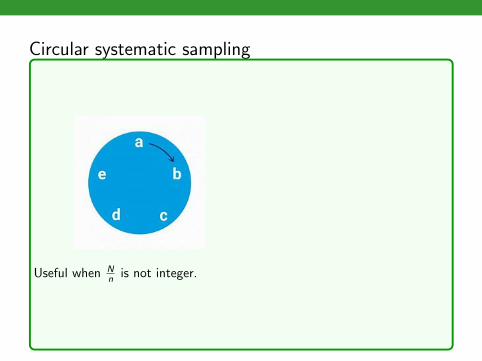
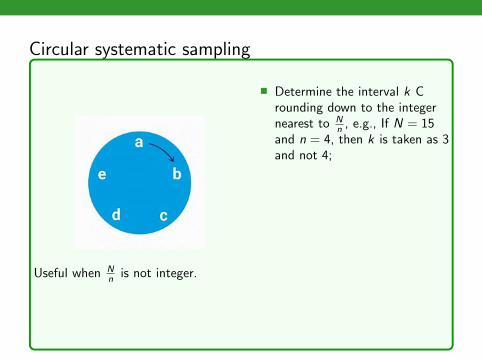
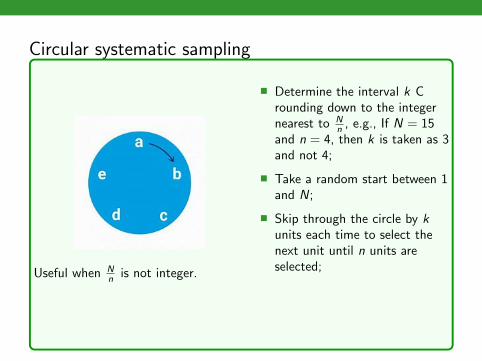
Circular systematic sampling
Useful when Nn is not integer.
� Determine the interval k Crounding down to the integernearest to N
n , e.g., If N = 15and n = 4, then k is taken as 3and not 4;
� Take a random start between 1and N;
� Skip through the circle by kunits each time to select thenext unit until n units areselected;
� Thus there could be N possibledistinct samples instead of k;
Ensures each unit equal chance of being selected into sample.
14 / 22

Circular systematic sampling
Useful when Nn is not integer.
� Determine the interval k Crounding down to the integernearest to N
n , e.g., If N = 15and n = 4, then k is taken as 3and not 4;
� Take a random start between 1and N;
� Skip through the circle by kunits each time to select thenext unit until n units areselected;
� Thus there could be N possibledistinct samples instead of k;
Ensures each unit equal chance of being selected into sample.14 / 22

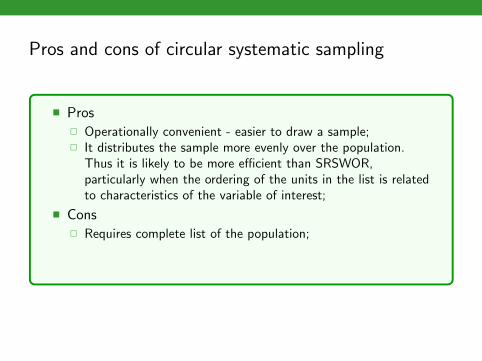
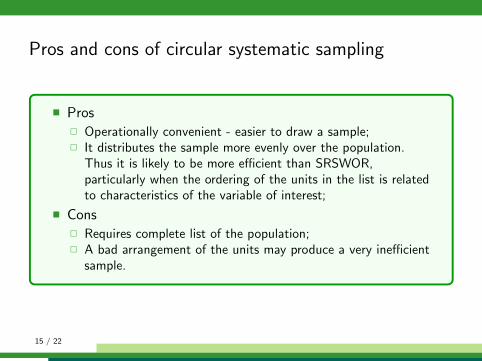
Pros and cons of circular systematic sampling
� Pros
� Operationally convenient - easier to draw a sample;� It distributes the sample more evenly over the population.
Thus it is likely to be more efficient than SRSWOR,particularly when the ordering of the units in the list is relatedto characteristics of the variable of interest;
� Cons� Requires complete list of the population;� A bad arrangement of the units may produce a very inefficient
sample.
15 / 22
Pros and cons of circular systematic sampling
� Pros� Operationally convenient - easier to draw a sample;
� It distributes the sample more evenly over the population.Thus it is likely to be more efficient than SRSWOR,particularly when the ordering of the units in the list is relatedto characteristics of the variable of interest;
� Cons� Requires complete list of the population;� A bad arrangement of the units may produce a very inefficient
sample.
15 / 22

Pros and cons of circular systematic sampling
� Pros� Operationally convenient - easier to draw a sample;� It distributes the sample more evenly over the population.
Thus it is likely to be more efficient than SRSWOR,particularly when the ordering of the units in the list is relatedto characteristics of the variable of interest;
� Cons� Requires complete list of the population;� A bad arrangement of the units may produce a very inefficient
sample.
15 / 22

Pros and cons of circular systematic sampling
� Pros� Operationally convenient - easier to draw a sample;� It distributes the sample more evenly over the population.
Thus it is likely to be more efficient than SRSWOR,particularly when the ordering of the units in the list is relatedto characteristics of the variable of interest;
� Cons
� Requires complete list of the population;� A bad arrangement of the units may produce a very inefficient
sample.
15 / 22
Pros and cons of circular systematic sampling
� Pros� Operationally convenient - easier to draw a sample;� It distributes the sample more evenly over the population.
Thus it is likely to be more efficient than SRSWOR,particularly when the ordering of the units in the list is relatedto characteristics of the variable of interest;
� Cons� Requires complete list of the population;
� A bad arrangement of the units may produce a very inefficientsample.
15 / 22
Pros and cons of circular systematic sampling
� Pros� Operationally convenient - easier to draw a sample;� It distributes the sample more evenly over the population.
Thus it is likely to be more efficient than SRSWOR,particularly when the ordering of the units in the list is relatedto characteristics of the variable of interest;
� Cons� Requires complete list of the population;� A bad arrangement of the units may produce a very inefficient
sample.
15 / 22
Outline
Motivation of Sampling
SamplingSimple Random SamplingSystematic SamplingStratified Sampling
16 / 22

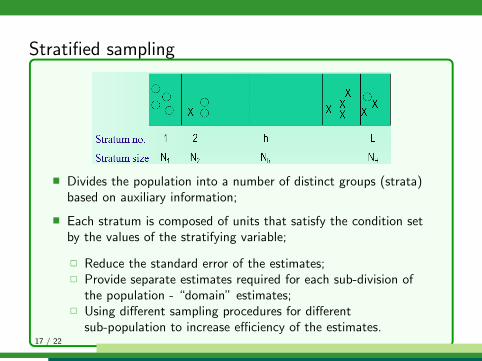
Stratified sampling
� Divides the population into a number of distinct groups (strata)based on auxiliary information;
� Each stratum is composed of units that satisfy the condition setby the values of the stratifying variable;
� Reduce the standard error of the estimates;� Provide separate estimates required for each sub-division of
the population - “domain” estimates;� Using different sampling procedures for different
sub-population to increase efficiency of the estimates.
17 / 22

Stratified sampling
� Divides the population into a number of distinct groups (strata)based on auxiliary information;
� Each stratum is composed of units that satisfy the condition setby the values of the stratifying variable;
� Reduce the standard error of the estimates;
� Provide separate estimates required for each sub-division ofthe population - “domain” estimates;
� Using different sampling procedures for differentsub-population to increase efficiency of the estimates.
17 / 22

Stratified sampling
� Divides the population into a number of distinct groups (strata)based on auxiliary information;
� Each stratum is composed of units that satisfy the condition setby the values of the stratifying variable;
� Reduce the standard error of the estimates;� Provide separate estimates required for each sub-division of
the population - “domain” estimates;
� Using different sampling procedures for differentsub-population to increase efficiency of the estimates.
17 / 22
Stratified sampling
� Divides the population into a number of distinct groups (strata)based on auxiliary information;
� Each stratum is composed of units that satisfy the condition setby the values of the stratifying variable;
� Reduce the standard error of the estimates;� Provide separate estimates required for each sub-division of
the population - “domain” estimates;� Using different sampling procedures for different
sub-population to increase efficiency of the estimates.17 / 22

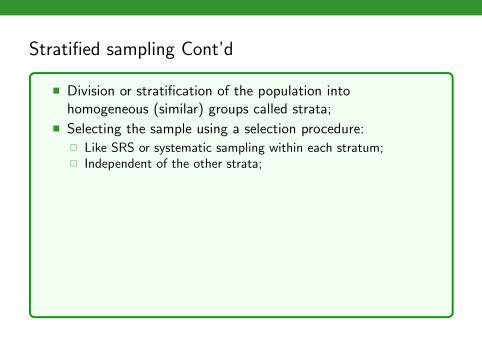
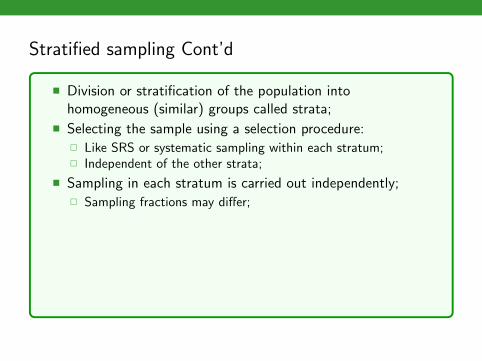
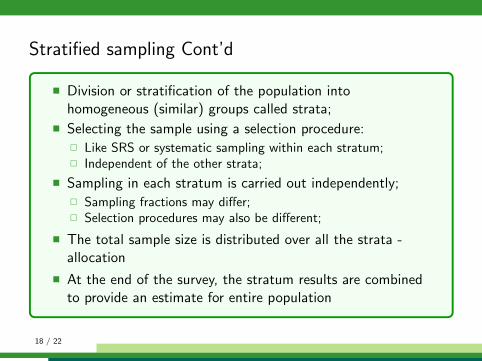
Stratified sampling Cont’d
� Division or stratification of the population intohomogeneous (similar) groups called strata;
� Selecting the sample using a selection procedure:� Like SRS or systematic sampling within each stratum;� Independent of the other strata;
� Sampling in each stratum is carried out independently;� Sampling fractions may differ;� Selection procedures may also be different;
� The total sample size is distributed over all the strata -allocation
� At the end of the survey, the stratum results are combinedto provide an estimate for entire population
18 / 22

Stratified sampling Cont’d
� Division or stratification of the population intohomogeneous (similar) groups called strata;
� Selecting the sample using a selection procedure:
� Like SRS or systematic sampling within each stratum;� Independent of the other strata;
� Sampling in each stratum is carried out independently;� Sampling fractions may differ;� Selection procedures may also be different;
� The total sample size is distributed over all the strata -allocation
� At the end of the survey, the stratum results are combinedto provide an estimate for entire population
18 / 22

Stratified sampling Cont’d
� Division or stratification of the population intohomogeneous (similar) groups called strata;
� Selecting the sample using a selection procedure:� Like SRS or systematic sampling within each stratum;
� Independent of the other strata;
� Sampling in each stratum is carried out independently;� Sampling fractions may differ;� Selection procedures may also be different;
� The total sample size is distributed over all the strata -allocation
� At the end of the survey, the stratum results are combinedto provide an estimate for entire population
18 / 22
Stratified sampling Cont’d
� Division or stratification of the population intohomogeneous (similar) groups called strata;
� Selecting the sample using a selection procedure:� Like SRS or systematic sampling within each stratum;� Independent of the other strata;
� Sampling in each stratum is carried out independently;� Sampling fractions may differ;� Selection procedures may also be different;
� The total sample size is distributed over all the strata -allocation
� At the end of the survey, the stratum results are combinedto provide an estimate for entire population
18 / 22

Stratified sampling Cont’d
� Division or stratification of the population intohomogeneous (similar) groups called strata;
� Selecting the sample using a selection procedure:� Like SRS or systematic sampling within each stratum;� Independent of the other strata;
� Sampling in each stratum is carried out independently;
� Sampling fractions may differ;� Selection procedures may also be different;
� The total sample size is distributed over all the strata -allocation
� At the end of the survey, the stratum results are combinedto provide an estimate for entire population
18 / 22
Stratified sampling Cont’d
� Division or stratification of the population intohomogeneous (similar) groups called strata;
� Selecting the sample using a selection procedure:� Like SRS or systematic sampling within each stratum;� Independent of the other strata;
� Sampling in each stratum is carried out independently;� Sampling fractions may differ;
� Selection procedures may also be different;
� The total sample size is distributed over all the strata -allocation
� At the end of the survey, the stratum results are combinedto provide an estimate for entire population
18 / 22

Stratified sampling Cont’d
� Division or stratification of the population intohomogeneous (similar) groups called strata;
� Selecting the sample using a selection procedure:� Like SRS or systematic sampling within each stratum;� Independent of the other strata;
� Sampling in each stratum is carried out independently;� Sampling fractions may differ;� Selection procedures may also be different;
� The total sample size is distributed over all the strata -allocation
� At the end of the survey, the stratum results are combinedto provide an estimate for entire population
18 / 22

Stratified sampling Cont’d
� Division or stratification of the population intohomogeneous (similar) groups called strata;
� Selecting the sample using a selection procedure:� Like SRS or systematic sampling within each stratum;� Independent of the other strata;
� Sampling in each stratum is carried out independently;� Sampling fractions may differ;� Selection procedures may also be different;
� The total sample size is distributed over all the strata -allocation
� At the end of the survey, the stratum results are combinedto provide an estimate for entire population
18 / 22

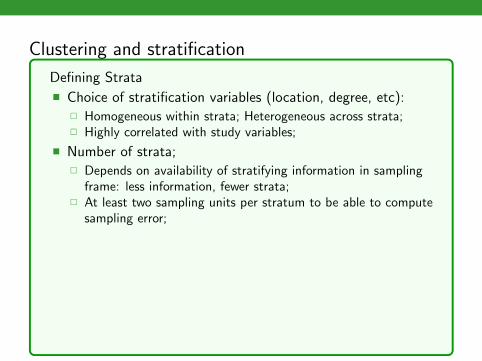
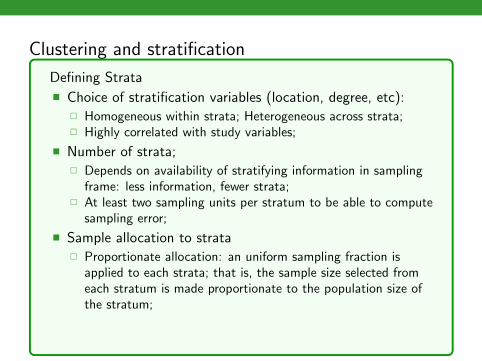
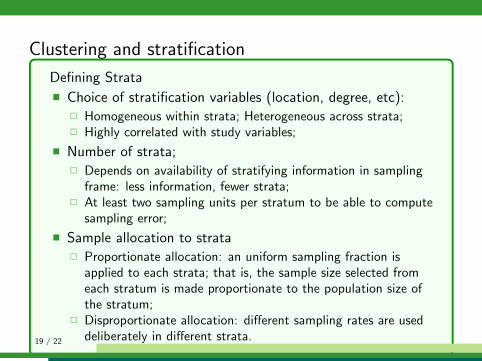
Clustering and stratification
Defining Strata
� Choice of stratification variables (location, degree, etc):� Homogeneous within strata; Heterogeneous across strata;� Highly correlated with study variables;
� Number of strata;� Depends on availability of stratifying information in sampling
frame: less information, fewer strata;� At least two sampling units per stratum to be able to compute
sampling error;
� Sample allocation to strata� Proportionate allocation: an uniform sampling fraction is
applied to each strata; that is, the sample size selected fromeach stratum is made proportionate to the population size ofthe stratum;
� Disproportionate allocation: different sampling rates are useddeliberately in different strata.
19 / 22

Clustering and stratification
Defining Strata� Choice of stratification variables (location, degree, etc):
� Homogeneous within strata; Heterogeneous across strata;� Highly correlated with study variables;
� Number of strata;� Depends on availability of stratifying information in sampling
frame: less information, fewer strata;� At least two sampling units per stratum to be able to compute
sampling error;
� Sample allocation to strata� Proportionate allocation: an uniform sampling fraction is
applied to each strata; that is, the sample size selected fromeach stratum is made proportionate to the population size ofthe stratum;
� Disproportionate allocation: different sampling rates are useddeliberately in different strata.
19 / 22

Clustering and stratification
Defining Strata� Choice of stratification variables (location, degree, etc):
� Homogeneous within strata; Heterogeneous across strata;
� Highly correlated with study variables;
� Number of strata;� Depends on availability of stratifying information in sampling
frame: less information, fewer strata;� At least two sampling units per stratum to be able to compute
sampling error;
� Sample allocation to strata� Proportionate allocation: an uniform sampling fraction is
applied to each strata; that is, the sample size selected fromeach stratum is made proportionate to the population size ofthe stratum;
� Disproportionate allocation: different sampling rates are useddeliberately in different strata.
19 / 22

Clustering and stratification
Defining Strata� Choice of stratification variables (location, degree, etc):
� Homogeneous within strata; Heterogeneous across strata;� Highly correlated with study variables;
� Number of strata;� Depends on availability of stratifying information in sampling
frame: less information, fewer strata;� At least two sampling units per stratum to be able to compute
sampling error;
� Sample allocation to strata� Proportionate allocation: an uniform sampling fraction is
applied to each strata; that is, the sample size selected fromeach stratum is made proportionate to the population size ofthe stratum;
� Disproportionate allocation: different sampling rates are useddeliberately in different strata.
19 / 22

Clustering and stratification
Defining Strata� Choice of stratification variables (location, degree, etc):
� Homogeneous within strata; Heterogeneous across strata;� Highly correlated with study variables;
� Number of strata;
� Depends on availability of stratifying information in samplingframe: less information, fewer strata;
� At least two sampling units per stratum to be able to computesampling error;
� Sample allocation to strata� Proportionate allocation: an uniform sampling fraction is
applied to each strata; that is, the sample size selected fromeach stratum is made proportionate to the population size ofthe stratum;
� Disproportionate allocation: different sampling rates are useddeliberately in different strata.
19 / 22

Clustering and stratification
Defining Strata� Choice of stratification variables (location, degree, etc):
� Homogeneous within strata; Heterogeneous across strata;� Highly correlated with study variables;
� Number of strata;� Depends on availability of stratifying information in sampling
frame: less information, fewer strata;
� At least two sampling units per stratum to be able to computesampling error;
� Sample allocation to strata� Proportionate allocation: an uniform sampling fraction is
applied to each strata; that is, the sample size selected fromeach stratum is made proportionate to the population size ofthe stratum;
� Disproportionate allocation: different sampling rates are useddeliberately in different strata.
19 / 22
Clustering and stratification
Defining Strata� Choice of stratification variables (location, degree, etc):
� Homogeneous within strata; Heterogeneous across strata;� Highly correlated with study variables;
� Number of strata;� Depends on availability of stratifying information in sampling
frame: less information, fewer strata;� At least two sampling units per stratum to be able to compute
sampling error;
� Sample allocation to strata� Proportionate allocation: an uniform sampling fraction is
applied to each strata; that is, the sample size selected fromeach stratum is made proportionate to the population size ofthe stratum;
� Disproportionate allocation: different sampling rates are useddeliberately in different strata.
19 / 22

Clustering and stratification
Defining Strata� Choice of stratification variables (location, degree, etc):
� Homogeneous within strata; Heterogeneous across strata;� Highly correlated with study variables;
� Number of strata;� Depends on availability of stratifying information in sampling
frame: less information, fewer strata;� At least two sampling units per stratum to be able to compute
sampling error;
� Sample allocation to strata
� Proportionate allocation: an uniform sampling fraction isapplied to each strata; that is, the sample size selected fromeach stratum is made proportionate to the population size ofthe stratum;
� Disproportionate allocation: different sampling rates are useddeliberately in different strata.
19 / 22
Clustering and stratification
Defining Strata� Choice of stratification variables (location, degree, etc):
� Homogeneous within strata; Heterogeneous across strata;� Highly correlated with study variables;
� Number of strata;� Depends on availability of stratifying information in sampling
frame: less information, fewer strata;� At least two sampling units per stratum to be able to compute
sampling error;
� Sample allocation to strata� Proportionate allocation: an uniform sampling fraction is
applied to each strata; that is, the sample size selected fromeach stratum is made proportionate to the population size ofthe stratum;
� Disproportionate allocation: different sampling rates are useddeliberately in different strata.
19 / 22
Clustering and stratification
Defining Strata� Choice of stratification variables (location, degree, etc):
� Homogeneous within strata; Heterogeneous across strata;� Highly correlated with study variables;
� Number of strata;� Depends on availability of stratifying information in sampling
frame: less information, fewer strata;� At least two sampling units per stratum to be able to compute
sampling error;
� Sample allocation to strata� Proportionate allocation: an uniform sampling fraction is
applied to each strata; that is, the sample size selected fromeach stratum is made proportionate to the population size ofthe stratum;
� Disproportionate allocation: different sampling rates are useddeliberately in different strata.19 / 22

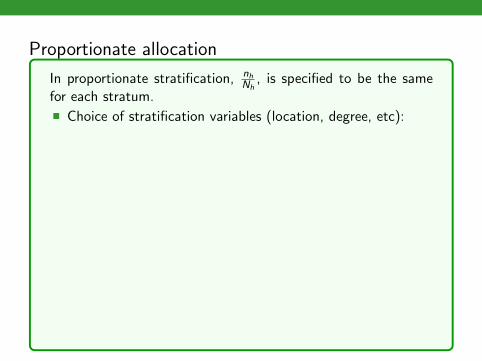
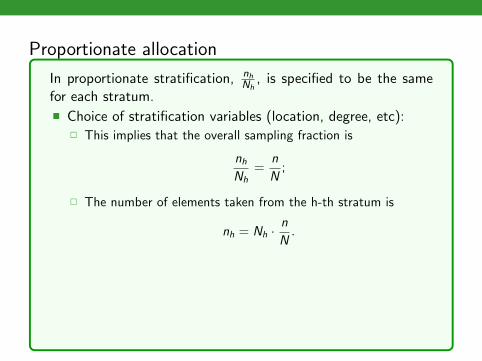
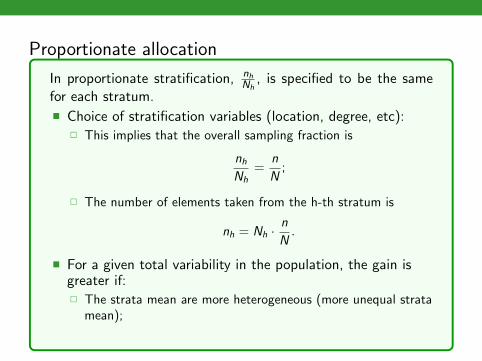
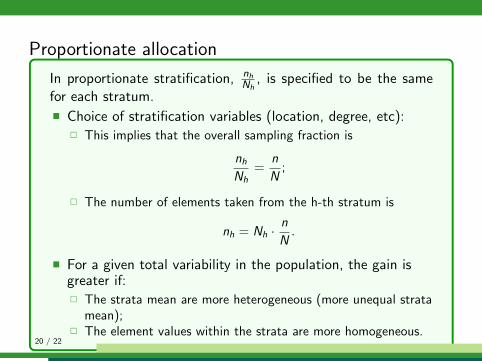
Proportionate allocation
In proportionate stratification, nhNh
, is specified to be the samefor each stratum.
� Choice of stratification variables (location, degree, etc):� This implies that the overall sampling fraction is
nhNh
=n
N;
� The number of elements taken from the h-th stratum is
nh = Nh ·n
N.
� For a given total variability in the population, the gain isgreater if:� The strata mean are more heterogeneous (more unequal strata
mean);� The element values within the strata are more homogeneous.
20 / 22
Proportionate allocation
In proportionate stratification, nhNh
, is specified to be the samefor each stratum.� Choice of stratification variables (location, degree, etc):
� This implies that the overall sampling fraction is
nhNh
=n
N;
� The number of elements taken from the h-th stratum is
nh = Nh ·n
N.
� For a given total variability in the population, the gain isgreater if:� The strata mean are more heterogeneous (more unequal strata
mean);� The element values within the strata are more homogeneous.
20 / 22

Proportionate allocation
In proportionate stratification, nhNh
, is specified to be the samefor each stratum.� Choice of stratification variables (location, degree, etc):
� This implies that the overall sampling fraction is
nhNh
=n
N;
� The number of elements taken from the h-th stratum is
nh = Nh ·n
N.
� For a given total variability in the population, the gain isgreater if:
� The strata mean are more heterogeneous (more unequal stratamean);
� The element values within the strata are more homogeneous.
20 / 22
Proportionate allocation
In proportionate stratification, nhNh
, is specified to be the samefor each stratum.� Choice of stratification variables (location, degree, etc):
� This implies that the overall sampling fraction is
nhNh
=n
N;
� The number of elements taken from the h-th stratum is
nh = Nh ·n
N.
� For a given total variability in the population, the gain isgreater if:� The strata mean are more heterogeneous (more unequal strata
mean);
� The element values within the strata are more homogeneous.
20 / 22
Proportionate allocation
In proportionate stratification, nhNh
, is specified to be the samefor each stratum.� Choice of stratification variables (location, degree, etc):
� This implies that the overall sampling fraction is
nhNh
=n
N;
� The number of elements taken from the h-th stratum is
nh = Nh ·n
N.
� For a given total variability in the population, the gain isgreater if:� The strata mean are more heterogeneous (more unequal strata
mean);� The element values within the strata are more homogeneous.
20 / 22
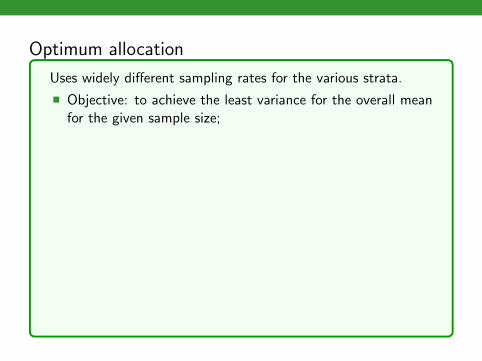
Optimum allocation
Uses widely different sampling rates for the various strata.
� Objective: to achieve the least variance for the overall meanfor the given sample size;
� Without cost consideration, the allocation is
nh = n · Nhσh∑Nhσh
.
� This gives better efficiency as compared to proportionateallocation:
VSRS ≥ Vprop ≥ Vopt .
� In practice, σh is unknown.
� This refers to a systematic sampling with the units arrangedin a certain order
21 / 22

Take-home messages
� Motivation of sampling� Sampling
� Simple Random Sampling� Systematic Sampling� Stratified Sampling
22 / 22