algebraic functions of views for 3d object …heraldo/eel891_selecao_atributos_george...sequential...
TRANSCRIPT

Feature SelectionJain, A.K.; Duin, P.W.; Jianchang Mao, “Statistical pattern
recognition: a review”, IEEE Transactions on Pattern Analysis and Machine Intelligence, vol. 22, no. 1, pp. 4-37, Jan. 2000.
Section 4.2
Genetic AlgorithmsChapter 7 (Duda et al.) – Section 7.5
CS479/679 Pattern RecognitionDr. George Bebis

Feature Selection
• Given a set of n features, the goal of feature selection is to select a subset of d features (d < n) in order to minimize the classification error.
• Fundamentally different from dimensionality reduction (e.g., PCA or LDA) based on feature combinations (i.e., feature extraction).
dimensionality reduction

Feature Selection vsDimensionality Reduction
• Dimensionality Reduction– When classifying novel patterns, all features need to be computed.
– The measurement units (length, weight, etc.) of the features are lost.
• Feature Selection– When classifying novel patterns, only a small number of features
need to be computed (i.e., faster classification).
– The measurement units (length, weight, etc.) of the features are preserved.

Feature Selection Steps
• Feature selection is an optimization problem.
– Step 1: Search the space of possible feature subsets.
– Step 2: Pick the subset that is optimal or near-optimal with respect to some objective function.

Feature Selection Steps (cont’d)
Search strategies
– Optimum
– Heuristic
– Randomized
Evaluation strategies
- Filter methods
- Wrapper methods

Search Strategies
• Assuming n features, an exhaustive search would
require:
– Examining all possible subsets of size d.
– Selecting the subset that performs the best according to the
criterion function.
• The number of subsets grows combinatorially, making
exhaustive search impractical.
• In practice, heuristics are used to speed-up search but
they cannot guarantee optimality.
6
n
d

Evaluation Strategies
• Filter Methods
– Evaluation is independent of
the classification algorithm.
– The objective function
evaluates feature subsets by
their information content,
typically interclass distance,
statistical dependence or
information-theoretic
measures.

Evaluation Strategies
• Wrapper Methods
– Evaluation uses criteria
related to the
classification algorithm.
– The objective function is a
pattern classifier, which
evaluates feature subsets
by their predictive
accuracy (recognition rate
on test data) by statistical
resampling or cross-
validation.

Filter vs Wrapper Approaches

Filter vs Wrapper Approaches (cont’d)

Naïve Search
• Sort the given n features in order of their probability of
correct recognition.
• Select the top d features from this sorted list.
• Disadvantage
– Correlation among features is not considered.
– The best pair of features may not even contain the best
individual feature.

Sequential forward selection (SFS)(heuristic search)
• First, the best single feature is selected (i.e.,
using some criterion function).
• Then, pairs of features are formed using one of
the remaining features and this best feature, and
the best pair is selected.
• Next, triplets of features are formed using one
of the remaining features and these two best
features, and the best triplet is selected.
• This procedure continues until a predefined
number of features are selected.
12
SFS performsbest when the optimal subset issmall.

Example
13
Results of sequential forward feature selection for classification of a satellite image using 28 features. x-axis shows the classification accuracy (%) and y-axis shows the features added at each iteration (the first iteration is at the bottom). The highest accuracy value is shown with a star.
features added at each iteration

Sequential backward selection (SBS)(heuristic search)
• First, the criterion function is computed for all n
features.
• Then, each feature is deleted one at a time, the
criterion function is computed for all subsets with
n-1 features, and the worst feature is discarded.
• Next, each feature among the remaining n-1 is
deleted one at a time, and the worst feature is
discarded to form a subset with n-2 features.
• This procedure continues until a predefined
number of features are left.
14
SBS performsbest when the optimal subset islarge.

Example
15
Results of sequential backward feature selection for classification of a satellite image using 28 features. x-axis shows the classification accuracy (%) and y-axis shows the features removed at each iteration (the first iteration is at the top). The highest accuracy value is shown with a star.
features removed at each iteration

Bidirectional Search (BDS)
• BDS applies SFS and SBS simultaneously:
– SFS is performed from the empty set.
– SBS is performed from the full set.
• To guarantee that SFS and SBS converge to the same solution:
– Features already selected by SFS are not removed by SBS.
– Features already removed by SBS are not added by SFS.

Limitations of SFS and SBS
• The main limitation of SFS is that it is unable to remove features that become non useful after the addition of other features.
• The main limitation of SBS is its inability to reevaluate the usefulness of a feature after it has been discarded.
• We will examine some generalizations of SFS and SBS:
– Plus-L, minus-R” selection (LRS)
– Sequential floating forward/backward selection (SFFS and SFBS)

“Plus-L, minus-R” selection (LRS)
• A generalization of SFS and SBS
– If L>R, LRS starts from the empty set and:• Repeatedly add L features
• Repeatedly remove R features
– If L<R, LRS starts from the full set and:• Repeatedly removes R features
• Repeatedly add L features
Its main limitation is the lack of a theory to help choose the optimal values of L and R.

Sequential floating forward/backward selection (SFFS and SFBS)
• An extension to LRS:
– Rather than fixing the values of L and R, floating methods determine these values from the data.
– The dimensionality of the subset during the search can be thought to be “floating” up and down
• Two floating methods:
– Sequential floating forward selection (SFFS)
– Sequential floating backward selection (SFBS)
P. Pudil, J. Novovicova, J. Kittler, Floating search methods in feature
selection, Pattern Recognition Lett. 15 (1994) 1119–1125.
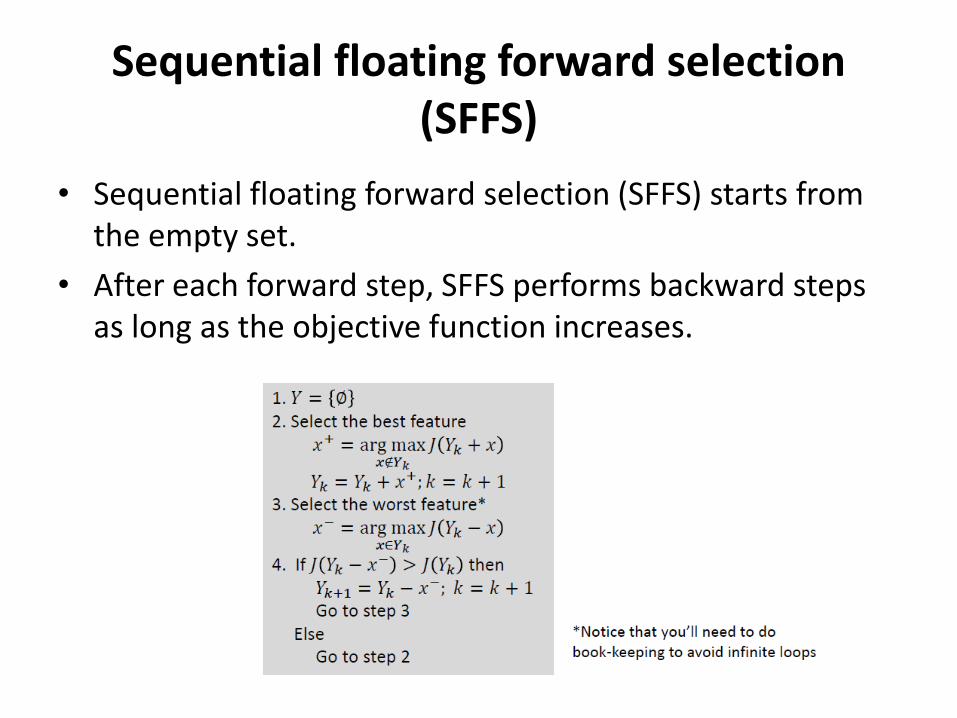
Sequential floating forward selection (SFFS)
• Sequential floating forward selection (SFFS) starts from the empty set.
• After each forward step, SFFS performs backward steps as long as the objective function increases.

Sequential floating backward selection (SFBS)
• Sequential floating backward selection (SFBS) starts from the full set.
• After each backward step, SFBS performs forward steps as long as the objective function increases.

Genetic Algorithms (GAs)(randomized search)
• What are GAs?– A global optimization technique for searching
very large spaces.– Inspired by the biological mechanisms of
natural selection and reproduction.
• Main characteristics of GAs– Searches probabilistically using a population
of possible solutions.– Each solution is properly encoded as a string
of symbols.– Uses an objective (or fitness) function to
evaluate the “goodness” of each solution.– Does not require using derivatives.
10010110…01100011…
01100011…10100100…
Population of encoded solutions

• Each solution in the search space is represented as a finite length string (chromosome) over some finite set of symbols.
Encoding
(11,6,9) (1011_ 0110 _1001) (101101101001)→ →
e.g., using binary encoding

• A fitness function is used to evaluate the goodness of each solution.
• The fitness function is “problem specific”.
Fitness Evaluation
( ( ))Fitness f decode chromosome=

Searching
10010110… 10010110…
01100010… 01100010…
10100100... 10100100…
10010010… 01111001…
01111101… 10011101…
Selection Crossover Mutation
Current Generation Next Generation
GA operators:
Population of encoded solutions
Population of encoded solutions

Selection
• Probabilistically filters out solutions that perform poorly, choosing high performance solutions to exploit.
0.1
0.9
0.01
0.01
1001 1001
1101 1101
1000 1101
0001 1101
→
fitness

• Crossover: information exchange between strings.
– Generate new chromosomes that, hopefully, will retain good features from the previous generation.
– It is applied to randomly selected pairs of chromosomes with a probability equal to a given crossover rate.
Crossover
10011110 10010010
10110010 10111110
→
Explore new solutions:

• Mutation: restore lost genetic material.
– It protects GAs against irrecoverable loss of good solution features.
– It changes a character of some chromosome with a probability equal to a very low given mutation rate.
Mutation
10011110 10011010
→
mutated bit
Explore new solutions:

Steps

Feature Selection using GAs(randomized search)
ClassifierFeature
Subset
Pre-
ProcessingFeature
Extraction
Feature
Selection
(GA)
Feature
Subset
• GAs provide a simple, general, and powerful framework
for feature selection.
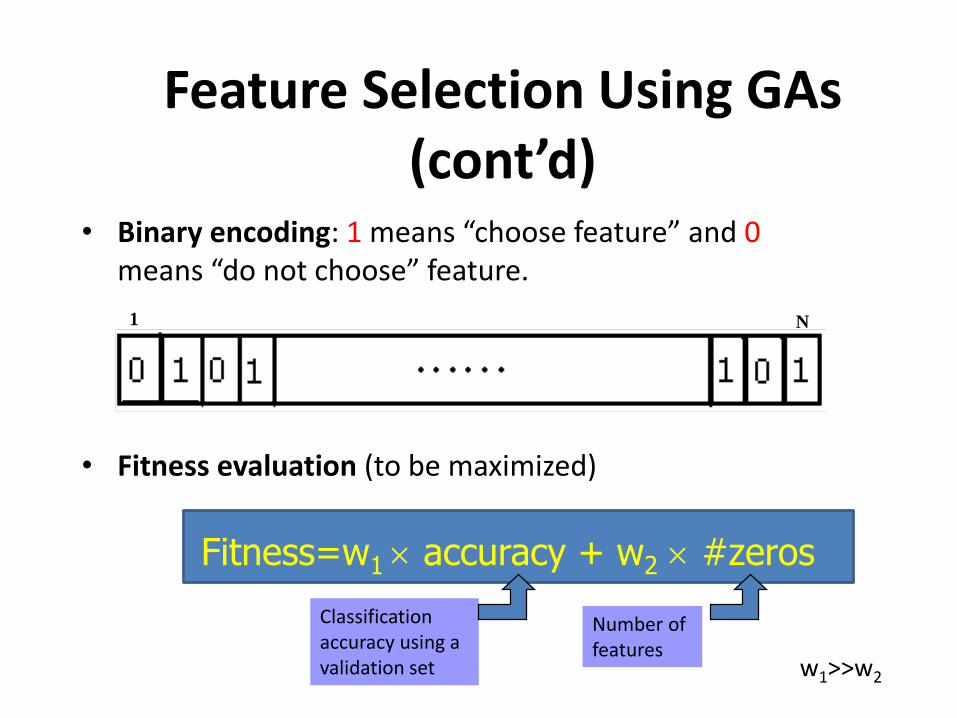
Feature Selection Using GAs (cont’d)
• Binary encoding: 1 means “choose feature” and 0means “do not choose” feature.
• Fitness evaluation (to be maximized)
1 N
Fitness=w1 accuracy + w2 #zeros
Classification accuracy using a validation set
Number offeatures
w1>>w2

Case Study 1: Gender Classification
• Determine the gender of a subject from facial images.
– Challenges: race, age, facial expression, hair style, etc.
Z. Sun, G. Bebis, X. Yuan, and S. Louis, "Genetic Feature Subset Selection for Gender Classification: A Comparison Study", IEEE Workshop on Applications of Computer Vision, pp. 165-170, Orlando, December 2002.

Feature Extraction Using PCA
• Use PCA to represent faces in terms of the “best” eigenvectors:

Which eigenvectors encode mostly gender information?
EV#1 EV#2 EV#3 EV#4 EV#5 EV#6
EV#8 EV#10 EV#12 EV#14 EV#19 EV#20
IDEA: Use GAs to search the space of eigenvectors!

Dataset
• 400 frontal images from 400 different people – 200 male, 200 female
– Different races, lighting conditions, and facial expressions
• Images were registered and normalized– No hair information
– Normalized to account for different lighting conditions

Experiments• Tested different classifiers:
– LDA
– Bayes classifier
– Neural Networks (NNs)
– Support Vector Machines (SVMs)
• Used three-fold cross validation– Training set: 75% of the data
– Validation set: 12.5% of the data
– Test set: 12.5% of the data
• Compared GAs with SFBS

Error Rates
ERM: error rate using top eigenvectors
ERG: error rate using GA selected eigenvectors
0
0.05
0.1
0.15
0.2
0.25
NN Bayes LDA SVMs SBFS+SVM
ERM
ERG17.7%
11.3%
22.4%
13.3%14.2%
9% 8.9%
4.7%6.7%

Ratio of Features - Information Kept
RN: percentage of eigenvectors selected.
RI: percentage of information contained in the eigenvector subset selected.
0
0.1
0.2
0.3
0.4
0.5
0.6
0.7
NN+GA B+GA LDA+GA SVM+GA SBFS+SVM
RN
RI
17.6%
38%
13.3%
31%36.4%
61.2%
8.4%
32.4%
42.8%
69.0%

Histograms of Selected Eigenvectors
(a) LDA (b) Bayes
(d) SVMs(c) NN
0
1
2
3
4
5
6
7
10 30 50 70 90 110 130 150 170 190 210 230 250
# EV

Reconstructed Images
Reconstructed faces using GA-selected EVs do not contain information
about identity but disclose strong gender information!
Original images
Using top 30 EVs
Using EVs selected
by SVM+GA
Using EVs selected
by NN+GA

Comparison with SFBS
Original images
Top 30 EVs
EVs selected
by SVM+GA
EVs selected
by SVM+SFBS

Case Study 2: Vehicle Detection
low light camera
rear views
Non-vehicles class muchlarger than vehicle class.
Z. Sun, G. Bebis, and R. Miller, "Object Detection Using Feature Subset Selection", Pattern Recognition, vol. 37, pp. 2165-2176, 2004.
Ford Motor Company

Which eigenvectors encode themost important vehicle features?

Experiments
• Training data set (collected in Fall 2001)
➢ 2102 images (1051 vehicles and 1051 non-vehicles)
• Test data sets (collected in Summer 2001)
➢ 231 images (vehicles and non-vehicles)
• SVM for classification
• Three-fold cross-validation
• Comparison with SFBS

Error Rate
6.49%
Using “top” eigenvectors

Histograms of Selected Eigenvectors
SFBS-SVM GA-SVM
Number of eigenvectors selected by SBFS: 87(43.5% information)
Number of eigenvectors selected by GA: 46(23% information)

Vehicle Detection
Original
Top 50 EVs
EVs selectedby SFBS
EVs selectedby GAs
Reconstructed images using the selected feature subsets. - Lighting differences have been disregarded by the GA approach.

Case Study 3:Fusion of Visible-Thermal IR Imagery
for Face Recognition
• Improve face recognition performance by integrating information both from the visible and infraredspectrum.
G. Bebis, A. Gyaourova, S. Singh, and I. Pavlidis, "Face Recognition by Fusing Thermal Infrared and Visible Imagery", Image and Vision Computing, vol. 24, no. 7, pp. 727-742, 2006.

Visible vs Thermal IR
• Visible spectrum– High resolution, sensitive to changes in illumination and
facial expression.
– Less sensitive to the presence of eyeglasses.
• Thermal IR spectrum– Robust to illumination changes and facial expressions.
– Low resolution, face heat patterns, aging, and the presence of eyeglasses.
glass is
opaque to
thermal IR
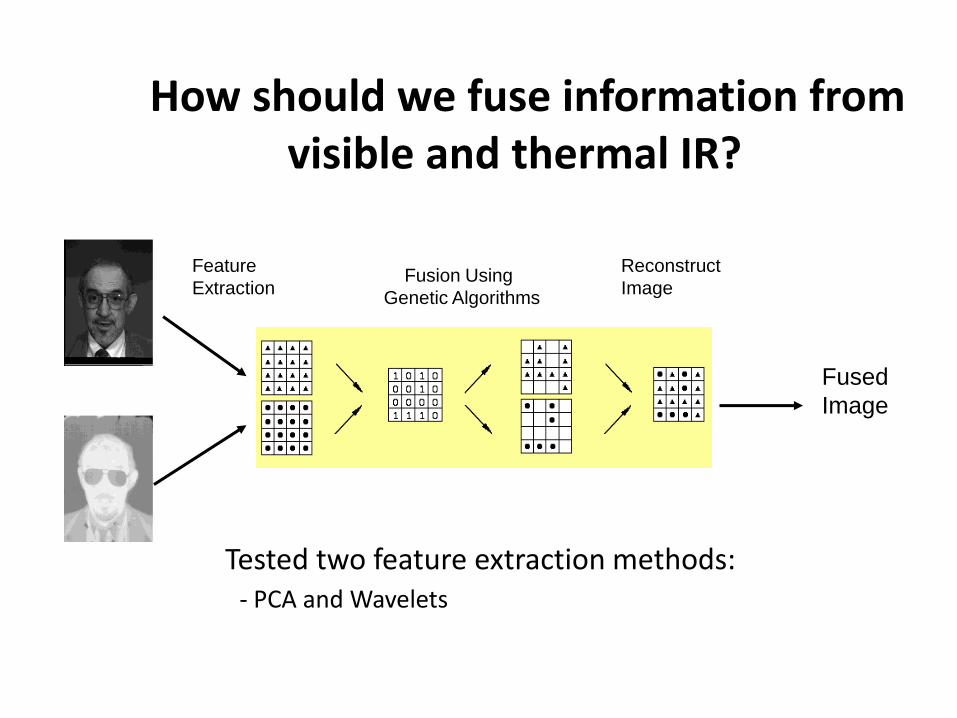
How should we fuse information from visible and thermal IR?
Feature
ExtractionFusion Using
Genetic Algorithms
Reconstruct
Image
Fused
Image
Tested two feature extraction methods:- PCA and Wavelets

Dataset
Co-registered thermal infrared and visible images.
Variations among images:
- Illumination (front, left, right)
- Facial expression (smile, frown, surprise and vowels)
- Eyeglasses
Equinox database

Test 1: Eyeglasses/Illumination
ELGELnG
EFnG EFG
Frontal Illumination
GlassesNo Glasses
EnG EG
Lateral illumination
DATA

Experiments
EG ELG EFG EnG ELnG EFnG
EG
ELG
EFG
EnG
ELnG
EFnG
no glassesglasses
glasses
no glasses
training
test
Eyeglasses Tests
Eyeglasses & Illumination Tests

Results
0
10
20
30
40
50
60
70
80
90
100
ELG
-ELnG
EFG
-EFnG
ELnG
-ELG
EFnG
-EFG
ELG
-EFG
EFG
-ELG
ELnG
-EFnG
EFnG
-ELnG
ELG
-EFnG
EFG
-ELnG
ELnG
-EFG
EFnG
-ELG
EG
-EnG
EnG
-EG
ELnG
-EG
EFnG
-EG
EG
-ELnG
EG
-EFnG
ELG
-EnG
EFG
-EnG
EnG
-ELG
EnG
-EFG
Presence ofeyeglasses
Illumination direction Eyeglasses andillumination direction
Eyeglasses and mixed illumnation
infrared
visible
fused

Test 2: Facial Expression
EA
Smile, Frown
& Surprise
Frontal Illumination
Lateral illumination
EF
EL
VA
Speaking
Vowels
Frontal Illumination
VF
VL
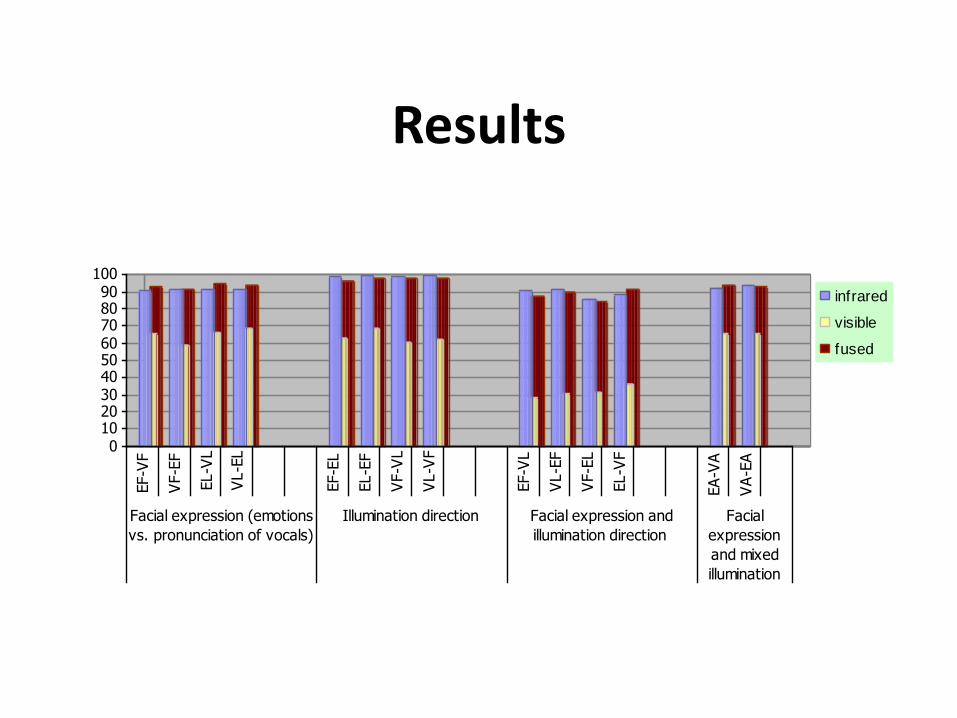
Results
0102030405060708090
100
EF-V
F
VF-E
F
EL-V
L
VL-E
L
EF-E
L
EL-E
F
VF-V
L
VL-V
F
EF-V
L
VL-E
F
VF-E
L
EL-V
F
EA
-VA
VA
-EA
Facial expression (emotions
vs. pronunciation of vocals)
Illumination direction Facial expression and
illumination direction
Facial
expression
and mixed
illumination
infrared
visible
fused

Overall Accuracy - Eyeglasses

Overall Accuracy – Facial Expressions