algal succession and nutrient dynamics in elephant butte reservoir
TRANSCRIPT

ALGAL SUSCESSION AND NUTRIENT DYNAMICS IN
ELEPHANT BUTTE RESERVOIR
by
Eric J. Nielsen
A thesis submitted to the faculty of
Brigham Young University
in partial fulfillment of the requirements for the degree of
Master of Science
Department of Civil and Environmental Engineering
Brigham Young University
April 2005


Copyright © 2005 Eric J. Nielsen
All Rights Reserved


BRIGHAM YOUNG UNIVERSITY
GRADUATE COMMITTEE APPROVAL
of a thesis submitted by
Eric J. Nielsen This thesis has been read by each member of the following graduate committee and by majority vote has been found to be satisfactory. Date E. James Nelson, Chair
Date A. Woodruff Miller
Date Gus P. Williams


BRIGHAM YOUNG UNIVERSITY As chair of the candidate’s graduate committee, I have read the dissertation/thesis of Eric J. Nielsen in its final form and have found that (1) its format, citations, and bibliographical style are consistent and acceptable and fulfill university and department style requirements; (2) its illustrative materials including figures, tables, and charts are in place; and (3) the final manuscript is satisfactory to the graduate committee and is ready for submission to the university library. Date E. James Nelson
Chair, Graduate Committee
Accepted for the Department
A. Woodruff Miller Department Chair
Accepted for the College
Douglas M. Chabries Dean, Ira A. Fulton College of Engineering and Technology

ABSTRACT
ALGAL SUSCESSION AND NUTRIENT DYNAMICS IN
ELEPHANT BUTTE RESERVOIR
Eric J. Nielsen
Department of Civil and Environmental Engineering
Master of Science
A water quality model was created for Elephant Butte Reservoir, New Mexico
to understand nutrient dynamics and algal response during a three year period. The
model chosen for this study was CE-QUAL-W2 because of its proven ability to
accurately represent hydrodynamics and the ability to represent multiple algal groups.
Elephant Butte has been subject to large algal blooms. This study examined the
phosphorus loading into the reservoir to see if it could sustain the observed algal
growth. Data showed that the amount of bioavailable phosphorus was more than
enough to support large blooms. This study was also an initial attempt to model
multiple groups of algae. The information obtained will later be used in other water
quality models built and maintained by the US Bureau of Reclamation. Four algal
species were modeled; diatoms, dinoflagellates, cyanobacteria and greens. Research


into literary values of kinetic parameters for multiple algal species was conducted and
the results were compiled in this paper to assist future modeling efforts. Because
Elephant Butte was often nitrogen-limited, the calibration of algal growth was
difficult. Algal growth was very sensitive to the adjustment of kinetic parameters for
nitrogen half-saturation, light requirements, growth rates and temperature rate
multipliers.


ACKNOWLEDGMENTS
I wish to thank the members of my graduate committee, Dr. Miller and Dr.
Williams for their insight and especially thank my advisor Dr. Nelson for his constant
support and encouragement. I thank Jerry Miller, Nick Williams and Amy Cutler
from the Bureau of Reclamation for offering their expertise in the field of modeling
and their knowledge concerning this area of research. I wish to express appreciation
to the Bureau of Reclamation and EMRL for funding this research.
I also wish to thank the one who should be thanked most of all, my wife Anna-
Lena for being my best friend and supporting me through all of life’s endeavors.


TABLE OF CONTENTS LIST OF TABLES............................................................................................................ix
LIST OF FIGURES..........................................................................................................xi
1 Introduction ...............................................................................................................1
1.1 Model Selection...............................................................................................2
1.2 Previous Research ...........................................................................................4
1.3 Objectives ........................................................................................................5
1.4 Scope ...............................................................................................................6
2 Model Background ....................................................................................................9
2.1 Site Characterization .......................................................................................9
2.2 Model Characterization .................................................................................11
3 Model Generation....................................................................................................15
3.1 Bathymetry ....................................................................................................16
3.2 Boundary Conditions.....................................................................................19
3.3 Meteorological Data ......................................................................................21
3.4 Evaporation Coefficients ...............................................................................26
3.5 Constituent Data ............................................................................................27
3.6 Algal Groups .................................................................................................29
4 Model Calibration ...................................................................................................33
4.1 Hydrodynamic Calibration ............................................................................33
4.2 Algal Succession ...........................................................................................40
vii

5 Summary and Conclusions .....................................................................................43
5.1 Realization of Objectives ..............................................................................43
5.2 Additional Findings .......................................................................................46
5.3 Potential Application of Results ....................................................................47
5.4 Potential Future Research..............................................................................47
6 References ................................................................................................................49
viii

LIST OF TABLES Table 3.1 Elephant Butte boundary conditions. ..........................................................20
Table 3.2 Required meteorological data......................................................................22
Table 3.3 Cloud cover. ................................................................................................24
Table 3.4 Constituent state variables in CE-QUAL-W2. ............................................28
Table 3.5 Typical values of algal kinetic coefficients. ................................................32
Table 4.1 Calibrated evaporation coefficients.............................................................37
Table 4.2 Coefficients affecting thermal calibration. ..................................................38
ix


LIST OF FIGURES Figure 2.1 Map of Elephant Butte Reservoir...............................................................10
Figure 3.1 Bathymetry created From TIN. ..................................................................17
Figure 3.2 Results from calibration of bathymetry. ....................................................18
Figure 3.3 Elephant Butte bathymetry (clockwise: plan, front, and side views).........19
Figure 3.4 Location of meteorological station. ...........................................................23
Figure 3.5 Results from cloud cover sensitivity analysis. ...........................................25
Figure 3.6 Monthly Algal Data. ..................................................................................31
Figure 4.1 Components of Elephant Butte water budget. ...........................................34
Figure 4.2 Distributed tributary flow 1998-2002 ........................................................35
Figure 4.3 Calibrated Temperature Profile near the Dam for 1999.............................39
xi


1 Introduction
Water quality is becoming a more integral part of the management process of
water resources. These water sources are vital for domestic water use, irrigation,
power generation, revenue from recreational activities and as habitat for wildlife. The
question of supply is now directly tied with the question of the quality of that supply.
Federal standards are established and enforced by states to maintain and protect the
water quality of lakes and rivers. The water quality of lakes and rivers are often
stressed by population growth, industry, farming, natural pollutants and other
activities.
These sources can degrade the quality of waterbodies miles away from their
immediate location. Watersheds, by definition, are areas that drain to a control point.
They are complex systems that can house several of the previously mentioned sources
of potential impact to water quality. Reservoirs are often a control point of
watersheds. Reservoirs are excellent indicators of the overall health of a watershed
because they are receptacles of all watershed activities. Over a timeframe of many
years reservoirs age; meaning that they become more biologically productive.
Because pollutants from a watershed are concentrated in reservoirs, the reservoirs age
at an accelerated rate. This process of accelerated growth is called eutrophication.
1
Eutrophication of reservoirs occurs when nutrient levels are high and the productivity
of plant species, specifically algae, increases.
Elephant Butte Reservoir, the modeling site of this study, is situated on the Rio
Grande River and is the largest reservoir in the state of New Mexico. It serves as a
recreational area, a source of irrigation and drinking water and it is used for power
generation. (Elephant Butte, 2004) Recently Elephant Butte Reservoir has suffered
decreasing levels of water quality, including large algal blooms. The state of New
Mexico’s Water Quality and Water Pollution Control (305d) report for 2002 states
“nuisance algae (is one of) the major casual agents of use impairment.” Recent algal
blooms in Elephant Butte have been toxic, which presents a hazard to livestock, pets
and wildlife in the area. The presence of floating algae also discourages recreation
and causes various problems in water treatment processes downstream such as clogged
filters and taste and odor in drinking water. Large algal blooms further degrade water
quality by depleting dissolved oxygen in surface waters, which is detrimental to
aquatic animal populations. Elephant Butte Reservoir is an excellent case study for
the purposes of this research.
1.1 Model Selection
With the increasing concern over water quality, decision makers want to know
what drives the eutrophication process so that they can identify limiting nutrients and
improve water quality. Numeric models are being used to better understand the
degradation of water quality and the eutrophication of reservoirs. Numeric models are
useful as interpretative tools to better understand the prototype or as predictive tools to
2

investigate the impact of prescribed changes. There are many numeric models
available for simulating water quality in reservoirs. WASP6 (Water Quality Analysis
Simulation Program) is an EPA supported water quality model that has many state
variables to model natural and manmade pollutants. WASP6 can model multiple
CBOD sources, chemicals and solids, but it models algae as one assemblage. (WASP,
2005) BASINS (Better Assessment Science Integrating point and Nonpoint Sources)
is another widely-used water quality model. It is a multi-purpose environmental
analysis system that integrates many models and databases for water quality studies.
(BASINS, 2004) Another numeric model, CE-QUAL-W2 is a two-dimensional
laterally-averaged hydrodynamic and watery quality model. Recent versions of CE-
QUAL-W2 can model many constituents including multiple algal groups. (Cole, 2002)
CE-QUAL-W2 was chosen for this modeling study for a few important
reasons. CE-QUAL-W2 is widely used and accepted, and was the model selected for
this study by the Bureau of Reclamation Upper Colorado Water Quality Group who
funded this research. CE-QUAL-W2 is well suited for this study because it allows
algae to be modeled as multiple groups. Modeling algae in multiple groups is
important because modeling algae as one conglomerate is only a general
approximation of actual conditions because kinetic rates are highly species dependent.
(Zison, 1978) A more accurate representation is possible by modeling algae as groups
based on different species.
3

1.2 Previous Research
Modeling multiple algal groups is a relatively new endeavor. Investigation
into previous studies using multiple algal groups found few examples. This is likely
due to the fact that most models do not support multiple algal groups and that
simulating multiple groups adds more uncertainty and difficulty into a model. Bowen
(1999) investigated the effect of nutrient reduction on the estuarine portion of the
Nuese River in North Carolina. He found that the model poorly predicted the timing
and location of algal blooms and that calibration to observed values depended on
adjusting multiple parameters. These same problems were encountered during this
research. The setting of Bowen’s paper differs from that of this thesis because
different algae are found in estuarine environments than those found in freshwater
reservoirs. Applicable research was also conducted on Lake Waco (Flowers, 2001)
and is proposed on Lake Spokane (Cusimano, 2004).
Deer Creek Reservoir on the Provo River in Utah is a freshwater system that
was successfully modeled by the Bureau of Reclamation. (PSOMAS, 2002) In the
1980’s Deer Creek experienced high nutrient loadings and became eutrophic. The
Deer Creek water quality model was conducted to better understand past problems
with algal blooms associated with this eutrophic period and as a guide to improve
management decisions. Water quality levels improved dramatically through the
recommendations made by this study on Deer Creek. (Miller, 2005) The conditions in
Deer Creek were similar to the conditions now witnessed in Elephant Butte. This
study attempts to investigate the situation in Elephant Butte so that the same positive
results experienced in Deer Creek can be attained in Elephant Butte. The Deer Creek
4

water quality model represented algae as one mass in the model. The Elephant Butte
water quality model represents various species of algae as multiple groups. This
research is the next step in the process of more completely modeling reservoirs using
multiple algal groups.
1.3 Objectives
The objectives of this study are to:
• Determine whether the external phosphorus loading is sufficient to
sustain the observed amount of algal growth or is internal loading of
phosphorus also required;
• Represent algae in CE-QUAL-W2 with multiple groups and correctly
model their seasonal succession;
• Research literature values for algal growth and create a reference
document for others using CE-QUAL-W2 to model reservoirs using
multiple algal groups; and
• Assist the Bureau of Reclamation in managing water quality of
Elephant Butte Reservoir by contributing this model and its results as
part of a continuing study.
In an attempt to better understand and develop management methods to limit
the appearance and extent of these algal blooms, this study will examine the effect
different loadings of phosphorus have on algal growth and attempt to model the
seasonal succession of these algae.
5
The limiting nutrients of algal growth will also be examined, specifically
phosphorus. The source of phosphorus can be broken down into two compartments:
1) Phosphorus can enter the reservoir externally through rivers or tributaries and 2)
phosphorus sorbs onto iron-containing sediments under aerobic conditions and is
released and made internally available when the water column becomes anoxic. This
distinction between external and internal phosphorus loading is important because it is
a determining factor in the choice of remediation. For example, if the primary source
of phosphorus is internal (phosphorus desorbing from sediments), then treatment of
external sources such as improved wastewater treatment in cities upstream will have
little effect on the water quality of Elephant Butte Reservoir. It is vital to know that
proposed remediation steps will be successful when making management decisions.
CE-QUAL-W2 allows the investigation of characteristics that drive reservoir
behavior and predict future behavior given certain situations. For this study, CE-
QUAL-W2 was used to model Elephant Butte Reservoir over a five-year period from
1998-2002. This period was chosen because of the range of conditions experienced by
the reservoir in these four years. Elephant Butte Reservoir storage was near storage
capacity in 1998 and 1999. By the end of 2002 the reservoir was drained to 15% of
capacity. By including both wet and dry years, the validity of the model results is
increased. (Cole, 2002)
1.4 Scope
This study is part of an ongoing U.S. Bureau of Reclamation, U.S. Geological
Survey, and State of New Mexico Study to assess the water quality impacts in
6

Elephant Butte Reservoir. The scope of this study was to set up the CE-QUAL-W2
model and calibrate it hydrodynamically, evaluate the nutrient dynamic within the
reservoir, and to initially test the new algal compartment of the latest version CE-
QUAL-W2. This model is also part of an ongoing study to determine the relationship
between internal and external phosphorus loading and the algal bloom dynamics
within the reservoir. This work was in part supported by funding from the U.S.
Bureau of Reclamation. It is anticipated that additional work with this model, beyond
the scope of this thesis, will be done by the U.S. Bureau of Reclamation, and the State
of New Mexico. The purpose of this thesis was to set up the model, complete initial
calibration, assemble the database to begin testing the new algal compartment of
Version 3.2, and complete a preliminary calibration of the unique algal succession in
Elephant Butte Reservoir.
7

2 Model Background
2.1 Site Characterization
Elephant Butte Reservoir is situated on the Rio Grande River in southwestern
New Mexico near the city of Truth or Consequences (see Figure 2.1), 125 miles
northwest of El Paso, Texas. Elephant Butte Dam (originally Engle Dam) was
completed in 1916 by the Bureau of Reclamation. It is a concrete gravity dam that
stands 301 feet high and 1,674 feet long. The conservation capacity of the reservoir is
2.2 million acre-feet of water. At the time it was built, Elephant Butte Reservoir was
the largest structure built in the United States, creating the largest manmade reservoir
in the world. (Elephant Butte, 2004) At full capacity Elephant Butte Reservoir
stretches back 40 miles along the Rio Grande River. Elephant Butte Reservoir is a
long and narrow reservoir, no more than 3 miles at any point when filled to capacity.
It is divided in two sections by an even narrower section of the reservoir called the
“Narrows”. The width of the reservoir through the Narrows ranges from 950 feet to
2000 feet. After the Narrows, Elephant Butte Reservoir quickly becomes significantly
deeper than the portion of the reservoir above the Narrows.
9
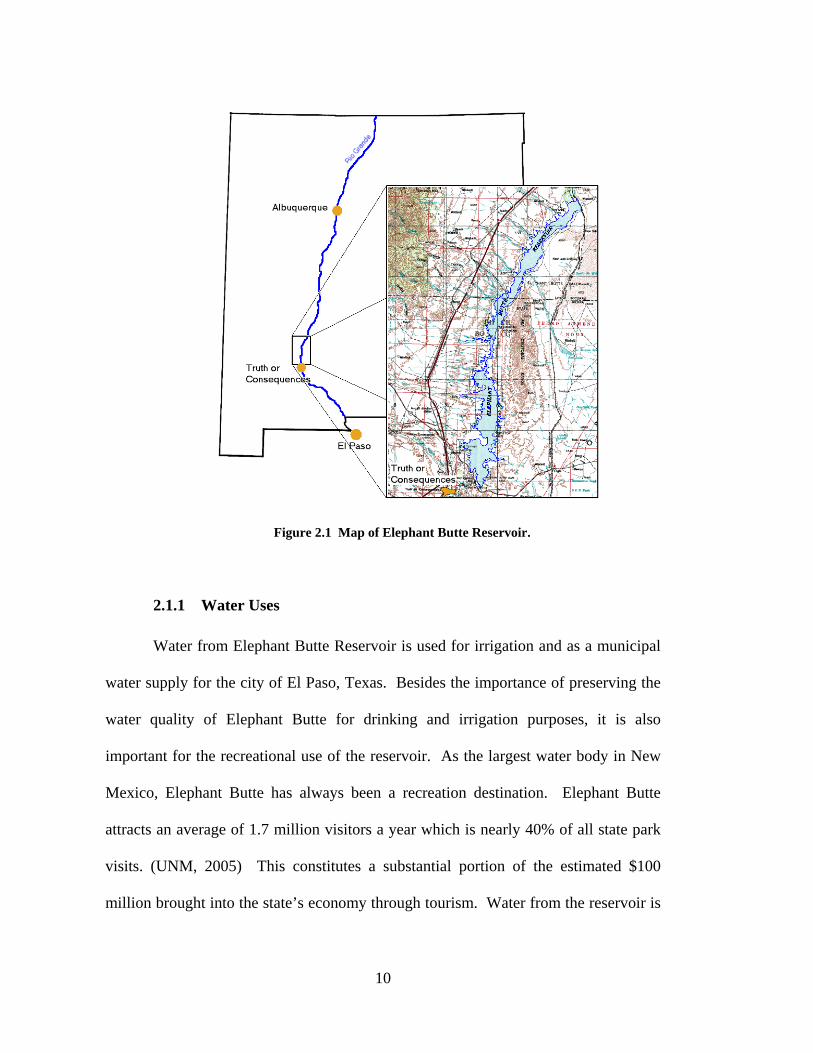
Figure 2.1 Map of Elephant Butte Reservoir.
2.1.1 Water Uses
Water from Elephant Butte Reservoir is used for irrigation and as a municipal
water supply for the city of El Paso, Texas. Besides the importance of preserving the
water quality of Elephant Butte for drinking and irrigation purposes, it is also
important for the recreational use of the reservoir. As the largest water body in New
Mexico, Elephant Butte has always been a recreation destination. Elephant Butte
attracts an average of 1.7 million visitors a year which is nearly 40% of all state park
visits. (UNM, 2005) This constitutes a substantial portion of the estimated $100
million brought into the state’s economy through tourism. Water from the reservoir is
10
also used to power a hydroelectric plant at the base of the dam. This hydroelectric
plant contains three generators each producing up to 10.3 MW of electricity. Elephant
Butte Reservoir is a valuable resource and a worthy candidate of a water quality study.
2.2 Model Characterization
2.2.1 History
CE-QUAL-W2 is a two-dimensional, laterally averaged, hydrodynamic and
water quality numerical model. The term “laterally-averaged” means that the
computed values (temperature, concentration, etc.) for each cell are constant across the
width of that cell. CE-QUAL-W2 is a finite difference model which uses a grid to
numerically solve the governing equations. CE-QUAL-W2 has been under continuous
development since 1975. It was originally known as the Laterally Averaged Reservoir
Model (LARM), which was authored by Edinger and Buchak. Water quality
algorithms were added in 1986 by the Water Quality Modeling Group at the US Army
Engineer Waterways Experiment Station (WES) and the model was renamed CE-
QUAL-W2 Version 1.0. CE-QUAL-W2 has evolved from that time to include new
algorithms to improve accuracy and stability. (Cole, 2002)
2.2.2 Capabilities and Limitations
It is important to understand the capabilities and limitations of CE-QUAL-W2
in order to understand its application to Elephant Butte and the model results. CE-
QUAL-W2 has many capabilities which make it applicable for this study. Since
Elephant Butte is a long and narrow reservoir, a laterally-averaged model like CE-
11

QUAL-W2 can be used because changing concentrations across the width of the
reservoir are assumed to be insignificant. CE-QUAL-W2 allows for long term
simulations and water quality responses which are also important for this study.
Version 3.1 allows for modeling of multiple algal groups and output of kinetic fluxes
for multiple constituents including phosphorus. The limitations of CE-QUAL-W2
which affect this study are that it does not explicitly include zooplankton and their
effects on recycling of nutrients. The model also uses a simplistic algorithm to
simulate sediment oxygen demand. “It does not model kinetics in the sediment and at
the sediment-water interface. This places a limitation on long-term predictive
capabilities of the water quality portion of the model.” (Cole, 2002) Despite these
limitations CE-QUAL-W2 has accurately modeled the behavior of many water bodies.
(Cole, 2002)
2.2.3 Previous Applications
CE-QUAL-W2 has been used by modelers around the world. To date the
number of waterbodies modeled by CE-QUAL-W2 is more than 250. Models using
multiple algal groups like this study include Nuese River, Lake Spokane and Lake
Waco. Lake Waco was one of the first to use the ability of CE-QUAL-W2to model
multiple algal groups. (Flowers, 2001) Lake Spokane had been modeled using CE-
QUAL-W2 and expressed interest and the need to develop the model further by
including multiple algal groups. (Cusimano, 2003) Nuese River investigated the
sensitivity of calibration of multiple algal groups and found that prediction of time and
place of algal blooms is problematic. (Bowen, 1999)
12

The Deer Creek TMDL study investigated the level of eutrophication in the
reservoir and as part of that study involved the use of CE-QUAL-W2 to model the
effects of nutrients on algal growth. Although the scope of the Deer Creek is larger
than the scope of this study, it is similar in many respects. Deer Creek is an important
source of drinking water to the Salt Lake and Utah counties and it is a popular
recreation area. During the 1970s and 1980s Deer Creek Reservoir was highly
eutrophic suffering from low hypolimnetic dissolved oxygen concentrations, large
toxic algal blooms and high levels of nutrient concentrations. CE-QUAL-W2 was
used to better understand reservoir processes and to predict results of proposed
management practices. The results of the predictive modeling were instrumental in
reducing the nutrients in the reservoir by 70 percent and improving the overall water
quality. Because CE-QUAL-W2 Version 2 was used in the modeling of Deer Creek
Reservoir, the algae had to be represented as a single conglomerate. (PSOMAS, 2002)
This study uses CE-QUAL-W2 Version 3, which allows the modeling of several algal
groups.
13


3 Model Generation
The purpose of this chapter is to describe the process of creating the Elephant
Butte Reservoir CE-QUAL-W2 model, to give supportive background information
relevant to the problem statement, and to validate the model results. The following
sections discuss the various components required for the Elephant Butte model, which
are bathymetry, boundary conditions, meteorological data, evaporation, constituent
data and algal composition. The section on bathymetry explains how the physical
description of the reservoir was represented. The boundary conditions of the model
which will be discussed include inflow, outflow and surface relationships. The
meteorological data section illustrates the use and importance of weather conditions on
the model. Evaporation is an important concern in the Elephant Butte model. The
section on evaporation details how it was represented in the model. The constituent
data used to describe the nutrients, organic matter, suspended solids and other
parameters are described. The final section discusses the data and methods used to
characterize the different species of algae in Elephant Butte Reservoir. CE-QUAL-
W2 files used for the Elephant Butte model are found on the attached CD.
15

3.1 Bathymetry
Bathymetry data was the starting point for the CE-QUAL-W2 model.
Bathymetry is the measurement of depths of a body of water and describes the shape
and volume of that waterbody. It quantifies the height, length, width and orientation
of each cell used in a grid to describe the reservoir. Important qualities such as the
storage-capacity curve are derived from the bathymetric data. Because the bathymetry
is vital to obtaining accurate model results (Cole, 2002), a significant amount of time
was spent generating and verifying a bathymetry file for CE-QUAL-W2. Many
months can be spent estimating widths of reservoir sections, formulating a bathymetry
file and calibrating it to a storage-capacity curve. In the case of Elephant Butte this
process was expedited by the use the software program, Watershed Modeling Systems
(WMS), developed by the Environmental Modeling Research Laboratory (EMRL), a
part of the Civil and Environmental Engineering Department at Brigham Young
University. Among its many capabilities, WMS can use various forms of spatial data
to create bathymetry inputs files suitable for use in CE-QUAL-W2. Similar to a
Geographic Information System (GIS) format, spatial data are read into WMS and
processed. Ideally a three-dimensional digital elevation set would be used, but
because Elephant Butte Reservoir was impounded so long ago, this information was
not available. Instead, a Triangulated Irregular Network (TIN) created from cross
sectional data was used as spatial data used for Elephant Butte (see Figure 3.1).
16

Figure 3.1 Bathymetry created From TIN.
The next step was to discretize the reservoir into model segments. This was
done by creating polygons longitudinally along the reservoir. Elephant Butte was
divided into segments each roughly 1500 meters long. After specifying a layer height
of 1 meter for all cells, the cell widths were automatically calculated from the TIN
developed for Elephant Butte. The segment lengths and layer heights were chosen
based on values used in previous models and to achieve a sufficiently refined grid.
With this information WMS generated a CE-QUAL-W2 bathymetry file. A storage-
capacity curve was then created from the bathymetry file and compared to an observed
storage-capacity for Elephant Butte. The observed storage-capacity curve was created
in 1997 from capacity equations derived by the Bureau of Reclamation Technical
Service Center using the least squares method of curve fitting. (Miller, 2005) Figure
3.2 shows the calibrated storage-capacity curve from the CE-QUAL-W2 bathymetry
file plotted against the derived storage-capacity curve from the Bureau of
Reclamation. Notice how well the calibrated model compares to the actual data.
17

Storage-Capacity Curve after Hydrodynamic Calibration
4200
4250
4300
4350
4400
4450
0 500000 1000000 1500000 2000000
Storage (ac-ft)
Elev
atio
n (ft
)
Calibrated Model
Actual
Storage-Capacity Curve after Hydrodynamic Calibration
4200
4250
4300
4350
4400
4450
0 500000 1000000 1500000 2000000
Storage (ac-ft)
Elev
atio
n (ft
)
Calibrated Model
Actual
Figure 3.2 Results from calibration of bathymetry.
The use of WMS was advantageous because creating bathymetry files for
Elephant Butte took hours instead of weeks. WMS also expedited modification of the
bathymetry to ensure that results were not adversely affected by grid resolution. The
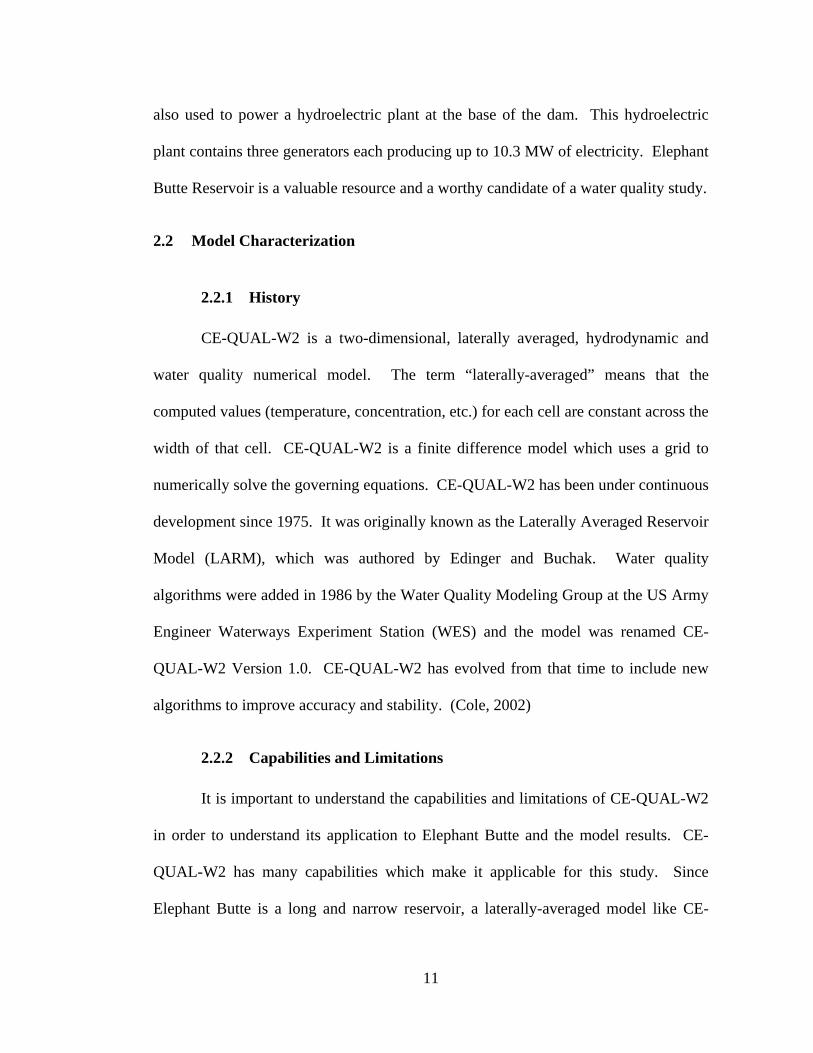
final bathymetry of the model is shown in Figure 3.3. The minimum cell width in the
bathymetry was limited to 30m to increase model stability and decrease model run
times.
18
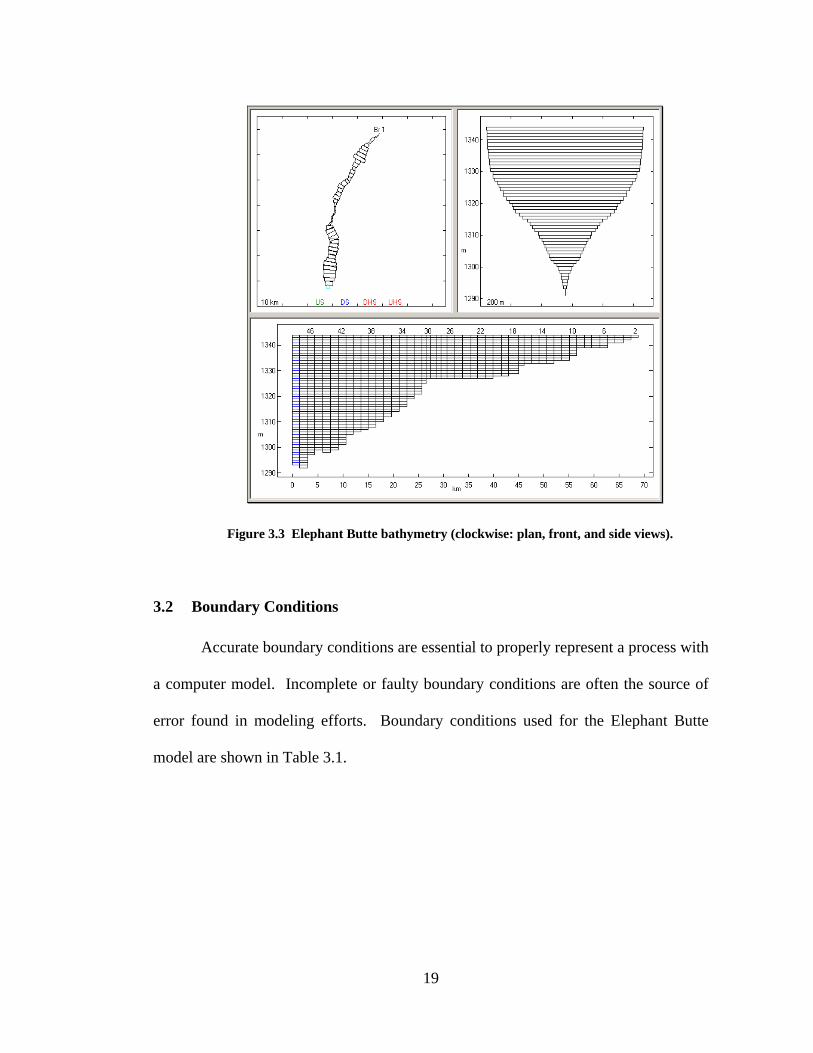
Figure 3.3 Elephant Butte bathymetry (clockwise: plan, front, and side views).
3.2 Boundary Conditions
Accurate boundary conditions are essential to properly represent a process with
a computer model. Incomplete or faulty boundary conditions are often the source of
error found in modeling efforts. Boundary conditions used for the Elephant Butte
model are shown in Table 3.1.
19
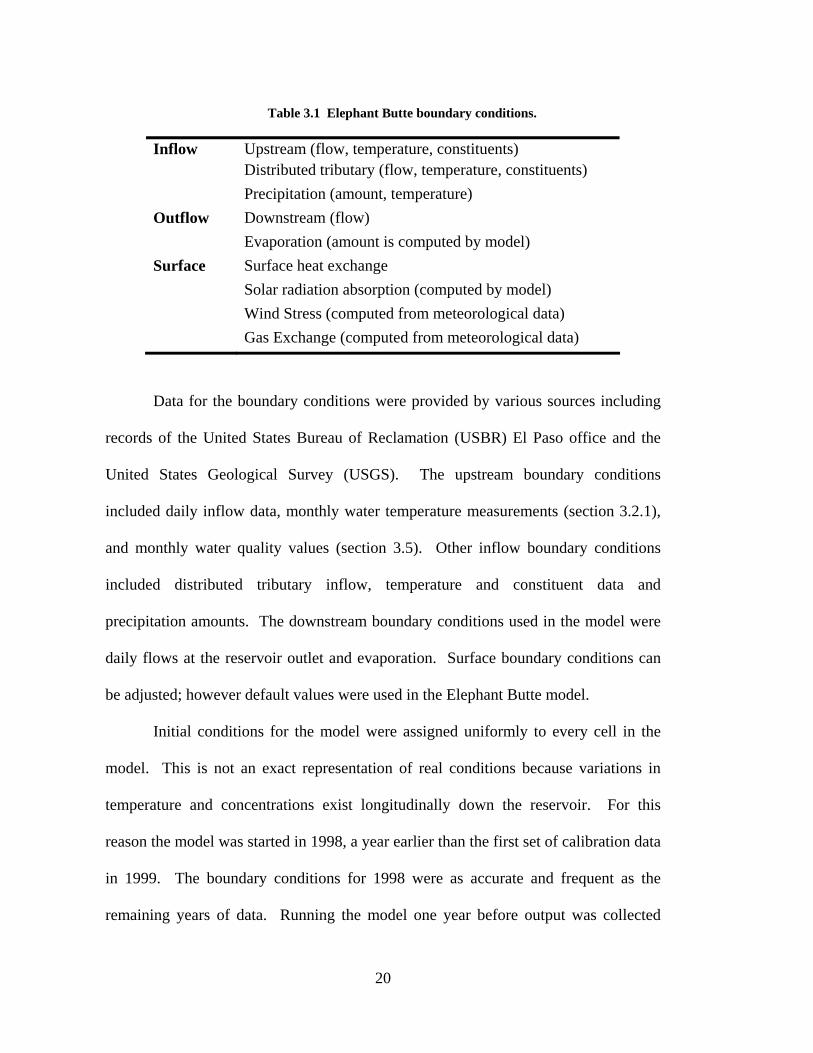
Table 3.1 Elephant Butte boundary conditions.
Inflow Upstream (flow, temperature, constituents) Distributed tributary (flow, temperature, constituents) Precipitation (amount, temperature) Outflow Downstream (flow) Evaporation (amount is computed by model) Surface Surface heat exchange Solar radiation absorption (computed by model) Wind Stress (computed from meteorological data) Gas Exchange (computed from meteorological data)
Data for the boundary conditions were provided by various sources including
records of the United States Bureau of Reclamation (USBR) El Paso office and the
United States Geological Survey (USGS). The upstream boundary conditions
included daily inflow data, monthly water temperature measurements (section 3.2.1),
and monthly water quality values (section 3.5). Other inflow boundary conditions
included distributed tributary inflow, temperature and constituent data and
precipitation amounts. The downstream boundary conditions used in the model were
daily flows at the reservoir outlet and evaporation. Surface boundary conditions can
be adjusted; however default values were used in the Elephant Butte model.
Initial conditions for the model were assigned uniformly to every cell in the
model. This is not an exact representation of real conditions because variations in
temperature and concentrations exist longitudinally down the reservoir. For this
reason the model was started in 1998, a year earlier than the first set of calibration data
in 1999. The boundary conditions for 1998 were as accurate and frequent as the
remaining years of data. Running the model one year before output was collected
20

(1998) lessened any effect from the lack of accuracy in the initial conditions. In effect
this allows the model to generate accurate initial conditions for the first year of
calibration (1999) on its own.
3.2.1 Equilibrium Temperatures
The fluctuation of inflowing water temperature can have a pronounced effect
on the heat budget of a water body. (Cole, 2002) This fluctuation in temperatures
throughout the day and night affect the characteristics of the thermocline. The data
provided for this model only contained average daily temperatures. After preliminary
model runs it was decided that more frequent inflow water temperatures were needed
in order to accurately capture the behavior of the thermocline throughout the
simulation. Thus, equilibrium water temperatures were calculated using
meteorological data and a software package called W2Met. (Edinger, 2005)
3.3 Meteorological Data
Meteorological data were obtained from the National Oceanic and
Atmospheric Administration (NOAA) National Data Centers. Table 3.2 shows the
required meteorological data and units for CE-QUAL-W2.
21

Table 3.2 Required meteorological data.
Required Data Units
Air Temperature ° C Dewpoint Temperature ° C
Wind Speed m / sec Wind Direction rad
Could Cover 0 – 10
Meteorological data are one of the primary forcing functions of CE-QUAL-
W2, so it is vital that it be as frequent as possible. The data for Elephant Butte are
input hourly over the five year period. Hourly data provided sufficient resolution to
represent the heat budget of Elephant Butte Reservoir. This was evident in the
hydrodynamic calibration process which will be discussed in section 4.1. The NOAA
station used was station 722710 KTCS Truth or Consequences. The station location
with respect to the reservoir can be seen in Figure 3.4. The proximity of the station to
the reservoir lessened the need to adjust the meteorological data for relevance and thus
lessened calibration time and should result in increased accuracy of the results.
22

Figure 3.4 Location of meteorological station.
Other than the cloud cover data, which required a transformation from the
original values, the meteorological data obtained were used directly in the model. CE-
QUAL-W2 requires cloud cover as a scale of 0 to 10 (0 meaning no cloud cover and
10 meaning total cloud cover). Because the cloud cover date was not recorded in this
format, a conversion was required. The cloud cover data obtained from this station
was recorded as clear, scattered, broken or overcast. Table 3.3 shows the fraction of
cloud cover associated with each designation for conversion to model requirements.
23
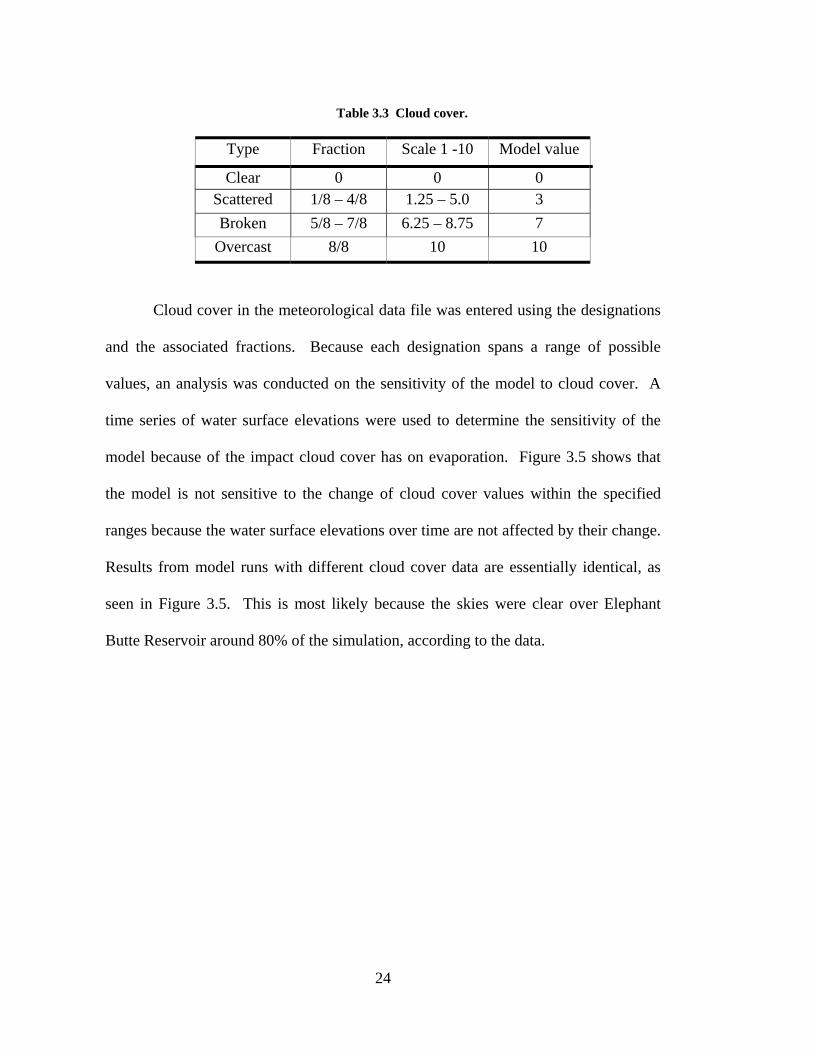
Table 3.3 Cloud cover.
Type Fraction Scale 1 -10 Model value
Clear 0 0 0 Scattered 1/8 – 4/8 1.25 – 5.0 3 Broken 5/8 – 7/8 6.25 – 8.75 7
Overcast 8/8 10 10
Cloud cover in the meteorological data file was entered using the designations
and the associated fractions. Because each designation spans a range of possible
values, an analysis was conducted on the sensitivity of the model to cloud cover. A
time series of water surface elevations were used to determine the sensitivity of the
model because of the impact cloud cover has on evaporation. Figure 3.5 shows that
the model is not sensitive to the change of cloud cover values within the specified
ranges because the water surface elevations over time are not affected by their change.
Results from model runs with different cloud cover data are essentially identical, as
seen in Figure 3.5. This is most likely because the skies were clear over Elephant
Butte Reservoir around 80% of the simulation, according to the data.
24
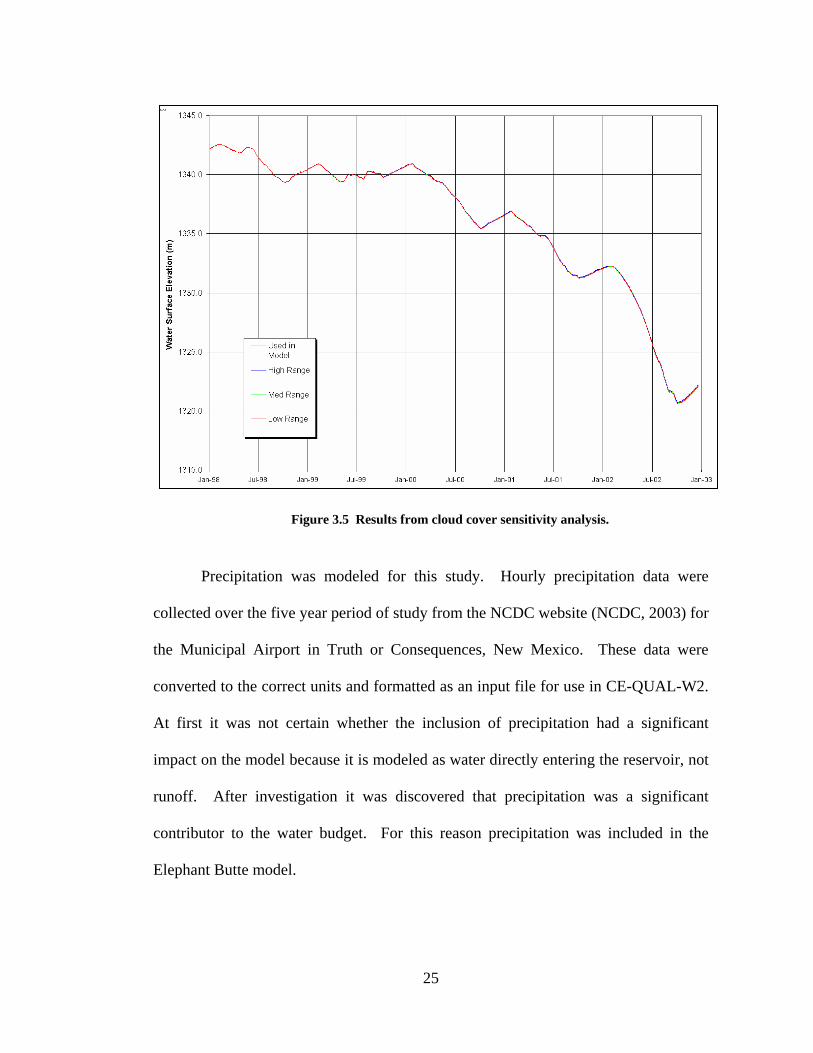
Figure 3.5 Results from cloud cover sensitivity analysis.
Precipitation was modeled for this study. Hourly precipitation data were
collected over the five year period of study from the NCDC website (NCDC, 2003) for
the Municipal Airport in Truth or Consequences, New Mexico. These data were
converted to the correct units and formatted as an input file for use in CE-QUAL-W2.
At first it was not certain whether the inclusion of precipitation had a significant
impact on the model because it is modeled as water directly entering the reservoir, not
runoff. After investigation it was discovered that precipitation was a significant
contributor to the water budget. For this reason precipitation was included in the
Elephant Butte model.
25
3.4 Evaporation Coefficients
Elephant Butte is located in one of the driest regions of the United States.
Annual evaporation at the reservoir ranges between 50,000 ac-ft and 250,000 ac-ft.
(S.S. Papadopulos, 2000) Evaporation is an important mechanism for the Elephant
Butte model in two ways. First, evaporation plays an important role in the water
budget and thus has a large effect on the reservoir volume over time. Second, the rate
of evaporation also greatly influences the water temperatures of the reservoir. For
these reasons it was important that the rates describing evaporation were appropriate
for the reservoir. CE-QUAL-W2 utilizes an evaporation equation of the form
pressureair vapor pressure vapor saturation
)(t coefficiennevaporatio
: Where)()(
==
+=
==
−∗∗=
a
s
c
as
ee
bWaufkE
eeufkE
CE-QUAL-W2 allows specification of the coefficients (a, b, and c) of the wind
function, f(u). By proper use of these coefficients, evaporation can be adjusted
constantly, linearly and exponentially in relation to the wind. The vapor pressures are
calculated internally and the wind speed is provided from data in the meteorological
input file. The wind function requires wind speeds taken two meters from the ground.
The height for the ASOS wind tower used for this study is 10 meters, CE-QUAL-W2
allows the specification of the height of the wind measurements to adjust for this.
Adjustment of the wind measurement height affects the rate of evaporation. The El
26

Paso office of the USBR provided monthly data for evaporation. This evaporation
data was used during calibration to verify the amount of water being evaporated.
3.5 Constituent Data
CE-QUAL-W2 has eighteen constituent state variables such as total dissolved
solids, orthophosphate, nitrite-nitrate, dissolved oxygen, etc. Four of the eighteen
constituent state variables represent groups that can consist of various divisions.
These four constituents are generic zero or first order constituents, inorganic
suspended solids, carbonaceous biochemical oxygen demand loadings, and algal
groups. The use of multiple algal groups in this model will be discussed in further
detail in the following section. Table 3.4 shows all of the constituent state variables
available that were used in the Elephant Butte model. All state variables were
modeled because “constituent kinetics are strongly coupled and failure to include one
or more constituents can have far reaching effects” (Cole, 2002). It can be seen that
although phosphorus is the nutrient of concern, it is important to include and
accurately model all nutrients to effectively represent the system and achieve
meaningful results.
27

Table 3.4 Constituent state variables in CE-QUAL-W2.
Total dissolved solids Labile dissolved organic matter Any 0- or 1-order constituents Refractory dissolved organic matter Inorganic suspended solids Labile particulate organic matter Dissolved inorganic phosphorus Refractory particulate organic matter Ammonium CBOD groups Nitrate-nitrite Algal groups Dissolved silica Dissolved oxygen Particulate biogenic silica Total inorganic carbon Dissolved iron Alkalinity
Constituents enter Elephant Butte Reservoir from the Rio Grande or from non-
point sources. Nutrients are present in many different forms in an aquatic
environment. Matter can be dissolved or in particulate form. Nutrients can be organic
or inorganic. In this study the nutrients of concern are the bioavailable or dissolved
inorganic nutrients. The constituent data that enters as external input into the Elephant
Butte model from the Rio Grande were obtained from two sources. The USGS gaging
station #08358400 “Rio Grande Floodway at San Marcial, NM” and data collected by
the Bureau of Reclamation were combined to make a file that provides bimonthly
constituent data into the reservoir.
The inflow constituent data alone hinted that Elephant Butte was a unique
reservoir. Inflow concentrations of bioavailable orthophosphate averaged 0.27 mg/L
over the simulation period. The average inflow concentration of nitrate-nitrite over
the simulation was 0.48 mg/L. Stoichiometric ratios of compounds needed for algal
cell growth specify that the ratio of nitrogen to phosphorus is around 14:1. (Miller,
2005) The ratio of nitrogen to phosphorus in the inflow concentrations for Elephant
28

Butte was only 2:1. This indicates that Elephant Butte Reservoir is nitrogen-limited
during the course of this simulation. Because Elephant Butte is nitrogen-limited
during the timeframe of this study, the algal growth and algal succession in the model
was unique and interesting. Section 3.6 describes in more detail the condition of the
reservoir with respect to algae.
Constituent data entering the reservoir as a non-point source were estimated
and included in the model using the distributed tributary constituent file.
Development of a more accurate non-point source loading to a waterbody is an area of
possible future research and will be discussed later in the study.
3.6 Algal Groups
Algae play an important role in the internal cycling of nutrients within a
reservoir. For this reason and others it was advantageous to include algae in the model
to accurately represent the nutrient dynamics. Algal growth is a function of
temperature, light and nutrients. The abundance or scarcity of these factors
determines the rate of growth. As algae grow they incorporate various nutrients into
their structure during photosynthesis. These nutrients, including phosphorus, are
returned to the water column as excretions from the algae, during decomposition after
the algae have died, and from algal respiration.
Of the constituents discussed in the previous section, carbon, phosphorus,
nitrogen and silicon are the major nutrients in algal growth. (Cole, 2002) And as
mentioned in section 3.5, the ratio of each nutrient needed for algae to grow is based
on stoichiometric relationships. Because Elephant Butte is nitrogen-limited during the
29

timeframe of this study, it is an interesting case of algal growth and algal succession.
This situation is unique because a majority of eutrophic reservoirs are phosphorus-
limited. In a nitrogen-limited reservoir such as Elephant Butte, it is easy to assume
that nitrogen-fixing algae would dominate this reservoir because they are able to
obtain unlimited amounts of nitrogen from the atmosphere. This is alarming because
nitrogen-fixing cyanobacteria are often the major cause of toxic blooms. However,
contrary to what would be expected from the collected algae data, cyanobacteria are
not the dominant species of algae in Elephant Butte. This makes Elephant Butte a
unique case study and a challenge to model. Calibration of the algal succession is
described in section 4.2.
A strength of CE-QUAL-W2 is that it allows for the modeling of multiple algal
groups. Because different species of algae have different characteristics, it is possible
to better define the nutrient cycling caused by the algae using multiple groups. The
Elephant Butte model includes four algal groups, representing the dominant species
throughout the period of study, which are diatoms, cyanobacteria, green algae, and
dinoflagellates. Figure 3.6 shows the seasonal succession of these four algal species
during 1999 and 2000.
30
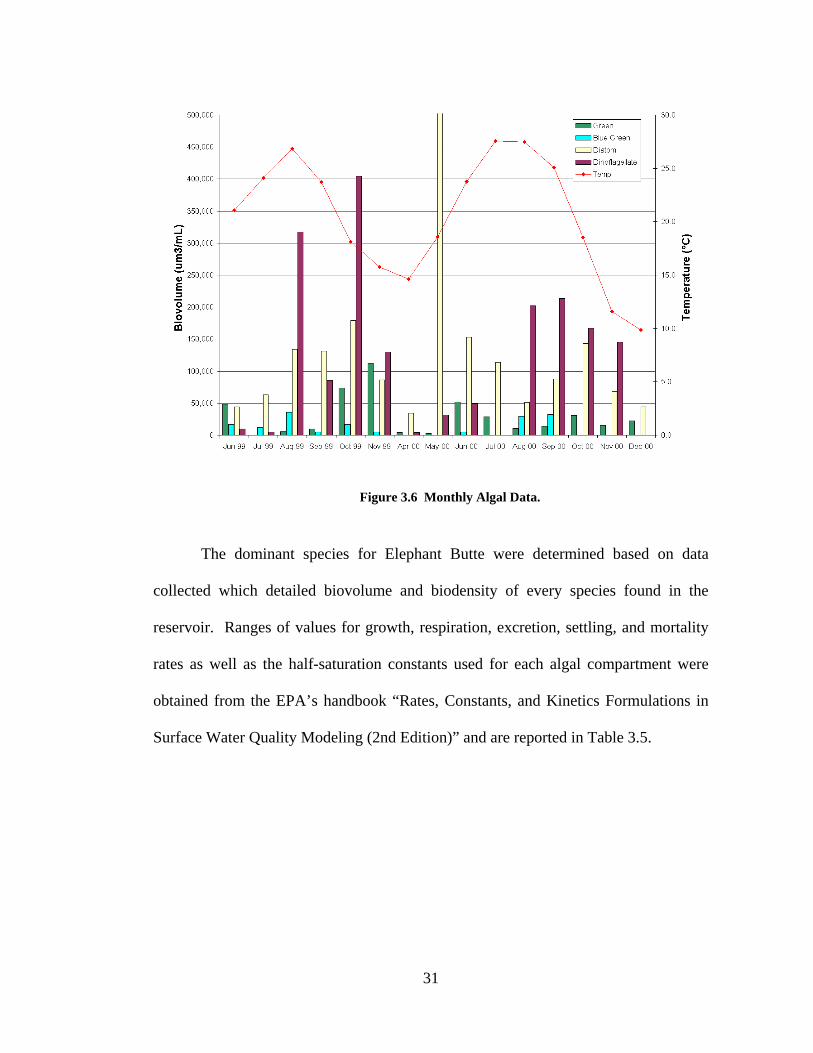
Figure 3.6 Monthly Algal Data.
The dominant species for Elephant Butte were determined based on data
collected which detailed biovolume and biodensity of every species found in the
reservoir. Ranges of values for growth, respiration, excretion, settling, and mortality
rates as well as the half-saturation constants used for each algal compartment were
obtained from the EPA’s handbook “Rates, Constants, and Kinetics Formulations in
Surface Water Quality Modeling (2nd Edition)” and are reported in Table 3.5.
31

Table 3.5 Typical values of algal kinetic coefficients.
Diatoms Greens Cyanobacteria Dinoflagellates
AG 1.1 - 5.0 0.7 - 4.1 0.4 – 2.5 0.2 – 2.1 AR 0.04 – 0.08 0.03 – 0.07 0.03 – 0.065 0.047 AS 0.05 – 0.4 0.05 – 0.4 0.0 – 0.15 2.8 – 6.1
AT1 0 10 15 15 AT2 10 25 20 20 AT3 30 35 30 30 AT4 32 40 40 35
ASAT 70 - 140 30 - 50 20 - 100 40 – 90 AHSP 0.001–0.009 0.003 - 0.02 0.01 – 0.02 0.06 AHSN 0.015 - 0.03 0.03 – 0.035 0.0 – 0.001 0.005 – 0.08
Notice that the half-saturation for nitrogen limited growth for cyanobacteria
can be zero. This means that cyanobacteria in the Elephant Butte can be modeled as
nitrogen-fixing.
32
4 Model Calibration
This chapter describes the process of calibrating the Elephant Butte Reservoir
CE-QUAL-W2 model to observed data. Calibration is a vital step in the modeling
process. The intent of the following discussion is to enumerate and justify the
decisions made during the calibration process to add clarity to the conclusions made
later in the study.
4.1 Hydrodynamic Calibration
Hydrodynamic calibration can be accomplished in many ways. Because there
is no one ideal method (Cole 2002), three steps were taken to calibrate the
hydrodynamics of the Elephant Butte model. These steps were 1) balancing the water
budget, 2) thermal calibration, and 3) dissolved oxygen calibration, which are
described in the followings sections.
4.1.1 Water Budget
Although balancing the water budget is not technically part of hydrodynamic
calibration, accurately accounting for the water budget is the most fundamental part of
calibrating a model. If a model is not correctly predicting the amount of water moving
33

through and remaining within the reservoir then there is little hope that any other
predictions made by the model can have validity.
The components of the water budget for Elephant Butte Reservoir are depicted
in Figure 4.1 below.
Figure 4.1 Components of Elephant Butte water budget.
As mentioned previously (section 3.2) the inflow and outflow data were
provided by the El Paso office of the USBR. Monthly evaporation and seepage data
were also included in this data set and all were accounted for in the water budget.
Daily precipitation data were obtained from the Truth or Consequences Municipal
Airport. The only unaccounted source to the Elephant Butte water budget is the
ungaged tributary flow from storm events. These ungaged flows were determined
using a computer program provided by Tom Cole and Scott Wells (Cole, 2004),
authors of the CE-QUAL-W2 model. This program helps to complete the water
budget by solving for the unaccounted flows by forcing the computed water surface
elevation to match the observed water surface elevation. The program outputs a file of
34
flows that can be used by CE-QUAL-W2 as a distributed tributary inflow file
(essentially spreading the difference over the entire reservoir). This file was included
in the Elephant Butte model to represent the ungaged tributary inflows and the effects
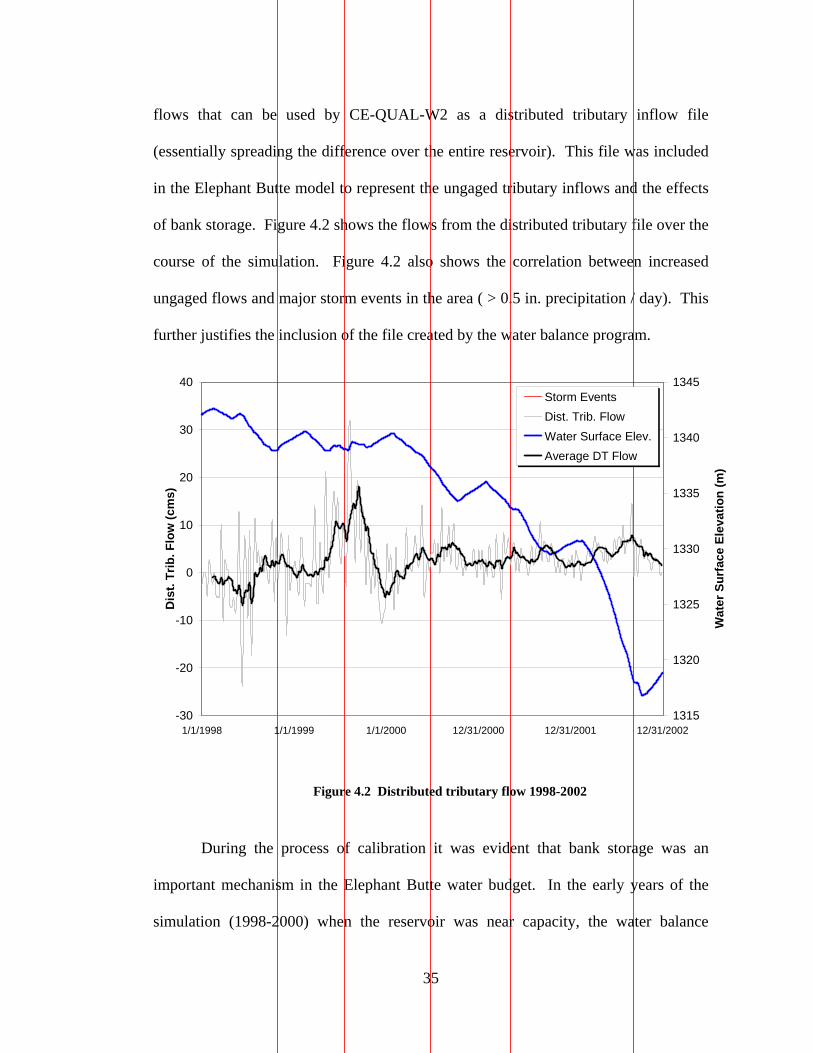
of bank storage. Figure 4.2 shows the flows from the distributed tributary file over the
course of the simulation. Figure 4.2 also shows the correlation between increased
ungaged flows and major storm events in the area ( > 0.5 in. precipitation / day). This
further justifies the inclusion of the file created by the water balance program.
-30
-20
-10
0
10
20
30
40
Dis
t. Tr
ib. F
low
(cm
s)
1315
1320
1325
1330
1335
1340
1345
1/1/1998 1/1/1999 1/1/2000 12/31/2000 12/31/2001 12/31/2002W
ater
Sur
face
Ele
vatio
n (m
)
Storm EventsDist. Trib. FlowWater Surface Elev.Average DT Flow
Figure 4.2 Distributed tributary flow 1998-2002
During the process of calibration it was evident that bank storage was an
important mechanism in the Elephant Butte water budget. In the early years of the
simulation (1998-2000) when the reservoir was near capacity, the water balance
35

program shows an increase of water leaving the reservoir. In the later years of the
simulation (2000-2003) when the reservoir was significantly drawn down, the water
balance program shows an increase of water entering the reservoir. This can be
explained through significant bank storage as the water surface elevation fluctuates.
When the water elevation rises, water leaves the reservoir and seeps into the ground or
banks. As the water surface recedes, the water stored in the bank flows back out into
the reservoir.
Because Elephant Butte Reservoir is located in one of the most arid regions of
the United States increasing the default evaporation coefficients (see section 3.4) were
required for model calibration. CE-QUAL-W2 models of other reservoirs in the
region used a similar increase of the evaporation coefficients in an attempt to best
represent this process. The US Bureau of Reclamation Upper Colorado Water Quality
Group is currently calibrating CE-QUAL-W2 models for Lake Mead and Lake Powell
using altered evaporation coefficients. (Miller, 2005) A sensitivity analysis was
conducted for the Elephant Butte model on the effect of each evaporation coefficient,
as well as on various combinations of coefficients. The sensitivity analysis examined
how combinations of coefficients performed based on the volume of evaporation,
effect on water temperature and model runtimes. The volume of evaporation was
evaluated after each run by comparing the amount of evaporation computed by the
model against monthly pan data provided by the USBR El Paso office. After each run
the temperature profiles were also inspected to ensure that the heat budget was not
being adversely impacted as a result of the evaporation calibration. The last factor,
although not vital to the integrity of the model results, was still important in the
36

decision of which evaporation coefficients to use. This factor affected the speed at
which the model ran. Certain combinations of coefficients seemed to cause run times
to increase dramatically. Finally it was decided to use the default evaporation
coefficients with the exception of a slight increase in base evaporation. The results
using these coefficients provided an accurate amount of evaporation and accurate
temperature profiles. The evaporation coefficients used are shown in Table 4.1
compared to their corresponding default values.
Table 4.1 Calibrated evaporation coefficients.
Coefficient Model Value Default
a 10.0 9.2 b 0.46 0.46 c 2.0 2.02
All of these components of the water budget were balanced until computed
water surface elevations over the duration of the simulation had an average mean error
of less than 10 cm compared to observed water surface elevations.
4.1.2 Temperature
After the water budget of Elephant Butte was balanced, the next step was to
thermally calibrate the model. Thermal calibration of Elephant Butte was closely tied
to the previous step of balancing the water budget because of the calibration of the
evaporation coefficients. Thermal calibration proved useful during the calibration of
the evaporation coefficients as was discussed in section 4.1.1. Some combination of
37

evaporation coefficients were able to balance the water budget but did not accurately
capture the behavior of observed temperature data. Evaporation calibration was
complete when the water budget was balanced and the thermal characteristics
(thermocline depth and shape) were reasonable.
Thermal calibration for Elephant Butte was fairly simple and straightforward.
The coefficients that affect thermal calibration suggested in the CE-QUAL-W2 users
manual (Cole 2002) and the values used in the Elephant Butte (EB) model are shown
in Table 4.2.
Table 4.2 Coefficients affecting thermal calibration.
Coefficient EB Default
Longitudinal eddy viscosity [AX] 1 m2 sec-1 1 m2 sec-1
Longitudinal eddy diffusivity [DX] 1 m2 sec-1 1 m2 sec-1
Chezy coefficient [FRICT] 70 m2 70 m2 Wind Sheltering coefficient [WSC] 1.0 ParameterSolar radiation absorbed in surface layer [BETA] 0.45 0.45 Extinction coefficient for pure water [EXH2O] 0.30 m-1 0.45 m-1
Extinction coefficient for inorganic solids [EXINOR] 0.10 m-1 0.01 m-1
Extinction coefficient for organic solids [EXORG] 0.10 m-1 0.2 m-1
Coefficient of bottom heat exchange [CBHE] 7.0E-8 7.0E-8 Sediment (ground) temperature [TSED] 16.12 - Heat loss to sediments that is added back to water [TSEDF] 1.0 0.0 - 1.0 Interfacial friction factor [FI] 0.0 0.01
One of the main calibration parameters in CE-QUAL-W2 is the wind
sheltering coefficient. A wind sheltering coefficient is assigned to each segment of the
reservoir model. Adjusting these coefficients allows the modeler to compensate for
38
wind sheltering caused by terrain and to compensate for large distances from weather
stations. In the case of Elephant Butte it was not justifiable to use the wind sheltering
coefficients as a calibration parameter since Elephant Butte Reservoir is located in a
flat, open area and the recording station for meteorological data is less than two miles
from the reservoir. This is somewhat unique because wind sheltering coefficients are
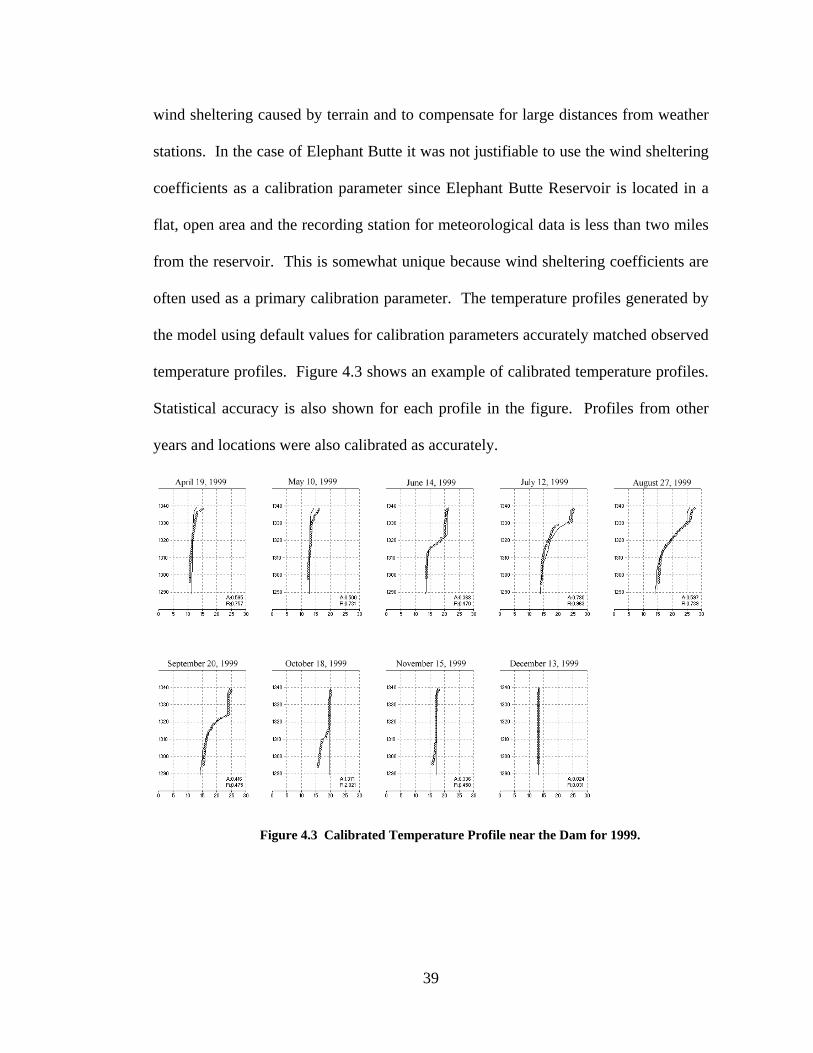
often used as a primary calibration parameter. The temperature profiles generated by
the model using default values for calibration parameters accurately matched observed
temperature profiles. Figure 4.3 shows an example of calibrated temperature profiles.
Statistical accuracy is also shown for each profile in the figure. Profiles from other
years and locations were also calibrated as accurately.
Figure 4.3 Calibrated Temperature Profile near the Dam for 1999.
39

4.1.3 Dissolved Oxygen
Calibration of the dissolved oxygen in a reservoir is an important step in
obtaining a useful model. When the dissolved oxygen is properly modeled it provides
additional evidence that the hydrodynamics of the reservoir are modeled correctly.
“Experience has shown that dissolved oxygen and phytoplankton are often much
better indicators of proper hydrodynamic calibration than temperature or salinity”
(Cole, 2002). Cole goes on to explain that dissolved oxygen is a better indicator for
two reasons. First, dissolved oxygen has gradients at different locations in the water
column than temperature. Second, dissolved oxygen is much more dynamic than
temperature and responds quickly to sudden changes in hydrodynamics. Dissolved
oxygen calibration was conducted on the Elephant Butte model to ensure more
accurate modeling of the hydrodynamics. This calibration was conducted before the
algal groups were added. A sediment oxygen demand was applied to the water
column and calibrated against observed profiles. Ideally this dissolved oxygen
calibration would be done again after the algal groups had been added. Because the
algal growth was not able to be calibrated, the dissolved oxygen was not calibrated
either.
4.2 Algal Succession
As mentioned previously in section 3.5, the nutrient budget and the behavior of
algal growth in Elephant Butte Reservoir present a challenging situation to model.
From the nutrient data it was determined that Elephant Butte is nitrogen-limiting
throughout the simulation. This fact was confirmed during the calibration of algal
40

growth. CE-QUAL-W2 can output the limiting factors for each of the four algal
groups and this data also showed that nitrogen or light was often the limiting
constituent. It would be suspected that under these conditions nitrogen-fixing algae
would outcompete other species and dominate the reservoir. As mentioned in section
3.6, the dominant algal species in Elephant Butte are dinoflagellates and diatoms, not
the nitrogen-fixing cyanobacteria. This posed a problem in modeling because there
was not enough nitrogen available for observed algal growth without enough nitrogen-
fixing algae in the reservoir. To overcome this, the dinoflagellates were modeled as
nitrogen-fixing so that they would be dominant and still provide enough nitrogen into
the water column. This improved results but the dinoflagellate modeled could not be
proved with a literature review as a nitrogen-fixing algae.
The process of correctly calibrating multiple groups of algae was challenging.
In the CE-QUAL-W2 manual Cole (2002) states that, “When including multiple algal
groups, the temperature rate coefficients are one of the most important parameters
determining algal succession.” This statement was strikingly evident in the calibration
of the four algal groups in Elephant Butte. Results from model runs were extremely
sensitive to practically any adjustment of the temperature rate coefficients. Allowing
one algal group to grow too early or too late negatively interfered with the growth of
other algal groups. Other possible calibrating parameters included are shown in Table
3.5. However, most of these parameters were not used in calibration, assuming that
literary values were correct. Parameters that were adjusted besides the temperature
rate coefficients were settling velocities, saturating light intensities, and phosphorus
and nitrogen half-saturation constants. Of all of the calibrating parameters,
41

temperature rate multipliers were the most important in the Elephant Butte model.
The model was not able to be calibrated for algal growth. It was impossible to achieve
enough nitrogen in the water to drive the observed growth while keeping the kinetic
parameters within the researched ranges. Further research into the specific species of
algae in the reservoir and additional algal data will help future calibration attempts.
As the Bureau of Reclamation continues to use multiple algal groups in this model and
other models, a better understanding of representing multiple algal groups will be
achieved.
42

5 Summary and Conclusions
5.1 Realization of Objectives
The objectives outlined in the introduction were resolved in the following
ways:
• External phosphorus loading alone is sufficient to support observed
algal blooms in the reservoir;
• Qualitatively modeled seasonal algal species succession although many
problems were experienced;
• Use of this document and the researched literature values will hopefully
expedite future efforts to model multiple algal groups;
• The Bureau of Reclamation will continue to investigate algal blooms
using this CE-QUAL-W2 model of Elephant Butte Reservoir along
with models of other reservoirs.
5.1.1 Phosphorus Loading
The initial assumption of this study was that the external loading of
phosphorus to the reservoir was not sufficient to produce the amount of algae observed
in Elephant Butte Reservoir. This assumption was made based on other large
43

reservoirs in the region. Reservoirs in the southwest usually have high suspended
sediment loadings which tie up available phosphorus. Lake Powell which lies on the
Colorado River in Utah can have similar inflow concentrations of total phosphorus as
Elephant Butte but the concentrations of bioavailable phosphorus vary significantly
between reservoirs. The percentage of bioavailable phosphorus to total phosphorus
average over 30% in Elephant Butte but in Lake Powell it is only 0.5 – 1.0% (Miller,
2005). This means that there is a lot more phosphorus available to drive algal growth.
This also means that the sediments entering Elephant Butte probably have a low
affinity for phosphorus sorbtion. This poses a problem because phosphorus sorbtion
onto iron-containing sediments usually acts as a buffer protecting reservoirs from large
spikes entering the system. Without this sort of buffer Elephant Butte is susceptible to
large nutrient spikes that produce large algal blooms.
5.1.2 Algal Succession
Previous water quality models have represented algal growth as a single
assemblage. The kinetic coefficients used to describe this type of assemblage were an
average of all of the species of algae present in the water column. This type of
representation of the algae in a reservoir is only an approximation. (Zison, 1978)
Representing each species of algae as a different group in a model allows for a more
accurate representation of their behavior. Because of this capability, seasonal growth
and decline of the dominant algal species could be represented in the Elephant Butte
model. Once this succession of algal species was properly captured, it was then
possible to determine why certain species dominate and what would happen if
44
conditions were to change. This was of interest because in Elephant Butte it was not
apparent why nitrogen-fixing blue-green algae do not dominate the reservoir during
the period of study instead of the observed diatom and dinoflagellate species. The
reservoir is nitrogen-limited during the modeled time period, which would make
nitrogen-fixing algae able to outcompete other algae. If blue-green algae were to
flourish many problems would be expected such as toxic algal blooms and taste and
odor problems in drinking water.
5.1.3 Literature Values
Literature values were collected from the EPA document on surface water
quality modeling (Bowie, 1985) and grouped in a format that useful for application
into CE-QUAL-W2 models. These ranges represent a wide range of values and
questions into the validity of possible values should be investigated further by
referring to the EPA document. These values are guidelines and should not be
considered absolute. As Elephant Butte showed, sometimes the algae behave
differently than laboratory results would predict. Correlation between laboratory
results and field observations will be better defined through further application of
models using multiple algal groups.
5.1.4 Further Investigation by USBR
Studies like this one on Elephant Butte are useful. It is important that our
water sources are protected from degrading levels of water quality. Management of
reservoirs in the southwest can be improved by understanding the workings of
evaporation, algal succession, and the effects of phosphorus learned from this study on
45
Elephant Butte Reservoir. The Elephant Butte water quality model is accurately
calibrated hydrodynamically and will be used for further research. The results of this
research along with the literature data collected will hopefully help future modelers
better represent and protect these valuable resources.
5.2 Additional Findings
CE-QUAL-W2 has been used on over 250 water quality studies in reservoirs
located worldwide (www.ce.pdx.edu/w2). This shows that CE-QUAL-W2 is capable
of accurately modeling waterbodies subject to many different climates. The results of
this model add to the reliability of CE-QUAL-W2 by capturing the behavior of
Elephant Butte which lies in the arid southwest.
An interesting additional finding during this study was the effect of
evaporation on calibration. Because Elephant Butte is located in the arid Southwest
Desert, evaporation was closely examined. A sensitivity analysis was performed to
investigate the effect of adjusting the coefficients tied to evaporation in the model.
This study found that based on three factors, 1) volume of evaporation 2) effect on
temperature and 3) effect on model run times, coefficients similar to the default
coefficients worked best. This adds further evidence to the fact that CE-QUAL-W2 is
able to accurately represent waterbodies in various conditions with little or no
adjustment to default coefficients. The evaporation coefficients were adjusted slightly
by increasing the base rate of evaporation. This was anticipated due to the location
and climate of Elephant Butte.
46

5.3 Potential Application of Results
There are many TMDL studies being conducted on reservoirs throughout the
country. Vast amounts of data are collected and organized in this process to determine
how to best protect designated water uses. When large sets of data are available it
becomes more feasible to construct a computer model. Using a model such as CE-
QUAL-W2 with multiple algal groups in conjunction with other studies can add depth
to the results of a TMDL report.
5.4 Potential Future Research
The results from this research have opened up many options for research that
can be investigated or developed more fully. Proposed options for future research
include the following topics.
This model used a rudimentary representation of non-point source flow to the
reservoir. The non-point source (or distributed tributary file) in the Elephant Butte
model represented bank storage to and from the reservoir and seasonal storm runoff.
This simple representation was applied because these flows were comparatively small
to the inflow over the course of the simulation. Future research could consist of using
a runoff model to develop and calibrate storm hydrographs and assign the flows as
seasonal tributaries to the reservoir. Tributaries enter the model at one point instead of
being distributed according to surface area over the entire model. Another opportunity
for research involves refining how constituents are introduced through non-point
sources. Currently the use of HSPF (Hydrological Simulation Program – Fortran) is
being explored to more reliably create non-point source loadings to be used in CE-
47

QUAL-W2 based on hydrologic conditions, land use, soil type and other parameters.
The results from HSPF can then be introduced into the model through the distributed
tributary constituent inflow file. Adding these refinements to the non-point sources in
the model will allow for more accurate results by further minimizing the error that
enters the model.
The results achieved on understanding the behavior of algae in this research
can be investigated further. The succession of algae in this study was done
qualitatively not quantitatively. A quantitative analysis can be conducted by
developing relationships between chlorophyll-a concentrations and the dry weight of
biomass calculated by the model. This will allow the calibration of biomass as well as
timing and relative bloom size.
48

6 References
BASINS (2004). “EPA Fact Sheet: Better Assessment Science Integrating point and
Nonpoint Sources, Version 3.” Retrieved February 2005, from Environmental
Protection Agency, Water Science Web site:
http://www.epa.gov/waterscience/basins/v3-1fs.pdf
Bowen, J.D. (1999) “Calibration Performance of a Two-Dimensional, Laterally-
Averaged Eutrophication Model of a Partial Mixed Estuary.” Part of
Proceedings of the 6th International Estuarine and Coastal Modeling
Conference, Reston, VA:ASCE, 0-7844-0504-2, pg. 1299.
Bowie, G.L., et al. (1985). “Rates, Constants and Kinetic Formulations in Surface
Water Quality Modeling (Second Edition).” EPA/600/3-85-040, US
Environmental Protection Agency, Washington, D.C.
Cole, T.M., and S.A. Wells (2002). “CE-QUAL-W2: A two-dimensional, laterally
averaged, Hydrodynamic and Water Quality Model, Version 3.1,” Instruction
Report EL-2002-1, US Army Engineering and Research Development Center,
Vicksburg, MS.
Cole, T.M (2004). “Water Balance Utility.” Download provided along with CE-
QUAL-W2 model. Retrieved September 2004, from CE-QUAL-W2 Web site:
http://www.ce.pdx.edu/w2/
49

Cusimano, B. (2003). “Response to comments on Draft Report: Spokane River and
Lake Spokane (Long Lake) Pollutant Loading Assessment for Protecting
Dissolved Oxygen.” Washington State Department of Ecology.
Edinger, J.E. (2004). “W2Met” Retreived July 2004, from J.E. Edinger Assosicates,
Inc. Web site: http://www.jeeai.com/Software-W2.htm#W2Met
Elephant Butte (2004) “Elephant Butte Lake” Retrieved May 2004, from the Truth
or Consequences Web site:
http://www.truthorconsequencesnm.net/eb_lake.htm
Flowers, J.D., et al. (2001) “Water Quality Modeling of Lake Waco Using CE-
QUAL-W2 for Assessment of Phosphorus Control Strategies.” Texas Institute
for Applied Environmental Research. Tartleton State University.
NCDC (2003). Precipitation data was retrieved July 2003 from the NCDC Web site:
http://www.ncdc.noaa.gov/servlets/ULCD
New Mexico Water Quality Control Commision. (2002). “Water Quality and Water
Pollution Control in New Mexico”. Prepared for submission to the Congress
of the United States pursuant to Section 305(b) of the Federal Clean Water
Act.
Miller, Jerry (2005). United States Bureau of Reclamation, Salt Lake City Office,
Water Quality Group. Personal communication.
PSOMAS. (2002). “Deer Creek Reservior Drainage TMDL Study”. Prepared for
Utah Department of Environmental Quality – Division of Water Quality. By
PSOMAS, Salt Lake City, UT.
50

S.S. Papadolulos & Associates, Inc. (2000). “Middle Rio Grande Water Supply
Study”. Prepared for US Army Corps of Engineers Albuquerque District and
New Mexico Interstate Stream Commision. By S.S. Papadopulos &
Associates, Inc., Boulder, CO.
UNM (2005), “New Mexico Statistical Abstract Summaries” Retrieved February
2005, from The University of New Mexico Web site:
http://www.unm.edu/~bber/statabst/toursumm.htm
WASP (2005). “Water Quality Analysis Simulation Program.” Retrieved February
2005, from Environmental Protection Agency, Water Science Web site:
http://www.epa.gov/athens/wwqtsc/WASP.pdf
Zison, S.W., et al. (1978). “Rates, Constants and Kinetic Formulations in Surface
Water Quality Modeling.” EPA/600/3-78/105, US Environmental Protection
Agency, Washington, D.C.
51