alessio fusco, philippe van kerm - gini-research.org · cumulative disadvantage and...
TRANSCRIPT

GROWING INEQUALITIES AND THEIR IMPACTS IN LUXEMBOURG
Alessio Fusco, Philippe Van Kerm
Aigul Alieva, Luna Bellani, Fanny Etienne-Robert,
Anne-Catherine Guio, Iryna Kyzyma, Kristell Leduc,
Philippe Liégeois, Maria Noel Pi Alperin, Anne
Reinstadler, Eva Sierminska, Denisa Sologon, Patrick
Thill, Marie Valentova, Bogdan Voicu
April 2013

GINI Country Report Luxembourg

GINI Country Report Luxembourg
Table of Contents
Executive summary ................................................................................................................................. 1
1. Introduction ......................................................................................................................................... 4
1.1 Economic Context................................................................................................................. 4
1.2. Domestic labour market and demographic challenges ....................................................... 6
1.3. What about inequality? ....................................................................................................... 9
2. The nature of inequality and its development over time ................................................................. 10
2.1. Has inequality grown? ....................................................................................................... 10
2.1.1. Household income inequality ........................................................................... 10
2.1.2. Wealth inequality .............................................................................................. 14
2.1.3. Labour market inequality .................................................................................. 17
2.1.4. Educational inequality ....................................................................................... 29
2.2. Whom it has affected ........................................................................................................ 33
2.3. Interdependence between various inequalities ............................................................... 35
2.4. Why has inequality grown? ............................................................................................... 35
2.5. Conclusions ........................................................................................................................ 37
3. The Social Impacts of Inequality ........................................................................................................ 38
3.1. Introduction ....................................................................................................................... 38
3.2. Patterns and trends in material deprivation ..................................................................... 38
3.3. Cumulative disadvantage and multidimensional measures of poverty and social exclusion .................................................................................................................................................. 42
3.4. Indicators of social cohesion ............................................................................................. 47
3.5. Family formation and breakdown, lone parenthood, fertility .......................................... 47
3.6. Health indicators ............................................................................................................... 51
3.7. Housing tenure .................................................................................................................. 58
3.8. Crime and punishment ...................................................................................................... 60
3.9. Subjective measures of well-being, satisfaction, ‘happiness’ ........................................... 61
3.10. Intergenerational mobility in education and occupation ............................................... 63
3.11. Conclusions ...................................................................................................................... 70
4. Political and cultural impacts ............................................................................................................ 72
4.1. Introduction ....................................................................................................................... 72
4.2. Political and civic participation .......................................................................................... 72
4.3. Trust in others and in institutions ..................................................................................... 79
4.4. Political values and legitimacy .......................................................................................... 83
4.5. Attitudes to social policy and welfare state ...................................................................... 87

GINI Country Report Luxembourg
4.6. Conclusions ........................................................................................................................ 89
5. The effectiveness of policies in combating inequality ...................................................................... 91
5.1. introduction ....................................................................................................................... 91
5.2. Labour income ................................................................................................................... 91
5.3. Taxation ............................................................................................................................. 95
5.4. Social expenditures ........................................................................................................... 99
5.5. Education ......................................................................................................................... 104
5.6. Conclusions ...................................................................................................................... 106
Conclusion ........................................................................................................................................... 108
References ........................................................................................................................................... 109
Annex ................................................................................................................................................... 115

GINI Country Report Luxembourg
List of Figures
Figure 1.1: Economic growth and public expenditure balance (in % of GDP) ......................................... 6
Figure 1.2: Evolution of employment in Luxembourg between 1975 and 2012 .................................... 7
Figure 1.3: Age pyramid of the wage earners in Luxembourg in 1994 and 2011 by category of
workers. ................................................................................................................................................... 9
Figure 2.1. Income inequality 1985 to 2010 (Gini coefficient) .............................................................. 12
Figure 2.2: Asset and debt ratios across the wealth distribution. ........................................................ 16
Figure 2.3: Average wealth levels by education and immigrant status ................................................ 16
Figure 2.4. Average inheritance across net worth deciles .................................................................... 17
Figure 2.5: Evolution between 1983 and 2011 of employment rates by age and gender .................... 18
Figure 2.6: Evolution between 1983 and 2011 of part-time employment (percentage of the total
employment for women in %) in Luxembourg, neighbouring countries and EU27. ............................. 19
Figure 2.7: Employment rates by nationality and sex (15-64 years old) ............................................... 20
Figure 2.8: Employment rates by educational attainment and sex ...................................................... 21
Figure 2.9: Evolution between 1983 and 2011 of the unemployment rates by gender (%) ................. 22
Figure 2.10: Evolution between 1983 and 2011 of the unemployment rates by age for Luxembourg
(%) .......................................................................................................................................................... 22
Figure 2.11: Evolution between 1992 and 2011 of the unemployment rates by the highest level of
education attained (%) .......................................................................................................................... 23
Figure 2.12: Population living in jobless households by age group and gender (%) ............................. 24
Figure 2.13: Evolution of overall wage inequality and aggregated within-groups (Residents and Cross-
borders) inequality (Theil index) ........................................................................................................... 25
Figure 2.14: Evolution of the within-residents and within-cross-borders wage inequality (Theil index)
............................................................................................................................................................... 26
Figure 2.15: Evolution of the between-groups (Residents versus Cross-borders) wage inequality (Theil
index) ..................................................................................................................................................... 26
Figure 2.16: Evolution of overall wage inequality and aggregated within-groups (Nationals,
Immigrants and Cross-borders) inequality (Theil index) ....................................................................... 27

GINI Country Report Luxembourg
Figure 2.17: Evolution of the within-nationals, within-immigrants and within-cross-borders wage
inequality (Theil index) .......................................................................................................................... 27
Figure 2.18: Evolution of between-groups (Nationals, Immigrants and Cross-borders) wage inequality
............................................................................................................................................................... 28
Figure 2.19: Trends in highest educational attainment: 1985-2010 ..................................................... 30
Figure 2.20. Trends in highest educational attainment among foreign and native population: 1985-
2010 ....................................................................................................................................................... 31
Figure 2.21. Proportion of variance in PISA 2009 test explained by social, cultural, and educational
resources of family ................................................................................................................................ 32
Figure 2.22. Trends of between and within group inequality by subgroups ........................................ 34
Figure 3.1: Standard and severe material deprivation rates, 2003-2010 ............................................. 40
Figure 3.2: Trends in individual items, 2003-2010 ................................................................................ 41
Figure 3.3: Some major risk factors of material deprivation (deprivation rates, %), 2010 ................... 42
Figure 3.4: Europe 2020, Population at-risk-of poverty and social exclusion (AROPE), total and by
subcomponents, thousands of people, 2005-2010 ............................................................................... 43
Figure 3.5: Europe 2020, Population at-risk-of poverty and social exclusion (AROPE), total by
education level, 2010 ............................................................................................................................ 44
Figure 3.6: Europe 2020, Population at-risk-of poverty and social exclusion (AROPE), total by
citizenship, 2010 .................................................................................................................................... 44
Figure 3.7: Severe housing deprivation rate (%), EU-27 and Luxembourg, 2005-2010 ........................ 45
Figure 3.8: Severe housing deprivation rate (%) by age group, tenure status and income poverty
status, 2010 ........................................................................................................................................... 45
Figure 3.9: Overcrowding rates (%), EU-27 and Luxembourg, 2005-2010 ............................................ 46
Figure 3.10: Overcrowding rates (%) by household type and income poverty status, 2010 ................ 46
Figure 3.11: Total fertility rate, 1967-2008 ........................................................................................... 47
Figure 3.12: Mother's mean age at childbirth ....................................................................................... 48
Figure 3.13: Share of births outside marriage, 1960 - 2011 .................................................................. 49
Figure 3.14: Share of single-parent families, 2003-2010 ...................................................................... 50

GINI Country Report Luxembourg
Figure 3.15: Number of marriages and divorces, 1960 - 2010 .............................................................. 50
Figure 3.16: Life expectancy at birth by sex, 1980-2010 ....................................................................... 51
Figure 3.17: Healthy life expectancy at birth, by sex ............................................................................ 52
Figure 3.18: Number of death per 100 000 residents ........................................................................... 53
Figure 3.19: Perceived health status by income quintile ...................................................................... 54
Figure 3.20: Perceived health status by sex .......................................................................................... 54
Figure 3.21: Perceived health status by age ......................................................................................... 55
Figure 3.22: Percentage of population with overweight or obese ....................................................... 55
Figure 3.23: Percentage of population with overweight or obese by activity, 2008 ............................ 56
Figure 3.24: Percentage of population with overweight or obese by education level ......................... 57
Figure 3.25: Percentage of population with overweight or obese by nationality ................................ 57
Figure 3.26: Consumption of tobacco ................................................................................................... 58
Figure 3.27: High housing costs rates (%), EU-27 and Luxembourg, 2005-2010 .................................. 59
Figure 3.28: High housing costs rates (%), by tenure status and income poverty status, Luxembourg,
2010 ....................................................................................................................................................... 60
Figure 3.29: Crimes recorded by the police, 1998-2009 ....................................................................... 60
Figure 3.30: Prison population units, 1998-2009 .................................................................................. 61
Figure 3.31: Feeling of happiness in Luxembourg, percentages ........................................................... 62
Figure 3.32: Life satisfaction in Luxembourg, percentages ................................................................... 63
Figure 4.1: Voter turnout in national elections ..................................................................................... 73
Figure 4.2: Voter turnout in European elections .................................................................................. 73
Figure 4.3: Dynamics of voting and left-right positioning ..................................................................... 75
Figure 4.4: Participation and collective bargaining coverage of labour unions, as percentages from
total number of wage and salary earners ............................................................................................. 76
Figure 4.5: Participation in protest actions: the share of those that have already participated and the
percentage of those who would never participate: 1989, 1999, and 2008 .......................................... 78
Figure 4.6: Dynamics of Social Trust...................................................................................................... 80

GINI Country Report Luxembourg
Figure 4.7: Dynamics in confidence in institutions, 1998-2011: The political system .......................... 82
Figure 4.8: Dynamics in confidence in institutions, 1998-2011: other institutions .............................. 82
Figure 4.9: Support for the EU membership ......................................................................................... 85
Figure 4.10: Attitudes towards immigrants .......................................................................................... 86
Figure 4.11: Perception of need in Luxembourg, percentages ............................................................. 87
Figure 4.12: Proportion of Luxembourg respondents who mentioned laziness and lack of willpower as
the most important reason why people are in need by education, percentages ................................. 88
Figure 4.13: Attitudes toward redistribution and state responsibility (mean response over 10-point
scale) ...................................................................................................................................................... 89
Figure 5.1. Minimum wages relative to mean and median wages of full-time workers ...................... 95
Figure 5.2. Share of wage-earners (excluding civil servants) earning the minimum wage ................... 95
Figure 5.3: Tax revenue as % of GDP, by source ................................................................................... 96
Figure 5.4. Public social expenditures, by function, as a percentage of GDP – Luxembourg 1980 –
2007 ....................................................................................................................................................... 99
Figure 5.5: Cash public social expenditure, by function, % GDP ......................................................... 100
Figure 5.6: In kind public social expenditure, by function, % GDP ...................................................... 101
Figure 5.7 At risk of poverty rates, before and after social transfers, 1995-2010 .............................. 103
Figure 5.8. Public spending on education (% of GDP) ......................................................................... 104
Figure A1: distribution of education level by cohorts ......................................................................... 116
Figure A.2. Education transition probabilities by gender and cohort ................................................. 119
Figure A.3: Education transition probabilities by migration status for female of the youngest cohort
and the cohort born in 1946-1957 ...................................................................................................... 122
GINI Country Report Luxembourg
List of Tables
Table 2.1: Income inequality 1985 to 2010 ........................................................................................... 13
Table 2.2: Decomposition of income inequality by income sources (1991, 2000) ............................... 14
Table 2.3: Wealth distribution statistics ................................................................................................ 15
Table 3.1: Average size of households in Luxembourg, 1960 - 2001 .................................................... 49
Table 3.2: Distribution of Households, by tenure status ...................................................................... 59
Table 3.3: Transition Matrices by Gender (Whole sample) - Education ............................................... 64
Table 3.4: Indicators of mobility by gender and cohort - Education ..................................................... 65
Table 3.5: Indicators of mobility by gender and migration status - Education ..................................... 66
Table 3.6: Transition Matrices by Gender (whole sample) - Occupation .............................................. 68
Table 3.7: Indicators of mobility by gender and cohort - occupation ................................................... 69
Table 3.8: Indicators of mobility by gender and migration status - occupation ................................... 70
Table 4.1: Membership in different types of civic associations in Luxembourg: 1975-2008.
(percentages of total population) ......................................................................................................... 77
Table 5.1: Tax revenue, by source, in Luxembourg and neighbouring countries (1990, 2000 and 2010)
............................................................................................................................................................... 97
Table A.1: Evolution between 1983 and 2011 of employment rates by age and gender ................... 115
Table A2: Theil index (Generalised entropy index (parameter = 1)) decomposition by subgroups ... 117
Table A2 (continued): Theil index (Generalised entropy index (parameter = 1)) decomposition by
subgroups ............................................................................................................................................ 118
Table A3: Transition Matrices by Gender (Whole sample), with highest educated parent ................ 120
Table A4: Indicators of mobility by gender and cohort, with highest educated parent ..................... 120
Table A.5: Education transition probabilities by gender and migration status................................... 121
Table A6: Indicators of mobility by gender and migration status, with highest educated parent ..... 123
Table A7: Transition Matrices by Gender (whole sample), with highest educated parent ................ 124
Table A8: Indicators of mobility by gender and cohort, with highest educated parent ..................... 124
Table A9: Indicators of mobility by gender and migration status, with highest educated parent ..... 125


Executive summary
Luxembourg experienced remarkable economic performance and employment growth since the
middle of the 1980s. Based on the development of the financial sector, this growth benefited
massively from the contribution of immigrants and cross-border workers to the domestic labour
force. High economic growth led to a rapid improvement of the overall living standard of the resident
population. During the same period, income inequality increased too, albeit modestly. Even if the
country can still be considered a low inequality country by international standards, this trend is a
potential source of concern.
Several factors may explain the increase in income inequality. Income source decomposition analysis
reveals that the relative contribution of paid employment income to total inequality increased over
time. This reflects major labour market evolutions: (i) the expansion of the high-wage financial
sector, (ii) an increase in the female employment rate, mainly married women, as well as (iii) an
increase in earnings inequality. The recent upward trend in the unemployment rate also coincided
with a period of increasing inequality. Finally, the analysis of education inequalities shows that for
both men and women the share of highly educated increased while the share of low educated
remained stable. This changing educational inequalities and the change in skills required by the
structural change from a heavy industry based society to a high value-added service society also
influenced income inequality.
The evolution of institutional characteristics and social policies may have also affected the income
distribution. The Luxembourg labour market is one of the most regulated of the OECD countries with
a strong regulatory framework within the Luxembourg ‘social model’, that is a strong social dialogue
between unions, employers’ representatives and the government. There is an automatic indexation
of salaries to inflation that applies to all wages and to the minimum wage. The minimum wage
relative to average wages also increased over time contrary to what happened in other countries.
This feature of the labour market, together with the generous welfare state (in particular the pension
system and family-related policies) contributed to raise the floor of the income distribution and
therefore to contribute ‘from the bottom’ to achieve a comparatively low level of inequality. On the
other hand trends in a relatively low personal income taxation since the 1980s generally benefited
higher income recipients.

GINI Country Report Luxembourg
Page 2
The increase in inequality does not seem to have had a strong impact on most of the social outcomes
considered in this project. Material deprivation in Luxembourg is still among the lowest in Europe,
the level of life satisfaction is stable and the overall level of health has improved (except for
overweight). An exception is the level of criminality and of the population imprisoned which both
recently increased. By and large, the positive effects on social outcomes due to the improvement of
overall living standards seem to have prevailed compared to the negative effects of increasing
inequality.
Increasing income inequality seems also mostly unrelated to political and cultural issues. Political and
civic participation, social trust and confidence in institutions, support for extreme parties changed
their levels or maintained to the same intensity independent of changes in income distribution, in
education attainment, or of the increasing share of immigrants. The same is valid for EU approval
and the attitudes towards immigrants. The main driver here seems to be the perceived prosperity,
which remained stable disregarding inequality dynamics and increasing share of immigrants in the
country. In fact, the immigrants, mostly European and better educated than the immigrants to other
European countries, may have also prevented deterioration of social cohesion and support for
democracy which might have been triggered by the slight increase in inequality levels.

GINI Country Report Luxembourg
Page 3

GINI Country Report Luxembourg
Page 4
1. Introduction1
With a territory of 82 km from North to South and 57 km from East to West for a total surface of
2586 km2, Luxembourg is the second smallest country in Europe. Its population increased
substantially, from 365 thousands in 1981 to 525 thousands in 2012 (Zahlen, 2012a). By contrast with
its small size, Luxembourg is a rich country that experienced remarkable economic performance and
employment growth since the middle of the 1980s. Based on the development of the financial
sector, this growth was fuelled by a large contribution of migrant and cross-border workers to the
domestic labour force. Luxembourg is a country with a low level of inequality compared to other
European countries (Allegrezza et al, 2004; Osier, 2012). However, according to the OECD (2012) the
level of inequality increased between the 1980s and 2010. The aim of this report to the GINI project
is to explain how the specificity of Luxembourg shaped the evolution of inequality and how in turn
inequality affected social, political and cultural outcomes in Luxembourg.
1.1 Economic Context
Since the end of World War II (WWII), Luxembourg has been on a remarkable positive growth trend
which led the country to be one with the highest Gross Domestic Product (GDP) per capita in
international rankings (Zahlen, 2012d).2 This trend was neither linear nor based on a unique reason
of economic success. Two main sources of wealth creation characterised the country. First, directly
following WWII, the boom of the steel industry was the main engine of growth. This period was
stopped with the first oil crisis which was followed by a decline in the economic growth. This difficult
1 This report was prepared by CEPS/INSTEAD staff for the ‘Growing Inequalities’ Impact (GINI)’ FP7 research project funded by the European Commission. This report was also supported by core funding for CEPS/INSTEAD from the Ministry of Higher Education and Research of Luxembourg and by the Luxembourg Fonds National de la Recherche through funding of FNR CORE projects PersiPov for A. Fusco, WealthPort for E. Sierminska and InWin for P. Van Kerm and through AFR Doc and Post-Doc Grants for L. Bellani, I. Kyzyma and D. Sologon. Most of the report writing and data collection were undertaken in 2012. The authors would like to thank Tom Dominique, John Haas, Vincent Hildebrand, Jérôme Hury, Serge Krippler, Julien Licheron, Caroline Lieffrig, Guillaume Osier, Günther Schmaus, Marianne Scholl, Michèle Wolter and Paul Zahlen for their help in gathering statistical or background information or retrieving them from miscellaneous data sources. In addition, comments by Jacques Brosius, Reinhard Pollak, Donald Williams, Sonja Zmerli and the GINI core teams are gratefully acknowledged. None of these persons should, however, be held responsible in any way for the present contents. 2 This has not always been the case. As underlined in many studies such as Wey (2011), Luxembourg was one of the poorest country in Europe at the beginning of the XXth century. As for James Newcomer, “the inherited nature of Luxembourg is rural and agricultural. The rich and sophisticated state of the 1980s is a contradiction of 1900 years of its history” (quoted by Wey, 2011:11).

GINI Country Report Luxembourg
Page 5
period was the occasion of the introduction of the “Luxembourg social model” – the ‘tripartite’ – in
order to look for consensual solution to the crisis. It also constituted the basis of the structural
change that was about to happen through the transformation of an industry-based economy into a
services-oriented one.
After the restructuration of the steel industry from the 1980s onwards, the primary engine of
economic growth in Luxembourg was the financial sector, together with other service activities (e.g.,
in ICTs). During this period, the economic performance of Luxembourg was remarkable, reaching a
real GDP per capita growth of 8.5% in 1991, 1999 and 2000 (see Figure 1.1). Between 1985 and 2007,
the average annual growth in Luxembourg (5.3%) was more than twice as high as that of the EU15
area (2.3%) (Zahlen, 2012d).3 According to International Monetary Fund (2000), Schuller (2002) or
Annaert (2004), the key factors explaining that economic success are a central location in Europe, a
stable political and social environment and a multilingual and skilled domestic labour force. In
addition, according to Annaert (2004), the successive governments put in place a “favourable fiscal
and regulatory framework” that attracted foreign financial institutions and investors, laying the
foundations for the creation of the international financial centre for which Luxembourg is known.
This positive situation created a virtuous circle (Annaert, 2004): high growth generated high revenues
from corporate tax which allowed Luxembourg to maintain low levels of income taxation, to contain
real labour costs to acceptable levels and to keep excellent public finances (see Figure 1.1). In turn
this constituted the roots for a generous welfare state.
However, this almost idyllic situation relied heavily on the worldwide development of the financial
sector and led Luxembourg to be strongly exposed to the recent international financial crisis. The
‘Great Recession’ led to a contraction of the GDP, an increase in unemployment and less favourable
fiscal revenues contributing to a recent public deficit. Nevertheless, over the whole period covered
by Figure 1.1., the social security administration displays a positive balance. This favourable financial
situation is mainly due to the continuous growth of the internal labour market as will be explained
below. Given the small size of the country, its high openness as well as its specialization in “niches
economy” vulnerable to the international environment, the question about the ability of the country
to keep the high growth rates of the pre-crisis period is raised along with potential threats to the
sustainability of the currently generous welfare state (OECD, 2010a, 2012).
3 The average annual growth over the period 2008-2011 has however been null, just as the EU15 average (Zahlen, 2012a).

GINI Country Report Luxembourg
Page 6
Figure 1.1: Economic growth and public expenditure balance (in % of GDP)
Source: IGSS (2012a:17)
1.2. Domestic labour market and demographic challenges
In addition to external factors such as the recent crisis, maintaining a high growth rate is also made
more uncertain due to internal factors related to the labour market and the demographic evolutions
of Luxembourg. Following the crisis in the steel industry, in the 1970s, Luxembourg experienced a
phase of stagnation and decline of its employment. It is only since the mid-1980s that employment
has known an exceptional growth with significant structural changes. Labour demand in the industry
sector declined while the service sector began an exceptional development. The domestic labour
supply quickly did not match labour demand: there were not enough Luxembourg or foreign national
resident workers. To deal with this shortage, the country needed to attract foreign labour and, since
1985, the share of cross-border workers (workers living in France, Belgium and Germany) has
continually increased (see Figure 1.2.).
Luxembourg now has an unusual domestic labour force composed of three categories of workers:
Luxembourg nationals, foreign national resident workers and non-resident cross-border workers
(Berger, 2005; Brosius and Ray, 2012). The share of Luxembourg national resident workers in the
total active population decreased continuously since the 80s. This group represented 45.8% of the
active population in March 1994 and dropped to 29.3% in March 2011.
-6
-4
-2
0
2
4
6
8
101
99
0
19
91
19
92
19
93
19
94
19
95
19
96
19
97
19
98
19
99
20
00
20
01
20
02
20
03
20
04
20
05
20
06
20
07
20
08
20
09
20
10
20
11
Central admin. Local admin. Social security admin. Economic growth

GINI Country Report Luxembourg
Page 7
Figure 1.2: Evolution of employment in Luxembourg between 1975 and 2012
Source: IGSS/STATEC.
The high level of migration is one of the main distinguishing characteristics of Luxembourg. The share
of foreign national resident workers in total employment has been fairly constant between 1994 and
2011 (28.1% and 26.9%). The percentage of foreigners in relation to the total population of
Luxembourg is the highest among OECD countries. Between 1981 and 2011, the share of foreign
nationals in the resident population increased from 26.3% to 43% (Zahlen, 2012b). Different types of
migrants joined the country at different moments in time. As mentioned by Alieva (2010),
Luxembourg had (as many other European Union (EU) countries) an active labour migration policy
until the 1970s, which resulted in high inflow of low-skilled migrants mainly from Southern Europe.4
This has formed a large proportion of today’s second- and third-generation immigrant population in
Europe. Finally, there is an intensified highly-skilled migration, which followed the development of
the financial sector, the installation of EU institutions and more recently, the European Union
enlargement (see also Amétépé and Hartmann-Hirsch, 2011). Migrants are nowadays mainly
4 The arrival of foreign labour force is directly related to the industrial development in the second half of the XIXth century. In the first place, Luxembourg hired German, Belgian or French workers but since 1892 Italian workers massively arrived to the Grand Duchy. Another wave of Italian workers appeared after the WWII. Since 1960, an important migration of Portuguese can be observed and in the end of 1980s they represent the first nationality among all foreign residents. This is partly due to the fact that Portuguese came with all their family in Luxembourg thanks to the new legislation regarding family reunification, while Italians used to come alone and often get a fixed-term contract of employment (less than 1 year).
0
50
100
150
200
250
300
350
400
1975197719791981198319851987198919911993199519971999200120032005200720092011
In T
ho
usa
nd
s
Total National resident workers Cross-border workers

GINI Country Report Luxembourg
Page 8
European, young and highly skilled. All these flows have generated a highly heterogeneous
immigrant population with very diverse earnings capacity.5
Finally, the share of cross-border workers commuting to the Grand Duchy increased over time. In
March 1994, one worker out of four (26.1%) was a cross-border worker. In the end of the 2000s, they
represented 43.8% of domestic employment. In 2010, the French are the largest group (49 %),
followed by Belgians (26 %) and Germans (24 %). It is important to note in the context of this report –
which focuses on household income inequality – that cross-border workers do not directly impact on
standard measures of inequality as they are not covered by the sampling frame of national survey
data on income: it is inequality among residents that is considered. However, cross-border workers
indirectly impact through their contribution to the output production of the country and their
participation to the tax-benefit system as we discuss later in this report.
The structure of the domestic labour market raises questions regarding the sustainability of the
current situation. When entering the domestic labour market, immigrants and cross-border workers
were usually younger than natives (see Figure 1.3). The shape of the age pyramids of the
economically active population has changed between 1994 and 2011 with a clear shrinking of
generations of young workers below 35 years old. Their share has become proportionally less large
than their elders, whilst the proportion of older workers has increased. However, since 1994, cross-
border workers have played a dominant role on the Luxembourg labour market, and their strong
increase was all the more important as they tend to arrive young.6 Therefore, unlike its bordering
countries, the sustained supply of a young foreign and external labour force allowed Luxembourg to
slow down the ageing of its active population. In addition, the participation of migrants and cross-
border workers to the labour market contributed to a favourable dependency ratio between
contributors and beneficiaries to the tax-redistribution system that led to a positive social security
balance (see Figure 1.1). The ageing of the working population will necessarily increase the number
of pensioners in the years to come and raise the question of the sustainability of the current system
without drastic socio-fiscal changes.
5 In between these two waves, Alieva (2010) mentioned in the late 80s a humanitarian migration wave that followed the changes in political regimes across former communist Eastern Europe. The profile of these immigrants is mixed and includes highly-educated professional individuals and families, as well as those without even basic education. 6 Cross-border workers in Luxembourg are younger than the labour force of their country. In 2003, whilst workers in France had a mean age of 40.8 years old (40.4 in Belgium and 40.8 in Germany), French cross-border workers in Luxembourg were on average 35.7 years old (36.1 for Belgian cross-border workers and 37.2 years for German cross-border workers).

GINI Country Report Luxembourg
Page 9
Figure 1.3: Age pyramid of the wage earners in Luxembourg in 1994 and 2011 by category of workers.
Source: IGSS files, March 1994 and 2011, calculation CEPS/INSTEAD
Population: Wage earners
1.3. What about inequality?
The high economic growth in Luxembourg over the period 1985-2010 led to a massive increase of
average living standard of the resident population (Osier, 2012).7 The median net income per adult
equivalent is now the highest among European countries. But according to the OECD (2011a, 2012),
during the same period, income inequality increased too.8 Even if the level of inequality is still low by
international standards, this trend is a potential source of concern if, as argued, e.g., in Wilkinson
and Pickett (2009) inequality has had detrimental impacts on individual outcomes such as health or
education or created the conditions for insecurity and distrust that might lead to social or political
conflict.
The purpose of this report to the GINI project is to further document trends in inequality across
various dimensions and to link these trends to social, cultural and political developments. Following
the common template for GINI country reports, Chapter 2 of this report documents trends in several
dimensions of inequality. Chapter 3 considers the potential social impacts of the observed inequality
trends, Chapter 4 considers political and cultural impacts Chapter 5 concludes with a discussion of
the effectiveness of policies in combating inequality.
7 The importance of the cross-borders workers in the domestic labour force suggests that the statistics of the GDP per capita might be biased. This is why the Gross National Income statistics is sometimes preferred. According to Statec (2011:112), the GDP per capita in Luxembourg is 150% higher than that of the Euro Area average in 2009 while the GNP per capita is 80% higher in Luxembourg. 8 As discussed supra, the extent of the growth in inequality over the period is, in fact, unclear: issues related to the comparability over time of data collection are likely to account for a significant share of the growth in inequality reported in OECD (2011a). We return to this issue in Chapter 2.

GINI Country Report Luxembourg
Page 10
2. The nature of inequality and its development over time
2.1. Has inequality grown?
2.1.1. Household income inequality
The high economic growth over the period 1985-2010 led to an increase of average living standards.
According to computation from Luxembourg Income Study and PSELL3/EU-SILC data (described
shortly), average household real disposable income (in 2005 prices) increased from 28700 Euros in
1985 to 56700 Euros in 2010; see Table 2.1. The increase in real household average income was
steep between 1985 and 1991, which was a period of high economic growth; it was then regular
between 1991 and 2004, and remained stable afterwards until 2009 before a small decline
afterwards (see also Osier, 2012 or STATEC, 2012). In this section, we examine trends in income
inequality in the same period.
Our main data source is the Socio-Economic Panel “Liewen zu Lëtzebuerg” (PSELL). This
representative household survey is based on the annual collection of data on income and living
conditions of individuals and private households residing in the Grand Duchy of Luxembourg. PSELL
consists of three independent and consecutive panels: PSELL1 (1985-1994), PSELL2 (1995-2002) and
PSELL3/EU-SILC (2003-onwards). In this section, we used the harmonized version of the data
included in the Luxembourg Income Study (LIS) database for the years 1985, 1991, 1994, 1997, 2000
and 2004 and original PSELL3/EU-SILC data for 2010.9 We focus on the whole resident population and
the unit of analysis is the individual. Note that in PSELL1 and PSELL2, only incomes net of income
taxes and social security contributions are recorded so that each component is also net. The
implications are that household disposable income is the sum of net income from labour, net income
from capital and net transfers and the impact of the tax policy on inequality cannot be assessed. By
contrast, both gross amounts and net amounts are collected in PSELL3. In that case, household
disposable income is the sum of gross components minus taxes and social contributions.
The variables we focus on are household factor income, disposable household income and ‘single
adult equivalent’ household income (a.k.a. ‘equivalised’ income). Figure 2.1. displays the evolution of
the Gini inequality index of these three variables while Table 2.1. reports several additional
inequality indices of equivalised income. Factor income includes income from labour and capital. We
9 The first three years are covered by PSELL1, the following two by PSELL2 and the other by PSELL3 (see Allegrezza et al, 2004)

GINI Country Report Luxembourg
Page 11
limit our analysis of this variable to the years 1985-2000 where it was collected net of taxes.
Inequality in net factor income increased by 11% between 1985 and 2000. A first increase occurred
between 1991 and 1994 followed by a more substantial increase between 1994 and 1997 coinciding
with the change of underlying survey dataset and a slight decrease up to 2000. When adding
transfers to factor income, the level of (household disposable income) inequality is greatly reduced
(by 11.8 points in the Gini index for 1985 and 14.5 points in 2000) as transfers are disproportionately
received by households with low income. Inequality in household disposable income was stable
between 1985 and 1994 and then increased between 1994 and 1997. A slight decrease occurred
between 1997 and 2000 followed by an upward trend. Equivalent income is equal to disposable
household income divided by an equivalence scale to account for economies of scale in household
consumption. We use the modified OECD equivalence scale. For all years, inequality in equivalent
income is lower than inequality in disposable income so that the equivalisation process seems to
reduce inequality. It evolved from 12% reduction in 1985 (0.267 to 0.233) to 8% reduction in 2010
(0.301 to 0.276). Inequality in equivalent income was stable between 1985 and 1994 and then
increased between 1994 and 1997. Contrary to household disposable income this was then followed
by a regular upward trend within and between PSELL2 (1997 and 2000) and PSELL3 (2004 and 2010).
In 2004 and 2010, both gross and net amounts were collected. In 2004 (2010), the Gini index for
unequivalised gross income (not reported in the Table) was equal to 0.324 (0.332) compared to
0.296 (0.301) for the unequivalised net income. Hence personal income taxes also reduce inequality
(3 points for the Gini).

GINI Country Report Luxembourg
Page 12
Figure 2.1. Income inequality 1985 to 2010 (Gini coefficient)
Source: LIS (1985-2004) and PSELL3/EU-SILC data (2010), authors’ computation. The underlying data for 1985, 1991 and 1994 is PSELL1; for 1997 and 2000, PSELL2; for 2004 and 2010, PSELL3/EU-SILC. Factor income was collected net of taxes and social contributions for all years except in 2004 and 2010 where gross values were reported. For comparability reasons, inequality in gross factor income is not reported here.
To summarize, between 1985 and 1994, which is the period covered by the PSELL1 dataset,
inequality of disposable household income and equivalised income was stable while inequality in
factor income increased between 1991 and 1994. A substantial increase can be noticed for the three
variables between 1994 (covered by PSELL1) and 1997 (covered by PSELL2). This increase could be
ascribed to the large employment and economic growth that occurred during these years but note
also that no major shocks occurred in the tax-benefit system during that period. Another key
potential explanation is related to measurement issues, rather than substantive factors: differences
in underlying data (PSELL1 vs. PSELL2) are likely associated to variations in the sampling frame, in
data collection methods and/or in details of income components definitions. While income data in
the LIS dataset are constructed according to harmonized definitions, such ex post construction may
not fully control for differences in underlying data collection, especially in that early period of
analysis. Concern about comparability and consistent collection of harmonized income data and the
understanding of its impact on comparisons over time and space is in fact relatively recent.
Conclusions about trends in inequality should therefore more reliably be made from changes within
the three periods covered by different data instruments (the connected points in Figure 2.1) rather
than between the three periods. Between 1997 and 2000, which is the period covered by PSELL2,
inequality in net factor income and household disposable income slightly decreased while inequality
0,384 0,383 0,392
0,434 0,427
0,267 0,268 0,264 0,287 0,283
0,296 0,301
0,233 0,234 0,233
0,259 0,264 0,271 0,276
0,20
0,25
0,30
0,35
0,40
0,45
0,50
19
85
19
91
19
94
19
97
20
00
20
04
20
10
Net factor incomeHousehold disposable incomeEquivalent income (modified OECD equivalence scale)
GINI Country Report Luxembourg
Page 13
in equivalised income increased. A further increase in inequality for household disposable income
and equivalised income occurred when moving from PSELL2-2000 to PSELL3-2004 and afterwards.
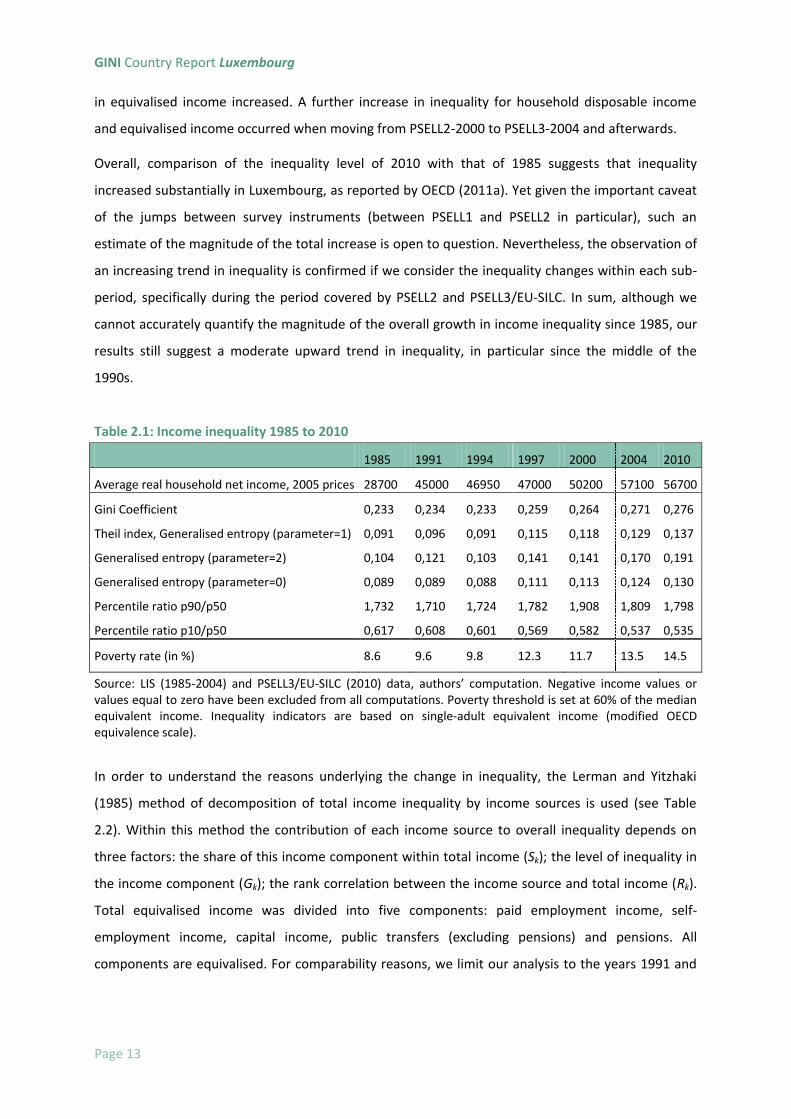
Overall, comparison of the inequality level of 2010 with that of 1985 suggests that inequality
increased substantially in Luxembourg, as reported by OECD (2011a). Yet given the important caveat
of the jumps between survey instruments (between PSELL1 and PSELL2 in particular), such an
estimate of the magnitude of the total increase is open to question. Nevertheless, the observation of
an increasing trend in inequality is confirmed if we consider the inequality changes within each sub-
period, specifically during the period covered by PSELL2 and PSELL3/EU-SILC. In sum, although we
cannot accurately quantify the magnitude of the overall growth in income inequality since 1985, our
results still suggest a moderate upward trend in inequality, in particular since the middle of the
1990s.
Table 2.1: Income inequality 1985 to 2010
1985 1991 1994 1997 2000 2004 2010
Average real household net income, 2005 prices 28700 45000 46950 47000 50200 57100 56700
Gini Coefficient 0,233 0,234 0,233 0,259 0,264 0,271 0,276
Theil index, Generalised entropy (parameter=1) 0,091 0,096 0,091 0,115 0,118 0,129 0,137
Generalised entropy (parameter=2) 0,104 0,121 0,103 0,141 0,141 0,170 0,191
Generalised entropy (parameter=0) 0,089 0,089 0,088 0,111 0,113 0,124 0,130
Percentile ratio p90/p50 1,732 1,710 1,724 1,782 1,908 1,809 1,798
Percentile ratio p10/p50 0,617 0,608 0,601 0,569 0,582 0,537 0,535
Poverty rate (in %) 8.6 9.6 9.8 12.3 11.7 13.5 14.5
Source: LIS (1985-2004) and PSELL3/EU-SILC (2010) data, authors’ computation. Negative income values or values equal to zero have been excluded from all computations. Poverty threshold is set at 60% of the median equivalent income. Inequality indicators are based on single-adult equivalent income (modified OECD equivalence scale).
In order to understand the reasons underlying the change in inequality, the Lerman and Yitzhaki
(1985) method of decomposition of total income inequality by income sources is used (see Table
2.2). Within this method the contribution of each income source to overall inequality depends on
three factors: the share of this income component within total income (Sk); the level of inequality in
the income component (Gk); the rank correlation between the income source and total income (Rk).
Total equivalised income was divided into five components: paid employment income, self-
employment income, capital income, public transfers (excluding pensions) and pensions. All
components are equivalised. For comparability reasons, we limit our analysis to the years 1991 and

GINI Country Report Luxembourg
Page 14
2000 where income components were collected net of taxes and social contributions. This period
covers the main increase in inequality that occurred in Luxembourg.
Table 2.2: Decomposition of income inequality by income sources (1991, 2000)
1991
2000
Sk Gk Rk ACk RCk Sk Gk Rk ACk RCk
Paid employment income 0.64 0.43 0.61 0.17 0.71 0.66 0.47 0.69 0.21 0.80
Self employment income 0.08 0.91 0.42 0.03 0.13 0.04 0.97 0.62 0.03 0.10
Capital income 0.05 0.89 0.65 0.03 0.12 0.04 0.90 0.66 0.02 0.09
Public transfers (excl. Pensions) 0.05 0.63 -0.19 -0.01 -0.03 0.07 0.65 -0.19 -0.01 -0.04
Pension income 0.19 0.75 0.11 0.02 0.07 0.19 0.78 0.08 0.01 0.05
1 0.234
0.234 1
0.264
0.264
Source: LIS data, authors’ computations. Reading guide: In 1991, the share (Sk) of ‘paid employment income’ in total income is 64%. The Gini coefficient of inequality (Gk) of this income source is equal to 0.43 while its rank correlation (Rk) with total income is equal to 0.61. The absolute contribution of this income source to total inequality is equal to 0.17 (ACk=Sk*Gk*Rk) while its relative contribution (ratio between the absolute contribution and the overall Gini coefficient) is 71%.
Equivalised paid employment income contributes the most to inequality in both years. Its relative
contribution to total inequality increased from 71% in 1991 to 80% in 2000. The contribution of this
income source to total inequality is mainly driven by its high income share in both years (64% in 1991
and 66% in 2000). Paid employment income was distributed more unequally in 2000 (0.47) than in
1991 (0.43) and was more directed towards higher income household as can be seen from the higher
rank correlation with total income. The increase in the contribution of paid employment income to
inequality may reflect the expansion of the high-wage financial sector. The relative contribution of
net equivalised self-employment income (13% to 10%), net equivalised capital income (12% to 9%)
and net equivalised pensions (7% to 5%) to total inequality decreased between 1991 and 2000.
Transfers (excluding pensions) play a stronger equalizing role in 2000 than in 1991.
2.1.2. Wealth inequality
Collection of individual-level data on wealth and asset holdings in Luxembourg is very recent. To date
only two data sources exist both collected by CEPS/INSTEAD. The first was collected in 2007 and
contains a limited number of questions measuring financial assets and real estate. Debt was
collected only to the extent it was used to finance the purchase of real estate. The second source of
data was collected in 2010 and 2011 at the request of the Banque Centrale du Luxembourg as part of
the Household Finance and Consumption Survey coordinated by the European Central Bank for all
the euro-zone countries. The survey contains detailed questions on assets, liabilities, as well as

GINI Country Report Luxembourg
Page 15
investment attitudes. Here we focus on the latter to present the most complete results available for
wealth in Luxembourg.
Table 2.3 below gives us an idea of the levels and distribution of the main components of wealth: assets and debt. Net worth in Luxembourg (defined as assets minus liabilities and used interchangeably with the term “wealth”) is quite high if we compare to other countries (Mathae et al, 2012, Sierminska and Doorley 2012). Due to the high level of assets, debt constitutes only about 10% of total assets. The distribution of debt seems to be highly skewed and concentrated at the top of the distribution as indicated by the very low median. Compared to other countries wealth inequality is not extremely high although it is higher than income inequality (Sierminska et al, 2006).
Table 2.3: Wealth distribution statistics
Net worth Assets Debt
Mean 698692 775364 76671
Median 391700 476605 6800
Gini 0.67 0.62 0.77
CV 3.47 2.86 1.92
p90/p10 373.74 157.52 .
p75/p25 14.22 7.58 .
Share
Top 10% 52.07 48.36 55.33
Top 5% 40.70 37.66 35.64
Top 1% 21.95 19.87 11.19
Source: Own calculations based on LU-HFCS 2010/2011. Note: Net worth=Assets-Debt
Over half of net worth and debt and almost half of assets is held by the top 10% richest households.
This is in the average range in comparison to other countries. The top 1% holds 20% of net worth and
assets but only 10% of debt suggesting that debt is concentrated among those below the top 1%.
Another way of looking at the distribution of wealth is to examine the ratio of assets and debt across
the net worth distribution. A ratio greater than one indicates average assets exceed average debts
within the decile. In Figure 2.2. we see a steep increase in the ratio for the richest 10%. Although
they hold a large share of aggregate debt, this constitutes a very small share of their total assets. At
the bottom of the distribution debt exceed assets making this group quite vulnerable.

GINI Country Report Luxembourg
Page 16
0
200000
400000
600000
800000
1000000
No or primary Upper secondary
Net worth
Real estate
Financial assets
Total debt
0
200000
400000
600000
800000
1000000
Natives Immigrants
Figure 2.2: Asset and debt ratios across the wealth distribution.
Source: Own calculations based on LU-HFCS 2010/2011.
In Figure 2.3. we find that the distribution of wealth exhibits a very steep education gradient, which
is driven mostly by real estate (main residence and other real estate property). Financial assets
exceed debt both for the least and the most educated. Households with secondary education have
the highest average level of debt compared to financial assets suggesting they do not have enough
liquid assets to cover their debts in case of unexpected shocks.
Figure 2.3: Average wealth levels by education and immigrant status.
Source: Own calculations based on LU-HFCS 2010/2011.
Immigrants constitute over 40% of the population in Luxembourg and hence, their well-being is
important to the overall well-being of the country. Comparing the wealth levels of the two groups we
find natives have over twice as much as immigrants. Natives have slightly higher levels of debt and
0,7 2,0 1,5 2,4
4,1
7,2
10,9 11,7
20,3
37,8
0
5
10
15
20
25
30
35
40
1 2 3 4 5 6 7 8 9 10

GINI Country Report Luxembourg
Page 17
financial assets. (Immigrant asset holding in a comparative perspective is documented in more detail
in Mathae et al 2011).
Apart from self-made fortunes an important source of wealth are inheritances. In Figure 2.4. we find
the distribution of inheritance across net worth deciles. As suspected the largest share of inheritance
is among the richest households.
Figure 2.4. Average inheritance across net worth deciles
Source: Own calculations based on LU-HFCS 2010/2011.
2.1.3. Labour market inequality
A. Employment
Employment growth in Luxembourg has been impressive during the period 1986 to 2008 which
corresponded to massive inflows of cross-borders workers (see Figure 1.2 in Chapter 1, STATEC, 2011
or Ries, 2012). However, all the comments, figures and tables that follow concern only the “national”
employment. For example, former cross-border workers who have become unemployed are not
present in any of our data.
By age and gender
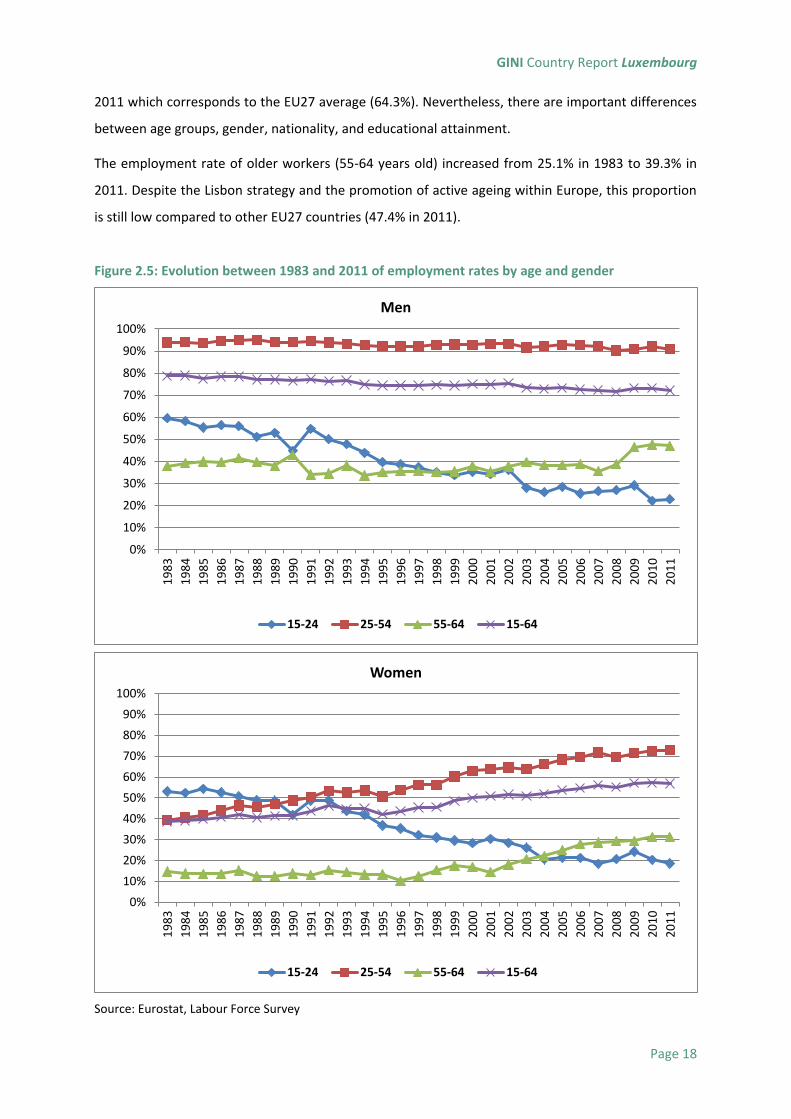
Figure 2.5 reports the evolution of the employment rates by age and gender between 1983 and 2011
on the basis of Labour Force Survey data. Figures for the whole population are reported in Table A1
in Annex 1. The total employment rate of residents has increased from 58.7% in 1983 to 64.6% in
44.539 22.676
62.101 76.706
112.447
165.424
86.986
138.633
214.554
414.256
0
50000
100000
150000
200000
250000
300000
350000
400000
450000
1 2 3 4 5 6 7 8 9 10
GINI Country Report Luxembourg
Page 18
2011 which corresponds to the EU27 average (64.3%). Nevertheless, there are important differences
between age groups, gender, nationality, and educational attainment.
The employment rate of older workers (55-64 years old) increased from 25.1% in 1983 to 39.3% in
2011. Despite the Lisbon strategy and the promotion of active ageing within Europe, this proportion
is still low compared to other EU27 countries (47.4% in 2011).
Figure 2.5: Evolution between 1983 and 2011 of employment rates by age and gender
Source: Eurostat, Labour Force Survey
0%
10%
20%
30%
40%
50%
60%
70%
80%
90%
100%
19
83
19
84
19
85
19
86
19
87
19
88
19
89
19
90
19
91
19
92
19
93
19
94
19
95
19
96
19
97
19
98
19
99
20
00
20
01
20
02
20
03
20
04
20
05
20
06
20
07
20
08
20
09
20
10
20
11
Men
15-24 25-54 55-64 15-64
0%
10%
20%
30%
40%
50%
60%
70%
80%
90%
100%
19
83
19
84
19
85
19
86
19
87
19
88
19
89
19
90
19
91
19
92
19
93
19
94
19
95
19
96
19
97
19
98
19
99
20
00
20
01
20
02
20
03
20
04
20
05
20
06
20
07
20
08
20
09
20
10
20
11
Women
15-24 25-54 55-64 15-64

GINI Country Report Luxembourg
Page 19
The employment rate of young people (15-24 years old) decreased strongly since 1983 (56.3% in
1983 to 20.7% in 2011). This result is not homogenous within the EU27. If some countries
experienced a substantial decrease of the youth employment rate (Netherlands), in other countries
the decrease is weaker (about -40% in Italy and Portugal, -22% in Belgium), while other countries
show an increase (+8% for Denmark, +6% for Germany).
If the employment rate for men has slightly declined during the period, the employment rate of
women increased by 47%, staying below the level of men employment rate: 38.6% in 1983 (78.7%
for men) to 56.9% in 2011 (72.1% for men - see Figure 2.5). But if women are more present on the
labour market, it is partly through part-time jobs. In 2011, 36% of the women have a part-time job
(32% in the EU27 – see Figure 2.6) against 4% for men. As shown by Berger et al (2013), women living
in couples contributed the most to this increase, while the employment rate of single women
remained stable.
Figure 2.6: Evolution between 1983 and 2011 of part-time employment (percentage of the total employment for women in %) in Luxembourg, neighbouring countries and EU27.
Source: Eurostat Labour Force Survey
By nationality
As already mentioned, Luxembourg is a special case in Europe concerning the migrant population,
with a share of 43.2% in 2011 while in other countries of Europe migrants represent usually about 7
to 8% of the resident population. Throughout the period, foreign residents always have a higher
employment rate than national residents (see Figure 2.7). As suggested by Amétépé and Hartmann-
0%
5%
10%
15%
20%
25%
30%
35%
40%
45%
50%
19
83
19
84
19
85
19
86
19
87
19
88
19
89
19
90
19
91
19
92
19
93
19
94
19
95
19
96
19
97
19
98
19
99
20
00
20
01
20
02
20
03
20
04
20
05
20
06
20
07
20
08
20
09
20
10
20
11
Belgium Germany France Luxembourg EU27

GINI Country Report Luxembourg
Page 20
Hirsch (2011) or STATEC (2011), this is mainly due to the fact migration is largely due to labour
motives. There are however substantial differences according to different group of migrants (not
shown in the figures): while migrants (both men and women) from EU27 countries have higher
employment rates than natives, extra-EU27 male (female) migrants have a similar (lower) level of
employment rate compared to their natives counterparts. Amétépé and Hartmann-Hirsch (2011:202-
203) underline that the share of less qualified migrant workers has not increased while the share of
highly qualified foreigners and foreign managers has strongly increased.
Figure 2.7: Employment rates by nationality and sex (15-64 years old)
Source: Eurostat Labour Force Survey
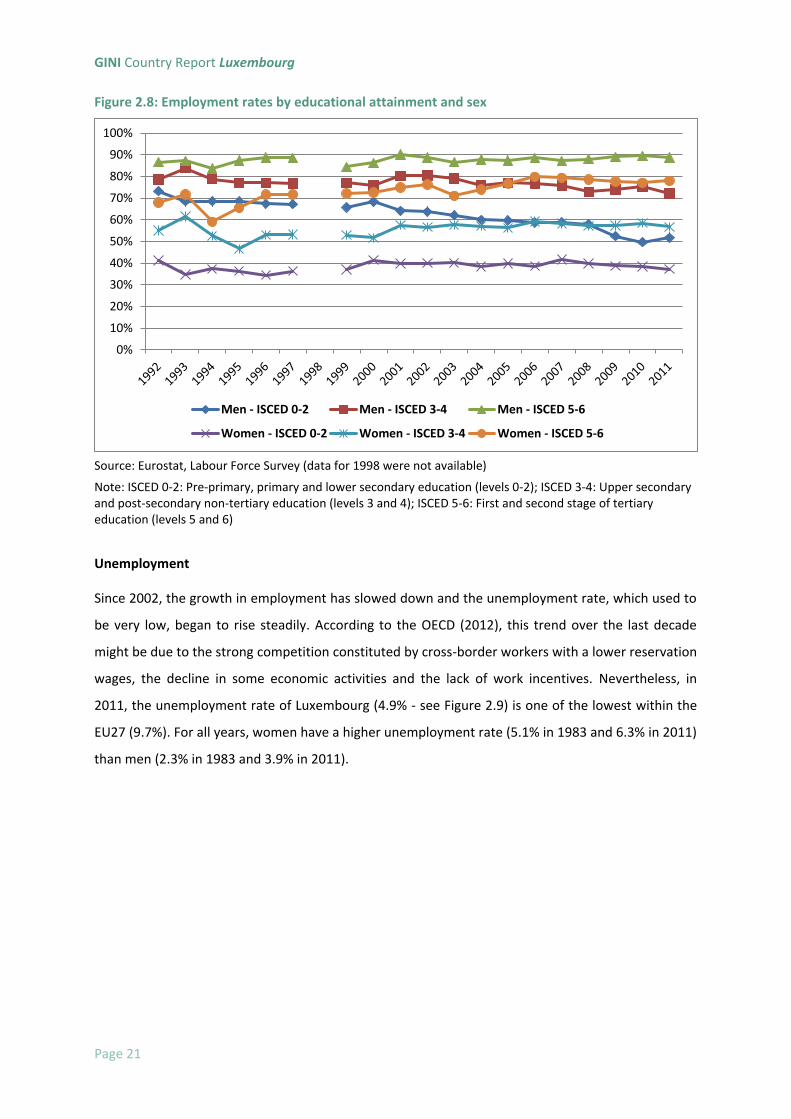
By educational attainment
The level of education determines the employability of an individual. The higher the educational
attainment, the higher the employment rate is. This is true for the total population and also by
gender. Lower educated people have the lowest employment rates for all years. In 2011, the
employment rate is equal to 44.2% for people with pre-primary, primary and lower secondary
education levels, to 64.4% for people with upper secondary and post-secondary non-tertiary
education level, and to 83.7% for people with a first and second stage of tertiary education level.
These results are comparable to the EU27 average (respectively 44.8%; 68.3%; 82.0%). If we compare
the employment rates by gender and educational attainment, we observe that women always have
lower employment rates compared to men for all levels of education (see Figure 2.8).
0,0%
10,0%
20,0%
30,0%
40,0%
50,0%
60,0%
70,0%
80,0%
19
95
19
96
19
97
19
98
19
99
20
00
20
01
20
02
20
03
20
04
20
05
20
06
20
07
20
08
20
09
20
10
20
11
Men - Foreign country Men - Declaring country Men - Total
Women - Foreign country Women - Declaring country Women - Total
GINI Country Report Luxembourg
Page 21
Figure 2.8: Employment rates by educational attainment and sex
Source: Eurostat, Labour Force Survey (data for 1998 were not available)
Note: ISCED 0-2: Pre-primary, primary and lower secondary education (levels 0-2); ISCED 3-4: Upper secondary and post-secondary non-tertiary education (levels 3 and 4); ISCED 5-6: First and second stage of tertiary education (levels 5 and 6)
Unemployment
Since 2002, the growth in employment has slowed down and the unemployment rate, which used to
be very low, began to rise steadily. According to the OECD (2012), this trend over the last decade
might be due to the strong competition constituted by cross-border workers with a lower reservation
wages, the decline in some economic activities and the lack of work incentives. Nevertheless, in
2011, the unemployment rate of Luxembourg (4.9% - see Figure 2.9) is one of the lowest within the
EU27 (9.7%). For all years, women have a higher unemployment rate (5.1% in 1983 and 6.3% in 2011)
than men (2.3% in 1983 and 3.9% in 2011).
0%
10%
20%
30%
40%
50%
60%
70%
80%
90%
100%
Men - ISCED 0-2 Men - ISCED 3-4 Men - ISCED 5-6
Women - ISCED 0-2 Women - ISCED 3-4 Women - ISCED 5-6

GINI Country Report Luxembourg
Page 22
Figure 2.9: Evolution between 1983 and 2011 of the unemployment rates by gender (%)
Source: Eurostat, Labour Force Survey
Young people (15-24 years old) have, throughout the whole period, a higher unemployment rate
compared to people aged between 25-49 years old and 50-64 years old (see Figure 2.10). In
comparison with other European countries, the unemployment rate of young people is below the
average of EU27: 16.8% against 21.3%.
Figure 2.10: Evolution between 1983 and 2011 of the unemployment rates by age for Luxembourg (%)
Source: Eurostat Labour Force Survey
0,0
1,0
2,0
3,0
4,0
5,0
6,0
7,0
8,0
19
83
19
84
19
85
19
86
19
87
19
88
19
89
19
90
19
91
19
92
19
93
19
94
19
95
19
96
19
97
19
98
19
99
20
00
20
01
20
02
20
03
20
04
20
05
20
06
20
07
20
08
20
09
20
10
20
11
%
Total Men Women
0%
2%
4%
6%
8%
10%
12%
14%
16%
18%
20%
19
83
19
84
19
85
19
86
19
87
19
88
19
89
19
90
19
91
19
92
19
93
19
94
19
95
19
96
19
97
19
98
19
99
20
00
20
01
20
02
20
03
20
04
20
05
20
06
20
07
20
08
20
09
20
10
20
11
15-24 25-49 50-64
GINI Country Report Luxembourg
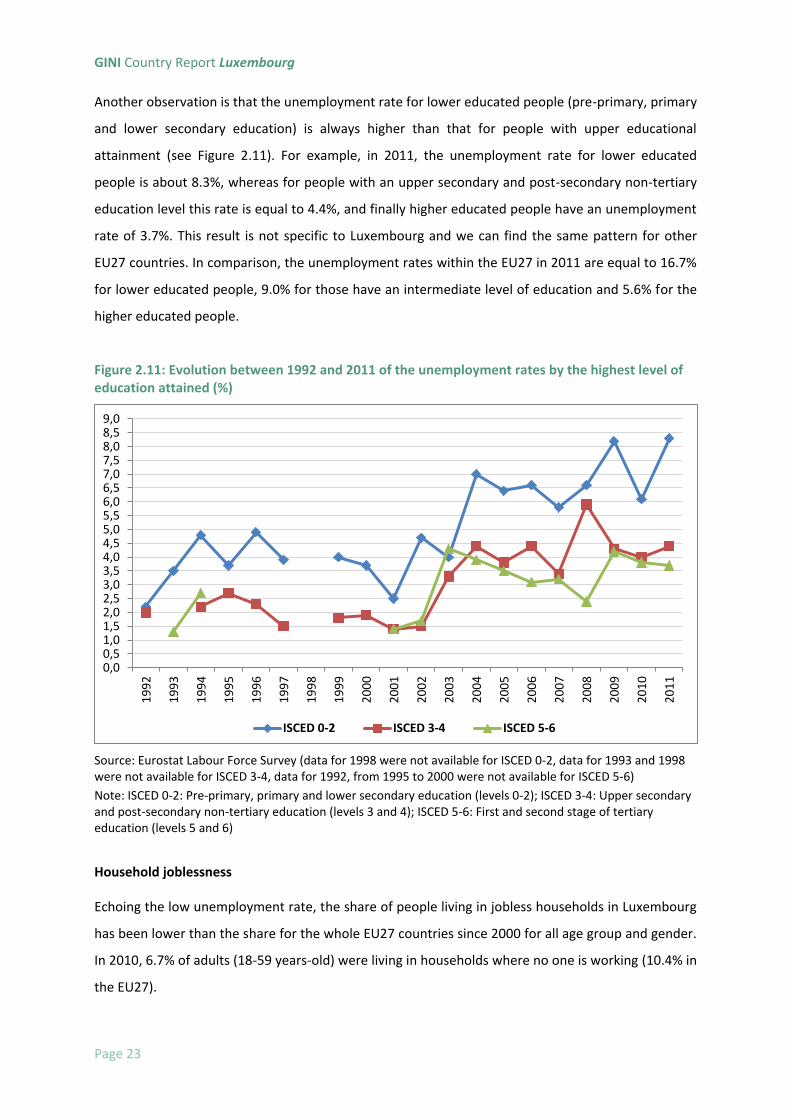
Page 23
Another observation is that the unemployment rate for lower educated people (pre-primary, primary
and lower secondary education) is always higher than that for people with upper educational
attainment (see Figure 2.11). For example, in 2011, the unemployment rate for lower educated
people is about 8.3%, whereas for people with an upper secondary and post-secondary non-tertiary
education level this rate is equal to 4.4%, and finally higher educated people have an unemployment
rate of 3.7%. This result is not specific to Luxembourg and we can find the same pattern for other
EU27 countries. In comparison, the unemployment rates within the EU27 in 2011 are equal to 16.7%
for lower educated people, 9.0% for those have an intermediate level of education and 5.6% for the
higher educated people.
Figure 2.11: Evolution between 1992 and 2011 of the unemployment rates by the highest level of education attained (%)
Source: Eurostat Labour Force Survey (data for 1998 were not available for ISCED 0-2, data for 1993 and 1998 were not available for ISCED 3-4, data for 1992, from 1995 to 2000 were not available for ISCED 5-6)
Note: ISCED 0-2: Pre-primary, primary and lower secondary education (levels 0-2); ISCED 3-4: Upper secondary and post-secondary non-tertiary education (levels 3 and 4); ISCED 5-6: First and second stage of tertiary education (levels 5 and 6)
Household joblessness
Echoing the low unemployment rate, the share of people living in jobless households in Luxembourg
has been lower than the share for the whole EU27 countries since 2000 for all age group and gender.
In 2010, 6.7% of adults (18-59 years-old) were living in households where no one is working (10.4% in
the EU27).
0,00,51,01,52,02,53,03,54,04,55,05,56,06,57,07,58,08,59,0
19
92
19
93
19
94
19
95
19
96
19
97
19
98
19
99
20
00
20
01
20
02
20
03
20
04
20
05
20
06
20
07
20
08
20
09
20
10
20
11
ISCED 0-2 ISCED 3-4 ISCED 5-6

GINI Country Report Luxembourg
Page 24
Figure 2.12: Population living in jobless households by age group and gender (%)
Source: Eurostat, Labour Force Survey
B. Wage Inequality
Based on survey data (covering only the resident population), Table 2.2 in Section 2.1.1 reported that
the (absolute and relative) contribution of household equivalised paid employment income to total
inequality increased between 1991 and 2000 through the combination of a higher share in total
income, a higher degree of inequality and a higher rank correlation with total income. In this section,
the evolution of hourly wage inequality over time is estimated using administrative data on
professional careers from the General Inspectorate of Social Security in Luxembourg (IGSS) which
covers also the cross-border workers. We select individuals aged 20 to 57, recorded working at least
once in Luxembourg during 1988 and 2009. Individuals with at least five years of inactivity between
1988 and 2009 because of disability or who retired before the age of 57 with a disability benefit are
disregarded. Additional information on the data is available in Sologon (2010).
Overall wage inequality as measured by the Theil index for the entire working population in
Luxembourg has increased by around 20% between 1988 and 2009. Given the specific composition
of the labour force, we decompose the evolution of wage inequality across cross-border workers and
residents. The trends in the sub-groups inequality decomposition is illustrated in Figures 2.13-2.15
(see Section 2.4 for related analysis for overall household income inequality, not confined to wage
inequality).
0%
2%
4%
6%
8%
10%
12%
1992199319941995199619971998199920002001200220032004200520062007200820092010
Children (0-17) Adults (18 - 59) Women (18 - 59) Men (18 - 59)

GINI Country Report Luxembourg
Page 25
The decomposition by population sub-groups shows that the increase in the overall wage inequality
reflects an increase in both within and between-groups inequality. The dominant component is the
aggregated within-groups wage inequality which follows closely the evolution of the overall wage
inequality (Figure 2.13). As shown in Figure 2.14, the level of within-group inequality is higher among
residents than among cross-borders, which indicates a higher degree of variation in wages which
may reflect differences between nationals and immigrants (Berger et al, 2010 found a similar result).
The relative increase over time is of 23% for within-residents inequality and of 27% for within-cross-
borders inequality.
Figure 2.13: Evolution of overall wage inequality and aggregated within-groups (Residents and Cross-borders) inequality (Theil index)
Source: IGSS files, calculation CEPS/INSTEAD
0
0,05
0,1
0,15
0,2
Overall Wage Inequality Within-Groups Wage Inequality

GINI Country Report Luxembourg
Page 26
Figure 2.14: Evolution of the within-residents and within-cross-borders wage inequality (Theil index)
Source: IGSS files, calculation CEPS/INSTEAD
Figure 2.15: Evolution of the between-groups (Residents versus Cross-borders) wage inequality (Theil index)
Source: IGSS files, calculation CEPS/INSTEAD
0
0,05
0,1
0,15
0,2
Within-Residents Wage Inequality Within-Cross-borders Wage Inequality
0
0,002
0,004
0,006
0,008
0,01
Between-Groups Wage Inequality

GINI Country Report Luxembourg
Page 27
Figure 2.16: Evolution of overall wage inequality and aggregated within-groups (Nationals, Immigrants and Cross-borders) inequality (Theil index)
Source: IGSS files, calculation CEPS/INSTEAD
Figure 2.17: Evolution of the within-nationals, within-immigrants and within-cross-borders wage inequality (Theil index)
Source: IGSS files, calculation CEPS/INSTEAD
0
0,05
0,1
0,15
0,2
Overall Wage Inequality Within-Groups Wage Inequality
0
0,05
0,1
0,15
0,2
0,25
Within-Nationals Wage Inequality Within-Immigrants Wage Inequality
Within-Cross-borders Wage Inequality

GINI Country Report Luxembourg
Page 28
Figure 2.18: Evolution of between-groups (Nationals, Immigrants and Cross-borders) wage inequality
Source: IGSS files, calculation CEPS/INSTEAD
The level of inequality between residents and cross-borders is considerably smaller compared with
within-groups inequality, but the relative increase is considerably larger. Between 1988 and 2009,
the level of between-groups inequality became almost 15 times higher (Figure 2.15).
Figures 2.16-2.18 illustrate the inequality decompositions when residents are further split into
nationals and immigrants. Immigrants are defined as non-Luxembourgers working and living in
Luxembourg. Comparing Figure 2.13 and Figure 2.16, the within-groups inequality is still the
dominant component, but slightly lower. This indicates the degree of between-group inequality is
higher when we consider also the differences between nationals and residents. This is confirmed by
Figures 2.15 and 2.18, which show a considerably higher between-group inequality among nationals,
immigrants and cross-borders than among residents and cross-borders. The relative increase in
between-group inequality over time is of 87%.
Figure 2.17 shows that the degree of within-group inequality is higher for immigrants throughout the
period. Cross-borders start at lower levels of within-group inequality, but converge with the
nationals starting with the mid-1990s.
0
0,002
0,004
0,006
0,008
0,01
Between-Groups Wage Inequality

GINI Country Report Luxembourg
Page 29
2.1.4. Educational inequality
Luxembourg has introduced obligatory primary school attendance already back in the 19th century.10
Throughout the 20th century, the system has been further modernized: in 1912 the obligatory
schooling has been extended from 6 to 7 years and offered it free of charge.11 In 1965 and 1979
secondary education has been established into currently existing system offering in parallel classical
and vocational programmes and became obligatory (MENFP 2010).
Population trend
Educational expansion both extended the duration of obligatory education and offered a variety of
post-secondary choices, including university studies. The creation of the University of Luxembourg in
2003 has made it possible for Luxembourgish students to pursue tertiary degree in their home
country, as well as to attract foreign students. Before 2003, several higher education institutions
were providing one or two years programs but students needed to move abroad in order to
complete their studies and obtain a university degree. The education distribution in population
changed within recent years with more men and women pursuing some tertiary degree (22% in 2010
vs. 5% in 1985). Similarly to other post-industrial societies, women appear to have benefited the
most from these developments: the share of highly educated women has grown by 14 percentage
points during this period. However, these findings should not be interpreted overly enthusiastically
for two reasons. On the one hand, women were traditionally in a far less favourable position
compared to men. Current figures reflect the tendency to level out historical disadvantages. On the
other hand, the growth in the proportion of highly-educated women is taking place due to the
change in distribution in the middle category, but does not challenge the share of low-educated
women, which remains as high as 47%. The lack of change in the lowest category over time raises
more concerns linked to both labour market integration and social fluidity in Luxembourg. The
increase in the proportion of highly educated combined with the persistence in the share of low
educated suggests an increase in educational inequality. (Figure A1 in annex presents the distribution
of education levels by cohorts.)
10 According to the ''Kirpach'' Law dated back to 20 April 1881, all children aged 6-12 were obliged to attend their local communal schools. Education back then was offered in French, and school expenses were covered both through local funds and parental contribution. 11 The law of 10th of August 1912 is considered as the first major legislation concerning education, which has also restricted the involvement of the Catholic clergy from involvement in formal education.

GINI Country Report Luxembourg
Page 30
Figure 2.19: Trends in highest educational attainment: 1985-2010
Source: LIS data (1985-2004) and PSELL3/EU-SILC data for 2010
As already mentioned, the earlier immigration wave in Luxembourg has attracted mostly manual
labour workers with lower educational level while recent immigrants are more likely to be highly-
educated and are filling professional and managerial positions. High influx of immigrants is likely to
affect both adult population education distribution, as well as school results among children and
adolescents.
Figure 2.20 captures the change in distribution of educational skills among adult population. Earlier
trend registers the prevalence of immigrants (both first- and second-generation) whose educational
level is below lower secondary school. The situation significantly changed between 1994 and 1997
where the immigrant population with tertiary education has sharply increased and remained above
20%. As underlined by Amétépé and Hartmann-Hirsch (2011), currently, the share of highly qualified
foreigners is higher than the share of highly qualified nationals.12 However, the share of immigrants
with low education remains very large, despite decreasing over time.
12 Amétépé and Hartmann-Hirsch (2011:200) even suggests that there could be “a reversal of the usual hierarchical relations between nationals and migrants, with a group of highly qualified foreigners and foreign managers positioned above the national elite.”
42 54
42 63
40 59
35 53
33 49 43
54 38 47
49 41
48 31
49 34
47
35
45 36
36 28
40 31
9 5 10 6 12 7 19 11
22 15 22 19 22 22
0%
20%
40%
60%
80%
100%
Men
Wo
men
Men
Wo
men
Men
Wo
men
Men
Wo
men
Men
Wo
men
Men
Wo
men
Men
Wo
men
1985 1991 1994 1997 2000 2004 2010
Low (ISCED 0-2) Middle (ISCED 3-4) High (ISCED 5-6)

GINI Country Report Luxembourg
Page 31
Figure 2.20. Trends in highest educational attainment among foreign and native population: 1985-2010
Source: LIS data (1985-2004) and PSELL3/EU-SILC data for 2010
Children and youth
The situation of youth currently at schools raises deeper concerns about the extent of inequalities in
education in Luxembourg. Results from the OECD PISA 2000 study of 15-year old students revealed
that the average performance in reading is below expected OECD average, with significant gaps
persisting between girls and boys, between native and immigrant students, as well as between
families with more and fewer educational, economic, and cultural resources.
The education system in Luxembourg is similar to systems in Germany, German-speaking part of
Switzerland, Flemish region in Belgium, and Austria: after primary school children are being assigned
to various educational programmes, based on their previous academic record and teachers
recommendation. Another crucial condition, which makes Luxembourgish system particularly rigid, is
fluency in both languages of instruction: German and French. Therefore, transition from primary to
secondary school becomes decisive for future educational and occupational outcomes, of which the
11-year old children are likely not to be fully aware of (see also OECD, 2012).
Research has documented that stratified educational systems are more likely to reinforce socio-
economic inequalities, and the OECD PISA 2009 results in graph below support these findings. With
the exception for Hungary, it is countries with differentiated school programmes that have stronger
associations between achievement and family background.
46 60 51
65 47
61 43 47 40 42 46 51
40 46
48 33
41 30
43 33
45 32 47 31
37 24 42 26
6 7 8 6 10 5 12 21 13
27 17 25 18 25
0%
20%
40%
60%
80%
100%
Nat
ive
Imm
igra
nt
Nat
ive
Imm
igra
nt
Nat
ive
Imm
igra
nt
Nat
ive
Imm
igra
nt
Nat
ive
Imm
igra
nt
Nat
ive
Imm
igra
nt
Nat
ive
Imm
igra
nt
1985 1991 1994 1997 2000 2004 2010
Low (ISCED 0-2) Middle (ISCED 3-4) High (ISCED 5-6)

GINI Country Report Luxembourg
Page 32
Figure 2.21. Proportion of variance in PISA 2009 test explained by social, cultural, and educational resources of family
Source: OECD (2010b)
OECD has revealed that students from disadvantaged families in Luxembourg are more likely to
attend schools with fewer educational resources, schools that experience teacher shortages, or
schools with lower share of teachers with tertiary education (OECD 2010b, 2012).
As a result, Luxembourg and Austria have the lowest share of resilient students – those who are in
the bottom quarter of the PISA index of economic, social and cultural status and performs in the top
quarter across students from all countries after accounting for socio-economic background – 5.1%
and 4.9% respectively in contrast to e.g. 11.4% in Finland. And on the other side, again Luxembourg
and Austria have the highest percentage of students who are at the bottom quarter of the socio-
economic scale and perform weakest – 7.4% and 8.2% respectively, compared to 2.2% in Finland.
Immigrant-origin students in Luxembourg frequently come from disadvantaged background –
according to PISA 2009 76.8% of 15-year old immigrant students are at the bottom of the socio-
economic scale. The difference with other countries is immense, with Switzerland being the second
country with highest share (44%).
Immigration trend shows continuous increase of foreign-born children in school population (from
34.6% in 2001 to 41% in 2010). The largest countries of origin are Portugal (22.4%), ex-Yugoslavia
(4.7%), France (3.2%), and Italy (2.5%). The socio-economic and educational profile of newcomers
from Portugal and former Yugoslavian countries has been and remains low (MENFP, 2011). Results in
0
5
10
15
20
25
30

GINI Country Report Luxembourg
Page 33
terms of PISA test scores (not shown here) remain low, and have not significantly changed from
2003, as well as the native-immigrant gap remains relatively stable.
While individual characteristics, such as speaking different than a test language at home, migratory
background (being a first- or second-generation student), and disadvantaged socio-economic
position explain are among main predictors of the achievement gap, immigrant students are more
responsive to structural environment, such as availability and educational background of teachers,
track placement, repetition of the school year (Alieva, 2010).
2.2. Whom it has affected
To understand who has been affected by increasing income inequality, it is instructive to analyse
whether income inequality was equally distributed between various population subgroups or
whether trends differed substantially across groups. The population subgroups analysed are
“migrants versus natives”, “low educated versus middle educated versus highly educated”, groups
determined by the cross-tabulation of the migratory status and education level variables13, and
different household composition groups.14 We used standard techniques of inequality decomposition
by subgroup where overall income inequality (measured by the Theil index) can be written as the
sum of within group inequality ((weighted) inequality within groups) and between groups inequality.
Between groups inequality is computed by giving to each individual within a subgroup the average
income of that subgroup.
Figure 2.22 displays the trend of between and within-group inequality for the populations subgroups
mentioned above (Table A2 in annex displays the underlying data). For the four groups, within group
inequality follows the same trend as overall inequality (see Table 2.1.) and accounts, by far, for the
highest share of total inequality. More specifically, within-group inequality followed an increasing
trend while between-group inequality shows different evolution for different population categories
and time period.
13 Six groups were defined: low-educated natives, low-educated migrants, middle-educated natives, middle-educated migrants, high-educated natives and high-educated migrants. 14 The original household composition variable available in the LIS data contains 16 types of households varying around 4 main groups: one person household, couples with children, couples without children and single parents. The remaining household types are the same as the previous ones except for the presence in the households of relatives or nonrelatives. We based our analysis on the four main groups and all the other combinations were included in a “other category” which amounted to 11% in 1985 and decreased to 8% in 2004. Conclusions about between and within group inequality for the original household variable are the same as with the recoded variable. For comparability reason, we did not decompose this variable for 2010.
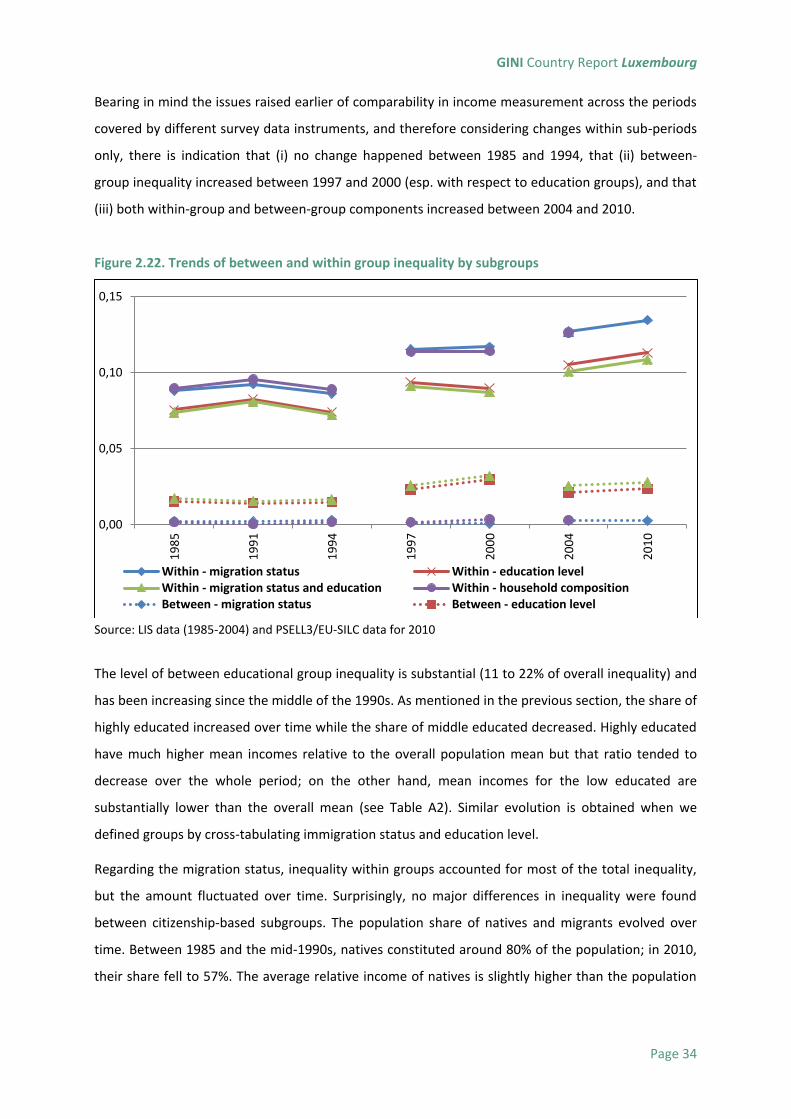
GINI Country Report Luxembourg
Page 34
Bearing in mind the issues raised earlier of comparability in income measurement across the periods
covered by different survey data instruments, and therefore considering changes within sub-periods
only, there is indication that (i) no change happened between 1985 and 1994, that (ii) between-
group inequality increased between 1997 and 2000 (esp. with respect to education groups), and that
(iii) both within-group and between-group components increased between 2004 and 2010.
Figure 2.22. Trends of between and within group inequality by subgroups
Source: LIS data (1985-2004) and PSELL3/EU-SILC data for 2010
The level of between educational group inequality is substantial (11 to 22% of overall inequality) and
has been increasing since the middle of the 1990s. As mentioned in the previous section, the share of
highly educated increased over time while the share of middle educated decreased. Highly educated
have much higher mean incomes relative to the overall population mean but that ratio tended to
decrease over the whole period; on the other hand, mean incomes for the low educated are
substantially lower than the overall mean (see Table A2). Similar evolution is obtained when we
defined groups by cross-tabulating immigration status and education level.
Regarding the migration status, inequality within groups accounted for most of the total inequality,
but the amount fluctuated over time. Surprisingly, no major differences in inequality were found
between citizenship-based subgroups. The population share of natives and migrants evolved over
time. Between 1985 and the mid-1990s, natives constituted around 80% of the population; in 2010,
their share fell to 57%. The average relative income of natives is slightly higher than the population
0,00
0,05
0,10
0,15
19
85
19
91
19
94
19
97
20
00
20
04
20
10
Within - migration status Within - education levelWithin - migration status and education Within - household compositionBetween - migration status Between - education level

GINI Country Report Luxembourg
Page 35
average; immigrants’ relative income is around 15% lower than the population income average in
1985 but this gap tends to reduce over time.
Regarding household composition, within group inequality also account for most of total inequality.
Between groups inequality slightly increased over time, mainly during the 1990s. This corresponds to
the period where the share of single person household and couples without children increased. The
relative mean income of these two groups increased between 1991 and 2000. On the other hand,
the share of couples with children decreased; so did the relative mean income of this group,
between 1991 and 2000.
2.3. Interdependence between various inequalities
The increase in the share of highly educated starting in the 1990s, for both men and women, fuelled
by the inflow of highly skilled migrants, corresponded to the period of moderate increase of
inequality in both household equivalent income and wage inequality. The most obvious channel
through which educational inequalities affect income inequality is in the labour market since the
level of education determines the level of employability of an individual and its wage rate. There is
clear dependence in educational, earnings and income inequality, three components whose trends
since the 1990s appear correlated.
2.4. Why has inequality grown?
The comparison of the inequality level of 2010 with that of 1985 suggest that inequality increased
substantially in Luxembourg. While the actual magnitude of the increase is questioned by data
comparability issues, there is indication of a moderate increase in inequality since the 1990s (see
OECD, 2012). Indications drawn from household income inequality trends within comparable sets of
data are coherent with trends observed on individual earnings from the more consistently collected
register data.
The descriptive analysis of the current chapter highlighted several trends that can explain at least
partly this evolution. Income source decomposition analysis reveals that the relative contribution of
paid employment income to total inequality increased over time. This reflects major labour market
evolutions: (i) the expansion of the high-wage financial sector,15 (ii) an increase in the female
15 For example, the OECD (2012:43-4) evaluated that “a one percent rise of the share of the financial sector among the working population increases the interdecile gap by 0.3% in Luxembourg as in many other countries”. In 2010, this sector represented 11% of the overall employment in Luxembourg compared to a 3% average in the Euro area.

GINI Country Report Luxembourg
Page 36
employment rate, mainly married women, as well as (iii) an increase in earnings inequality. The
recent upward trend in the unemployment rate also coincided with a period of increasing inequality.
The analysis of education inequalities shows that for both men and women the share of highly
educated increased while the share of low educated remained stable. This changing educational
inequalities and the change in skills required by the structural change from a heavy industry based
society to a high value-added service society also influenced income inequality. On the other end,
the educational system appears to perform relatively badly compared to other OECD countries,
hampering labour market outcomes and intergenerational mobility (see supra). Given the positive
returns to education, increasing educational inequalities also likely contributed to the trend in
inequality.
The evolution of institutional characteristics and social policies may have also affected the income
distribution (see Chapter 5). The Luxembourg labour market is one of the most regulated of the
OECD countries with a strong regulatory framework within the Luxembourg ‘social model’, that is a
strong social dialogue between unions, employers’ representatives and the government. There is an
automatic indexation of salaries to inflation that applies to all wages and to the minimum wage. The
minimum wage relative to average wages also increased over time contrary to what happened in
other countries. This feature of the labour market, together with the generous welfare state (in
particular the pension system and family-related policies) contributed to raise the floor of the
income distribution and therefore to contribute ‘from the bottom’ to achieve a comparatively low
level of inequality. On the other hand trends in a relatively low personal income taxation since the
1980s generally benefited higher income recipients.
Immigration likely contributed to the spread of the income distribution. Immigrants contributed to
the expansion of education of the population as the share of immigrants with higher education
increased considerably. This was the result of the policies and regulation put in place to attract
foreign investment in Luxembourg in the 1990s. The share of low educated migrants kept stable
ending up in a heterogeneous population with very different human capital and earnings capacity.
This is reflected in much higher within-group wage inequality among immigrants than among
Luxembourg nationals or even among cross-border workers. The impact of the cross-border workers
on the overall income distribution cannot really be evaluated since, by definition, cross-border
workers are not part of the population among which income inequality is assessed. Yet, both groups
indirectly played a role in the evolution of the income distribution in Luxembourg through their
impacts on the labour market. These two groups are characterised by the fact that they are younger,
in age of having children, and with higher employment rates. The contribution of both migrants and
cross-border workers to the tax system is high given their high employment rate which contributed
GINI Country Report Luxembourg
Page 37
to maintain low level of personal income taxation and social contributions and, in turn, to build and
expand a generous welfare system for all the residents. On the other hand, the age structure of the
migrants and cross-borders imply that most of them are not entitled yet to pensions and that their
need, say, in healthcare is on average lower. The differential between tax revenues from non-
residents and expenditures to non-residents is, at least up to now, in favour of Luxembourg.
2.5. Conclusions
The analysis in this chapter suggested that income inequality modestly increased in Luxembourg over
the period 1985 and 2010. It should however be kept in mind that despite the increase in income
inequality, Luxembourg can still be considered a low inequality country and that the break in series
between the different socio-economic panels call for caution when interpreting the evolution.
This trend was accompanied by major economic expansion in the service and financial sectors,
substantial increase in the level of incomes, massive immigration (including of highly skilled
immigrants), increase in educational inequality (with an expansion of the share of highly educated
residents), and a large growth of cross-border employment to compensate for shortages in domestic
labour supply. Unemployment rates have been comparatively low in the overall period yet increased
markedly in recent years.
Luxembourg is still among top countries in terms of GDP per capita and, according to OECD (2012),
emerged in quite good conditions from the recent crisis, compared to other OECD countries.
However, Luxembourg is confronted to several challenges such as rising unemployment, population
ageing, difficulties in the tri-partite decision making process and negative perspective on public
deficit. The ability of the country to deal with these issues in a changing international environment
will most likely impact on the social cohesion in general but also on the income distribution.
GINI Country Report Luxembourg
Page 38
3. The Social Impacts of Inequality
3.1. Introduction
In this chapter, we analyse whether the increasing trend in income inequality observed over the
period 1985 and 2010 has been correlated with the trends of a set of social outcomes. It should
however be kept in mind that despite the increase in income inequality, Luxembourg can still be
considered a low inequality country and that the break in series between the different socio-
economic panels calls for caution when interpreting the evolution. The Luxembourg case is
interesting because alongside the rising dispersion of incomes, levels of living have increased
substantially. The question is then whether the positive effects linked to the increase of overall living
standards (but also of the development of effective welfare institutions it helped finance), have
prevailed over the potential negative effects of the increase in income inequality.
In addition to analysing this question at the national level by comparing trends of inequality with
trends in social outcomes, we also investigate, when possible, how the adverse social outcomes are
distributed among different groups of the resident population. Again, cross-border workers who are
an important component of the domestic labour force are not covered in the data used in this
chapter. A final caveat emptor is that our analysis is deliberately descriptive and claims about causal
relationships between the different phenomenons analysed here should be made cautiously.
The thematic coverage of the social outcomes considered in this chapter follows the guidelines of the
common GINI country report template. First, material dimensions of social exclusion such as material
deprivation (Section 3.2), cumulative disadvantage and multidimensional measures of poverty and
social exclusion (Section 3.3) and housing deprivation (Sections 3.3 and 3.7) are discussed. Then a
broad set of topics is successively covered: social cohesion (Section 3.4), family formation and
breakdown, fertility (Section 3.5), health (Section 3.6), crime and punishment (Section 3.8),
happiness (Section 3.9.) and intergenerational mobility for education and occupation (Section 3.10).
3.2. Patterns and trends in material deprivation
Since 2009, in order to complement the income poverty figures and to better reflect differences in
actual standards of living across EU (especially since last enlargements), the EU portfolio of
commonly agreed social indicators includes measures of material deprivation (MD), conceived as an
enforced lack of a combination of nine items depicting material living conditions, namely the ability

GINI Country Report Luxembourg
Page 39
to 1) face unexpected expenses; 2) afford one week annual holiday away from home; 3) pay for
arrears (mortgage or rent, utility bills or hire purchase instalments); 4) afford a meal with meat,
chicken or fish every second day; 5) keep home adequately warm; 6) have a washing machine; 7)
have a colour TV; 8) have a telephone; 9) have a personal car.
Based on the Community Statistics data from the EU Survey on Income and Living Conditions (EU-
SILC) instrument, the purpose of these EU deprivation indicators is to capture a situation of exclusion
from a minimum acceptable way of life due to a lack of resources (EU Council of Ministers, 1985).
The standard MD rate is defined as the proportion of people living in households who cannot afford
at least 3 of the 9 items. A severe MD concept, defined as the proportion of people living in
households who cannot afford at least 4 of the 9 items, is one the three indicators used to define the
EU social inclusion target, in the context of the Europe 2020 Strategy (see Section 3.3).
Trends in both standard and severe deprivation rates are illustrated in this section, using EU-SILC for
the 2003-2010 period. Comparable figures are not available for years prior to the beginning of the
EU-SILC survey. Figure 3.1 shows that a rather low proportion of individuals suffer from deprivation
in Luxembourg, i.e. around 4% lack 3 items or more, and less than 1% lack 4 items or more (out of
nine).16 At the EU level, in 2010, these percentages reach 17.4% (standard MD) and 8.1 % (severe
MD), respectively. Figure 3.1 also shows that severe material deprivation decreased from 2005
onwards and increased in 2009. The trend of the standard measure goes in the reverse direction,
with a steady increase from 2006 to 2010. However, it is worth noting that many annual variations
are lower than 1% and should be interpreted with caution, as they may not be statistically significant.
16 According to previous studies using a slightly different definition of material deprivation and the European community household panel (ECHP), Luxembourg was also among the less deprived European countries in the late 1990s and at the beginning of 2000 (see Eurostat (2002) and Guio (2005)).

GINI Country Report Luxembourg
Page 40
Figure 3.1: Standard and severe material deprivation rates, 2003-2010
Source: Eurostat (EU-SILC)
Notes: MD: standard material deprivation rate (threshold set at 3 items out of nine); SMD: severe material deprivation rate (threshold set at 4 items out of nine).
To better understand the annual variations of the aggregated MD indicators, we analyse the trend of
individual items (see Figure 3.2).17 The proportion of people who cannot face unexpected expenses
rose in 2005, and then remained quite stable until 2009, when the financial crisis presumably
conducted more people (from 20% to 25% of the population) to declare such problems in 2009 and
2010. The first jump in 2005 may be due to a definition change between 2003/2004 and the
following years, when the amount of the unexpected expenses was more precisely defined in the EU-
SILC questionnaire across the EU. The inability to afford paying one week holidays away from home
remained either stable or decreased slightly, except a jump in 2008-2009-2010. So was the
proportion of people who suffer from arrears, which also increased in 2009-2010, after many years
of slight decrease.
17 Since the proportion of people lacking each of the three basic durables (a TV, a telephone or a washing machine), if desired, is negligible in Luxembourg, we do not analyse the trend for these items.
0,0
1,0
2,0
3,0
4,0
5,0
6,0
2003 2004 2005 2006 2007 2008 2009 2010
MD SMD

GINI Country Report Luxembourg
Page 41
Figure 3.2: Trends in individual items, 2003-2010
Source: Eurostat (EU-SILC)
If the general level of material deprivation is very low in Luxembourg, some sub-populations suffer
more than others from MD. Figure 3.3 presents some of the most important risk factors of material
deprivation in Luxembourg, i.e. income poverty, unemployment, low education, single parenthood,
and living in large families (these two last factors impacting on the global risk encountered by
children).
The share of those severely deprived among those materially deprived varies between sub-groups.
This share is particularly small for families with children (whose deprivation rate varies between 2%
and 6% depending on the number of children although their severe deprivation rate is virtually
nonexistent) and on the contrary very large for retired (1.9% of retired are deprived, among whom
0.9% are severely deprived, i.e. a share of 50%). Among singles (with and without children), low
educated or unemployed, the share of those severely deprived among those deprived is also high
(25%-30%), indicating the higher severity of deprivation suffered by these groups.
0
5
10
15
20
25
30
20
03
20
04
20
05
20
06
20
07
20
08
20
09
20
10
Inability to face unexpected financial expenses
Inability to afford paying for one week annual holiday away from home
Arrears (mortgage or rent, utility bills or hire purchase)
Inability to afford a meal with meat, chicken, fish (or vegetarian equivalent) every second day
Enforced lack of a car
Inability to keep the home adequately warm
%
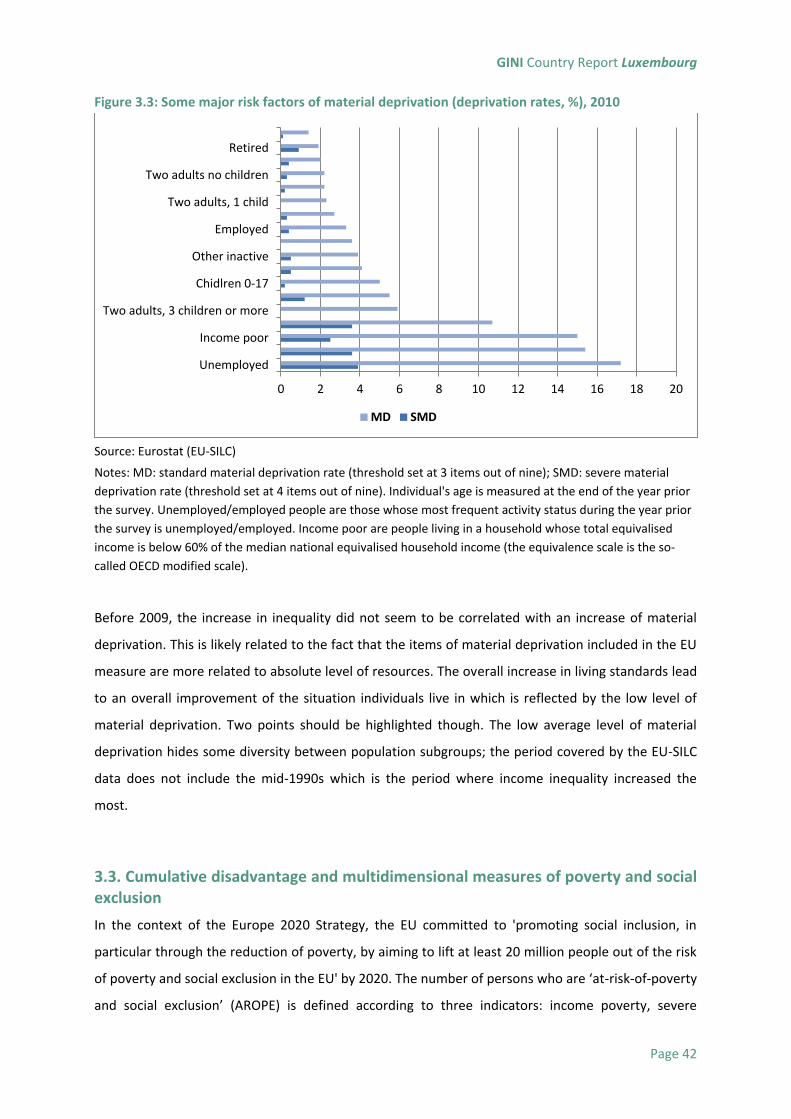
GINI Country Report Luxembourg
Page 42
Figure 3.3: Some major risk factors of material deprivation (deprivation rates, %), 2010
Source: Eurostat (EU-SILC)
Notes: MD: standard material deprivation rate (threshold set at 3 items out of nine); SMD: severe material
deprivation rate (threshold set at 4 items out of nine). Individual's age is measured at the end of the year prior
the survey. Unemployed/employed people are those whose most frequent activity status during the year prior
the survey is unemployed/employed. Income poor are people living in a household whose total equivalised
income is below 60% of the median national equivalised household income (the equivalence scale is the so-
called OECD modified scale).
Before 2009, the increase in inequality did not seem to be correlated with an increase of material
deprivation. This is likely related to the fact that the items of material deprivation included in the EU
measure are more related to absolute level of resources. The overall increase in living standards lead
to an overall improvement of the situation individuals live in which is reflected by the low level of
material deprivation. Two points should be highlighted though. The low average level of material
deprivation hides some diversity between population subgroups; the period covered by the EU-SILC
data does not include the mid-1990s which is the period where income inequality increased the
most.
3.3. Cumulative disadvantage and multidimensional measures of poverty and social exclusion
In the context of the Europe 2020 Strategy, the EU committed to 'promoting social inclusion, in
particular through the reduction of poverty, by aiming to lift at least 20 million people out of the risk
of poverty and social exclusion in the EU' by 2020. The number of persons who are ‘at-risk-of-poverty
and social exclusion’ (AROPE) is defined according to three indicators: income poverty, severe
0 2 4 6 8 10 12 14 16 18 20
Unemployed
Income poor
Two adults, 3 children or more
Chidlren 0-17
Other inactive
Employed
Two adults, 1 child
Two adults no children
Retired
MD SMD

GINI Country Report Luxembourg
Page 43
material deprivation, and very low work intensity (people in very low household work intensity are
those aged 0-59 living in households where, on average, adult members aged 18-59 have worked less
than 20 % of their total work potential during the income reference period (i.e. year prior to the
survey) (See Fusco, Guio and Marlier, 2011, Nolan and Whelan, 2011 or Zahlen, 2011). Figure 3.4
shows that in Luxembourg the target group (in number of persons and not in percentage as in Figure
3.1) represent, in 2010, 83.000 persons. The target is to reduce this population at 66.000 persons by
2020 (survey year 2018).
Figure 3.4 also highlights a jump of the proportion of the population targeted in 2009 (likely due to
the financial crisis), driven by the worsening of income poverty, the deterioration of the labour
market and the increase of severe material deprivation.
Figure 3.4: Europe 2020, Population at-risk-of poverty and social exclusion (AROPE), total and by subcomponents, thousands of people, 2005-2010
Source: Eurostat (EU-SILC).
Notes: the AROPE measure encompasses those at-risk-of poverty (people living in a household whose total
equivalised income is below 60 % of the median national equivalised household income (the equivalence scale
is the so-called OECD modified scale)) or severely deprived (see Section 3.2) or living in household with a very
mow work intensity (people in very low household work intensity are those aged 0-59 living in households
where, on average, adult members aged 18-59 have worked less than 20 % of their total work potential during
the income reference period (i.e. year prior to the survey).
Figure 3.5 and 3.6 present the risk of poverty and social exclusion broken down by education and
citizenship and show that low educated and people from non EU-27 countries suffer from higher risk
of AROPE than other categories.
77 74 73 72
85 83
66 61
64 62 62
71 71
8 5 4 3 5 3
21 19 19 18
24 22
0
10
20
30
40
50
60
70
80
90
20
05
20
06
20
07
20
08
20
09
20
10
20
11
20
12
20
13
20
14
20
15
20
16
20
17
20
18
At-risk-of poverty and socialexclusion (AROPE)At-risk-of poverty (ARP)
Severe material deprivation(SMD)Very low work intensity(VLWI)
10
00
peo
ple

GINI Country Report Luxembourg
Page 44
Figure 3.5: Europe 2020, Population at-risk-of poverty and social exclusion (AROPE), total by education level, 2010
Source: Eurostat (EU-SILC)
Figure 3.6: Europe 2020, Population at-risk-of poverty and social exclusion (AROPE), total by citizenship, 2010
Source: Eurostat (EU-SILC)
The next figures complement the picture with some information on housing deprivation and
overcrowding, compared with the EU average. Figure 3.7 presents the level of housing deprivation,
0,0
5,0
10,0
15,0
20,0
25,0
30,0
2004 2005 2006 2007 2008 2009 2010
Low educated Middle educated High educated
%
0,0
10,0
20,0
30,0
40,0
50,0
60,0
2004 2005 2006 2007 2008 2009 2010
EU-27-excluding Luxembourg Not EU-27 Luxembourg
%

GINI Country Report Luxembourg
Page 45
which was globally stable during the recent period and far less problematic than at the EU level
(where however it was decreasing from 2005).
Figure 3.7: Severe housing deprivation rate (%), EU-27 and Luxembourg, 2005-2010
Source: Eurostat (EU-SILC)
Notes: Severe housing deprivation rate is defined as the percentage of population living in the dwelling which is considered as overcrowded (see below), while also exhibiting at least one of the housing deprivation measures: either a leaking roof or no bath/shower or no indoor toilet or a dwelling considered too dark.
Figure 3.8 highlights that being tenant, and income poor increase the risk of housing deprivation.
Figure 3.8: Severe housing deprivation rate (%) by age group, tenure status and income poverty status, 2010
Source: Eurostat (EU-SILC)
The situation regarding overcrowding is also stable: around 7-8% of the population lives in an
overcrowded dwelling (far less than at the EU-27 level) (Figure 3.9). However, as highlighted by
0
2
4
6
8
10
12
14
16
18
20
2005 2006 2007 2008 2009 2010
Luxembourg EU-27
%
0 1 2 3 4 5 6 7
Not income poor
Income poor
< 18 years
18-64
65+
Owner, with mortgage or loan
Owner, no outstanding mortgage or housing loan
Tenant

GINI Country Report Luxembourg
Page 46
Figure 3.10, the risk is concentrated on some sub-populations (single living in only one room, single
parents, large families and income poor).
Figure 3.9: Overcrowding rates (%), EU-27 and Luxembourg, 2005-2010
Source: Eurostat (EU-SILC)
Notes: The overcrowding rate is defined as the percentage of the population living in an overcrowded household. A person is considered as living in an overcrowded household if the household does not have at its disposal a minimum number of rooms equal to: one room for the household; one room per couple in the household; one room for each single person aged 18 or more; one room per pair of single people of the same gender between 12 and 17 years of age; one room for each single person between 12 and 17 years of age and not included in the previous category; one room per pair of children under 12 years of age.
Figure 3.10: Overcrowding rates (%) by household type and income poverty status, 2010
Source: Eurostat (EU-SILC)
0,0
5,0
10,0
15,0
20,0
25,0
2005 2006 2007 2008 2009 2010Luxembourg EU-27
%
0 5 10 15 20 25 30
Two adults, at least one aged 65 years or over
Two or more adults without dependent children
Two adults younger than 65 years
One adult 65 years or over
Two adults with one dependent child
Two adults with two dependent children
Two or more adults with dependent children
Two adults with three or more dependent children
One adult younger than 65 years
Single person with dependent children
Income poor
Not income poor
%

GINI Country Report Luxembourg
Page 47
3.4. Indicators of social cohesion
On the basis of 2006 cross-sectional EU-SILC data, Lelkes (2010) find that close to 70% of the
Luxembourg residents get together with their relatives several times a month, while this proportion
is higher than 80% when it comes to getting together with friends. These results in terms of
frequency of social contacts rank Luxembourg fairly well. On the other side, more than 8% of the
population consider that they cannot ask for and receive help from relatives, friends or neighbours.
This proportion is higher than the EU average. The risk for individuals at risk of poverty of not being
able to ask for and receive help is more than twice as high as for individuals not at risk of poverty.
3.5. Family formation and breakdown, lone parenthood, fertility
The total fertility rate of the whole population decreased over the 1970s, and then slightly increased
during the next 20 years, remaining relatively stable afterwards around 1.6 children per woman. This
value place Luxembourg in the first half of the European countries (STATEC, 2011). This situation
depends on the nationality of the mothers. Until the mid-1980s, the total fertility rate is clearly
higher for non-Luxembourgish females. The difference disappears for a few years, before
reappearing but to an extent which diminishes over time (Figure 3.11).18
The evolution of the fertility level could be partly due to the increase in the mother's age at childbirth
(Figure 3.12), which leads to a decrease in the total number of children.
18 STATEC (2011) provide figures about the natural balance, that is the difference between births and deaths in Luxembourg. In the 1960s the natural balance in Luxembourg was lower than that of the EU27. From the 1970s on, the number of birth started to increase while the number of deaths started to decrease. This led to a natural balance higher than that of the EU27 average. This result is linked to migration since migrants arrived young and in age of having children which impacted on the number of deaths and births.

GINI Country Report Luxembourg
Page 48
Figure 3.11: Total fertility rate, 1967-2008
Source: STATEC, http://www.statistiques.public.lu/stat/TableViewer/tableView.aspx?ReportId=452&IF_Language=fra&MainTheme=2&FldrName=2&RFPath=101
Figure 3.12: Mother's mean age at childbirth
Source: Eurostat
The share of births out of wedlock has dramatically increased over the same period of time. It has
remained almost negligible (less than 5%) until the 1980s, then increased steadily during the next 30
years to reach 35% in 2011 (Figure 3.13). As mentioned by STATEC (2011), this is however below the
0,5
0,7
0,9
1,1
1,3
1,5
1,7
1,9
2,1
2,3
2,51
97
0
19
72
19
74
19
76
19
78
19
80
19
82
19
84
19
86
19
88
19
90
19
92
19
94
19
96
19
98
20
00
20
02
20
04
20
06
20
08
20
10
Total population Luxembourgish population Foreign population
25
26
27
28
29
30
31
32

GINI Country Report Luxembourg
Page 49
EU27 average (38%) and below the values of France (54%) and Belgium (47%) and at the level of
Germany (34%).
Figure 3.13: Share of births outside marriage, 1960 - 2011
Source: Eurostat
Average household size decreased over the period 1960-2001. It was on average equal to 3.07 in
1970, and is 2.5 thirty years later (cf. Table 3.1.). This figure puts Luxembourg at the last rank of all
OECD countries (OECD family database).19
Table 3.1: Average size of households in Luxembourg, 1960 - 2001
years 1970 1981 1991 2001
Average size 3.07 2.79 2.61 2.51
Source: STATEC
The number of single-parent families has not really changed between 2003 and 2010 (Figure 3.14). In
2010, around 3.5% of the households are in such a situation, which is much less than in other
European countries (for example, there were already 9.1% in Belgium in 2001).20
19 see http://www.oecd.org/els/socialpoliciesanddata/41919509.pdf 20 Survey data presented in Table A2 in annex suggest that the stability in the proportion of individuals living in single parent families goes back to the middle of the 1980s.
0
5
10
15
20
25
30
35
40
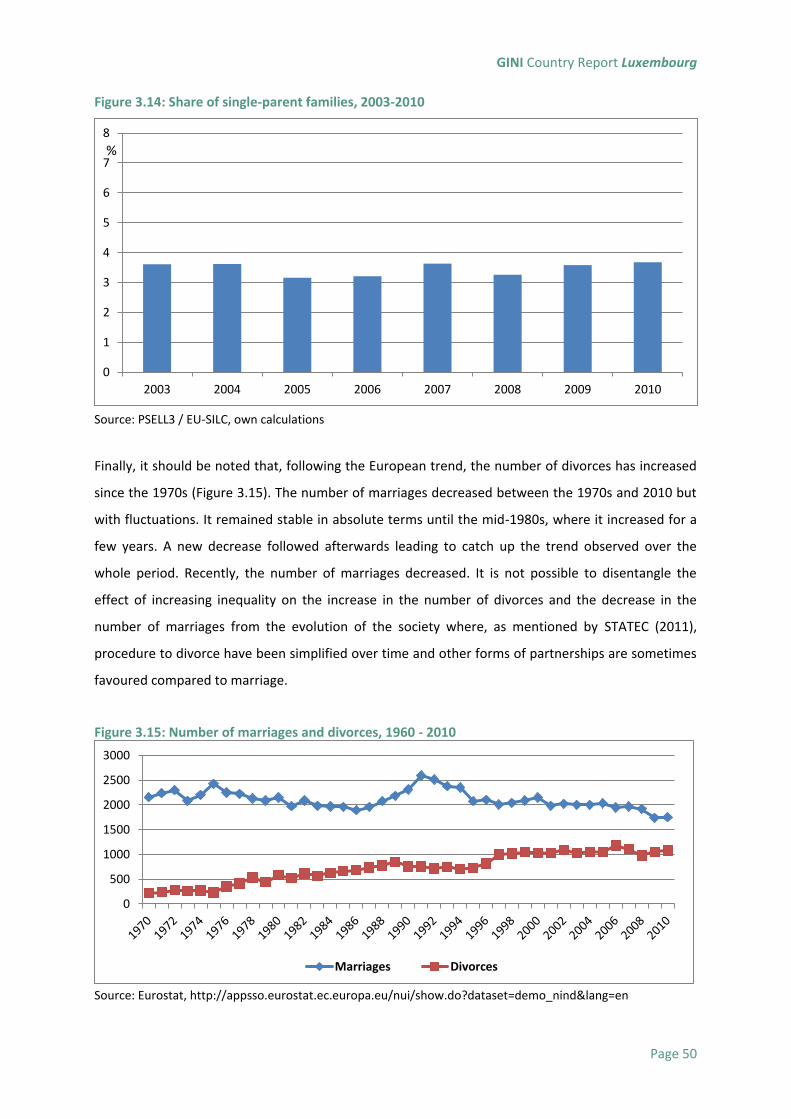
GINI Country Report Luxembourg
Page 50
Figure 3.14: Share of single-parent families, 2003-2010
Source: PSELL3 / EU-SILC, own calculations
Finally, it should be noted that, following the European trend, the number of divorces has increased
since the 1970s (Figure 3.15). The number of marriages decreased between the 1970s and 2010 but
with fluctuations. It remained stable in absolute terms until the mid-1980s, where it increased for a
few years. A new decrease followed afterwards leading to catch up the trend observed over the
whole period. Recently, the number of marriages decreased. It is not possible to disentangle the
effect of increasing inequality on the increase in the number of divorces and the decrease in the
number of marriages from the evolution of the society where, as mentioned by STATEC (2011),
procedure to divorce have been simplified over time and other forms of partnerships are sometimes
favoured compared to marriage.
Figure 3.15: Number of marriages and divorces, 1960 - 2010
Source: Eurostat, http://appsso.eurostat.ec.europa.eu/nui/show.do?dataset=demo_nind&lang=en
0
1
2
3
4
5
6
7
8
2003 2004 2005 2006 2007 2008 2009 2010
%
0
500
1000
1500
2000
2500
3000
Marriages Divorces

GINI Country Report Luxembourg
Page 51
3.6. Health indicators
Life expectancy
The life expectancy at birth has increased steadily over the last three decades: from 75.6 years old in
1980 to 83.5 years old in 2010 for women, and from 70 years old up to 77.9 years old for men (see
Figure 3.16). In 1998, men life expectancy in Luxembourg (73.7) was lower than that of the Euro zone
average (74.7) while in 2009, it was higher (78.1 vs. 77.8). These results show that the country is
following the global tendency of most of the OECD countries. The increase of life expectancy coupled
with a stabilization of fertility rates at a level which does not allow the renewal of generations led to
an ageing of the population.
Figure 3.16: Life expectancy at birth by sex, 1980-2010
Source: OECD (2011b), « OECD Health Data: Selected Data », OECD Health Statistics (database)
Even if the life expectancy is a common demographic indicator, it does not allow us to know if the
ageing of the population is accompanied by an increased in time spent in good health. Indicators of
‘healthy life expectancy’ (HLE) serve this purpose.
60
65
70
75
80
85
90
19
80
19
81
19
82
19
83
19
84
19
85
19
86
19
87
19
88
19
89
19
90
19
91
19
92
19
93
19
94
19
95
19
96
19
97
19
98
19
99
20
00
20
01
20
02
20
03
20
04
20
05
20
06
20
07
20
08
20
09
20
10
Females at birth Males at birth

GINI Country Report Luxembourg
Page 52
Figure 3.17: Healthy life expectancy at birth, by sex
Source: Eurostat, EuroBase
The HLE indicator in Figure 3.17 shows that, in 2010, a man at birth could expect to spend 64.5 years
(of the 77.9 years of his life) without activity limitations due to health problems (this represents 83%
of his total life). For women, the life expectancy in good health is 66 years (79% of total years of life
expected at birth). Even if the HLE of females is higher than for males, this gap is lower than the gap
observed between these two groups with the conventional life expectancy. Between 2004 and 2010
men earned at birth five years of additional life expectancy free of health limitations, against nearly
six years for women.
The increase in life expectancy in good health between 2004 and 2010 is faster than the increase in
total life expectancy, so that the share of healthy life in the lives of individuals is also growing. For
men, it increased from 78% in 2004 to 83% in 2010, while it increased from 73% to 79% for women.
We can say that individuals live not only longer but also live longer, healthier lives.
Mortality
The number of death per 100 000 residents in Luxembourg (Figure 3.18) has decreased drastically
from 1500.4 (1533) in 1980 to 768.8 (812.6) in 2009 for the female (male) group. The number of
death includes all the causes of mortality from health diseases as certain infectious and parasitic
diseases and malignant neoplasms, among others. This decrease can be associated to more efficient
treatments, a better social security coverage and disease prevention campaigns.
54
56
58
60
62
64
66
68
2004 2005 2006 2007 2008 2009 2010
Males Females

GINI Country Report Luxembourg
Page 53
Figure 3.18: Number of death per 100 000 residents
Source: OECD (2011b), « OECD Health Data: Selected Data », OECD Health Statistics (database)
Self-assessed health
Figures 3.19, 3.20 and 3.21 show the percentage of the population, aged 15 years old and over, who
report their health to be 'good' or 'better' by income quintile, sex and age respectively. In particular,
individuals have answered the following question: “How is your health in general? ‘Very good’,
‘Good’, ‘Fair’, ‘Bad’ or ‘Very bad’” (OECD, 2011b). In general terms, the percentage of individuals
considering their health status as good or better has increased from 1996 to 2010.
An income gradient in self-reported health is observed (Figure 3.19) When dividing the residents of
Luxembourg by income quintiles, the proportion of individuals belonging to the richest quintile
declaring that their health status good or better (83.9% in 2010) is higher than the proportion of
individuals belonging to the poorest quintile (69.1%). This gap is however declining over time from
1996 (78.6% for the highest quintile versus 58.1% for the lowest quintile) and 2003 (81.9% vs.
61.4%).
0
200
400
600
800
1000
1200
1400
1600
1800
19
80
19
81
19
82
19
83
19
84
19
85
19
86
19
87
19
88
19
89
19
90
19
91
19
92
19
93
19
94
19
95
19
96
19
97
19
98
19
99
20
00
20
01
20
02
20
03
20
04
20
05
20
06
20
07
20
08
20
09
Deaths per 100 000 females (standardised rates) Deaths per 100 000 males (standardised rates)

GINI Country Report Luxembourg
Page 54
Figure 3.19: Perceived health status by income quintile
Source: OECD (2011b), « OECD Health Data: Selected Data », OECD Health Statistics (database)
Figure 3.20: Perceived health status by sex
Source: OECD (2011b), « OECD Health Data: Selected Data », OECD Health Statistics (database)
During the whole period (from 1996 to 2010), the percentage of male declaring their health as being
good or better is higher for males than females. However, this gap is being reduced over time (see
Figure 3.20). Unsurprisingly, the percentage of individuals claiming to have good health is lower the
higher is their age group (Figure 3.21). It is interesting to note that the percentage of those aged at
least 65 shows an increase of 13.4 percentage points, between 1996 and 2010, which represents the
group of age with the largest increase.
58,1 61,4 61,6
65,1 68,1
65,3 64,2 66,8 69,1
78,6 81,9 79,9 78,4
83,3 82,5 82,7 84,3 83,9
0
10
20
30
40
50
60
70
80
90
1996 … 2003 2004 2005 2006 2007 2008 2009 2010
Health >= good, total, income quintile 1 (lowest) Health >= good, total, income quintile 5 (highest)
62
70 70,6 71,9 72,3 72,8 72,7 71,8 74 70,4
75,1 74,1 75,5 76,2 76,1 75,5 76,4 76,7
0
10
20
30
40
50
60
70
80
90
1996 … 2003 2004 2005 2006 2007 2008 2009 2010
Health >= good, female, all ages Health >= good, male, all ages
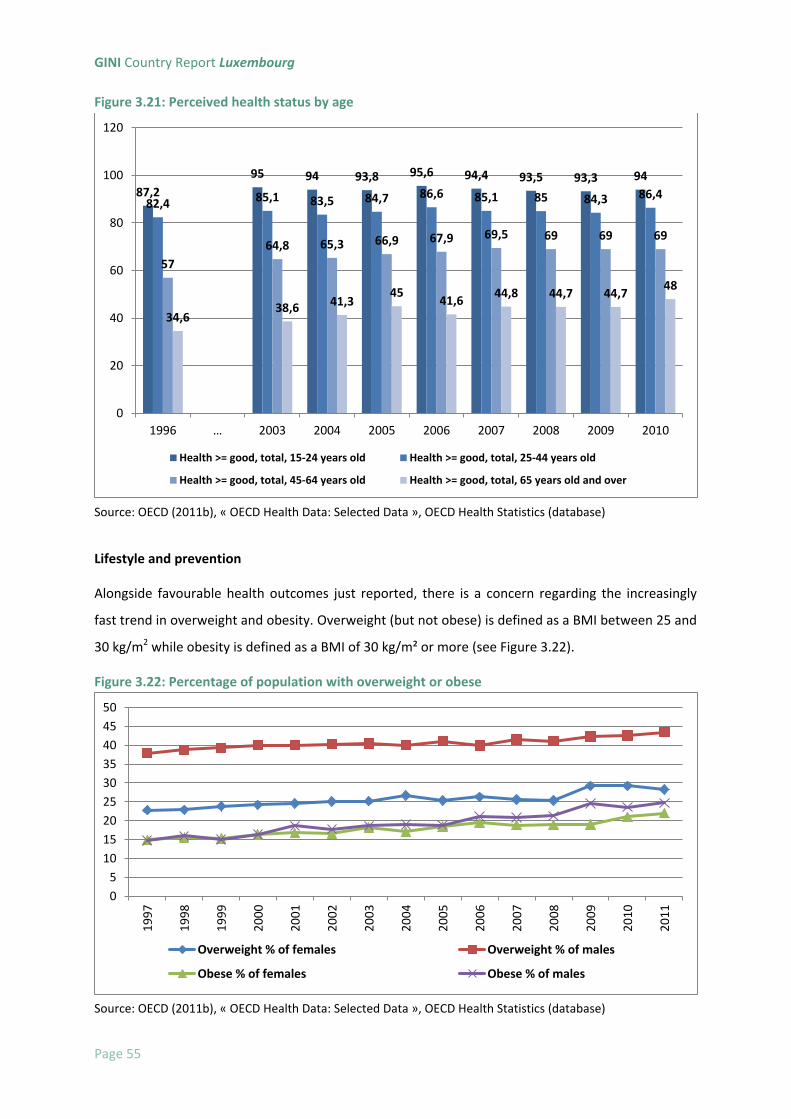
GINI Country Report Luxembourg
Page 55
Figure 3.21: Perceived health status by age
Source: OECD (2011b), « OECD Health Data: Selected Data », OECD Health Statistics (database)
Lifestyle and prevention
Alongside favourable health outcomes just reported, there is a concern regarding the increasingly
fast trend in overweight and obesity. Overweight (but not obese) is defined as a BMI between 25 and
30 kg/m2 while obesity is defined as a BMI of 30 kg/m² or more (see Figure 3.22).
Figure 3.22: Percentage of population with overweight or obese
Source: OECD (2011b), « OECD Health Data: Selected Data », OECD Health Statistics (database)
87,2
95 94 93,8 95,6 94,4 93,5 93,3 94
82,4 85,1 83,5 84,7 86,6 85,1 85 84,3 86,4
57
64,8 65,3 66,9 67,9 69,5 69 69 69
34,6 38,6 41,3
45 41,6
44,8 44,7 44,7 48
0
20
40
60
80
100
120
1996 … 2003 2004 2005 2006 2007 2008 2009 2010
Health >= good, total, 15-24 years old Health >= good, total, 25-44 years old
Health >= good, total, 45-64 years old Health >= good, total, 65 years old and over
0
5
10
15
20
25
30
35
40
45
50
19
97
19
98
19
99
20
00
20
01
20
02
20
03
20
04
20
05
20
06
20
07
20
08
20
09
20
10
20
11
Overweight % of females Overweight % of males
Obese % of females Obese % of males

GINI Country Report Luxembourg
Page 56
Overweight has increased from 22.8% (37.9%) in 1997 to 28.3% (43.5%) in 2011 for females (males).
The percentage gap between males and females is constant over time. Obesity has increased from
14.8% (14.9%) to 24.7% (22%) for males (females) (see Figure 3.22). In 1997, the proportion of males
and females suffering from obesity was similar while in 2011, males display a higher obesity rate than
women. These indicators are alarming because obesity is known to be associated with a severe
decline in life expectancy of those affected: it is associated with a higher risk of developing different
types of health problems such as certain types of cancer, heart diseases, stroke and diabetes.
Figure 3.23: Percentage of population with overweight or obese by activity, 2008
Source: Pi Alperin and Berzosa (2011)
Figure 3.23 shows the percentage of population overweight or obese according to their position in
the labour market in 2008. As Hernandez-Quevedo et al. (2010) point out, those individuals who are
unemployed, retired or housewife report a worst health than those who have an activity. In general
terms, it is possible to say that, in Luxembourg, individuals occupying more educated employment
have less overweight or obese problems (Pi Alperin and Berzosa (2011) have constructed the activity
dimension depending on the skill levels). This can be confirmed if we analyse the percentage of the
population overweight or obese by level of education (Figure 3.24). Since 1995, the percentage of
individuals with none or only a primary school level having some degree of overweight is more
important than for those having secondary or post-secondary studies. Precisely, in 2008, 66.8%,
53.8% and 44% of individuals with none or primary, secondary and post-secondary level of school are
overweight or obese, respectively.
33,9
28,3
48,1
14,5
23,9
8,8
17,8
9,9
40,2
29,3
42,7 46,1
58,0 54,7 53,2
0
10
20
30
40
50
60
70
Professional Intermediate Workman Manual Inactive
Males Females Total

GINI Country Report Luxembourg
Page 57
Figure 3.24: Percentage of population with overweight or obese by education level
Source: Tchicaya and Lorentz (2010)
No clear variations in overweight or obesity problems are observed across nationalities. Figure 3.25
shows that the percentage of individuals affected by some degree of overweight is similar for natives
from Luxembourg, Portuguese immigrants and other immigrants.
Figure 3.25: Percentage of population with overweight or obese by nationality
Source: Tchicaya and Lorentz (2010)
56,6
63 66,8
47,5 52,4 53,8
46,1
40,2 44
0
10
20
30
40
50
60
70
80
1995 2005 2008
None or primary Secondary Post-secondary
52,0 54,5 55,8
49,8
55,3
60,4
51,1 48,4
50,8
0,0
10,0
20,0
30,0
40,0
50,0
60,0
70,0
1995 2005 2008
LU PT Others

GINI Country Report Luxembourg
Page 58
Finally, the annual consumption of tobacco items (e.g. cigarettes, cigars) in grams per person aged 15
years or more is presented in Figure 3.26. The percentage of smokers has decreased in Luxembourg
between 2001 and 2011. This tendency is similar to the other OECD countries. In this time period the
percentage of males who are daily smokers is more important than the percentage of females.
However, the proportion of males that have stopped the consumption of tobacco since 2001 is more
important than the proportion of females.
Figure 3.26: Consumption of tobacco
Source: OECD (2011b), « OECD Health Data: Selected Data », OECD Health Statistics (database)
3.7. Housing tenure
The proportion of households owning their accommodation increased steadily since the end of
World War II. Table 3.2 indicates that 49% of private households owned their accommodation in
1947, 59% in 1981 and 67% in 2001 which corresponds to the last census data available at the time
of preparing this report. According to subsequent survey data, the proportion of owners kept
increasing until 2007 (71%) before decreasing to the level of 67% in 2010.
Despite high housing costs in general, the proportion of people for which housing costs can be
considered excessive in comparison to their income is relatively low and quite stable, i.e. 4% of the
population lives in a household where the housing costs are higher than 40% of the disposable
income, although 10% of the population is in this situation at the EU level. A small impact of the
financial crisis is visible in Luxembourg in 2010 but should be confirmed with additional data.
23 22 22 23
19 18 18 18 17 16 16
29 30
34
30 27
24 24 23 22 21 18
0
5
10
15
20
25
30
35
40
2001 2002 2003 2004 2005 2006 2007 2008 2009 2010 2011
% of females aged 15+ who are daily smokers % of males aged 15+ who are daily smokers

GINI Country Report Luxembourg
Page 59
Table 3.2: Distribution of Households, by tenure status
owner non owner not indicated
1947 49% 50% 1%
1960 55% 45% 0%
1970 56% 44% 0%
1981 59% 39% 1%
1991 64% 33% 3%
2001 67% 30% 4%
2007 71% 29%
2010 67% 33%
Source: PSELL3/EU-SILC survey data for 2007 and 2010 and census data otherwise
Figure 3.27: High housing costs rates (%), EU-27 and Luxembourg, 2005-2010
Source: Eurostat (EU-SILC)
Notes: The high housing cost rate is the percentage of the population living in households where the total housing costs ('net' of housing allowances) represent more than 40% of disposable income ('net' of housing allowances).
In terms of risk factors, Figure 3.28 shows that the problem is concentrated on some social groups:
25% of those with low income and 15% of tenants at market price (i.e. not benefiting from a reduced
or “social” price) suffer from high housing costs.
0,0
2,0
4,0
6,0
8,0
10,0
12,0
14,0
2005 2006 2007 2008 2009 2010
Luxembourg EU-27
%

GINI Country Report Luxembourg
Page 60
Figure 3.28: High housing costs rates (%), by tenure status and income poverty status, Luxembourg, 2010
Source: Eurostat (EU-SILC)
3.8. Crime and punishment
Statistics on crime and criminal justice systems for the total number of recorded crimes are available
on Eurostat website. The total number of crimes recorded by the police initially decreased but
started to rise from 2000 on reflecting the increase in number of crimes linked to drug trafficking.
Figure 3.29: Crimes recorded by the police, 1998-2009
Source Eurostat website. http://appsso.eurostat.ec.europa.eu/nui/show.do?dataset=crim_gen&lang=en
0 5 10 15 20 25 30
Owner, with mortgage or loan
Owner, no outstanding mortgage or housing loan
Tenant, rent at market price
Tenant, rent at reduced price or free
Income poor
Not income poor
0
5.000
10.000
15.000
20.000
25.000
30.000
35.000
19
93
19
94
19
95
19
96
19
97
19
98
19
99
20
00
20
01
20
02
20
03
20
04
20
05
20
06
20
07
20
08
20
09

GINI Country Report Luxembourg
Page 61
The number of individuals in prison increased from around 400 in 1993 to almost 700 in 2009. In
1999, the prison population per 100000 thousand inhabitants was of 90.3 and it increased to 137.6
per 100000 inhabitants in 2009.21 This increase is linked to the increase in number of crimes –
especially crimes linked to drug trafficking.
Figure 3.30: Prison population units, 1998-2009
Source Eurostat website. (http://appsso.eurostat.ec.europa.eu/nui/show.do?dataset=crim_pris&lang=en)
3.9. Subjective measures of well-being, satisfaction, ‘happiness’
The feeling of happiness was measured by selected questions from the European Values Study that
covers years 1999 and 2008. The respondents were asked to respond to the following: “Taking all
things together, would you say you are: 1. Very happy; 2. Quite happy 3. Not very happy; 4. Not at all
happy”. The data show that around 93% of the population feels quite happy or very happy both in
1999 and 2008. The feeling of happiness was stable between 1999 and 2008. The mean value for
1999 was of 1.71 and for 2008 it was of 1.69 and the distributions are very similar (see Figure 3.31.).
21 Source : http://epp.eurostat.ec.europa.eu/statistics_explained/images/archive/3/3a/20121214153659!Prison_population%2C_1999-2009.png. A break in the serie occurred between 2004 and 2009.
0
100
200
300
400
500
600
700
800
19
93
19
94
19
95
19
96
19
97
19
98
19
99
20
00
20
01
20
02
20
03
20
04
20
05
20
06
20
07
20
08
20
09

GINI Country Report Luxembourg
Page 62
Figure 3.31: Feeling of happiness in Luxembourg, percentages
Source: European Values Study, own calculations
Figure 3.32 provides a longer term perspective on the evolution of life satisfaction in Luxembourg
based on Eurobarometer data. Since the beginning of the 1980s, the country level of life satisfaction
is fairly stable at a high level. On average the proportion of individuals at least fairly satisfied is higher
than 90%. Peaks of happiness occurred in 1991 and 2004 when more than 50% of the population
declared themselves very satisfied. Over the period, the proportion of individuals not at all satisfied
remained very low. The analysis of this social outcome suggests that the modest increase in
inequality did not affect substantially the level of happiness and life satisfaction in Luxembourg.
0%
10%
20%
30%
40%
50%
60%
70%
80%
90%
100%
1999 2008
Don't know Very happy Quite happy Not very happy Not at all happy

GINI Country Report Luxembourg
Page 63
Figure 3.32: Life satisfaction in Luxembourg, percentages
Source: Eurobarometer: http://ec.europa.eu/public_opinion/cf/index_en.cfm
3.10. Intergenerational mobility in education and occupation
Recent research by the OECD (2010c) shows that Luxembourg has one of the highest correlation
between characteristics of parents and the income of the descendants. The OECD report also
mentions education as the key driver of persistence in wages, suggesting that inequalities in
secondary education are likely to translate into inequalities in further level of education and in later
earnings inequality. The penalty of growing up in a low educated family in Luxembourg is found to be
around 16% relative to wages earned by individuals raised in a better-educated family.
In this section we try to gather some additional evidence on the intergenerational mobility in
educational level and occupation in Luxembourg. The analysis is based on data from PSELL3/EU-SILC
of 2005 which contains a module on intergenerational transmission, where retrospective questions
about parental education and occupation were asked. A caveat emptor for analysis of
intergenerational transmission in Luxembourg is of course that massive immigration flows leads to a
current population with very diverse generational backgrounds – many of today’s residents have
grown in diverse foreign countries. It also makes assessments of trends over time in mobility
hazardous since population composition changes have been important.
0%
10%
20%
30%
40%
50%
60%
70%
80%
90%
100%ap
r-8
0
jul-
81
okt
-82
jan
-84
apr-
85
jul-
86
okt
-87
jan
-89
apr-
90
jul-
91
okt
-92
jan
-94
apr-
95
jul-
96
okt
-97
jan
-99
apr-
00
jul-
01
okt
-02
jan
-04
apr-
05
jul-
06
okt
-07
jan
-09
apr-
10
jul-
11
Very satisfied Fairly satisfied Not very satisfied Not at all satisfied Don't know

GINI Country Report Luxembourg
Page 64
Mobility in education
Table 3.3 reports the transition matrices we estimated for the whole sample of 6,542 respondents
aged more than 24 at the time of the survey. For each child, the matrix gives the percentage
probability of reaching a certain level of education conditional on parent’s educational attainment.
Row probabilities add up to 100.
We first compare educational attainments of successive generations along a gender dimension
(father-son and mother-daughter). Both among female and male the probability of attaining only a
primary level of education, conditional on the parent having that same level, is still pretty high
(almost 40%) while the probability of reaching the highest level of education is only 13% for women
and 17% for men. This probability goes to 83% and 72% respectively if the parents are instead highly
educated. These results show slightly less mobility among women than men. The ratio between the
frequencies on the diagonal as compared to the case of perfect mobility, which we will define as the
immobility index from now on, is in fact higher for the mother-daughter transmission (1.72 against
1.66 for male). At the same time women seem to experience more upward mobility than men, as we
can evince from the ratio between the frequencies above and below the diagonal in the same
transition matrices (4.92 against 4.51).22
Table 3.3: Transition Matrices by Gender (Whole sample) - Education
Father\Son Primary Lower secondary Upper secondary Tertiary
Primary 37.7 10.1 34.3 18.0
Lower secondary 4.0 13.1 34.3 48.5
Upper secondary 4.9 8.7 43.1 43.3
Tertiary 1.9 4.8 21.1 72.2
Mother\Daughter Primary Lower secondary Upper secondary Tertiary
Primary 39.1 13.3 34.5 13.1
Lower secondary 5.9 16.0 31.6 46.5
Upper secondary 3.6 12.0 33.8 50.7
Tertiary 0.0 1.4 15.6 82.9
Source: PSELL-3/EU-SILC 2005, authors' computation
22 The immobility index is bounded between 1 (perfect mobility) and n=the number of categories, 4 in this case (perfect immobility). Upward/downward mobility is higher than 1 if there is more upward mobility than downward, is equal to 1 in case of perfect mobility and lower if there is more downward mobility than upward. In case of perfect immobility it is equal to zero.

GINI Country Report Luxembourg
Page 65
In order to approach the intertemporal pattern of mobility, given the lack of longer panel data for
Luxembourg, the sample is divided in four cohorts of similar size composed by the individuals born in
1925-1945, 1946-1957, 1958-1969 and 1970-1980.
From a gender prospective, we can notice that female situation has improved significantly, moving
from only a 12% of women with tertiary education among the oldest cohort to a 43% in the youngest
one, while the distribution of education among men does not show any particular difference over
cohorts (See Figure A2 in Annex).
Analyzing the intertemporal pattern of mobility we can notice that intergenerational mobility is
higher for the oldest cohort, as confirmed also by a lower value of the immobility index (Table 3.4).
This is true in particular for women, for which, while general mobility seems to decrease for the
cohort born right after the end of the Second World War and then to increase again for the youngest
cohort, as for the male population, the upward mobility shows instead a clear increasing trend.
Table 3.4: Indicators of mobility by gender and cohort - Education
Male Female
Immobility Index Upward/Downward Immobility Index Upward/Downward
1970-1980 1.61 4.42 1.58 7.98
1958-1969 1.70 3.60 1.71 4.48
1946-1957 1.78 4.69 1.79 3.51
1925-1945 1.42 3.96 1.25 1.40
Source: PSELL-3/EU-SILC 2005, authors' computation
If we repeat the analysis comparing the level of education of the second generation with the highest
level of education of the parents, we notice, as expected given the distribution of education by
gender, that the mobility indicators for male are mainly unaffected while we find a greater
immobility for the oldest cohort and a generally lower upward mobility amongst female (see Table
A3 and A4 in annex).
Luxembourg is a country of immigration and this should be considered also in analysing
intergenerational mobility. Focusing on the lowest and the highest level of education, we can at first
notice a lower mobility among both male and female migrant compared to native (See Table A5 in
annex). A native male with father in the lowest educational group has 25% (33% for female)
probability of remaining in the same educational class compared to 52% (46% for female) for a
migrant. Looking at the other extreme of the parents distribution, the probability of transmission of

GINI Country Report Luxembourg
Page 66
the highest educational level is 60% (78% for female) for natives compared to 81% (85% for female)
for migrants, respectively. Considering the transition matrices by gender and by migration status for
the whole sample, we find greater mobility among male natives than migrants, while the opposite is
true for female. Mobility among migrant is consistently more directed upward than among native,
also once we consider each cohort separately.23 Of particular interest is to look at the evolution over
time of these differences. While again male situation does not present any significant change over
cohort, the female situation has improved among the native population (from 10 % to 43% with a
tertiary education and from 32% to 10% with primary education), while, although migrant population
was already more educated, the 27% of female migrant in the youngest cohort (compare to the 10%
of native) has reached only the lowest level of education (in Fig. A3 in annex are presented the
transition probabilities by migration status for female of the youngest cohort and the cohort born in
1946-1957).24
Table 3.5: Indicators of mobility by gender and migration status - Education
Male Female
Immobility
Index Upward/Downward Immobility Index Upward/Downward
Native 1.51 3.09 1.75 3.43
Migrant 1.70 6.27 1.66 7.17
Nat
ive
1970-1980 1.29 3.62 1.47 7.50
1958-1969 1.53 2.61 1.73 2.89
1946-1957 1.65 2.78 1.61 1.58
1925-1945 1.44 3.92 1.00 3.03
Mig
ran
t
1970-1980 1.80 5.75 1.66 9.38
1958-1969 1.65 5.61 1.63 6.09
1946-1957 1.77 9.52 1.75 8.61
1925-1945 1.35 4.39 1.19 2.21
Source: PSELL-3/EU-SILC 2005, authors' computation
23 The only exception is the oldest cohort. The sample of migrant for this cohort contains only 87 women. 24 As explained in the previous note, we choose this cohort and not the oldest because we have only 87 female migrant belonging to that cohort.

GINI Country Report Luxembourg
Page 67
Also when we consider mobility by migration status, comparing the level of education of the female
with the highest level among the parent, generally decreases mobility more among the migrant than
the native, while it decreases the upward mobility for the entire female sample, leaving higher level
for migrant (see Table A6).
Mobility in occupation
As far as occupation is concerned, starting from the available data in the 2005 wave of PSELL-3/EU-
SILC, we grouped the ISCO-88 categories into 6 type of occupation (Manager/Professional,
Technicians, Clerks, Skilled agricultural/craft workers, Blue-collar, Elementary occupations) and we
replicate for those the same analysis we described before for education.
Table 3.6 shows the highest persistence in the managerial and professional occupation (57% for men
and 44% for female) and the lowest for elementary occupations for male (less than 10%) and for
blue-collar for female (4%).
Mobility in occupation turns out to be slightly higher for female (immobility index 1.71 for male and
1.60 for female), although it seems to be characterized by a lower upward mobility with respect to
men (1.73 against 2.48). Again from a gender perspective, if we calculate the same transition
probability by cohort we can notice some relevant changes for women, who, as we have already
noticed above regarding educational attainment, are increasing their presence in more skilled
occupations as technician and manager/professional (21% and 22% respectively for the youngest
cohort instead of 12% and 11% for the women born between 1925-1945), showing then a greater
mobility than man, for which we do not find any significant change over the period.
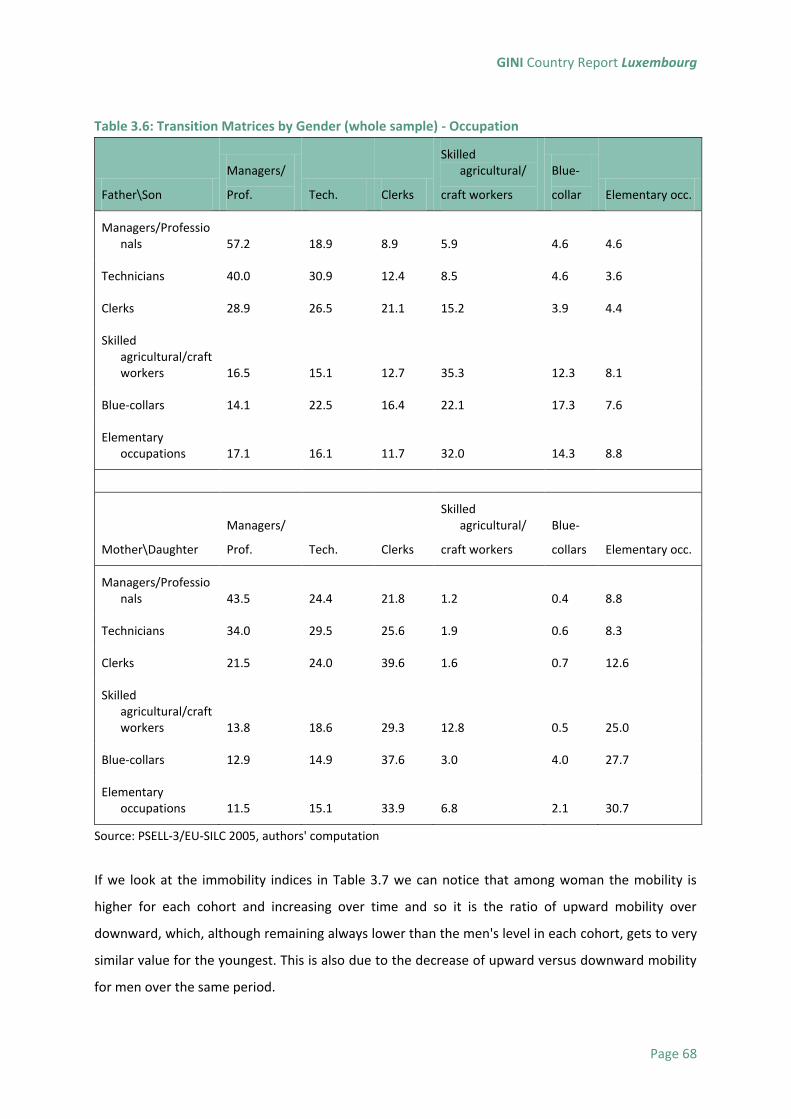
GINI Country Report Luxembourg
Page 68
Table 3.6: Transition Matrices by Gender (whole sample) - Occupation
Father\Son
Managers/
Prof. Tech. Clerks
Skilled agricultural/
craft workers
Blue-
collar Elementary occ.
Managers/Professionals 57.2 18.9 8.9 5.9 4.6 4.6
Technicians 40.0 30.9 12.4 8.5 4.6 3.6
Clerks 28.9 26.5 21.1 15.2 3.9 4.4
Skilled agricultural/craft workers 16.5 15.1 12.7 35.3 12.3 8.1
Blue-collars 14.1 22.5 16.4 22.1 17.3 7.6
Elementary occupations 17.1 16.1 11.7 32.0 14.3 8.8
Mother\Daughter
Managers/
Prof. Tech. Clerks
Skilled agricultural/
craft workers
Blue-
collars Elementary occ.
Managers/Professionals 43.5 24.4 21.8 1.2 0.4 8.8
Technicians 34.0 29.5 25.6 1.9 0.6 8.3
Clerks 21.5 24.0 39.6 1.6 0.7 12.6
Skilled agricultural/craft workers 13.8 18.6 29.3 12.8 0.5 25.0
Blue-collars 12.9 14.9 37.6 3.0 4.0 27.7
Elementary occupations 11.5 15.1 33.9 6.8 2.1 30.7
Source: PSELL-3/EU-SILC 2005, authors' computation
If we look at the immobility indices in Table 3.7 we can notice that among woman the mobility is
higher for each cohort and increasing over time and so it is the ratio of upward mobility over
downward, which, although remaining always lower than the men's level in each cohort, gets to very
similar value for the youngest. This is also due to the decrease of upward versus downward mobility
for men over the same period.

GINI Country Report Luxembourg
Page 69
Table 3.7: Indicators of mobility by gender and cohort - occupation
Male Female
Immobility Index Upward/Downward Immobility Index Upward/Downward
1970-1980 1.88 2.04 1.46 1.81
1958-1969 1.56 2.82 1.48 1.84
1946-1957 1.80 2.69 1.66 1.53
1925-1945 1.73 3.36 1.50 1.27
Source: PSELL-3/EU-SILC 2005, authors' computation
Considering the low participation in the labour force of the mother of especially the oldest cohort, it
is interesting to repeat the analysis considering the parent with the highest level of occupation. This
results in higher upward mobility for women than men (see Table A7 and A8).
In comparing native and migrant, we can first notice that the distribution in occupational categories
is similar for male, with a tendency for migrant to be more present in the two class requiring more
skills, while there is a stronger presence of migrant woman working in elementary occupation (31%)
with respect to native (only 13%).
The main difference in terms of transmission comes from the highest probability for a migrant with a
father/mother in a managerial/professional occupation to be a manager/professional as well, (62%
compared to less than 50% for male and 49% to 36% for female) and the highest upward mobility for
migrant than for native (46% against 35% for male and 38% to 25% for female) from technicians'
parents to Manager or Professional children.

GINI Country Report Luxembourg
Page 70
Table 3.8: Indicators of mobility by gender and migration status - occupation
Male Female
Immobility
Index Upward/Downward Immobility Index Upward/Downward
Native 1.68 2.54 1.55 1.85
Migrant 1.67 2.22 1.60 1.49
Nat
ive
1970-1980 1.81 1.95 1.51 3.45
1958-1969 1.48 2.71 1.31 2.18
1946-1957 1.79 2.42 1.45 1.30
1925-1945 1.78 4.00 1.38 2.41
Mig
ran
t
1970-1980 1.87 1.51 1.41 1.16
1958-1969 1.59 2.68 1.59 1.65
1946-1957 1.65 2.71 1.74 1.57
1925-1945 1.38 2.40 1.74 1.28
Source: PSELL-3/EU-SILC 2005, authors' computation
Looking at the intertemporal evolution of mobility, we notice an increasing pattern for migrant
female: intergenerational mobility for this group is even higher than for native for the youngest
cohort. This pattern is reversed if we compare migrant female occupation with the highest
occupational level of occupation among their parents. The ratio of upward mobility is shown to be
generally lower for migrant with respect to native and especially low for migrant women in the
youngest cohort, one possible reason for this could be found in a distribution of occupation already
quite skewed to the more skill-requiring jobs. This ratio is instead higher for migrant women if we
compare their situation to the one of the parent with the highest occupation and this is especially
true for the oldest cohorts (see Table A9).
3.11. Conclusions
Luxembourg represents a special case in terms of social impacts. We started this chapter by asking
whether the positive effects linked to the increase of overall living standards, but also of the
development of effective welfare institutions, have prevailed or not compared to the potential
negative effects of the moderate increase in income inequality when considering the evolution of a
set of social outcomes. To date, the increase in income inequality does not seem to have had a

GINI Country Report Luxembourg
Page 71
strong impact on most of the social outcomes considered in this project. Material deprivation in
Luxembourg is among the lowest in Europe, the level of happiness and life satisfaction is stable at
high levels and the overall level of health has improved. The outcomes that worsened over time are
obesity, the level of crimes and of population imprisoned which only recently increased. Overall, the
results suggest that the moderate increase in inequality in Luxembourg over the last decades was not
high enough to matter in this country, given the increase of the overall living standards.
Evidently, this positive aggregate evolution should not hide the fact that, at subgroup levels, several
gradients can be identified. For example, we observe that some less-skilled populations, the income
poor or non EU27 citizens, do lag behind. Low educated are more likely to be materially deprived, at
risk of poverty and social exclusion and overweight or obese than higher educated. In the same line,
low incomes or income poor are more likely to be materially deprived or house deprived, to live in an
overcrowded household, not to be able to ask for help to friends and relatives than high income or
non-income poor; they are also less likely to perceive their health as good. Finally, migrants,
especially non EU27, are also more likely to be house deprived or at risk of poverty and social
exclusion than Luxembourgers. Nevertheless we do not identify here clear trends in such social
gradients.

GINI Country Report Luxembourg
Page 72
4. Political and cultural impacts
4.1. Introduction
This chapter addresses political and cultural impacts. We describe trends in political and civic
participation (Section 4.2), trust and support towards institutions and the EU (Section 4.3), political
values, legitimacy and attitudes towards immigrants (Section 4.4) and attitudes towards inequality
and individual responsibility (Section 4.5). Most of the figures presented in the next sections are
derived from survey data, and again cover only the resident population.
4.2. Political and civic participation
Voting and political participation
Voting in national elections is compulsory for all Luxembourg citizens. Failing to vote is subject to
financial penalties. The obligation to vote applies in local and European elections too. In local
elections, the obligation extends over all residents, while for the European Parliament only EU
nationals have to vote. However, there are restrictions. In order to vote in local elections, the
residents that are not Luxembourgish citizens should have already spent at least five years in the
country. For being on the electoral roll for EU elections, the EU citizens should have been residing in
Luxembourg for at least two years.
Since 1945, the national voter turnout remains stable around 90% of registered electors. This is
slightly lower than in Belgium, where voting is also mandatory. Considering now all residents of
voting age, the turnout sharply decreases since the 1960s. The peak was registered in 1959, then in
1974, when 74% of the residents voted at national elections. Since then, the high immigration flows
led to a continuous decline: the voting age population increased much faster than registered voters.
Luxembourg faces today the risk to have a turnout of less than 50%. This is somewhat paradoxical in
a country where voting is made mandatory by law, and this contributes to discrepancies in rights
between national and non-national residents.
The situation is not much different when considering the ballot for the European Parliament. There
are slightly more voters registered. For instance, in 2009, for the EU elections the number of
residents who registered to voting exceeded with 16827 the one recorded for the same year national
elections. The difference represents 7,5 percent points out of the total number of registered voters.
It led to a similar increase of the total expressed votes.

GINI Country Report Luxembourg
Page 73
Figure 4.1: Voter turnout in national elections
Data source: Idea Voter Turnout Database (www.idea.int/vt/country_view.cfm?CountryCode=LU). The thick
lines are plotted on the left-hand vertical axis (turnout), while the thin ones express population size being
scaled according to the right-hand axis.
Figure 4.2: Voter turnout in European elections
Data source: Idea Voter Turnout Database (www.idea.int/vt/country_view.cfm?CountryCode=LU).
In the 2011 local elections, there were 263068 registered electors, out of which 31019 (12%) were
non-citizens. As compared to the total number of voting-age immigrants, participation is lower than
a fifth. Among the 3319 candidates, 233 (6%) had not Luxembourgish citizenship. The 17 of them
winning seats in their communes stand for only 3% of the total number of elected councillors.
0
50000
100000
150000
200000
250000
300000
350000
400000
450000
0%
10%
20%
30%
40%
50%
60%
70%
80%
90%
100%
19
45
19
48
19
51
19
54
19
59
19
64
19
68
19
74
19
79
19
84
19
89
19
94
19
99
20
04
20
09
Po
pu
lati
on
siz
e
Turn
ou
t in
nat
ion
al e
lect
ion
s
Voting-age population turnout Voter turnout Voting-age population Registered voters
0
50000
100000
150000
200000
250000
300000
350000
400000
450000
0%
10%
20%
30%
40%
50%
60%
70%
80%
90%
100%
19
79
19
84
19
89
19
94
19
99
20
04
20
09
Po
pu
lati
on
siz
e
Turn
ou
t in
EU
ele
ctio
ns
Voting-age population turnout Voter turnout Voting-age population Registered voters

GINI Country Report Luxembourg
Page 74
The country has a multiparty system, with five parties dominating the political scene: the Christian
Social People’s Party (CSV), the Democratic Party (DP), the Luxembourg Socialist Workers’ Party
(LSAP), the Greens, and the Alternative Democratic Reform Party (ADR). The conservative CSV
provided all prime ministers since 1918, except for only 6 years (1974-1979). The socialist LSAP is the
second party as voting intentions, and currently the junior partner in the governing coalition. The
liberal DP provided the only non-conservative prime minister in the LSAP-DP government in the
1970s. The Greens and the conservative-Eurosceptic ADR emerged as relevant parties in the past two
decades; in the 2009 national elections each of them gathered about 10% of the votes.
Starting from the late 1970s, CSV was the most popular among high-income Luxembourg voters,
while LSAP (or the social-democrat parties who preceded it) was more popular among low-income
households as compared to mid- and high-income ones.25 DP was slightly more popular among the
better off individuals as over the entire period, but it does not differ much in terms of received
support among all incomes groups. The higher the education, the lesser are the ones that have no
voting option. Starting early nineties, all the three main parties lost popularity among each education
group. Nowadays there is not much difference in voting induced by the total number of years spent
in school. However, LSAP gets more support among the ones that have average education, while DP,
and particularly the Greens, get more adepts among highly educated ones. The dynamics of
inequality seems to have little in common with the dynamic of voting for a party or another, no
matter the levels of income or education.
There are no signs of increasing political polarization. Starting from the 1980s, the increase in
inequality was simultaneous to increasing the share of seats won in national elections by right-wing
parties, and decreasing of the left-wing ones (Figure 4.3.). However, it is unlikely that the two
processes are associated. Meanwhile, the average positioning on a ten-points left-right scale slowly
25 This entire paragraph is based on own calculations, using data from the Eurobarometer series (EB2-1974, EB12-1979, EB22-1984, EB32-1989, EB41-1994, EB52.0-1999, EB61-2004), respectively European Values Study (EVS 2008). The years were selected such as to coincide with election cycles. When full data on voting, income and education were available, the autumn waves of the Eurobarometer were selected. For 1994 and 2004 this was not possible, therefore spring editions were employed. Since in the Eurobarometer the Luxembourg sample sizes are small, the text presents only large significant differences. One should also be cautioned that “voters” and “respondents” in surveys are not fully overlapping populations. Public opinion surveys in Luxembourg often use social security registers for drawing probabilistic samples. Many residents of immigrant origins are likely to be selected to answer questionnaires, but they might lack the requirements to be registered as voters. Therefore, the actual opinions of those who have the right to vote may differ on the average political preferences of the population investigated by surveys. However, it is unlikely that the two are very distant in attitudes, and since the sample are already quite small and often lack information that would allow separate those who are or not entitled to vote, the presented data makes no difference between the two categories.
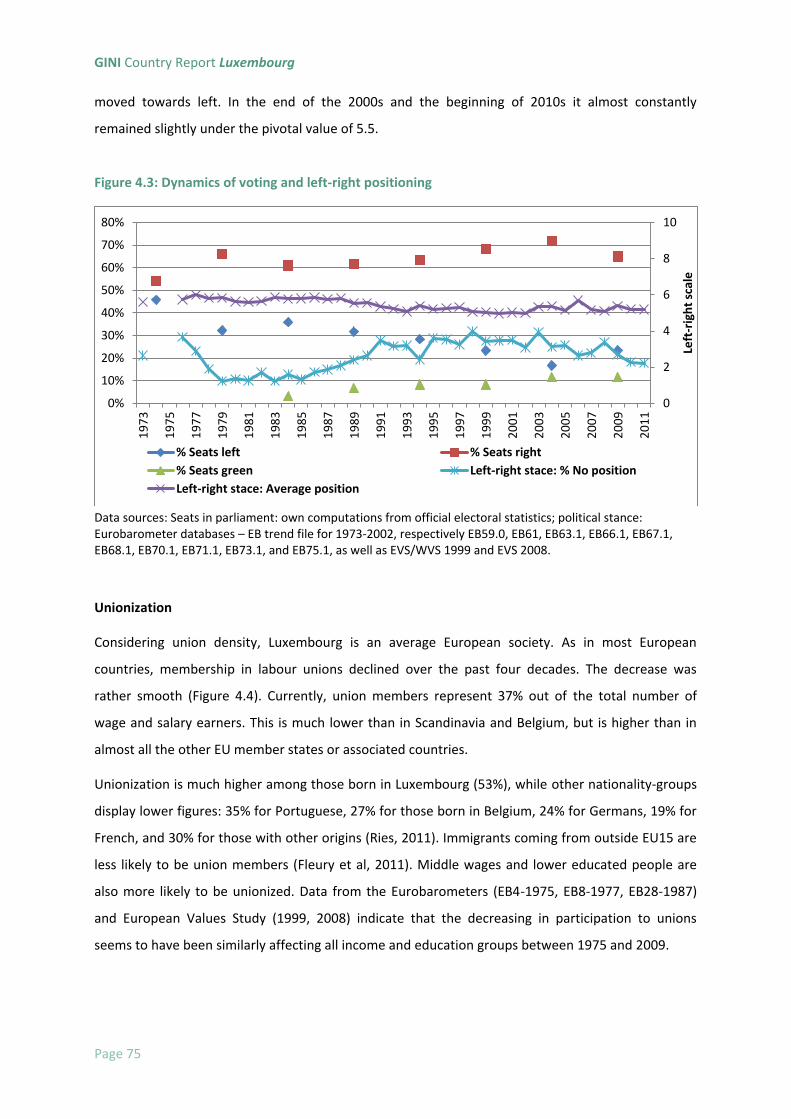
GINI Country Report Luxembourg
Page 75
moved towards left. In the end of the 2000s and the beginning of 2010s it almost constantly
remained slightly under the pivotal value of 5.5.
Figure 4.3: Dynamics of voting and left-right positioning
Data sources: Seats in parliament: own computations from official electoral statistics; political stance: Eurobarometer databases – EB trend file for 1973-2002, respectively EB59.0, EB61, EB63.1, EB66.1, EB67.1, EB68.1, EB70.1, EB71.1, EB73.1, and EB75.1, as well as EVS/WVS 1999 and EVS 2008.
Unionization
Considering union density, Luxembourg is an average European society. As in most European
countries, membership in labour unions declined over the past four decades. The decrease was
rather smooth (Figure 4.4). Currently, union members represent 37% out of the total number of
wage and salary earners. This is much lower than in Scandinavia and Belgium, but is higher than in
almost all the other EU member states or associated countries.
Unionization is much higher among those born in Luxembourg (53%), while other nationality-groups
display lower figures: 35% for Portuguese, 27% for those born in Belgium, 24% for Germans, 19% for
French, and 30% for those with other origins (Ries, 2011). Immigrants coming from outside EU15 are
less likely to be union members (Fleury et al, 2011). Middle wages and lower educated people are
also more likely to be unionized. Data from the Eurobarometers (EB4-1975, EB8-1977, EB28-1987)
and European Values Study (1999, 2008) indicate that the decreasing in participation to unions
seems to have been similarly affecting all income and education groups between 1975 and 2009.
0
2
4
6
8
10
0%
10%
20%
30%
40%
50%
60%
70%
80%
19
73
19
75
19
77
19
79
19
81
19
83
19
85
19
87
19
89
19
91
19
93
19
95
19
97
19
99
20
01
20
03
20
05
20
07
20
09
20
11
Left
-rig
ht
scal
e
% Seats left % Seats right
% Seats green Left-right stace: % No position
Left-right stace: Average position

GINI Country Report Luxembourg
Page 76
Figure 4.4: Participation and collective bargaining coverage of labour unions, as percentages from total number of wage and salary earners
Data source: Visser, (2009) ICTWSS Database
Civic participation
Luxembourg residents have a relatively high rate of participation in voluntary organizations,
comparable to Nordic countries or the Netherlands. According to the 2008 European Values Study,
some 60% of the adult population is member of at least one voluntary organization. Excluding labour
unions, political parties and religious associations, slightly more than half of the population is
involved in formal associations (Voicu, 2010).
Table 4.1 includes figures collected from different rounds of EuroBarometer and European Values
Study about membership in associations. Sport and recreational organizations were the most
popular starting the 1970s and kept their attractiveness to present days. Ecological organizations
were more popular in the late eighties and early nineties as compared to now, while human rights
groups knew an ascendant trend. As almost everywhere in Europe, traditional organizations such as
political parties and groups, or religious organizations experienced a smooth but stable decline over
the entire period.
Participation is higher among the better educated and better off Luxembourgers, reflecting a
regularity found in most societies (Wilson, 2000). The same relationship is found in alternative
sources (Lejealle, 2002, 2003).
60% 60% 60% 60% 60% 60% 60% 58% 58% 58%
0%
10%
20%
30%
40%
50%
60%
70%
19701972197419761978198019821984198619881990199219941996199820002002200420062008
Collective bargaining coverage Union density

GINI Country Report Luxembourg
Page 77
Table 4.1: Membership in different types of civic associations in Luxembourg: 1975-2008. (percentages of total population)
Survey EB4 EB8 EB19 EB28 EB34.0 EB49 EVS EVS
Year 1975 1977 1983 1987 1990 1998 1999 2008
sports or recreation 32%
31% 32% 29% 32% 25% 31%
education, arts, music or cultural activities
21% 26% 15%
17% 16%
labour unions 32% 40%
28%
12% 15%
social welfare/charity
13% 14% 13%
conservation, environment, ecology, animal rights
10% 15% 18% 21% 16% 11% 12%
human rights
3% 4% 4% 4% 11% 10%
professional associations
6% 10%
youth work
11% 12% 10% 8% 9% 8%
religious organization 14% 10% 11% 11% 8% 8% 10% 7%
organization concerned with health
7% 7%
political parties 10% 11% 9% 12% 6% 13% 6% 6%
local political actions
5% 6%
women´s group
1% 8%
6% 4%
peace movement
2% 2%
other groups 3% 7%
19% 18% 4% 4% 6%
none 27% 38% 31% 23% 24% 26% 41% 38%
social action groups
29% 11% 13% 13%
trade union/professional associations
26%
19% 27% 16% 22%
consumer groups/rights 6% 7% 11% 15% 13% 15%
membership - various common interest
14%
social club
7%

GINI Country Report Luxembourg
Page 78
cultural action group
17% 12% 13%
hobby/spec interest clubs
8%
Data sources are mentioned on the first two rows. Empty cells indicate lack of data. Reading tip: 32% of the total population reported membership in ‘sport or recreation’ associations in 1975, according to the EB4.
Participation is also related to the opportunity to participate (Meulemann, 2008). The number of
associations existing in Luxembourg is difficult to estimate, particularly due to the boom of the sector
in the 1990s and 2000s, and to the fact that the very short life that some have quickly makes official
registers obsolete (Blond-Hanten et al. 2012). The dynamics of the sector is noticeable in other
societies as well, being specific to the current times (Salamon et al, 2003; Voicu, 2005). For
Luxembourg, recent estimations indicate a total of roughly 7500 associations potentially active in
2009 (Blond-Hanten et al. 2012). Comparing to the size of the population, there are some 65
residents for an association, which stands as one of the highest figures across Europe. Most likely
some of these organizations are not active, but the density remains high anyway. It reflects the
associative culture that exists in Luxembourg and it simultaneously fosters participation by providing
opportunities in this regard.
Figure 4.5: Participation in protest actions: the share of those that have already participated and the percentage of those who would never participate: 1989, 1999, and 2008
Data sources: EB31-1989, EVS/WVS 1999, EVS 2008.
0%
10%
20%
30%
40%
50%
60%
70%
80%
90%
100%
1989 1999 2008
Have Participated
Petition Boycott Lawful demonstration
0%
50%
1989 1999 2008
Percentage of those who "would never attend"
Petition Boycott Demonstration

GINI Country Report Luxembourg
Page 79
Civic and political actions
The flourishing associative life is reflected in civic and political action as well. Figure 4.5. takes stock
on participating in various such activities: petition signing, boycotting certain products, attending
lawful demonstrations. In the past two decades, the percentages of those who declare that they will
never be part of such actions remained unchanged (the small graph in the upper-left corner).
However, the share of those who actually participated in each of the three types of actions
significantly increased.
4.3. Trust in others and in institutions
Social trust is differently measured in different surveys. The most common measures are the
dichotomous item (“most people can be trusted” vs. “can’t be too careful in dealing with people”) or
using a 10-point scale with the two choices from the dichotomous item as labels for the ends of the
scale. In Luxembourg, the dichotomous item was applied in the 1999 and 2008 waves of the
European Values Survey, as well as in the 1986 Eurobarometer. The ten-point scale is part of the
European Social Survey (ESS) 2004, of the Eurobarometer 74.1 in 2010, and of the European Quality
of Life Survey (EQLS) waves from 2003 and 2007. Although the measures are not fully comparable,
we use both of them in order to be able to assess existing trends.
Figure 4.6 provides information on the trends recorded in the two measures. The left hand side of
the figure indicates no difference in 2008 as compared to 1986, although the figures for 1999
indicate slightly lower levels of trust. The right-hand side of the figure indicates a marginal increase
of social trust in 2007 as compared to 2003 and 2004, followed by a reverting towards initial values
in 2010, possibly under the impact of economic recession.26
The general level of trust in Luxembourg is one of the lowest in Western Europe. As elsewhere,
better educated and better off people display higher levels of trust. From this point of view,
Luxembourg is no different from other societies (Paxton, 2007). Immigrants’ level of trust is higher
than natives’, and the relative difference is one of the largest in Western Europe (Voicu, 2012). EVS
2008 data indicate that 27% of the natives in Luxembourg display trust in others, according to the
dichotomous measurement. The corresponding figure for foreign-born residents is 34%.
26 This is consistent with Inglehart’s assumption that individuals retreat towards more traditional values when experiencing economic recession or high inflation (Inglehart & Baker, 2000; Inglehart &Welzel, 2005).

GINI Country Report Luxembourg
Page 80
5,38 5,02 5,76 5,59
1
2
3
4
5
6
7
8
9
10
2003 2004 2007 2010
EQLS ESS EQLS EB74.1
Figure 4.6: Dynamics of Social Trust
Dichotomous item Ten-point scale
The low level of trust raises interrogation, particularly when considering the country’s high ethnic
heterogeneity. On the one hand, Blau’s theory of intergroup relations (Blau & Schwartz, 1984)
suggests that when in contact with different (ethnic) groups, there will be more gratifications to
develop cross-group relations. Such relations are said to build trust (Putnam, 2001). Apparently
Luxembourg does not fit this description, which points to Putnam’s (2007) ‘hunkering down’
hypothesis on the disruptive effects of fractionalization on social trust. However, such effects appear
only under specific conditions, including high segregation (Uslaner, 2011) or high income inequality
(Kesler and Bloemraad, 2010). Luxembourg is also quite far from being segregated or highly unequal.
The increase in inequality in the past decades is not followed by decreasing levels of generalized
trust, as the above data show. In addition, the stock of immigrants has continuously risen, but
generalized trust has not decreased. It remains to look for the individual level determinants.
Education is one of the most important, and might partially explain the presence of the two third of
the Luxembourg population who rather mistrust others. Indeed, the number of university graduates
in the active population is lower as compared to Scandinavia, for instance. It is also lower than in
most of the Western European societies, except for Italy, Portugal and Austria. These societies
display levels of social trust which are lower (Portugal) or similar to the ones in Luxembourg. Finally,
for Luxembourg it might be also an effect of contagion from the neighbouring France, with quite low
social trust, and an important number of daily commuters to the Grand Duchy.
Two distinct data sources are used to describe the levels of confidence in institutions: the
Eurobarometers and the two waves of the European Values Study that were collected in Luxembourg
(EVS/WVS 1999 and EVS 2008). Most of the Eurobarometer base their estimates on a dichotomous
choice: rather trust vs. rather mistrust a certain institution. The EVS uses a 4-point scale, while the
68%
71%
64%
30%
25%
31%
80% 60% 40% 20% 0% 20% 40%
1986
1999
2008
EB2
5EV
S/W
VS
EVS
Can´t be too careful Most people can be trusted

GINI Country Report Luxembourg
Page 81
EB74.1 (August-September 2010) uses a 10-point scale. We have recoded these longer scales to
dichotomous variables, counting in all the surveys the percentages of those that rather trust,
respectively rather distrust the respective institutions. This adds more time-points when
measurement is available, but risks decreasing reliability due to the different original scales.
However, when different measurement were available for the same period of time (e.g. confidence
in the National government, summer of 2008), dichotomizing the 4-point scale led to results which
were almost identical (and not significantly different) as compared to the binary choice to be
encountered in the usual EB questionnaire. Therefore, such measures might be comparable, but
caution is still needed.
Figure 4.7 takes stock of trust in the most prominent political institutions: the Parliament, the
Government, and the political parties. The long-term stability of political system, lack of important
scandals, and low corruption make Luxembourgers one of the most trustful Europeans when
considering their political parties, the executive and the legislative. In 2010s, only Scandinavia and
the Netherlands had as high levels of confidence in these three institutions. The dynamics seems to
have no connection with the evolution of inequality. Instead, it follows the same legacy found
elsewhere (Mihaylova, 2004; Tufiş, 2012): confidence in institutions is boosted immediately after
elections and erodes during the electoral cycle.
Figure 4.8 shows how The Justice, The Police, The Civil Services, as well as labour unions are credited
with trust by most Luxembourgers. The confidence in these institutions remained stable over the
past decade, with a peak around 2000. EVS/WVS 1999 and EVS 2008 data show that the Education
System, the Social Security System, the Environmental Protection Movement and the Health Care
System also are valued with trust in Luxembourg. Among them, the Education System is the one to
receive the lower appreciation (68%). However this is one of the highest figures across Europe.
If the small Luxembourgish Army captures the confidence of majority with a high score all over the
period, the other traditional institution (Church) is in clear decline, being rather mistrusted. As
compared to other European societies, Luxembourgers have an average trust in the army and one of
the lowest levels of trust in religious institutions.

GINI Country Report Luxembourg
Page 82
Figure 4.7: Dynamics in confidence in institutions, 1998-2011: The political system
Data sources: Eurobarometer (EB51.0, EB55.1, EB54.1, EB57.1, EB59.1, EB60.1, EB61, EB62.2, EB63.4, EB64.2, EB66.1, EB67.2, EB68.1, EB69.2, EB71.1, EB71.3, EB72.4, E73.4, EB74.1, EB74.2, EB75.3), respectively value surveys (EVS/WVS 1999, EVS 2008). The percentages are derived from dichotomous items, except for EVS/WVS 1999 (July) and EVS 2008 (June) where 4-point scales were employed, as well as for EB74.1 (August 2010) were a 10-point scale was used.
Figure 4.8: Dynamics in confidence in institutions, 1998-2011: other institutions
0%
10%
20%
30%
40%
50%
60%
70%
80%
90%
100%
mrt
-99
sep
-99
mrt
-00
sep
-00
mrt
-01
sep
-01
mrt
-02
sep
-02
mrt
-03
sep
-03
mrt
-04
sep
-04
mrt
-05
sep
-05
mrt
-06
sep
-06
mrt
-07
sep
-07
mrt
-08
sep
-08
mrt
-09
sep
-09
mrt
-10
sep
-10
mrt
-11
The Political Parties The (National) Government The (National) Parliament
Nat
ion
al &
Eu
rop
ean
Nat
ion
al &
Eu
rop
ean
El
ecti
on
s
Nat
ion
al &
Eu
rop
ean
El
ecti
on
s Jul.05->EU referendum Oct.05->Local elections
0%
20%
40%
60%
80%
100%
mrt
-99
apr-
00
mei
-01
jun
-02
jul-
03
aug-
04
sep
-05
okt
-06
no
v-0
7
dec
-08
jan
-10
feb
-11
The Justice (System)The PoliceThe Labour Unions
0%
20%
40%
60%
80%
100%
mrt
-99
mrt
-00
mrt
-01
mrt
-02
mrt
-03
mrt
-04
mrt
-05
mrt
-06
mrt
-07
mrt
-08
mrt
-09
mrt
-10
mrt
-11
Armed Forces/The Army
Churches/Religious Institutions

GINI Country Report Luxembourg
Page 83
Data sources: Eurobarometer (EB51.0, EB55.1, EB54.1, EB57.1, EB59.1, EB60.1, EB61, EB62.2, EB63.4, EB64.2,
EB66.1, EB67.2, EB68.1, EB69.2, EB71.1, EB71.3, EB72.4, E73.4, EB74.2, EB75.3), respectively value surveys
(EVS/WVS 1999, EVS 2008). The percentages are derived from dichotomous items, except for EVS/WVS 1999
(July) and EVS 2008 (June) where 4-point scales were employed.
Trust in the media (Radio, Press, Television and Internet) seems to have fluctuated in recent years. As
compared to other countries, television and particularly Internet score surprisingly low, while radio
and the press have average to high scores of trust. The fact that traditional newspapers loose impact
in favour of free daily papers and particularly Internet (Borsenberger et al, 2011; Lamour & Langers,
2012; Lamour & Lorentz, 2012) makes the low confidence in Internet even more intriguing.
Luxembourg is one of the founding members of the EU and has benefited from European integration,
e.g., it helped develop a ‘cross-border metropolis’ (Sohn, 2012) providing easier access to the labour
force from neighbouring countries, and generally facilitated immigration from EU Member States. On
the other hand, EU regulations were not always easy to accommodate, e.g., for the banking industry.
Figure 4.9 shows a decreasing trend of confidence in supranational institutions and the EU, yet
confidence in the EU remains at comparatively high levels.
No big differences are observed in trust towards institutions for different socio-economic groups.
Older people and immigrants appear to put significantly more confidence than others in institutions.
4.4. Political values and legitimacy
Support towards democracy
Luxembourg residents express a strong support for democracy as a way to organize society.
According to the 2008 EVS data, 59% rejected authoritarian leaders, 50% rejected technocratic
governance, 93% rejected army ruling, and 85% supported democracy as the best system for
governance. As compared to EVS/WVS 1999, the figures reflect a slight tendency to increase support
0%
20%
40%
60%
80%
100%
mrt
-99
apr-
00
mei
-01
jun
-02
jul-
03
aug-
04
sep
-05
okt
-06
no
v-0
7
dec
-08
jan
-10
feb
-11
The United Nations
The European Union
NATO 0%
20%
40%
60%
80%
100%
mrt
-99
mrt
-00
mrt
-01
mrt
-02
mrt
-03
mrt
-04
mrt
-05
mrt
-06
mrt
-07
mrt
-08
mrt
-09
mrt
-10
mrt
-11
RADIOThe PressTELEVISION

GINI Country Report Luxembourg
Page 84
for democracy and to consider the alternatives as bad. This makes the Grand Duchy closer to
Western Europe average attitudes. Considering the 2008 data, support for democracy is positively
associated with income and education. Being native or immigrant makes no significant difference
when considering supporting democracy. However, both in 1999 and 2008, being native increases
the odds to support a strong leader who does not have to bother with parliament and elections, but
also increases rejecting the army rule.
Extreme-parties
In many Western countries, the cultural shift towards postmodern values and the globalization
triggered retreats towards traditional values in some groups, and lead to ascension of extreme-right
parties in the 1990s (Ignazi, 2006). This was not the case in Luxembourg, where building the EU (and
slightly weakening the national sovereignty) and hosting more and more immigrants was done in an
era of buoyant economic growth. The second half of the 1900s was prosperous enough to maintain
low unemployment and to lead to levels of GDP per capita much higher than anywhere in the EU.
After 1950 and before the 1980s, the extreme-right was virtually inexistent. Then it started to be
visible, as a reaction to globalisation, as well as to the increasing number of immigrants and asylum
seekers. However, the extreme parties never acceded to Parliament, and got only limited popular
support.
In recent history, there were other attempts to propose extreme-right solutions. For example, the
2003 founded Free Party of Luxembourg (FPL) unsuccessfully proposed 8 candidates in the 2004
legislative elections, and totalled 0.1% of votes. The party disbanded in 2005. In 2009 national
elections, the “Citizen’s List” (CL), totalled 0.8% of votes. The CL main claims were increased pension
rights, and opposition to the established parties, rejecting the Lisbon Treaty and building a Europe of
nations.
The extreme-left was virtually inexistent except for a short while during the 1970s, with the
Communist League of Luxembourg (KBL)
Support towards EU membership
Over the past four decades, surveys showed a high support for EU membership. Figure 4.9 indicates
that it fluctuated between 70% and 85%, with no noticeable trend, except for a decline during the
recession. The high support is found in all socio-economic groups by age, education, region, sex, or
wealth.

GINI Country Report Luxembourg
Page 85
EU membership approval was also expressed, albeit not in overwhelming proportions, in the 2005
referendum on the Treaty to establish a European Constitution. The turnout was 88%. Out of the
valid votes, a majority of 56.52% pronounced in favour of the Constitution. Apparently, the figure
reflects a rather poor performance of the pro-Europeans, since all parties campaigned for voting
‘yes’, except for Déi Lénk, who considered the treaty too market-oriented. Otherwise, all major
parties were and are favourable to the EU. Some variations do exist, including ADR’s option for a
Europe of nations and the opposition of the same party to Turkey accession. But it is important to
note that the referendum was organized just after the rejections of the treaty in France and the
Netherlands.
Figure 4.9: Support for the EU membership
Data sources: Eurobarometers (86 surveys).
Attitudes towards immigrants
The pre-War tradition to attract immigrants, particularly Italians and Germans in the beginning of the
twentieth century (Fetzer, 2011; Scuto, 2012) persisted throughout the century. The migration is
mostly intra-European. Portuguese immigrants now form the largest foreign community in
Luxembourg. Asylum seekers have also been numerous: Czechs in the late 1960s, Chileans in the
1970s, Iranians in early 1980s. Romanians and Zairians come in the beginning of 1990s, but the
highest group is the one of ex-Yugoslavians. Their flow peaks to 2000 refugees in 1993, and to 4600
persons in 1999 (Blau, 2005). Frequent contact with both cross-border workers and immigrants can
be expected to lead to more tolerant values and attitudes (Blau & Schwartz, 1984). In 1999, 48% of
0%
10%
20%
30%
40%
50%
60%
70%
80%
90%
100%
sep
-73
sep
-75
sep
-77
sep
-79
sep
-81
sep
-83
sep
-85
sep
-87
sep
-89
sep
-91
sep
-93
sep
-95
sep
-97
sep
-99
sep
-01
sep
-03
sep
-05
sep
-07
sep
-09
sep
-11
Generally speaking, do you think that Luxembourg's membership of the EU would be...?
Good thing Neither nor Bad thing 4 per. Mov. Avg. (Good thing)

GINI Country Report Luxembourg
Page 86
Luxembourgish respondents to the WVS considered that when jobs are scarce employers should give
priority to Luxembourgish people than immigrants. The figure was among the lowest in Europe and
the world, the Grand Duchy’s tolerance being next just to Sweden, Denmark and the Netherlands.
The EVS 2008 figure is 41%. Only 8% in 1999, respectively 14% in 2008, mentioned immigrants and
foreign workers among undesirable neighbours, placing Luxembourg among the most tolerant
societies in Europe with respect to immigrants. Older, lower educated, and natives tend to be less
tolerant, but even in their cases, the share of those avoiding immigrants as neighbours is no larger
than 20% using 2008 data.
Figure 4.10 offers more indications about the stability of attitudes towards immigrants in the past
decade. Unfortunately there is no more recent data available to take stock of the effect of the recent
economic crisis.
Figure 4.10: Attitudes towards immigrants
Concerned with Immigrants’ living conditions*
1999 2008
Very much 5% 4%
Much 18% 20%
To a certain extent 40% 40%
Not so much 24% 21%
Not at all 11% 14%
Don´t know 2% 1%
No answer 1% 1%
Total 100% 100%
Data sources: EVS 1999 and 2008, Luxembourg.
*Answers to the question “To what extent do you feel concerned about the living conditions of immigrants?”.
As discussed above, these attitudes are not reflected in voting rights for non-citizen residents. The
prevention of political representation and influence of non-natives finds roots in early 1920s, and
later in 1940s, as a way to inhibit German influences (Scuto, 2012). However, the naturalization laws
were constantly amended in the past decades (1968, 1975, 1986, 2001 and 2008), always relaxing
conditions and making easier access to citizenship. It could be expected that voting rights for non-
citizens will soon follow. This is one of the topics which are currently on the public agenda.
Attitudes towards immigrants may also be reflected in the prevalence of mixed marriages.
Considering all marriages involving Luxembourgish citizens, the share of mixed ones (a spouse is
Luxembourgish, the other is of another nationality) in the total number of marriages involving at
-3%
-1%
-2%
-37%
-50%
-7%
2%
2%
2%
37%
52%
6%
-60% -10% 40%
No answer
Don´t know
Prohibit people from coming
Strict limits
As long as jobs available
Let anyone come
Immigration Policy
1999 2008

GINI Country Report Luxembourg
Page 87
least a Luxembourgish was 9% in the beginning of the 1990s, then increased to 19% in 2003 and to
more than a third (34%) in 2008 (own computations based on Blau, 2005 and STATEC, 2010). In the
same time, considering the marriages in which at least a partner is not Luxembourgish, the share of
those involving a Luxembourgish spouse is currently 51% (it used to be 60-70% during the 1970s and
1980s, when the number of immigrants was low, and 37-40% in the early 1990s, after the 1986
relaxation of naturalisation laws, when many immigrants received Luxembourgish nationality).
4.5. Attitudes to social policy and welfare state
Attitudes towards social policy and welfare state were measured by selected questions from the
European Values Study (EVS) 1999 and 2008. The first question deals with the perception of needs.
The respondents were asked to answer to the following: “Why are there people in this country who
live in need? Here are four possible reasons. Which one reason do you consider to be most
important?”. The offered response categories were: “Because they are unlucky; Because of laziness
and lack of willpower; Because of injustice in our society; it’s an inevitable part of modern progress;
none of these".
The data show that the perception of the main drivers behind being in need have changed between
1999 and 2008 (see Figure 4.11). In 2008 fewer people consider luck as the most important reason
for being in need than in 1999. The percentage dropped from 32.4% in 2008 to 24.5% in 2008. On the
other hand, we observe a growing tendency to see people in need as an inevitable element of
modern society, thus as something that cannot be avoided. In 1999 it was 18.1% of respondents,
whereas in 2008 it was 24.1%.
Figure 4.12 shows the proportion of respondents who mention laziness and lack of willpower as the
most important reason why people are in need for four different educational levels: the highest
proportion is found among individuals with basic education (28% in 1999 and 29.3% in 2008). On the
contrary, residents with post-secondary education support this reasoning least (11.3 % in 1999 and
18% in 2008).

GINI Country Report Luxembourg
Page 88
Figure 4.11: Perception of need in Luxembourg, percentages
Source: EVS 1999 and 2008, author’s calculations
Figure 4.12: Proportion of Luxembourg respondents who mentioned laziness and lack of willpower as the most important reason why people are in need by education, percentages
Source: EVS 1999 and 2008, author’s calculations.
Note: The higher is the percentage, the more the respondents support the idea that laziness and lack of will
power is the reason why there are people in need in the country.
The European Value Study also provides information on what people think about the distribution of
income and about individual responsibility versus collective responsibility. These issues are measured
by responses on a 10-point scale between two sets of opposing statements: (i) “Incomes should be
32,40% 24,50%
22,30%
23,60%
23,40% 24,30%
18,10% 24,10%
3,80% 3,50%
0%
10%
20%
30%
40%
50%
60%
70%
80%
90%
100%
1999 2008
Unlucky Lazy Injustice Inevitable part of modern society None of these
28% 29,30%
25,30% 23,80% 23,40% 24,10%
11,30%
18,00%
0%
5%
10%
15%
20%
25%
30%
35%
1999 2008 1999 2008 1999 2008 1999 2008
basic lower secondary upper secondary post-secondary

GINI Country Report Luxembourg
Page 89
made more equal” versus “There should be greater incentives for individual efforts” and (ii)
“Individuals should take more responsibility for providing for themselves” versus “The state should
take more responsibility to ensure that everyone is provided for”. Response categories were
presented on a 10-point scale, where 1 represented a strong agreement with the first statement and
10 stood for strong agreement with the opposing claim.
Figure 4.13 shows that in 2008 Luxembourg residents tended to agree slightly more with the
statement pleading for a more equal distribution of income than in 1999. The difference between
1999 and 2008 concerning the people’s views on the individual’s responsibility to provide for
themselves was negligible. It became also apparent that, in general, the Luxembourg residents
support more the claim on individual responsibility than the statement that incomes should be made
more equal.
Figure 4.13: Attitudes toward redistribution and state responsibility (mean response over 10-point scale)
Source: European Value Study, own calculations
Note: the lower is the mean value, the stronger is the agreement with the mentioned statement.
4.6. Conclusions
The increase in inequality seems mostly unrelated to the issues that we have described in this
chapter. Political and civic participation, social trust and confidence in institutions, support for
extreme parties changed their levels or maintained the same intensity independent of changes in
income distribution, in education attainment, or of the increasing share of immigrants. The same is
true for EU approval and the attitudes towards immigrants. The main driver here seems to be the
6,75 6,37
4,33 4,44
0
1
2
3
4
5
6
7
8
1999 2008
Incomes should be made more equal
Individuals should take more responsibility for providing for themselves

GINI Country Report Luxembourg
Page 90
perceived prosperity, which remained stable disregarding inequality dynamics and increasing share
of immigrants in the country. In fact, the immigrants, mostly European and better educated than the
immigrants to other European countries, may have also prevented deterioration of social cohesion
and support for democracy which might have been triggered by the slight increase in inequality
levels.
Most of the data reported in this chapter are on aggregate, national level. Whenever possible, we
have been looking for trends in discrepancies between various status groups, depending on
education, age, immigration status, or income. Although small samples often prevent detailed
analysis, the overall impression is that the same stability noticed for the average figures is found for
the population subgroups that we have considered.

GINI Country Report Luxembourg
Page 91
5. The effectiveness of policies in combating inequality
5.1. Introduction
Previous chapters have documented the trend in income inequality in Luxembourg and its
correlation with several social, cultural and political outcomes. In the present chapter, we analyse
the way in which policies may have contributed to shape the trend in income inequality, upward or
downward. To this aim, we present time series on policy variables related to economic inequality.
Section 5.2 documents policy variables that affect labour income directly – minimum wages and
wage-setting mechanisms. Section 5.3 studies the evolution of various components of taxes while
the evolutions of public social expenditures including benefits and social welfare, old age pensions,
health care, family benefits and housing subsidies are discussed in Section 5.4,. Section 5.5 reports
on policies in the field of education.
5.2. Labour income
The Luxembourg labour market is one of the most regulated within OECD countries (Hartmann-
Hirsch, 2010). Bargaining processes between social partners (trade and employer unions) have
shaped wages in Luxembourg. Bargaining areas at corporate, tripartite or - more recently – through
bipartite meetings with a single social partner and the government, are not only part of what is often
referred to as Luxembourg’s social model (Hirsch 1986; Allegrezza et al, 2003; Thill, Thomas 2009;
Thill, Thomas 2011; Cames 2011), but are also embedded in a legal framework dating back to the
steel crisis in the 1970s when tripartite instruments were designed as a means of tackling
unemployment and restoring competitiveness. This model also constituted an element of the
successful transition from a steel industry based society to a financial-based one since, as mentioned
by Thill and Thomas (2011), “Luxembourg witnessed a prolonged period during which social
concertation at tripartite level played an important role in social and economic regulation, with a
strong orientation towards consensus”. Within the Luxembourg social model, it has been intended to
put forward, in addition to other policy areas, wage-related policies on a consensual basis either in
the tripartite committee whose agreements have then been forged into legislation or through
collective labour agreements whose provisions were set up by law in 2004. We first discuss the
impact of collective labour agreements on wages in Luxembourg, then analyse the general
framework of collective bargaining processes as regards income and of the automatic indexation

GINI Country Report Luxembourg
Page 92
system as a fundamental instrument to shape wage setting in Luxembourg and conclude by
presenting the minimum wages in Luxembourg.
The impact of collective labour agreements on wages
Collective labour agreements are based on a legal framework established by law in 2004,27 although
agreements have always been shaped between the social partners and more so in the context of the
National Action Plan law of 1999.28 Agreements can apply to single companies seeking common
provisions for their employees or to sectors as a whole for which commonly binding provisions are
elaborated (Maas et al, 2012). Legal provisions set out in the 2004 law organize the participation of
social partners within the bargaining period until reaching a consensus-based agreement, the
contents of agreements, and the details – should disputes arise during the negotiation process - of a
conciliation procedure at the National Office for Consolidation which dates back to grand-ducal
legislation of 1945.29 On the one hand, the 2004 law impacts on wage setting through considering
wages as an integral and fundamental element of the bargaining process towards an agreement (art.
20, (1)). On the other hand, it provides for additionally agreed upon provisions on pay adjustments
for night-time work and for hazardous or arduous work, as well as for detailed rules on gender pay
equality. The role of social partners in these bargaining processes is reinforced in the sense that only
those social partners are eligible to take part in negotiations benefitting from national
representativeness. More broadly, Luxembourg’s unionization rate has more recently stood at 41%
of resident workers (Ries, 2011).
The significance of labour agreements has been highlighted by STATEC in a study on wages and
labour agreements, stipulating that collective labour agreements are positively impacting upon wage
developments (Schäfer, 2010). However, the coverage of labour agreements varies broadly by
sectors. Schäfer (2010) reveals that 80% of private sector companies do not apply a collective labour
agreement, and adopt individual wage bargaining strategies. While agreements are less applied in
commerce (13%) or are non-existent in the catering sector, the construction sector is displaying the
largest proportion of agreements (77%).
27 Law of June 30, 2004 on collective labour agreements, the management of collective conflicts and the National Office of Conciliation, Mémorial A, Number 119, 15 July 2004. As regards the 2004 part on collective agreements, the law replaces a law of 12 June 1965. 28 Loi du 12 février 1999 concernant la mise en œuvre du plan d'action national en faveur de l'emploi 1998, Mémorial A, number 13, 23 February 1999. 29Grand-ducal legislation of October 6, 1945 on the creation, the missions and the management of a National Conciliation Office, Mémorial A, number 59, 15 October 1945.

GINI Country Report Luxembourg
Page 93
The impact of collective agreements on wages is both sector-dependent and strongly related to both
the company size and the education level of the employees. The existence of an agreement results in
increased salaries for all types of professions, but wage earners with higher education often benefit
more. In the finance sector, salaries are higher for non-contracted employees. In other sectors, such
as commerce, the wage gap in companies with or without a collective labour agreement is low. Two
examples of ordinary collective agreements at company level demonstrate in practice how wage
setting takes place as a result of consensus-based bargaining: first, the renewal of the TWINERG
collective agreement is allotting a series of bonuses and wage adaptations to employees; second, a
new collective labour agreement in the steel sector (for the metallurgical plant in Dudelange)
provides for extra bonuses for difficult work. Consensus, however, is difficult to be reached when
negotiating a collective bargaining agreement which has for example been highlighted during the
current financial and economic crisis in Luxembourg’s finance sector: the latest agreement covering
the finance sector could only integrate already existing provisions into a new agreement to be
applied for a smaller period of time. 30 In other activity areas (i.e. insurance sector), negotiations to
reach consensus have also become more difficult.
Collective bargaining processes and automatic wage indexation
At the national level, wage bargaining has often occurred between the representative social partners
and the government in the context of wage indexation discussions (Thill and Thomas 2011). Policies
related to wages are regularly adapted and major provisions have been on the policy agenda since
2006 when the last major tripartite negotiations led to the “tripartite” law31 with an agreement to be
afterwards forged into legislation on maintaining in employment policies, unemployment allowances
and the wage indexation system which has come to be scaled into different stages of payment over
the subsequent years. A similar decision has been taken at tripartite level to consecutively adjust the
basic social minimum wage in July 2010 and in January 2011 by 1.9%.
Luxembourg’s automatic indexation mechanism, set with the objective to cushion cost of living
increases and manage inflation, concerns the public sector and the overall private sector since 1975:
the instrument dates back to 1921 when wages of civil servants and railway workers were adapted
regularly to the cost of living. The application of indexation of wages, whose mechanism will be
explained in the next section, has generated over time conflictive positions which rendered
30 (Press communication of 26 November 2010). 31Law of December 22, 2006 on the promotion of maintaining in employment policies and on special measures in the area of social security and environmental policy, Mémorial A, number 239, 29 December 2006.
GINI Country Report Luxembourg
Page 94
consensus on an agreement among social partners difficult, in particular since the onset of the recent
economic and financial crisis,. Employers’ unions generally agree that indexation of salaries has been
a harmful instrument for corporate competitiveness; trade unions on their hand consider pay
increases in tandem with the rise of inflation as having a positive effect on consumer demand,
consumption, and social cohesion in general (Thill, Thomas 2009). In addition to continuing pressure
from the European Union (i.e. Annual Growth Survey 201232) or OECD (2012) to revise wage setting
mechanisms and proceed to reforms, the cost of living index has also been the subject of the 2006
tripartite negotiations, resulting in the social partners to agree on fixing index brackets to be limited
to the strict minimum of only one per year over the 2007-2009 period. It was also the disagreement
on wage indexation that led the last tripartite meetings to fail with the government finally agreeing
on limiting indexation to a single increase per year until 2014.
Minimum wage
The minimum wage (Salaire Social Minimum) has been introduced in Luxembourg in 1944. Figure 5.1.
displays the evolution of minimum wages relative to average earnings, that is, the ratio of minimum
wages to median earnings of full-time employees. Minimum wages increased over time but
remained between 30% and 35% of the mean wage of full-time employees. Labour market
institutions such as the minimum wage (and its automatic indexation) and the existence of the
unions mainly impact on the lower part of the income distribution.
As already mentioned, Luxembourg is one of the few countries that still uses a full and automatic
linking of salaries to changes in prices (STATEC, 2003) similar to that applied to wages in Belgium. The
mechanism works in the following way: if living costs (measured through the half yearly average of
the retail price index in the basket of goods) increases by 2.5%, wages and salaries in the public and
private sectors increase by 2.5%. Luxembourg’s social minimum wage was reformed in 197333 and
has since then been constantly adapted to price evolution. According to IGSS (2012a), 15.7% of wage
earners (corresponding to 52.074) received a social minimum wage in March 2012. In March 2012,
the SSM was standing at 1801.49 Euros and at 2161.78 Euros for qualified workers. Out of the total,
39% receive the qualified social minimum wage. The majority of minimum wage earners receive the
social minimum wage for non-qualified workers. The proportion of workers earning the minimum
32http://ec.europa.eu/europe2020/reaching-the-goals/monitoring-progress/annual-growth-surveys/index_en.htm 33Loi du 12 mars 1973 portant réforme du salaire social minimum, Mémorial A, number 15, 15 March 1973.

GINI Country Report Luxembourg
Page 95
wage varied between 10 and 12 percent from 1995 to 2008 and then increase due to change in the
methodology made necessary by a reform of social security organization.
Figure 5.1. Minimum wages relative to mean and median wages of full-time workers
Source: OECD http://stats.oecd.org/Index.aspx?DatasetCode=MIN2AVE
Figure 5.2. Share of wage-earners (excluding civil servants) earning the minimum wage
Source: IGSS (2012a:63)
5.3. Taxation
Taxes have a considerable impact on final disposable household income, and hence income
inequality. Tax revenue as a share of GDP in Luxembourg experienced little fluctuations between
0,2
0,25
0,3
0,35
0,4
0,45
19
80
19
81
19
82
19
83
19
84
19
85
19
86
19
87
19
88
19
89
19
90
19
91
19
92
19
93
19
94
19
95
19
96
19
97
19
98
19
99
20
00
20
01
20
02
20
03
20
04
20
05
20
06
20
07
20
08
20
09
20
10
Mean Median
0%
2%
4%
6%
8%
10%
12%
14%
16%
18%
19
95
19
96
19
97
19
98
19
99
20
00
20
01
20
02
20
03
20
04
20
05
20
06
20
07
20
08
20
09
20
10
20
11
20
12

GINI Country Report Luxembourg
Page 96
1990 and 2010 (see Figure 5.3.). During a first period, the burden increased from 33.4% in 1991 up to
39.7% in 2001. Then, the share of tax revenue in GDP was reduced, reaching 35.5% in 2009, before
rising again. On average over the 1990-2010 period, the tax burden in Luxembourg (37.2% of GDP)
was comparable to that of Germany (36.3%), but lower compared to Belgium (43.8%) and France
(43.5%).
Figure 5.3: Tax revenue as % of GDP, by source
Source: OECD Stat
The composition of the tax burden remained rather stable over the 1990-2010 period (see Table
5.1.). Luxembourg is in general more concentrating on taxes on income, profits and capital gains than
the neighbouring countries, Belgium, France and Germany, with a gap maximizing in 2010 between
Luxembourg (36% of total tax revenue in 2010) and France (22%). Within that budgetary article, it is
also striking to mention that the corporate tax is much higher in Luxembourg: 16% of total revenue in
2010 (16% in 1990, 18% in 2000), rather than between 4% and 7% only in the other three countries.
On the other side, social contributions are moderate (30% of tax revenue in Luxembourg in 2010, the
minimum share, 39% in Germany, the maximum). Finally, taxes on goods and services remained
rather stable, between 25% and 29% of the total tax burden in all four countries in 1990, 2000 and
2010.
0
5
10
15
20
25
30
35
40
45
50
19
90
19
91
19
92
19
93
19
94
19
95
19
96
19
97
19
98
19
99
20
00
20
01
20
02
20
03
20
04
20
05
20
06
20
07
20
08
20
09
20
10
5000 Taxes on goods and services 4000 Taxes on property
2000 Social security contributions 1000 Taxes on income, profits and capital gains

GINI Country Report Luxembourg
Page 97
Table 5.1: Tax revenue, by source, in Luxembourg and neighbouring countries (1990, 2000 and 2010)
Year
1990 2000 2010
Total tax revenue (in % of GDP)
LU 36% 39% 37%
BE 42% 45% 44%
FR 42% 44% 43%
DE 35% 37% 36%
Taxes on income, profits and capital gains (in % of total tax revenue)
LU 39% 36% 36%
BE 37% 39% 34%
FR 16% 25% 22%
DE 32% 30% 29%
… of which Corporate tax (in % of total tax revenue)
LU 16% 18% 16%
BE 5% 7% 6%
FR 5% 7% 5%
DE 5% 5% 4%
Social security contributions (in % of total tax revenue)
LU 27% 26% 30%
BE 33% 31% 32%
FR 44% 36% 39%
DE 37% 39% 39%
Taxes on goods and services (in % of total tax revenue)
LU 25% 27% 27%
BE 26% 25% 26%
FR 28% 26% 25%
DE 27% 28% 29%
Social security contributions and Taxes on income, profits and capital gains, out of Corporate tax (in % of total tax revenue)
LU 51% 44% 50%
BE 65% 62% 61%
FR 55% 54% 56%
DE 65% 64% 64%
Source: OECD Stat and own computations
It is often argued that the tax structure in Luxembourg is offering some attractiveness with regard to
the taxation of labour income (Annaert 2004) or, more generally, personal income. Such a scheme
would have “contributed to containing the rise in labour income while guaranteeing high net
incomes…”. This might be roughly illustrated while considering all taxes in income, profits and capital
gains (out of corporate tax) as well as social contributions. Altogether, those represent a share of
51% of the tax burden in 1990, 44% in 2000 and 50% again in 2010 in Luxembourg, to be compared

GINI Country Report Luxembourg
Page 98
to a fraction ranging from 54% and 65% in the other three countries over the same period, even if
clearly the gap experienced a significant reduction during the last decade, especially by comparison
with France (10% in 2000, 6% in 2010).
During the period 1990-2010, Luxembourg has known several tax reforms which might be roughly
summarized in three chapters: a decrease in the maximum marginal tax rate on personal income
from 50% in the early nineties (it had culminated at 62.70% in 1984-1985) down to 38% in 2001-2002
(then 39% since 2011), an important tax reform in 2001-2002 and, more recently, several changes
regarding households with children.
The tax reform of 2001-2002, out of a drop in maximal marginal tax rate from 46% down to 38%, also
included an enlargement of the first tax bracket, which means that the minimum income before tax
was increased, from 6,693 EUR in 2000 to 9,750 EUR in 2002. The reform of 2001-2002 benefitted
mainly to the richest: a 9% increase of mean equivalised income was observed when considering the
highest decile compared with less than 1% for the lowest decile, hence a higher Gini inequality index
(+0.014): “The reinforced income inequality is largely explained through a reduction of the Reynolds-
Smolensky index of vertical redistribution. This can be further decomposed into ‘progressivity’
(Kakwani index) and ‘magnitude’ (a coefficient depending on the average rate of taxation), both
factors playing a positive role in the vertical redistribution. Yet, clearly, the reduction in vertical
equity due to the reform results from a drop in the rate of taxation of 5.0-5.1% and not from the
progressivity, which increases from 0.342 … to 0.411 … as measured by the Kakwani index34.”
(Liégeois et al., 2011).
More recently, several adaptations have been adopted. For example, Luxembourg has a system of
compulsory joint taxation (income splitting) for married couples and cohabiting couples under the
“partenariat” law also had the possibility to be taxed jointly since 2008. The same year has been
introduced a tax bonus which replaced the tax reduction for children, hence benefitting to all
households fulfilling eligibility conditions and no longer to taxable households only. This reform
mainly benefitted to households (with children) with the lowest taxable income.
Regarding savings and capital income, since 2006 Luxembourg has introduced a 10% withholding tax
on income from some savings products for residents of Luxembourg who are not tax residents in
another state (such a tax was not collected earlier). This tax is in full discharge of a person’s liability
to tax on that income. Capital income, which was imposed a tax rate of 25% since 1994 (15% earlier),
34 The increase in progressivity can be explained by an enlargement of the first tax bracket (tax rate = 0%), which overcame, regarding the measurement of progressivity through the Kakwani index, the effect of reducing the marginal tax rates for higher income levels.

GINI Country Report Luxembourg
Page 99
was “better” treated since 2002 (back to a tax rate of 20%) and even more since 2007 (15%)
(Elvinger, 2008). Finally, the personal wealth tax was removed in 2006 in Luxembourg.
The growing importance of cross-border workers for the Luxembourg economy has been emphasized
all along the report. This is reflected of course in terms of contribution to the social security in
Luxembourg. For example, the participation of non-residents to the health insurance was 29.9% in
2001, to be compared to 33.7% in 2010 (IGSS, 2012b). For pensions, the share was 36.0% in 2001 and
43.5% in 2011. Of course, the link is two-way but with for some aspects a clear disequilibrium. Even if
comparisons between those figures must be done with care, only 16.2% of pensions were paid
abroad in 2001 and 21.0% in 2010 (IGSS, 2012b).
5.4. Social expenditures
As compared to the other OECD countries, Luxembourg has been just above average in terms of
public social expenditures (measured as a percentage of GDP) over the last 30 years (Figure 5.4).
Figure 5.4. Public social expenditures, by function, as a percentage of GDP – Luxembourg 1980 – 2007
Source: OECD Socx
Old age and health are the two functions with the highest public expenditures. As for STATEC
(2003:183), this suggests that “the solidarity established by the social welfare system is not so much
between rich and poor as between those in employment and those retired, and between those who
are healthy and those who are sick”. Spending on unemployment has increased since 2000,
remaining quite low. Universal family allowances are continuously growing since 1980 and went from
0
5
10
15
20
25
30
19
80
19
81
19
82
19
83
19
84
19
85
19
86
19
87
19
88
19
89
19
90
19
91
19
92
19
93
19
94
19
95
19
96
19
97
19
98
19
99
20
00
20
01
20
02
20
03
20
04
20
05
20
06
20
07
Health Old age Family IncapacitySurvivors Unemployment ALMP OtherHousing OECD

GINI Country Report Luxembourg
Page 100
a 8% share of the total spending to a 15% share in 2007. More recently, the Luxembourgish Ministry
of Family indicated that between 2007 and 2010, the foreseen family expenses increased
substantially following the increase in foreseen expenses on parental leave, family benefits and
mainly childcare services subsidies.35
While the share of cash public social expenditure in overall expenditure over time has decreased
(Figure 5.5.), the share of in kind social expenditure has increased (Figure 5.6.). In 1980, the latter
represented 25% of the overall social expenditure while in 2007 they amounted to almost 40%. This
increase is mainly due to the increase in health care spending. In-kind family benefits do not account
for a high share since the 1980s but this however has probably changed recently as one major
childcare reform has been introduced in Luxembourg (Reinstadler, 2011). After this reform, the
expenses directed to childcare services have increased, both by raising the number of childcare slots
for young children whose parents work, and by subsidizing the price of these slots (Bousselin, 2011;
Bousselin and Segura, 2011).
Figure 5.5: Cash public social expenditure, by function, % GDP
Sources: OECD SOCX; data are available every 5 years before 2005
35 Sources: Loi du 22 décembre 2006 concernant le budget des recettes et des dépenses de l'Etat pour l'exercice 2007, and Loi du 18 décembre 2009 concernant le budget des recettes et des dépenses de l'Etat pour l'exercice 2010.
0
2
4
6
8
10
12
14
16
19
80
19
85
19
90
19
95
20
00
20
05
20
06
20
07
Old age Incapacity related Survivors Family Unemployment Other social policy areas

GINI Country Report Luxembourg
Page 101
Figure 5.6: In kind public social expenditure, by function, % GDP
Sources: OECD SOCX; data are available every 5 years before 2005
Since 1901, Luxembourg adopted a Bismarckian insurance model and was able to develop a broad
system of social protection providing generous unemployment benefits and old-age pensions.
Hartmann-Hirsch (2010) explains how, thanks to the massive presence of foreigners in the private
sector, the Luxembourg system of social security was able over the last twenty years to expand and
improve its insurance provision and benefits – including universal benefits – while other European
countries had to stabilise their system or even implement significant cuts.
Among the new insurances and benefits introduced, one can list the parental leave (1999), the care
insurance (1999) (“assurance dependence”), an education allowance (2002), a minimum income
scheme for disabled persons (2003), a child bonus to replace a tax credit (2008) and in-kind benefits
to help finance childcare (2009) (see IGSS, 2012a). In addition to the introduction of these measures,
the generosity of some measures has been substantially improved. Policies in favour of the elderly
but also families with children are extremely generous. According to Kieffer (2012), the gross pension
replacement rate increased substantially to more than 80% for all income groups following the 1991
and 2002 pension reforms. Child benefits in Luxembourg are among the highest in the European
Union. Considering spending (in cash and in kind) on families with children and taking into account
tax expenditures (expressed in % of GDP), Bradshaw and Chzhen (2009) find that Luxembourg is the
second most generous OECD country. When expressing the spending per child as a proportion of
spending per old person, they find that spending on children compared with the elderly has
increased strongly in Luxembourg between 1980 (around 30%) and 2003 (around 90%). In the same
line, STATEC (2003:185) note that “the increasingly important role played by various benefits and
0
2
4
6
8
10
19
80
19
85
19
90
19
95
20
00
20
05
20
06
20
07
Health Incapacity related Family Housing Other social policy areas Old age Survivors

GINI Country Report Luxembourg
Page 102
allowances for families with dependent children also becomes apparent when we consider the rate
of increase of expenditure on the various functions. From 1985 to 2000, they rose by 338%, while
pensions spending only doubled.”
As was mentioned in Chapter 1, the social security administration displays a positive budgetary
balance since the beginning of the 1990s even during the recent crisis (Fig. 1.1.). This situation is
mainly the result of the continued growth of the domestic labour market attained through the
inflows of migrants and cross-borders workers. The current number of insured individuals
contributing plainly to the funding of the social protection through social contribution and tax
exceeds the number that would actually be necessary to sustain the system (Zanardelli, 2004,
Allegrezza et al, 2005 or Amétépé and Hartmann-Hirsch, 2011). The net gain in pension and
healthcare insurance is based on the contribution of foreigners and cross-borders workers who are
on average younger, better educated and with higher employment rates than the nationals.36
However, as already mentioned, the ageing of the population might create sustainability problems
when this ‘over-contribution’ will end due to the mass retirement of these two groups (Amétépé and
Hartmann-Hirsch, 2011).
The high share of cross-border workers imply that a high proportion of cash benefits are exported.
For example, as mentioned earlier, 21% of the old age pensions are exported in 2010 compared to
16.2% in 2001. According to IGSS (2012a), the low level of exportation of pensions is due to the fact
that migrants and cross-borders workers that arrived in the country in the last twenty years are not
yet entitled to pensions. Also, since the amount of pensions is linked to the length of affiliation,
migrants who stayed only some years in Luxembourg do not receive full pensions from Luxembourg.
The age structure of the cross-border workers and migrants also explains the lower level in terms of
health-care and long term allowances.
The level of public expenditures in percentage of GDP does not give any information as for their
effectiveness in combating inequalities. As mentioned in Section 2.1.1., the level of inequality is
greatly reduced when we compare the level of inequality for factor income (income from work and
capital) and household disposable income (factor income and transfers). Inequality is reduced (by
11.8 points in the Gini index for 1985 and 14.5 points in 2000) when transfers are taken into account.
This substantial reduction reflects the strong redistributive effect of the Luxembourg welfare state
(OECD, 2012). Indeed, in 2010, Luxembourg is among the countries displaying the highest reduction
of the Gini coefficient before and after taxes and transfers (OECD, 2012)
36 Statec (2011) reports that the old-youth dependency ratio was stable around 22.3% in Luxembourg between 1995 and 2010. This is quite unique in Europe where the dependency ratio increased significantly between these two dates. For the EU27, the dependency ratio was of 24.4% in 1995 and increase to 28.4% in 2010.

GINI Country Report Luxembourg
Page 103
Figure 5.7. also shows that the poverty rate after transfers (using a 60% of the median equivalent
income poverty threshold) is consistently lower than the poverty rate before transfers in
Luxembourg. However, as mentioned by the OECD (2012), the reduction in poverty is less than in
other countries such as Denmark or Sweden where social spending expressed as a share of national
income are comparable. This may be explained by the fact that the main components of the social
system such as pensions or family benefits are "designed mainly to tackle specific social issues and
are not primarily designed for redistribution [..]. As a result, the progressivity of cash transfers is
rather low in international comparison" (OECD, 2012:47).
Figure 5.7 At risk of poverty rates, before and after social transfers, 1995-2010
Source: Eurostat for At risk of poverty rate and at risk of poverty rate before social transfers (excluding pensions). STATEC for the at risk poverty rate before social transfers 2003-2010.
Finally, a minimum guaranteed income (Revenu Minimum Garanti (RMG)) has been introduced in
Luxembourg in 1986 (Amétépé, 2012). It was at that time granted under conditions of age (30 years
at least), residence (10 years in Luxembourg over the previous 20 years) and income. These eligibility
criteria have changed afterwards: in 1999, the age condition has been set at 25 years, and the
residence period reduced to 5 years; this last condition has even disappeared in 2001 for EU-citizens.
These changes have led to increase the eligible population.
0
5
10
15
20
25
30
35
40
45
50
19
95
19
96
19
97
19
98
19
99
20
00
20
01
20
03
20
04
20
05
20
06
20
07
20
08
20
09
20
10
At risk of poverty rate before social transfers (pensions excluded from social transfers)
At risk of poverty rate
At risk of poverty rate before social transfers

GINI Country Report Luxembourg
Page 104
5.5. Education
The National education system (including tertiary education) in Luxembourg is managed by two
ministries: the Ministry of National Education and Professional Training – responsible for pre-
primary, primary, secondary education, as well as the adult learning; and the Ministry of Higher
Education and Research - responsible for tertiary education, research, and research institutes. The
funding of the education system is ensured by the government of the Grand Duchy37 through direct
allocations to both ministries, with additional contribution through related services as well as funding
from local communes, Ministry of Health, Ministry of Family, Ministry of Transport, and
Administration of Public Buildings. The education expenditures (for pre-school, primary, and
secondary education) have been slowly decreasing since early 1980s, and reached 3.1% of GDP in
2011.
Figure 5.8. Public spending on education (% of GDP)
Data: World Bank (http://data.worldbank.org/indicator/SE.XPD.TOTL.GD.ZS) & Eurostat (http://appsso.eurostat.ec.europa.eu/nui/show.do?dataset=educ_figdp&lang=en)
Despite the relative decrease in expenditures both in comparison to earlier years and to other
European countries, Luxembourg remains one of the top-spending nations per student (OECD 2012).
Also, the education budget has been growing in absolute terms and has nearly doubled between
37 Historically set by the Law of 10 August 1912 with respect to the obligatory education, and remained unchanged since then.
4,6
5,3
3,3
4,1
3,5
3,9
2,9
3,1
2
3
4
5
6
19
80
19
81
19
82
19
83
19
86
19
87
19
88
19
89
19
95
19
96
20
01
20
02
20
03
20
04
20
05
20
06
20
07
20
08
20
09
20
11

GINI Country Report Luxembourg
Page 105
2000 and 2011, reaching 1,173,197,989 EUR38 (MENFP 2012: 92). However, as shown infra, inequality
of opportunity in educational achievements persists along the socio-economic and immigration lines.
Below is an overview of most recent policy changes in Luxembourg.
Socio-economic inequalities
In order to financially support families, Luxembourg has introduced a special law in 1986 which offers
school benefits for all families which have at least one pupil. The amount of financial help paid
annually at the beginning of the year is dependent on the number of children in the family. Families
can additionally apply for social assistance through special services in school. The assistance covers
school meal of a student, as well as provides means to purchase all school materials, books.
Government offers other free services such as transport for attending school free of charge.
Due to changes in labour force profile and increasing participation of women in the labour market,
government was compelled to offer systematic support for working families, especially with younger
children. This resulted in the creation of Foyer Scolaire/Maison Relais –after-school centres, where
children are picked up from school, and are looked after, complete their homework, have art and
music classes, engage in trips, other learning activities.
For young students in secondary schools, the Ministry has initiated the creation of Cours d’appuis –
assistance classes where students can ask for additional help from teachers after the end of the
school day. However, these services are offered only in larger secondary schools.
For both initiatives, however, there are no studies which evaluate the efficiency of these services, or
offer other quantifiable information, to the best of our knowledge.
Immigrant background-related inequalities
With immigrant population continuously growing, the Ministry of Education has created a special
department Service de la scolarisation des enfants étrangers – Office for education of immigrant
children, which from 1998 coordinates all measures for school integration of immigrant children
through various help offered to the pupils, parents, as well as the teachers. Parents, for instance, can
use the services of “intercultural mediators” offered by the Ministry, in order to communicate with
teachers, and participate in other school-related activities. The mediators usually perform the role of
38 It should be noted, however, that 70% of the budget is spent for remuneration of teaching and assisting personnel.

GINI Country Report Luxembourg
Page 106
translators between school officials and parents. Such services are especially designed for recent
immigrants, in order to provide them with most important information about school system.
Luxembourgish schools also offer various educational classes for immigrant students, with most of
them being offered for newcomers.
Drop-out
Official data suggest a decline in school dropout from 16.8% to 13.4% from 2000 to 2008. The rate is
somewhat lower than the average EU-level (14.9% in 2008). Recent study by the Ministry of
Education and Local Action for Youth revealed that 20% remain unemployed which is in high contrast
with country-level average unemployment rate of 5.6% (2008).39
L’école de la 2e chance - School of the 2nd chance40 is a targeted measure for re-integrating young
people aged 16-24 who dropped out of school and are currently unemployed. It has been opened in
March 2011 and has the capacity for accepting up to 350 young people. The programme has three
main options: general education – e.g. in languages or mathematics necessary for the re-integration
at school; vocational education – training for profession in one of the following fields: agriculture,
artisanship, commerce, hotel and tourist industry, paramedics, and social field aiming at entry into
the labour market; and complementary activities – cultural, arts, and sports activities.
5.6. Conclusions
The evolution of the Luxembourg institutions contributed to the evolution of the income distribution
in the last thirty years. First, the favourable taxation put in place in the beginning of the 1990s and
modified in 2002 favoured the increase in average standard of living and of top incomes which
contributed to increase income inequality.
Second, the different features of the Luxembourg socio-fiscal system and institutions contributed to
contain inequality. Indeed, the virtuous cycle between increased employment and growth
contributed to keep excellent public finances which in turn have been used to build an efficient
redistributive welfare state. The system of transfers evolved, in the words of Hartmann-Hirsch
(2010), from a corporatist welfare state into a universalistic Scandinavian one. The labour market is
39 There might be an underestimation, as 25% of young adults did not provide information, or could not be reached. 40 Loi du 12 mai 2009 portant création d’une École de la 2e Chance. Available at: http://www.men.public.lu/legislation/lois_rgd_recents/090518_ecole_2e_chance.pdf [Accessed on 12 August 2012].

GINI Country Report Luxembourg
Page 107
one of the most regulated of the OECD countries with a strong regulatory framework within the
Luxembourg social model, that is a strong social dialogue between unions, employers’
representatives and the government. There is an automatic indexation of salaries to inflation that
apply to all wages and also to the minimum wage. The minimum wage relative to average wages
increased over time contrary to what happened in other countries. This feature of the labour market,
together with the generous welfare state (in particular the pension system and family-related
policies) contributed to raise the floor of the income distribution and therefore to contribute ‘from
the bottom’ to achieve a comparatively low level of inequality.
However, concern has been expressed by international institutions such as the OECD (2012) about
the sustainability of the whole system. Budget deficit, population ageing, increasing unemployment
are among the challenges that the country currently has to face in a context of low economic growth
which contrasts with the impressive economic expansion of the last thirty years.

GINI Country Report Luxembourg
Page 108
Conclusion
The purpose of this national report to the GINI project was to document trends in inequality across
various dimensions and to link these trends to social, cultural and political developments in
Luxembourg for the period 1980-2010. The situation described is a ‘success story’ which saw
Luxembourg successfully transition from a steel-based industrial economy to a high value-added
services-oriented society. While the average standard of living increased substantially, not all
Luxembourg residents benefited equally from this growth since the income distribution became
more dispersed. The analysis of the evolution of a set of social, political and cultural outcomes
suggest that the (moderate) rising trend in inequality did not impact strongly on the society or was
offset by the benefits of increasing living standards and a generous Welfare State that expanded over
the period thanks to the continued economic growth.
Of course, not everything is perfect. The main conclusion of our report is based on evolution of
average trends. Where possible, we also analysed the evolution of trends at a subgroup level which
revealed how some less skilled population subgroups do lag behind. Second, some inequalities at a
subgroup level appear to be sustained by an educational system that tends to reproduce social
disadvantage across generations. Finally, the period covered by this report was a period of great
expansion in Luxembourg which has slowed down in recent years.
Luxembourg is still among top countries in terms of GDP per capita and, according to OECD (2012),
emerged in quite good conditions from the recent crisis, compared to other OECD countries.
However, dependence of the economy on the financial sector is now perceived as a vulnerability and
the country is facing the challenges of an ageing population, rising unemployment, fiscal
consolidation, and difficulties in the social dialogue that threatens the social model in place since the
industrial transition and the capacity of the country to maintain its generous Welfare State. The
ability of the country to deal with these issues in a changing international environment will be an
important determinant of future social inequalities, well-being and cohesion.

GINI Country Report Luxembourg
Page 109
References
Alexander, R.J. (2001). Maoism in the developed world, Westport: Praeger.
Alieva, A. (2010). Educational Inequalities in Europe: Performance of Students with Migratory Background in Luxembourg and Switzerland, Frankfurt am Main: Peter Lang.
Allegrezza S., Brosius J., Gerber P., Hausman P., Langers, J., Schuller G., Zanardelli M. (2005). “Emploi, production, rémuneration et transferts courants des salariés frontaliers”, Cahiers Economiques n°100, STATEC, Luxembourg.
Allegrezza, S., Heinrich, G. and Jesuit, D. (2004). “Poverty and income inequality in Luxembourg and the Grande Région in comparative perspective”, Socio-Economic Review, vol. 2, pp.263-283.
Allegrezza, S., Hirsch, M., von Kunitzki, N (2003), L’histoire, le présent et l’avenir du modèle luxembourgeois, Luxembourg: Institut d’études européennes et internationales du Luxembourg.
Amétépé F. (2012), “The effectiveness of Luxembourg’s minimum guaranteed income”, International Social Security Review, vol.°65, 1/2012.
Amétépé F., Hartmann-Hirsch C. (2011), “An outstanding position of migrants and nationals: the case of Luxembourg”, Population Review, vol. 50, 1, pp.195-217.
Annaert J.L. (2004). “A bright spot in the heart of Europe: what can we learn from the Luxembourg success story?”, ECFIN Country Focus, Vol. 1. Issue 15. 1/2012, pp.99-116.
Berger, F. (2007) “Revenu disponible, niveau de vie, pauvreté, inégalités : bilan sur la période 1995-2005", Forum, n°263, pp.33-38.
---- (2005). “Développement de l’emploi transfrontalier au Luxembourg et portrait sociodémographique des frontaliers”, Population & Emploi n°8, CEPS/INSTEAD.
---- (2003). “Le système socio-fiscal luxembourgeois: analyse des effets et de son évolution entre 1999 et 2002", Population & Emploi n°2, CEPS/INSTEAD.
Berger, F., Fusco, A., Jeandidier, B. and Reinstadler, A. (2010). "La pauvreté des enfants au Luxembourg", Rapport pour le Ministère de la Famille et de l’Intégration du Luxembourg, Mai, CEPS/INSTEAD.
Berger F., Fusco A., Kyzyma I. (2013). “Explication de l’évolution des inégalités de revenu entre 1987 et 2010 au Luxembourg”, in CEPS/INSTEAD (eds.), Cohésion sociale et territoriale : Regards croisés sur la société luxembourgeoise, forthcoming.
Blau, L. (2005). Histoire de l'extrême-droite au Grand-Duché de Luxembourg au XXe siècle, Esch-sur-Alzette: Éditions Le Phare.
Blau, P.M., Schwartz, J.E. (1984). Cross-cutting Social Circles: Testing a Macrostructural Theory of Intergroup Relations, Transaction Publishers.

GINI Country Report Luxembourg
Page 110
Blond-Hanten, C., Lejealle, B., Segura, J., Waltzer, L. (2012). Le secteur associatif au Luxembourg. Rapport pour l’Oeuvre Nationale de Secours Grande-Duchesse Charlotte, CEPS/INSTEAD, Œuvre Nationale de Secours Grande-Duchesse Charlotte.
Borsenberger, M., Cassilde, S., Lamour, C., Bardes, J., Vanni, L., Villeret, A. (2011). Les pratiques culturelles au Luxembourg. Volume 1/2. Résultats de l’enquête culture 2009. Differdange: CEPS/INSTEAD.
Bousselin A. (2011). “Conséquences sur l’activité des prestataires de l’accueil socio-éducatif”. Rapport pour le Ministère de la Famille et de l'Intégration, CEPS/INSTEAD.
Bousselin A. and Segura J. (2011). “Bilan du chèque-service accueil un an après sa mise en application Conséquences sur la demande de modes d’accueil des enfants et l’activité professionnelle des parents”, Rapport pour le Ministère de la Famille et de l'Intégration, CEPS/INSTEAD.
Bradshaw J., and Chzhen Y. (2009), “Child Poverty Policies across Europe”, Zeitschrift für Familienforschung, 21. Jahrg., Heft 2/2009, S. 128-149.
Brosius J., Ray J-C. (2012), “Wage differentials between natives and cross-border workers within and across establishments: evidence from Luxembourg”, mimeo, CEPS/INSTEAD.
Cames M. (2011), “The Luxembourg Social Model: Quo vadis?”, mimeo, University of Luxembourg.
Elvinger A., (2008), “Regards sur un demi-siècle d'histoire de l'impôt au Luxembourg”, in Droit fiscal luxembourgeois, Livre jubilaire de l’IFA Luxembourg, Bruylant, Bruxelles, 3-38.
EU Council of Ministers (1985), “Council Decision of 19 December 1984 on Specific Community Action to Combat Poverty” (85/8/EEC), OJEC, L 2, Brussels.
Eurostat (2002), Income, Poverty and Social Exclusion, Second Report, Luxembourg.
Eurostat, EuroBase, http://epp.eurostat.ec.europa.eu/portal/page/portal/waste/data/database.
Fetzer, J.S. (2011). Luxembourg as an Imigration Succes Story. The Grand Duchy in Pan-European Perspective, Lanham, Boulder, New York, Toronto & Plymouth: Lexinton Books.
Fleury C., Maas R., Thomas A. (2011). “Les immigrants et les syndicats”, CEPS/INSTEAD Working Paper 2011-63, Luxembourg.
Fusco A., Guio A.-C., Marlier E. (2011). “Income poverty and Material Deprivation in European, countries”, CEPS/INSTEAD Working Paper 2011-04, Luxembourg.
Guio, A.-C. (2005). “Material Deprivation in the EU”, Statistics in Focus, 21/2005, Eurostat, Luxembourg.
Hartmann-Hirsch C. (2010). “The state of the Luxembourg welfare state: the effects of the crisis on a corporatist model shifting to a universalistic model”, CEPS/INSTEAD Working paper 2010-44, Luxembourg.
Hartmann-Hirsch C., Amétépé F. (2012). “Luxembourg’s corporatist Scandinavian welfare system and incorporation of migrants”, IMIS Beiträge, 41, 81-103.
Hernandez-Quevedo C., Masseria C. and Mossialos E., (2010), “Analyzing the socioeconomic determinants of health in Europe: new evidence for EU-SILC”, Methodologies and Working papers, Eurostat, Luxembourg.

GINI Country Report Luxembourg
Page 111
Hirsch, M. (1986). “Tripartism in Luxembourg: the limits of social concertation”, West European Politics, vol 9.
Ignazi, P. (2006). Extreme right parties in Western Europe, Oxford: Oxford University Press.
IGSS (Inspection Générale de la Sécurité Sociale) (2012a), Rapport Général sur la Sécurité Sociales au Grand-Duché de Luxembourg, Ministère de la sécurité Sociale, Luxembourg.
---- (2012b), http://www.isog.public.lu/gbe/pkg_isgbe5.prc_show_dokument?p_aid=28881772&p_uid=statsecu2007&sprache=D&p_lfd_nr=1&p_dokumente=0, accessed in October 2012.
IMF (International Monetary Fund) (2000), “Why is Luxembourg growing so fast?” in Luxembourg: Staff Report for the 2000 Article IV Consultation Ŕ Selected issues, pp. 6-14.
Inglehart, R., Baker, W.E. (2000). “Modernization, Cultural Change, and the Persistence of Traditional Values”, American Sociological Review, vol. 65, pp.19-51.
Inglehart, R., Welzel, C. (2005). Cultural Change and Democracy: The Human Development Sequence, New York and Cambridge: Cambridge University Press.
Kesler, C., Bloemraad, I. (2010). “Does Immigration Erode Social Capital? The Conditional Effects of Immigration-Generated Diversity on Trust, Membership, and Participation across 19 Countries, 1981-2000”. Canadian Journal of Political Science vol.43(2):319-347.
Kieffer R. (2012), “Avis du Président de la Caisse nationale D’Assurance Pension concernant le projet de loi portant réforme de l’assurance pension”, Juin 2012.
Lamour, C., Langers, J. (2012). “La Presse Quotidienne Gratuite au Luxembourg. Vers un renouveau générationnel et populaire de la presse?”, Population & Emploi n°2012-01, Cahiers du CEPS/INSTEAD, Luxembourg.
Lamour, C., Lorentz, N. (2012). “La pratique de la presse payante papier au Luxembourg.Une fin programmable au temps numérique et métropolitain?”, Population & Emploi n°2012-03, Cahiers du CEPS/INSTEAD, Luxembourg.
Lejealle, B., (2003) “Participation a la vie associative au Luxembourg en 2001”, Population & Emploi n°1, CEPS/INSTEAD, Luxembourg.
---- (2002) “Le travail bénévole au Luxembourg en 2001 », Population & Emploi n°2, CEPS/INSTEAD, Luxembourg.
Lelkes O. (2010). “Social participation and social isolation”. Methodologies and working papers. Luxembourg, Publications Office of the European Union.
Lerman, R. I. and Yitzhaki, S. (1985), “Income inequality effects by income source: A new approach and applications to the United States”, The Review of Economics and Statistics, vol 67 (1): 151-156.
Liégeois Ph., Berger F., Islam N. and Wagener R., (2011), “Cross-validating administrative and survey datasets through microsimulation and the assessment of a tax reform”, International Journal of Microsimulation, vol. 4(1), 1-18.
Maas R., Blond-Hanten C., Etienne-Robert F. (2012), “Le temps de travail, l’emploi, la formation et l’égalité des genres dans les conventions collectives de travail en 2005 et 2006”, Rapport, CEPS/INSTEAD.

GINI Country Report Luxembourg
Page 112
Mathä T.Y., Porpiglia, A., Sierminska E., (2011). "The Immigrant/Native Wealth Gap in Germany, Italy and Luxembourg," BCL working papers 57, Central Bank of Luxembourg.
Mathä T., Porpiglia A., Ziegelmeyer M. (2012), "The Luxembourg Household Finance and Consumption Survey (LU-HFCS): Introduction and Results", BCL Working Paper n°73, Central Bank of Luxembourg.
MENFP (2010), “L’éducation au Luxembourg 2009” (accessed on 02 August 2012: http://www.men.public.lu/publications/syst_educatif_luxbg/systeme_scol_luxbg/100215_education_au_luxembourg_2009/100215_web_education_au_luxembourg.pdf), Luxembourg.
---- (2011), “Le rapport d'activité du MENFP de l'année 2010”, Luxembourg.
---- (2012), “Les chiffres clés de l’éducation nationale : statistiques et indicateurs. Année scolaire 2010-2011”, Luxembourg.
---- (2012), “Le rapport d'activité du MENFP de l'année 2011”, Luxembourg.
Meulemann, H. (2008). “Introduction”, in Meulemann H. (Ed.) Social capital in Europe: similarity of countries and diversity of people? Multi-level analyses of the European social survey 2002, Leiden, Boston: Brill, pp. 1-40.
Mihaylova, D. (2004). Social Capital in Central and Eastern Europe. A Critical Assessment and Literature Review, CPS Policy Studies Series: Budapest.
Nolan, B., Whelan C.T. (2011), "The EU2020 poverty target", GINI Discussion Paper 19, AIAS, Amsterdam Institute for Advanced Labour Studies.
OECD (2012), Economic surveys of Luxembourg, December 2012.
----. (2011a) Divided we stand: Why inequality keeps rising. Paris: OECD
OECD Health Statistics (2011b), http://stats.oecd.org/index.aspx?DataSetCode=HEALTH_STAT#.
OECD (2010a) Economic surveys of Luxembourg, May 2010.
---- (2010b), “PISA 2009 Results: Overcoming Social Background – Equity in Learning Opportunities and Outcomes” (Volume II).
---- (2010c). Economic Policy Reforms. Going for Growth. Chapter 5, Paris: OECD.
Osier G. (2012), “L’évolution du revenu des ménages depuis le milieu des années 80”, STATEC, Collection le Luxembourg 1960-2010, Luxembourg.
Paxton, P. (2007). “Association Memberships and Generalized Trust: A Multilevel Model across 31 Countries”, Social Forces, vol. 86(1):47-75.
Pi Alperin M.N. and Berzosa G, (2011), “A fuzzy logic approach to measure obesity”. CEPS/|INSTEAD Working Paper 2011-55, Luxembourg.
Putnam, R.D. (2007). “E Pluribus Unum: Diversity and Community in the Twenty-first Century”, Scandinavian Political Studies vol. 30(2):137-174.
---- (2001). Bowling Alone. The Collapse and Revival of American Community. Touchstone.
Reinstadler A. (2011). “Luxembourg and France: Comparable Family Benefits, Comparable Fertility Levels?” CEPS/INSTEAD Working Papers 2011-65, Luxembourg.
GINI Country Report Luxembourg
Page 113
Ries J. (2012), “Les mutations de l’emploi de 1960 à 2010”, STATEC, Collection le Luxembourg 1960-2010, Luxembourg.
---- (2011), “Regards sur la syndicalisation au Luxembourg”. Luxembourg: STATEC, Regards 12-2011.
Salamon, L.M., Sokolowski, S.W., List, R. (2003), Global Civil Society. An overview, Baltimore: Center for Civil Society Studies, Institute for Policy Studies, The John Hopkins University.
Schäfer A. (2010), “Conventions collectives et salaries”, Working papers du STATEC, Number 36, Luxembourg.
Schuller G. (2002), “Des déterminants du développement économique du Luxembourg: Tendances et perspectives”, Forum, n°221, pp. 16-23.
Scuto, D. (2012). La nationalité luxembourgeoise (XIXe-XXIe siècles). Histoire d’un alliage européen, Bruxelles: Éditions de L’Université de Bruxelles.
Sierminska, E., Brandolini, A., and Smeeding, T. (2006). “The LuxembourgWealth Study:A cross-country comparable database for household wealth research”. Journal of Economic Inequality, vol. 4(3):375–383.
Sierminska E., Doorley K., (2012). “Decomposing household wealth portfolios across countries: An age-old question?” CEPS/INSTEAD Working Paper 2012-32, Luxembourg.
Sohn, C. (2012). “La frontière comme ressource dans l’espace urbain globalisé. Une contribution à l’hypothèse de la métropole transfrontalière”, CEPS/INSTEAD Working Paper 2012-25, Luxembourg.
Sologon, D.M. (2010). Earnings dynamics in Europe, PhD thesis, Maastricht University, Boekenplan Press, Maastricht.
STATEC website http://www.statistiques.public.lu/fr/economie-finances/index.html.
---- (2012), “Rapport Travail et Cohésion Sociale 2012”, Cahiers Economiques number 114, Luxembourg.
---- (2011), “Rapport Travail et Cohésion Sociale 2011”, Cahiers Economiques number 112, Luxembourg.
---- (2010), “Nuptialité et divortialité au Luxembourg (1994-2008)”, Bulletin du STATEC, n°2.
---- (2003), “Economic and social portrait of Luxembourg”, Luxembourg.
Tchicaya A. And Lorentz N., (2010), “Prévalence du surpoids et de l’obésité de 1995 à 2008”, Vivre au Luxembourg No. 66, CEPS/INSTEAD, Luxembourg.
Thill P., Thomas A. (2009), “Le ‘Modèle social luxembourgeois’ au défi de la crise”, Gouvernance et Emploi, n°12, CEPS/INSTEAD, Luxembourg.
---- (2011) “The End of Consensus? The Effects of the Economic Crisis on Industrial Relations in Luxembourg” in M. Baglioni, B. Brandl (eds), Changing Labour Relations Between Path Dependency and Global Trends, Frankfurt am Main: Peter Lang, Labour, Education & Society, Vol. 24.
Thomas, A. (2011). “Besoin de qualification et circulation transfrontalière de l'information sur l'emploi dans la Grande Région”, Les cahiers transfrontaliers d’EURES N°3/2011
GINI Country Report Luxembourg
Page 114
Tibesar, A. (2010). “L'évolution du marché du travail transfrontalier dans le contexte de crise économique”, Les cahiers transfrontaliers d’EURES N°2/2010.
Tufiş, C.D. (2012). Learning Democracy and Market Economy in Post-Communist Romania, Iaşi: EdituraInstitutul European.
Uslaner, E.M. (2011). “Trust, Diversity, and Segregation in the United States and the United Kingdom”. Comparative Sociology vol. 10(2):221-247.
Visser, J. (2009), ICTWSS: Database on Institutional Characteristics of Trade Unions, Wage Setting, State Intervention and Social Pacts in 34 Countries between 1960 and 2007. Amsterdam: Amsterdam Institute for Advanced Labour Studies (AIAS).
Voicu, B. (2012). Immigrants and social trust: Mind the cultural gap? Manuscript.
---- (2010), Social Capital in Romania at the beginning of the Millenium: Traveller in the no-friends land?, Iaşi: Lumen (in Romanian language).
---- (2005). The Pseudo-Modern Penury of the Romanian Postcommunism. Volume I. Social change and individual actions, Iaşi: Expert Projects.
Wey C. (2011). "D’un pays arriéré et pauvre à l’Etat le plus prospère d’Europe", in Jungblut M-P. and Wey, C. (eds). Armes Luxemburg ? Pauvre Luxembourg ? pp. 11-33, Musée d’Histoire de la ville du Luxembourg, Luxembourg.
Wilkinson R. and Pickett K. (2009). The spirit Level: Why inequality is bad for everyone, Allen Lane, UK.
Wilson, J. (2000). “Volunteering”, Annual Review of Sociology vol. 26: 215-240.
Zahlen P. (2012a). “50 ans d’évolution démographique”, STATEC, Collection le Luxembourg 1960-2010, Luxembourg.
---- (2012b), “50 ans de migrations”, STATEC, Collection le Luxembourg 1960-2010, Luxembourg.
---- (2012c), “50 ans de mariages et de divorces”, STATEC, Collection le Luxembourg 1960-2010, Luxembourg.
---- (2012d), “L’évolution économique globale du Luxembourg sur la longue durée”, STATEC, Collection le Luxembourg 1960-2010, Luxembourg.
---- (2011), “Regards sur le nouvel indicateur de pauvreté et d’exclusion UE-2020”, Regards 3-2011, STATEC, Luxembourg.
Zanardelli M. (2004), “Les niveaux de formation de la main d’oeuvre active au Grand-Duché de Luxembourg”, Population & Emploi n°3, CEPS/INSTEAD, Luxembourg.

GINI Country Report Luxembourg
Page 115
Annex
Table A.1: Evolution between 1983 and 2011 of employment rates by age and gender
Employment rates for the whole population
15-24 25-54 55-64 15-64
1983 56.3% 67.2% 25.1% 58.7%
1984 55.2% 68.0% 25.1% 59.0%
1985 54.8% 68.0% 25.5% 58.5%
1986 54.5% 69.8% 25.4% 59.5%
1987 53.3% 71.0% 27.4% 60.1%
1988 50.0% 70.6% 25.3% 58.8%
1989 50.8% 70.8% 24.8% 59.3%
1990 43.3% 71.8% 28.2% 59.2%
1991 51.8% 72.8% 23.2% 60.7%
1992 49.4% 74.1% 24.7% 61.5%
1993 45.7% 73.3% 26.1% 61.0%
1994 42.8% 73.5% 23.2% 60.2%
1995 38.2% 71.9% 24.0% 58.5%
1996 36.9% 73.2% 22.6% 59.1%
1997 34.7% 74.4% 23.7% 59.9%
1998 33.1% 74.7% 25.0% 60.2%
1999 31.7% 76.7% 26.3% 61.6%
2000 31.8% 78.2% 27.2% 62.7%
2001 32.3% 78.7% 24.8% 63.0%
2002 32.3% 79.1% 27.9% 63.6%
2003 27.0% 77.8% 30.3% 62.2%
2004 23.3% 79.3% 30.4% 62.5%
2005 24.9% 80.7% 31.7% 63.6%
2006 23.3% 81.0% 33.2% 63.6%
2007 22.5% 81.9% 32.0% 64.2%
2008 23.8% 80.0% 34.1% 63.4%
2009 26.7% 81.2% 38.2% 65.2%
2010 21.2% 82.3% 39.6% 65.2%
2011 20.7% 82.0% 39.3% 64.6%
Source: Eurostat, Labour Force Survey
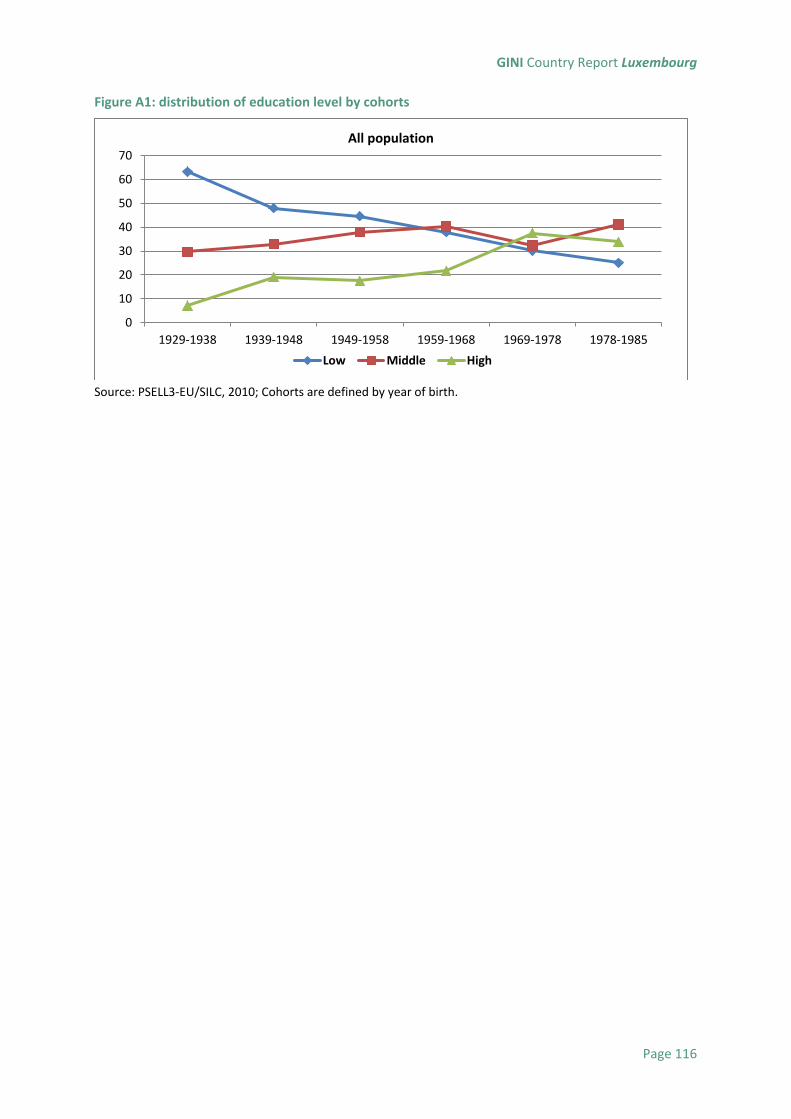
GINI Country Report Luxembourg
Page 116
Figure A1: distribution of education level by cohorts
Source: PSELL3-EU/SILC, 2010; Cohorts are defined by year of birth.
0
10
20
30
40
50
60
70
1929-1938 1939-1948 1949-1958 1959-1968 1969-1978 1978-1985
Low Middle High
All population

GINI Country Report Luxembourg
Page 117
Table A2: Theil index (Generalised entropy index (parameter = 1)) decomposition by subgroups
immigration population share relative mean income GE(1) within between within between
natives migrants natives migrants
1985 79% 21% 1.035 0.869 0.09047 0.08811 0.00235 97.39% 2.60%
1991 83% 17% 1.028 0.865 0.09434 0.09237 0.00197 97.91% 2.09%
1994 81% 19% 1.036 0.841 0.08927 0.08623 0.00304 96.59% 3.41%
1997 70% 30% 1.030 0.930 0.11623 0.11518 0.00105 99.10% 0.90%
2000 60% 40% 1.031 0.953 0.11759 0.11686 0.00073 99.38% 0.62%
2004 57% 43% 1.060 0.919 0.12941 0.12693 0.00248 98.08% 1.92%
2010 57% 43% 1.060 0.918 0.13714 0.13456 0.00258 98.12% 1.88%
Source: LIS (1985-2004) and PSELL3/EU-SILC data (2010), authors’ computation. individuals aged 15+
education population share relative mean income GE(1) within between within between
low medium High low medium high
1985 48.3% 45.1% 6.6% 0.858 1.069 1.565 0.09070 0.07548 0.01522 83.22% 16.78%
1991 53.3% 39.0% 7.6% 0.876 1.067 1.524 0.09645 0.08233 0.01412 85.36% 14.64%
1994 50.0% 40.9% 9.1% 0.872 1.045 1.509 0.08884 0.07402 0.01482 83.32% 16.68%
1997 44.2% 40.8% 15.0% 0.814 1.027 1.473 0.11671 0.09379 0.02292 80.36% 19.64%
2000 40.9% 40.7% 18.4% 0.785 0.993 1.493 0.11925 0.08967 0.02958 75.19% 24.81%
2004 48.3% 31.6% 20.1% 0.831 1.010 1.390 0.12631 0.1051 0.02121 83.21% 16.79%
2010 42.6% 35.5% 21.9% 0.808 0.987 1.393 0.13639 0.11291 0.02348 83.47% 16.53%
Source: LIS (1985-2004) and PSELL3/EU-SILC data (2010), authors’ computation. Individuals aged 15+

GINI Country Report Luxembourg
Page 118
Table A2 (continued): Theil index (Generalised entropy index (parameter = 1)) decomposition by subgroups
share relative mean income
1985 1991 1994 1997 2000 2004 2010 1985 1991 1994 1997 2000 2004 2010
single person 8.5% 8.2% 8.7% 10.9% 11.3% 11.7%
0.986 1.014 0.994 1.055 1.070 1.054
couple 19.0% 16.2% 17.3% 18.2% 20.7% 19.5%
1.111 1.052 1.126 1.107 1.142 1.136
couple with children 56.3% 59.5% 58.4% 55.0% 54.3% 56.2%
0.961 0.993 0.980 0.961 0.942 0.964
single parent 5.3% 5.3% 5.0% 6.2% 6.0% 5.0%
1.003 0.930 0.913 0.964 0.912 0.856
other 10.9% 10.9% 10.7% 9.7% 7.7% 7.6% 1.016 0.983 0.950 0.981 0.991 0.927
low educated migrant 12.1% 11.0% 11.2% 14.2% 16.1% 21.4% 19.6% 0.730 0.740 0.747 0.686 0.692 0.704 0.705
low educated native 36.3% 42.3% 38.8% 30.1% 24.9% 26.9% 23.0% 0.900 0.913 0.908 0.875 0.846 0.930 0.897
mid edu migrant 6.8% 5.0% 6.1% 9.5% 11.7% 10.1% 11.2% 0.993 1.030 0.934 0.933 0.892 0.933 0.842
mid edu native 38.2% 34.1% 34.9% 31.3% 28.9% 21.6% 24.3% 1.084 1.074 1.064 1.056 1.034 1.047 1.054
high edu migrant 1.5% 0.9% 1.0% 6.4% 10.5% 10.3% 11.6% 1.474 1.395 1.443 1.446 1.453 1.349 1.374
high edu native 5.2% 6.6% 8.0% 8.6% 7.9% 9.7% 10.3% 1.589 1.535 1.518 1.493 1.548 1.440 1.415
immigration status and education household composition
GE(1) within between within between GE(1) within between within between
1985 0.091 0.074 0.017 81.2% 18.8% 0.091 0.090 0.002 98.3% 1.7%
1991 0.096 0.081 0.015 84.0% 16.0% 0.096 0.095 0.000 99.6% 0.4%
1994 0.089 0.072 0.017 81.3% 18.7% 0.091 0.089 0.002 98.1% 1.9%
1997 0.117 0.091 0.026 78.0% 22.0% 0.115 0.114 0.002 98.6% 1.4%
2000 0.119 0.087 0.032 73.1% 26.9% 0.118 0.114 0.003 97.1% 2.9%
2004 0.126 0.101 0.026 79.8% 20.2% 0.129 0.126 0.003 97.7% 2.3%
2010 0.136 0.109 0.028 79.7% 20.3%
Source: LIS (1985-2004) and PSELL3/EU-SILC data (2010)

GINI Country Report Luxembourg
Page 119
Figure A.2. Education transition probabilities by gender and cohort
Source: PSELL-3/EU-SILC 2005, authors' computation

GINI Country Report Luxembourg
Page 120
Table A3: Transition Matrices by Gender (Whole sample), with highest educated parent
Son Primary Lower secondary Upper secondary Tertiary
Primary 40.07 9.85 34.47 15.62
Lower secondary 2.78 15.28 34.72 47.22
Upper secondary 5.16 8.93 44.44 41.47
Tertiary 1.76 5.29 19.90 73.05
Daugther Primary Lower secondary Upper secondary Tertiary
Primary 47.16 12.77 31.32 8.75
Lower secondary 12.00 20.00 35.20 32.80
Upper secondary 9.82 13.64 41.10 35.44
Tertiary 6.07 8.18 26.17 59.58
Source: PSELL-3/EU-SILC 2005, authors' computation
Table A4: Indicators of mobility by gender and cohort, with highest educated parent
Male Female
Immobility Index Upward/Downward Immobility Index Upward/Downward
1970-1980 1.72 3.97 1.55 4.24
1958-1969 1.80 4.00 1.76 2.56
1946-1957 1.83 4.66 1.60 1.33
1925-1945 1.32 4.11 1.59 0.61
Source: PSELL-3/EU-SILC 2005, authors' computation
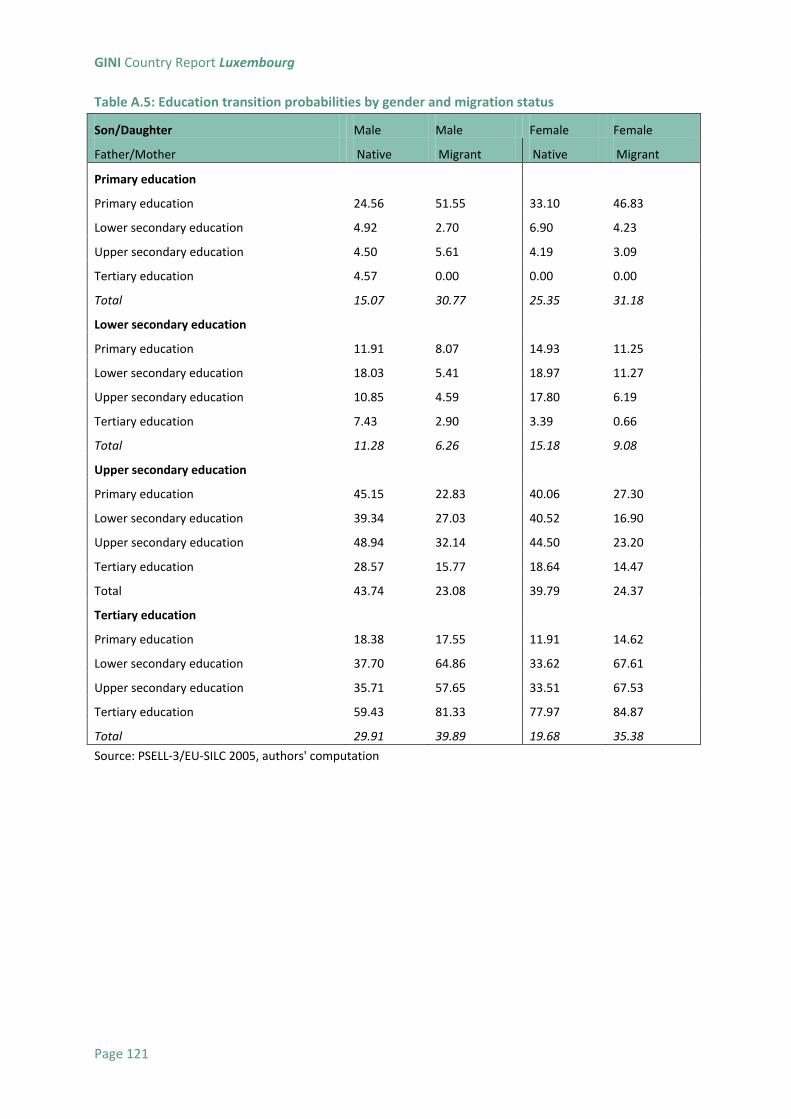
GINI Country Report Luxembourg
Page 121
Table A.5: Education transition probabilities by gender and migration status
Son/Daughter Male Male Female Female
Father/Mother Native Migrant Native Migrant
Primary education
Primary education 24.56 51.55 33.10 46.83
Lower secondary education 4.92 2.70 6.90 4.23
Upper secondary education 4.50 5.61 4.19 3.09
Tertiary education 4.57 0.00 0.00 0.00
Total 15.07 30.77 25.35 31.18
Lower secondary education
Primary education 11.91 8.07 14.93 11.25
Lower secondary education 18.03 5.41 18.97 11.27
Upper secondary education 10.85 4.59 17.80 6.19
Tertiary education 7.43 2.90 3.39 0.66
Total 11.28 6.26 15.18 9.08
Upper secondary education
Primary education 45.15 22.83 40.06 27.30
Lower secondary education 39.34 27.03 40.52 16.90
Upper secondary education 48.94 32.14 44.50 23.20
Tertiary education 28.57 15.77 18.64 14.47
Total 43.74 23.08 39.79 24.37
Tertiary education
Primary education 18.38 17.55 11.91 14.62
Lower secondary education 37.70 64.86 33.62 67.61
Upper secondary education 35.71 57.65 33.51 67.53
Tertiary education 59.43 81.33 77.97 84.87
Total 29.91 39.89 19.68 35.38
Source: PSELL-3/EU-SILC 2005, authors' computation
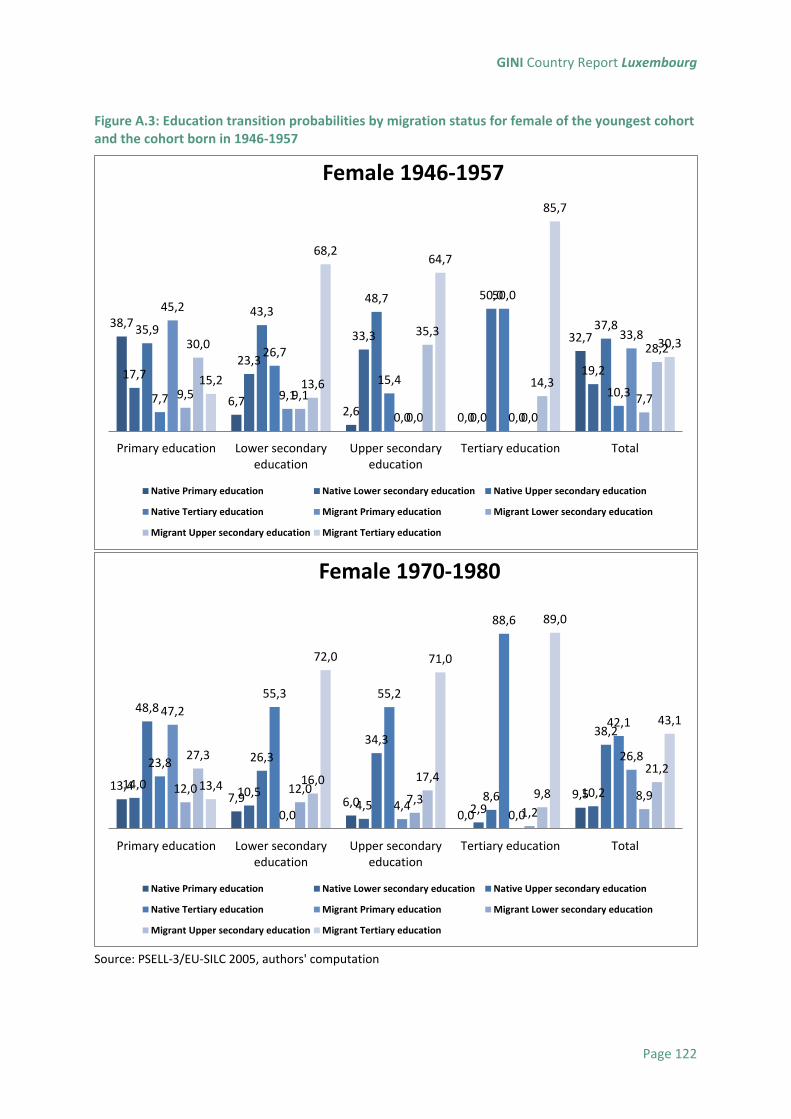
GINI Country Report Luxembourg
Page 122
Figure A.3: Education transition probabilities by migration status for female of the youngest cohort and the cohort born in 1946-1957
Source: PSELL-3/EU-SILC 2005, authors' computation
38,7
6,7 2,6 0,0
32,7
17,7 23,3
33,3
0,0
19,2
35,9
43,3 48,7 50,0
37,8
7,7
26,7
15,4
50,0
10,3
45,2
9,1
0,0 0,0
33,8
9,5 9,1
0,0 0,0
7,7
30,0
13,6
35,3
14,3
28,2
15,2
68,2 64,7
85,7
30,3
Primary education Lower secondaryeducation
Upper secondaryeducation
Tertiary education Total
Female 1946-1957
Native Primary education Native Lower secondary education Native Upper secondary education
Native Tertiary education Migrant Primary education Migrant Lower secondary education
Migrant Upper secondary education Migrant Tertiary education
13,4 7,9 6,0
0,0
9,5 14,0
10,5 4,5 2,9
10,2
48,8
26,3
34,3
8,6
38,2
23,8
55,3 55,2
88,6
42,1 47,2
0,0 4,4
0,0
26,8
12,0 12,0 7,3
1,2
8,9
27,3
16,0 17,4
9,8
21,2
13,4
72,0 71,0
89,0
43,1
Primary education Lower secondaryeducation
Upper secondaryeducation
Tertiary education Total
Female 1970-1980
Native Primary education Native Lower secondary education Native Upper secondary education
Native Tertiary education Migrant Primary education Migrant Lower secondary education
Migrant Upper secondary education Migrant Tertiary education

GINI Country Report Luxembourg
Page 123
Table A6: Indicators of mobility by gender and migration status, with highest educated parent
Male Female
Immobility Index Upward/Downward Immobility Index Upward/Downward
Native 1.57 3.03 1.56 1.50
Migrant 1.78 6.63 1.71 3.47
1970-1980 1.37 3.35 1.45 4.43
1958-1969 1.64 2.54 1.50 1.80
1946-1957 1.69 2.84 1.49 0.93
1925-1945 1.30 4.12 1.54 0.51
1970-1980 1.90 4.89 1.50 4.08
1958-1969 1.73 8.29 1.94 4.18
1946-1957 1.84 8.99 1.72 2.77
1925-1945 1.26 4.37 1.57 2.15
Source: PSELL-3/EU-SILC 2005, authors' computation

GINI Country Report Luxembourg
Page 124
Table A7: Transition Matrices by Gender (whole sample), with highest educated parent
Parents\Son
Manager/
Technicians
Clerks
Skilled agricultural/
Blue-collar
Elementary occupations
Professional craft workers
Manager/Professional 64.46 18.18 4.96 4.96 2.48 4.96
Technicians 52.94 25 12.5 2.94 2.94 3.68
Clerks 43.6 26 16.4 7.6 2.4 4
Skilled agricultural/craft workers 25 17.01
12.15 28.47 9.72 7.64
Blue-collar 18.42 21.05 18.95 23.68 10.53 7.37
Elementary occupations 19.99 18.57 12.71 27.81 13.37 7.55
Parents\Daugther
Manager/
Technicians
Clerks
Skilled agricultural/
Blue-collar
Elementary occupations
Professional craft workers
Manager/Professional 51.45 23.91 16.67 0.72 0.72 6.52
Technicians 45.19 28.89 17.78 1.48 0 6.67
Clerks 30.67 26.89 31.93 0.42 0.84 9.24
Skilled agricultural/craft workers 15.85 25
32.39 9.15 0.35 17.25
Blue-collar 11.98 16.12 45.04 3.31 1.65 21.9
Elementary occupations 11.45 15.05 33.89 6.79 2.12 30.7
Table A8: Indicators of mobility by gender and cohort, with highest educated parent
Male Female
Immobility Index Upward/Downward Immobility Index Upward/Downward
1970-1980 1.75 2.69 1.33 4.18
1958-1969 2.19 2.67 2.13 5.13
1946-1957 1.33 3.04 1.59 4.31
1925-1945 1.49 1.94 2.07 4.97
Source: PSELL-3/EU-SILC 2005, authors' computation

GINI Country Report Luxembourg
Page 125
Table A9: Indicators of mobility by gender and migration status, with highest educated parent
Male Female
Immobility Index
Upward/Downward
Immobility Index
Upward/Downward
Native 1.44 2.56 1.58 4.01
Migrant 2.21 2.5 2.05 4.25
Nat
ive
1970-1980 1.51 2.76 1.44 4.86
1958-1969 2.16 2.98 2.12 7.74
1946-1957 1.62 2.69 1.34 3.09
1925-1945 1.28 1.85 1.47 3.76
Mig
ran
t
1970-1980 2.01 2.32 1.32 3.8
1958-1969 2.23 2.3 2.2 4.63
1946-1957 1.28 3.72 1.74 5.36
1925-1945 1.56 2.21 2.3 6.94
Source: PSELL-3/EU-SILC 2005, authors' computation