aleknagik traditional council indoor air quality program national tribal forum on air quality at...
TRANSCRIPT

Aleknagik Traditional Aleknagik Traditional Council Indoor Air Council Indoor Air Quality ProgramQuality ProgramNational Tribal Forum on Air National Tribal Forum on Air
QualityQualityAtAt
Tulsa, Oklahoma Tulsa, Oklahoma May 22-24, 2012May 22-24, 2012

How we got startedHow we got started• Submitted the grant on February 18, 2011Submitted the grant on February 18, 2011• Tribal Air Quality Cooperative Agreement Tribal Air Quality Cooperative Agreement
under a sub-awards covered by Code of under a sub-awards covered by Code of Federal Domestic Assistance (CFDA) # Federal Domestic Assistance (CFDA) # 66.03866.038
• Which was funded thru the U. S Which was funded thru the U. S Environmental Protection Agency Region 10Environmental Protection Agency Region 10
• Administered by Alaska Native Tribal Administered by Alaska Native Tribal Health Consortium; Division of Health Consortium; Division of Environmental Health and Engineering (Environmental Health and Engineering (
DEHE)DEHE)• We were awarded the Cooperative We were awarded the Cooperative
Agreement on March 21, 2011Agreement on March 21, 2011
What the Project Consist What the Project Consist ofof
• To increase awareness of community To increase awareness of community residents and leaders of sources of air residents and leaders of sources of air pollution and health impacts.pollution and health impacts.
• Do quarterly newsletters to educate Do quarterly newsletters to educate tribal members tribal members
• Do an air assessment of source pollutionDo an air assessment of source pollution• Partner with ANTCH and BBAHCPartner with ANTCH and BBAHC• Assess individuals homes of source Assess individuals homes of source
pollutionpollution
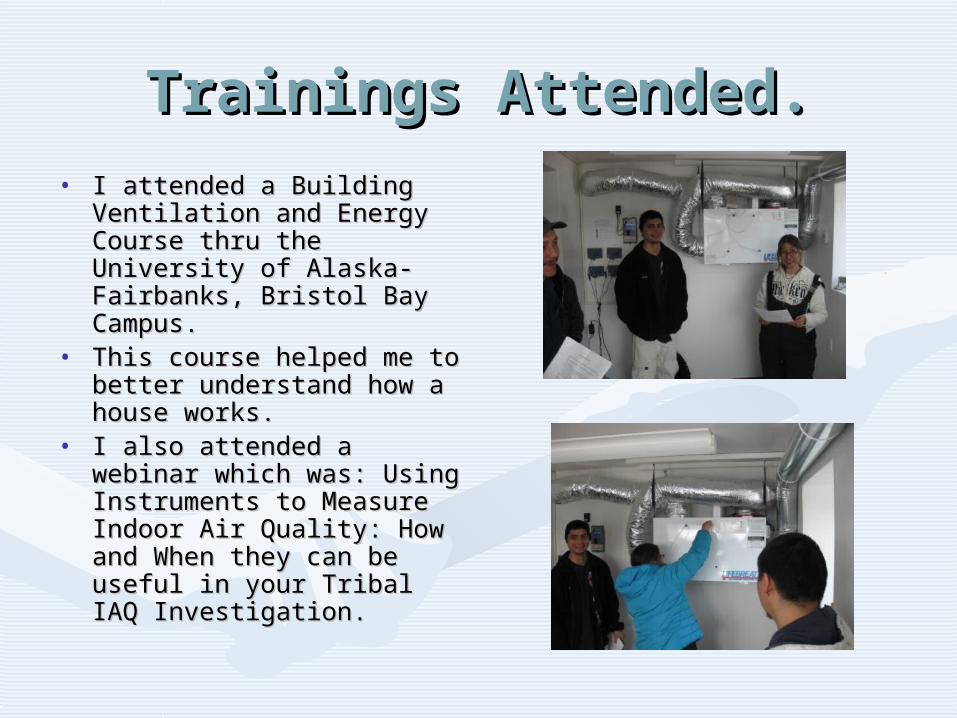
Trainings Attended.Trainings Attended.• I attended a Building I attended a Building
Ventilation and Energy Ventilation and Energy Course thru the University Course thru the University of Alaska-Fairbanks, of Alaska-Fairbanks, Bristol Bay Campus.Bristol Bay Campus.
• This course helped me to This course helped me to better understand how a better understand how a house works.house works.
• I also attended a webinar I also attended a webinar which was: Using which was: Using Instruments to Measure Instruments to Measure Indoor Air Quality: How Indoor Air Quality: How and When they can be and When they can be useful in your Tribal IAQ useful in your Tribal IAQ Investigation.Investigation.

Community MeetingCommunity Meeting• Held a community Held a community
meeting on May 28, meeting on May 28, 20112011
• I showed video’s on road I showed video’s on road dust, wood smoke, and dust, wood smoke, and Solid Waste. (AK tribal Solid Waste. (AK tribal air toolkit)air toolkit)
• I also did the fish tank I also did the fish tank experiment for air experiment for air conversion and used bar conversion and used bar straws to show how an straws to show how an asthmatic felt like when asthmatic felt like when having an asthma attack. having an asthma attack.
• We had 19 participates We had 19 participates at the meeting.at the meeting.

InstrumentsInstruments
• Q-Trak is an Q-Trak is an instrument that instrument that measures:measures:
• CO-Carbon CO-Carbon MonoxideMonoxide
• COCO² -Carbon Dioxide ² -Carbon Dioxide • Rh- Relative HumidityRh- Relative Humidity• Temp- TemperatureTemp- Temperature• Dust Trak is an instrument Dust Trak is an instrument
which measures which measures particulate matter 2.5particulate matter 2.5
Quality Assurance Quality Assurance Project PlanProject Plan
• Alaska Native Tribal Health Consortium-Alaska Native Tribal Health Consortium-Chris Fish worked on the Quality Chris Fish worked on the Quality Assurance Project Plan (QAPP)Assurance Project Plan (QAPP)
• Most EPA projects do need them such Most EPA projects do need them such as: as:
• Water Quality WorkWater Quality Work• Air Quality WorkAir Quality Work• This assures you are following Standard This assures you are following Standard
Operating Procedures.Operating Procedures.
Sampling Sampling
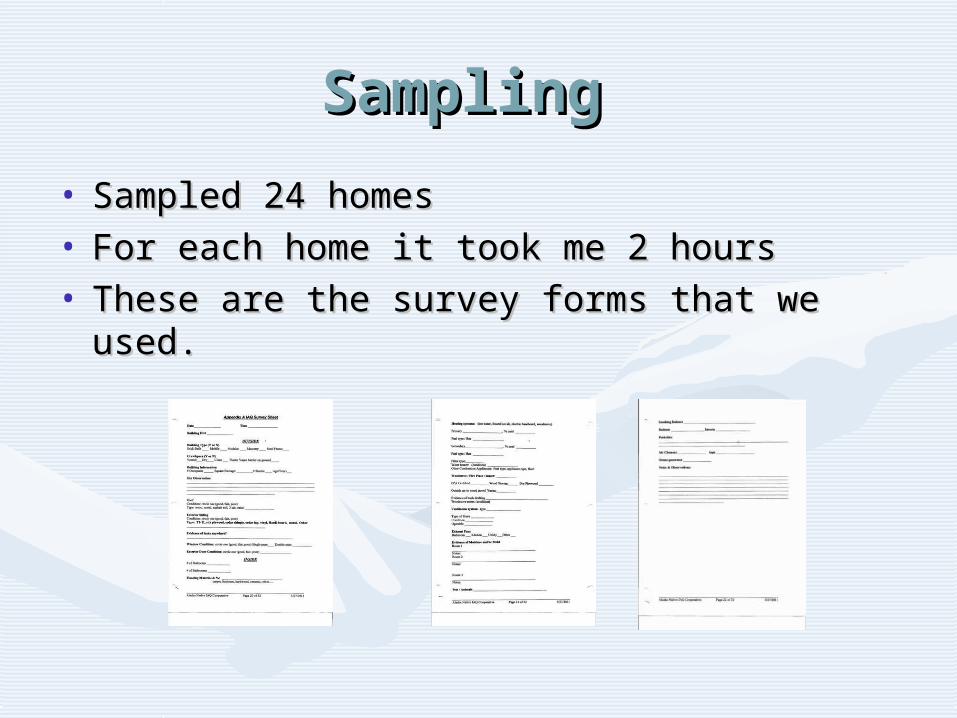
• Sampled 24 homesSampled 24 homes• For each home it took me 2 hoursFor each home it took me 2 hours• These are the survey forms that we used.These are the survey forms that we used.

SamplingSampling
• We log them on to We log them on to our Data Sheet.our Data Sheet.

SamplingSampling
• Entered them on Entered them on excelexcel
Site: Air Quality Specialist: Equipment ID: Equipment Calibration Certification Date:IGAP Office Tina Tinker/Chris Fish Dust Trak: 8554-05051004 3/16/2011
Q Trak: 8533111207 1/14/2011Time: CO-ppm CO2-ppm RH-% Temp-F
9:47 AM Min: 11.9 Min: 2196 Min: 59.1% Min: 18.6 CMax: 12.5 Max: 2332 Max: 76.4 Max: 21.8Avg: 12.2 Avg: 2285 Avg: 66.4 Avg: 20.5
Time: CO-ppm CO2-ppm RH-% Temp-F10:43 Dust Trak Min: 13.4 Min: 2150 Min:47.1 Min:23.711:40 Q Trak Max: 14.5 Max: 2332 Max: 52.3 Max: 24.1
Avg: 13.9 Avg: 2262 Avg: 48.4 Avg: 23.6
Time: CO-ppm CO2-ppm RH-% Temp-F12:50 Dust Trak Min: 13.5 Min: 1834 Min: 46.2 Min: 23.310:55 Q Trak Max: 16.7 Max: 3092 Max: 54.1 Max:24.1
Avg: 15.3 Avg: 2505 Avg: 47.0 Avg: 23.6

DataData
• Chris refined the data to look at all the averages of the Chris refined the data to look at all the averages of the homes that were sampled.homes that were sampled.
CO COCO CO² Rh Temp 2.5 pm² Rh Temp 2.5 pm
Living room/ Kitchen
7/12/2011 8:25 0 4
1.8
1483
1579
1537
63.5
67.3
64.4
67.6
68.3
68.2
0.019
0.132
0.028
Bedroom7/12/20
11 03.8
1.5
1639
1802
1704
64.3
65.5 65
67.5
68.3
67.7
0.024
0.059 0.03
This Was The Color Code This Was The Color Code We UsedWe Used
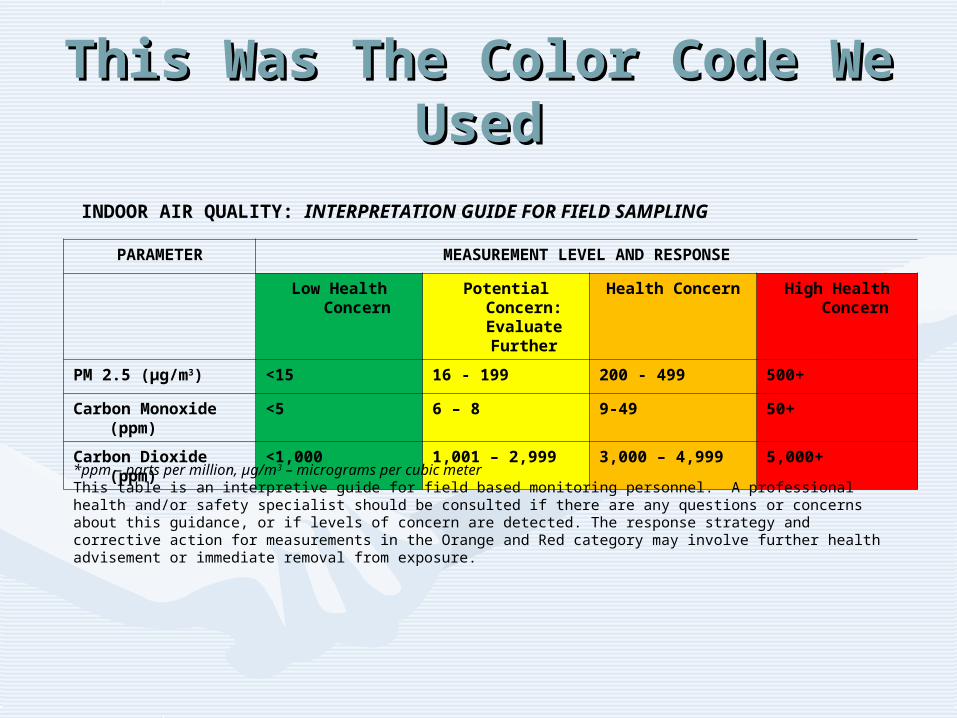
INDOOR AIR QUALITY: INTERPRETATION GUIDE FOR FIELD SAMPLING
PARAMETER MEASUREMENT LEVEL AND RESPONSE
Low Health Concern Potential Concern: Evaluate Further
Health Concern High Health Concern
PM 2.5 (µg/m3) <15 16 - 199 200 - 499 500+
Carbon Monoxide (ppm) <5 6 – 8 9-49 50+
Carbon Dioxide (ppm) <1,000 1,001 – 2,999 3,000 – 4,999 5,000+
*ppm – parts per million, µg/m3 – micrograms per cubic meterThis table is an interpretive guide for field based monitoring personnel. A professional health and/or safety specialist should be consulted if there are any questions or concerns about this guidance, or if levels of concern are detected. The response strategy and corrective action for measurements in the Orange and Red category may involve further health advisement or immediate removal from exposure.
Success StorySuccess Story
• When we first got the grant; I trained When we first got the grant; I trained using our office to collect air samples.using our office to collect air samples.
• We sampled 20 minutes and noticed We sampled 20 minutes and noticed that the Carbon Monoxide was reading that the Carbon Monoxide was reading very high.very high.
• We tested again for 24 hrsWe tested again for 24 hrs• Both Daniel and I were experiencing Both Daniel and I were experiencing
headaches and Nausea by the time we headaches and Nausea by the time we got off work; we worked 7.5 hrs a day. got off work; we worked 7.5 hrs a day.
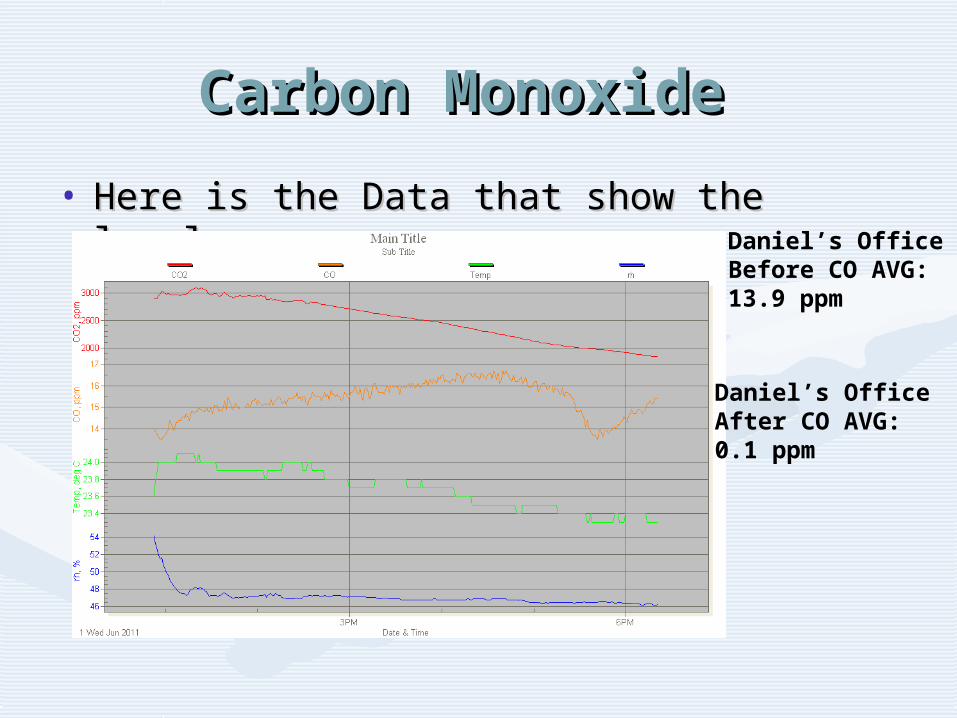
Carbon Monoxide Carbon Monoxide
• Here is the Data that show the levels.Here is the Data that show the levels.Daniel’s Office Before CO AVG:13.9 ppm
Daniel’s Office After CO AVG:0.1 ppm

OfficeOffice
• Well we let our Well we let our Council know about Council know about our office.our office.
• Since we received Since we received our office in 2001, we our office in 2001, we have had this monitor have had this monitor stove.stove.
• Our maintenance Our maintenance Department found Department found out that our seal on out that our seal on the pot belly was the pot belly was worn, and was worn, and was releasing CO.releasing CO.

Mold IssuesMold Issues• We had two homes that We had two homes that
had mold.had mold.• We did further We did further
investigations and investigations and educated them on their educated them on their HRV.HRV.
• Also, we tested the walls Also, we tested the walls to see how much to see how much moisture was in the moisture was in the walls using a moisture walls using a moisture meter.meter.
• Here are the results:Here are the results:• East wall: 14-15East wall: 14-15°, 19-22°°, 19-22°• Interior wall: 16-17°, 21-19°Interior wall: 16-17°, 21-19°

Problems EncounteredProblems Encountered
• When first using the Q-Trak, I didn’t When first using the Q-Trak, I didn’t follow the Standard Operating follow the Standard Operating Procedures-Had to re-do 8 homes. The Procedures-Had to re-do 8 homes. The re-do took 1 hour which I could have re-do took 1 hour which I could have been doing another home.been doing another home.
• When picking out how many homes When picking out how many homes should be assessed; try to pick a lower should be assessed; try to pick a lower number. I chose 50 homes of which I was number. I chose 50 homes of which I was only able to do 24 homes.only able to do 24 homes.
• Take lots of pictures; a picture can tell a Take lots of pictures; a picture can tell a story by itself.story by itself.

Conclusion Conclusion
Most of the homes that we tested had Most of the homes that we tested had a high COa high CO² which is Carbon Dioxide.² which is Carbon Dioxide.
This tell us that most homes need to exchange This tell us that most homes need to exchange their air by opening windows or turning their their air by opening windows or turning their HRV up to exchange air or install M-80’s to HRV up to exchange air or install M-80’s to help exchange air. (homes that were built in help exchange air. (homes that were built in the 1970 or earlier)the 1970 or earlier)

ConclusionConclusion
• Most homes for PM 2.5 were in the yellow Most homes for PM 2.5 were in the yellow zone.zone.
• This can be caused by smoke, burning fuels This can be caused by smoke, burning fuels and materials (carpet, dust mites, pet and materials (carpet, dust mites, pet dander, ect.)dander, ect.)
• It’s important to follow best practices for It’s important to follow best practices for operating wood stoves and heating operating wood stoves and heating appliances.appliances.
• Cooking, Indoor Smoking, and outside Cooking, Indoor Smoking, and outside conditions can contribute to PM 2.5 levels.conditions can contribute to PM 2.5 levels.

Special ThanksSpecial Thanks• I’d like to thank: I’d like to thank:
Chris Fish; Project OfficerChris Fish; Project OfficerAlaska Native Tribal Health ConsortiumAlaska Native Tribal Health Consortium
Division of Health and Engineering Division of Health and Engineering 1901 Bragaw Street, Suite 2001901 Bragaw Street, Suite 200
Anchorage, AK 99508Anchorage, AK 99508E-Mail: E-Mail: [email protected]@anthc.org
And And EPA-Mary ManousEPA-Mary Manous
Air Tribal Policy and Grants LeadAir Tribal Policy and Grants LeadOffice of Air and Toxics, AWT-107Office of Air and Toxics, AWT-107
1200 Sixth Ave, Suite 9001200 Sixth Ave, Suite 900Seattle, WA 98101Seattle, WA 98101
E-Mail: E-Mail: [email protected]@epa.gov
ThanksThanks
Tina L. Carr-TinkerTina L. Carr-Tinker
P.O. Box 115P.O. Box 115
Aleknagik, AK 99555Aleknagik, AK 99555
Phone: (907) 842-4407 Fax: (907) 842-Phone: (907) 842-4407 Fax: (907) 842-45344534
E-Mail: [email protected]: [email protected]