alden - new hampshire · winnicut dam removal feasibility study hydraulic fish passage and...
TRANSCRIPT

WINNICUT DAM REMOVAL
FEASIBILITY STUDY
HYDRAULIC
FISH PASSAGE
AND ALTERNATIVES ANALYSIS
By
John E. Richardson, Ph.D., P.E.
Prepared for
WOODLOT ALTERNATIVES, INC.
Topsham, Maine
ALDEN Solving Flow Problems Since 1894 41-03/N1082F February 2004
WINNICUT DAM REMOVAL
FEASIBILITY STUDY
HYDRAULIC
FISH PASSAGE
AND ALTERNATIVES ANALYSIS
By
John E. Richardson, Ph.D., P.E.
Prepared for
WOODLOT ALTERNATIVES, INC.
Topsham, Maine
February 2004
ALDEN RESEARCH LABORATORY, INC.
30 Shrewsbury Street
Holden, MA 01520

TABLE OF CONTENTS
PAGE
1. Introduction 1
2. Methodology 3
3. Hydraulic Analysis 4
3.1 Preliminary Calculations 4
3.1.1 Present Day Condition (40 cfs) 4
3.1.2 Dam Out Condition (40 cfs) 7
3.1.3 Natural Appearing Fishpass (40 cfs) 11
3.1.4 Summary of Results 14
3.2 Final Calculations 15
3.2.1 Dam Out Condition (10 cfs) 17
3.2.2 Dam Out Condition (40 cfs) 18
3.2.3 Summary of Results 19
3.3 Conclusions 20
4. Fish Passage 22
4.1 Swimming Speeds 22
4.1.1 American Eel 25
4.1.2 Rainbow Smelt 25
4.1.3 Blueback Herring and Alewife 26
4.1.4 Summary of Results 28
4.2 Conclusions 29
5. Alternatives Analysis 30
5.1 Replace Existing Fish Ladder 30
5.2 Remove Dam and Construct Nature-Like Fish Passage 35
5.3 Cost Estimates 39
6. Recommendations 44
7. References 45
i
1
1. Introduction On behalf of Woodlot Alternatives, Inc. a numerical analysis of flow under the Route 33 Bridge past the Winnicut Dam was carried out. The simulations were used to evaluate pre- and post-dam removal hydraulic conditions and to study the efficacy of constructing a technical fish passage beneath the existing Route 33 Bridge, or at the present location of the Winnicut Dam. A specialized three-dimensional, free-surface, numerical modeling program was used to calculate flow patterns in the river channel. As input, this computer program requires topographic data, a specified river flow rate, and a downstream water surface elevation. As output, this computer program provides estimates of three-dimensional velocities and water surface elevations throughout the modeled river region. The results of the computer simulations were compared to swimming speeds required for the upstream migration of target fish species and different options for fish passage were evaluated.
Three different, preliminary simulations were performed in September 2003. In each of these simulations the flow rate under the Route 33 Bridge was set equal to 40 cfs. This is a typical flow rate associated with the spring migration period for River Herring and Rainbow Smelt (two of the target fish species at this site, see Figure 1). Two different, final simulations were performed in November 2003. In the first simulation, the flow rate under the Route 33 Bridge was set equal to 10 cfs. This flow rate corresponds to one observed in the river on 17 October 2003 at which time the elevation of water behind the Winnicut Dam had been drawn down. At this time measurements of velocity and water surface elevation in the river were made. This information was used to calibrate the 10 cfs simulation. In the second simulation, the flow rate under the Route 33 Bridge was increased to 40 cfs (i.e., a typical flow rate associated with the spring migration period). All parameter values determined by the model calibration (i.e., the 10 cfs simulation) were applied to the final 40 cfs simulation. The methodology used in this study is presented in Section 2. Results of the hydraulic analyses are presented in Section 3, an assessment of swimming speeds required for successful upstream fish passage is provided in Section 4, and an analysis of dam removal alternatives is given in Section 5.

2
Figure 1: Flow-Duration Curves (Courtesy of Woodlot Alternatives, Inc.)

3
2. Methodology The procedure used to analyze flows, assess the likelihood of fish passage, and evaluate costs associated with the construction of a technical fish passage at the project location consisted of five steps. Step One: Field Data Collection Survey describing the shape of the river channel around the project was collected. These data were stored in a digital format and converted into a three-dimensional terrain model of the site. The digital terrain model was, in turn, used as input to the flow model (i.e., the digital terrain model provided the geometry for the analysis). Step Two: Hydrologic Study A review of hydrologic data was performed and flow duration curves (Figure 1) for the Winnicut were developed. River flow rates expected to occur during periods of migration were identified and corresponding water surface elevations were estimated. Boundary conditions for the numerical simulations were developed from these data. Step Three: Three-Dimensional Flow Modeling
Three-dimensional flow patterns in the river were calculated using a specialized three-dimensional, free surface, numerical modeling program. Steps one and two supplied required input to the computer analysis, and the results of the computer analysis provided estimates of velocities and flow depths everywhere within the computed region. Step Four: Biological Assessment of Fish Passage Calculated velocities and flow depths were compared to swimming requirements for target species and opportunities for fish passage were assessed. Step Five: Alternatives Analysis Conceptual designs of two alternatives, intended to improve fish passage at the Winnicut Dam location, were developed. Cost estimates for each were produced.
4
3. Analysis
3.1 Preliminary Calculations
Simulations of three different conditions were used to evaluate pre- and post-dam removal hydraulic conditions and the feasibility of constructing a technical fish passage at the present location of the dam. The river flow rate was equal to 40 cfs in all of the simulations. This is a typical flow rate expected to occur during the spring migration period.
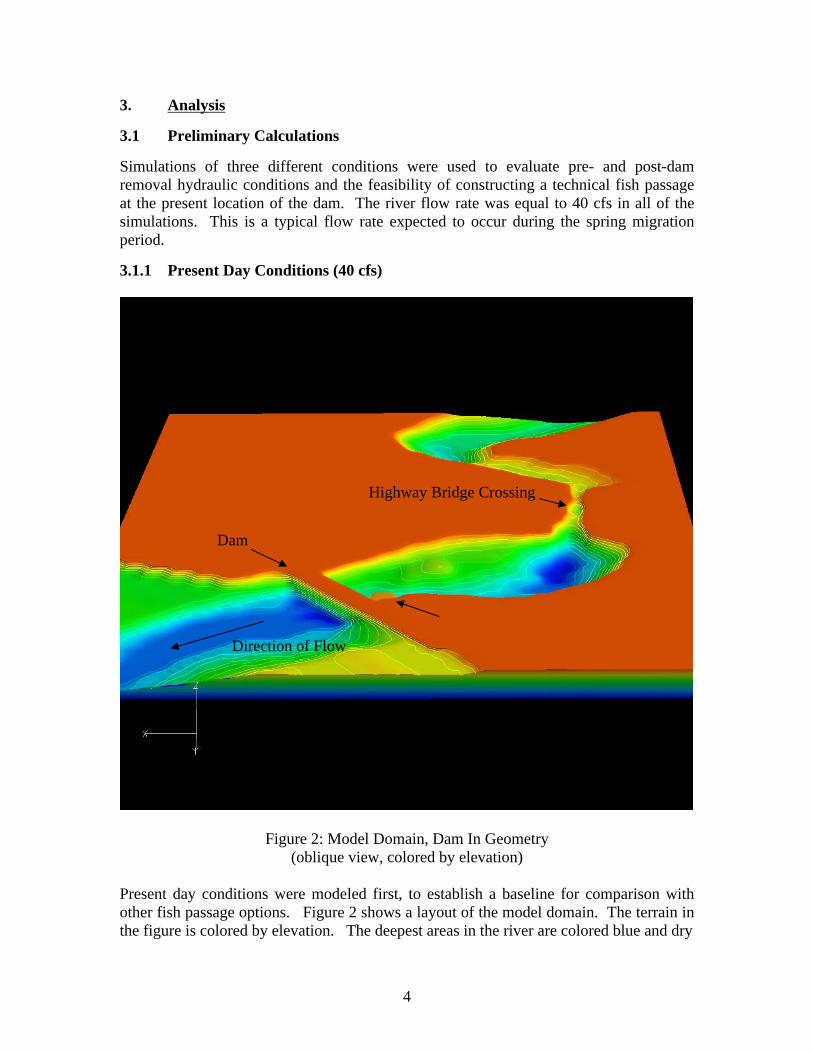
3.1.1 Present Day Conditions (40 cfs)
Figure 2: Model Domain, Dam In Geometry (oblique view, colored by elevation)
Present day conditions were modeled first, to establish a baseline for comparison with other fish passage options. Figure 2 shows a layout of the model domain. The terrain in the figure is colored by elevation. The deepest areas in the river are colored blue and dry
Highway Bridge Crossing
Dam
Direction of Flow

5
areas are red. Figure 3 shows the same data, only the viewpoint has been changed to provide a plan view of the model domain. The constriction in the river caused by the bridge crossing is plainly seen in Figure 3.
Figure 3: Model Domain, Dam In Geometry (plan view, colored by elevation)
Figure 4 shows computed velocity distributions in the river channel beneath the Route 33 Bridge. For 40 cfs, with the dam in place, typical channel velocities were calculated to be less than 2.0 ft/sec at most locations; however, and at one location maximum velocities were calculated to be 5.8 ft/sec. According to this analysis, upstream fish passage should be expected beneath the bridge with the dam in place. Although, some changes to shape of the channel are recommended to eliminate the area of high velocity.
Direction of Flow
Dam
Fish Pass
Direction of Flow
Highway Bridge Crossing

6
(a)
(b)
Figure 4: Calculated Flow Patterns
(a) Global Solution, (b) Local Solution – max. speed is 5.8 ft/s (colored by speed, engineering units, speeds greater than 2.0 ft/s are red)
Direction of Flow

7
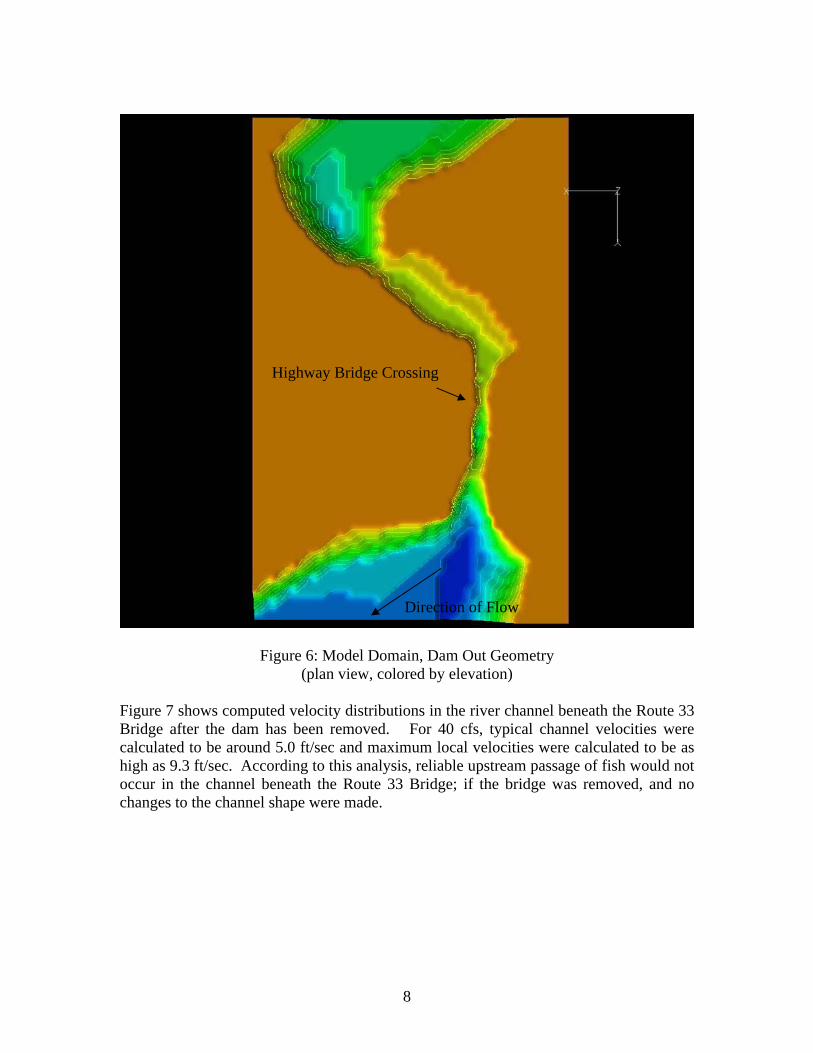
3.1.2 Dam Out Conditions (40 cfs)
Figure 5: Model Domain, Dam Out Geometry (oblique view, colored by elevation)
Hydraulic conditions associated with a dam-out condition were compared to the results of the present day simulation. Figure 5 shows a layout of the dam-out model domain. The terrain in the figure is colored by elevation. The deepest areas in the river are colored blue and dry areas are red. Figure 6 shows the same data, only the viewpoint has been changed to provide a plan view of the model domain. Similar to Figure 3, the constriction in the river caused by the bridge crossing is plainly seen in Figure 6.
Direction of Flow
Highway Bridge Crossing
8
Figure 6: Model Domain, Dam Out Geometry (plan view, colored by elevation)
Figure 7 shows computed velocity distributions in the river channel beneath the Route 33 Bridge after the dam has been removed. For 40 cfs, typical channel velocities were calculated to be around 5.0 ft/sec and maximum local velocities were calculated to be as high as 9.3 ft/sec. According to this analysis, reliable upstream passage of fish would not occur in the channel beneath the Route 33 Bridge; if the bridge was removed, and no changes to the channel shape were made.
Direction of Flow
Highway Bridge Crossing

9
(a)
(b)
(c)
Figure 7: Calculated Flow Patterns (a) Global Solution, (b) Local Solution – max. speed 9.3 ft/s (b) Local Solution – max. speed 5.7 ft/s (colored by speed)
Notes: (a) “Drop-outs” in graphics appear when the computed flows are quite shallow (i.e., when control volumes are less than half full). There is no loss in accuracy associated with the drop-outs and the results do not represent a discontinuous flow (the drop-outs are a feature of the graphics program only). (b) Different color scales were used in each of the frames to better illustrate the range of velocities calculated for this flow condition.
Frame (c)
Frame (b)
Direction of Flow
10
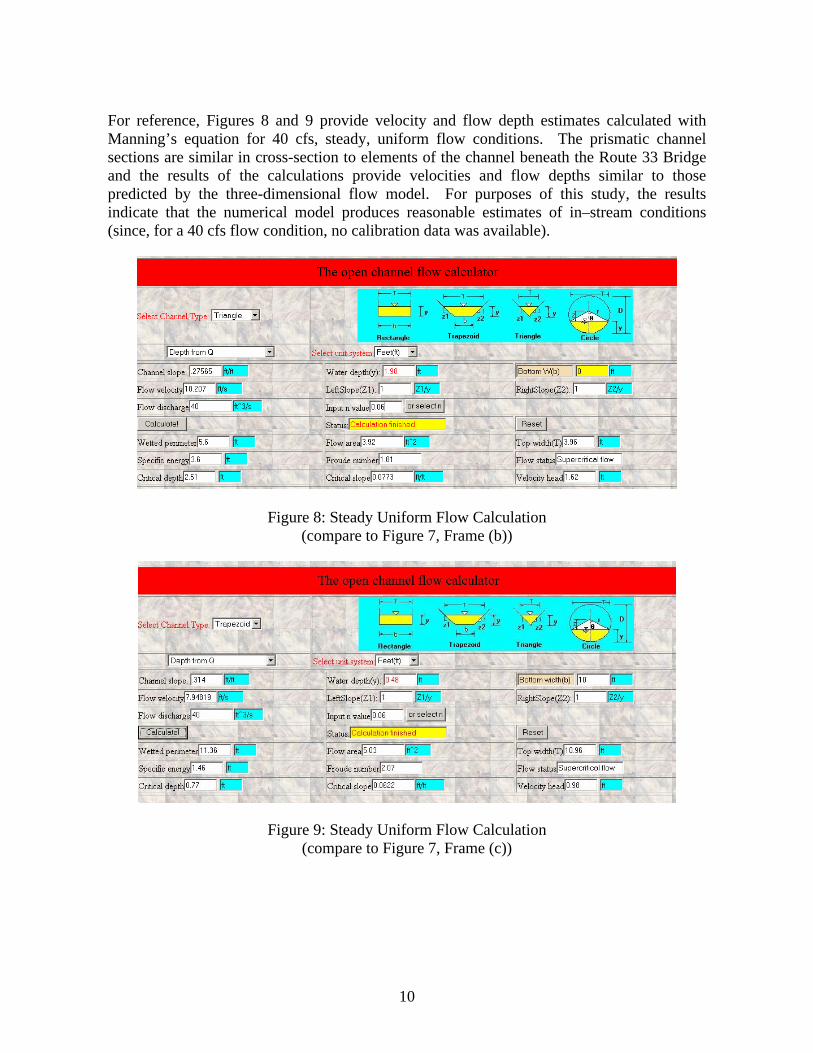
For reference, Figures 8 and 9 provide velocity and flow depth estimates calculated with Manning’s equation for 40 cfs, steady, uniform flow conditions. The prismatic channel sections are similar in cross-section to elements of the channel beneath the Route 33 Bridge and the results of the calculations provide velocities and flow depths similar to those predicted by the three-dimensional flow model. For purposes of this study, the results indicate that the numerical model produces reasonable estimates of in–stream conditions (since, for a 40 cfs flow condition, no calibration data was available).
Figure 8: Steady Uniform Flow Calculation (compare to Figure 7, Frame (b))
Figure 9: Steady Uniform Flow Calculation (compare to Figure 7, Frame (c))

11
3.1.3 Technical Fish Passage (40 cfs)
Figure 10: Model Domain, Fish Passage Geometry
(oblique view, colored by elevation)
Hydraulic conditions associated with replacement of the dam with a technical fish passage were calculated. Figure 10 shows a layout of the model domain. The terrain in the figure is colored by elevation. The deepest areas in the river are colored blue and dry areas are red. Figure 11 shows a close up of the technical fish passage.
Direction of Flow
Highway Bridge Crossing
Fill

12
Figure 11: Technical Fish Passage, Close-Up (colored by elevation)
Figure 12 shows computed velocity distributions in the river channel beneath the Route 33 Bridge and through the technical fish passage. For 40 cfs, typical channel velocities are calculated to be around 6.0 ft/sec and maximum local velocities were calculated to be as high as 9.4 ft/sec. According to this analysis, reliable upstream passage of fish would not possible if this design approach were pursued (in this proposed configuration). However, additional fill could be used to enlarge the technical fish passage; to effectively raise its crest elevation and moderate its slope. These changes would reduce velocities in the channel beneath the Route 33 Bridge and in the technical fish passage. The primary drawback of this design approach is the amount of fill that would be required to construct a technical fish passage at this location.
Direction of Flow
Technical Fish Passage

13
(a)
(b)
Figure 12: Calculated Flow Patterns
(a) Global Solution, (b) Technical Fish Passage – max. speed 9.4 ft/s
Notes: (a) “Drop-outs” in graphics appear when the computed flows are quite shallow (i.e., when control volumes are less than half full). There is no loss in accuracy associated with the drop-outs and the results do not represent a discontinuous flow (the drop-outs are a feature of the graphics program only). (b) Different color scales were used in each of the frames to better illustrate the range of velocities calculated for this flow condition.
Frame (b)
Direction of Flow

14
For reference, Figure 13 provides velocity and flow depth estimates calculated with Manning’s equation for 40 cfs, steady, uniform flow conditions. The prismatic channel section is similar in cross-section to the face of the technical fish passage and the results provide velocities and flow depths similar to those predicted by the three-dimensional flow model. For purposes of this study, the results indicate that the numerical model produces reasonable estimates of in–stream conditions (since no calibration data was available for this channel configuration).
Figure 13: Steady Uniform Flow Calculation (compare to Figure 12, Frame (b))
3.1.4 Summary of Results
Flow approaching the Winnicut Dam was calculated with 40 cfs for present day conditions. Results of this analysis predict a localized area of high velocity (5.8 ft/s) in the stream beneath the existing roadway bridge. Calculated velocities in the pool upstream of the Dam are low (less than 1 ft/s). In a second calculation, the Winnicut Dam was removed from the stream. Results of this analysis predict an increase in local velocities beneath the existing roadway bridge (maximum flow speeds equal to 9.3 ft/s) and suggest that a cascading flow might develop in the location where stream passes out from under the roadway bridge. In a third calculation, a technical fish passage replaced the Winnicut Dam. The passage is a conceptual design intended to bring fish upstream to an elevation similar to that of the river channel invert beneath the bridge. The proposed technical fish passage also provides a resting pool for migrating fish and protects the bridge abutments from scour. Where applicable, calculated results using Manning’s equation have been provided for comparison to the simulation results (Figures 8, 9, and 13). Even though the computed flow fields are gradually varied and not uniform; the comparison between results is close.
15
This implies that roughnesses in the simulations are similar to those assumed to affect the hydraulics of the channel. As a result of these simulations the following comments can be made:
1) removing the dam by itself may produce a greater impediment to fish passage, 2) a technical fish passage could be designed to reduce the likelihood of scour at the
bridge crossing and to improve upstream fish migration [note: this approach requires a considerable amount of fill and construction activities at the present day dam location], and
3) improvements to the stream channel beneath the bridge could be made to improve
its ability to provide fish passage (note: a solution that relies on such improvements could be affected by future bridge maintenance activities).
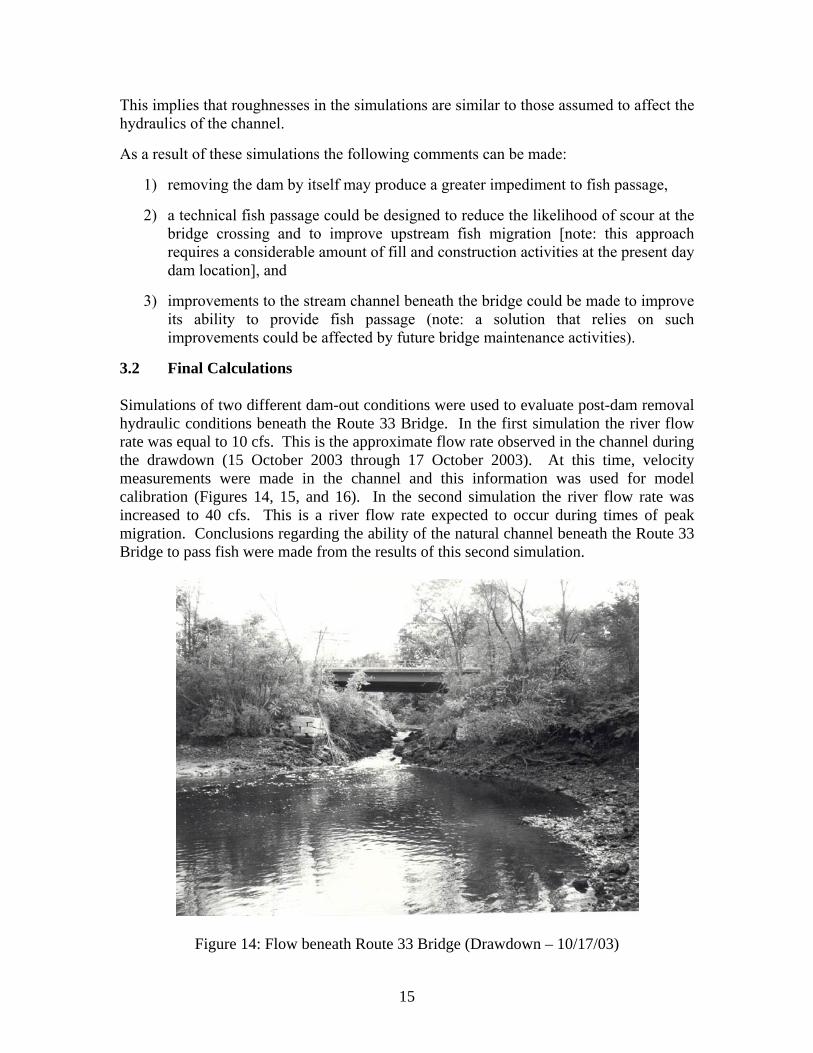
3.2 Final Calculations Simulations of two different dam-out conditions were used to evaluate post-dam removal hydraulic conditions beneath the Route 33 Bridge. In the first simulation the river flow rate was equal to 10 cfs. This is the approximate flow rate observed in the channel during the drawdown (15 October 2003 through 17 October 2003). At this time, velocity measurements were made in the channel and this information was used for model calibration (Figures 14, 15, and 16). In the second simulation the river flow rate was increased to 40 cfs. This is a river flow rate expected to occur during times of peak migration. Conclusions regarding the ability of the natural channel beneath the Route 33 Bridge to pass fish were made from the results of this second simulation.
Figure 14: Flow beneath Route 33 Bridge (Drawdown – 10/17/03)
16
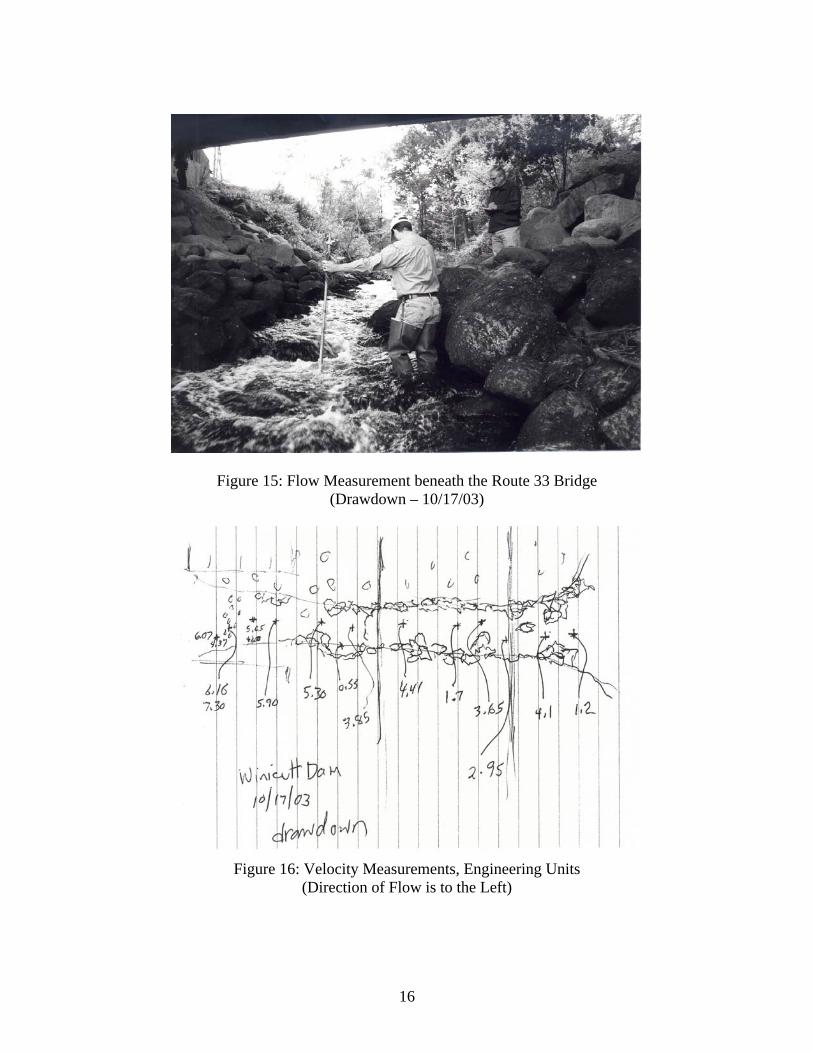
Figure 15: Flow Measurement beneath the Route 33 Bridge (Drawdown – 10/17/03)
Figure 16: Velocity Measurements, Engineering Units
(Direction of Flow is to the Left)

17
3.2.1 Dam Out Conditions (10 cfs)
Figure 17: Calculated Flow beneath the Route 33 Bridge (10 cfs)
Simulations of flow beneath the Route 33 Bridge were carried out for a 10 cfs condition (Figure 17) and the results were compared to velocity measurements made during the Winnicut Dam drawdown (Figure 16). In general, the comparison is close. However, some localized areas of high velocity (e.g., 12 ft/sec) that are predicted by the numerical model do not appear in the field measurements. These discrepancies arise from the fact that the geometry of the numerical model is slightly different than the geometry of the natural channel and the fact that the velocity measurements were not necessarily made in the locations of highest velocity (i.e., the discretization of the field sampling program was different from the discretization of the numerical model). Nevertheless, the results of both studies indicate a gradual increase in velocities as the water moves down the channel leading to the development of entrance conditions that could be difficult for fish to negotiate when moving upstream (i.e., fast & shallow flow, see Figure 18).
18
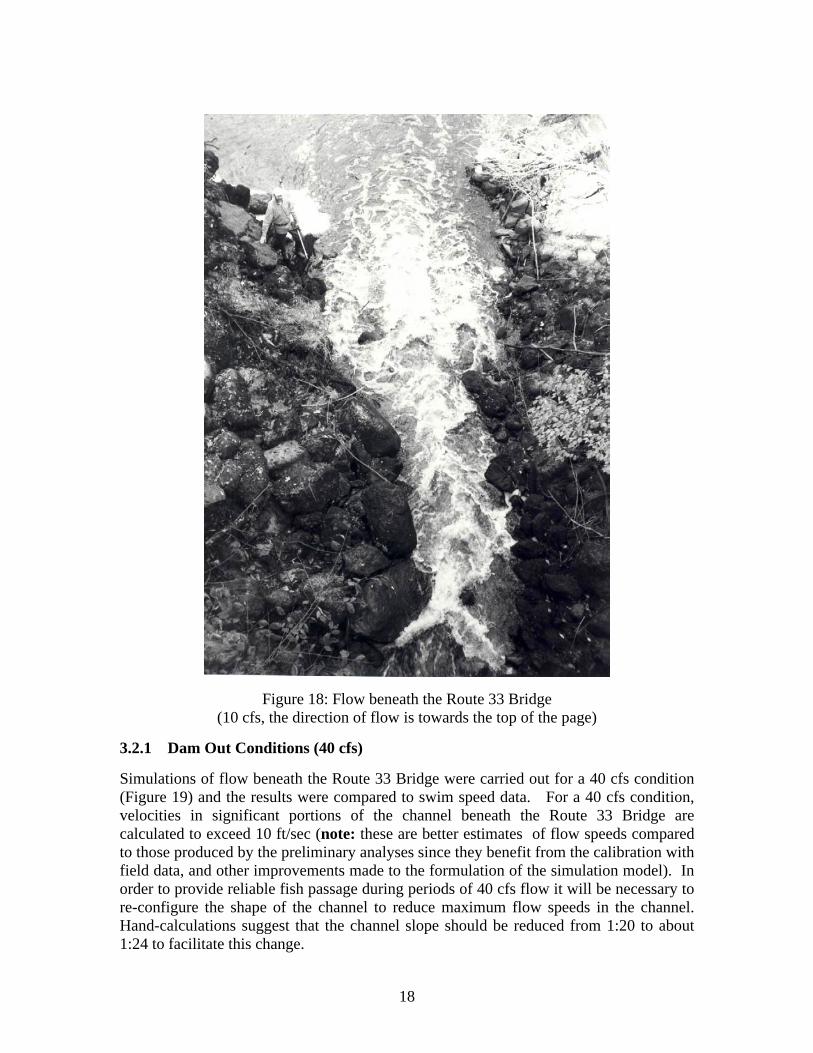
Figure 18: Flow beneath the Route 33 Bridge (10 cfs, the direction of flow is towards the top of the page)
3.2.1 Dam Out Conditions (40 cfs)
Simulations of flow beneath the Route 33 Bridge were carried out for a 40 cfs condition (Figure 19) and the results were compared to swim speed data. For a 40 cfs condition, velocities in significant portions of the channel beneath the Route 33 Bridge are calculated to exceed 10 ft/sec (note: these are better estimates of flow speeds compared to those produced by the preliminary analyses since they benefit from the calibration with field data, and other improvements made to the formulation of the simulation model). In order to provide reliable fish passage during periods of 40 cfs flow it will be necessary to re-configure the shape of the channel to reduce maximum flow speeds in the channel. Hand-calculations suggest that the channel slope should be reduced from 1:20 to about 1:24 to facilitate this change.

19
Figure 19: Calculated Flow Beneath the Route 33 Bridge (40 cfs)
3.2.2 Summary of Results Flow in the channel beneath the Route 33 Bridge was calculated for a 10 cfs condition. Results of this analysis agree with field data collected during the drawdown (10/17/03) and suggest that areas of high flow speed would develop in the channel if the dam were removed. Fish passage through these areas of high velocity may not be possible and some changes to the channel design will be required in the event that the Winnicut Dam is removed and the channel beneath the bridge is used for fish passage. In a second calculation, flows were increased to 40 cfs (a typical flow rate occurring during times of migration) and flow speeds in excess of 10 ft/sec were predicted throughout the channel. If the Winnicut Dam is to be removed, and if the channel beneath the Route 33 Bridge is to provide fish passage, then some reconfiguration of the channel will be required to control flow speeds in the channel.

20
3.3 Conclusions
Two impediments to fish passage exist near the Winnicut Dam. One of these impediments is the existing fish passage at the dam. Flow velocities, in the structure are, too great during periods of migration to permit reliable passage of target fish species (according to conversations with Woodlot Alternatives and others). The other impediment to fish passage results from the condition (i.e., shape and slope) of the river channel beneath the Route 33 Bridge. With the Winnicut Dam in place, fish passage beneath Route 33 Bridge is likely. If the Winnicut Dam were removed, then velocities in the river beneath the bridge would be too great to allow upstream migration of target species. To improve fish passage at the Winnicut Dam three options exist. First, the existing fish ladder at the dam could be improved. Second, the Winnicut Dam could be removed and a technical fish passage could be constructed in its place. Third, the Winnicut Dam could be removed, and modifications to the river channel beneath the Route 33 Bridge could be made to provide reliable fish passage. As a result of these hydraulic analyses, the following conclusions with respect to each fish passage alternative are made: Option 1: Improve Existing Fish Passage
• Flow velocities in the river channel beneath the Route 33 Bridge are limited by
the crest elevation of the Winnicut Dam. These analyses indicate that with the Winnicut Dam in place upstream fish passage beneath the Route 33 Bridge is likely (Figure 4).
• Improved Fish passage around the Winnicut Dam could be achieved if the
existing fish ladder were replaced with a properly designed structure. The replacement ladder could be a standard design (e.g., Alaskan Steeppass) or a technical fish passage.
Option 2: Replace Dam with a Technical Fish Passage
• Fish passage around the Winnicut Dam could be achieved by removing the
existing dam and replacing it with a technical fish passage. However, the construction of a technical fish passage at this location would require excessive amounts of fill and other changes made to the site according to this analysis.
Option 3: Remove Dam and Construct Passage Beneath Bridge
• Fish passage around the Winnicut Dam could be achieved by removal of the dam and modifications made to the shape of the natural channel beneath the Route 33 Bridge to limit peak flow velocities during periods of migration.

21
• If the Winnicut Dam is removed and no changes are made to the shape natural
channel beneath the Route 33, then velocities in the channel will be too high to provide reliable fish passage (assuming 40 cfs migration flows). To improve this situation, the effective slope of the channel beneath the bridge will have to be made more mild (e.g., the 1:20 slope of the existing natural channel could be reduced to a 1:24 slope to provide more reliable fish passage and ease some design constraints).
• If the Winnicut Dam is removed, then the Route 33 Bridge will loose the scour
protection that is provided by the dam. To mitigate concerns for scour, additional protection could be placed around the foundation of the bridge at the same time modifications are made to the channel beneath the bridge.
Based on results of the computer modeling, Options 1 and 3 appear to be the most likely candidates for improving fish passage at the Winnicut Dam location. Descriptions of the modifications and costs associated with these two alternatives are provided in Section 5.

22
4. Fish Passage To evaluate the efficacy of different fish passage alternatives, the swimming abilities of the different target species were identified. Presented in the sections that follow is a summary of swimming speed information for American Eel, Rainbow Smelt, Blueback Herring and Alewife. 4.1 Swimming Speeds Fish swimming can be classified into three categories: sustained, prolonged, and burst swimming (Beamish 1978). Examples are shown in Figure 20. Sustained swimming is that which can be maintained indefinitely (i.e. longer than 200 minutes); it is also referred to as cruising speed. Prolonged swimming is a moderate speed that can be maintained for a specific period of time (i.e. up to 200 minutes). Burst swimming is the fastest speed achievable and can only be maintained for short durations as it utilizes more anaerobic metabolism than the other swimming modes. Another measurement of fish swimming ability commonly reported in the literature is Ucrit, (critical swimming speed), which is a standardized calculation of the maximum swimming speed a fish can maintain for a predetermined period of time. As these times are typically between 10 and 200 minutes, Ucrit falls under the category of prolonged swimming speed.
Figure 20: Examples of sustained, prolonged, and burst swimming for three salmonid species shown in terms of time to fatigue. From Beamish (1980) as cited in EPRI (2000)
23
Although additional factors such as body length, water temperature, turbulence, and distance of ascent (endurance) can affect the ability of upstream migrants to pass a potential barrier, the maximum burst swimming speed would be the most relevant gauge of a given species’ ability to pass the barrier in question near the Winnicut Dam, assuming that sufficient intermediate resting areas exist. However, because burst swimming speed data were not available for all target species, other measurements of swimming speed are also provided (Table 1). Further, data other than burst swimming speed may be more relevant in the absence sufficient resting areas. Where swimming speed data for suitable surrogate species were available, they were included to supplement the information available for the target species themselves.

24
Table 1: Summary of Swimming Speeds for both Target and Surrogate Species
Species Common Name Life Stagea
Mean Lengthb
(mm)
Water Temp (°C)
Time (s)
Swimming Mode
Swimming Speed (cm/s)
Reference
Anguilla rostrata American eel Elver 56 (TL) 17-23 600 Sustained 15 Barbin and Krueger 1994
Anguilla rostrata American eel Elver 56 (TL) 17-23 600 Prolonged 25 Barbin and Krueger 1994
Anguilla rostrata American eel Elver 56 (TL) 17-23 Unknown Burst 40 Barbin and Krueger 1994
Anguilla australis Short-finned eel Glass eel 54 (TL) 20-22 1800 Sustained 29 Langdon and Collins 2000
Anguilla australis Short-finned eel Glass eel 54 (TL) 20-22 180 Prolonged 35 Langdon and Collins 2000
Anguilla australis Short-finned eel Glass eel 54 (TL) 20-22 3 Burst 79 Langdon and Collins 2000
Anguilla reinhardtii Long-finned eel Glass eel 51 (TL) 21-23 1800 Sustained 32 Langdon and Collins 2000
Anguilla reinhardtii Long-finned eel Glass eel 51 (TL) 21-23 120 Prolonged 42 Langdon and Collins 2000
Anguilla reinhardtii Long-finned eel Glass eel 51 (TL) 21-23 5 Burst 75 Langdon and Collins 2000
Hypomesus transpacificus Delta smelt Adult 35-74 12-21 600 Ucrit 27.6 Swanson et al. 1998
Osmerus mordax Rainbow smelt Adult 70-163 10 3600 Sustained 39-59 Griffiths 1979 in Katopodis and Gervais 1991
Alosa aestivalis Blueback herring Juvenile 85 10 Unknown Ucrit 22.7 Terpin et al. 1997 in EPRI 2000
Alosa aestivalis Blueback herring Juvenile 89 15 Unknown Ucrit 34.7 Terpin et al. 1997 in EPRI 2000
Alosa aestivalis Blueback herring Adult 205 15 Unknown Burst 250c Castro-Santos 2002
Alosa pseudoharengus Alewife Juvenile 136 20 Unknown Ucrit 63.6 Wyllie et al. 1976 in EPRI 2000
Alosa pseudoharengus Alewife Juvenile 137 29 Unknown Ucrit 35.7 King 1971b in EPRI 2000
Alosa pseudoharengus Alewife Juvenile 46-150 15 3600 Ucrit 42.6-53.5 Griffiths 1979 in Katopodis and Gervais 1991
Alosa pseudoharengus Alewife Adult 225 15 Unknown Burst 275c Castro-Santos 2002 aUnless specified in the literature, life stage was assumed based on fish length. bMean length is fork length unless otherwise noted (TL = Total Length)
cSwimming speed based on volitional ascent in an open flume and indicates the water velocity at which 50% of the fish are able to ascend at least five meters.
25
4.1.1 American Eel (Anguilla rostrata) The swimming ability of American eel elvers is probably less than that of the other species of concern at the head of the Winnicut Dam pool. Although yellow phase eels would have greater swimming abilities, freshwater colonization first takes place in the elver stage. Because the Winnicut Dam is located at or near the head of tide, the swimming ability of elvers would therefore be the limiting factor in predicting the effectiveness of eel passage at this site following dam removal. Barbin and Krueger (1994) found that the maximum speed attained (burst speed) by American eel elvers was 40 cm/s. Other anguillids (A. australis and A. reinhardtii) were found to have burst swimming abilities nearly twice as high as American eel elvers (Langdon and Collins 2000). However, in an experimental flume, American eel elvers used existing substrate to avoid areas of high velocity and proceeded upstream in the lower-velocity boundary layer created between the water column and the substrate (Barbin and Krueger 1994). At higher velocities, the size of the existing boundary layer decreased and was not as readily utilized. In a channel with sufficient roughness though, elvers may pass successfully although velocities in the water column may exceed their maximum swimming speed. In addition, because elvers have been documented passing barriers terrestrially and even climbing vertical surfaces, it is unlikely that this obstacle would be completely impassable. 4.1.2 Rainbow Smelt (Osmerus mordax)
Compared to the other target species, there is little available information regarding the swimming ability of rainbow smelt. Katopodis and Gervais (1991) cite the following regression equation from Griffiths (1979) to predict rainbow smelt swimming velocity (U) for fish of a given fork length (L) at 10°C:
U = 1.148 L0.504
This equation was derived from the performance of fish from a landlocked population of rainbow smelt with fork lengths of 70 to 163 mm. This relationship is also based on an endurance time of 60 minutes, which is more indicative of prolonged swimming than burst swimming ability. Using the above equation, the projected prolonged swimming speed for these fish ranges from 39 to 59 cm/s for the lengths reported.
Although no other studies of rainbow smelt swimming speed are known, Swanson et al. (1998) measured Ucrit for the delta smelt (Hypomesus transpacificus), a west coast species belonging to the same family as the rainbow smelt (Osmeridae). They observed mean Ucrit values of 27.6 cm/s (±5.1), irrespective of water temperature (12-21°C) or fish size (34-73 mm fork length). While rainbow and delta smelt are morphologically similar, delta smelt are a smaller and more delicate species. Further, whereas rainbow smelt spawn in lotic freshwater environments and exhibit some ability to negotiate riffles, delta smelt are a euryhaline species that remain in slow moving water throughout their life-history.
Given that sexually mature anadromous smelt in the Great Bay (into which the Winnicut River flows) range from 70 mm (1 yr-old) to 200 mm (4 yr-old) in mean fork length
26
(Buckley 1989), we would expect them to have burst swimming speeds superior to the prolonged swimming speeds of the smaller landlocked rainbow smelt and the Ucrit of delta smelt. However, given the lack of burst swimming data for rainbow smelt, it is difficult to predict the magnitude to which this would exceed the maximum prolonged swimming speed of 59 cm/s cited herein. To help make this prediction, Figure 20 shows the relationship between prolonged and burst swimming speeds for three other salmoniforme species, arctic char (Salvelinus alpinus), rainbow trout (Salmo gairdneri sic), and sockeye salmon (Onchrhynchus nerka) from Beamish (1980) as cited in EPRI (2000). Using this figure, we estimate that the maximum burst swimming speed (i.e. at a time-to-fatigue of six seconds) can be roughly 2.0 to 2.6 times greater than the maximum prolonged speed for 60 minutes [the amount of time used by Griffiths (1979)]. Assuming this relationship would hold true for rainbow smelt, we obtain burst swimming speed estimates ranging from 78 to 153 cm/s for the range of lengths reported by Grifiths (1979). 4.1.3 Blueback Herring (Alosa pseudoharengus) and Alewife (Alosa aestivalis) Of the four species of concern, adult blueback herring and alewife (collectively river herring) have the greatest swimming ability. Some of the swimming speed studies for these species were conducted with small individuals (< 150 mm fork length; see Table 1) that were assumed to be juveniles or sub-adults. Because the upstream migrants entering the Winnicut River are adults, and because larger fish exhibit higher swimming speeds, we would expect them to be stronger swimmers than suggested by some of the studies cited below. The maximum burst swimming speed reported was 34.7 cm/s for juvenile (89 mm) blueback herring (Terpin et al. 1997 in EPRI 2000) and 63.6 cm/s for juvenile (136 mm) alewife (Wyllie et al. 1976 in EPRI 2000).
Most of these studies were conducted in closed tunnels where fish were forced to swim against incrementally increasing water velocities for a specified time period (i.e., Ucrit). In contrast, a recent open flume study (Castro-Santos 2002) examined the volitional swimming ability of adult blueback herring and alewife (as well as other species) captured during their spawning migrations. By using actively migrating adults and quantifying the distance swum in a flume against different water velocities, this study offers more power in predicting if blueback herring and alewife would be able to negotiate a potential obstruction. In addition, information is provided on the percentage of a population that would be able to pass a given velocity barrier, thereby accounting for the individual variability in swimming performance that naturally occurs.
27
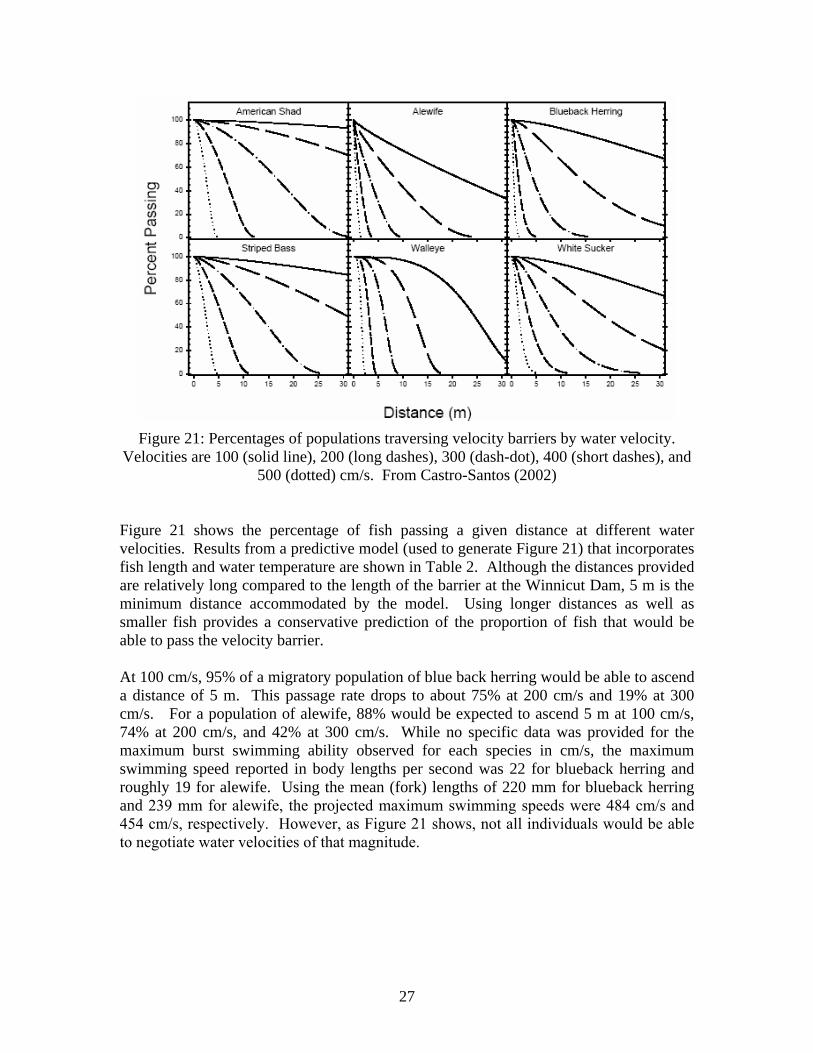
Figure 21: Percentages of populations traversing velocity barriers by water velocity. Velocities are 100 (solid line), 200 (long dashes), 300 (dash-dot), 400 (short dashes), and
500 (dotted) cm/s. From Castro-Santos (2002) Figure 21 shows the percentage of fish passing a given distance at different water velocities. Results from a predictive model (used to generate Figure 21) that incorporates fish length and water temperature are shown in Table 2. Although the distances provided are relatively long compared to the length of the barrier at the Winnicut Dam, 5 m is the minimum distance accommodated by the model. Using longer distances as well as smaller fish provides a conservative prediction of the proportion of fish that would be able to pass the velocity barrier. At 100 cm/s, 95% of a migratory population of blue back herring would be able to ascend a distance of 5 m. This passage rate drops to about 75% at 200 cm/s and 19% at 300 cm/s. For a population of alewife, 88% would be expected to ascend 5 m at 100 cm/s, 74% at 200 cm/s, and 42% at 300 cm/s. While no specific data was provided for the maximum burst swimming ability observed for each species in cm/s, the maximum swimming speed reported in body lengths per second was 22 for blueback herring and roughly 19 for alewife. Using the mean (fork) lengths of 220 mm for blueback herring and 239 mm for alewife, the projected maximum swimming speeds were 484 cm/s and 454 cm/s, respectively. However, as Figure 21 shows, not all individuals would be able to negotiate water velocities of that magnitude.

28
Table 2: Proportion of Blueback Herring and Alewife Ascending Distances of 5, 10, and 15 m at Various Water Velocities (predictions are based on the smallest fish relevant to
the model at a water temperature of 15°C, from Castro-Santos 2002)
Blueback Herring (FL=205) Distance Traversed (m)
Water Velocity (cm/s) 5 10 15
050 0.979 0.942 0.896
100 0.951 0.867 0.769
150 0.886 0.710 0.532
200 0.748 0.439 0.220
250 0.498 0.139 0.026
300 0.188 0.009 0.000
350 0.018 0.000 0.000
400 0.000 0.000 0.000
450 0.000 0.000 0.000
Alewife (FL=225) Distance Traversed (m)
Water Velocity (cm/s) 5 10 15
050 0.920 0.858 0.802
100 0.881 0.789 0.705
150 0.823 0.686 0.561
200 0.737 0.534 0.353
250 0.609 0.315 0.101
300 0.421 0.070 0.000
350 0.172 0.000 0.000
400 0.006 0.000 0.000
450 0.000 0.000 0.000
4.1.4 Summary of Results For each species of concern, the fact that existing water velocities at the site in question fall below some critical swimming speed would not necessarily indicate that the site is passable for 100 percent of the population. Because swimming abilities vary among individual fish and velocity barriers can have behavioral affects, it is likely that some fish would not be able to pass. To some extent these analytical limitations are resolved by the data provided for river herring. However, for other species only data for critical swimming speeds were available.

29
4.2 Conclusions
A review of the swimming speed information indicates that reliable upstream fish passage should be expected for all target species if velocities are limited to less than 3.0 ft/s (~1.0 m/s). The hydraulic analysis suggests that if the Winnicut Dam remains in place, then this criterion is already satisfied in the channel beneath the Route 33 Bridge (although, some minor channel modifications might be required). If the Winnicut Dam is removed, then modifications to the channel beneath the Route 33 Bridge will have to be made to limit velocities during periods of migration.
30
5. Alternatives Analysis
Two options improving fish passage at the Winnicut Dam were selected for further evaluation: 1) replacement of the existing fish ladder with an Alaska steeppass fishway and 2) complete removal of the dam and construction of a technical fish passage beneath the Route 33 Bridge. A description and cost estimates for the two alternatives follow.
5.1 Option #1 Replace Existing Fish Ladder with an Alaska Steeppass
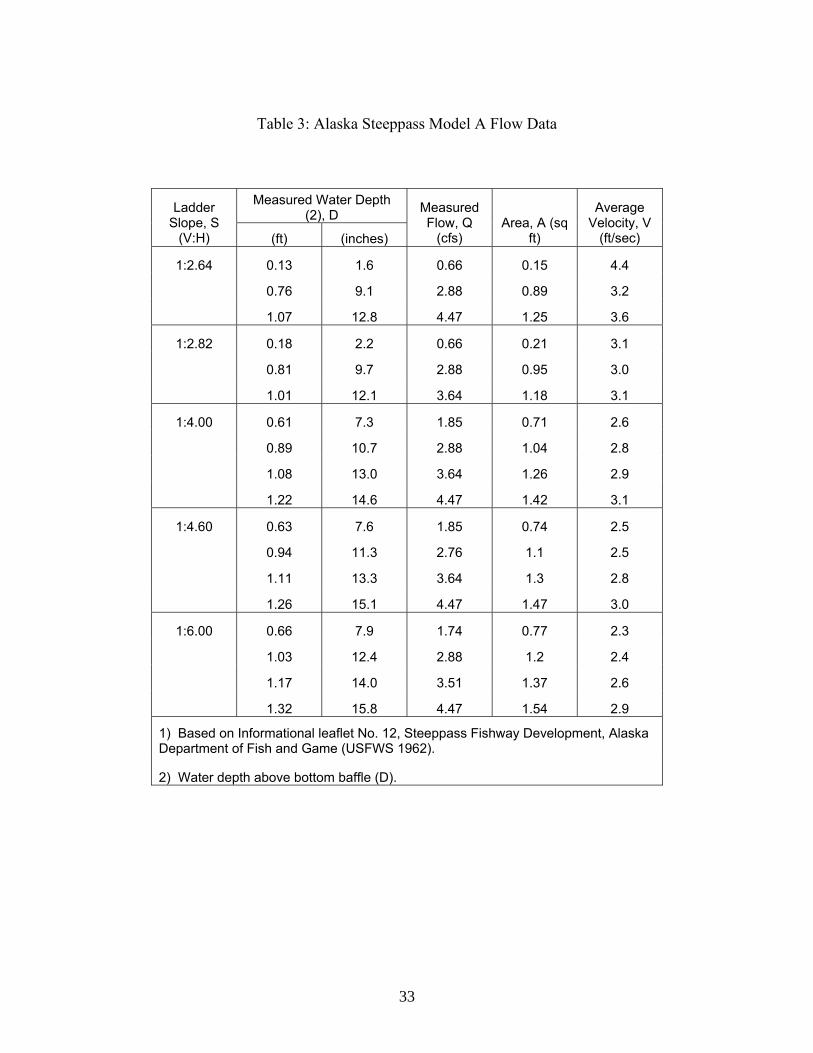
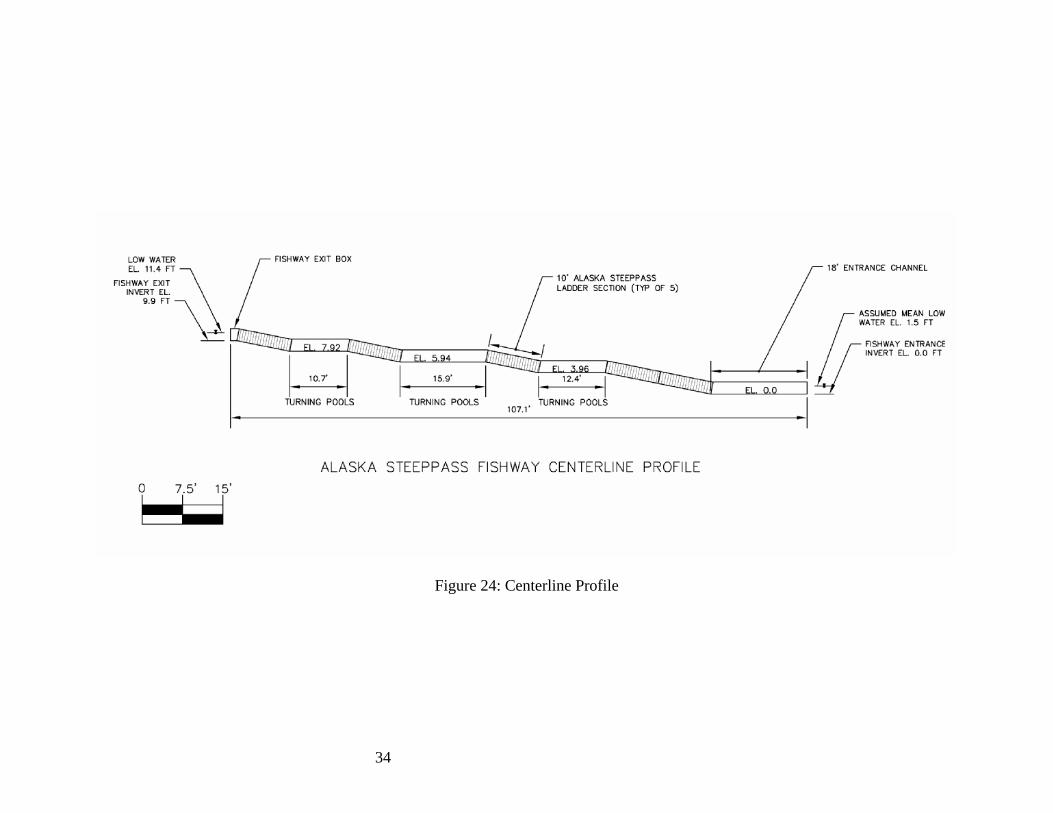
An inspection of the Winnicut Dam during the field survey did not indicate any structural deficiencies. However, the inspection and results of subsequent discussions with project stakeholders did identify a problem with the existing fish ladder. During times of peak migration, velocities in the existing fish ladder are too great to permit reliable passage of target species (according to discussions with Woodlot Alternatives and others). To correct this problem the existing fish ladder could be replaced with an Alaska steeppass fishway. The Alaska steeppass fishway would be placed in the position of the existing fish ladder. In fact, elements of the existing fish ladder would be used to support the new fishway. The steeppass fishway would have five, 10 ft long Alaska steeppass model A design sections as shown in Figure 22. A typical cross section of an Alaska steeppass model A design is shown on Figure 23. Flow characteristics of the model A design are presented in Table 3. The fishway entrance would be located about 12 ft downstream of the dam with an invert elevation of 0.0 ft (see Figure 24). The fish ladder sections would be supported by steel framing attached to the existing concrete fishway. Portions of the existing fishway would be dismantled to accommodate the geometry of the new fishway. The fishway exit would be located in the same location as the existing fishway with an invert elevation of 9.9 ft. The fishway would be designed for fish passage at water levels corresponding to expected river flows during the fish migration period. During low flow periods, the minimum water depth at the entrance would be about 1.5 ft. At a high river flow rate of 200 cfs, the entrance would have about 2.2 ft of water depth. Flows in the ladder would range from about 4 cfs at 10 cfs river flow, up to about 8 cfs at 200 cfs river flow.

31
Figure 22: Alaska Steeppass Configuration (Plan-view)

32
Figure 23: Steeppass Model A Cross-Section
33
Table 3: Alaska Steeppass Model A Flow Data
Measured Water Depth (2), D Ladder
Slope, S (V:H) (ft) (inches)
Measured Flow, Q
(cfs) Area, A (sq
ft)
Average Velocity, V
(ft/sec)
1:2.64 0.13 1.6 0.66 0.15 4.4
0.76 9.1 2.88 0.89 3.2
1.07 12.8 4.47 1.25 3.6
1:2.82 0.18 2.2 0.66 0.21 3.1
0.81 9.7 2.88 0.95 3.0
1.01 12.1 3.64 1.18 3.1
1:4.00 0.61 7.3 1.85 0.71 2.6
0.89 10.7 2.88 1.04 2.8
1.08 13.0 3.64 1.26 2.9
1.22 14.6 4.47 1.42 3.1
1:4.60 0.63 7.6 1.85 0.74 2.5
0.94 11.3 2.76 1.1 2.5
1.11 13.3 3.64 1.3 2.8
1.26 15.1 4.47 1.47 3.0
1:6.00 0.66 7.9 1.74 0.77 2.3
1.03 12.4 2.88 1.2 2.4
1.17 14.0 3.51 1.37 2.6
1.32 15.8 4.47 1.54 2.9
1) Based on Informational leaflet No. 12, Steeppass Fishway Development, Alaska Department of Fish and Game (USFWS 1962).
2) Water depth above bottom baffle (D).
34
Figure 24: Centerline Profile

35
The fishway configuration requires minimal modification to the dam structures. The configuration was selected to locate the fishway components such that the ladder installations would not affect the discharge capacity of the spillway. The steeppass fishway could be constructed in the “dry” using sandbag cofferdams. Hay bales and fabric filter barriers would be installed around the project construction limits. Filter barriers would be installed in the creek at the ladder entrance and exit channel inlet locations during construction. Internal elements of the existing fishway would be dismantled and steel columns would be anchored to the remnant fishway. The five fishway sections would then be installed. Installation of the fishway would be accomplished over a period of one month. Installing hay bales and silt fences around the project limits would take approximately one week. Installation of a small sandbag cofferdam, and support columns would take one week. Placing the concrete formwork for the fishway, installation of the fishway and demobilization would take another two weeks.
The steeppass ladder configuration is based on conventional design practice for fishways and should be effective in passing target fish species (e.g., River Herring and Rainbow Smelt). The entrance to the fishway is located as close to the spillway crest as possible (consistent with USFWS design requirements at other sites). At low creek flows, fish should not have any problem finding the ladder entrance because the entrance is located just downstream of the apron at the base of the dam. At high creek flows, fish will have to search to find the fishway entrance, but should find the entrance relatively quickly because of narrow width of the river.
Operation of the fishway will require periodic inspection of the ladder to monitor debris buildup. After storms with significant runoff, the ladder and exit pool should be inspected and debris removed, if necessary.
5.2 Option #2 Remove Dam and Construct Technical Fish Passage
Fish passage could be improved by removing the Winnicut Dam and constructing a technical fish passage beneath the Route 33 Bridge. Removing the dam would include excavating accumulated sediments behind the barrier, removing the concrete structures, and monitoring post dam removal conditions of the creek. The sediments behind the dam would be excavated and the concrete spillway, apron, and abutments removed to the natural creek bottom. If the composition of the natural river bottom is not intact below the footing of the dam, then armor stone or riprap will need to be installed to stabilize the river bed and banks. The computer analysis predicted water velocities less than 2.0 ft/sec at the dam location for a 40 cfs flow condition after removal of the dam. Therefore, the post dam removal conditions in the creek should allow fish passage most of the time. However, the flow

36
conditions and river channel stability should be monitored after dam removal to verify effective fish passage. During removal, access is possible from both sides of the dam. A temporary staging area could be constructed on the South side of the dam. Hay bales and a silt fence would be installed around the project construction limits. A silt barrier would be installed downstream of the site to contain disturbed sediments. Stop logs would be removed from the dam to drain the impoundment. An earthen cofferdam would be constructed upstream of the dam and siphons would be installed to divert all river flow around the dam. After the impoundment was drained, excavators would remove excess sediments. The dam would then be broken up with excavators and hydraulic hammers and removed. The cofferdam upstream would then be removed. Removal of the dam and accumulated sediments would take approximately 4 months. Development of the staging area on the South side of the dam would take approximately three weeks. Installation of siphons to drain the impoundment and construction of a cofferdam and siphons to the river around the impoundment and dam would take about six weeks. Excavation of sediments behind the dam would take about four weeks and removing the dam would take another three weeks. Standby construction services for minor river modifications after dam removal, demobilization and clean up would be an additional three weeks. The cost estimate for removal of the dam is based on the assumption that an average of 3 feet of sediment would be removed. The cost and construction time may be reduced if sediment behind the dam were allowed to pass downstream its dam removal. With the Winnicut Dam removed, upstream, fish passage would be facilitated by the construction of a technical fish passage beneath the Route 33 Bridge. The fish passage would operate on a 1:24 slope. The channel would be about 20 ft wide. Sixteen pools would be separated by large rocks and openings between the rocks would provide fish passage during periods of low flows (see Figures 25 and 26). The fish passage would be supported by a concrete structure and the rocks used to separate the pools would be tied into the support structure (to prevent their movement during periods of high flow). The fishway is designed to provide fish passage at water levels corresponding to expected river flows during the fish migration period. During low flow periods, minimum water depth at the entrance would be about 2.8 feet. At a high creek flow rate of 200 cfs, the entrance would have about 6.5 ft of water depth. Construction of the fishway would require a temporary access to provide access for construction equipment. Hay bales and fabric filter barriers would be installed around the project construction limits. Filter barriers would be installed in the creek at the ladder entrance and exit channel inlet locations. River flows would be diverted around the fishway through siphon pipes and temporary cofferdams would be placed around the construction area.

37
Figure 25: Technical Fish Passage (Plan-View)

38
Figure 26: Technical Fish Passage Construction Details
39
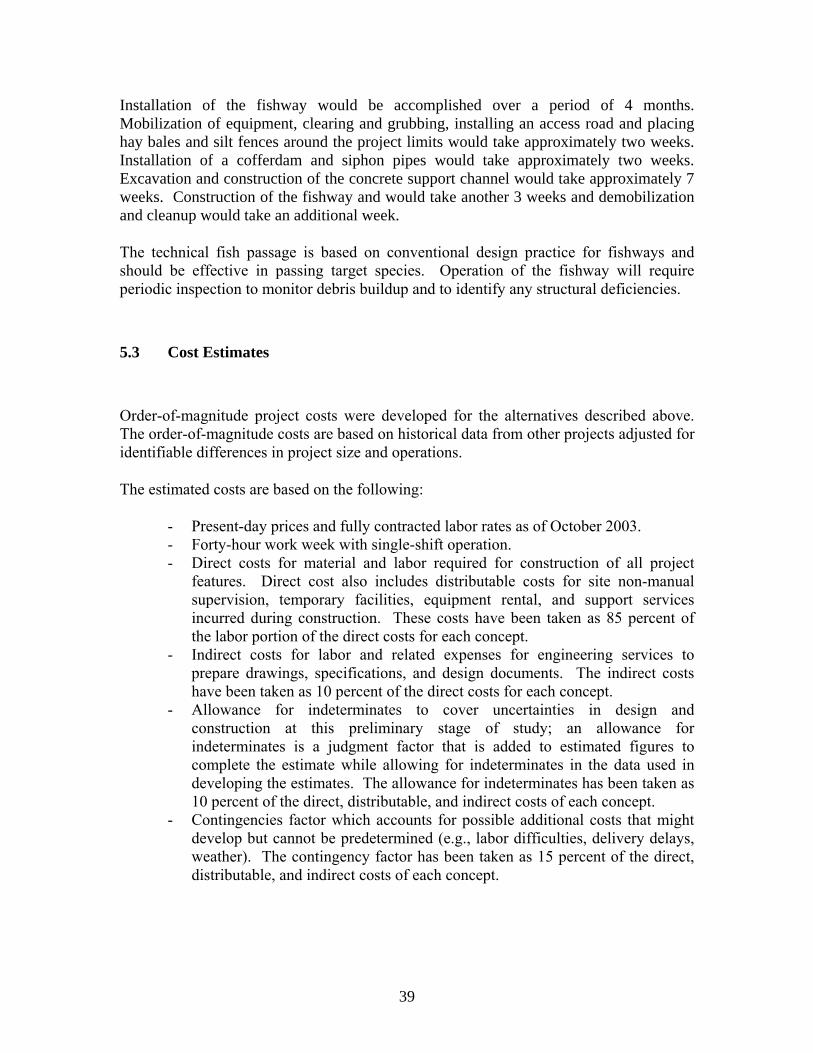
Installation of the fishway would be accomplished over a period of 4 months. Mobilization of equipment, clearing and grubbing, installing an access road and placing hay bales and silt fences around the project limits would take approximately two weeks. Installation of a cofferdam and siphon pipes would take approximately two weeks. Excavation and construction of the concrete support channel would take approximately 7 weeks. Construction of the fishway and would take another 3 weeks and demobilization and cleanup would take an additional week.
The technical fish passage is based on conventional design practice for fishways and should be effective in passing target species. Operation of the fishway will require periodic inspection to monitor debris buildup and to identify any structural deficiencies.
5.3 Cost Estimates
Order-of-magnitude project costs were developed for the alternatives described above. The order-of-magnitude costs are based on historical data from other projects adjusted for identifiable differences in project size and operations.
The estimated costs are based on the following:
- Present-day prices and fully contracted labor rates as of October 2003. - Forty-hour work week with single-shift operation. - Direct costs for material and labor required for construction of all project
features. Direct cost also includes distributable costs for site non-manual supervision, temporary facilities, equipment rental, and support services incurred during construction. These costs have been taken as 85 percent of the labor portion of the direct costs for each concept.
- Indirect costs for labor and related expenses for engineering services to prepare drawings, specifications, and design documents. The indirect costs have been taken as 10 percent of the direct costs for each concept.
- Allowance for indeterminates to cover uncertainties in design and construction at this preliminary stage of study; an allowance for indeterminates is a judgment factor that is added to estimated figures to complete the estimate while allowing for indeterminates in the data used in developing the estimates. The allowance for indeterminates has been taken as 10 percent of the direct, distributable, and indirect costs of each concept.
- Contingencies factor which accounts for possible additional costs that might develop but cannot be predetermined (e.g., labor difficulties, delivery delays, weather). The contingency factor has been taken as 15 percent of the direct, distributable, and indirect costs of each concept.

40
The project costs do not include the following items that should be included to obtain total capital cost estimates:
- Costs to provide power to the construction sites. - Escalation. - Permitting costs. - Costs to cover administration of project contracts and for engineering and
construction management.
The estimated projected costs and costs relative to operating and maintenance for the alternatives are presented in Tables 4 and 5 and a summary is presented in Table 6. Parameters considered in the operation and maintenance costs include routine inspections and annual maintenance.

41
Table 4: Replace Existing Fish Ladder with an Alaska Steeppass
(Option #1)
Cost x $1,000
Mobilization and Demobilization 8
Site Preparation 7
Install Fishway Supports 26
Modify Existing Fishway 14
Alaska Steeppass Fishway (5-10 ft sections) 14
Entrance, Turning, and Exit Pools (Aluminum) 10
18" Downstream Passage Pipe 6
Direct Costs 85
Indirect Costs 9
Total Construction and Indirect Costs 94
Allowance for Indeterminates/Contingencies 24
Total Estimated Project Costs 118
Operation and Maintenance Costs Cost x $1,000
Annual Labor, Inspect and Maintain Fishway 16
Total Average Annual Costs 16
42
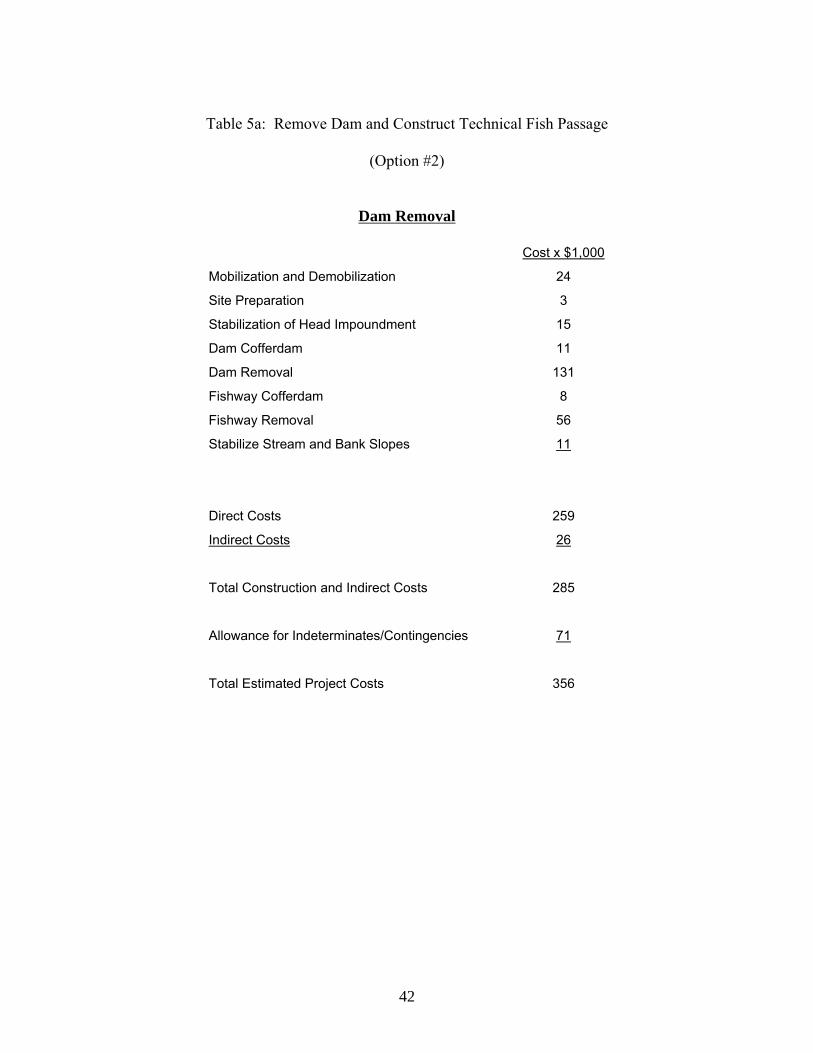
Table 5a: Remove Dam and Construct Technical Fish Passage
(Option #2)
Dam Removal
Cost x $1,000
Mobilization and Demobilization 24
Site Preparation 3
Stabilization of Head Impoundment 15
Dam Cofferdam 11
Dam Removal 131
Fishway Cofferdam 8
Fishway Removal 56
Stabilize Stream and Bank Slopes 11
Direct Costs 259
Indirect Costs 26
Total Construction and Indirect Costs 285
Allowance for Indeterminates/Contingencies 71
Total Estimated Project Costs 356

43
Table 5b: Remove Dam and Construct Technical Fish Passage
(Option #2)
Technical Fish Passage Construction
Cost x $1,000
Mobilization and Demobilization 51
Cofferdam 4
Divert River 196
Fishway 307
Direct Costs 558
Indirect Costs 56
Total Construction and Indirect Costs 614
Allowance for Indeterminates/Contingencies 154
Total Estimated Project Costs 768
Table 6: Summary of Costs for Fish Passage Alternatives
Fish Passage Alternatives Total Project Costs Annual Operation and
Maintenance Costs
Option #1 $119,000 $16,000
Option #2 $1,124,000 $6,000
44
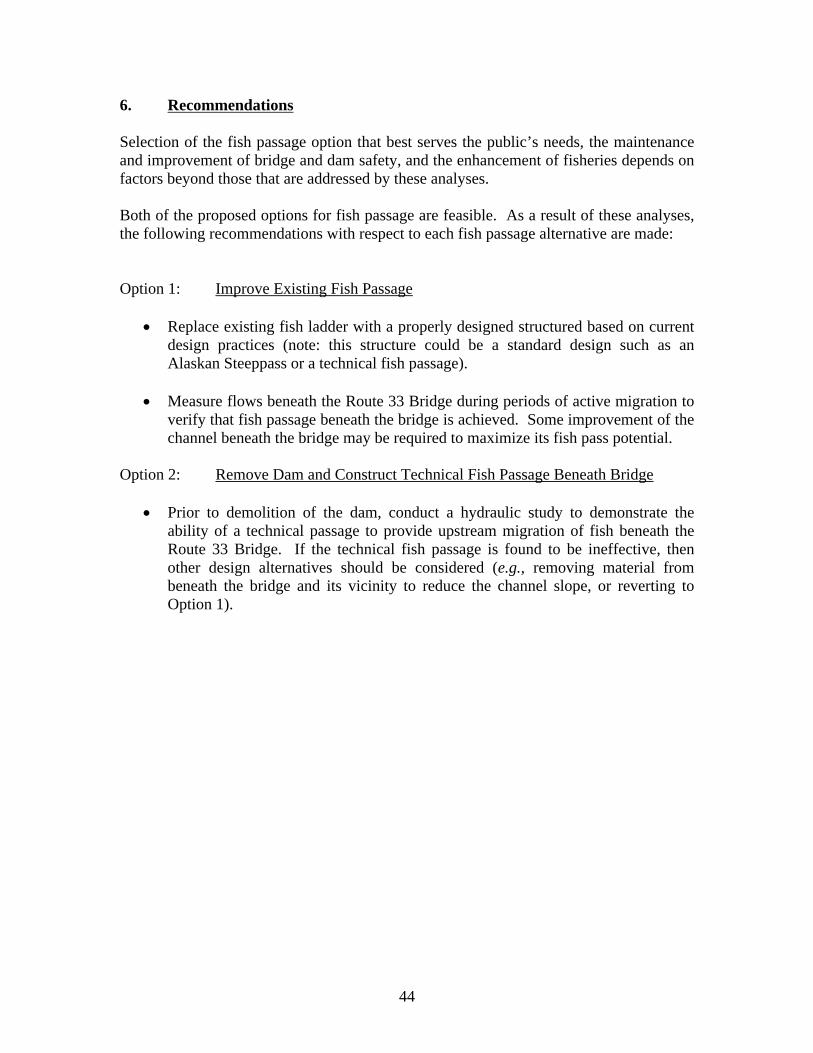
6. Recommendations
Selection of the fish passage option that best serves the public’s needs, the maintenance and improvement of bridge and dam safety, and the enhancement of fisheries depends on factors beyond those that are addressed by these analyses. Both of the proposed options for fish passage are feasible. As a result of these analyses, the following recommendations with respect to each fish passage alternative are made: Option 1: Improve Existing Fish Passage
• Replace existing fish ladder with a properly designed structured based on current
design practices (note: this structure could be a standard design such as an Alaskan Steeppass or a technical fish passage).
• Measure flows beneath the Route 33 Bridge during periods of active migration to
verify that fish passage beneath the bridge is achieved. Some improvement of the channel beneath the bridge may be required to maximize its fish pass potential.
Option 2: Remove Dam and Construct Technical Fish Passage Beneath Bridge
• Prior to demolition of the dam, conduct a hydraulic study to demonstrate the ability of a technical passage to provide upstream migration of fish beneath the Route 33 Bridge. If the technical fish passage is found to be ineffective, then other design alternatives should be considered (e.g., removing material from beneath the bridge and its vicinity to reduce the channel slope, or reverting to Option 1).
45
7. References
Barbin, G.P. and W.H. Krueger. 1994. Behavior and swimming performance of elvers of the American eel, Anguilla rostrata, in an experimental flume. Journal of Fish Biology 45: 111-121.
Beamish, F.W.H. 1978. Swimming capacity. Pages 101-187 in W.S. Hoar and D.J. Randall, editors. Fish Physiology. Volume VII. Locomotion. Academic Press, New York.
Buckley, J.L. 1989. Species profiles: life histories and environmental requirements of coastal fishes and invertebrates (North Atlantic) – rainbow smelt. U.S. Fish Wildl. Serv. Biol. Rep. 82(11.106). U.S. Army Corps of Engineers, TR EL-82-4. 11 pp.
Castro-Santos, T.R. 2002. Swimming Performance of Upstream Migrant Fishes: New Methods, New Perspectives. Ph.D. Dissertation, University of Massachusetts Amherst. 185 pp.
EPRI (Electric Power Research Institute). 2000. Technical Evaluation of the Utility of Intake Approach Velocity as an Indicator of Potential Adverse Environmental Impact under Clean Water Act Section 316(b), EPRI, Palo Alto, CA. 1000731.
Katopodis, C. and R. Gervais. 1991. Ichthyomechanics: working document. Freshwater Institute, Department of Fisheries and Oceans, Winnipeg, Manitoba.
Langdon, S.A. and A.L. Collins. 2000. Quantification of the maximal swimming performance of Australasian glass eels, Anguilla australis and Anguilla reinhardtii, using a hydraulic flume swimming chamber. New Zealand Journal of Marine and Freshwater Research 34: 629-636.
Swanson, C., P.S. Young, and J.J. Cech Jr. 1998. Swimming performance of delta smelt: maximum performance, and behavioral and kinematic limitations on swimming at submaximal velocities. The Journal of Experimental Biology 201: 333-345.