alcohol and drug trends within region 8
TRANSCRIPT

www.SACADA.org
Abigail Moore, MA, ACPS LPCSACADA CEO
Gyna Juarez, MPA ACPSProgram Director

www.SACADA.org

www.SACADA.org
Youth Prevention Programs(Bexar County Only)Project Heart (8-13)
Middle School (6th – 8th)Adolescent/Teen (14 – 18)
Hype ProductionAlternative Programs
Adult and Family ServicesAssessment and Referrals
Project ADELANTEWORC Project
Resource CenterBrochuresDVD/CDPosters
Fact Sheets
Education and TrainingDrugs & Alcohol TrendsDrug-Free WorkplaceCourt Mandated forAlcohol AwarenessDWI Education
Programs and Services Offered
www.SACADA.org
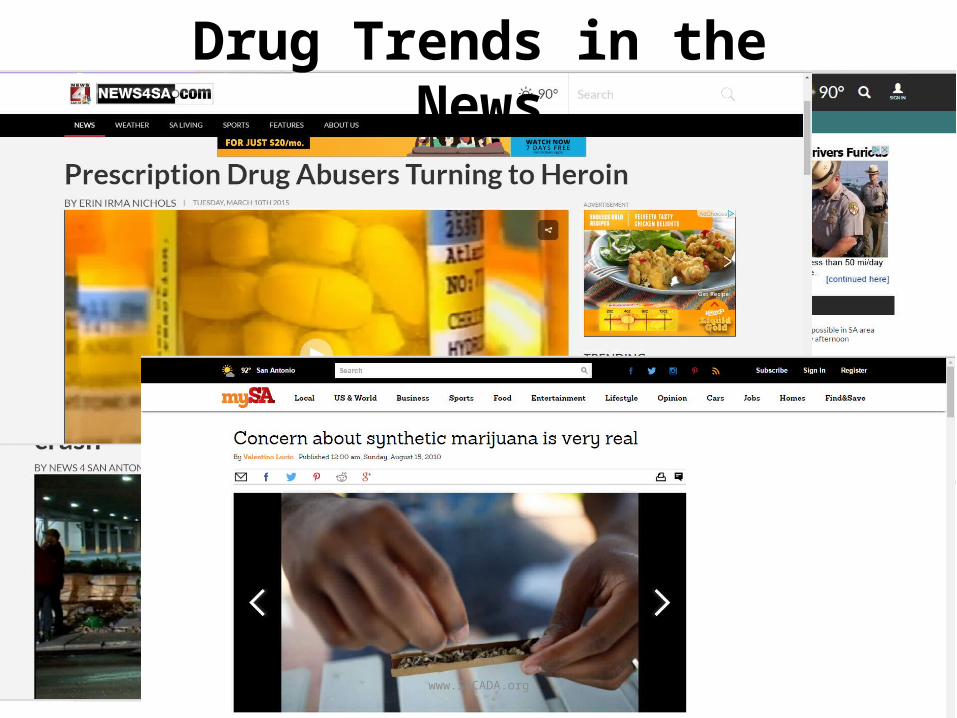
Drug Trends in the News

www.SACADA.org
SHOWME THE
DATA!
www.SACADA.org
Workshop Objectives• To familiarize participants with Region 8 demographics • To discuss Region 8 Drug Trends with youth and adults• To discuss signs and symptoms of substance abuse• To identify resources communities can utilize

www.SACADA.org
The Prevention Resource Center-Region 8 is one of 11 PRCs across Texas funded by
the Texas Department of State Health Services (DSHS). We cover 28 counties in
South Central Texas.
www.SACADA.org
The Purpose of the Regional Needs Assessment (RNA)
The regional needs assessment is a document developed with state, regional and local data to provide the
community at large with a comprehensive view of information about the trends, outcomes and
consequences associated with drug and alcohol use.
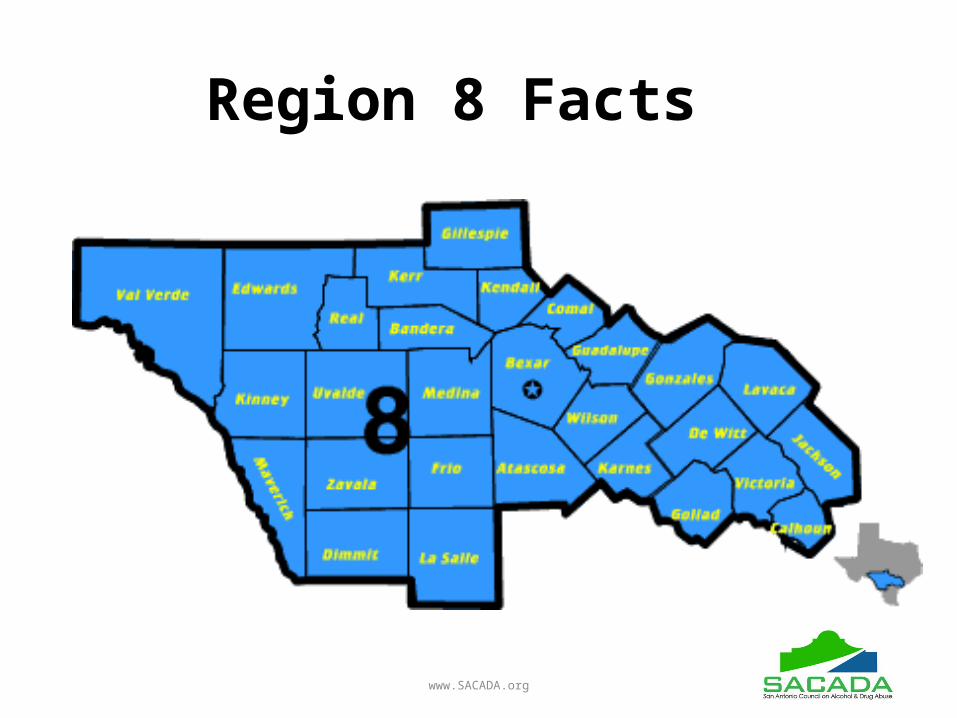
Region 8 Facts
www.SACADA.org

www.SACADA.org
Region 8 Demographics Largest Cities
Nation1. New York2. Los Angles3. Chicago4. Houston5. Philadelphia6. Phoenix7. San Antonio
Texas1. Houston2. San Antonio3. Dallas4. Austin5. Ft Worth6. El Paso

www.SACADA.org
Region 8 Demographics
Region Texas Nation31,637.1
sq. mile261,231.71
sq. mile3,531,905.43
sq. mile
Land Area
Region Texas Nation2,751,696 26,956,958 318,857,056
Region Texas Nation87 Per Sq. Mile 96.3 per sq. mile 87.4 per sq. mile
Population Did you know?Region <1% Texas 8%

Region 8 Population RankingRegion 8 Counties by Ranking Population in Texas
Atascosa 68 Kendall 79Bandera 115 Kerr 63Bexar * Largest 4 Kinney 219Calhoun 112 La Salle 184Comal 33 Lavaca 122DeWitt 117 Maverick 57Dimmit 160 Medina 67Edwards * Smallest 236 Real 221Frio 127 Uvalde 98Gillespie 100 Val Verde 65Goliad 183 Victoria 41Gonzales 118 Wilson 70Guadalupe 29 Zavala 156Jackson 141 Region 8 *In State 4Karnes 140 Texas * In the
Nation 2
Source: http://factfinder.census.gov/faces/tableservices/jsf/pages/productview.xhtml?src=bkmk
www.SACADA.org

Cultural Indicators - Veterans
Region 8 Texas0
1
2
3
4
5
6
7
8
9
10
Veterans
U.S. Census Bureau. 2009 – 2013 5 Year American Community Survey
www.SACADA.org
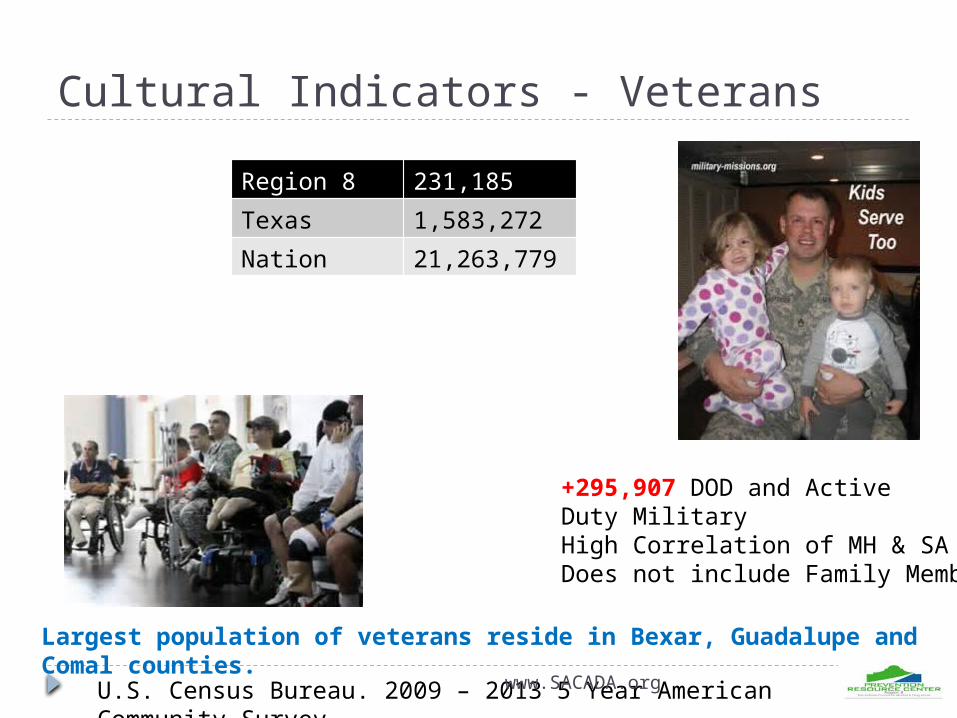
Cultural Indicators - Veterans
U.S. Census Bureau. 2009 – 2013 5 Year American Community Survey
Region 8 231,185Texas 1,583,272Nation 21,263,779
+295,907 DOD and ActiveDuty MilitaryHigh Correlation of MH & SADoes not include Family Members
Largest population of veterans reside in Bexar, Guadalupe and Comal counties. www.SACADA.org

% of Individuals Living Below Poverty Level
14
14.5
15
15.5
16
16.5
17
17.5
18
17.1%17.6%
15.4%
U.S. Census Bureau. 2009 – 2013 5 Year American Community Survey
Counties with the most population living in poverty Zavala 35%, Maverick – 30.5% and Dimmit and Uvalde both at 26.5%
www.SACADA.org

Children Living in Poverty
Children in Poverty20%
22%
24%
26%
United States; 22%
Texas; 25%
Region; 24.10%
Chart Title
Axis Title
2015 Kids Count Profilewww.SACADA.org

www.SACADA.org
Counties with the Largest % of Kids Living in Poverty
Gonzales 1,657 30.7Val Verde 4,500 32.3Maverick 6,289 34.8LaSalle 526 35.6Frio 1,535 35.9Edwards 152 38.3Dimmit 1,262 39Real 223 39.1Uvalde 2,940 39.4Zavala 1,655 45

Socioeconomic Indicators
Region 8
Texas Nation
$45,658
$51,900
$53,046
Median Household Income (In 2013 Dollars)
U.S. Census Bureau. 2009 – 2013 5 Year American Community Survey
The top 3 Counties with the most income include Kendall - $73,410, Comal - $65,839 and Wilson - $64,571The bottom 3 Counties with the least income include Maverick - $31,395, La Salle - $26,756 and Zavala - $25,625.
$6,242Less
$7,388Less
www.SACADA.org

Households Receiving Supplemental Nutrition Assistance Program (SNAP) Benefits
Area TotalHouseholds
Households ReceivingSNAP Benefits
% Households Receiving SNAP Benefits
Region 8 921,190 132,345 14.37%Texas 8,886,471 1,173,314 13.20%Nation 115,610,216 14,339,330 12.40%
SNAP provides monthly benefits that help eligible low income households purchase healthy food.
www.SACADA.org

Confirmed Child Protective Service (CPS) Victims & Investigations
Area Confirmed Victims of Child Abuse
Per 1,000 Children
Region 8
8,397 11.6
Texas 66,572 9.2
Texas State Data Center, University of Texas San Antonio, Based on Census 2010 Data www.SACADA.org

www.SACADA.org
Region 8 Demographics - Language
English SpanishOther
36%
More Than 1/3 of our Citizens Ages 5 and Older Speak Spanish as Their First Language.
U.S. Census Bureau, 2009 – 2013 5- Year American Community Survey
www.SACADA.org
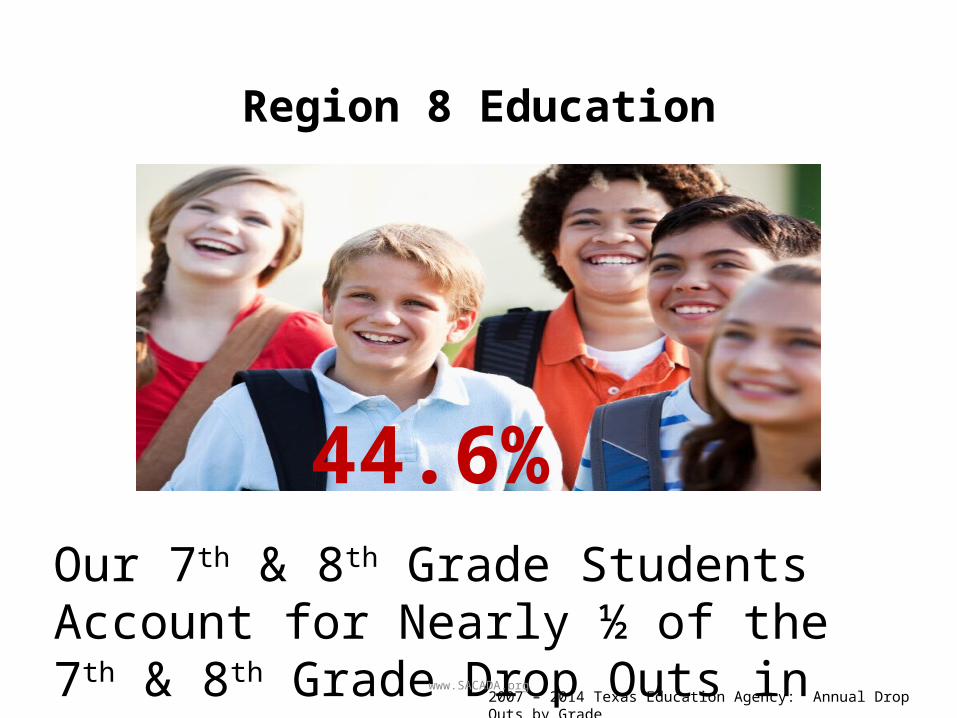
Region 8 Education
Our 7th & 8th Grade Students Account for Nearly ½ of the 7th & 8th Grade Drop Outs in Texas.
44.6%
2007 – 2014 Texas Education Agency: Annual Drop Outs by Grade

www.SACADA.org
Region 8 Education
Our 9th & 10th Grade Students Account for 9% of the 9th & 10th Grade Drop Outs in Texas.
9.2%
2007 – 2014 Texas Education Agency: Annual Drop Outs by Grade

www.SACADA.org
Region 8 Education
In Total, Our 7th thru 12th Grade Students Account for nearly 15% Drop Outs in Texas.
14.5%
2007 – 2014 Texas Education Agency: Annual Drop Outs by Grade

www.SACADA.org
Region 8 Criminal Activity-Adolescents
•The total offenses by males under 18 in 2013 account for almost 70% of the crimes committed.
•All illicit drug-related offenses (drug abuse violations, drug sale/manufacture, and drug possessions) account for 40% of arrests.
DPS, Texas Uniform Crime Reporting Program 2013

www.SACADA.org
Region 8 Substance Abuse Treatment and Adolescents (12 – 18 Year Olds)
351 Treatment Admissions
7% of the State’s Total2014 Substance Abuse and Mental Health Treatment Youth Admissions Report

www.SACADA.org
Region 8 Substance Abuse Treatment and Adolescents (12 – 18 Year Olds)
2014 Substance Abuse and Mental Health Treatment Youth Admissions Report
12 Yr Olds 13 Yr Olds 14 Yr Olds 15 Yr Olds 16 Yr Olds 17 Yr Olds0
5
10
15
20
25
30
35
40
Admissions in 2014

www.SACADA.org
Region 8 Substance Abuse Treatment and Adolescents (12 – 18 Year Olds)
2014 Substance Abuse and Mental Health Treatment Youth Admissions Report
Admissions in 2014
Out Patient Residential
24%76%

www.SACADA.org
Region 8 Substance Abuse Treatment and Adolescents (12 – 18 Year Olds)
2014 Substance Abuse and Mental Health Treatment Youth Admissions Report
Reasons for Treatment Admissions in 2014Marijuana/Hash Meth Alcohol & Other
89%

Teen Pregnancy
Data Source: US Department of Health & Human Services, Health Indicators Warehouse. Centers for Disease Control and Prevention, National Vital Statistics System. Accessed via CDC WONDER. 2006-12. Source geography: County
Female with birth in the past 12
months (15 to 19)
Total White alone Black or African
American
Hispanic or Latino
Origin(of any race)
Area Total teen (15-19) population
% of teen female with birth
Total teen (15-19) population
% of teen female with birth
Total teen (15-19) population
% of teen female with birth
Total teen (15-19) population
% of teen female with birth
Region 8 (County Level)
Counties reporting
150,580
3.1 39,248
2.0 11,971 4.5 93,362
4.1
Texas
1,884,547
3.8 682,019
2.2 251,666 4.3 854,228
5.3
US 21,715,074
2.4 12,080,761
1.6 3,315,656
3.7 4,547,603
3.8• Texas has the 5th highest birth rate among teenagers, behind Arkansas, Mississippi,
Oklahoma and New Mexico. And Texas, where schools are not required to teach sex education, has the highest rate of repeat births among teenagers ages 15 to 19.
• The Centers for Disease Control and Prevention has examined a troubling sub-group: teens who give birth to a second, third or even fourth child. These are called “repeat teen births.” Of all 50 states, Texas ranks #1 for this phenomenon.
Source: U.S. Census Bureau, 2009-2013 5-Year American Community Surveywww.SACADA.org

SuicideArea self poisoning self harm by
hangingself harm by
other /firearmTotal Suicide
death rate per
100,000
% of total deaths
death rate per
100,000
% of total
deaths
death rate per
100,000
% of total
deaths
death
rate per 100,000
% of total deaths
Region 8
14 - 0.1 40 2.2 0.2 *101 5.6 0.5 155
3.9 0.3
Suicide Mortality Rates Per 100K Population, Region 8, 2013, CDC Wonder MCD
Deaths RateRegion 8 3,912 12.62Texas 37,699 10.73
Suicide Mortality Rates Per 100K Population, 1999-2013, CDC Wonder MCD
www.SACADA.org
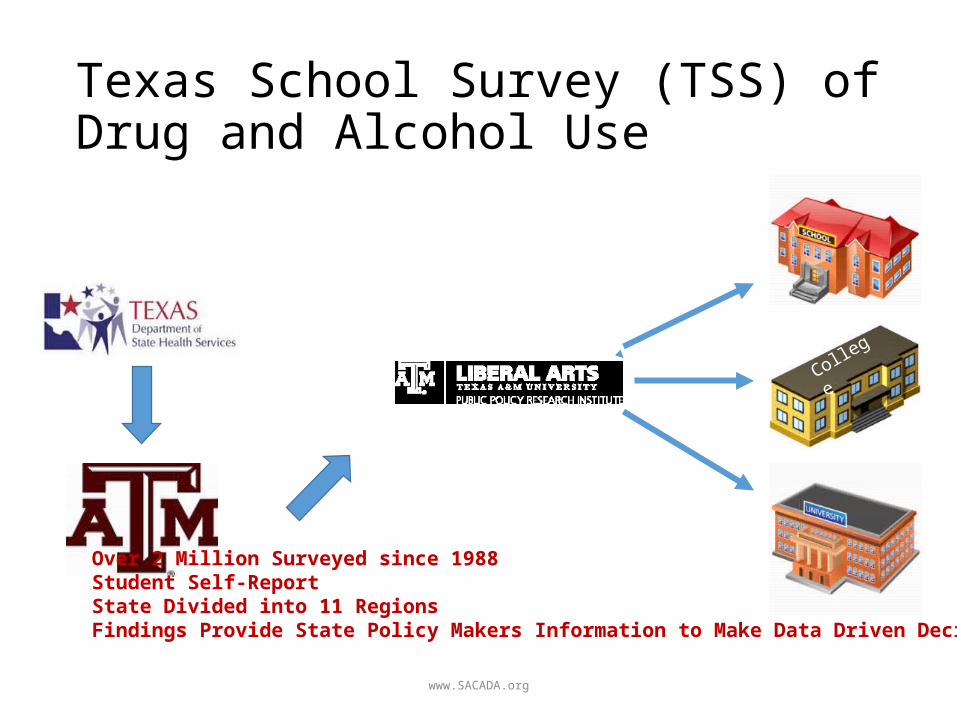
Texas School Survey (TSS) ofDrug and Alcohol Use
College
Over 2 Million Surveyed since 1988Student Self-ReportState Divided into 11 RegionsFindings Provide State Policy Makers Information to Make Data Driven Decisions.
www.SACADA.org

- Students self-report their use of drugs, alcohol and tobacco in grades 7 – 12.
Measures frequency, peers, driving under the influence, access, perceptions of danger, parental approval and other related behavior.
www.SACADA.org

20102012
2014
Texas School Survey Participation Regions 7&8
www.SACADA.org

Tobacco
Stero
ids
Marijuan
a
Inhalants
Heroin
Hallucin
ogenus
Ecstas
y
Cocaine/C
rack
Alcohol
Any Illicit
Drug
Rohypnol
Methampheta
mine
Syntheti
c Mariju
ana
0
10
20
30
40
50
60
70Youth Ever Used 2014
Region State Nation
Alcohol continues to be the most used substance.
www.SACADA.org

Nation Texas Region 7 & 8 0
10
20
30
40
50
60
70
Alcohol Tobacco Marijuana
Nation – Tobacco leads Marijuana by .4%
Most Self-Reported Substance Used 2014
State - Marijuana leads Tobacco by .8%
Region – Tobacco leads Marijuana by .2%
www.SACADA.org

Youth Ever Used 2014
TobaccoSteroids
MarijuanaInhalants
HeroinHallucinogenus
EcstasyCocaine/Crack
AlcoholAny Illicit Drug
RohypnolMethamphetamine
Synthetic Marijuana
0 10 20 30 40 50 60
State Region
Region ranks below the State in all areasexcept Meth and Steroids. (.1% )
www.SACADA.org

Alcohol is the most commonly used
substance. In 2014, 46% of the students in
Region 7&8 reported having used alcohol at
some point in their lives.
46%
In the Past 30 Days…11% of students reported having at least one instance of binge drinking (5 or more drinks in one sitting)
11%
BINGE
www.SACADA.org
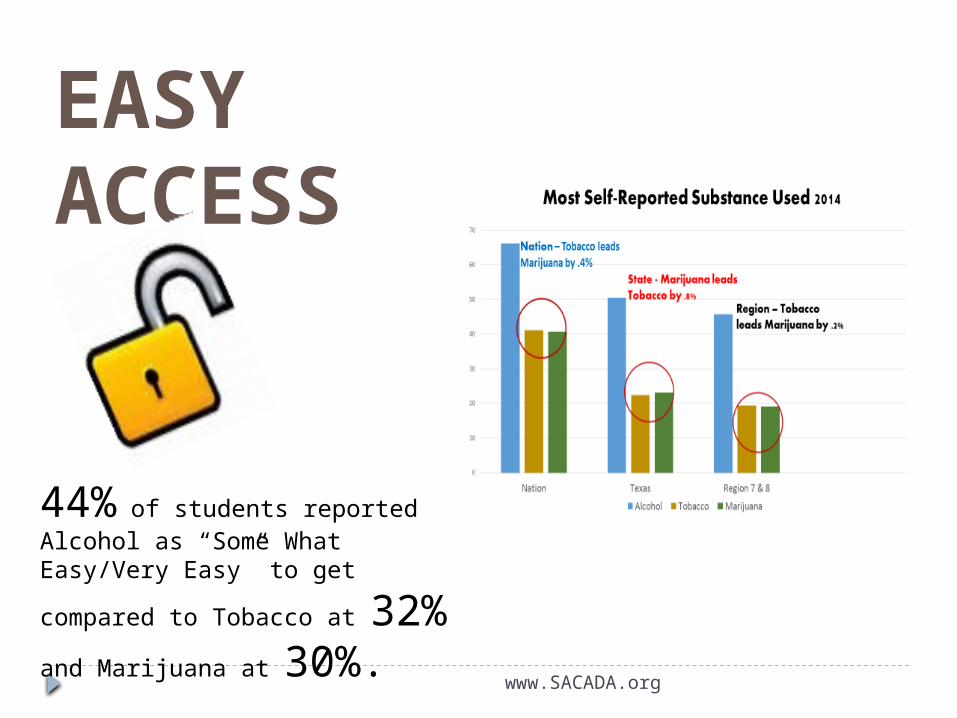
EASY ACCESS
44% of students reported Alcohol as “Some What Easy/Very Easy” to get compared to Tobacco at 32% and Marijuana at
30%. www.SACADA.org

Tobacco86% reported
that Tobacco is SomeWhat/Very Dangerous
31% reported that at least one of their close friends uses Tobacco.
Marijuana
74% reported that Marijuana is SomeWhat/Very Dangerous
39% reported that at least one of their close friends uses Marijuana.
If the Perception is Low…the Use is High!
Perception of harm
www.SACADA.org

Girls have surpassed Boys in Alcohol Usage in all categories.
2x
Students not living with two parents (32%)
reported using marijuana more than twice as much as those living in a two
parent household (17%).www.SACADA.org

RX Drugs – Region 7/8
Codein
e
Oxycon
tin
Vicodin
Valium
Xanax
Over th
e Cou
nter D
XM, Trip
le CS 0
1
2
3
4
Region 7&8
Everwww.SACADA.org

Inhalants – Comparison
Spray
Paint
Compu
ter Dust
Spray
sGlue
Gas/Octa
ne/Carb
Cleane
r01234
Texas
Ever Used
Spray
Paint
Compu
ter Dust
Spray
sGlue
Gas/Octa
ne/Carb
Cleane
r0
1
2
3
4
Region 7&8
Ever Used
How recently, if ever have you sniffed, huffed, or inhaled the following inhalants for “kicks” or to get “high”?
www.SACADA.org

Alcohol Any Illicit Inhalants Marijuana Tobacco0
5
10
15
20
25
30
35
40
Past Month Use by Grade – Region 7&8
Grade 12 Grade 11 Grade 10 Grade 9Grade 8 Grade 7 Grade 6
Substance use increases by grade level with the exception of inhalants. 6th & 7th grade reported more likely to use inhalants.
www.SACADA.org

Seek Help – Region 7&8
School Counselor
Adult at School
Counselor Out
Parents Medical Dr. Friends Another Adult Not Seek0
10
20
30
40
50
60
70
80
90
If you had a drug or alcohol problem and needed help, who would you go to?
No Yes
52% Will Not Seek Help
www.SACADA.org

www.SACADA.org

Behavioral HealthDATA BOOKA quarterly reference to community mental health and substance abuse services
Fiscal Year 2015 Quarter 1 March 10, 2015
http://www.dshs.state.tx.us/mhsa/databook/

48
Figure 3.4. Number of adult admissions to substance abuse treatment programs by primary substance per year
FY11 FY12 FY13 FY140
5,000
10,000
15,000
20,000
12,184 12,925
12,015 12,496
6,125 6,022
4,884 4,755 5,554 5,400 5,614
6,052
2,628 3,094
4,383
5,663
3,840 3,797 3,531 3,210
9,213 9,117 9,264 9,738
Alcohol Cocaine Marijuana Methamphetamine Opioid Other
SUBSTANCE ABUSE SERVICES Section 3 Treatment
Source: DSHS, Clinical Management for Behavioral Health Services (CMBHS).
Region 8 Admissions FY14 = 3,763
49
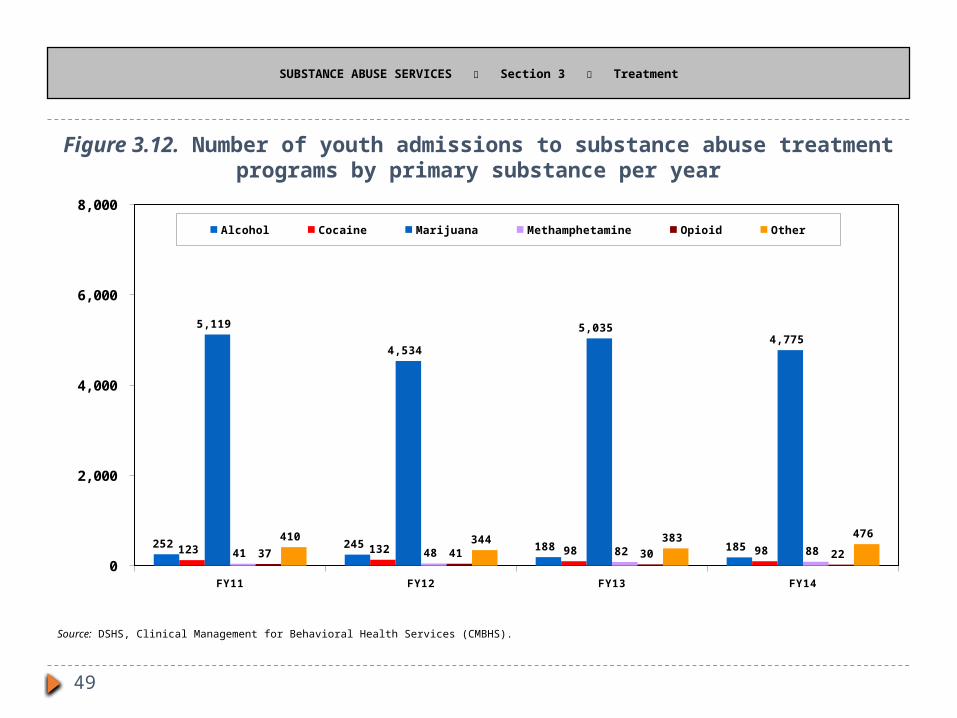
Figure 3.12. Number of youth admissions to substance abuse treatment programs by primary substance per year
FY11 FY12 FY13 FY140
2,000
4,000
6,000
8,000
252 245 188 185 123 132 98 98
5,119
4,534
5,035 4,775
41 48 82 88 37 41 30 22 410 344 383 476
Alcohol Cocaine Marijuana Methamphetamine Opioid Other
SUBSTANCE ABUSE SERVICES Section 3 Treatment
Source: DSHS, Clinical Management for Behavioral Health Services (CMBHS).

50
FY11 FY12 FY13 FY140
2,000
4,000
6,000
8,000
10,000
0 68 107 94
838
1,757 1,984
2,635
341 304 710 564 461 634
1,410 1,435
6,553 6,271 6,305
5,391
COPSD Detox Methadone Outpatient Residential
Figure 6.1. Number of adults entered on waiting list by substance abuse program per year
SUBSTANCE ABUSE SERVICES Section 6 Waiting List
Source: DSHS, Clinical Management for Behavioral Health Services (CMBHS).

51
FY11 FY12 FY13 FY140
200
400
600
800
0 20 0 0
687
412 389 395
66 98
49 40 0 0
COPSD Detox Residential Outpatient Methadone
Figure 6.2. Number of youth entered on waiting list by substance abuse program per year
SUBSTANCE ABUSE SERVICES Section 6 Waiting List
Source: DSHS, Clinical Management for Behavioral Health Services (CMBHS).

Alcohol-Underage Drinking
www.SACADA.org

Alcohol – Underage Drinking
www.SACADA.org

Alcohol – Binge Drinking
www.SACADA.org

College: Binge Drinking
Past 30 Days
Male 41%
Females 35%
14%
Youth Binge Drinking
Binge Drinking: Five drinks in one sitting for menFour drinks in one sitting for women
11% of our region’s youth (grades 6-12) report binge drinking within the past 30 days.


Tobacco/Electronic Nicotine Devices
www.SACADA.org
Tobacco use is the leading cause of preventable disease and death in the United States; if current smoking rates continue, 5.6 million Americans aged <18 years who are alive today are projected to die prematurely from smoking-related disease.
During 2011–2015, substantial increases were observed in e-cigarette and hookah use among high school and middle school students, whereas significant decreases were observed in the use of cigarettes, cigars, smokeless tobacco, pipe tobacco, and bidis, resulting in no decline in tobacco use overall.
During 2015, electronic cigarettes (e-cigarettes) were the most commonly used tobacco product among middle (5.3%) and high (16.0%) school students.
Singh T, Arrazola RA, Corey CG, et al. Tobacco Use Among Middle and High School Students — United States, 2011–2015. MMWR Morb Mortal Wkly Rep 2016;65:361–367. DOI: http://dx.doi.org/10.15585/mmwr.mm6514a1
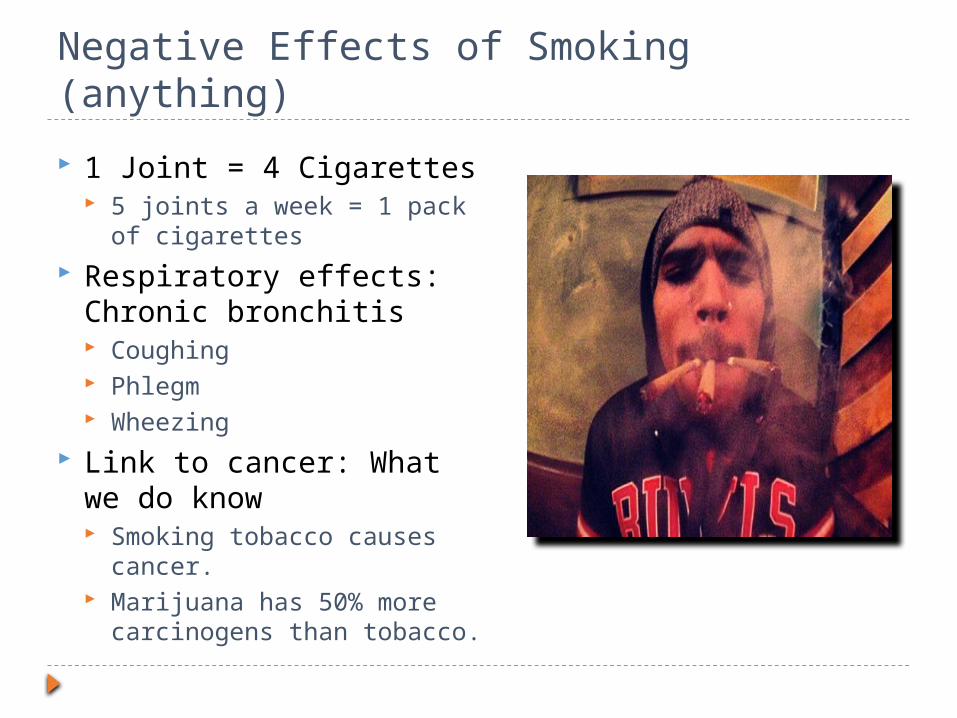
Negative Effects of Smoking (anything) 1 Joint = 4 Cigarettes
5 joints a week = 1 pack of cigarettes
Respiratory effects: Chronic bronchitis Coughing Phlegm Wheezing
Link to cancer: What we do know Smoking tobacco causes
cancer. Marijuana has 50% more
carcinogens than tobacco.
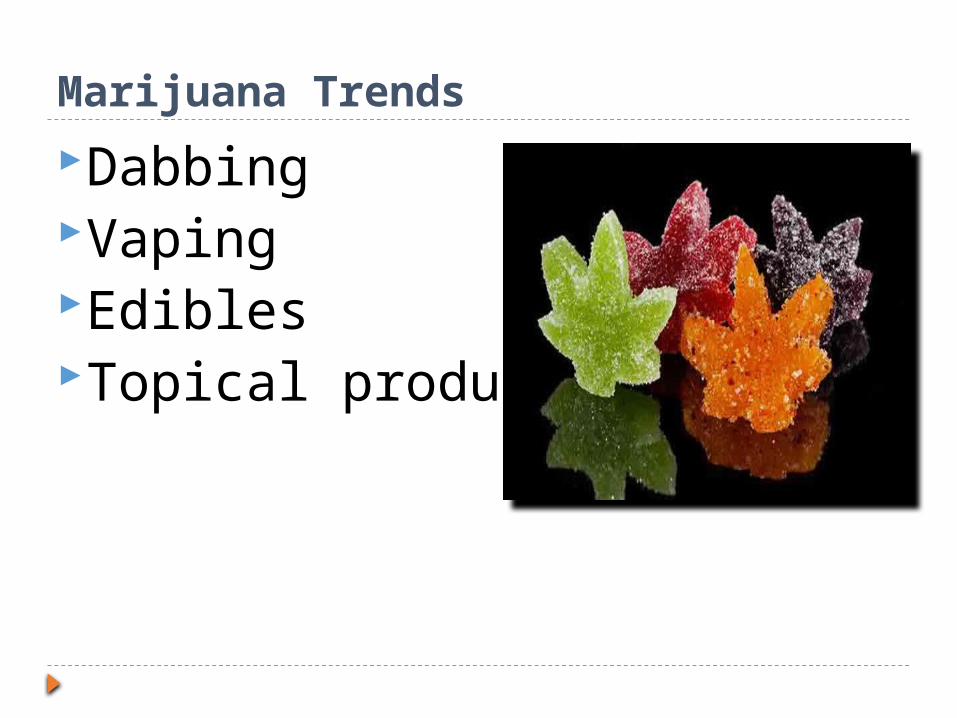
Marijuana TrendsDabbing VapingEdiblesTopical products

Hashish
Hash OilSlang terms include wax, ear wax, canna wax, dabs, canna oil, honey oil, and other
lovely descriptive terms. Using hash oil
is often called “dabbing.”
Hashish is extracted from marijuana either by compression or purification.

Vaping Hash Oil

Edibles Marketed to youth Derive benefits w/o
smoke No THC wasted in smoke
1 puff on a joint ~ 5 mg THC
1 “serving” = 10 mg THC 1 package = up to 10
servings Effects delayed up to 30
min

National Overdose DeathsNumber of Deaths from Prescription Drugs
20012002
20032004
20052006
20072008
20092010
20112012
20132014
0
5,000
10,000
15,000
20,000
25,000
30,000 Total Female Male
Source: National Center for Health Statistics, CDC Wonder

National Overdose DeathsNumber of Deaths from Prescription Opioid Pain Relievers
20012002
20032004
20052006
20072008
20092010
20112012
20132014
0
2,000
4,000
6,000
8,000
10,000
12,000
14,000
16,000
18,000
20,000 Total Female Male
Source: National Center for Health Statistics, CDC Wonder

National Overdose DeathsNumber of Deaths from Benzodiazepines
20012002
20032004
20052006
20072008
20092010
20112012
20132014
0
1,000
2,000
3,000
4,000
5,000
6,000
7,000
8,000
9,000 Total Female Male
Source: National Center for Health Statistics, CDC Wonder

Over the Counter - Cough Syrup(DXM)
http://www.dextroverse.org/sources.html
Skittles

Heroin – On the Rise
www.SACADA.org
Heroin use more than doubled among young adults ages 18–25 in the past decade.
More than 9 in 10 people who used heroin also used at least one other drug.
45% of people who used heroin were also addicted to prescription opioid painkillers.
http://www.cdc.gov/vitalsigns/heroin/

National Overdose DeathsNumber of Deaths from Heroin
20012002
20032004
20052006
20072008
20092010
20112012
20132014
0
2,000
4,000
6,000
8,000
10,000
12,000 Total Female Male

Addiction A primary disease that develops over
time.
Characterized by preoccupation and mood-altering chemicals, loss of control over consumption, chronicity, and tendency to relapse.
Whatever label is used to describe addiction, it has consistent symptoms, progression and outcome if left untreated. It can be diagnosed and treated effectively.
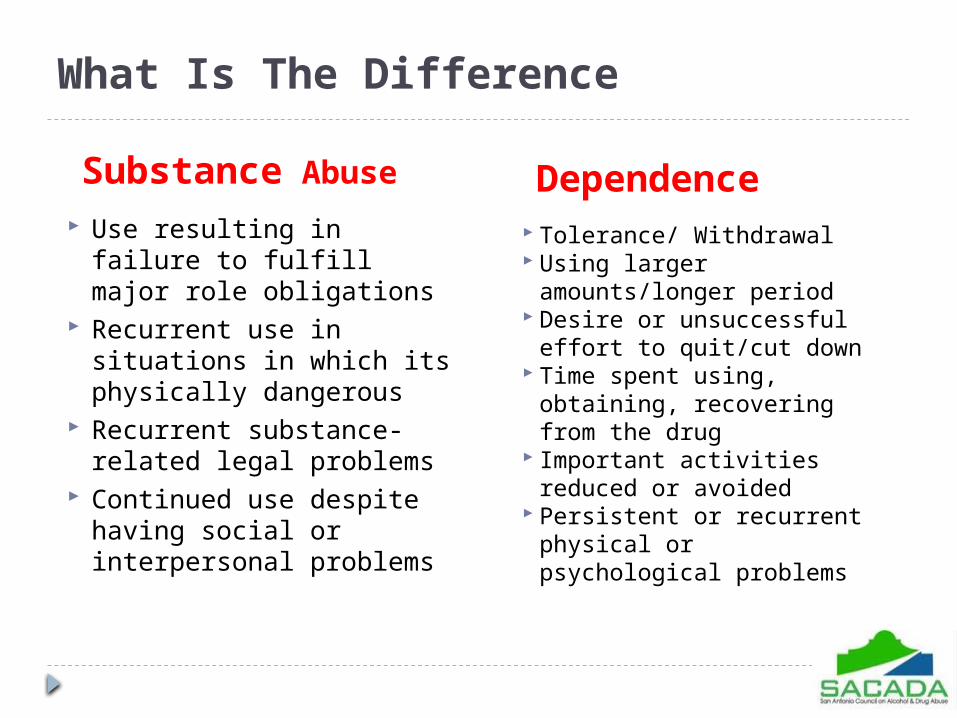
What Is The Difference
Substance Abuse Use resulting in failure to
fulfill major role obligations
Recurrent use in situations in which its physically dangerous
Recurrent substance-related legal problems
Continued use despite having social or interpersonal problems
Dependence Tolerance/ Withdrawal Using larger
amounts/longer period Desire or unsuccessful
effort to quit/cut down Time spent using,
obtaining, recovering from the drug
Important activities reduced or avoided
Persistent or recurrent physical or psychological problems
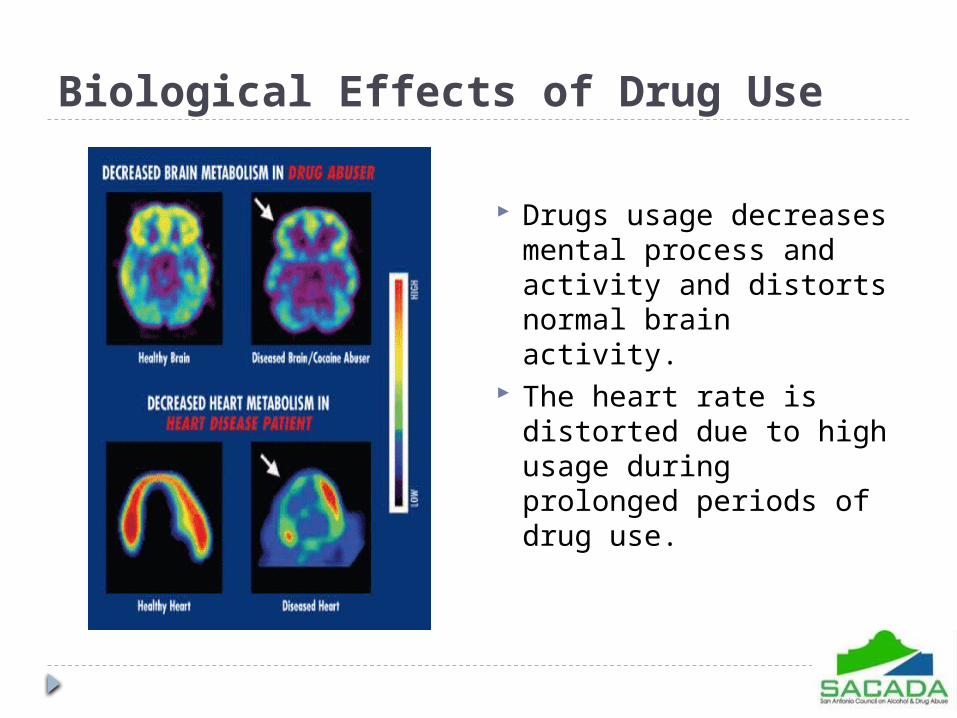
Biological Effects of Drug Use
Drugs usage decreases mental process and activity and distorts normal brain activity.
The heart rate is distorted due to high usage during prolonged periods of drug use.
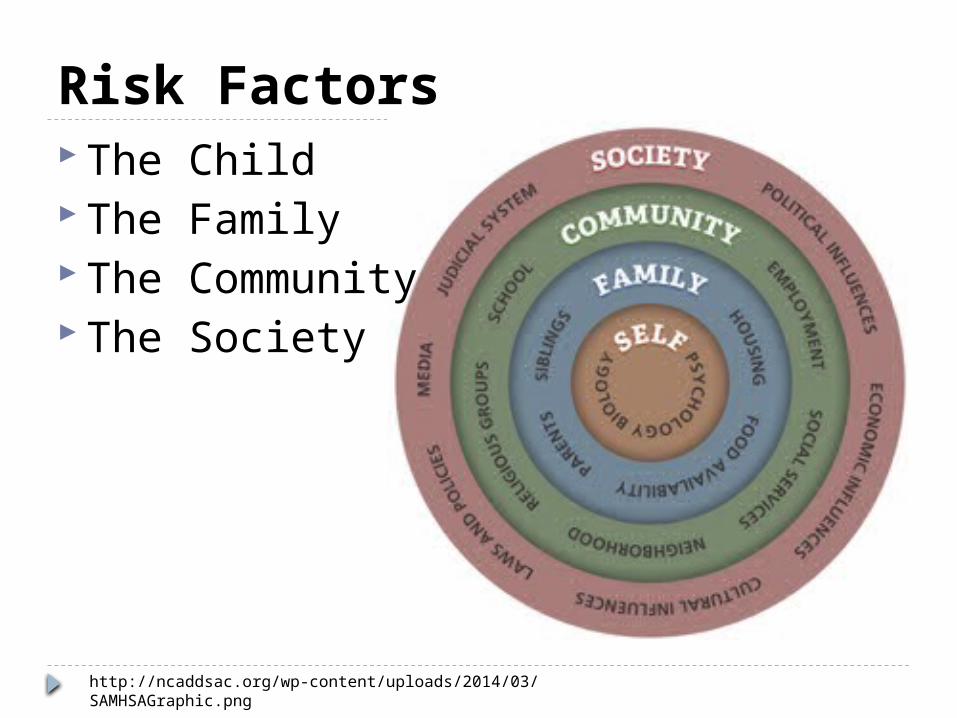
Risk Factors The Child The Family The Community The Society
http://ncaddsac.org/wp-content/uploads/2014/03/SAMHSAGraphic.png

Children at greater risk With disabilities,
mental illness, and ill children, premature birth, exposure to toxins in utero
Age– younger more likely to be neglected older sexual abuse
Gender

The families at great risk Substance abuse (up to 80% is present) Been abused as a child/become victimizer Single parents, step parenting, Poverty Domestic violence Lack of parenting skills and other life skills Young families, many kids –more risk (remember
data Gyna shared teen pregnancy, youth drug use)

Risk Factor- Community Lack of community support Cultural norms Violence Unemployment

Risk Factor-Social Religious norms, Acceptance of violence Stressful life events Lack of social support Others?
Protective Factors Child Parent/ family Social/Environmental

Protective Factor- Child Mom’s good prenatal care during pregnancy Good health and development Easy temperament, positive deposition Active coping skills Positive self esteem Good social skills Internal locus of control Balance between help seeking & autonomy
**SACADA work on with kids
Parental/Family Protective Factors Parent wellness (mental, medical) and drug
free Warm parent-child relationship Supportive family environment Parental monitoring of child Stable relationship of parents Parental coping skills and competence Parental education/income

Social/Environmental Protective factors Access to health care Safe community (crime, drugs) Adequate housing Family religious faith participation (healthy) Mid to high socioeconomic status
SACADA Services Prevention Services Recovery Coaches MIP Classes, Alcohol DWI Classes (1st Time Offender)
ADAEP Classes, every Thursday
First Friday Workshops
Questions from the Audience
www.SACADA.org

Thank You for Your Time!SACADA7500 Hwy 90 W, Ste. 100San Antonio, TX 78227Phone (210) 225-4741 www.sacada.org Twitter.com/SACADATexasFacebook.com/SACADATex
Abigail Moore, [email protected] Juarez, [email protected]