alberta’s international exports by industry a 10-year ... · pdf filenovember 29, 2017...
TRANSCRIPT
Alberta’s International Exports by Industry A 10-Year Review, 2006 to 2016
November 29, 2017
Highlights:
Between 2006 and 2016, Alberta’s international merchandise exports rose 1.5% to
$78.9 billion. By comparison, Alberta exports rose 91% between 2004 and 2014.
The much lower 10-year growth rate for 2016 is mainly the result of the sharply
lower oil and gas prices of 2015 and 2016.
-2- November 29, 2017 Alberta’s International Exports by Industry
A 10-Year Review, 2006 to 2016
Overview
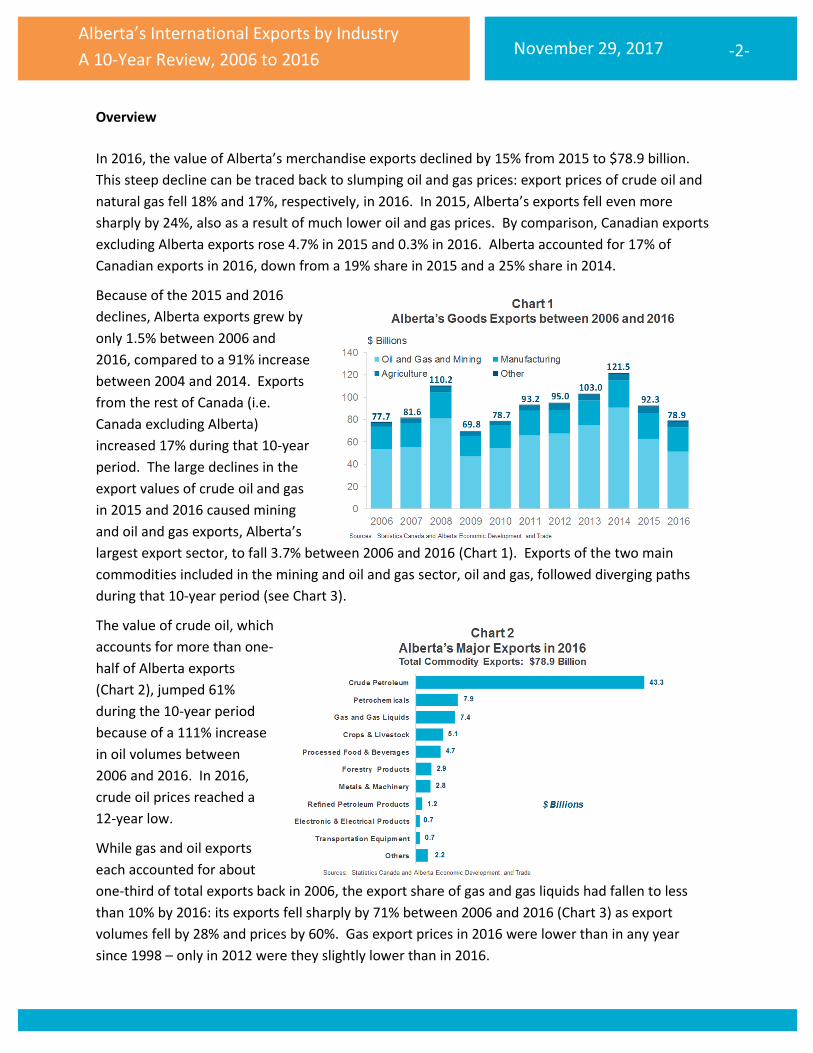
In 2016, the value of Alberta’s merchandise exports declined by 15% from 2015 to $78.9 billion.
This steep decline can be traced back to slumping oil and gas prices: export prices of crude oil and
natural gas fell 18% and 17%, respectively, in 2016. In 2015, Alberta’s exports fell even more
sharply by 24%, also as a result of much lower oil and gas prices. By comparison, Canadian exports
excluding Alberta exports rose 4.7% in 2015 and 0.3% in 2016. Alberta accounted for 17% of
Canadian exports in 2016, down from a 19% share in 2015 and a 25% share in 2014.
Because of the 2015 and 2016
declines, Alberta exports grew by
only 1.5% between 2006 and
2016, compared to a 91% increase
between 2004 and 2014. Exports
from the rest of Canada (i.e.
Canada excluding Alberta)
increased 17% during that 10-year
period. The large declines in the
export values of crude oil and gas
in 2015 and 2016 caused mining
and oil and gas exports, Alberta’s
largest export sector, to fall 3.7% between 2006 and 2016 (Chart 1). Exports of the two main
commodities included in the mining and oil and gas sector, oil and gas, followed diverging paths
during that 10-year period (see Chart 3).
The value of crude oil, which
accounts for more than one-
half of Alberta exports
(Chart 2), jumped 61%
during the 10-year period
because of a 111% increase
in oil volumes between
2006 and 2016. In 2016,
crude oil prices reached a
12-year low.
While gas and oil exports
each accounted for about
one-third of total exports back in 2006, the export share of gas and gas liquids had fallen to less
than 10% by 2016: its exports fell sharply by 71% between 2006 and 2016 (Chart 3) as export
volumes fell by 28% and prices by 60%. Gas export prices in 2016 were lower than in any year
since 1998 – only in 2012 were they slightly lower than in 2016.

-3- November 29, 2017 Alberta’s International Exports by Industry
A 10-Year Review, 2006 to 2016
The manufacturing sector saw its exports grow by 5.7% between 2006 and 2016 while the
agricultural sector1 led all sectors with growth of 64%.
Export Volumes Even though the value of exports rose only 1.5% between 2006 and 2016, total export volumes rose strongly by an estimated 30%2 as overall export prices were lower in 2016 than in 2006. This export price decline was mostly the result of the 60% decline in natural gas prices over the 10-year period and of a 24% drop in crude oil prices. The value of exports of oil and gas and gas liquids fell 3.2% but volumes rose 44% during that time period driven by a 111% surge in crude oil volumes as a result of the huge production gains in the oil sands region. When we exclude oil and gas and other energy commodities, export volumes of non-energy commodities increased by about 1%. Although the agricultural sector saw the value of its exports rise 64% over the 10-year period, most of that increase was the result of higher prices as export volumes rose only 3%. The manufacturing sector saw the value of its exports rise 5.7% between 2006 and 2016: most of that increase was also the result of higher prices as export volumes rose only 1%.
Mining and Oil and Gas3
Mining and oil and gas commodities
account for the largest share of
Alberta exports – this sector’s share
ranged from a low of 52% in 1998
(when crude oil and natural gas
prices were low) to a high of 75% in
2014 when both oil and gas prices
were relatively high for most of the
year and crude oil volumes reached
record levels. In 2016, its share fell
to a 14-year low of 65% as a result
of the sharp price declines for oil
and gas in 2015 and 2016 (although
crude oil volumes had another record setting year in 2016). Mining and oil and gas exports totaled
$51.2 billion, an 18% decrease from the previous year, and the lowest export value since 2010.
After declining by 32% in 2015 the value of crude oil exports fell by a further 18% in 2016.
However, these exports still rose 61% between 2006 and 2016 to $43.3 billion. Oil volumes
1 This is the primary agricultural sector and does not include processed agri-foods. 2 Growth in export volumes was derived by 1) multiplying the 2016 export volumes for individual commodities by their 2006 price levels, 2) summing up the re-estimated values for 2016 for these commodities, and 3) dividing the sum of the re-estimated 2016 values by the 2006 value. 3 The mining and oil and gas sector is dominated by energy commodities, such as crude oil, gas and gas liquids, coal and electricity, but also includes a few non-energy commodities such as peat and sulphur.

-4- November 29, 2017 Alberta’s International Exports by Industry
A 10-Year Review, 2006 to 2016
increased 111% over that period, with all of the volume growth coming from rising oil sands
production. Oil export volumes surged by an average of about 11% per year between 2010 and
2015 as both conventional oil and oil sands production increased, but volume growth weakened to
1% in 2016 because of the temporary production disruptions in the oil sands region due to the Fort
McMurray wildfires and also because of lower production of conventional crude oil. Oil prices
peaked in 2008, just prior to the US tight oil boom: they declined by 18% in 2016 and were also
18% higher in 2016 than they were in 2006. Crude oil has been Alberta’s largest export commodity
since 2006 and in 2016 accounted for 55% of Alberta’s merchandise exports.
Much of the volume growth for crude oil came from rising in-situ (or SAGD) oil sands production.
Between 2006 and 2016 in-situ bitumen production increased 180% and now exceeds oil
production from mining operations. Production of bitumen and synthetic crude oil from mining
operations increased by one-half over the same period.
Prior to 2006, natural gas and gas liquids4 were Alberta’s top export commodity as a result of rising
prices and volumes. However, since 2006 volumes of gas and gas liquids have fallen by 28% as
Alberta’s conventional natural gas reserves are decreasing while prices fell by 60% during that
period because of the US’ huge shale gas reserves which have had a downward impact on prices.
Between 2006 and 2016, the value of gas and gas liquids exports declined by 71% from $25.5
billion in 2006 to $7.4 billion in 2016. Natural gas exports totaled $6.5 billion in 2016, down 73%
from 2006: volumes fell by 30% during that period, while gas prices were 61% lower in 2016 than
in 2006. Exports of propane declined by 44% to $730 million: volumes increased 11% between
2006 and 2016 and prices dropped by one-half.
Other mining and oil and gas exports also include sulphur and coal. Sulphur exports totaled $198
million in 2016, nearly 50% less than the 2006 value of $390 million, and well below 2008’s peak of
$1.9 billion. The value of coal exports rose until 2011 to a record level of $886 million (up from
$317 million in 2006), as a result of rising international bituminous coal prices and strong growth in
export volumes, before declining to $177 million in 2016 as prices and volumes declined.
The main destination of Alberta mining and oil and gas commodities is the US, which accounted for
99% of energy exports in 2016, as virtually all oil and gas is shipped to the US. Nevertheless,
exports to other destinations totaled about $313 million in 2016, as exports of coal and sulphur are
destined primarily for non-US markets, such as Japan, China, Australia and Chile.
4 Gas liquids include propane, butanes and other liquefied petroleum gases.
-5- November 29, 2017 Alberta’s International Exports by Industry
A 10-Year Review, 2006 to 2016
Primary Agriculture
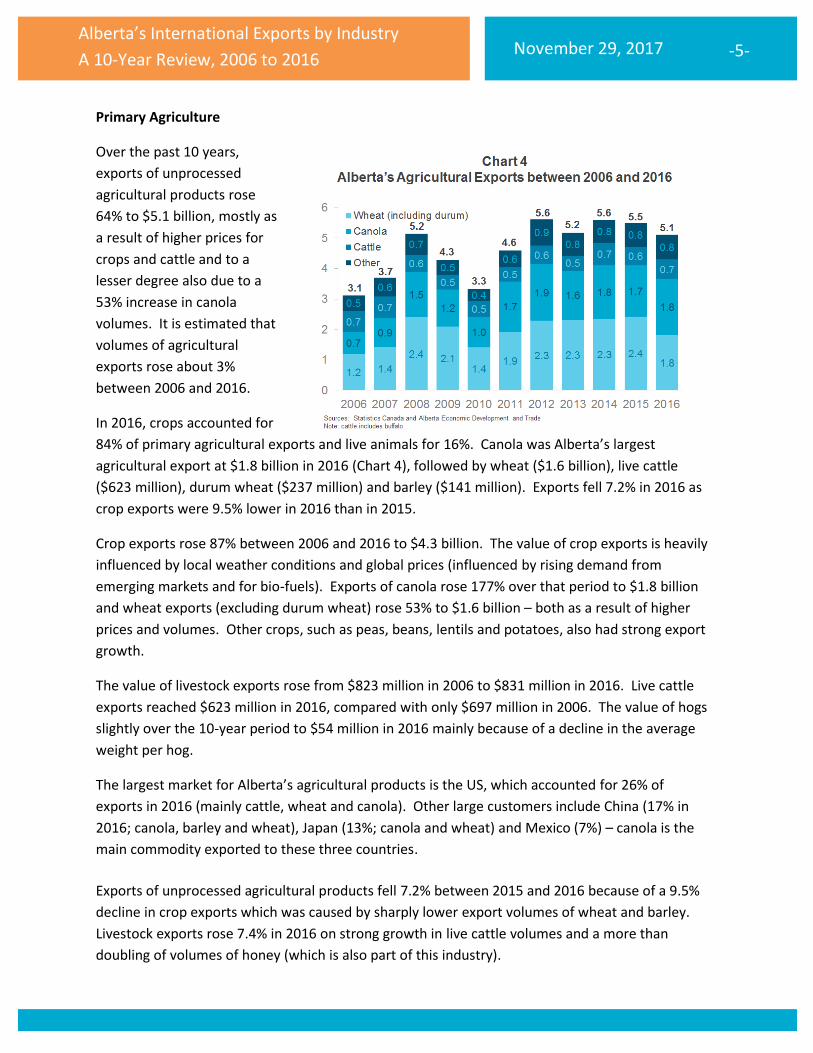
Over the past 10 years,
exports of unprocessed
agricultural products rose
64% to $5.1 billion, mostly as
a result of higher prices for
crops and cattle and to a
lesser degree also due to a
53% increase in canola
volumes. It is estimated that
volumes of agricultural
exports rose about 3%
between 2006 and 2016.
In 2016, crops accounted for
84% of primary agricultural exports and live animals for 16%. Canola was Alberta’s largest
agricultural export at $1.8 billion in 2016 (Chart 4), followed by wheat ($1.6 billion), live cattle
($623 million), durum wheat ($237 million) and barley ($141 million). Exports fell 7.2% in 2016 as
crop exports were 9.5% lower in 2016 than in 2015.
Crop exports rose 87% between 2006 and 2016 to $4.3 billion. The value of crop exports is heavily
influenced by local weather conditions and global prices (influenced by rising demand from
emerging markets and for bio-fuels). Exports of canola rose 177% over that period to $1.8 billion
and wheat exports (excluding durum wheat) rose 53% to $1.6 billion – both as a result of higher
prices and volumes. Other crops, such as peas, beans, lentils and potatoes, also had strong export
growth.
The value of livestock exports rose from $823 million in 2006 to $831 million in 2016. Live cattle
exports reached $623 million in 2016, compared with only $697 million in 2006. The value of hogs
slightly over the 10-year period to $54 million in 2016 mainly because of a decline in the average
weight per hog.
The largest market for Alberta’s agricultural products is the US, which accounted for 26% of
exports in 2016 (mainly cattle, wheat and canola). Other large customers include China (17% in
2016; canola, barley and wheat), Japan (13%; canola and wheat) and Mexico (7%) – canola is the
main commodity exported to these three countries.
Exports of unprocessed agricultural products fell 7.2% between 2015 and 2016 because of a 9.5%
decline in crop exports which was caused by sharply lower export volumes of wheat and barley.
Livestock exports rose 7.4% in 2016 on strong growth in live cattle volumes and a more than
doubling of volumes of honey (which is also part of this industry).

-6- November 29, 2017 Alberta’s International Exports by Industry
A 10-Year Review, 2006 to 2016
Manufacturing
After falling sharply in
2009 to a six-year low
of $17.9 billion,
manufacturing exports
rebounded by 36%
between 2009 and
2014 to $24.3 billion.
These exports declined
by 11% between 2014
and 2016 to $21.6
billion, only 5.7% higher
than the 2006 level of
$20.5 billion.
The chemical sector has maintained its number one spot throughout the entire period (Chart 5)
and food and beverages ranked second for most of the 11 years.
Chemicals
Starting in 2001 chemicals
became Alberta’s top
manufacturing sector on an
export basis and has retained
that position since then.
Between 2006 and 2016 the
chemicals sector accounted
for approximately one-third of
total manufacturing exports.
Exports of chemicals
increased by 12% between
2006 and 2016 to $7.9 billion.
It is estimated that about 40%
of the $854 million increase in value over that period was the result of higher volumes and that
higher prices accounted for 60% of the increase.
Exports of chemical products fell 3.4% between 2015 and 2016 because of steep declines in
exports of propylene, ethylene and diethylene glycol, and acyclic hydrocarbons.
The largest sub-sector is synthetic resins and fibres (Chart 6), such as polyethylene, that accounted
for more than one-half of chemical exports in 2016, followed by basic chemicals (petro-chemicals),
-7- November 29, 2017 Alberta’s International Exports by Industry
A 10-Year Review, 2006 to 2016
such as ethylene glycol, with a 31% share, and fertilizers, such as anhydrous ammonia, with a 15%
share.
Exports of synthetic resins rose 22% over the 2006 to 2016 period to $4.1 billion as volumes
increased 16% and prices rose about 6%. Export volumes were fairly stable between 2006 and
2014 due to a shortage of ethane feedstock but increased by 17% between 2014 and 2016 as
imports of ethane from the US have surged over the past few years. The largest commodities in
2016 were polyethylene ($1.5 billion) and other ethylene polymers ($2.4 billion).
Exports of basic chemicals fell by 11% between 2006 and 2016: they rose 21% between 2006 and
2014 to $3.3 billion as both prices and volumes increased; but tumbled 26% between 2014 and
2016 on lower prices. The largest commodities in 2016 were ethylene glycol ($1.2 billion), acyclic
hydrocarbons ($276 million) and styrene ($265 million). Exports of biodiesel have been surging,
rising from $4 million in 2012 to $186 million in 2016.
Exports of fertilizers rose 46% over the same period to $1.2 billion, as a result of much higher
prices; volumes fell about 3%. The largest commodities in 2016 were anhydrous ammonia ($690
million) and urea ($318 million).
The main destination of Alberta chemicals is the US, which accounted for 84% of exports in 2016.
Other large customers include China (10%) and Mexico (3%).
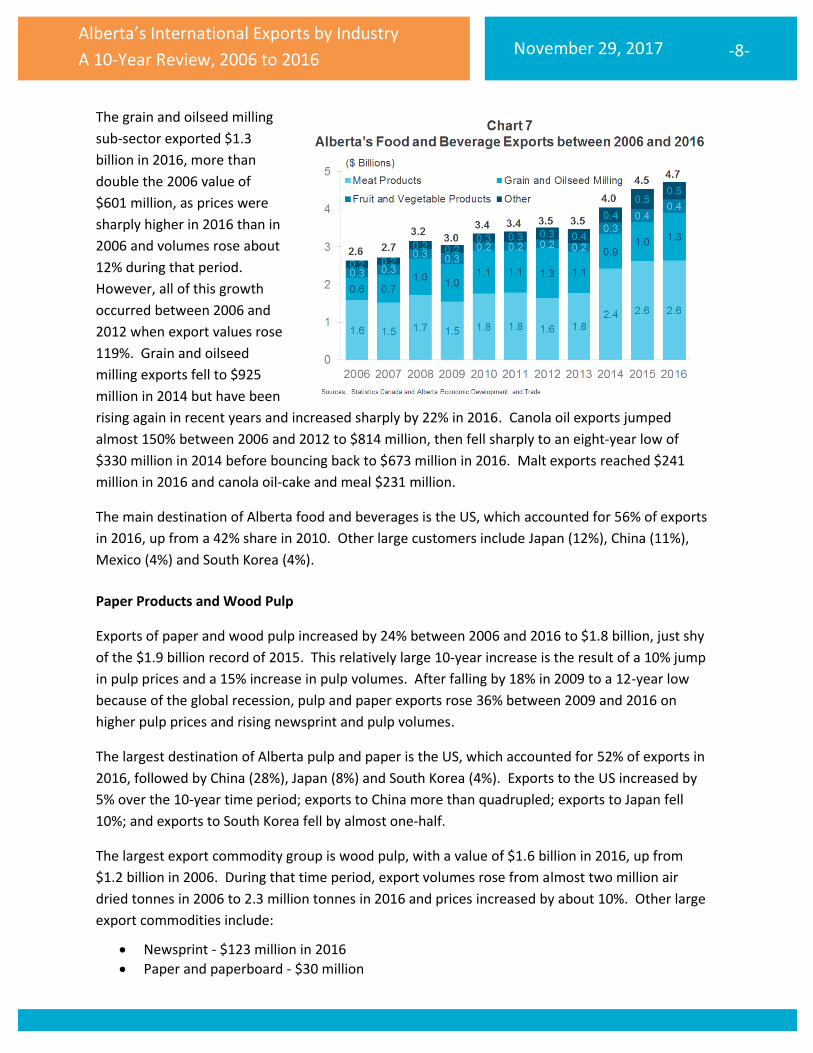
Food and Beverages
The processed food and beverages sector has been the fastest growing manufacturing sector
during the past decade: exports rose 80% between 2006 and 2016 to a record $4.7 billion, as
volumes rose 12% during that period while prices increased by about 60%. Half of the export
increase was registered during the past three years: they grew by 37% between 2013 and 2016 as
exports to the US, Alberta’s largest market for food and beverages, rose 54%. The strong
appreciation of the US dollar against the Canadian dollar explains about one-half of this recent
increase in exports to the US.
The largest sub-sector is meat products (Chart 7), which accounted for $2.6 billion or 56% of food
and beverage exports in 2016. Beef exports totaled $1.5 billion in 2016, a 73% increase from the
$857 million of 2006 as both volumes and prices were higher. Pork exports were valued at $445
million in 2016, virtually unchanged from both 2006 and 2015, as higher prices were offset by
lower volumes.
-8- November 29, 2017 Alberta’s International Exports by Industry
A 10-Year Review, 2006 to 2016
The grain and oilseed milling
sub-sector exported $1.3
billion in 2016, more than
double the 2006 value of
$601 million, as prices were
sharply higher in 2016 than in
2006 and volumes rose about
12% during that period.
However, all of this growth
occurred between 2006 and
2012 when export values rose
119%. Grain and oilseed
milling exports fell to $925
million in 2014 but have been
rising again in recent years and increased sharply by 22% in 2016. Canola oil exports jumped
almost 150% between 2006 and 2012 to $814 million, then fell sharply to an eight-year low of
$330 million in 2014 before bouncing back to $673 million in 2016. Malt exports reached $241
million in 2016 and canola oil-cake and meal $231 million.
The main destination of Alberta food and beverages is the US, which accounted for 56% of exports
in 2016, up from a 42% share in 2010. Other large customers include Japan (12%), China (11%),
Mexico (4%) and South Korea (4%).
Paper Products and Wood Pulp
Exports of paper and wood pulp increased by 24% between 2006 and 2016 to $1.8 billion, just shy
of the $1.9 billion record of 2015. This relatively large 10-year increase is the result of a 10% jump
in pulp prices and a 15% increase in pulp volumes. After falling by 18% in 2009 to a 12-year low
because of the global recession, pulp and paper exports rose 36% between 2009 and 2016 on
higher pulp prices and rising newsprint and pulp volumes.
The largest destination of Alberta pulp and paper is the US, which accounted for 52% of exports in
2016, followed by China (28%), Japan (8%) and South Korea (4%). Exports to the US increased by
5% over the 10-year time period; exports to China more than quadrupled; exports to Japan fell
10%; and exports to South Korea fell by almost one-half.
The largest export commodity group is wood pulp, with a value of $1.6 billion in 2016, up from
$1.2 billion in 2006. During that time period, export volumes rose from almost two million air
dried tonnes in 2006 to 2.3 million tonnes in 2016 and prices increased by about 10%. Other large
export commodities include:
Newsprint - $123 million in 2016
Paper and paperboard - $30 million

-9- November 29, 2017 Alberta’s International Exports by Industry
A 10-Year Review, 2006 to 2016
Sacks and bags - $29 million
Machinery
In Alberta, most of the
machinery produced and
exported is destined for the
oil and gas fields. Therefore,
this sector’s performance is
closely tied to oil and gas
prices which in turn impact
investment in machinery and
equipment by the oil and gas
sector. Exports of machinery
rose 55% between 2006 and
2014 but declined by 55%
between 2014 and 2016 to a
12-year low of $1.4 billion as oil and gas producers are cutting back on purchases of machinery and
of services from oil and gas service companies which purchase drilling and exploration machinery.
Machinery exports declined by 30% over the 10-year from 2006 to 2016.
The largest sub-sector is mining machinery, which is dominated by oil and gas related machinery in
Alberta. This sub-sector accounted for $362 million in exports in 2016, down from $821 million in
2014 and 53% less than the $639 million in 2006. The largest export commodity group is oil and
gas field boring and sinking machinery (including parts) with a value of $241 million in 2016, down
from $533 million in 2006. The next largest export commodity group is derricks and cranes
including parts ($68 million).
The second largest sub-sector in 2016 was general-purpose machinery with $431 million in
exports, a 32% decrease from the 2006 value of $636 million and sharply lower than the $1.1
billion that was exported in 2014. Pumps and parts for pumps (destined for the oil and gas fields)
are the largest commodity group in this sub-sector with $211 million in exports in 2016, down 65%
from 2014, followed by lifting, handling, loading or unloading machinery including parts (such as
well servicing rigs) at $141 million, also down 65% from 2014.
Exports of industrial machinery totaled $193 million in 2016, down from $548 million in 2014, and
one-third less than the $293 million that was exported in 2006. The largest commodity group is
machines and mechanical appliances with individual functions, mainly oil and gas field wireline and
down-hole equipment, with $168 million in exports in 2016.
The main destination of Alberta machinery is the US, which accounted for 67% of exports in 2016.
Other large customers include the United Arab Emirates and Australia (3% each in 2016).
-10- November 29, 2017 Alberta’s International Exports by Industry
A 10-Year Review, 2006 to 2016
Petroleum and Coal Products
Exports of refinery products grew by 10% between 2006 and 2016 to $1.2 billion: export volumes
increased by one-half during that period; prices declined by almost 25%. All of the volume growth
during that period was the result of surging volumes in 2015 of fuel oils such as bunker fuel and
gasoline. Volumes were little changed between 2015 and 2016. Prices rose steadily between the
end of the 2009 recession and 2014 but declined by close to one-half between 2014 and 2016
because of lower crude oil input costs.
The main destination of Alberta refinery products is the US, which accounted for 87% of exports in
2016, followed by Peru (5%) and Japan (3%). The US share was relatively stable over the 2006 –
2015 period, averaging 94% per year, but declined to 87% in 2016.
The largest export commodity group is petroleum oils and oils obtained from bituminous minerals,
such as motor gasoline, diesel fuel and other fuel oils, with a value of $875 million in 2016, down
from $1.2 billion in 2015 and up from $684 million in 2006. Other large export commodities
include:
Petroleum bitumen (not raw bitumen but the refined product primarily used for asphalt) - $141 million in 2016
Liquefied propylene and butadiene - $118 million
Petroleum coke - $94 million
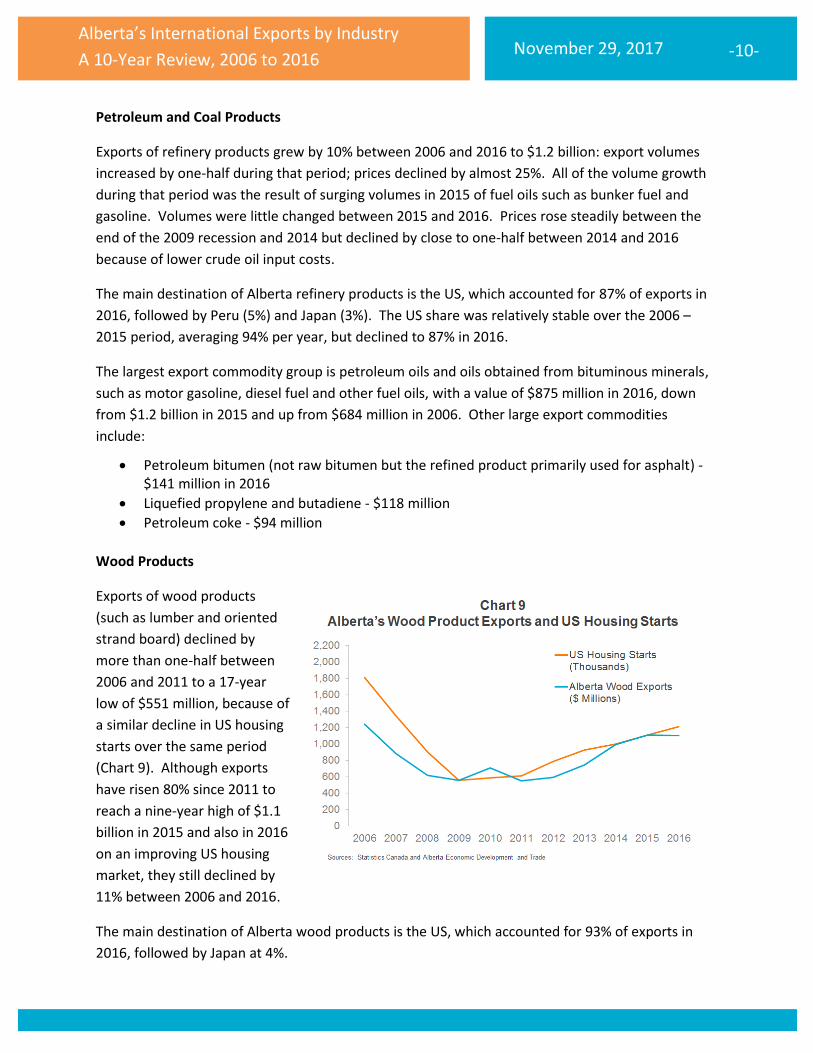
Wood Products
Exports of wood products
(such as lumber and oriented
strand board) declined by
more than one-half between
2006 and 2011 to a 17-year
low of $551 million, because of
a similar decline in US housing
starts over the same period
(Chart 9). Although exports
have risen 80% since 2011 to
reach a nine-year high of $1.1
billion in 2015 and also in 2016
on an improving US housing
market, they still declined by
11% between 2006 and 2016.
The main destination of Alberta wood products is the US, which accounted for 93% of exports in
2016, followed by Japan at 4%.

-11- November 29, 2017 Alberta’s International Exports by Industry
A 10-Year Review, 2006 to 2016
The largest sub-sector is sawmills and wood preservation, with a value of $594 million in 2016,
down 12% from 2014, but 13% higher than the 2006 value of $524 million. Lumber volumes fell by
15% between 2006 and 2016 and lumber prices increased by 37%. Lumber prices reached a 12-
year high in 2016 but volumes were 22% lower in 2016 than in 2015.
Exports of the veneer, plywood and engineered wood products sub-sector have been very volatile
during the 10-year period, tumbling from $590 million in 2006 to $106 million in 2011. In 2016,
the sub-sector’s exports grew strongly by 23% from the previous year to $478 million. Volumes of
oriented strand board (osb) declined by more than 81% between 2006 and 2012, but have risen
more than 400% since then. Prices have risen strongly since the 2008-2009 recession and reached
an 11-year high in 2016.
The sector’s largest export commodities in 2016 include:
Lumber - $594 million
Oriented strand board (osb) - $428 million
Medium density fibreboard (mdf) - $41 million
Primary Metals
Exports of primary metals (such as nickel and steel pipes) totaled $881 million in 2016, down from
$1.1 billion in 2015 and down 42% from the $1.5 billion registered in 2006. These exports peaked
at $2.3 billion in 2007, but then declined by more than one-half between 2007 and 2009 because
of plunging nickel and cobalt5 prices, and have remained weak since then as nickel prices fell to a
14-year low in 2016 and because of plummeting orders from a number of markets such as China
and the Netherlands.
The top two destinations of Alberta primary metals are the US and the Netherlands, which
accounted for 30% and 21%, respectively, of 2016 exports. Other major markets include Japan
(12%) and China (11%).
The largest export commodity group is nickel products, with a value of $458 million in 2016, down
from $869 million in 2006. During that time period, export volumes rose from about 31.3 million
kilograms in 2006 to 33.6 million in 2016 while prices dropped by more than one-half. Nickel
prices fell by more than one-half between 2007 and 2016, for instance the price of unwrought
nickel fell from $38 per kg in 2007 to a 14-year low of $13 per kg in 2016. Other large export
commodities include:
Cobalt - $156 million in 2016
Line pipe for oil or gas pipelines - $93 million
Bars and rods of steel - $73 million
5 Nickel and cobalt ores are imported from Cuba and then refined in Alberta and most of it is then exported.

-12- November 29, 2017 Alberta’s International Exports by Industry
A 10-Year Review, 2006 to 2016
Transportation Equipment
Exports of transportation equipment (primarily aerospace equipment) increased by 37% between
2006 and 2016 to $718 million, although these exports did decline by 14% between 2015 and
2016. This strong 10-year increase is primarily the result of large increases in exports of turbo
propellers and jets, from $237 million in 2006 to $403 million in 2016, and of motor trucks.
The main destination of Alberta transportation equipment is the US, which accounted for 67% of
exports in 2016. Other markets include China (12%), Switzerland (5%) and France (3%).
The largest export commodity group is turbo propellers and jets, followed by:
Motor vehicle parts - $99 million
Motor trucks - $97 million
Special purpose motor vehicles (for the oil and gas sector) - $47 million
Computer and Electronic Products
Prior to 2006, communications equipment dominated Alberta’s computer and electronics exports,
mainly because of the presence of NorTel in the province. However, this sector’s exports have
declined sharply, both because of the tech bust that took place after 2000 and NorTel’s pulling out
of the province. Exports of electronics peaked in 2000 at $4.5 billion, making it manufacturing’s
largest sector on an export basis in that year. Exports declined steadily since 2000 to $1.3 billion in
2006 and to a low of $547 million in 2016.
The main destination of Alberta’s electronics is the US, which accounted for 55% of exports in
2016. Other markets include China (8%) and Switzerland and the United Arab Emirates (4% each).
Back in 2006, $604 million or almost one-half of this sector’s $1.3 billion exports were of
telecommunication equipment (such as transmission equipment). Telecom exports now total
about $65 million, down from $93 million in 2015.
The largest export commodities in 2016 include:
Radar apparatus and radio navigational aid apparatus - $89 million
Surveying or geophysical instruments - $75 million
Instruments and apparatus for physical or chemical analysis (for instance gas or smoke analysis apparatus) - $72 million
Telecom equipment - $65 million
Other measuring or checking instruments, appliances and machines - $68 million
Fabricated Metals
Exports of fabricated metals (primarily iron and steel products, such as taps, cocks and valves for
oil and gas fields) fell 16% between 2006 and 2016 to an 11-year low of $503 million. After
reaching a record $806 million in 2014, fabricated metals exports dropped by 22% in 2015 and by a

-13- November 29, 2017 Alberta’s International Exports by Industry
A 10-Year Review, 2006 to 2016
further 20% in 2016 because of weak demand from international oil and gas producers and service
companies.
The main destination of Alberta fabricated metals is the US, which accounted for 64% of exports in
2016. Other markets include Algeria (4%), Kuwait (3%) and the United Kingdom (2%).
The largest export commodity group is taps, cocks, valves and similar appliances (including parts),
with a value of $208 million in 2016, down from $347 million in 2014 and slightly lower than the
$216 million in export sales in 2016. Other large export commodities include:
Miscellaneous articles of iron and steel (such as casing heads and supports for tubes or pipes) - $81 million
Tube or pipe fittings, of iron or steel - $33 million
Springs and leaves (for springs) - $29 million
Structures and parts of structures, of iron or steel - $27 million
Reservoirs, tanks, vats and similar containers, of iron or steel - $24 million
Other Manufacturing
Some of the largest export commodities not included in the above categories are:
Metal furniture - $118 million in 2016
Fibreglass insulation - $66 million
Plastic tubes, fittings and pipes and hoses - $65 million
Plastic sacks and bags and other packing materials - $51 million
Plastic plates, sheets, film, foil and strip - $48 million
Boards, panels and other bases for electric control or the distribution of electricity - $44 million
Alberta’s Export Performance in 2017 Alberta exports have rebounded sharply in 2017 (Chart 10): exports totaled $74.3 billion during the first nine months of 2017, an increase of 32% from the same period of 2016. This increase is also mainly the result of the oil and gas sector which has seen prices rise 28% this year and volumes 12%. Alberta exports of commodities other than oil and gas are also increasing this year albeit at a lower rate of 14%. For instance, exports of refined petroleum products, such as diesel fuel, increased 57% in the first nine months and lumber and canola oil rose 80% and 59%, respectively.
-14- November 29, 2017 Alberta’s International Exports by Industry
A 10-Year Review, 2006 to 2016
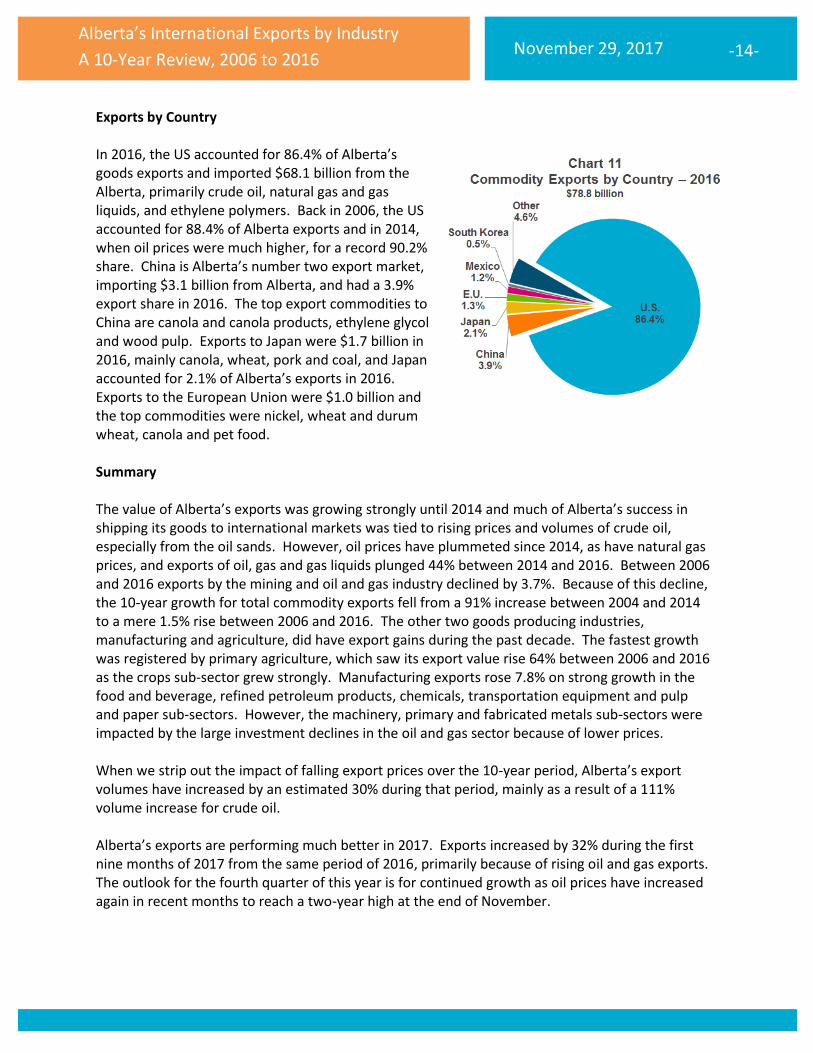
Exports by Country In 2016, the US accounted for 86.4% of Alberta’s goods exports and imported $68.1 billion from the Alberta, primarily crude oil, natural gas and gas liquids, and ethylene polymers. Back in 2006, the US accounted for 88.4% of Alberta exports and in 2014, when oil prices were much higher, for a record 90.2% share. China is Alberta’s number two export market, importing $3.1 billion from Alberta, and had a 3.9% export share in 2016. The top export commodities to China are canola and canola products, ethylene glycol and wood pulp. Exports to Japan were $1.7 billion in 2016, mainly canola, wheat, pork and coal, and Japan accounted for 2.1% of Alberta’s exports in 2016. Exports to the European Union were $1.0 billion and the top commodities were nickel, wheat and durum wheat, canola and pet food. Summary The value of Alberta’s exports was growing strongly until 2014 and much of Alberta’s success in shipping its goods to international markets was tied to rising prices and volumes of crude oil, especially from the oil sands. However, oil prices have plummeted since 2014, as have natural gas prices, and exports of oil, gas and gas liquids plunged 44% between 2014 and 2016. Between 2006 and 2016 exports by the mining and oil and gas industry declined by 3.7%. Because of this decline, the 10-year growth for total commodity exports fell from a 91% increase between 2004 and 2014 to a mere 1.5% rise between 2006 and 2016. The other two goods producing industries, manufacturing and agriculture, did have export gains during the past decade. The fastest growth was registered by primary agriculture, which saw its export value rise 64% between 2006 and 2016 as the crops sub-sector grew strongly. Manufacturing exports rose 7.8% on strong growth in the food and beverage, refined petroleum products, chemicals, transportation equipment and pulp and paper sub-sectors. However, the machinery, primary and fabricated metals sub-sectors were impacted by the large investment declines in the oil and gas sector because of lower prices. When we strip out the impact of falling export prices over the 10-year period, Alberta’s export volumes have increased by an estimated 30% during that period, mainly as a result of a 111% volume increase for crude oil. Alberta’s exports are performing much better in 2017. Exports increased by 32% during the first nine months of 2017 from the same period of 2016, primarily because of rising oil and gas exports. The outlook for the fourth quarter of this year is for continued growth as oil prices have increased again in recent months to reach a two-year high at the end of November.

-15- November 29, 2017 Alberta’s International Exports by Industry
A 10-Year Review, 2006 to 2016
Alberta International Exports by Industry
EXPORTS
By Industry ($Millions) 2006 2011 2012 2013 2014 2015 2016
%Change
2006-2016
%Change
2015-2016
Primary Agriculture 3,114.7 4,595.6 5,620.5 5,165.7 5,599.6 5,507.7 5,112.8 64.2% -7.2%
Crops 2,292.1 4,017.4 4,907.7 4,541.2 4,688.3 4,733.6 4,281.7 86.8% -9.5%
Livestock 822.6 578.2 712.9 624.5 911.3 774.1 831.1 1.0% 7.4%
Primary Forestry
FishinTrapping
3.7 3.2 2.6 2.7 2.9 3.3 2.8 -24.2% -15.6%
Mining & Energy 53,202.0 65,901.6 67,357.9 75,339.3 90,839.6 62,145.4 51,229.0 -3.7% -17.6%
Crude Oil 26,942.3 51,990.0 57,950.4 64,440.8 76,025.9 52,567.0 43,336.5 60.8% -17.6%
Natural Gas & Natural Gas
Liquids
25,492.7 12,332.3 8,408.5 9,977.3 14,068.8 8,892.8 7,401.3 -71.0% -16.8%
Coal 319.5 886.4 661.8 645.1 443.6 290.6 196.6 -38.5% -32.3%
Sulphur 390.0 638.2 273.0 219.8 229.5 303.5 197.9 -49.3% -34.8%
Other Mining & Energy 57.5 54.7 64.4 56.4 71.8 91.4 96.7 68.2% 5.7%
Manufacturing 20,489.9 22,019.2 21,338.3 21,788.0 24,275.6 23,868.5 21,649.8 5.7% -9.3%
Chemicals 7,073.0 7,233.5 6,601.1 7,584.4 8,409.1 8,203.3 7,926.6 12.1% -3.4%
Food, Feed & Beverages 2,635.9 3,412.6 3,513.3 3,467.2 4,051.1 4,541.3 4,732.8 79.6% 4.2%
Machinery 2,026.5 3,252.6 3,292.8 2,902.4 3,147.6 2,434.8 1,423.9 -29.7% -41.5%
Paper Products & Wood Pulp 1,415.7 1,476.9 1,549.0 1,600.6 1,707.9 1,884.2 1,754.2 23.9% -6.9%
Petroleum & Coal Products 1,132.2 2,000.9 1,785.4 1,510.1 1,628.7 1,634.8 1,249.5 10.4% -23.6%
Wood Products 1,244.0 551.3 590.5 743.1 989.8 1,107.4 1,104.4 -11.2% -0.3%
Primary Metal Products 1,513.5 1,473.3 1,208.0 1,072.8 1,134.2 1,085.9 881.1 -41.8% -18.9%
Transportation Equipment 523.9 553.4 568.4 687.2 807.9 838.8 718.2 37.1% -14.4%
Electronic Products 1,320.6 603.4 674.9 705.9 675.1 650.3 547.4 -58.6% -15.8%
Fabricated Metal Products 596.5 683.7 782.3 684.6 806.1 629.8 503.3 -15.6% -20.1%
Plastics & Rubber Products 212.2 245.0 282.3 312.7 313.9 247.3 250.3 17.9% 1.2%
Electrical Equipment 235.5 251.2 218.6 244.9 282.7 239.5 189.4 -19.6% -21.0%
Non-Metal Mineral Products 140.3 93.5 81.7 82.6 127.3 156.4 154.1 9.8% -1.5%
Furniture & Related Products 214.8 82.2 88.4 82.6 104.5 132.7 147.2 -31.5% 10.9%
Other Manufacturing 205.4 105.7 101.6 107.0 89.7 82.1 67.7 -67.1% -17.5%
Other Exports 933.5 697.1 729.1 717.9 863.0 916.0 933.9 0.0% 2.0%
Total Goods Exports 77,743.9 93,216.8 95,048.4 103,013.7 121,580.7 92,440.9 78,928.2 1.5% -14.6%
Source: Statistics Canada. Industry aggregations by Alberta Economic Development and Trade.