alberta traffic collision statistics 2015 · table 3.2 age of casualties 2015 ... 15 table 4.1 age...
TRANSCRIPT
Alberta
Traffic Collision Statistics
2015


Alberta
Traffic Collision Statistics
2015
For further information contact: Alberta Transportation Office of Traffic Safety
Main Floor, Twin Atria Building 4999 – 98 Avenue
Edmonton, Alberta T6B 2X3 780-427-8901
www.transportation.alberta.ca


2015 Overview
Alberta Traffic Collision Statistics 2015 Page i
2015 Overview
The number of traffic fatalities decreased 10.6% over the past year from 369 fatalities in 2014 to 330 in 2015.
The number of traffic injuries decreased 4.5% over the past year from 18,745 injuries in 2014 to 17,907 in 2015.
The number of traffic collisions decreased 2.8% over the past year from 144,740 collisions in 2014 to 140,705 in 2015.
The highest number of fatal collisions occurred in July. The highest number of injury collisions occurred in October.
Friday was the most collision-prone day of the week.
The most collision-prone period of time was the afternoon rush hour.
Casualty rates were highest for persons between the ages of 15 and 24.
Male drivers between the ages of 18 and 19 had the highest involvement rate of all drivers involved in casualty collisions.
Following too closely, running off the road and left turn across path were the most frequently identified improper driver actions contributing to casualty collisions.
Fatal collisions occurred most frequently in rural areas, whereas injury and property damage collisions occurred more frequently in urban areas.
21.7% of pedestrians involved in fatal collisions had consumed alcohol prior to the collision compared to 10.2% of pedestrians in injury collisions.
19.8% of drivers involved in fatal collisions had consumed alcohol prior to the crash compared to 3.1% of drivers in injury collisions.
Collision-involved restraint users had a much lower injury rate (6.8%) than those not using restraints (22.4%)

2015 Overview
Alberta Traffic Collision Statistics 2015 Page ii

Preface
Alberta Traffic Collision Statistics 2015 Page iii
Preface The purpose of this report is to provide an overview of the “who”, “what”, “when”, “where”, “why”,
and “how” of traffic collisions which occurred in Alberta during 2015. Although the report is general in nature, it pays particular attention to casualty collisions, that is, those collisions which result in death or injury. Legislation in Alberta requires that a traffic collision, which results in death, injury, or property damage to an apparent extent of $2000.00 or more, be reported immediately to an authorized peace officer. The officer completes a standardized collision report form which provides information on various aspects of the traffic collision. This report is based on the data collected from these report forms.
The collision report form is issued with standard instructions to every police service within Alberta,
to be completed by the officer attending the scene of a motor vehicle collision or at a police station. Police priorities at the scene of a collision are to care for the injured, protect the motoring public, complete an on-scene investigation and clear the roadway. Completion of the collision report form is a secondary, but necessary, task.
After completion, the information on the collision report form is coded for input to computer files.
The Alberta Collision Information System, which has been operational since 1978, undergoes several manual and computerized inspections each year in order to ensure maximum accuracy of the final data output. This collision information is used to make Alberta’s roads safer for all road users. Due to continuing police investigation, some numbers presented in this report may be subject to revision. It should also be noted that not all percentage columns will total 100 due to rounding error.
This report was produced based on collisions reported to Alberta Transportation by police, at the
time of printing. The numbers presented in this report will not be updated. However, the patterns and trends detailed in this report represent an accurate description of Alberta’s traffic collision picture.

Preface
Alberta Traffic Collision Statistics 2015 Page iv
Table of Contents
Alberta Traffic Collision Statistics 2015 Page v
Table of Contents
Page
2015 Overview ......................................................................................................................................... i Preface ................................................................................................................................................... iii List of Tables ......................................................................................................................................... vii List of Figures ......................................................................................................................................... ix Glossary ................................................................................................................................................. xi 2015 Traffic Collision Summary .............................................................................................................. 1 When the Collisions Occurred................................................................................................................. 7 Victims ................................................................................................................................................... 13 Drivers ................................................................................................................................................... 17 Vehicles ................................................................................................................................................. 21 Environment .......................................................................................................................................... 25 Special Types of Vehicles Motorcycles ................................................................................................................................. 29 Truck Tractors ............................................................................................................................. 39 Trains ........................................................................................................................................... 45 Pedestrians ........................................................................................................................................... 49 Bicyclists ................................................................................................................................................ 59 Traffic Safety Issues Alcohol Involvement .................................................................................................................... 67 Restraint Use ............................................................................................................................... 77

Table of Contents
Alberta Traffic Collision Statistics 2015 Page vi

List of Tables
Alberta Traffic Collision Statistics 2015 Page vii
List of Tables
Page
Table 1.1 Alberta Traffic Collisions 2011 - 2015 ........................................................................... 2
Table 1.2 Traffic Collision Rates 2011 - 2015 ............................................................................... 3
Table 1.3 Provincial Comparison of Casualty Rates Per Billion Vehicle Kilometres Travelled 2010 - 2014 ................................................... 5
Table 2.1 Collision Occurrence by Month 2015 ............................................................................ 8
Table 2.2 Collision Occurrence by Day of Week 2015 ................................................................. 9
Table 2.3 Collision Occurrence by Time Period 2015 ................................................................ 10
Table 2.4 Collisions During 2015 Holidays ................................................................................. 12
Table 3.1 Injuries and Fatalities by Road User Class 2015 ........................................................ 14
Table 3.2 Age of Casualties 2015 ............................................................................................... 15
Table 4.1 Age and Sex of Drivers Involved in Casualty Collisions: Per 1,000 Licenced Drivers 2015 ................................................................................ 18
Table 4.2 Improper Actions of Drivers Involved in Casualty Collisions 2015 ............................. 20
Table 5.1 Types of Vehicles Involved in Casualty Collisions 2015 ............................................. 22
Table 5.2 Vehicle Factors Involved in Casualty Collisions 2015 ................................................ 23
Table 5.3 Point of Impact on Vehicles Involved in Casualty Collisions 2015 ............................. 24
Table 6.1 Location of Collisions 2015 ......................................................................................... 26
Table 6.2 Casualty Collision Occurrence by Surface Condition 2015 ........................................ 27
Table 7.1 Motorcycles Involved in Casualty Collisions 2011 - 2015 ........................................... 30
Table 7.2 Age and Sex of Motorcycle Operators Involved in Casualty Collisions 2015 ............. 32
Table 7.3 Improper Actions of Motorcycle Operators Involved in Casualty Collisions 2015 ...... 33
Table 7.4 Condition of Motorcycle Operators Involved in Casualty Collisions 2015 .................. 34
Table 7.5 Motorcycle Vehicle Factors in Casualty Collisions 2015 ............................................ 35
Table 7.6 Casualty Collisions Involving Motorcycles: Month of Occurrence 2015 .................... 36
Table 7.7 Casualty Collisions Involving Motorcycles: Road Surface Condition 2015 ................ 37

List of Tables
Alberta Traffic Collision Statistics 2015 Page viii
Table 7.8 Truck Tractors Involved in Casualty Collisions 2011 - 2015 ....................................... 40
Table 7.9 Improper Actions of Truck Tractor Drivers Involved in Casualty Collisions 2015 ....... 41 Table 7.10 Condition of Truck Tractor Drivers Involved in Casualty Collisions 2015 ................... 42 Table 7.11 Vehicle Factors of Truck Tractors Involved in Casualty Collisions 2015 .................... 43 Table 7.12 Casualty Collisions Involving Truck Tractors: Month of Occurrence 2015 ................ 44
Table 7.13 Trains Involved in Casualty Collisions 2011 - 2015 .................................................... 46
Table 7.14 Casualty Collisions Involving Trains: Month of Occurrence 2015 ............................. 47
Table 7.15 Actions of Drivers Involved in Casualty Collisions with Trains 2015 .......................... 48
Table 8.1 Casualty Collisions Involving Pedestrians: Month of Occurrence 2015 .................... 50
Table 8.2 Casualty Collisions Involving Pedestrians: Day of Week 2015 ................................. 51
Table 8.3 Casualty Collisions Involving Pedestrians: Time Period 2015 ................................... 52
Table 8.4 Casualty Collisions Involving Pedestrians: Location 2015......................................... 53
Table 8.5 Actions of Drivers Involved in Casualty Collisions with Pedestrians 2015 ................. 54
Table 8.6 Age of Pedestrian Casualties 2015 ............................................................................. 55
Table 8.7 Condition of Pedestrians Involved in Casualty Collisions 2015 .................................. 57
Table 8.8 Age of Drinking Pedestrians Involved in Casualty Collisions 2015 ........................... 58
Table 9.1 Casualty Collisions Involving Bicycles: Month of Occurrence 2015 .......................... 60
Table 9.2 Casualty Collisions Involving Bicycles: Day of Week 2015 ....................................... 61
Table 9.3 Casualty Collisions Involving Bicycles: Time Period 2015......................................... 62
Table 9.4 Age of Bicyclist Casualties 2015 ................................................................................. 63
Table 9.5 Improper Actions of Bicyclists Involved in Casualty Collisions 2015 .......................... 64
Table 9.6 Condition of Bicyclists Involved in Casualty Collisions 2015 ...................................... 65
Table 10.1 Condition of Drivers in Casualty Collisions 2015 ........................................................ 68
Table 10.2 Age and Sex of Drinking Drivers in Casualty Collisions 2015 .................................... 71
Table 10.3 Alcohol-Involved Casualty Collisions: Month of Occurrence 2015 ............................ 73
Table 10.4 Alcohol-Involved Casualty Collisions: Day of Week 2015 ......................................... 74
Table 10.5 Alcohol-Involved Casualty Collisions: Time Period 2015 ........................................... 75
Table 10.6 Restraint Use of Vehicle Occupants and Injury Severity 2015 (Use vs. Non-Use) .... 78

List of Figures
Alberta Traffic Collision Statistics 2015 Page ix
List of Figures
Page
Figure 1 Alberta Traffic Collision Rates Per 10,000 Population 2011 - 2015 ................................... 4
Figure 2 Traffic Fatality Rates per Billion Vehicle Kilometres Travelled 2010 - 2014 ....................... 6
Figure 3 Collision Occurrence by Month/Day of Week/Time Period 2015 ...................................... 11
Figure 4 Age of Casualties 2015 ..................................................................................................... 16
Figure 5 Age and Sex of Drivers Involved in Casualty Collisions 2015 .......................................... 19
Figure 6 Number of Motorcycles Involved in Fatal Collisions 2011 - 2015 ..................................... 31
Figure 7 Pedestrian Casualties 2015 .............................................................................................. 56
Figure 8 Involvement of Drinking Drivers in Casualty Collisions 2011 - 2015 ................................ 69
Figure 9 Driver Condition in Casualty Collisions 2015 .................................................................... 70
Figure 10 Drinking Drivers Involved in Casualty Collisions 2015 ...................................................... 72
Figure 11 Alcohol-Involved Casualty Collisions by Month/Day of Week/Time Period 2015 ............. 76

List of Figures
Alberta Traffic Collision Statistics 2015 Page x

Glossary
Alberta Traffic Collision Statistics 2015 Page xi
Glossary Alcohol Impaired – In the judgment of the police officer, driving ability was impaired by alcohol
consumption. Whether or not the subject was actually charged is not taken into consideration by the collision report form.
Casualty Collision – A vehicle collision which results in either a fatal or personal injury. Drinking Driver – Refers to those drivers judged by the police officer as having been drinking prior to the
collision or as being alcohol impaired at the time of the collision. Whether or not the driver was actually charged is not taken into consideration by the collision report form.
Fatality – A fatality is the death of a person that occurs as a result of a motor vehicle collision within 30
days of the collision. Had Been Drinking – In the judgment of the police officer, the driver had recently consumed alcohol but
his driving ability was not obviously impaired. Major Injury – Persons with injuries or complaints of pain who went to the hospital and were
subsequently admitted, even if for observation only. Minor Injury – Persons with injuries or complaints of pain that went to the hospital, were treated in
emergency (or refused treatment) and SENT HOME without ever being admitted to the hospital. (Also includes people who indicated that they intended to seek medical treatment.)
Motorcyclist – Refers to drivers and passengers of motorcycles. Occupant Casualties – Refers to people who were injured or killed as a result of a vehicle collision and
were identified as being either a vehicle driver or passenger. Property Damage – A vehicle collision which resulted in property damage exceeding $2000.00. Reportable Collision – A vehicle collision which resulted in death, injury or property damage greater
than $2000.00. Rural – Any area outside of what is defined as “Urban”. Urban – Any area within the corporate boundaries of a city, town, village or hamlet.

Glossary
Alberta Traffic Collision Statistics 2015 Page xii
2015 Traffic Collision Summary
Alberta Traffic Collision Statistics 2015 Page 1
2015 Traffic Collision Summary
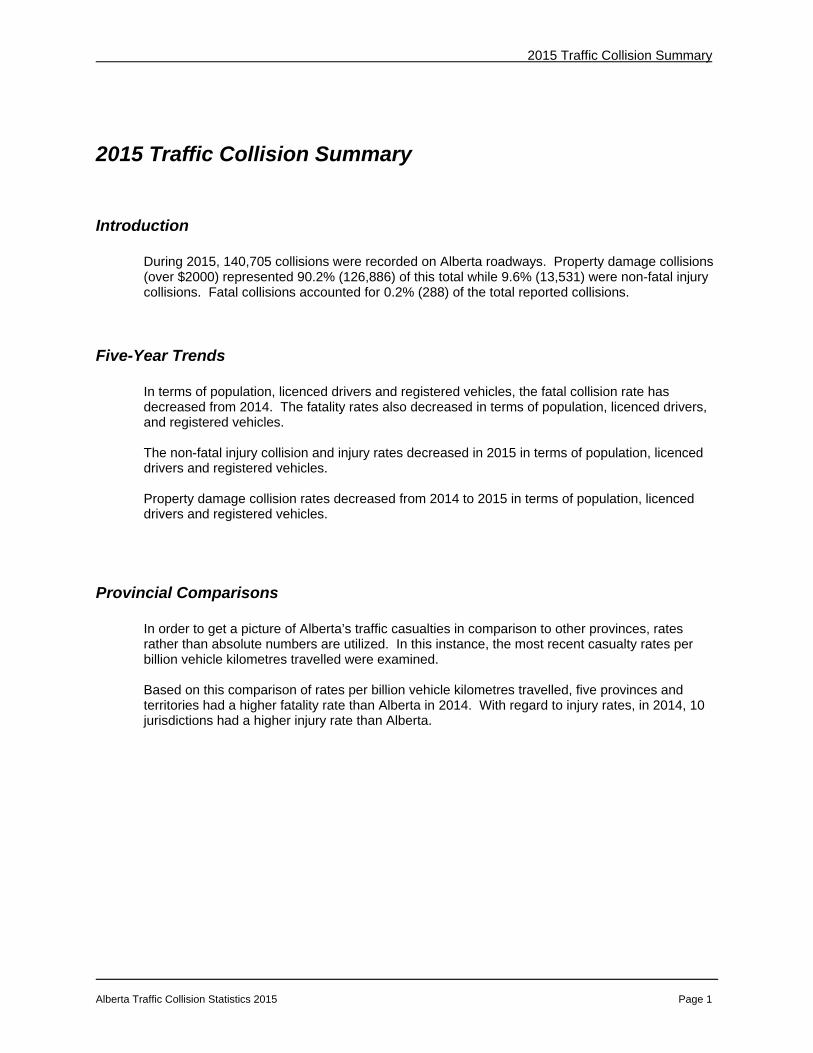
Introduction During 2015, 140,705 collisions were recorded on Alberta roadways. Property damage collisions
(over $2000) represented 90.2% (126,886) of this total while 9.6% (13,531) were non-fatal injury collisions. Fatal collisions accounted for 0.2% (288) of the total reported collisions.
Five-Year Trends In terms of population, licenced drivers and registered vehicles, the fatal collision rate has
decreased from 2014. The fatality rates also decreased in terms of population, licenced drivers, and registered vehicles.
The non-fatal injury collision and injury rates decreased in 2015 in terms of population, licenced
drivers and registered vehicles. Property damage collision rates decreased from 2014 to 2015 in terms of population, licenced
drivers and registered vehicles.
Provincial Comparisons In order to get a picture of Alberta’s traffic casualties in comparison to other provinces, rates
rather than absolute numbers are utilized. In this instance, the most recent casualty rates per billion vehicle kilometres travelled were examined.
Based on this comparison of rates per billion vehicle kilometres travelled, five provinces and
territories had a higher fatality rate than Alberta in 2014. With regard to injury rates, in 2014, 10 jurisdictions had a higher injury rate than Alberta.

2015 Traffic Collision Summary
Alberta Traffic Collision Statistics 2015 Page 2
Table 1.1 Alberta Traffic Collisions 2011 – 2015
Observations In 2015, the overall number of collisions decreased 2.8% when compared to 2014. In 2015, injury collisions decreased by 5.0% and fatal crashes decreased by 12.2%. The number of fatalities decreased by 10.6% from 2014 to 2015 and the number of injuries decreased by 4.5%. In terms of the past five years, overall collisions were lowest in 2012 and highest in 2014.
Severity of Collisions 2015 2014 2013 2012 2011
Fatal Collisions 288 328 331 307 285
Non-Fatal Injury Collisions 13531 14244 14073 13822 13909
Property Damage Collisions 126886 130168 127234 122466 124985
Total Reportable Collisions 140705 144740 141638 136595 139179
Number Killed 330 369 358 345 313
Number Injured 17907 18745 18650 18220 18584
Total Number of Casualties 18237 19114 19008 18565 18897

2015 Traffic Collision Summary
Alberta Traffic Collision Statistics 2015 Page 3
Table 1.2 Traffic Collision Rates 2011 – 2015
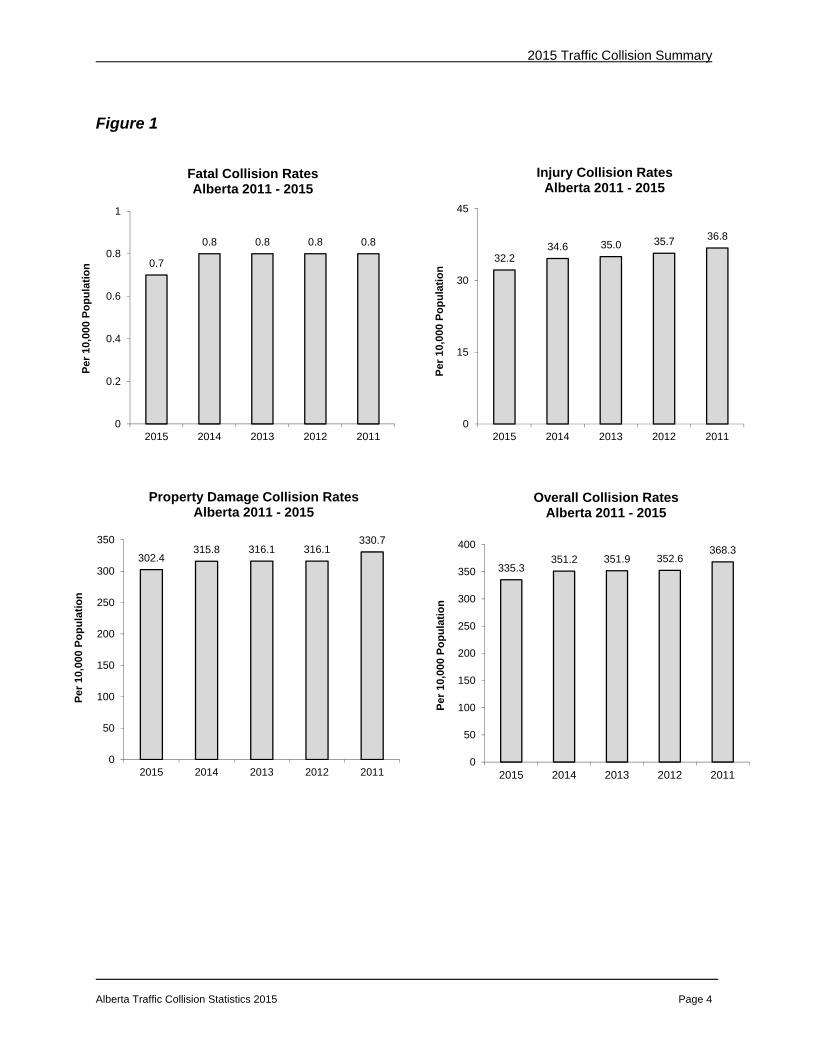
Observations In terms of population, licenced drivers and registered vehicles the fatal collision rate has
decreased from 2014 to 2015. The fatality rates also decreased in terms of population, licenced drivers, and registered vehicles.
The non-fatal injury collision and injury rates decreased in terms of population, licenced drivers
and registered vehicles. Property damage collision rates decreased from 2014 to 2015 in terms of population, licenced
drivers and registered vehicles. Sources: Population – Statistics Canada as of July 1, 2015 Licenced Drivers – Service Alberta – Registries Services, as of December 31, 2015 Registered Vehicles – Service Alberta – Registries Services, as of December 31, 2015
Severity of Collision 2015 2014 2013 2012 2011 2015 2014 2013 2012 2011 2015 2014 2013 2012 2011
Fatal Collisions 0.7 0.8 0.8 0.8 0.8 0.9 1.1 1.1 1.1 1.0 0.8 0.9 1.0 0.9 0.9
Number Killed 0.8 0.9 0.9 0.9 0.8 1.1 1.2 1.2 1.2 1.1 0.9 1.0 1.0 1.0 1.0
Non-Fatal InjuryCollisions 32.2 34.6 35.0 35.7 36.8 43.3 46.6 47.4 47.9 49.2 37.1 39.5 40.5 41.3 43.2
Number Injured 42.7 45.5 46.3 47.0 49.2 57.3 61.3 62.8 63.1 65.8 49.1 52.0 53.6 54.4 57.7
Property DamageCollisions 302.4 315.8 316.1 316.1 330.7 405.8 425.7 428.7 424.1 442.3 347.9 360.8 366.0 365.8 388.0
Total ReportableCollisions 335.3 351.2 351.9 352.6 368.3 450.0 473.4 477.2 473.0 492.6 385.8 401.2 407.4 408.0 432.1
Rate Per 10,000Population
Rate Per 10,000Licenced Drivers
Rate Per 10,000Registered Vehicles
2015 Traffic Collision Summary
Alberta Traffic Collision Statistics 2015 Page 4
Figure 1
0.7
0.8 0.8 0.8 0.8
0
0.2
0.4
0.6
0.8
1
2015 2014 2013 2012 2011
Per
10,
000
Po
pu
lati
on
Fatal Collision Rates Alberta 2011 - 2015
32.234.6 35.0 35.7 36.8
0
15
30
45
2015 2014 2013 2012 2011P
er 1
0,00
0 P
op
ula
tio
n
Injury Collision Rates Alberta 2011 - 2015
302.4315.8 316.1 316.1
330.7
0
50
100
150
200
250
300
350
2015 2014 2013 2012 2011
Per
10,
000
Po
pu
lati
on
Property Damage Collision Rates Alberta 2011 - 2015
335.3351.2 351.9 352.6
368.3
0
50
100
150
200
250
300
350
400
2015 2014 2013 2012 2011
Per
10,
000
Po
pu
lati
on
Overall Collision RatesAlberta 2011 - 2015
2015 Traffic Collision Summary
Alberta Traffic Collision Statistics 2015 Page 5
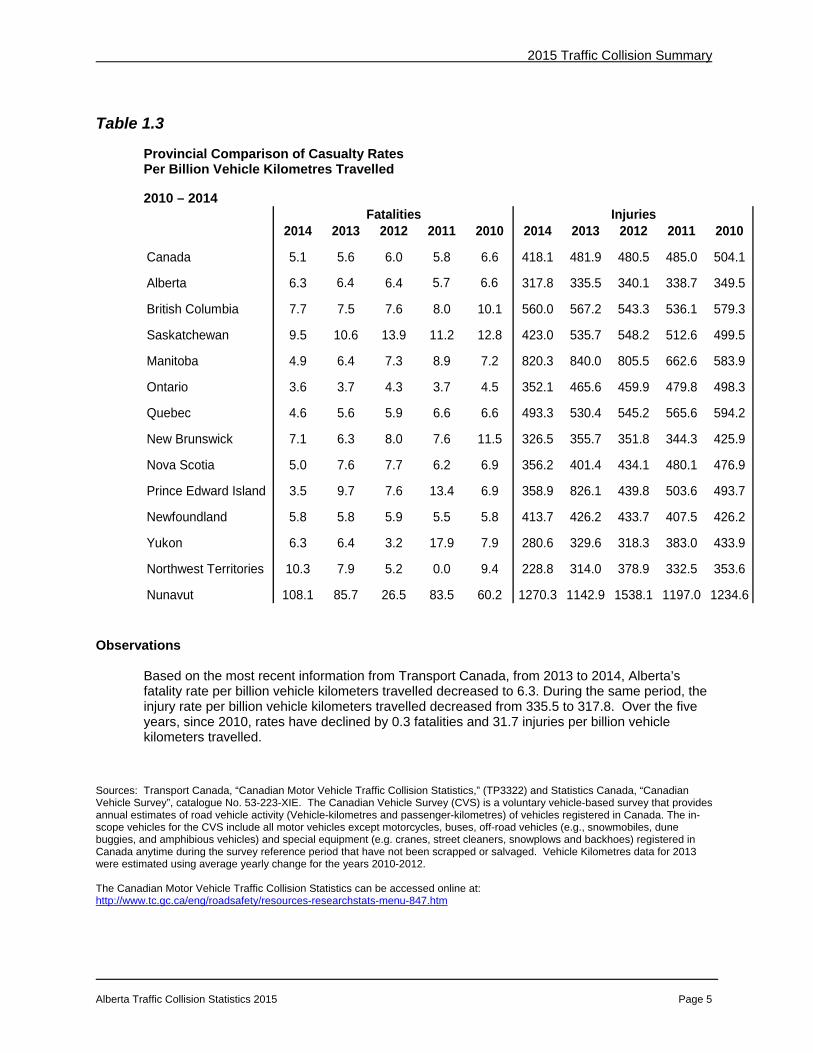
Table 1.3 Provincial Comparison of Casualty Rates Per Billion Vehicle Kilometres Travelled 2010 – 2014
2014 2013 2012 2011 2010 2014 2013 2012 2011 2010
Canada 5.1 5.6 6.0 5.8 6.6 418.1 481.9 480.5 485.0 504.1
Alberta 6.3 6.4 6.4 5.7 6.6 317.8 335.5 340.1 338.7 349.5
British Columbia 7.7 7.5 7.6 8.0 10.1 560.0 567.2 543.3 536.1 579.3
Saskatchewan 9.5 10.6 13.9 11.2 12.8 423.0 535.7 548.2 512.6 499.5
Manitoba 4.9 6.4 7.3 8.9 7.2 820.3 840.0 805.5 662.6 583.9
Ontario 3.6 3.7 4.3 3.7 4.5 352.1 465.6 459.9 479.8 498.3
Quebec 4.6 5.6 5.9 6.6 6.6 493.3 530.4 545.2 565.6 594.2
New Brunswick 7.1 6.3 8.0 7.6 11.5 326.5 355.7 351.8 344.3 425.9
Nova Scotia 5.0 7.6 7.7 6.2 6.9 356.2 401.4 434.1 480.1 476.9
Prince Edward Island 3.5 9.7 7.6 13.4 6.9 358.9 826.1 439.8 503.6 493.7
Newfoundland 5.8 5.8 5.9 5.5 5.8 413.7 426.2 433.7 407.5 426.2
Yukon 6.3 6.4 3.2 17.9 7.9 280.6 329.6 318.3 383.0 433.9
Northwest Territories 10.3 7.9 5.2 0.0 9.4 228.8 314.0 378.9 332.5 353.6
Nunavut 108.1 85.7 26.5 83.5 60.2 1270.3 1142.9 1538.1 1197.0 1234.6
Fatalities Injuries
Observations
Based on the most recent information from Transport Canada, from 2013 to 2014, Alberta’s fatality rate per billion vehicle kilometers travelled decreased to 6.3. During the same period, the injury rate per billion vehicle kilometers travelled decreased from 335.5 to 317.8. Over the five years, since 2010, rates have declined by 0.3 fatalities and 31.7 injuries per billion vehicle kilometers travelled.
Sources: Transport Canada, “Canadian Motor Vehicle Traffic Collision Statistics,” (TP3322) and Statistics Canada, “Canadian Vehicle Survey”, catalogue No. 53-223-XIE. The Canadian Vehicle Survey (CVS) is a voluntary vehicle-based survey that provides annual estimates of road vehicle activity (Vehicle-kilometres and passenger-kilometres) of vehicles registered in Canada. The in-scope vehicles for the CVS include all motor vehicles except motorcycles, buses, off-road vehicles (e.g., snowmobiles, dune buggies, and amphibious vehicles) and special equipment (e.g. cranes, street cleaners, snowplows and backhoes) registered in Canada anytime during the survey reference period that have not been scrapped or salvaged. Vehicle Kilometres data for 2013 were estimated using average yearly change for the years 2010-2012. The Canadian Motor Vehicle Traffic Collision Statistics can be accessed online at: http://www.tc.gc.ca/eng/roadsafety/resources-researchstats-menu-847.htm

2015 Traffic Collision Summary
Alberta Traffic Collision Statistics 2015 Page 6
Figure 2
6.3 6.4 6.4
5.7
6.6
0.0
2.0
4.0
6.0
8.0
2014 2013 2012 2011 2010
Fata
lity
Rat
e P
er
Bill
ion
Ve
hic
les
Km
s T
rave
lled
Alberta Fatality Rates2010-2014
6.3
7.7
9.5
4.9
3.6
4.6
7.1
5.0
3.5
5.86.3
10.3
0.0
2.0
4.0
6.0
8.0
10.0
12.0
AB BC SK MB ON QC NB NS PE NL YT NT
Fata
lity
Rat
e p
er
Bill
ion
Ve
hic
le K
ms
Tra
velle
d
Provinces
Provincial Fatality Rates 2014
Note: To maintain the scale of the graph and to facilitate the comparison across jurisdictions the fatality rate for Nunavut is not included in this graph. The rate for Nunavut is reported in Table 1.3.

When the Collisions Occurred
Alberta Traffic Collision Statistics 2015 Page 7
When the Collisions Occurred Month July experienced more fatal collisions than other months. The highest number of injury and
property damage collisions were recorded during the months of October and January, respectively.
Day of Week The daily distribution of collisions indicated that Friday was the most collision-prone day of the
week. Time The afternoon rush hour period (3:00 p.m. – 6:59 p.m.) accounted for the highest proportion of
collisions. The least collision-prone time period was the early morning (3:00 a.m. – 6:59 a.m.). Holidays The August Long Weekend recorded the highest number of fatalities while the Christmas Season
recorded the highest number of injuries. The Christmas Season also recorded the highest total number of collisions.

When the Collisions Occurred
Alberta Traffic Collision Statistics 2015 Page 8
Table 2.1 Collision Occurrence by Month 2015
MonthN % N % N % N %
January 23 8.0 1262 9.3 14053 11.1 15338 10.9
February 14 4.9 1036 7.7 10865 8.6 11915 8.5
March 14 4.9 975 7.2 9998 7.9 10987 7.8
April 18 6.3 910 6.7 8716 6.9 9644 6.9
May 23 8.0 1119 8.3 9558 7.5 10700 7.6
June 37 12.8 1173 8.7 9964 7.9 11174 7.9
July 40 13.9 1219 9.0 9454 7.5 10713 7.6
August 31 10.8 1101 8.1 8886 7.0 10018 7.1
September 26 9.0 1105 8.2 9802 7.7 10933 7.8
October 23 8.0 1267 9.4 10458 8.2 11748 8.3
November 18 6.3 1172 8.7 12168 9.6 13358 9.5
December 21 7.3 1189 8.8 12827 10.1 14037 10.0
Unspecified -- -- 3 0.0 137 0.1 140 0.1
Total Numberof Collisions 288 100.0 13531 100.0 126886 100.0 140705 100.0
Total CollisionsProperty Damage
Collisions Non-Fatal
Injury CollisionsFatal Collisions
Observations The month of July experienced more fatal crashes than any other month. The highest number of
reported injury collisions were in October. January reported more property damage collisions than any other month.
When the Collisions Occurred
Alberta Traffic Collision Statistics 2015 Page 9
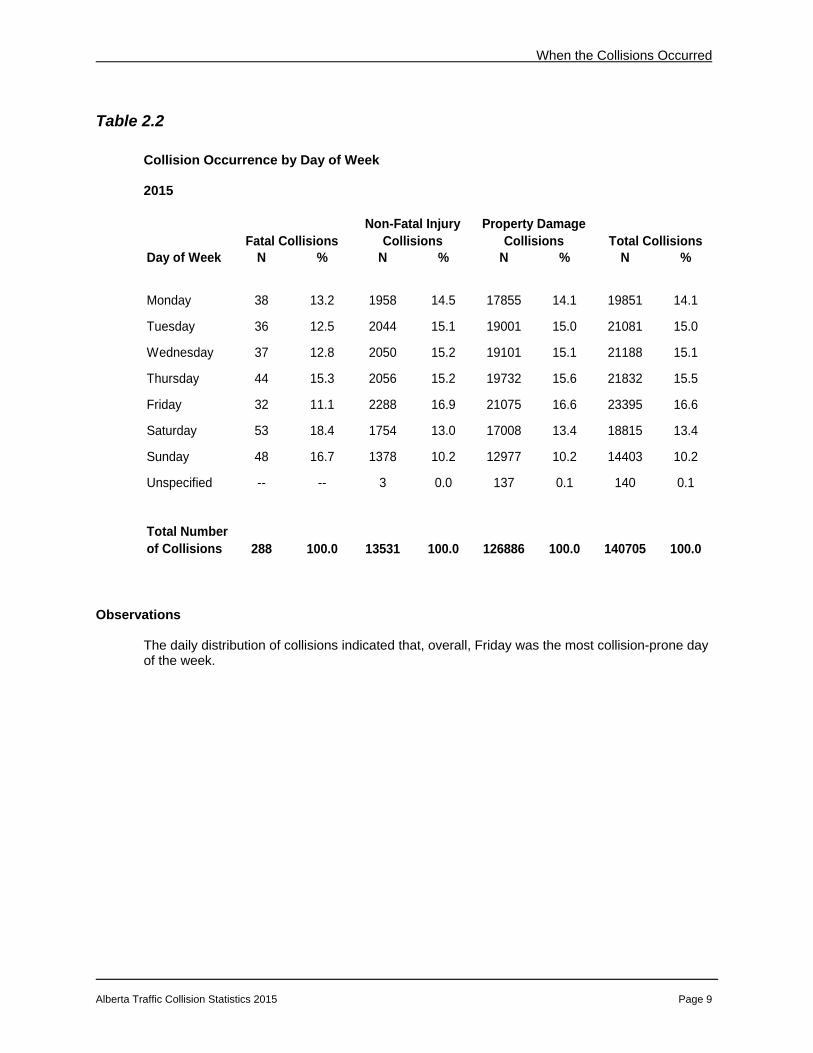
Table 2.2 Collision Occurrence by Day of Week 2015
Day of Week N % N % N % N %
Monday 38 13.2 1958 14.5 17855 14.1 19851 14.1
Tuesday 36 12.5 2044 15.1 19001 15.0 21081 15.0
Wednesday 37 12.8 2050 15.2 19101 15.1 21188 15.1
Thursday 44 15.3 2056 15.2 19732 15.6 21832 15.5
Friday 32 11.1 2288 16.9 21075 16.6 23395 16.6
Saturday 53 18.4 1754 13.0 17008 13.4 18815 13.4
Sunday 48 16.7 1378 10.2 12977 10.2 14403 10.2
Unspecified -- -- 3 0.0 137 0.1 140 0.1
Total Numberof Collisions 288 100.0 13531 100.0 126886 100.0 140705 100.0
Fatal CollisionsNon-Fatal Injury
CollisionsProperty Damage
Collisions Total Collisions
Observations The daily distribution of collisions indicated that, overall, Friday was the most collision-prone day
of the week.

When the Collisions Occurred
Alberta Traffic Collision Statistics 2015 Page 10
Table 2.3 Collision Occurrence by Time Period 2015
Time Period N % N % N % N %
11:00 p.m. - 2:59 a.m. 44 15.3 883 6.5 7642 6.0 8569 6.1
3:00 a.m. - 6:59 a.m. 23 8.0 721 5.3 6317 5.0 7061 5.0
7:00 a.m. - 10:59 a.m. 53 18.4 2454 18.1 23040 18.2 25547 18.2
11:00 a.m. - 2:59 p.m. 51 17.7 3048 22.5 32001 25.2 35100 24.9
3:00 p.m. - 6:59 p.m. 63 21.9 4360 32.2 37678 29.7 42101 29.9
7:00 p.m. - 10:59 p.m. 52 18.1 1902 14.1 16841 13.3 18795 13.4
Unspecified 2 0.7 163 1.2 3367 2.7 3532 2.5
Total Numberof Collisions 288 100.0 13531 100.0 126886 100.0 140705 100.0
Fatal CollisionsNon-Fatal
Injury CollisionsProperty Damage
Collisions Total Collisions
Observations The afternoon rush hour period (3:00 p.m. – 6:59 p.m.) accounted for the largest percentage
(29.9%) of collisions occurring in a 24-hour period. The least collision-prone time period was the early morning (3:00 a.m. – 6:59 a.m.).

When the Collisions Occurred
Alberta Traffic Collision Statistics 2015 Page 11
Figure 3
0.0
2.0
4.0
6.0
8.0
10.0
12.0
14.0
16.0
Jan Feb Mar Apr May Jun Jul Aug Sep Oct Nov Dec
Per
cen
tag
e o
f C
olli
sio
ns
Collision Occurrence By Month Alberta 2015
Fatal Injury Property Damage
0.0
5.0
10.0
15.0
20.0
Monday Tuesday Wednesday Thursday Friday Saturday Sunday
Per
cen
tag
e o
f C
olli
sio
ns
Collision Occurrence By Day of Week Alberta 2015
Fatal Injury Property Damage
0.05.0
10.015.020.025.030.035.0
11:00 pm-2:59 am 3:00 am-6:59 am 7:00 am-10:59 am 11:00 am-2:59 pm 3:00 pm-6:59 pm 7:00 pm-10:59 pm
Per
cen
tag
e o
f C
olli
sio
ns
Collision Occurrence By Time Period Alberta 2015
Fatal Injury Property Damage

When the Collisions Occurred
Alberta Traffic Collision Statistics 2015 Page 12
Table 2.4 Collisions During 2015 Holidays
Number Killed Number Injured Total Collisions*Holidays N N N
New Year's Day(January 1)
1 29 247
Family Day Long Weekend(February 13-16)
6 208 1523
Easter Long Weekend(April 2-6)
5 172 1370
Victoria Day Long Weekend(May 15-18)
4 142 1109
Canada Day(July 1)
1 34 285
August Long Weekend(July 31 - August 3)
7 177 1198
Labour Day Long Weekend(September 4-7)
5 164 1189
Thanksgiving Long Weekend(October 9-12)
6 199 1196
Remembrance Day(November 11)
-- 29 303
Christmas Season(December 24-28)
1 226 2016
Total 36 1380 10436 Observations The August Long Weekend recorded the highest number of fatalities while the Christmas Season
recorded the highest number of injuries. The Christmas Season also recorded the highest total number of collisions.
*Total collisions includes fatal, injury and property damage collisions. Note: Comparisons should be done with caution. The number of days for each holiday period within the year may vary. From year
to year, holiday periods may also vary in length.
Victims
Alberta Traffic Collision Statistics 2015 Page 13
Victims Road User Class The majority of traffic victims were drivers and passengers of vehicles. Pedestrians and
motorcyclists accounted for 6.8% and 3.7% of the total casualties, respectively. Age of Casualties Casualty rates per 10,000 population were highest for persons between the ages of 15 and 24.
The lowest casualty rates were recorded for children 14 years of age and under.

Victims
Alberta Traffic Collision Statistics 2015 Page 14
Table 3.1 Injuries and Fatalities by Road User Class 2015
Road User Class N % N % N %
Drivers 173 52.4 11254 62.8 11427 62.7
Passengers 70 21.2 3906 21.8 3976 21.8
Pedestrians 36 10.9 1198 6.7 1234 6.8
Motorcyclists 33 10.0 640 3.6 673 3.7
Bicyclists 3 0.9 534 3.0 537 2.9
Other 11 3.3 228 1.3 239 1.3
Unspecified 4 1.2 147 0.8 151 0.8
Total Casualties 330 100.0 17907 100.0 18237 100.0
Persons Killed Total CasualtiesPersons Injured
Observations
The majority of traffic victims were drivers (62.7%) and passengers (21.8%) of vehicles. Pedestrians and motorcyclists accounted for 6.8% and 3.7% of the total casualties, respectively.

Victims
Alberta Traffic Collision Statistics 2015 Page 15
Table 3.2 Age of Casualties 2015
Casualty RatePer 10,000
Population*Age in Years N % N % N %
Under 5 3 0.9 226 1.3 229 1.3 8.3
5 - 9 2 0.6 355 2.0 357 2.0 13.6
10 - 14 2 0.6 439 2.5 441 2.4 18.9
15 - 19 24 7.3 1731 9.7 1755 9.6 71.9
20 - 24 50 15.2 2026 11.3 2076 11.4 71.0
25 - 29 41 12.4 2111 11.8 2152 11.8 62.1
30 - 34 27 8.2 1767 9.9 1794 9.8 49.1
35 - 44 52 15.8 2917 16.3 2969 16.3 48.2
45 - 54 48 14.5 2562 14.3 2610 14.3 45.5
55 - 64 40 12.1 1903 10.6 1943 10.7 38.8
65 and over 40 12.1 1348 7.5 1388 7.6 28.5
Unspecified 1 0.3 522 2.9 523 2.9
Total Casualties 330 100.0 17907 100.0 18237 100.0
Persons Killed Total CasualtiesPersons Injured
Observations
Casualty rates per 10,000 population were highest for persons between the ages of 15 and 24. The lowest casualty rates were recorded for children 14 years of age and younger.
*Based on estimates of the Alberta population by age groups and sex, July 1, 2015, Statistics Canada

Victims
Alberta Traffic Collision Statistics 2015 Page 16
Figure 4
8.3
13.6
18.9
71.9 71.0
62.1
49.1 48.245.5
38.8
28.5
0.0
10.0
20.0
30.0
40.0
50.0
60.0
70.0
80.0
Under 5 5 - 9 10 - 14 15 - 19 20 - 24 25 - 29 30 - 34 35 - 44 45 - 54 55 - 64 65 andover
Rat
e p
er 1
0,00
0 P
op
ula
tio
n
Age in Years
Age of Casualties Alberta 2015

Drivers
Alberta Traffic Collision Statistics 2015 Page 17
Drivers Age and Sex of Drivers Collision rates per 1000 licenced drivers indicate that males 18 to 19 years old were more likely to
be involved in a casualty collision than any other age group. The next age group most likely to be involved in casualty collisions was males 20 to 24 years old.
Driver Actions Following too closely (31.2%), running off the road (18.4%) and left turn across path (11.3%)
were the most frequently identified improper driver actions contributing to casualty collisions.
Drivers
Alberta Traffic Collision Statistics 2015 Page 18
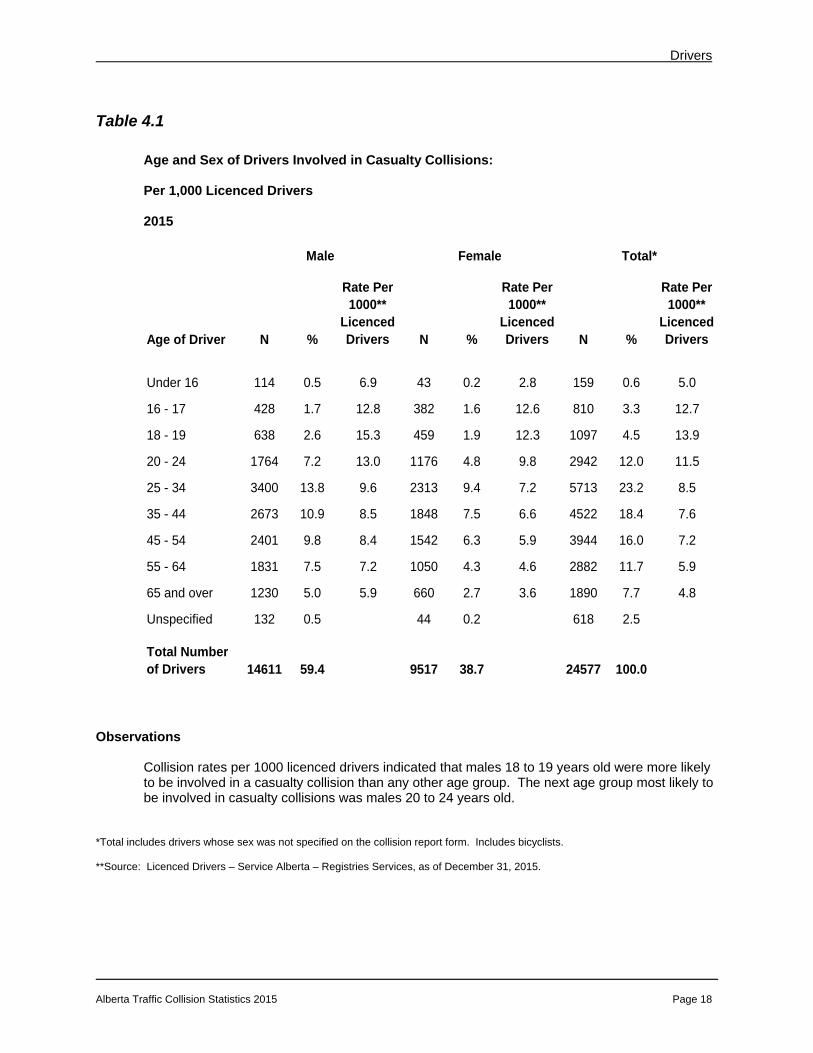
Table 4.1 Age and Sex of Drivers Involved in Casualty Collisions: Per 1,000 Licenced Drivers 2015
Age of Driver N %
Rate Per1000**
LicencedDrivers N %
Rate Per1000**
LicencedDrivers N %
Rate Per1000**
LicencedDrivers
Under 16 114 0.5 6.9 43 0.2 2.8 159 0.6 5.0
16 - 17 428 1.7 12.8 382 1.6 12.6 810 3.3 12.7
18 - 19 638 2.6 15.3 459 1.9 12.3 1097 4.5 13.9
20 - 24 1764 7.2 13.0 1176 4.8 9.8 2942 12.0 11.5
25 - 34 3400 13.8 9.6 2313 9.4 7.2 5713 23.2 8.5
35 - 44 2673 10.9 8.5 1848 7.5 6.6 4522 18.4 7.6
45 - 54 2401 9.8 8.4 1542 6.3 5.9 3944 16.0 7.2
55 - 64 1831 7.5 7.2 1050 4.3 4.6 2882 11.7 5.9
65 and over 1230 5.0 5.9 660 2.7 3.6 1890 7.7 4.8
Unspecified 132 0.5 44 0.2 618 2.5
Total Numberof Drivers 14611 59.4 9517 38.7 24577 100.0
Male Female Total*
Observations Collision rates per 1000 licenced drivers indicated that males 18 to 19 years old were more likely
to be involved in a casualty collision than any other age group. The next age group most likely to be involved in casualty collisions was males 20 to 24 years old.
*Total includes drivers whose sex was not specified on the collision report form. Includes bicyclists. **Source: Licenced Drivers – Service Alberta – Registries Services, as of December 31, 2015.

Drivers
Alberta Traffic Collision Statistics 2015 Page 19
Figure 5
6.9
12.8
15.3
13.0
9.6
8.5 8.4
7.2
5.9
2.8
12.6 12.3
9.8
7.26.6
5.9
4.63.6
0.0
2.0
4.0
6.0
8.0
10.0
12.0
14.0
16.0
18.0
Under16
16 - 17 18 - 19 20 - 24 25 - 34 35 - 44 45 - 54 55 - 64 65 andover
Rat
e p
er 1
000
Lic
ense
d D
rive
rs
Age in Years
Age and Sex of Drivers Involved in Casualty Collisions Alberta 2015
Males Females

Drivers
Alberta Traffic Collision Statistics 2015 Page 20
Table 4.2 Improper Actions of Drivers Involved in Casualty Collisions* 2015
Improper Actions N % N % N %
Followed Too Closely 7 3.0 3420 31.8 3427 31.2
Ran Off Road 104 43.9 1917 17.8 2021 18.4
Left Turn Across Path 19 8.0 1218 11.3 1237 11.3
Stop Sign Violation 22 9.3 886 8.2 908 8.3
Disobey Traffic Signal 9 3.8 730 6.8 739 6.7
Failed to Yield Right of Way to Pedestrian 6 2.5 592 5.5 598 5.4
Improper Turn 3 1.3 375 3.5 378 3.4
Improper Lane Change 2 0.8 348 3.2 350 3.2
Left of Centre 50 21.1 264 2.5 314 2.9
Backed Unsafely 1 0.4 276 2.6 277 2.5
Failed to Yield Right of Way - Uncontrolled Intersection 2 0.8 230 2.1 232 2.1
Yield Sign Violation -- -- 186 1.7 186 1.7
Improper Passing 7 3.0 103 1.0 110 1.0
Other 5 2.1 210 2.0 215 2.0
Total Number of Drivers 237 100.0 10755 100.0 10992 100.0
Total Driversin CasualtyCollisions
Drivers in Drivers in
Fatal Collisions Injury CollisionsNon-Fatal
Observations
Following too closely (31.2%), running off the road (18.4%) and left turn across path (11.3%) were the most frequently identified improper driver actions contributing to casualty collisions.
*Based on those cases where driver actions were specified on the collision report form. Includes bicyclists. Note: There were a total of 22,242 drivers involved in casualty collisions for which a driver action was specified on the collision
report form. 11,250 were indicated as driving properly at the time of the collision.

Vehicles
Alberta Traffic Collision Statistics 2015 Page 21
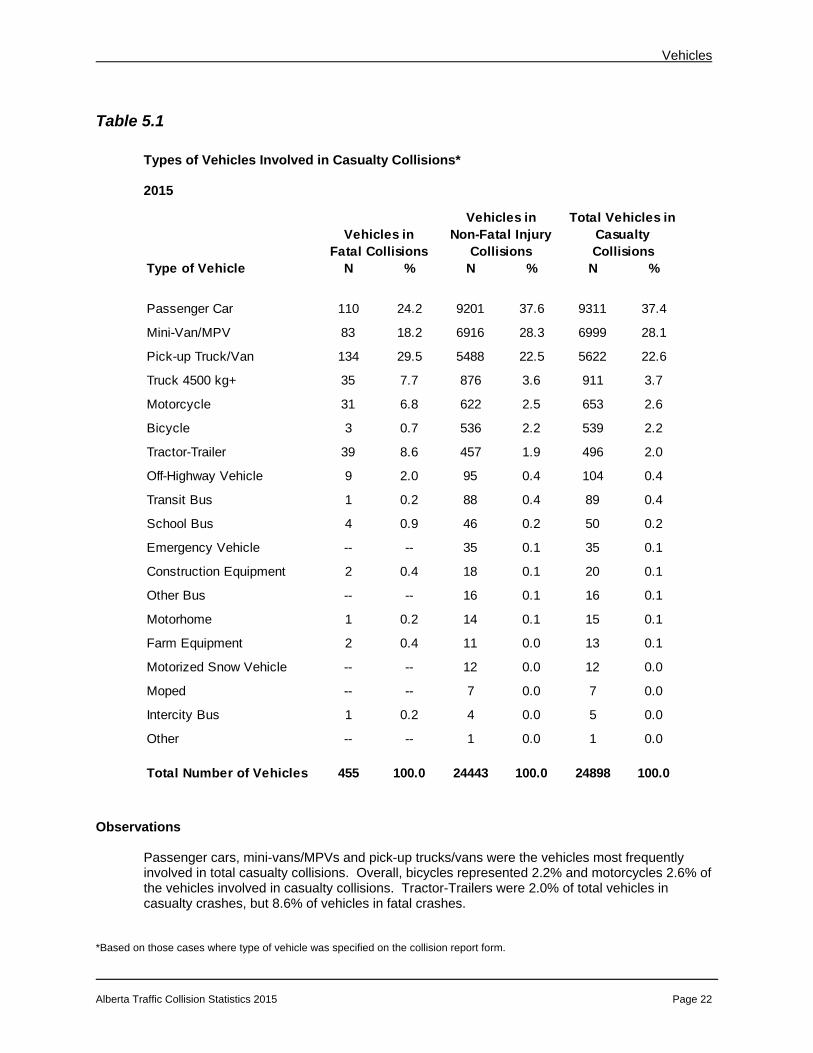
Vehicles Types of Vehicles Passenger cars (37.4%), minivans/MPVs (28.1%) and pick-up trucks/vans (22.6%) were the
vehicles most frequently involved in total casualty collisions. Vehicle Factors Overall 0.9% of vehicles involved in casualty collisions were identified as having a vehicle defect.
The most common defect was defective brakes. Point of Impact The most common point of impact in casualty collisions involved the front of the vehicle. Overall,
45.1% of the impacts involved the centre front.
Vehicles
Alberta Traffic Collision Statistics 2015 Page 22
Table 5.1 Types of Vehicles Involved in Casualty Collisions* 2015
Observations
Passenger cars, mini-vans/MPVs and pick-up trucks/vans were the vehicles most frequently involved in total casualty collisions. Overall, bicycles represented 2.2% and motorcycles 2.6% of the vehicles involved in casualty collisions. Tractor-Trailers were 2.0% of total vehicles in casualty crashes, but 8.6% of vehicles in fatal crashes.
*Based on those cases where type of vehicle was specified on the collision report form.
Type of Vehicle N % N % N %
Passenger Car 110 24.2 9201 37.6 9311 37.4
Mini-Van/MPV 83 18.2 6916 28.3 6999 28.1
Pick-up Truck/Van 134 29.5 5488 22.5 5622 22.6
Truck 4500 kg+ 35 7.7 876 3.6 911 3.7
Motorcycle 31 6.8 622 2.5 653 2.6
Bicycle 3 0.7 536 2.2 539 2.2
Tractor-Trailer 39 8.6 457 1.9 496 2.0
Off-Highway Vehicle 9 2.0 95 0.4 104 0.4
Transit Bus 1 0.2 88 0.4 89 0.4
School Bus 4 0.9 46 0.2 50 0.2
Emergency Vehicle -- -- 35 0.1 35 0.1
Construction Equipment 2 0.4 18 0.1 20 0.1
Other Bus -- -- 16 0.1 16 0.1
Motorhome 1 0.2 14 0.1 15 0.1
Farm Equipment 2 0.4 11 0.0 13 0.1
Motorized Snow Vehicle -- -- 12 0.0 12 0.0
Moped -- -- 7 0.0 7 0.0
Intercity Bus 1 0.2 4 0.0 5 0.0
Other -- -- 1 0.0 1 0.0
Total Number of Vehicles 455 100.0 24443 100.0 24898 100.0
Vehicles inFatal Collisions
Vehicles in Non-Fatal Injury
Collisions
Total Vehicles in Casualty Collisions

Vehicles
Alberta Traffic Collision Statistics 2015 Page 23
Table 5.2 Vehicle Factors Involved in Casualty Collisions* 2015
Observations
Overall 0.9% of vehicles involved in casualty collisions were identified as having a vehicle defect. The most common defect was defective brakes.
*Based on those cases where a vehicle factor was specified on the collision report form. This information does not indicate whether or not a mechanical inspection of the collision-involved vehicle was conducted.
Vehicle Factors N % N % N %
No Apparent Defect 356 98.3 21906 99.1 22262 99.1
Defective Brakes 2 0.6 68 0.3 70 0.3
Tires Failed 2 0.6 36 0.2 38 0.2
Improper Load/Shift 1 0.3 15 0.1 16 0.1
Lighting Defect -- -- 3 0.0 3 0.0
Other 1 0.3 74 0.3 75 0.3
Total Number of Vehicles 362 100.0 22102 100.0 22464 100.0
Vehicles in Fatal Collisions
Vehicles in Non-Fatal Injury
Collisions
Total Vehicles in Casualty Collisions

Vehicles
Alberta Traffic Collision Statistics 2015 Page 24
Table 5.3 Point of Impact on Vehicles Involved in Casualty Collisions* 2015
Observations
The most common point of impact in casualty collisions involved the front of the vehicle. 45.1% of the impacts involved the centre front, while 21.4% of the impacts involved the centre rear.
*Based on those cases where point of impact was specified on the collision report form.
Point of Impact N % N % N %
Centre Front 229 51.5 10630 45.0 10859 45.1
Centre Rear 22 4.9 5122 21.7 5144 21.4
Right Front 18 4.0 1631 6.9 1649 6.8
Left Front 16 3.6 1632 6.9 1648 6.8
Rollover 77 17.3 1176 5.0 1253 5.2
Left Side 36 8.1 1055 4.5 1091 4.5
Right Side 18 4.0 1001 4.2 1019 4.2
Left Rear 5 1.1 554 2.3 559 2.3
Right Rear 4 0.9 521 2.2 525 2.2
Attachment 14 3.1 211 0.9 225 0.9
Undercarriage 2 0.4 61 0.3 63 0.3
Top 4 0.9 48 0.2 52 0.2
Total Number ofVehicles 445 100.0 23642 100.0 24087 100.0
Vehicles inFatal Collisions
Vehicles in Non-Fatal
Injury Collisions
Total Vehicles in Casualty Collisions
Environment
Alberta Traffic Collision Statistics 2015 Page 25
Environment Location
The majority of fatal crashes (68.1%) occurred in rural areas, whereas the majority of injury (75.7%) and property damage (85.1%) crashes occurred in urban areas.
Surface Conditions
The majority (68.4%) of all casualty collisions occurred when surface conditions were dry. Slush, snow or ice was involved in 10.8% of fatal collisions and 19.6% of non-fatal injury collisions.

Environment
Alberta Traffic Collision Statistics 2015 Page 26
Table 6.1 Location of Collisions 2015
Location N % N % N % N %
Urban 92 31.9 10247 75.7 107974 85.1 118313 84.1
Rural 196 68.1 3284 24.3 18912 14.9 22392 15.9
Total Number of Collisions 288 100.0 13531 100.0 126886 100.0 140705 100.0
Fatal CollisionsNon-Fatal Injury
Collisions Total CollisionsProperty Damage
Collisions
Observations
The majority of fatal collisions (68.1%) occurred in rural areas. Collisions occurring in urban areas resulted in the highest proportion of non-fatal injury collisions (75.7%) and property damage crashes (85.1%).

Environment
Alberta Traffic Collision Statistics 2015 Page 27
Table 6.2 Casualty Collision Occurrence by Surface Condition 2015
Surface Condition N % N % N %
Dry 223 77.4 9233 68.2 9456 68.4
Slush/Snow/Ice 31 10.8 2655 19.6 2686 19.4
Wet 23 8.0 1089 8.0 1112 8.0
Loose Surface Material 4 1.4 201 1.5 205 1.5
Muddy -- -- 26 0.2 26 0.2
Other 2 0.7 41 0.3 43 0.3
Unspecified 5 1.7 286 2.1 291 2.1
Total Number of Collisions 288 100.0 13531 100.0 13819 100.0
Fatal CollisionsNon-Fatal Injury
CollisionsTotal Casualty
Collisions
Observations
The majority (68.4%) of casualty collisions occurred when surface conditions were dry. Slush, snow or ice was involved in 10.8% of fatal collisions and 19.6% of non-fatal injury collisions.

Environment
Alberta Traffic Collision Statistics 2015 Page 28

Special Types of Vehicles
Alberta Traffic Collision Statistics 2015 Page 29
Special Types of Vehicles Motorcycles
In 2015, based on motorcycle registrations, the involvement rate of motorcycles has decreased in fatal collisions over 2014 but increased in injury collisions.
The majority of motorcycle casualty collisions involved male drivers. Motorcycle operators under
the age of 25 had the highest involvement rate per 1000 licenced drivers.
Compared to drivers involved in total casualty collisions, motorcycle operators were more likely to run off the road, make an improper turn, or pass improperly. However, motorcycle operators were less likely to follow too closely, make a left turn across the path of an oncoming vehicle or commit a stop sign violation.
Compared to drivers involved in all types of vehicle casualty collisions, motorcycle operators were
more likely to have consumed alcohol before the crash.
Vehicle factors were identified for 1.9% of motorcycles involved in casualty collisions compared to 1.0% for all types of vehicles involved in casualty collisions.
The occurrence of casualty collisions involving motorcycles was highest in the month of July.
The majority of casualty collisions involving motorcycles occurred on dry roads.

Special Types of Vehicles
Alberta Traffic Collision Statistics 2015 Page 30
Table 7.1
Motorcycles Involved in Casualty Collisions 2011 – 2015 Number of Motorcycles 2015 2014 2013 2012 2011
Fatal 31 36 42 22 26
Non-Fatal Injury 622 598 642 609 655
Total Number of Motorcycles Involved in Casualty Collisions 653 634 684 631 681
Casualties*
Number Killed 33 35 42 21 24
Number Injured 685 649 697 660 719
Total Casualties in Collisions Involving Motorcycles 718 684 739 681 743
Number of Motorcycles Involved in Casualty Collisions Per 10,000 Registered Motorcycles**
Fatal Collisions 2.5 2.9 3.6 2.0 2.4
Non-Fatal Injury Collisions 49.2 48.9 54.7 54.3 60.5 Observations
Based on motorcycle registrations in 2015, compared to 2014, the involvement rate of motorcycles has decreased in fatal collisions but increased in injury collisions.
*This refers to the total number of people killed and injured in collisions in which a motorcycle was involved. It does not refer to the number of motorcyclists killed and injured. ** Source: Based on vehicle registration statistics, Service Alberta – Registries Services, December 31, 2015.

Special Types of Vehicles
Alberta Traffic Collision Statistics 2015 Page 31
Figure 6
2.52.9
3.6
2.02.4
0
1
2
3
4
5
6
2015 2014 2013 2012 2011
Rat
e p
er 1
0,00
0 R
egis
tere
d M
oto
rcyc
les
Number of Motorcycles Involved in Fatal Collisions Alberta 2011 - 2015
Special Types of Vehicles
Alberta Traffic Collision Statistics 2015 Page 32
Table 7.2
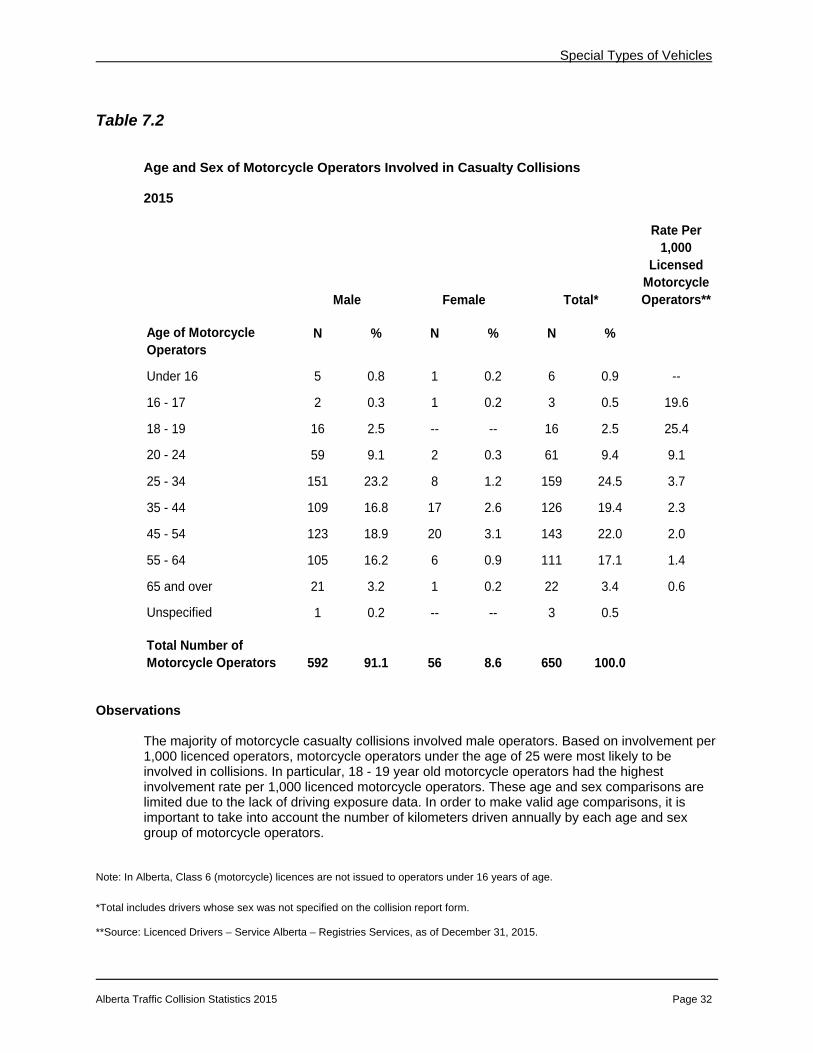
Age and Sex of Motorcycle Operators Involved in Casualty Collisions 2015
Rate Per 1,000
Licensed Motorcycle Operators**
N % N % N %
Under 16 5 0.8 1 0.2 6 0.9 --
16 - 17 2 0.3 1 0.2 3 0.5 19.6
18 - 19 16 2.5 -- -- 16 2.5 25.4
20 - 24 59 9.1 2 0.3 61 9.4 9.1
25 - 34 151 23.2 8 1.2 159 24.5 3.7
35 - 44 109 16.8 17 2.6 126 19.4 2.3
45 - 54 123 18.9 20 3.1 143 22.0 2.0
55 - 64 105 16.2 6 0.9 111 17.1 1.4
65 and over 21 3.2 1 0.2 22 3.4 0.6
Unspecified 1 0.2 -- -- 3 0.5
Total Number of Motorcycle Operators 592 91.1 56 8.6 650 100.0
Age of Motorcycle Operators
Male Female Total*
Observations
The majority of motorcycle casualty collisions involved male operators. Based on involvement per 1,000 licenced operators, motorcycle operators under the age of 25 were most likely to be involved in collisions. In particular, 18 - 19 year old motorcycle operators had the highest involvement rate per 1,000 licenced motorcycle operators. These age and sex comparisons are limited due to the lack of driving exposure data. In order to make valid age comparisons, it is important to take into account the number of kilometers driven annually by each age and sex group of motorcycle operators.
Note: In Alberta, Class 6 (motorcycle) licences are not issued to operators under 16 years of age.
*Total includes drivers whose sex was not specified on the collision report form. **Source: Licenced Drivers – Service Alberta – Registries Services, as of December 31, 2015.
Special Types of Vehicles
Alberta Traffic Collision Statistics 2015 Page 33
Table 7.3
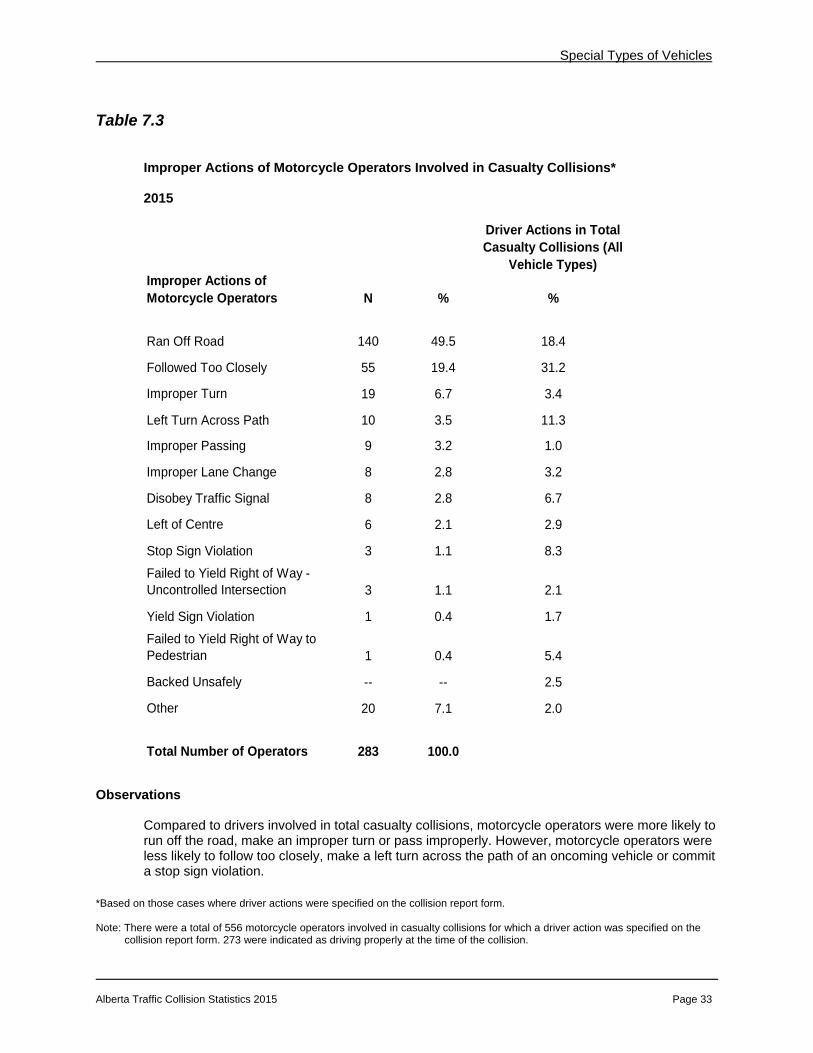
Improper Actions of Motorcycle Operators Involved in Casualty Collisions* 2015
Driver Actions in Total Casualty Collisions (All
Vehicle Types)Improper Actions of Motorcycle Operators N % %
Ran Off Road 140 49.5 18.4
Followed Too Closely 55 19.4 31.2
Improper Turn 19 6.7 3.4
Left Turn Across Path 10 3.5 11.3
Improper Passing 9 3.2 1.0
Improper Lane Change 8 2.8 3.2
Disobey Traffic Signal 8 2.8 6.7
Left of Centre 6 2.1 2.9
Stop Sign Violation 3 1.1 8.3
Failed to Yield Right of Way - Uncontrolled Intersection 3 1.1 2.1
Yield Sign Violation 1 0.4 1.7
Failed to Yield Right of Way to Pedestrian 1 0.4 5.4
Backed Unsafely -- -- 2.5
Other 20 7.1 2.0
Total Number of Operators 283 100.0
Observations
Compared to drivers involved in total casualty collisions, motorcycle operators were more likely to run off the road, make an improper turn or pass improperly. However, motorcycle operators were less likely to follow too closely, make a left turn across the path of an oncoming vehicle or commit a stop sign violation.
*Based on those cases where driver actions were specified on the collision report form. Note: There were a total of 556 motorcycle operators involved in casualty collisions for which a driver action was specified on the
collision report form. 273 were indicated as driving properly at the time of the collision.

Special Types of Vehicles
Alberta Traffic Collision Statistics 2015 Page 34
Table 7.4
Condition of Motorcycle Operators Involved in Casualty Collisions* 2015
Driver Condition in Total Casualty Collisions (All Vehicle Types)
Condition of Motorcycle Operator N % %
Normal 546 95.5 94.4
Had Been Drinking 15 2.6 1.5
Alcohol Impaired 10 1.7 1.9
Total Alcohol Involvement 25 4.4 3.4
Impaired by Drugs 1 0.2 0.3
Fatigued/Asleep -- -- 0.9
Other -- -- 1.1
Total Number of Motorcycle Operators 572 100.0
Observations
The motorcycle operator’s condition was a contributory factor for 4.5% of the motorcycle operators involved in casualty collisions. Compared to drivers involved in total casualty collisions, motorcycle operators were more likely to have consumed alcohol prior to the crash.
*Based on those cases where driver condition was specified on the collision report form.

Special Types of Vehicles
Alberta Traffic Collision Statistics 2015 Page 35
Table 7.5
Motorcycle Vehicle Factors in Casualty Collisions* 2015
Vehicle Factors in Total Casualty Collisions(All Vehicle Types)
Vehicle Factors N % %
No Apparent Defect 581 98.1 99.0
Tires Failed 3 0.5 0.2
Defective Brakes 2 0.3 0.3
Lighting Defect 1 0.2 0.0
Improper Load/Shift -- -- 0.1
Other 5 0.8 0.4
Total Number of Motorcycles 592 100.0
Observations
Vehicle factors were identified for 1.9% of the motorcycles involved in casualty collisions compared to 1.0% for all types of vehicles involved in casualty collisions.
*Based on those cases where a vehicle factor was specified on the collision report form. This does not indicate that a mechanical inspection of the collision-involved motorcycle was conducted.

Special Types of Vehicles
Alberta Traffic Collision Statistics 2015 Page 36
Table 7.6
Casualty Collisions Involving Motorcycles: Month of Occurrence 2015
Observations
The month of July recorded the highest proportion of casualty crashes involving motorcycles.
Month N %
January 1 0.2
February 1 0.2
March 23 3.6
April 50 7.8
May 97 15.2
June 107 16.8
July 122 19.1
August 101 15.8
September 85 13.3
October 43 6.7
November 8 1.3
December -- --
Total Number of Collisions 638 100.0

Special Types of Vehicles
Alberta Traffic Collision Statistics 2015 Page 37
Table 7.7
Casualty Collisions Involving Motorcycles: Road Surface Condition 2015 Road Surface Condition N %
Dry 571 89.5
Loose Surface Material 29 4.5
Wet 23 3.6
Other 7 1.1
Unspecified 8 1.3
Total Number of Collisions 638 100.0
Observations
The majority (89.5%) of casualty collisions involving motorcycles occurred on dry roads. Loose material on the road surface was involved in 4.5% of motorcycle casualty crashes. Wet roads were the scene for 3.6% of motorcycle casualty collisions.
Special Types of Vehicles
Alberta Traffic Collision Statistics 2015 Page 38
Special Types of Vehicles
Alberta Traffic Collision Statistics 2015 Page 39
Special Types of Vehicles Truck Tractors
In 2015, there were 38 persons killed and 556 injured in collisions involving truck tractors. This represents a decrease in fatalities and injuries from 2014.
Compared to drivers of other vehicles, truck tractor drivers were more likely to run off the road, make an improper lane change, or pass improperly. However, operators of truck tractors were less likely than other vehicle operators to follow too closely, make a left turn across the path of oncoming vehicles or fail to yield right of way to a pedestrian.
Truck tractor drivers were less likely to consume alcohol before the crash compared to drivers in
total casualty collisions.
Vehicle factors were more likely to be present in truck tractor casualty collisions than in total casualty collisions.
The occurrence of casualty collisions involving truck tractors was highest in the month of January.

Special Types of Vehicles
Alberta Traffic Collision Statistics 2015 Page 40
Table 7.8
Truck Tractors Involved in Casualty Collisions 2011 – 2015 Number of Truck Tractors 2015 2014 2013 2012 2011
Fatal 39 54 50 39 48
Non-Fatal Injury 457 526 477 476 481
Total Number of Truck Tractors Involved in Casualty Collisions 496 580 527 515 529
Casualties*
Number Killed 38 57 53 37 50
Number Injured 556 633 584 599 670
Total Casualties in Collisions Involving Truck Tractors 594 690 637 636 720
Observations
In 2015, there were 38 persons killed and 556 injured in collisions involving truck tractors. This represents a decrease in fatalities and injuries from 2014. The total number of truck tractors involved in casualty crashes was highest in 2014 at 580.
*This refers to the total number of people killed and injured in collisions in which a truck tractor was involved. It does not refer to the number of truck tractor drivers killed and injured.

Special Types of Vehicles
Alberta Traffic Collision Statistics 2015 Page 41
Table 7.9
Improper Actions of Truck Tractor Drivers Involved in Casualty Collisions* 2015
Driver Actions in Total Casualty Collisions (All
Vehicle Types)Improper Actions of Truck Tractor Driver N % %
Ran Off Road 88 43.1 18.4
Followed Too Closely 41 20.1 31.2
Improper Lane Change 14 6.9 3.2
Stop Sign Violation 13 6.4 8.3
Improper Passing 9 4.4 1.0
Left Turn Across Path 7 3.4 11.3
Left of Centre 7 3.4 2.9
Disobey Traffic Signal 6 2.9 6.7
Improper Turn 5 2.5 3.4
Backed Unsafely 4 2.0 2.5
Failed to Yield Right of Way - Uncontrolled Intersection 3 1.5 2.1
Yield Sign Violation 1 0.5 1.7
Failed to Yield Right of Way - Pedestrian 1 0.5 5.4
Other 5 2.5 2.0
Total Number of Drivers 204 100.0 Observations
Compared to drivers of other vehicles, truck tractor drivers were more likely to run off the road, make an improper lane change, or pass improperly. However, operators of truck tractors were less likely than other vehicle operators to follow too closely, make a left turn across the path of oncoming vehicles or fail to yield right of way to a pedestrian.
*Based on those cases where driver actions were specified on the collision report form. Note: There was a total of 446 truck-tractor drivers involved in casualty collisions for which a driver action was specified on the
collision report form. 242 were indicated as driving properly at the time of the collision.

Special Types of Vehicles
Alberta Traffic Collision Statistics 2015 Page 42
Table 7.10
Condition of Truck Tractor Drivers Involved in Casualty Collisions* 2015
Driver Condition in Total Casualty
Collisions(All Vehicle Types)
Driver Condition N % %
Normal 420 96.8 94.4
Had Been Drinking 3 0.7 1.5
Alcohol Impaired 2 0.5 1.9
Total Alcohol Involvement 5 1.2 3.4
Fatigued/Asleep 7 1.6 0.3
Impaired by Drugs -- -- 0.9
Other 2 0.5 1.1
Total Number of Drivers 434 100.0
Observations
The condition of the truck tractor driver was a contributory factor for 3.2% of the drivers involved. In 2015, five truck tractor drivers were reported by police as having consumed alcohol. Truck tractor drivers were more likely to have been fatigued or asleep at the time of the crash.
*Based on those cases where driver condition was specified on the collision report form.
Special Types of Vehicles
Alberta Traffic Collision Statistics 2015 Page 43
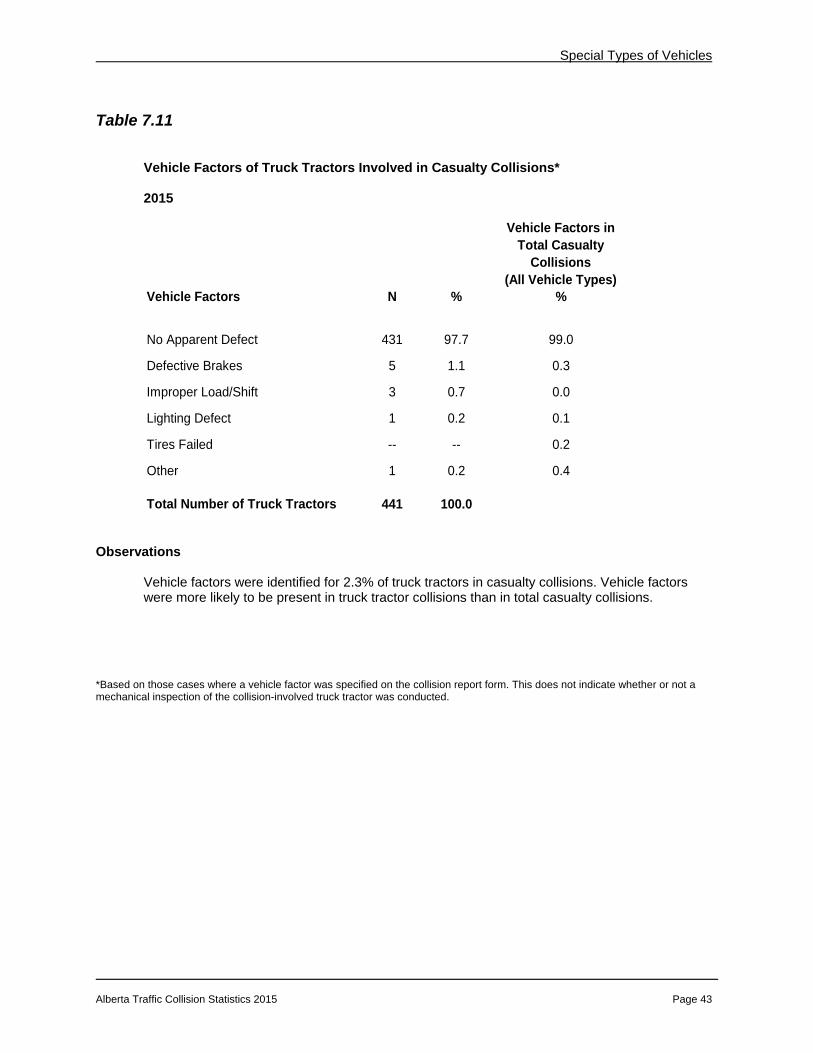
Table 7.11
Vehicle Factors of Truck Tractors Involved in Casualty Collisions* 2015
Vehicle Factors in Total Casualty
Collisions(All Vehicle Types)
Vehicle Factors N % %
No Apparent Defect 431 97.7 99.0
Defective Brakes 5 1.1 0.3
Improper Load/Shift 3 0.7 0.0
Lighting Defect 1 0.2 0.1
Tires Failed -- -- 0.2
Other 1 0.2 0.4
Total Number of Truck Tractors 441 100.0
Observations
Vehicle factors were identified for 2.3% of truck tractors in casualty collisions. Vehicle factors were more likely to be present in truck tractor collisions than in total casualty collisions.
*Based on those cases where a vehicle factor was specified on the collision report form. This does not indicate whether or not a mechanical inspection of the collision-involved truck tractor was conducted.

Special Types of Vehicles
Alberta Traffic Collision Statistics 2015 Page 44
Table 7.12
Casualty Collisions Involving Truck Tractors: Month of Occurrence 2015 Month N %
January 60 13.1
February 41 9.0
March 31 6.8
April 26 5.7
May 23 5.0
June 33 7.2
July 47 10.3
August 48 10.5
September 25 5.5
October 43 9.4
November 36 7.9
December 43 9.4
Unspecified 1 0.2
Total Number of Collisions 457 100.0
Observations
The occurrence of casualty collisions involving truck tractors was highest in the month of January and lowest during May.

Special Types of Vehicles
Alberta Traffic Collision Statistics 2015 Page 45
Special Types of Vehicles Trains
In 2015, four people were killed and 14 people were injured in crashes in which a train was involved. The number of casualties involving trains remained the same from 2014.
The largest number of casualty collisions involving trains occurred in the month of November.
The majority (93.3%) of drivers involved in casualty collisions with a train made an improper
driving action.

Special Types of Vehicles
Alberta Traffic Collision Statistics 2015 Page 46
Table 7.13
Trains Involved in Casualty Collisions 2011 – 2015 Number of Trains 2015 2014 2013 2012 2011
Fatal 4 2 4 1 3
Non-Fatal Injury 12 14 16 16 19
Total Number of Trains Involved in Casualty Collisions 16 16 20 17 22
Casualties*
Number Killed 4 2 4 1 3
Number Injured 14 16 20 20 27
Total Casualties in Collisions Involving Trains 18 18 24 21 30
Observations
The number of trains involved in casualty collisions remained the same compared to 2014. The number of casualties resulting from these collisions also remained the same.
*This refers to the total number of people killed and injured in collisions involving a train.

Special Types of Vehicles
Alberta Traffic Collision Statistics 2015 Page 47
Table 7.14
Casualty Collisions Involving Trains: Month of Occurrence 2015
Month N % N % N %
January -- -- -- -- -- --
February -- -- 2 16.7 2 12.5
March -- -- -- -- -- --
April 1 25.0 -- -- 1 6.3
May -- -- 2 16.7 2 12.5
June -- -- -- -- -- --
July 1 25.0 -- -- 1 6.3
August -- -- 2 16.7 2 12.5
September -- -- 2 16.7 2 12.5
October 1 25.0 1 8.3 2 12.5
November -- -- 3 25.0 3 18.8
December 1 25.0 -- -- 1 6.3
Total Number of Collisions 4 100.0 12 100.0 16 100.0
Fatal CollisionsNon-Fatal Injury
CollisionsTotal Casualty
Collisions
Observations
The largest number of casualty collisions involving trains occurred in the month of November.

Special Types of Vehicles
Alberta Traffic Collision Statistics 2015 Page 48
Table 7.15
Actions of Drivers Involved in Casualty Collisions with Trains* 2015
Driver Actions N % N % N %
Driving Properly -- -- 1 9.1 1 6.7
Disobey Traffic Signal 3 75.0 5 45.5 8 53.3
Stop Sign Violation 1 25.0 2 18.2 3 20.0
Failed to Yield Right of Way - Uncontrolled Intersection -- -- 2 18.2 2 13.3
Improper Turn -- -- 1 9.1 1 6.7
Total Number of Drivers 4 100.0 11 100.0 15 100.0
Drivers in Fatal Collisions
Drivers in Non-Fatal Injury Collisions
Total Drivers in Casualty Collisions
Observations
The majority (93.3%) of drivers involved in a casualty collision with a train made an improper driving action.
*Based on those cases where driver actions were specified on the collision report form.

Pedestrians
Alberta Traffic Collision Statistics 2015 Page 49
Pedestrians
Pedestrian casualty collisions were more likely to occur in October. July experienced the least number of pedestrian crashes.
Pedestrian casualty collisions were most likely to occur on Tuesday and least likely to occur on
Sunday.
Pedestrian casualty collisions were most likely to occur during the evening rush-hour period (3:00 p.m. - 6:59 p.m.).
50.2% of the drivers in casualty collisions involving a pedestrian were recorded as failing to yield
the right of way to the pedestrian.
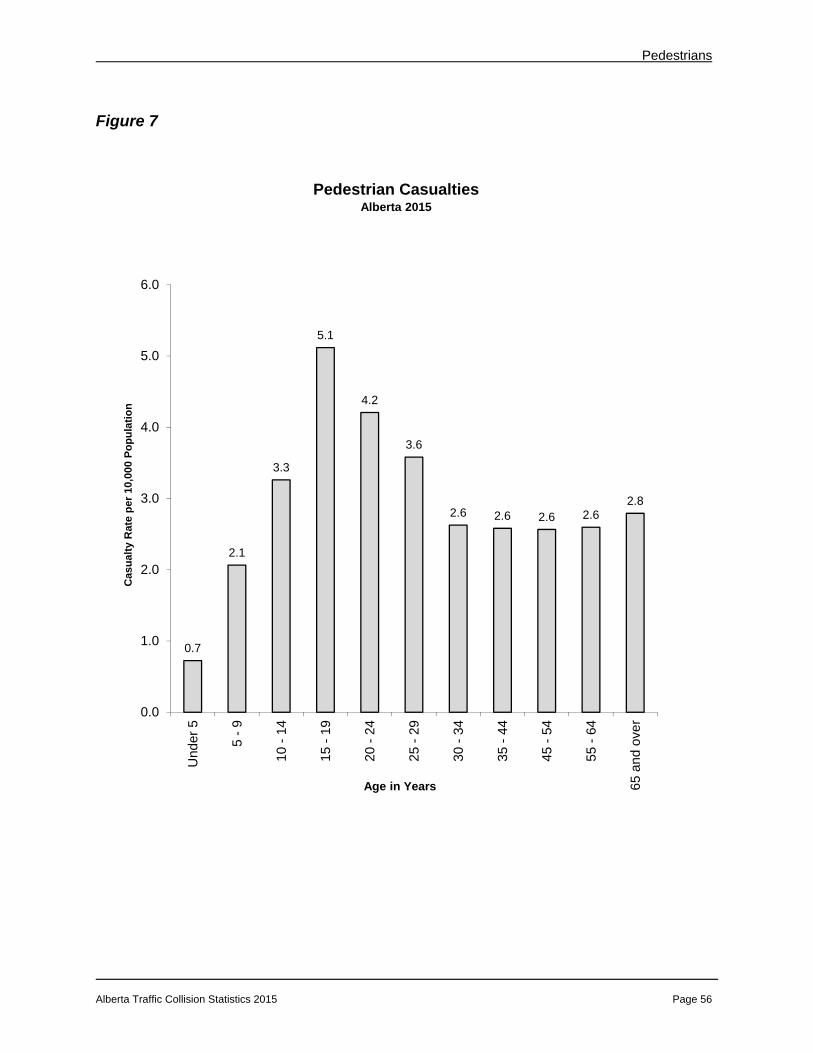
The casualty rate per population was highest for pedestrians between the ages of 15 and 19.
Of pedestrians involved in injury collisions, 10.2% had consumed alcohol before the collision, compared to 21.7% involved in fatal collisions.
Of those pedestrians who had consumed alcohol prior to the collision, the highest rate of
involvement per 10,000 population was for pedestrians 20 - 24 years of age.

Pedestrians
Alberta Traffic Collision Statistics 2015 Page 50
Table 8.1 Casualty Collisions Involving Pedestrians: Month of Occurrence 2015
Observations
Pedestrian casualty collisions were more likely to occur in October. July experienced the least number of pedestrian crashes.
Month of Collision N %
January 105 8.8
February 91 7.7
March 107 9.0
April 81 6.8
May 93 7.8
June 87 7.3
July 79 6.6
August 80 6.7
September 107 9.0
October 126 10.6
November 122 10.3
December 111 9.3
Total Number of Collisions 1189 100.0

Pedestrians
Alberta Traffic Collision Statistics 2015 Page 51
Table 8.2 Casualty Collisions Involving Pedestrians: Day of Week 2015
Day of Week N %
Monday 181 15.2
Tuesday 191 16.1
Wednesday 185 15.6
Thursday 187 15.7
Friday 185 15.6
Saturday 139 11.7
Sunday 121 10.2
Total Number of Collisions 1189 100.0 Observations
Pedestrian casualty collisions were most likely to occur on Tuesday and least likely to occur on Sunday.
Pedestrians
Alberta Traffic Collision Statistics 2015 Page 52
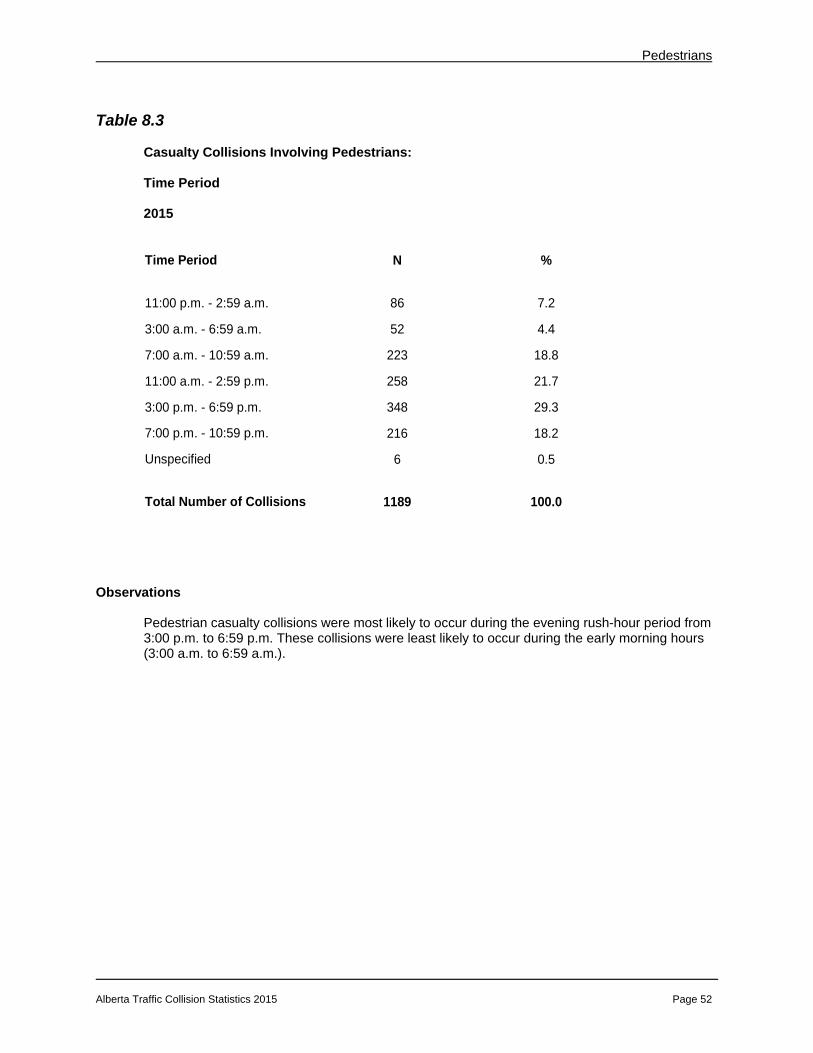
Table 8.3 Casualty Collisions Involving Pedestrians: Time Period 2015
Time Period N %
11:00 p.m. - 2:59 a.m. 86 7.2
3:00 a.m. - 6:59 a.m. 52 4.4
7:00 a.m. - 10:59 a.m. 223 18.8
11:00 a.m. - 2:59 p.m. 258 21.7
3:00 p.m. - 6:59 p.m. 348 29.3
7:00 p.m. - 10:59 p.m. 216 18.2
Unspecified 6 0.5
Total Number of Collisions 1189 100.0 Observations
Pedestrian casualty collisions were most likely to occur during the evening rush-hour period from 3:00 p.m. to 6:59 p.m. These collisions were least likely to occur during the early morning hours (3:00 a.m. to 6:59 a.m.).

Pedestrians
Alberta Traffic Collision Statistics 2015 Page 53
Table 8.4
Casualty Collisions Involving Pedestrians: Location 2015
Location N %
Urban 1146 96.4
Rural 43 3.6
Total Number of Collisions 1189 100.0 Observations
The majority of pedestrian casualty collisions (96.4%) occurred in urban areas. Only 3.6% occurred in rural areas.

Pedestrians
Alberta Traffic Collision Statistics 2015 Page 54
Table 8.5 Actions of Drivers Involved in Casualty Collisions with Pedestrians* 2015
Driver Actions N %
Driving Properly 306 28.9
Failed to Yield Right of Way To Pedestrian 531 50.2
Backed Unsafely 96 9.1
Improper Turn 29 2.7
Ran Off Road 16 1.5
Failed to Yield Right of Way - Uncontrolled Intersection 16 1.5
Followed Too Closely 12 1.1
Left Turn Across Path 11 1.0
Stop Sign Violation 11 1.0
Disobey Traffic Signal 11 1.0
Yield Sign Violation 5 0.5
Left of Centre 3 0.3
Improper Passing 3 0.3
Improper Lane Change 2 0.2
Other 6 0.6
Total Number of Drivers 1058 100.0 Observations 28.9% of the drivers involved in pedestrian casualty crashes were recorded as driving properly. However, 50.2% of the drivers involved in pedestrian casualty collisions failed to yield the right of way to the pedestrian. *Based on those cases where driver actions were specified on the collision report form.

Pedestrians
Alberta Traffic Collision Statistics 2015 Page 55
Table 8.6 Age of Pedestrian Casualties 2015
Pedestrians Killed
Pedestrians Injured
Pedestrian Casualty Rate
Per 10,000 Population*
Age in Years N N N %
Under 5 -- 20 20 1.6 0.7
5 - 9 1 53 54 4.4 2.1
10 - 14 1 75 76 6.2 3.3
15 - 19 2 123 125 10.1 5.1
20 - 24 1 122 123 10.0 4.2
25 - 29 2 122 124 10.0 3.6
30 - 34 2 94 96 7.8 2.6
35 - 44 9 150 159 12.9 2.6
45 - 54 5 142 147 11.9 2.6
55 - 64 5 125 130 10.5 2.6
65 and over 8 128 136 11.0 2.8
Unspecified -- 44 44 3.6
Total Number of Pedestrian Casualties 36 1198 1234 100.0
Total Pedestrian Casualties
Observations
The casualty rate per population was highest for pedestrians between the ages of 15 and 19. The lowest casualty rate was recorded for children under 5 years of age.
*Source: Based on estimates of the Alberta population by age groups and sex, July 1, 2015, Statistics Canada
Pedestrians
Alberta Traffic Collision Statistics 2015 Page 56
Figure 7
0.7
2.1
3.3
5.1
4.2
3.6
2.6 2.6 2.6 2.62.8
0.0
1.0
2.0
3.0
4.0
5.0
6.0
Und
er 5
5 -
9
10 -
14
15 -
19
20 -
24
25 -
29
30 -
34
35 -
44
45 -
54
55 -
64
65 a
nd o
ver
Cas
ual
ty R
ate
per
10,
000
Po
pu
lati
on
Age in Years
Pedestrian CasualtiesAlberta 2015

Pedestrians
Alberta Traffic Collision Statistics 2015 Page 57
Table 8.7 Condition of Pedestrians Involved in Casualty Collisions* 2015
Condition of Pedestrian N % N % N %
Normal 17 73.9 944 88.5 961 88.2
Had Been Drinking 2 8.7 42 3.9 44 4.0
Alcohol Impaired 3 13.0 67 6.3 70 6.4
Total Alcohol Involvement 5 21.7 109 10.2 114 10.5
Impaired by Drugs -- -- 7 0.7 7 0.6
Fatigued/Asleep -- -- 1 0.1 1 0.1
Other 1 4.3 6 0.6 7 0.6
Total Number of Pedestrians 23 100.0 1067 100.0 1090 100.0
Pedestrians in Fatal Collisions
Pedestrians in Non-Fatal Injury
Collisions
Total Pedestrians in Casualty Collisions
Observations
Of pedestrians involved in injury collisions, 10.2% had consumed alcohol before the collision, compared to 21.7% involved in fatal collisions. As the severity of the collision increased, the involvement of alcohol increased.
*Based only on those cases where pedestrian condition was specified on the collision report form.

Pedestrians
Alberta Traffic Collision Statistics 2015 Page 58
Table 8.8 Age of Drinking Pedestrians Involved in Casualty Collisions* 2015
Observations
Of those pedestrians who had consumed alcohol prior to the collision, the highest rate of involvement per 10,000 population was for pedestrians 20 - 24 years of age.
*Based on those cases where pedestrian condition was specified on the collision report form. **Source: Based on estimates of the Alberta population by age groups and sex, July 1, 2015, Statistics Canada.
Rate per 10,000 Population**
Age in Years N %
Under 10 -- -- --
10 - 14 1 0.9 0.0
15 - 19 3 2.6 0.1
20 - 24 18 15.8 0.6
25 - 29 15 13.2 0.4
30 - 34 15 13.2 0.4
35 - 44 20 17.5 0.3
45 - 54 26 22.8 0.5
55 - 64 8 7.0 0.2
65 and over 4 3.5 0.1
Unspecified 4 3.5
Total Number of Pedestrian Casualties 114 100.0

Bicyclists
Alberta Traffic Collision Statistics 2015 Page 59
Bicyclists
Casualty collisions involving bicycles were more likely to occur in the month of July. Weekdays experienced the most casualty collisions involving bicycles. As well, the largest
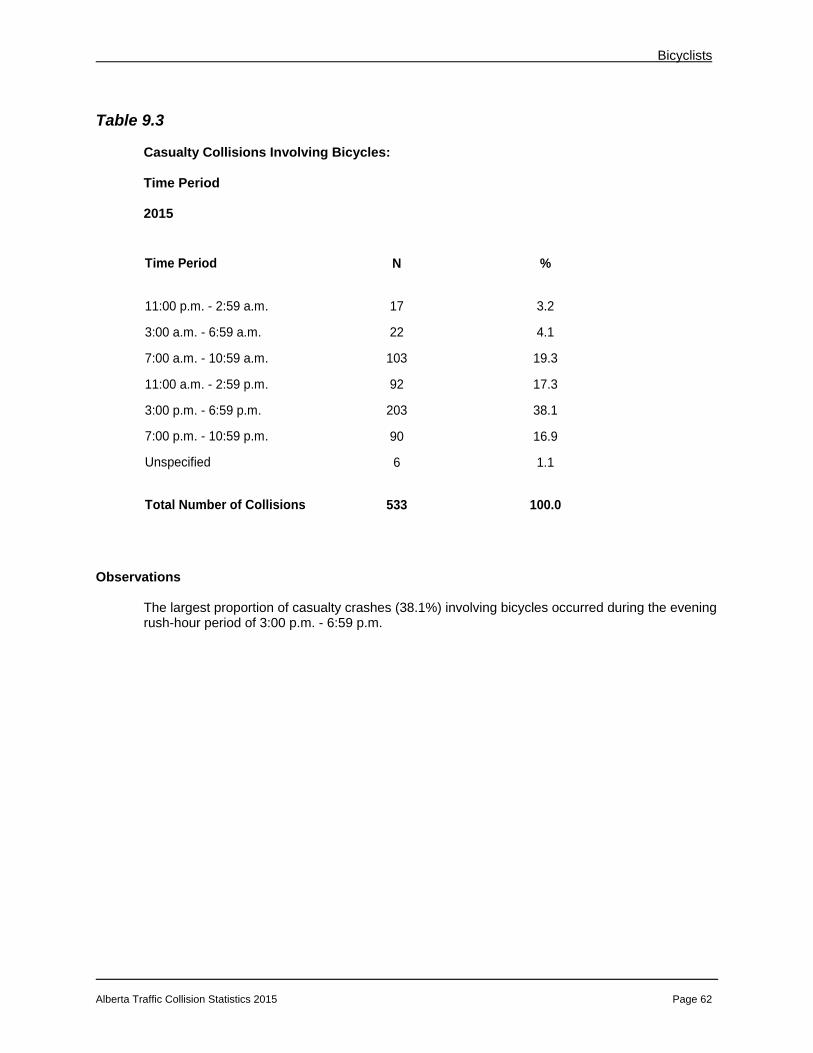
number of these crashes (38.1%) occurred during the evening rush-hour period.
Young bicyclists aged 15 to 19 had the highest casualty rate per 10,000 population. Compared to operators of all vehicles in casualty collisions, bicyclists were more likely to disobey
a traffic signal or fail to yield right-of-way at an uncontrolled intersection.
5.2% of bicyclists involved in casualty collisions had consumed alcohol before the crash.

Bicyclists
Alberta Traffic Collision Statistics 2015 Page 60
Table 9.1 Casualty Collisions Involving Bicycles: Month of Occurrence 2015
Month of Collision N %
January 7 1.3
February 8 1.5
March 15 2.8
April 44 8.3
May 54 10.1
June 87 16.3
July 91 17.1
August 80 15.0
September 76 14.3
October 46 8.6
November 17 3.2
December 8 1.5
Total Number of Collisions 533 100.0
Observations
The highest number of casualty crashes involving bicycles occurred during the month of July.

Bicyclists
Alberta Traffic Collision Statistics 2015 Page 61
Table 9.2 Casualty Collisions Involving Bicycles: Day of Week 2015
Day of Week N %
Monday 65 12.2
Tuesday 91 17.1
Wednesday 97 18.2
Thursday 94 17.6
Friday 90 16.9
Saturday 58 10.9
Sunday 38 7.1
Total Number of Collisions 533 100.0 Observations
Casualty collisions involving bicycles were most likely to occur on weekdays.
Bicyclists
Alberta Traffic Collision Statistics 2015 Page 62
Table 9.3 Casualty Collisions Involving Bicycles: Time Period 2015
Time Period N %
11:00 p.m. - 2:59 a.m. 17 3.2
3:00 a.m. - 6:59 a.m. 22 4.1
7:00 a.m. - 10:59 a.m. 103 19.3
11:00 a.m. - 2:59 p.m. 92 17.3
3:00 p.m. - 6:59 p.m. 203 38.1
7:00 p.m. - 10:59 p.m. 90 16.9
Unspecified 6 1.1
Total Number of Collisions 533 100.0 Observations
The largest proportion of casualty crashes (38.1%) involving bicycles occurred during the evening rush-hour period of 3:00 p.m. - 6:59 p.m.
Bicyclists
Alberta Traffic Collision Statistics 2015 Page 63
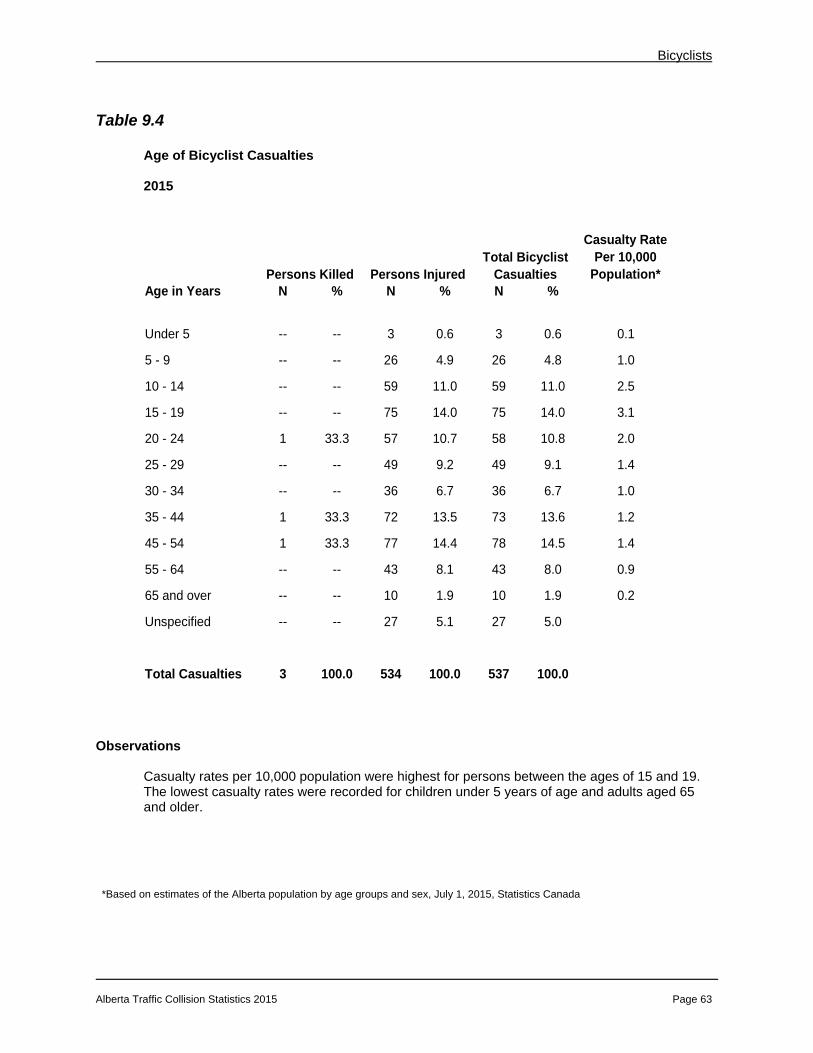
Table 9.4 Age of Bicyclist Casualties 2015
Casualty RatePer 10,000
Population*Age in Years N % N % N %
Under 5 -- -- 3 0.6 3 0.6 0.1
5 - 9 -- -- 26 4.9 26 4.8 1.0
10 - 14 -- -- 59 11.0 59 11.0 2.5
15 - 19 -- -- 75 14.0 75 14.0 3.1
20 - 24 1 33.3 57 10.7 58 10.8 2.0
25 - 29 -- -- 49 9.2 49 9.1 1.4
30 - 34 -- -- 36 6.7 36 6.7 1.0
35 - 44 1 33.3 72 13.5 73 13.6 1.2
45 - 54 1 33.3 77 14.4 78 14.5 1.4
55 - 64 -- -- 43 8.1 43 8.0 0.9
65 and over -- -- 10 1.9 10 1.9 0.2
Unspecified -- -- 27 5.1 27 5.0
Total Casualties 3 100.0 534 100.0 537 100.0
Persons Killed Persons InjuredTotal Bicyclist
Casualties
Observations
Casualty rates per 10,000 population were highest for persons between the ages of 15 and 19. The lowest casualty rates were recorded for children under 5 years of age and adults aged 65 and older.
*Based on estimates of the Alberta population by age groups and sex, July 1, 2015, Statistics Canada

Bicyclists
Alberta Traffic Collision Statistics 2015 Page 64
Table 9.5 Improper Actions of Bicyclists Involved in Casualty Collisions 2015
Driver Actions inTotal CasualtyCollisions (AllVehicle Types)
Improper Actions ofBicyclists N % %
Disobey Traffic Signal 44 23.4 6.7
Failed to Yield Right of Way - Uncontrolled Intersection 26 13.8 2.1
Stop Sign Violation 23 12.2 8.3
Followed Too Closely 7 3.7 31.2
Backed Unsafely 5 2.7 2.5
Improper Lane Change 5 2.7 3.2
Left Turn Across Path 5 2.7 11.3
Improper Turn 4 2.1 3.4
Left of Centre 4 2.1 2.9
Improper Passing 4 2.1 1.0
Failed to Yield Right of Way to Pedestrian 3 1.6 5.4
Yield Sign Violation 3 1.6 1.7
Ran Off Road 2 1.1 18.4
Other 53 28.2 2.0
Total Number of Bicyclists 188 100.0 Observations
Compared to operators of all vehicles in casualty collisions, bicyclists were more likely to disobey a traffic signal or to fail to yield right-of-way at an uncontrolled intersection.
*Based on those cases where driver actions were specified on the collision report form. Note: There were a total of 381 bicyclists involved in casualty collisions for which a driver action was specified on the collision report
form. 193 were indicated as driving properly at the time of the collision.

Bicyclists
Alberta Traffic Collision Statistics 2015 Page 65
Table 9.6 Condition of Bicyclists Involved in Casualty Collisions* 2015
Condition of Bicyclist N %
Normal 449 93.7
Had Been Drinking 17 3.5
Alcohol Impaired 8 1.7
Total Alcohol Involvement 25 5.2
Impaired by Drugs 2 0.4
Fatigued/Asleep 1 0.2
Other 2 0.4
Total Number of Bicyclists 479 100.0 Observations
5.2% of bicyclists involved in casualty collisions had consumed alcohol before the crash. *Based only on those cases where bicyclist condition was specified on the collision report form.
Bicyclists
Alberta Traffic Collision Statistics 2015 Page 66
Traffic Safety Issues
Alberta Traffic Collision Statistics 2015 Page 67
Traffic Safety Issues Alcohol Involvement
A total of 3.1% of drivers involved in injury crashes were judged to have consumed alcohol prior to the crash, compared to 19.8% of drivers involved in fatal collisions. As the severity of the collision increased, the involvement of alcohol dramatically increased.
In terms of involvement per 1,000 licenced drivers, males between 18 and 21 years of age were
most likely to have been drinking before the crash. There were over four times as many male drivers as female drivers who had consumed alcohol prior to the collision.
In 2015, alcohol related casualty crashes were most likely to have occurred in May, on Saturday,
and between 11:00 p.m. and 2:59 a.m.
Figure 8 provides a graphic representation of the involvement of drinking drivers in casualty collisions over the past five years, 2011 - 2015.
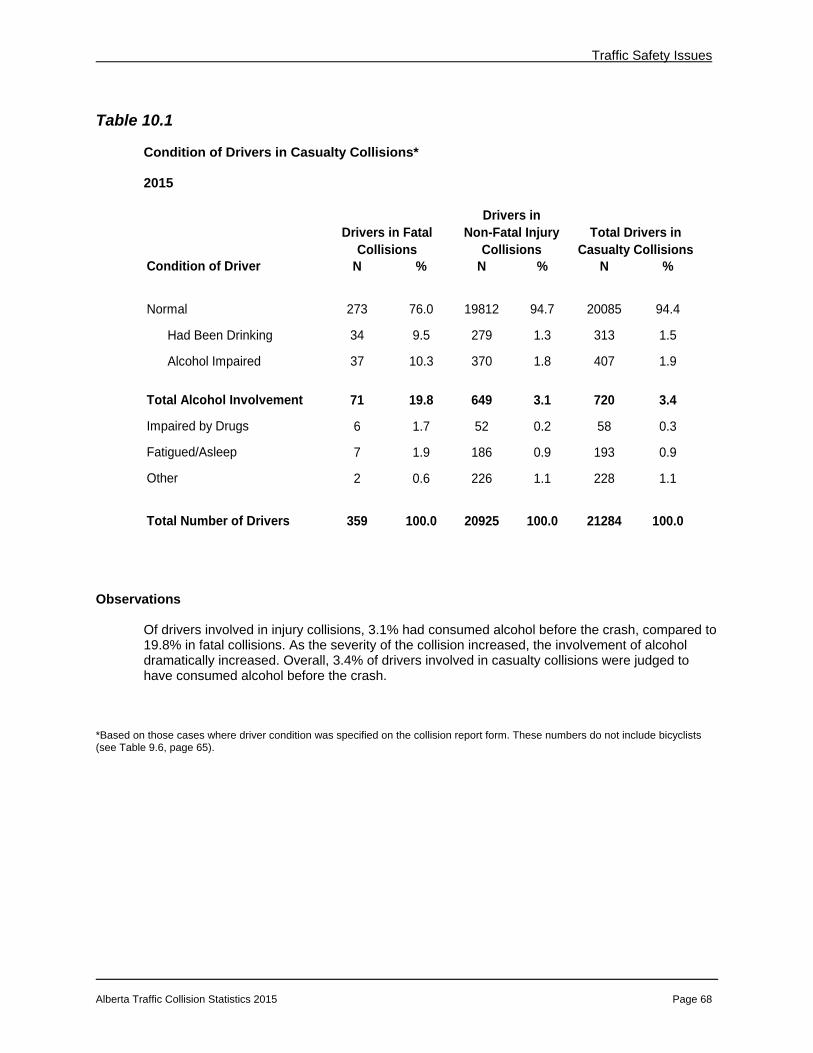
Traffic Safety Issues
Alberta Traffic Collision Statistics 2015 Page 68
Table 10.1 Condition of Drivers in Casualty Collisions* 2015
Condition of Driver N % N % N %
Normal 273 76.0 19812 94.7 20085 94.4
Had Been Drinking 34 9.5 279 1.3 313 1.5
Alcohol Impaired 37 10.3 370 1.8 407 1.9
Total Alcohol Involvement 71 19.8 649 3.1 720 3.4
Impaired by Drugs 6 1.7 52 0.2 58 0.3
Fatigued/Asleep 7 1.9 186 0.9 193 0.9
Other 2 0.6 226 1.1 228 1.1
Total Number of Drivers 359 100.0 20925 100.0 21284 100.0
Drivers in Fatal Collisions
Drivers in Non-Fatal Injury
CollisionsTotal Drivers in
Casualty Collisions
Observations
Of drivers involved in injury collisions, 3.1% had consumed alcohol before the crash, compared to 19.8% in fatal collisions. As the severity of the collision increased, the involvement of alcohol dramatically increased. Overall, 3.4% of drivers involved in casualty collisions were judged to have consumed alcohol before the crash.
*Based on those cases where driver condition was specified on the collision report form. These numbers do not include bicyclists (see Table 9.6, page 65).

Traffic Safety Issues
Alberta Traffic Collision Statistics 2015 Page 69
Figure 8
19.8
15.917.5
19.6
16.5
3.1 3.3 3.3 4.1 4.4
0
5
10
15
20
25
2015 2014 2013 2012 2011
% I
nvo
lve
men
t o
f D
rin
kin
g D
rive
rs
Driver Condition
Involvement of Drinking Drivers in Casualty Collisions Alberta 2011 - 2015
Fatal Collisions Injury Collisions

Traffic Safety Issues
Alberta Traffic Collision Statistics 2015 Page 70
Figure 9
76.0
9.510.3
19.8
94.7
1.3 1.83.1
0
10
20
30
40
50
60
70
80
90
100
Normal Had Been Drinking Alcohol Impaired TOTAL AlcoholInvolvement
% o
f D
rive
rs i
n C
asu
alty
Co
llisi
on
s
Driver Condition
Driver Condition in Casualty Collisions Alberta 2015
Fatal Collisions Injury Collisions
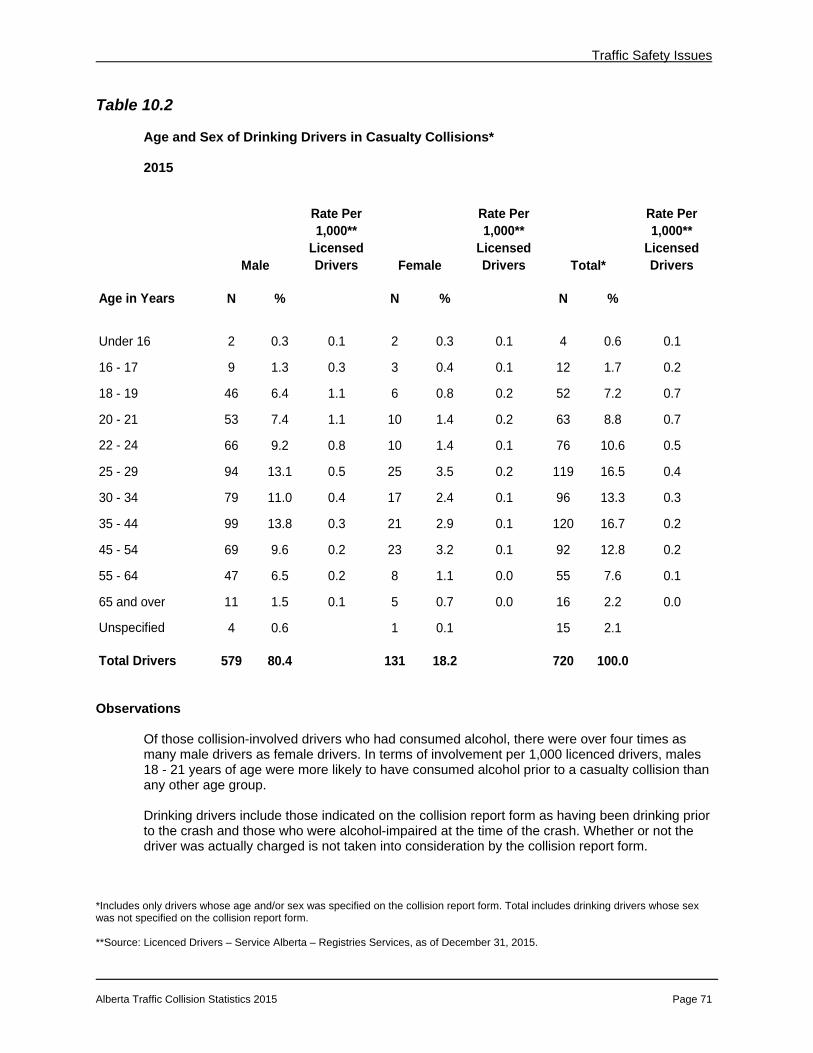
Traffic Safety Issues
Alberta Traffic Collision Statistics 2015 Page 71
Table 10.2 Age and Sex of Drinking Drivers in Casualty Collisions* 2015
Rate Per 1,000**
Licensed Drivers
Rate Per 1,000**
Licensed Drivers
Rate Per 1,000**
Licensed Drivers
Age in Years N % N % N %
Under 16 2 0.3 0.1 2 0.3 0.1 4 0.6 0.1
16 - 17 9 1.3 0.3 3 0.4 0.1 12 1.7 0.2
18 - 19 46 6.4 1.1 6 0.8 0.2 52 7.2 0.7
20 - 21 53 7.4 1.1 10 1.4 0.2 63 8.8 0.7
22 - 24 66 9.2 0.8 10 1.4 0.1 76 10.6 0.5
25 - 29 94 13.1 0.5 25 3.5 0.2 119 16.5 0.4
30 - 34 79 11.0 0.4 17 2.4 0.1 96 13.3 0.3
35 - 44 99 13.8 0.3 21 2.9 0.1 120 16.7 0.2
45 - 54 69 9.6 0.2 23 3.2 0.1 92 12.8 0.2
55 - 64 47 6.5 0.2 8 1.1 0.0 55 7.6 0.1
65 and over 11 1.5 0.1 5 0.7 0.0 16 2.2 0.0
Unspecified 4 0.6 1 0.1 15 2.1
Total Drivers 579 80.4 131 18.2 720 100.0
Male Female Total*
Observations
Of those collision-involved drivers who had consumed alcohol, there were over four times as many male drivers as female drivers. In terms of involvement per 1,000 licenced drivers, males 18 - 21 years of age were more likely to have consumed alcohol prior to a casualty collision than any other age group. Drinking drivers include those indicated on the collision report form as having been drinking prior to the crash and those who were alcohol-impaired at the time of the crash. Whether or not the driver was actually charged is not taken into consideration by the collision report form.
*Includes only drivers whose age and/or sex was specified on the collision report form. Total includes drinking drivers whose sex was not specified on the collision report form. **Source: Licenced Drivers – Service Alberta – Registries Services, as of December 31, 2015.

Traffic Safety Issues
Alberta Traffic Collision Statistics 2015 Page 72
Figure 10
0.1
0.3
1.1 1.1
0.8
0.5
0.4
0.3
0.2
0.2
0.1
0.10.1
0.2
0.2
0.10.2
0.10.1 0.1
0.0 0.0
0.0
0.2
0.4
0.6
0.8
1.0
1.2
Under 16 16 - 17 18 - 19 20 - 21 22 - 24 25 - 29 30 - 34 35 - 44 45 - 54 55 - 64 65 andover
Rat
e p
er
1,00
0 L
ice
nce
d D
rive
rs
Age in Years
Drinking Drivers Involved in Casualty Collisions Alberta 2015
Male Female
Note: The bars in the above figure depict the actual number. The data labels have been rounded.
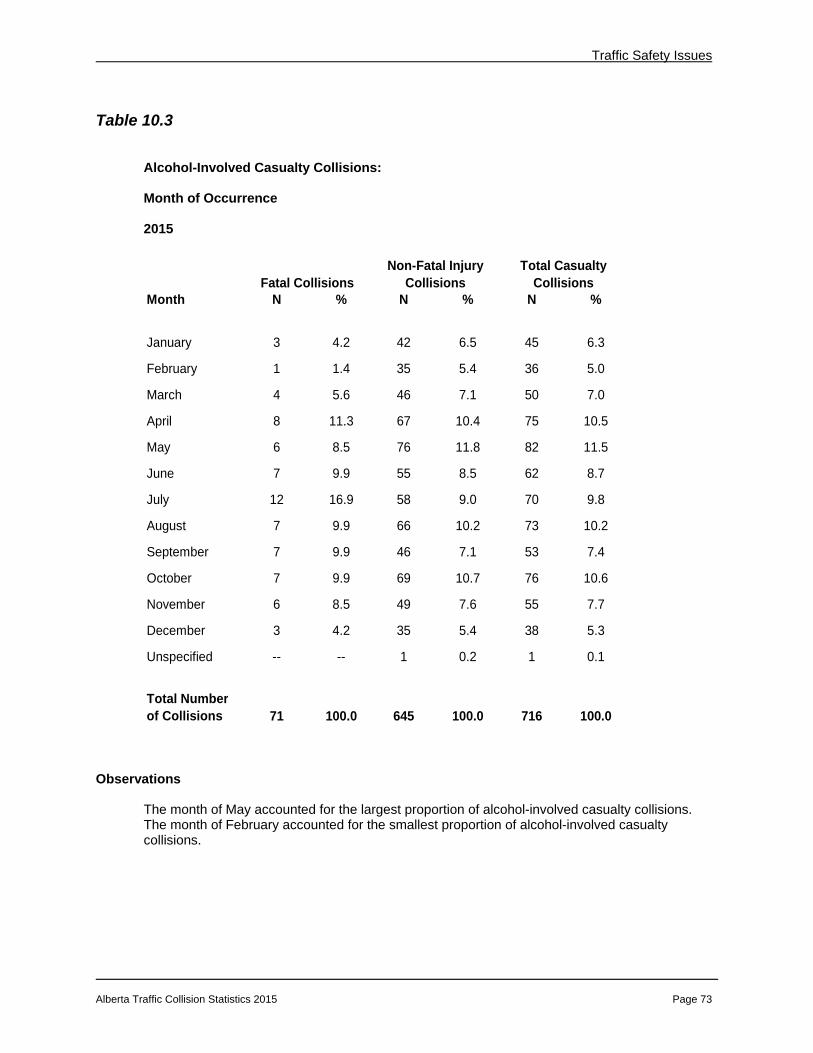
Traffic Safety Issues
Alberta Traffic Collision Statistics 2015 Page 73
Table 10.3
Alcohol-Involved Casualty Collisions: Month of Occurrence 2015
Month N % N % N %
January 3 4.2 42 6.5 45 6.3
February 1 1.4 35 5.4 36 5.0
March 4 5.6 46 7.1 50 7.0
April 8 11.3 67 10.4 75 10.5
May 6 8.5 76 11.8 82 11.5
June 7 9.9 55 8.5 62 8.7
July 12 16.9 58 9.0 70 9.8
August 7 9.9 66 10.2 73 10.2
September 7 9.9 46 7.1 53 7.4
October 7 9.9 69 10.7 76 10.6
November 6 8.5 49 7.6 55 7.7
December 3 4.2 35 5.4 38 5.3
Unspecified -- -- 1 0.2 1 0.1
Total Numberof Collisions 71 100.0 645 100.0 716 100.0
Non-Fatal InjuryCollisions
Total CasualtyCollisionsFatal Collisions
Observations
The month of May accounted for the largest proportion of alcohol-involved casualty collisions. The month of February accounted for the smallest proportion of alcohol-involved casualty collisions.

Traffic Safety Issues
Alberta Traffic Collision Statistics 2015 Page 74
Table 10.4
Alcohol-Involved Casualty Collisions: Day of Week 2015
Day of Week N % N % N %
Monday 5 7.0 87 13.5 92 12.8
Tuesday 8 11.3 81 12.6 89 12.4
Wednesday 11 15.5 63 9.8 74 10.3
Thursday 7 9.9 66 10.2 73 10.2
Friday 6 8.5 91 14.1 97 13.5
Saturday 17 23.9 145 22.5 162 22.6
Sunday 17 23.9 111 17.2 128 17.9
Unspecified -- -- 1 0.2 1 0.1
Total Number of Collisions 71 100.0 645 100.0 716 100.0
Fatal CollisionsNon-Fatal Injury
CollisionsTotal Casualty
Collisions
Observations
The highest number of alcohol-involved fatal collisions occurred on Saturday and Sunday (23.9%). The highest number of non-fatal injury collisions occurred on Saturday (22.5%). The smallest number of alcohol-involved casualty collisions occurred on Thursday (10.2%).

Traffic Safety Issues
Alberta Traffic Collision Statistics 2015 Page 75
Table 10.5
Alcohol-Involved Casualty Collisions: Time Period 2015
Time Period N % N % N %
11:00 p.m. - 2:59 a.m. 19 26.8 193 29.9 212 29.6
3:00 a.m. - 6:59 a.m. 8 11.3 73 11.3 81 11.3
7:00 a.m. - 10:59 a.m. 5 7.0 38 5.9 43 6.0
11:00 a.m. - 2:59 p.m. 8 11.3 45 7.0 53 7.4
3:00 p.m. - 6:59 p.m. 12 16.9 127 19.7 139 19.4
7:00 p.m. - 10:59 p.m. 19 26.8 161 25.0 180 25.1
Unspecified -- -- 8 1.2 8 1.1
Total Number of Collisions 71 100.0 645 100.0 716 100.0
Non-Fatal Injury Collisions
Total Casualty CollisionsFatal Collisions
Observations
The late night/early morning time period (11:00 p.m. – 2:59 a.m.) was most likely to record alcohol-involved casualty collisions (29.6%). The morning hours (7:00 a.m. – 10:59 a.m.) were least likely to record alcohol-involved casualty crashes (6.0%).

Traffic Safety Issues
Alberta Traffic Collision Statistics 2015 Page 76
Figure 11
Alcohol-Involved Casualty Collisions Alberta 2015
6.35.0
7.0
10.511.5
8.79.8 10.2
7.4
10.6
7.7
5.3
0.0
2.0
4.0
6.0
8.0
10.0
12.0
14.0
Jan Feb Mar Apr May Jun Jul Aug Sep Oct Nov Dec
% o
f A
lco
ho
l In
volv
ed
Cas
ual
ty C
olli
sio
ns
By Month of Occurrence
12.8 12.410.3 10.2
13.5
22.6
17.9
0.0
5.0
10.0
15.0
20.0
25.0
Monday Tuesday Wednesday Thursday Friday Saturday Sunday
% o
f A
lco
ho
l In
volv
ed
Cas
ual
ty C
olli
sio
ns
By Day of Week
29.6
11.3
6.0 7.4
19.4
25.1
0.0
5.0
10.0
15.0
20.0
25.0
30.0
35.0
11:00 pm-2:59 am 3:00 am-6:59 am 7:00 am-10:59 am 11:00 am-2:59 pm 3:00 pm-6:59 pm 7:00 pm-10:59 pm
% o
f A
lco
ho
l In
volv
ed
Cas
ual
ty
Co
llisi
on
s
By Time Period

Traffic Safety Issues
Alberta Traffic Collision Statistics 2015 Page 77
Traffic Safety Issues
Restraint Use
Collision-involved restraint users had a much lower injury rate (6.8%) than those not using
restraints (22.4%).
Occupants using a restraint reduce the likelihood of sustaining an injury and the severity
of injury decreases.

Traffic Safety Issues
Alberta Traffic Collision Statistics 2015 Page 78
Table 10.6
Restraint Use of Vehicle Occupants and Injury Severity* (Use versus Non-Use) 2015
Injury Severity of Occupants
Percentage of Occupants Using
Restraints
Percentage of Occupants Not Using
Restraints% %
Fatal Injury 0.1 3.5
Major Injury 0.9 7.9
Minor Injury 5.9 11.0
Total Occupants Sustaining Injuries 6.8 22.4
No Apparent Injury 93.2 77.6
Total Occupants 100.0 100.0
Observations
Collision involved restraint users had a much lower injury rate (6.8%) than those not using restraints (22.4%). This table illustrates the moderating effect of seat belt use on injury severity. Occupants using a restraint reduce the likelihood of sustaining an injury and the severity of injury decreases.
Injury Severity
Fatal – A fatal injury is the death of a person that occurs as a result of a motor vehicle collision within 30 days of the collision.
Major – Persons with injuries or complaint of pain that went to the hospital and were subsequently admitted even if for observation only.
Minor – Persons with injuries or complaint of pain that went to the hospital, were treated in emergency (or refused treatment) and SENT HOME without ever being admitted to the hospital. (Also includes persons who indicated they intend to seek medical attention.)
*Based on those cases where occupant restraint use and injury severity were specified on the collision report form.