alaska railbelt electrical grid authority (rega… · alaska railbelt electrical grid authority...
TRANSCRIPT

ALASKA RAILBELT ELECTRICAL GRID AUTHORITY
(REGA) Study
Final Report
September 12, 2008
DISCLAIMER ALASKA REGA STUDY
Black & Veatch September 12, 2008
DISCLAIMER STATEMENT In conducting our analysis and in forming the recommendations summarized in this report, Black & Veatch Corporation (Black & Veatch) has made certain assumptions with respect to conditions, events, and circumstances that may occur in the future. The methodologies we utilized in performing the analysis and developing our recommendations follow generally accepted industry practices. While we believe that such assumptions and methodologies as summarized in this report are reasonable and appropriate for the purpose for which they are used, depending upon conditions, events, and circumstances that actually occur but are unknown at this time, actual results may materially differ from those projected. Such factors may include, but are not limited to, the ability of the Railbelt electric utilities and the State of Alaska to implement the recommendations and execute the implementation plan contained herein, the regional and national economic climate, and growth in the Railbelt region.
Readers of this report are advised that any projected or forecasted financial, operating, growth, performance, or strategy merely reflects the reasonable judgment of Black & Veatch at the time of the preparation of such information and is based on a number of factors and circumstances beyond our control. Accordingly, Black & Veatch makes no assurances that the projections or forecasts will be consistent with actual results or performance.
Any use of this report, and the information therein, constitutes agreement that: 1) Black & Veatch makes no warranty, express or implied, relating to this report, 2) the user accepts the sole risk of any such use, and 3) the user waives any claim for damages of any kind against Black & Veatch.
Furthermore, readers of this report should understand that its focus is on the evaluation of alternative organizational structures for the reconfiguration of the generation and transmission functions of the Railbelt utilities. In completing its analysis, Black & Veatch evaluated alternative energy futures and developed prescriptive resource plans for each energy future considered. These prescriptive resource plans were developed to assist in the evaluation of alternative organizational paths. These prescriptive resource plans are not alternative integrated resource plans; as such, readers should not compare the prescriptive resource plans to each other nor should they draw any conclusions from this analysis as to what the optimal resource mix for the Railbelt over the next 30 years might include.

ACKNOWLEDGEMENTS ALASKA REGA STUDY
Black & Veatch September 12, 2008
ACKNOWLEDGEMENTS The Black & Veatch project team would like to thank the following individuals for their valuable contributions to this project.
Alaska Energy Authority/Alaska Industrial Development and Export Authority • Steve Haagenson, P.E., AEA Executive Director • James Strandberg, P.E., Project Manager • Sarah Fisher-Goad, Deputy Director, Operations • Jim Hemsath, P.E., Deputy Director,
Development • Karl Reiche, Projects Development Manager • Christopher Rutz, C.P.M., Procurement Manager
• David Lockard, P.E., Geothermal and Ocean Energy Program Manager
• James Jensen, Project Manager • Martina Dabo, Wind Project Manager • Peter Crimp, Project Manager • Rebecca Garrett, Energy Efficiency Program
Manager • Sherrie Siverson, Administrative Assistant
Railbelt Utilities (numerous management personnel from the following Railbelt utilities) • Anchorage Municipal Light & Power • Chugach Electric Association • City of Seward Electric System
• Golden Valley Electric Association • Homer Electric Association • Matanuska Electric Association
Advisory Working Group Members • Norman Rokeberg, Retired State of Alaska
Representative, Chairman • Chris Rose, Renewable Energy Alaska Project,
Vice Chairman • Brad Janorschke, Homer Electric Association • Brian Newton, Golden Valley Electric
Association • Colleen Starring, Enstar Natural Gas Company • Debra Schnebel, Scott Balice Strategies
• Jan Wilson, Regulatory Commission of Alaska • Jim Sykes, Alaska Public Interest Group • Kip Knudson, Tesoro • Lois Lester, AARP • Marilyn Leland, Alaska Power Association • Mitch Little/Les Webber, Marathon Oil
Company • Nick Goodman, TDX Power, Inc. • Steve Denton, Usibelli Coal Mine, Inc. • Tony Izzo, TMI Consulting
ACKNOWLEDGEMENTS ALASKA REGA STUDY
Black & Veatch September 12, 2008
Additional Non-Utility Stakeholders That Provided Input to Project • Alexander Gajdos, Energia Cura • Ashley Schmiedeskamp, Cook Inlet Region, Inc. • Bob Charles, Association of Village Council
Presidents/Nuvista Light and Electric Cooperative, Inc.
• Brian Rogers, Information Insights • Buki Wright, Aurora Energy • Charles Thomas, SAIC • Chris Tuck, IBEW 1547 • Christine Vecchio, MEA Ratepayers Alliance • Curtis Thayer, Enstar Gas Company • Dave Carlson, Four Dam Power Pool • Dave Lappi, Alaska Wind Power LLC • Delbert LaRue, Dryden & LaRue • Dennis Witmer, Arctic Energy Technology
Development Laboratory • Doug Nicholson, NovaGold Alaska, Inc. • Ed Williams, Four Dam Power Pool • Eric Marchegiani, USDA - RUS • Eric Uhde, Alaska Center for the Environment • Eric Yould, Wood Canyon, Inc. • François Vecchio, Consultant • Fred Abegg, Consultant • Fred Boness, Consultant • Fred Valdez, Chugach Renewable Energy
Committee • Harold Heinze, Alaska Natural Gas Development
Authority • Ian Sharrock, Chugach Renewable Energy
Committee
• James Fueg, Barrick Gold Corporation • James Mery, Doyon, Limited • Julius Matthews, IBEW 1547 • Mark Johnson, Regulatory Commission of
Alaska • Mark Masteller, Alaska Center for Appropriate
Technology • Mary Ann Pease, MAP Consulting, LLC • Michael Hubbard, Financial Engineering
Company • Mike Hodsdon, IBEW 1547 • Parker Nation, State of Alaska - Department of
Law • Pat Kennedy, Chugach Renewable Energy
Committee • Pat Lavin, Conservation Policy Advocate • Randy Hobbs, Tiqun Energy, Inc. • Ray Krieg, Chugach Consumers • Richard C. Hundrup, Usibelli Coal Mine, Inc. • Rufus Bunch, Aurora Energy • Scott Waterman, Alaska Housing Finance
Corporation • Sean Skaling, Chugach Renewable Energy
Committee • Steve Borrell, Alaska Miners Association • Steve Gilbert, enXco Development Corp. • Tim Johnson, Kenai Gasification Project • Tim Leach, MEA Ratepayers Alliance • Trish Rolfe, Sierra Club • Willard Dunham, City of Anchorage
Additional Contributors • Bob Richhart, Hoosier Energy Rural Electric
Cooperative, Inc. • Christine Hein Pihl, J.P. Morgan Securities, Inc. • Fred Boness, former Municipal Attorney for the
Municipality of Anchorage • Gary Smith, PowerSouth Energy Cooperative • Isaac Sine, Merrill Lynch & Co. • John Carley, South Mississippi Electric Power
Association
• John Miller, Citibank • John Pirog, Hawkins, Delafield & Wood • Ken Vassar, Birch Horton Bittner & Cherot • Margie Backstrom, Morgan Stanley • Martin Lowery, National Rural Electric
Cooperative Association • Pat Baumhoer, Associated Electric Cooperative,
Inc.

ACKNOWLEGEMENTS ALASKA REGA STUDY
Black & Veatch September 12, 2008
“The long-term failure of the Railbelt utilities to
deal with aging generation and other related energy issues suggests that there is
insufficient motivation, economic or otherwise, to
come together in a cooperative manner to
solve industry problems.”
Native Corporation Representative
“The bottom line is that in order for an energy
plan to be effective, it has to have support and that has to come from the top
down. When the Governor and the Legislature decide that energy is the number
one priority in order to provide an economically stable State, it will attract
business and people.”
Financial Community Representative
“There is a lack of an over-riding vision and
goals that aligns electrical production and energy
security within a framework that is
ecologically sustainable and equitable to all future
generations.”
Renewable Energy Advocate
“Future results will not be different if we do not
make different choices.”
“Hope is not a strategy.”
Anchorage Chamber of Commerce, Findings and
Conclusions about Alaska’s Energy Crisis
“Alone we can do so little, together we can do so
much.”
Helen Keller
“Coming together is a beginning, staying
together is progress, and working together is
success.”
Henry Ford
“The economic stability of the State relies upon the
Railbelt and consequently there has to be a
substantive investment by the State in it so that the State attracts businesses
and development.”
Financial Community Representative
“The die is cast: electric prices are going up. Since a large percentage of the
generating capacity currently operated by the
utilities is ready for replacement we’re at a point where long-term decisions that support lower power costs over
time are critical.”
Project Developer

TABLE OF CONTENTS ALASKA REGA STUDY
Black & Veatch i September 12, 2008
SECTION PAGE SECTION 1 - EXECUTIVE SUMMARY ..........................................................................................................1 SECTION 2 - PROJECT OVERVIEW AND REPORT OUTLINE .................................................................25 SECTION 3 - SITUATIONAL ASSESSMENT ...............................................................................................37 SECTION 4 - ORGANIZATIONAL PATHS AND EVALUATION SCENARIOS .......................................54 SECTION 5 - EXISTING AND FUTURE RESOURCE OPTIONS ................................................................59 SECTION 6 - ORGANIZATIONAL ISSUES ..................................................................................................74 SECTION 7 - SUMMARY OF ASSUMPTIONS.............................................................................................84 SECTION 8 - SUMMARY OF RESULTS .......................................................................................................95 SECTION 9 - CONCLUSIONS AND RECOMMENDATIONS ...................................................................100 SECTION 10 - NEXT STEPS AND IMPLEMENTATION PLAN ...............................................................128 APPENDIX A - NON-UTILITY STAKEHOLDER INPUT SURVEY INSTRUMENT.............................. A-1 APPENDIX B - PROFILES OF EXAMPLE REGIONAL ORGANIZATIONS............................................B-1 APPENDIX C - SCENARIO A RESULTS.....................................................................................................C-1 APPENDIX D - SCENARIO B RESULTS.................................................................................................... D-1 APPENDIX E - SCENARIO C RESULTS .....................................................................................................E-1 APPENDIX F - SCENARIO D RESULTS .....................................................................................................F-1 APPENDIX G - TAX-EXEMPT BOND FINANCING OPTIONS FOR CONSTRUCTION OF A NEW
ELECTRIC GENERATION AND TRANSMISSION FACILITY TO SERVE THE RAILBELT ........ G-1 APPENDIX H - BIBLIOGRAPHY................................................................................................................ H-1 APPENDIX I - PUBLIC COMMENTS RECEIVED ON DRAFT REPORT.................................................. I-1

LIST OF FIGURES ALASKA REGA STUDY
Black & Veatch ii September 12, 2008
FIGURE PAGE Figure 1 - Summary of Issues Facing the Railbelt Region ..................................................................................2 Figure 2 - Summary of Organizational Paths Evaluated......................................................................................5 Figure 3 - Summary of Evaluation Scenarios ......................................................................................................7 Figure 4 - Summary of Organizational Issues .....................................................................................................9 Figure 5 - Required Cumulative Capital Investment .........................................................................................15 Figure 6 - Summary of Recommendations – Organizational Structure .............................................................21 Figure 7 - Project Approach Overview ..............................................................................................................27 Figure 8 - Elements of Stakeholder Involvement Process .................................................................................30 Figure 9 - Overview of Models..........................................................................................................................31 Figure 10 – Organizational Cost Model.............................................................................................................34 Figure 11 - Summary of Issues Facing the Railbelt Region ..............................................................................38 Figure 12 - Chugach’s Reliance on Natural Gas................................................................................................44 Figure 13 - Chugach’s Gas Supply Outlook ......................................................................................................44 Figure 14 - Overview of Cook Inlet Gas Situation ............................................................................................45 Figure 15 - Projected Supply and Demand for Cook Inlet Gas .........................................................................45 Figure 16 - Historical Chugach Natural Gas Prices Paid...................................................................................46 Figure 17 - Chugach Residential Bills Based on 700 kWh Consumption .........................................................46 Figure 18 - Prices of Natural Gas for Residential Customers ............................................................................47 Figure 19 - Established Renewables Portfolio Standards ..................................................................................50 Figure 20 - Summary of Organizational Paths Evaluated..................................................................................56 Figure 21 - Summary of Evaluation Scenarios ..................................................................................................58 Figure 22 - Generation, Transmission, and Distribution Facilities ....................................................................64 Figure 23 - Existing Load Centers as Modeled..................................................................................................65 Figure 24 - Available Supply-Side and Demand-Side Resource Options .........................................................67 Figure 25 - Summary of Organizational Issues .................................................................................................75 Figure 26 - Organizational Chart .......................................................................................................................94 Figure 27 - Number of Positions by Department ...............................................................................................94 Figure 28 - Summary of Organizational Paths Evaluated..................................................................................95 Figure 29 - Summary of Scenarios Evaluated ...................................................................................................96 Figure 30 - Required Cumulative Capital Investment .......................................................................................99 Figure 31 - Summary of Potential Savings ......................................................................................................108 Figure 32 - Overview of Retail Requirements Approach ................................................................................110 Figure 33 - Summary of Recommendations – Organizational Structure .........................................................118 Figure 34 - Implementation Schedule..............................................................................................................131

LIST OF TABLES ALASKA REGA STUDY
Black & Veatch iii September 12, 2008
TABLE PAGE Table 1 - Summary Listing of Issues Facing the Railbelt Region .......................................................................3 Table 2 - Summary of Organizational Issues.....................................................................................................10 Table 3 - Average Annual Present Worth Power Cost Savings.........................................................................11 Table 4 - Estimated Start-up Costs – Labor.......................................................................................................12 Table 5 - Estimated Start-up Costs – Non-Labor...............................................................................................13 Table 6 - Average Annual Present Worth A&G Costs ($’000) .........................................................................14 Table 7 - Average Annual Present Worth Net Savings (Costs) Under Each Evaluation Scenario ....................14 Table 8 - Estimated Required Capital to Finance the Region’s Future..............................................................17 Table 9 - Value of State Financial Assistance ...................................................................................................18 Table 10 - Value of Tax-Exempt Financing ......................................................................................................18 Table 11 - Summary of Recommendations - Formational Issues ......................................................................22 Table 12 - Relative Cost per kWh (Alaska Versus Other States) ......................................................................41 Table 13 - Relative Monthly Electric Bills Among Alaska Railbelt Utilities....................................................42 Table 14 - Cumulative Impacts of Electric Efficiency Programs as a Percentage of Total Retail Sales ..........51 Table 15 - Summary of Organizational Options ................................................................................................54 Table 16 - ML&P Existing Thermal Units ........................................................................................................59 Table 17 - CEA Existing Thermal Units............................................................................................................60 Table 18 - GVEA Existing Thermal Units.........................................................................................................60 Table 19 - HEA Existing Thermal Units ...........................................................................................................60 Table 20 - Railbelt Hydroelectric Generation Plants .........................................................................................61 Table 21 - Railbelt Installed Capacity................................................................................................................61 Table 22 - Cost of Capital and Fixed Charge Rates...........................................................................................84 Table 23 - Railbelt Load Forecast for Evaluation..............................................................................................85 Table 24 - Fuel Price Reference Forecast ..........................................................................................................85 Table 25 - Railbelt Spinning Reserve Requirements .........................................................................................86 Table 26 - Railbelt Capacity Requirements .......................................................................................................87 Table 27 - Carbon Dioxide Emission Allowance Price Forecast.......................................................................88 Table 28 - Conventional and Emerging Technology Unit Characteristics ........................................................89 Table 29 - Estimated Start-up Level of Effort ...................................................................................................91 Table 30 - Estimated Start-up Costs – Labor.....................................................................................................92 Table 31 - Estimated Start-up Costs – Non-Labor.............................................................................................93 Table 32 - Average Annual Power Cost Savings...............................................................................................97 Table 33 - Average Annual Present Worth A&G Costs ....................................................................................98 Table 34 - Average Annual Present Worth Net Savings (Costs) Under Each Evaluation Scenario ..................98 Table 35 - Average Annual Present Worth Net Savings (Costs) Under Each Evaluation Scenario ................100 Table 36 - Example Regional Generation and Transmission Entities .............................................................103 Table 37 - Estimated Required Capital to Finance the Region’s Future..........................................................104 Table 38 - Value of State Financial Assistance (per $1 Billion of Assistance) ...............................................104 Table 39 - Value of Tax-Exempt Financing ....................................................................................................106 Table 40 - Comparison of Alternative Legal Forms ........................................................................................115 Table 41 - Implementation Budget ..................................................................................................................131
SECTION 1 - EXECUTIVE SUMMARY ALASKA REGA STUDY
Black & Veatch 1 September 12, 2008
“When our children’s children look at the
decisions that we made, what will they think of us?”
“The Railbelt utilities have successfully worked
together to improve the Bradley Lake Project. This
upgrade has made the Railbelt system more
reliable. The lesson here is that utilities can work cooperatively under a
State/private partnership.”
Utility Representative
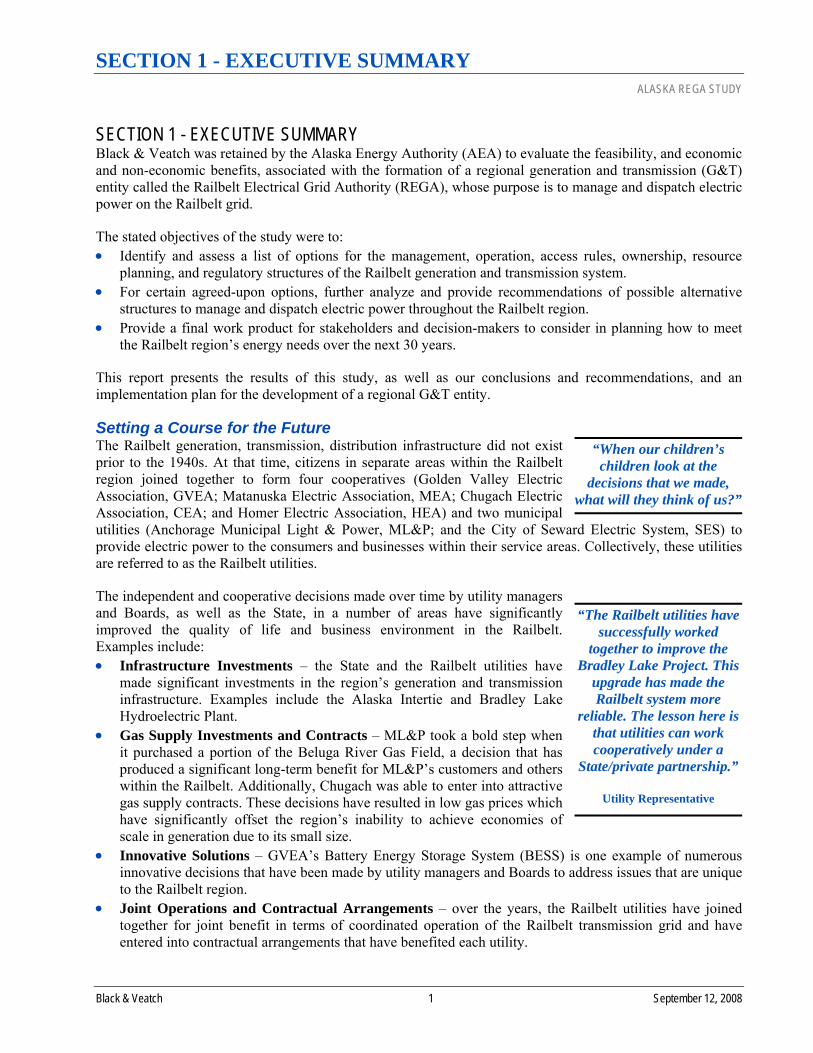
SECTION 1 - EXECUTIVE SUMMARY Black & Veatch was retained by the Alaska Energy Authority (AEA) to evaluate the feasibility, and economic and non-economic benefits, associated with the formation of a regional generation and transmission (G&T) entity called the Railbelt Electrical Grid Authority (REGA), whose purpose is to manage and dispatch electric power on the Railbelt grid.
The stated objectives of the study were to: • Identify and assess a list of options for the management, operation, access rules, ownership, resource
planning, and regulatory structures of the Railbelt generation and transmission system. • For certain agreed-upon options, further analyze and provide recommendations of possible alternative
structures to manage and dispatch electric power throughout the Railbelt region. • Provide a final work product for stakeholders and decision-makers to consider in planning how to meet
the Railbelt region’s energy needs over the next 30 years.
This report presents the results of this study, as well as our conclusions and recommendations, and an implementation plan for the development of a regional G&T entity.
Setting a Course for the Future The Railbelt generation, transmission, distribution infrastructure did not exist prior to the 1940s. At that time, citizens in separate areas within the Railbelt region joined together to form four cooperatives (Golden Valley Electric Association, GVEA; Matanuska Electric Association, MEA; Chugach Electric Association, CEA; and Homer Electric Association, HEA) and two municipal utilities (Anchorage Municipal Light & Power, ML&P; and the City of Seward Electric System, SES) to provide electric power to the consumers and businesses within their service areas. Collectively, these utilities are referred to as the Railbelt utilities.
The independent and cooperative decisions made over time by utility managers and Boards, as well as the State, in a number of areas have significantly improved the quality of life and business environment in the Railbelt. Examples include: • Infrastructure Investments – the State and the Railbelt utilities have
made significant investments in the region’s generation and transmission infrastructure. Examples include the Alaska Intertie and Bradley Lake Hydroelectric Plant.
• Gas Supply Investments and Contracts – ML&P took a bold step when it purchased a portion of the Beluga River Gas Field, a decision that has produced a significant long-term benefit for ML&P’s customers and others within the Railbelt. Additionally, Chugach was able to enter into attractive gas supply contracts. These decisions have resulted in low gas prices which have significantly offset the region’s inability to achieve economies of scale in generation due to its small size.
• Innovative Solutions – GVEA’s Battery Energy Storage System (BESS) is one example of numerous innovative decisions that have been made by utility managers and Boards to address issues that are unique to the Railbelt region.
• Joint Operations and Contractual Arrangements – over the years, the Railbelt utilities have joined together for joint benefit in terms of coordinated operation of the Railbelt transmission grid and have entered into contractual arrangements that have benefited each utility.

SECTION 1 - EXECUTIVE SUMMARY ALASKA REGA STUDY
Black & Veatch 2 September 12, 2008
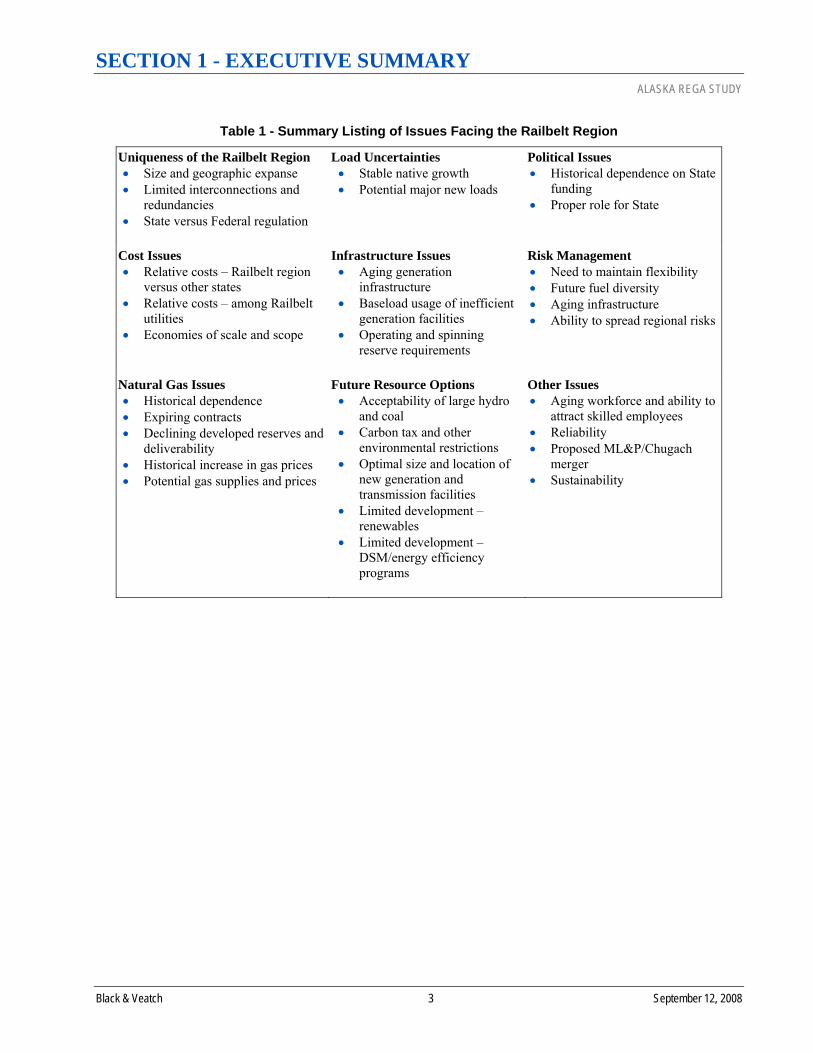
The evolution of the business and operating environments and changes in the mix of stakeholders, presents new dynamics for the way decisions must be made. These changing environments pose significant challenges for the Railbelt utilities and, indeed, all stakeholders. In fact, it is not an overstatement to say that the Railbelt is at a historical crossroad, not unlike the period of time when the Railbelt utilities were originally formed. The following graphic summarizes the key categories of issues currently facing the Railbelt utilities.
Figure 1 - Summary of Issues Facing the Railbelt Region
CostIssues
RAILBELT
Future
Adopt New Direction
Maintain Status Quo
Impact on RailbeltBusinesses and Consumers
Power CostsReliabilitySustainabilityRisks
FutureResourceOptions
Uniquenessof the Railbelt
Region
Natural GasIssues
InfrastructureIssues
LoadUncertainties
PoliticalIssues
RiskManagement
OtherIssues
The following table provides a listing of the issues within each category shown in the graphic above. These issues are addressed in detail in Section 3.
SECTION 1 - EXECUTIVE SUMMARY ALASKA REGA STUDY
Black & Veatch 3 September 12, 2008
Table 1 - Summary Listing of Issues Facing the Railbelt Region
Uniqueness of the Railbelt Region • Size and geographic expanse • Limited interconnections and
redundancies • State versus Federal regulation
Load Uncertainties • Stable native growth • Potential major new loads
Political Issues • Historical dependence on State
funding • Proper role for State
Cost Issues • Relative costs – Railbelt region
versus other states • Relative costs – among Railbelt
utilities • Economies of scale and scope
Infrastructure Issues • Aging generation
infrastructure • Baseload usage of inefficient
generation facilities • Operating and spinning
reserve requirements
Risk Management • Need to maintain flexibility • Future fuel diversity • Aging infrastructure • Ability to spread regional risks
Natural Gas Issues • Historical dependence • Expiring contracts • Declining developed reserves and
deliverability • Historical increase in gas prices • Potential gas supplies and prices
Future Resource Options • Acceptability of large hydro
and coal • Carbon tax and other
environmental restrictions • Optimal size and location of
new generation and transmission facilities
• Limited development – renewables
• Limited development – DSM/energy efficiency programs
Other Issues • Aging workforce and ability to
attract skilled employees • Reliability • Proposed ML&P/Chugach
merger • Sustainability
SECTION 1 - EXECUTIVE SUMMARY ALASKA REGA STUDY
Black & Veatch 4 September 12, 2008
“Quite frankly, we have studied the issues to death and only need to act. What
is likely preventing implementation is the lack
of leadership from management and decision-making from utility boards
on a course of action.”
Utility Representative
* * * “There has been a lack of
courage to make a decision and plan for the future
without perfect knowledge which we all know does not
exist.”
Fuel Supplier
* * * “High energy prices and
reduced supplies are likely to damage the economy of South-central Alaska and
have already damaged rural economies.”
Anchorage Chamber of
Commerce, Findings and Conclusions about Alaska’s
Energy Crisis
“A long-range vision of sustainable and responsible electricity generation and
transmission is needed. We are at a crossroads here in
Alaska. Aging infrastructure, the lack of a
robust transmission network, impressive
natural resources, and the strong public and political
concern regarding the effects of climate change have us balanced between polluting fuel sources of the past and clean fuel sources of the future.”
Consumer Advocate
The current situation facing the Railbelt utilities is the result of thousands of historic decisions, resulting in the electric systems as they exist today, as well as a number of factors (e.g., rising natural gas prices) that are outside the control of utility managers. We received significant comments related to the current issues facing the Railbelt region from not only the utilities themsleves, but also from the numerous non-utility stakeholders who met with the Black & Veatch project team or responded to our non-utility stakeholder input survey instrument. Throughout this report, we provide selected comments in sidebars that, when viewed in total, present a good general overview of the views of various stakeholders of the current Railbelt electric system situation.
Given this widespread recognition of the changing regional conditions, this study was directed by the Alaska Legislature to assess whether reconfiguring the electric generation and transmission elements of the Railbelt region would produce benefits in terms of cost, efficiency and reliability.
Fortunately, the Railbelt region has a number of inherent advantages and significant natural resources that provide a solid basis for working through the
challenges facing it. Additionally, the Railbelt region can learn from the experience of utilities elsewhere and there is no need to “reinvent the wheel.”
Decisions that need to be made over the next five years will set the foundation for the next 50 years. These decisions include: • How best to address the significant issues and manage the risks facing the
Railbelt region. • Whether a regional generation and transmission entity will be formed to
plan and develop new generation and transmission capacity for the Railbelt.
• The specifics of the State Energy Plan, and related policies, that is currently being developed in response to a directive from the Governor.
• The development of a regional Integrated Resource Plan (IRP) that will identify the optimal mix of utility investment in generation resources and transmission, and non-utility investments in conservation resources for the future.
• How the State will optimally deploy the abundant in-state resources, including hydroelectric, coal, renewables, and demand-side management (DSM)/energy efficiency programs to meet the needs of the citizens and businesses in the Railbelt region and throughout the State.
• Determine the best source(s) of financing, including potential State financial assistance, to minimze the costs that will be borne by Railbelt region citizens and businesses related to the capital investments that will be necessary to replace aging infrastructure and reliably meet the future electric needs of the region
Taking a regional approach to economic dispatch, integrated resource planning, and project development will most likely lead to better results than the current situation of six individual decisions working separately to meet the needs of their residential and commercial customers, provided that the regional entity has the appropriate governance structure, and financial and technical expertise.

SECTION 1 - EXECUTIVE SUMMARY ALASKA REGA STUDY
Black & Veatch 5 September 12, 2008
This study is not a State Energy Plan, nor is it an IRP; consequently, we do not answer the question as to what will be the future optimal resource mix. However, taking advantage of these resources, when chosen, will be easier with the implementation of the correct Railbelt generation and transmission organizational structure, which is the focus of this study.
Organizational Paths and Scenarios Evaluated Based upon input from the Advisory Working Group that was formed to provide advice and help guide the Black & Veatch project team during the course of the project, five Organizational Paths were chosen for detailed evaluation. These Paths are shown in the following graphic and discussed below.
Figure 2 - Summary of Organizational Paths Evaluated
Status QuoPath 1
Form an Entity That Would be Responsible for Independent Operation of the GridPath 2
Form an Entity That Would be Responsible for Independent Operation of the Grid and Regional Economic DispatchPath 3
Form an Entity That Would be Responsible for Independent Operation of the Grid, Regional Economic Dispatch, Regional Resource Planning and Joint Project Development
Path 4
Form a Power PoolPath 5
Status QuoPath 1 Status QuoPath 1
Form an Entity That Would be Responsible for Independent Operation of the GridPath 2 Form an Entity That Would be Responsible for Independent Operation of the GridPath 2
Form an Entity That Would be Responsible for Independent Operation of the Grid and Regional Economic DispatchPath 3 Form an Entity That Would be Responsible for Independent Operation of the Grid and Regional Economic DispatchPath 3
Form an Entity That Would be Responsible for Independent Operation of the Grid, Regional Economic Dispatch, Regional Resource Planning and Joint Project Development
Path 4Form an Entity That Would be Responsible for Independent Operation of the Grid, Regional Economic Dispatch, Regional Resource Planning and Joint Project Development
Path 4
Form a Power PoolPath 5
It should be noted that the following descriptions of Organizational Paths 2, 3, 4, and 5 are focused on the functional responsibilities of a new regional entity. In each case, the new regional entity could be a Joint Action Agency (JAA), G&T Cooperative, or State Agency/Corporation. • Path 1 – Status Quo
This Path assumes that the six Railbelt utilities continue to conduct business essentially in the same manner as now (i.e., six separate utilities with limited coordination and bilateral contracts between them), and it does not include the potential impact of the proposed ML&P/Chugach merger. This is, in essence, the “Base Case” and the other Paths will be compared to this Path for each of the Evaluation Scenarios considered.
• Path 2 – Form an Entity That Would be Responsible for Independent Operation of the Grid Under this Path, a new entity would be formed to independently operate the Railbelt electric transmission grid. Currently, the Railbelt utilities have three control centers (GVEA, Chugach and ML&P). The operations of these centers are coordinated (but generation is not fully economically dispatched on a regional basis) through the Intertie Operating Committee. This new entity would not perform regional economic dispatch, just the independent operation of the Railbelt transmission grid.

SECTION 1 - EXECUTIVE SUMMARY ALASKA REGA STUDY
Black & Veatch 6 September 12, 2008
• Path 3 – Form an Entity That Would be Responsible for Independent Operation of the Grid and Regional Economic Dispatch This Path would expand upon this coordination through the formation of an organization that would be responsible for the joint economic dispatching of all generation facilities in the Railbelt. This Path, as well as the following two Paths, will require some additional investment in transmission transfer capability and supervisory control and data acquisition (SCADA)/telecommunications capabilities. This Path, and the following two Paths, would also require the development of operating and cost sharing agreements to guide how economic dispatching would occur and how the related costs and benefits would be allocated among the six Railbelt utilities.
• Path 4 – Form an Entity That Would be Responsible for Independent Operation of the Grid, Regional Economic Dispatch, Regional Resource Planning, and Joint Project Development This Path is similar to Path 3 except the scope of responsibilities of the new regional entity would be expanded to include regional integrated resource planning and the joint project development of new generation and transmission assets.
• Path 5 – Form Power Pool This entity would be responsible for the independent operation of the transmission grid, regional economic dispatch and regional resource planning. In that sense, it is similar to Path 4, except that the individual utilities would retain the responsibility for the development of future generation and transmission facilities.
As noted before, there are a significant number of issues and uncertainties facing the Railbelt utilities. One of the most significant issues related to the evaluation of alternative organizational structures for the reconfiguration of the Railbelt utilities relates to the future generation supply resource mix that will be implemented to replace the aging generation facilities and meet future load growth in the region.
As a result, we developed the following four Evaluation Scenarios, which can be viewed as alternative energy futures for the Railbelt region. We analyzed the net impact of each Organizational Path under each of the four Evaluation Scenarios separately to determine the economic benefits of each Organizational Path, relative to each other. The intent was to determine if one Organizational Path was the most optimal alternative regardless of the energy future chosen by the region, or whether different Organizational Paths were optimal under different futures.
For each Evaluation Scenario, we developed prescriptive generation supply resource plans, which are representative resource plans to determine the economic benefits of each Organizational Path. These prescriptive resource plans are not the same as integrated resource plans for each Evaluation Scenario, which are optimal long-term resource plans given all considered factors.
Therefore, as noted earlier, it would be inappropriate to compare one Evaluation Scenario to another, as the resulting evaluation plans and power costs under the different Scenarios are not necessarily indicative of what they would be under an optimized integrated resource plan. They do, however, provide a solid foundation for the evaluation of the various Organizational Paths to each other under alternative futures.

SECTION 1 - EXECUTIVE SUMMARY ALASKA REGA STUDY
Black & Veatch 7 September 12, 2008
These Evaluation Scenarios are shown in the following graphic and discussed below.
Figure 3 - Summary of Evaluation Scenarios
Scenario ALarge Hydro /
Renewables / DSM / Energy Efficiency
Scenario
Scenario BNatural Gas
Scenario
Scenario CCoal
Scenario
Scenario DMixed Resource
Portfolio Scenario
Scenario ALarge Hydro /
Renewables / DSM / Energy Efficiency
Scenario
Scenario ALarge Hydro /
Renewables / DSM / Energy Efficiency
Scenario
Scenario BNatural Gas
Scenario
Scenario BNatural Gas
Scenario
Scenario CCoal
Scenario
Scenario CCoal
Scenario
Scenario DMixed Resource
Portfolio Scenario
Scenario DMixed Resource
Portfolio Scenario
• Scenario A – Large Hydro/Renewables/DSM/Energy Efficiency Scenario This Scenario assumes that the majority of the future regional generation resources that are added to the region include one or more large hydroelectric plants (greater than 200 MW), other renewable resources, and DSM and energy efficiency programs.
• Scenario B – Natural Gas Scenario In this Scenario, we assumed that all of the future generation resources will be natural gas-fired facilities, continuing the region’s dependence upon natural gas.
• Scenario C – Coal Scenario The central resource option in this Scenario is the addition of coal plants to meet the future needs of the region.
• Scenario D – Mixed Resource Portfolio Scenario In this Scenario, we assumed that a combination of large hydroelectric, renewables, DSM/energy efficiency programs, coal and natural gas resources is added over the next 30 years to meet the future needs of the region.
Existing and Future Resource Options There are a variety of existing generation resources that are owned and operated by the Railbelt utilities, as well as a transmission grid that extends from the Fairbanks area down to the Kenai Peninsula. There are also a broad array of supply-side resource options, both traditional and renewable resources, and demand-side resources (i.e., DSM and energy efficiency programs), available to meet the future electrical needs of the Railbelt region. A description of these existing and future resource options are provided in Section 5.
Note to the Readers of This Report
It is important to understand that the focus
of this study is on the evaluation of alternative organizational structures for the reconfiguration of
the generation and transmission functions of
the Railbelt utilities. In completing this analysis,
Black & Veatch evaluated alternative energy futures and developed prescriptive
resource plans for each energy future considered.
These prescriptive resource plans were developed to
assist in the evaluation of alternative organizational paths. These prescriptive resource plans are not alternative integrated
resource plans; as such, readers should not
compare the prescriptive resource plans to each
other nor should they draw any conclusions from this
analysis as to what the optimal resource mix for the Railbelt over the next 30 years might include.

SECTION 1 - EXECUTIVE SUMMARY ALASKA REGA STUDY
Black & Veatch 8 September 12, 2008
Organizational Issues This section provides an overview of the various organizational issues that relate to the formation of a new regional entity, including scope of responsibilities, tax and legal issues, regulatory oversight issues, required legislative actions, and so forth.
The formation of regional entities to focus on generation and transmission issues is a common practice throughout the country. Typically, the legal structure of the entities falls into one of the following four business models: • State/Federal Power Authorities • G&T Cooperatives • Joint Action Agencies • Regional Transmission Organizations (RTOs)/Independent System Operators (ISOs)
Within the not-for-profit segment of the industry, the G&T Cooperative and JAA and business models are the most common. State Power Authorities exist in a limited number of states. RTOs/ISOs are typically “super regional” organizations as they cover large regions (e.g., Texas or multiple states) in the lower-48 states, and investor-owned utilities (IOUs), G&T Cooperatives, JAAs, and State Power Authorities operate within the regions under their direction.
In Appendix B, we provide descriptions of a number of different organizations that currently exist within the U.S. that are similar to the types of organizations considered in this study, including: • State/Federal Power Authorities • G&T Cooperatives • Joint Action Agencies • Other Types of Regional Generation and Transmission Entities • Centralized Energy Efficiency Organizations
Many other examples exist, but this summary provides a representative overview of these types of organizations.
Notwithstanding the experience that has been gained elsewhere with the formation of regional G&T entities, there are a number of organizational issues that need to be addressed if the Railbelt utilities and the State of Alaska are to successfully create such an entity. Specific categories of these organizational issues are identified in the following graphic. In addition, the subsequent table provides a listing of the issues within each category shown in the graphic below. These issues are addressed in detail in Section 6.

SECTION 1 - EXECUTIVE SUMMARY ALASKA REGA STUDY
Black & Veatch 9 September 12, 2008
Figure 4 - Summary of Organizational Issues
Scope ofResponsibilities
FORMATION OFNEW REGIONAL
ENTITY
FormationIssues
OperationalIssues
Regional Generationand TransmissionPlanning Issues
Joint ProjectDevelopment
Issues
Required SkillSets and
Staffing Levels-related Issues
Tax andLegal Issues
RegulatoryOversight Issuesand Legislative
Actions
Other RequiredState Issues
MarketStructure
Issues
Tariff/ContractualRequirements-Related Issues
GovernanceIssues

SECTION 1 - EXECUTIVE SUMMARY ALASKA REGA STUDY
Black & Veatch 10 September 12, 2008
Table 2 - Summary of Organizational Issues
Scope of Responsibilities • Coordinated operation of the
transmission grid • Regional economic dispatch • Regional resource planning • Joint project development
Required Skill Sets and Staffing Levels-Related Issues • Total staffing levels • Organizational structure • Strategy for transfer of
existing employees • Recruiting and relocation
strategy • Compensation program
Tariff/Contractual Requirements-Related Issues • Open access transmission
tariff • Postage stamp of mileage-
based rates • Contracts between individual
parties
Formation Issues • Legal structure • Location • Transfer of existing assets and
fuel supply contracts • Whether to adopt a “hold
harmless” requirement • Transition period
Tax and Legal Issues • Ability to issue tax-exempt
debt • Transfer of ownership of
existing assets • Transfer of the City of
Anchorage’s ownership of gas reserves in the Cook Inlet
• Governance
Governance Issues • Non-profit operation • Requirements for
membership • Board representation • Formation of management
committees • Meetings • Decision-making and
approval process • Issuance of debt
Operational Issues • O&M responsibility • Consolidation of control centers • Required SCADA/
telecommunications investments • Determination of transmission
voltage level and treatment of large customers currently served at transmission voltage levels
Regulatory Oversight Issues and Legislative Actions • Regional integrated resource
plans • Joint project development • Fuel contracts • Cost/benefit allocation
methodology • Transmission tariff • Annual reporting requirements
• Purchase of power, adherence to results of economic dispatch, regional planning process and joint project development
• Termination of membership • Merger, consolidation or
dissolution of regional entity• Indemnification of Directors,
management personnel, employees and agents
Regional Generation and Transmission Planning Issues • Development of new coordinated
planning processes • Requirement to follow results
Other Required State Actions • State Energy Plan and related
issues
• Contracting • Rules, regulations and rate
schedules
Joint Project Development Issues • All-in or opt-out option • Responsibility for project
construction
Market Structure Issues • Required changes to market
structure • Adoption of a competitive
power procurement process
Summary of Assumptions The supply-side and demand-side resource assumptions that we used in our analysis are summarized in Section 7. This section also discusses the input assumptions that we used regarding the start-up and annual operating costs associated with each Organizational Path. Under the base case, we assumed that the new regional entity would be able to issue tax-exempt debt under each Organizational Path and Evaluation Scenario. As a sensitivity case, we also evaluated Organizational Path 4, for each Evaluation Scenario, under

SECTION 1 - EXECUTIVE SUMMARY ALASKA REGA STUDY
Black & Veatch 11 September 12, 2008
the assumption that the new regional entity would be required to issue taxable municipal bonds to finance the region’s future generation and transmission assets.
Summary of Results
Power Cost Results In this subsection, we summarize the economic results of our analysis of power costs under each of the alternative Organizational Paths for each of the Evaluation Scenarios. These results are discussed in more detail in Section 8.
The following table summarizes the average annual present worth savings in power costs, including both generation and transmission costs, for each Organizational Path and Evaluation Scenario. To calculate the average annual present worth figures shown in the tables in this Section, we discounted the 30-year stream of costs to a present worth value in 2009 using a discount rate of 6.0 percent. We then divided this value by 30 to calculate the average annual present worth value.
Table 3 - Average Annual Present Worth Power Cost Savings ($’000)
Path 2 Path 3 Path 4 Path 5
Tax-Exempt Debt Scenario A -- $10,688 $49,228 $49,228 Scenario B -- $9,658 $19,341 $19,341 Scenario C -- $13,104 $43,722 $43,722 Scenario D -- $11,263 $40,740 $40,740
Taxable Debt Scenario A $34,712 Scenario B $16,997 Scenario C $37,417 Scenario D $31,659
The top half of the above table shows the average annual power cost savings associated with the formation of a new regional G&T entity, assuming that the entity would be able to finance future generation and transmission asset additions using tax-exempt debt. As can be seen, the most significant savings result from Organizational Paths 4 and 5. As previously discussed, the only difference between Paths 4 and 5 is that, under Path 5, the existing Railbelt utilities would remain responsible for the joint development of future generation and transmission facilities; the resulting power cost savings are the same for both Organizational Paths because we assumed that the investment decisions made by the individual utilities under the Path 5 power pool would align and track completely with the regional resource planning decisions made by the new regional entity.
As can be seen in the table above, there are not any power cost savings associated with Organizational Path 2. This is because Path 2 involves the coordinated operation of the Railbelt transmission grid by an independent entity; the only difference between Path 2 and the status quo (Organizational Path 1) is that the transmission grid operation function would be performed by an independent entity, as opposed to the existing Railbelt which are fulfilling this responsibility today. Hence, there is not any additional power costs savings associated with this Organizational Path.

SECTION 1 - EXECUTIVE SUMMARY ALASKA REGA STUDY
Black & Veatch 12 September 12, 2008
Finally, the bottom half of this table shows the power costs savings under Organizational Path 4 assuming that taxable debt must be used to finance future generation and transmission asset additions. As can be seen, this sensitivity case results in lower average annual power cost savings, under each Evaluation Scenario, due to the additional financing costs associated with taxable debt relative to tax-exempt debt.
More detailed information regarding these power cost savings results are provided in Appendices C-F.
Organizational Cost Results We developed a detailed estimate of the average annual present worth costs associated with the creation of a new regional entity for each of the alternative Organizational Paths. We also developed a 30-year estimate of the annual operating costs for each alternative organization, including the amortization of the start-up costs over the first five years of operations. A detailed discussion related to these cost estimates is provided in Section 7. These cost estimates do not include potential net cost savings at existing utilities.
The following table summarizes the resulting labor costs related to the start-up of each of the alternative Organizational Paths.
Table 4 - Estimated Start-up Costs – Labor Estimated Start-Up Labor Cost ($’000)
Category Path 2 Path 3 Path 4 Path 5 Provide Overall Program Management/Governance
$68 $168 $294 $199
Finalize Business Structure 96 193 353 243 Secure New Facility 80 121 167 133 Develop Business Policies, Processes and Procedures
78 113 207 159
Complete Operations Transition Planning 13 15 23 18 HR and Recruiting 57 82 252 104 Complete Operations and Economic Dispatch Transition
12 310 310 310
Complete Generation and Transmission Planning Transition
0 0 96 96
Develop IT Infrastructure 189 199 405 211 Develop Business Systems 166 511 652 511 Employee Training 67 88 176 105 Transition and Cutover Execution 76 82 110 82 Other 0 0 285 285
Subtotals $902 $1,882 $3,331 $2,457 Out-of-Pocket Expenses (15%) 135 282 500 369 Contingency (25%) 259 541 958 706
Totals $1,296 $2,705 $4,788 $3,532
In addition to labor costs, there are a number of non-labor costs that will be incurred during the start-up of a new regional entity. Therefore, the next step in the process was to develop cost estimates for each Organizational Path related to the following: • Control center system enhancements
SECTION 1 - EXECUTIVE SUMMARY ALASKA REGA STUDY
Black & Veatch 13 September 12, 2008
• Economic dispatch and resource planning software • Transmission planning software • Enterprise back-office systems • Office equipment (e.g., furniture and printers) • Servers and network infrastructure • Telecommunications • Desktop hardware and software
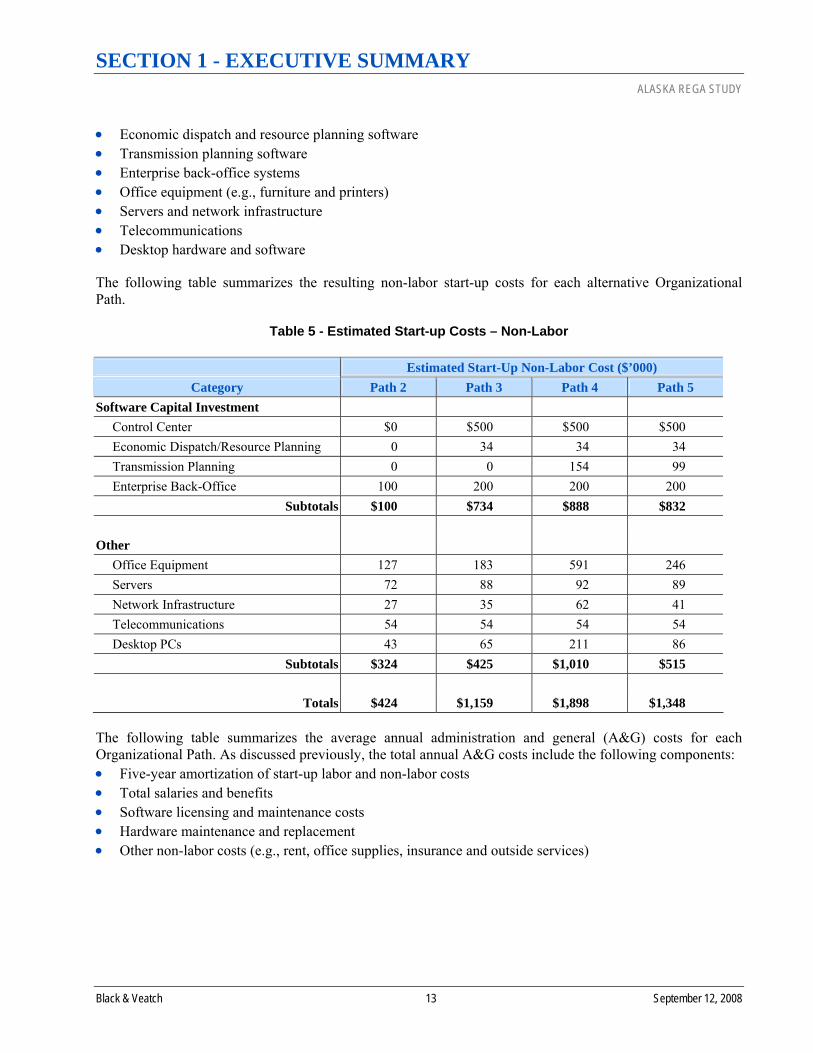
The following table summarizes the resulting non-labor start-up costs for each alternative Organizational Path.
Table 5 - Estimated Start-up Costs – Non-Labor Estimated Start-Up Non-Labor Cost ($’000)
Category Path 2 Path 3 Path 4 Path 5 Software Capital Investment Control Center $0 $500 $500 $500 Economic Dispatch/Resource Planning 0 34 34 34 Transmission Planning 0 0 154 99 Enterprise Back-Office 100 200 200 200
Subtotals $100 $734 $888 $832 Other Office Equipment 127 183 591 246 Servers 72 88 92 89 Network Infrastructure 27 35 62 41 Telecommunications 54 54 54 54 Desktop PCs 43 65 211 86
Subtotals $324 $425 $1,010 $515
Totals $424 $1,159 $1,898 $1,348
The following table summarizes the average annual administration and general (A&G) costs for each Organizational Path. As discussed previously, the total annual A&G costs include the following components: • Five-year amortization of start-up labor and non-labor costs • Total salaries and benefits • Software licensing and maintenance costs • Hardware maintenance and replacement • Other non-labor costs (e.g., rent, office supplies, insurance and outside services)

SECTION 1 - EXECUTIVE SUMMARY ALASKA REGA STUDY
Black & Veatch 14 September 12, 2008
Table 6 - Average Annual Present Worth A&G Costs ($’000)
Path 2 $1,272 Path 3 $2,459 Path 4 $6,545 Path 5 $3,132
The average annual A&G costs for Organizational Path 5 are lower than Path 4 because of lower start-up labor and non-labor costs, and lower annual operating costs due to lower staffing requirements.
More detailed information regarding these results is provided in Appendices C-F.
Net Savings The following table provides an overall summary of the average annual present worth net savings (costs) under each Evaluation Scenario. In other words, this table shows the average annual present worth net savings, or increased costs, when both the power cost savings, shown in Table 3, and the annual A&G costs, shown in Table 6, are combined together.
Table 7 - Average Annual Present Worth Net Savings (Costs) Under Each Evaluation Scenario ($’000)
Relative Path 4 Results
Scenario
Path 2
Path 3
Path 4
Path 5
% Savings
Impact on Typical Monthly Residential Bill
Tax-Exempt Debt Scenario A ($1,272) $8,229 $42,683 $46,097 10.9% $11.50 Scenario B ($1,272) $7,199 $12,795 $16,209 4.1% $4.30 Scenario C ($1,272) $10,645 $37,177 $40,591 10.8% $11.30 Scenario D ($1,272) $8,804 $34,195 $37,608 9.4% $9.90
Taxable Debt Scenario A $28,166 7.9% $8.30 Scenario B $10,452 3.6% $3.70 Scenario C $30,872 10.1% $10.60 Scenario D $25,114 7.5% $7.90
As can be seen in this table, Organizational Paths 4 and 5 offer the greatest net annual savings, and these savings are significant relative to the status quo (Organizational Path 1). While the net annual savings for Organizational Path 4 are less under the taxable debt sensitivity case, they are still significant. The above table also shows the percentage savings relative to the total power costs under each Organizational Path 4, as well as the resulting impact on typical monthly residential bills.
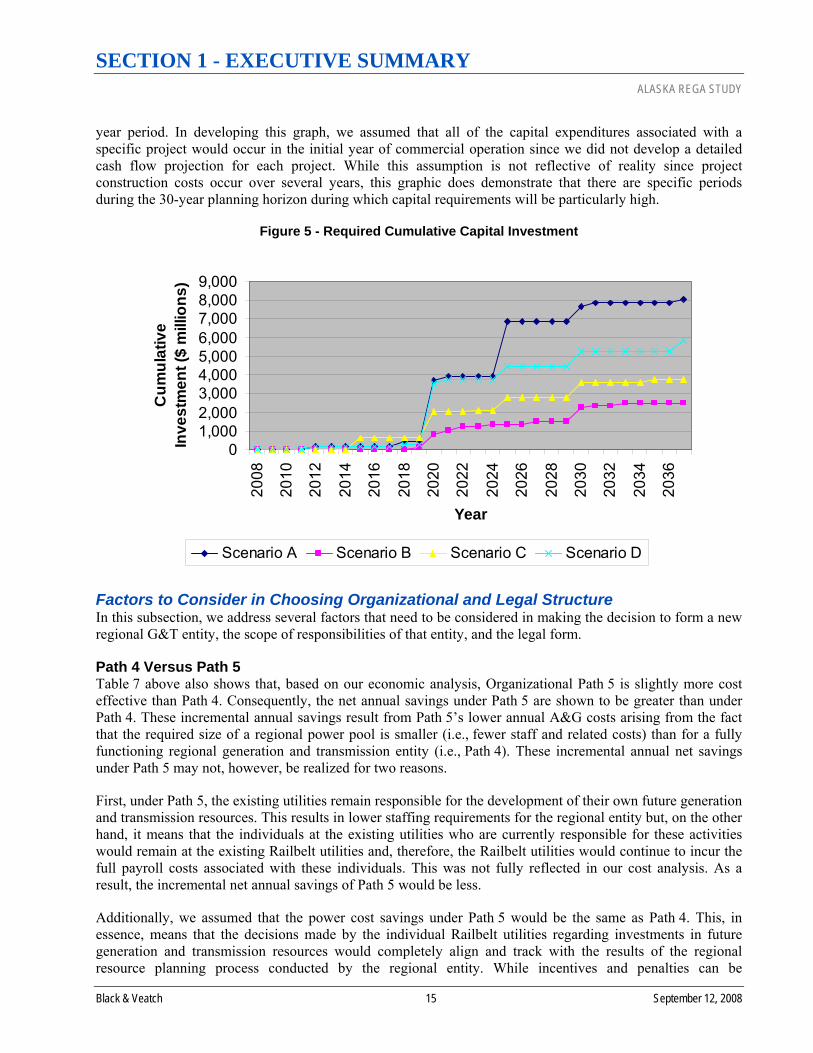
Cumulative Capital Requirements The following figure shows the cumulative capital requirements over the next 30 years resulting from the generation and transmission expansion plans for each of the four Evaluation Scenarios. As can be seen, the future cumulative capital requirements range from $2.5 billion for Evaluation Scenario B to $8.1 billion for Scenario A. This graphic also shows the fact that these capital expenditures do not occur evenly over the 30-
SECTION 1 - EXECUTIVE SUMMARY ALASKA REGA STUDY
Black & Veatch 15 September 12, 2008
year period. In developing this graph, we assumed that all of the capital expenditures associated with a specific project would occur in the initial year of commercial operation since we did not develop a detailed cash flow projection for each project. While this assumption is not reflective of reality since project construction costs occur over several years, this graphic does demonstrate that there are specific periods during the 30-year planning horizon during which capital requirements will be particularly high.
Figure 5 - Required Cumulative Capital Investment
01,0002,0003,0004,0005,0006,0007,0008,0009,000
2008
2010
2012
2014
2016
2018
2020
2022
2024
2026
2028
2030
2032
2034
2036
Year
Cum
ulat
ive
Inve
stm
ent (
$ m
illio
ns)
Scenario A Scenario B Scenario C Scenario D
Factors to Consider in Choosing Organizational and Legal Structure In this subsection, we address several factors that need to be considered in making the decision to form a new regional G&T entity, the scope of responsibilities of that entity, and the legal form.
Path 4 Versus Path 5 Table 7 above also shows that, based on our economic analysis, Organizational Path 5 is slightly more cost effective than Path 4. Consequently, the net annual savings under Path 5 are shown to be greater than under Path 4. These incremental annual savings result from Path 5’s lower annual A&G costs arising from the fact that the required size of a regional power pool is smaller (i.e., fewer staff and related costs) than for a fully functioning regional generation and transmission entity (i.e., Path 4). These incremental annual net savings under Path 5 may not, however, be realized for two reasons.
First, under Path 5, the existing utilities remain responsible for the development of their own future generation and transmission resources. This results in lower staffing requirements for the regional entity but, on the other hand, it means that the individuals at the existing utilities who are currently responsible for these activities would remain at the existing Railbelt utilities and, therefore, the Railbelt utilities would continue to incur the full payroll costs associated with these individuals. This was not fully reflected in our cost analysis. As a result, the incremental net annual savings of Path 5 would be less.
Additionally, we assumed that the power cost savings under Path 5 would be the same as Path 4. This, in essence, means that the decisions made by the individual Railbelt utilities regarding investments in future generation and transmission resources would completely align and track with the results of the regional resource planning process conducted by the regional entity. While incentives and penalties can be
SECTION 1 - EXECUTIVE SUMMARY ALASKA REGA STUDY
Black & Veatch 16 September 12, 2008
incorporated in the power pool’s cost allocation methodology to induce the individual utilities to behave in this manner, there is no guarantee that this will happen. Hence, it is very possible that the actual power cost savings under Path 5 would, in fact, be less than under Path 4, and the resulting decrease in power cost savings could easily be greater than the savings in A&G costs under Path 5.
Therefore, we view Path 5 as more of a transition strategy towards the development of a fully functioning regional generation and transmission entity, not the ultimate optimal end-state for the region. We further believe that the region should move directly to the optimal end-state; therefore, we are not recommending the formation of a power pool, even as a transitional strategy.
Non-Economic Benefits Associated With Formation of a Regional Entity There are a number of benefits associated with the creation of a fully functioning regional generation and transmission entity (i.e., a Path 4-type entity) that go beyond the economics that were modeled in our analysis. These additional benefits include the following: • Economies of scale and coordination related to staffing. Examples include:
♦ Better coordination is possible if all regional employees with generation and transmission responsibilities are part of one organization.
♦ Depth of bench – it is easier to take advantage of the depth of everyone’s skills and expertise when everyone works for one organization, and greater specialization can occur.
♦ The concentration of staff increases the ability of the regional entity to keep abreast of new technologies (e.g., renewables) and industry trends.
♦ The concentration of staff also increases the ability of the Railbelt region to develop and support the delivery of cost effective renewables and DSM/energy efficiency programs.
• The concentration of staff would likely lead to more sophisticated generation and transmission planning, resulting in better regional resource planning decisions.
• A regional entity, with rational regional planning, enables the region to identify and prioritize projects on a regional basis and it puts the State in a better position to evaluate, award and monitor funding.
• The formation of a regional entity could lead to a reduction in the required levels of reserve margins over time.
• A regional entity is better able to integrate non-dispatchable resources, such as wind and solar. • With regard to project development, the concentration of staff within one organization increases the
ability to make timely and effective mid-course corrections, as required. • A regional entity is in a better position to manage risks which is particularly important given the current
circumstances in the Railbelt region. • A regional entity is more likely in a better position to compete in a competitive marketplace for human
resources and to offset, somewhat, the impacts of an aging workforce. • A regional entity could also result in other cost savings not captured in our economic modeling,
including: ♦ The region would need to develop only one regional Integrated Resource Plan, as opposed to three or
more Integrated Resource Plans, every three to five years. ♦ Legal and consulting expenses can be reduced as more issues are addressed on a regional basis versus
on an individual utility basis. ♦ Total staffing levels in certain areas on a regional basis can likely be reduced. ♦ Better access to lower cost financing due to the overall financial strength of the regional entity
relative to the six individual utilities. • The formation of a regional entity can increase the flexibility of the region to respond to major events
(e.g., a large load increase, such as a new or expanded mine).
SECTION 1 - EXECUTIVE SUMMARY ALASKA REGA STUDY
Black & Veatch 17 September 12, 2008
• A regional entity would be in a better position to work with Enstar Natural Gas Company and the gas producers to address the region’s energy issues in a more comprehensive manner.
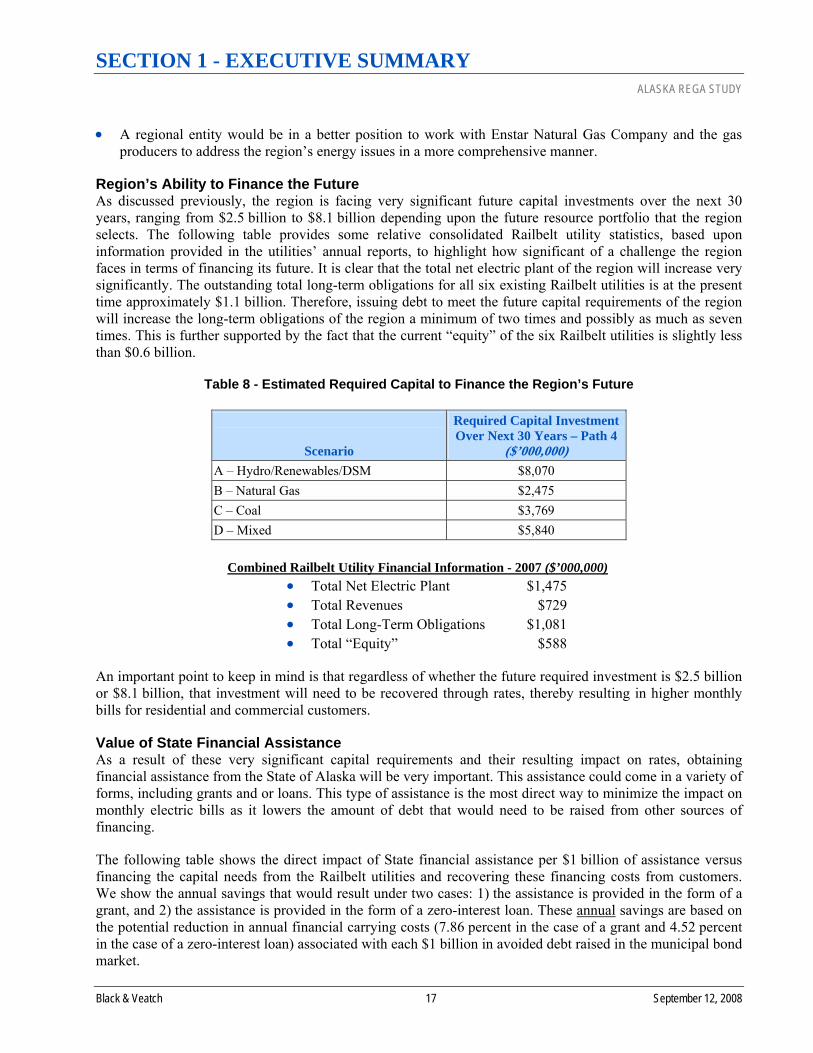
Region’s Ability to Finance the Future As discussed previously, the region is facing very significant future capital investments over the next 30 years, ranging from $2.5 billion to $8.1 billion depending upon the future resource portfolio that the region selects. The following table provides some relative consolidated Railbelt utility statistics, based upon information provided in the utilities’ annual reports, to highlight how significant of a challenge the region faces in terms of financing its future. It is clear that the total net electric plant of the region will increase very significantly. The outstanding total long-term obligations for all six existing Railbelt utilities is at the present time approximately $1.1 billion. Therefore, issuing debt to meet the future capital requirements of the region will increase the long-term obligations of the region a minimum of two times and possibly as much as seven times. This is further supported by the fact that the current “equity” of the six Railbelt utilities is slightly less than $0.6 billion.
Table 8 - Estimated Required Capital to Finance the Region’s Future
Scenario
Required Capital Investment Over Next 30 Years – Path 4
($’000,000) A – Hydro/Renewables/DSM $8,070 B – Natural Gas $2,475 C – Coal $3,769 D – Mixed $5,840
Combined Railbelt Utility Financial Information - 2007 ($’000,000)
• Total Net Electric Plant $1,475 • Total Revenues $729 • Total Long-Term Obligations $1,081 • Total “Equity” $588
An important point to keep in mind is that regardless of whether the future required investment is $2.5 billion or $8.1 billion, that investment will need to be recovered through rates, thereby resulting in higher monthly bills for residential and commercial customers.
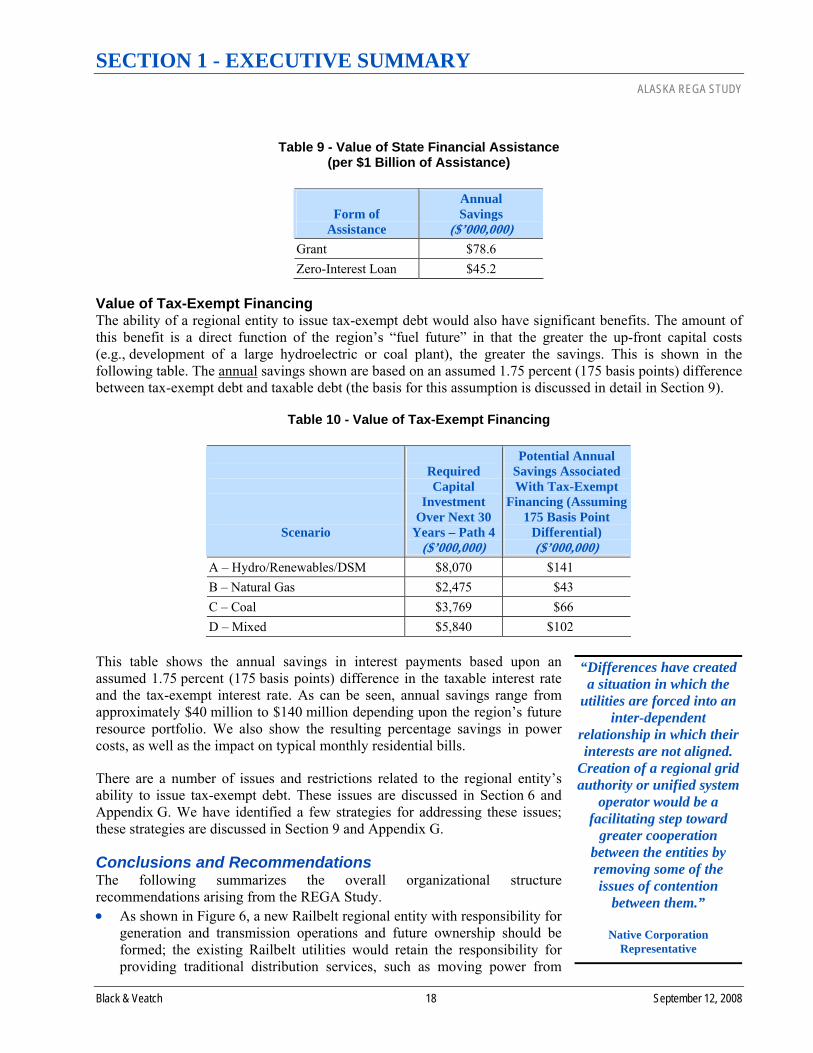
Value of State Financial Assistance As a result of these very significant capital requirements and their resulting impact on rates, obtaining financial assistance from the State of Alaska will be very important. This assistance could come in a variety of forms, including grants and or loans. This type of assistance is the most direct way to minimize the impact on monthly electric bills as it lowers the amount of debt that would need to be raised from other sources of financing.
The following table shows the direct impact of State financial assistance per $1 billion of assistance versus financing the capital needs from the Railbelt utilities and recovering these financing costs from customers. We show the annual savings that would result under two cases: 1) the assistance is provided in the form of a grant, and 2) the assistance is provided in the form of a zero-interest loan. These annual savings are based on the potential reduction in annual financial carrying costs (7.86 percent in the case of a grant and 4.52 percent in the case of a zero-interest loan) associated with each $1 billion in avoided debt raised in the municipal bond market.
SECTION 1 - EXECUTIVE SUMMARY ALASKA REGA STUDY
Black & Veatch 18 September 12, 2008
“Differences have created a situation in which the
utilities are forced into an inter-dependent
relationship in which their interests are not aligned.
Creation of a regional grid authority or unified system
operator would be a facilitating step toward
greater cooperation between the entities by removing some of the issues of contention
between them.”
Native Corporation Representative
Table 9 - Value of State Financial Assistance (per $1 Billion of Assistance)
Form of Assistance
Annual Savings
($’000,000) Grant $78.6 Zero-Interest Loan $45.2
Value of Tax-Exempt Financing The ability of a regional entity to issue tax-exempt debt would also have significant benefits. The amount of this benefit is a direct function of the region’s “fuel future” in that the greater the up-front capital costs (e.g., development of a large hydroelectric or coal plant), the greater the savings. This is shown in the following table. The annual savings shown are based on an assumed 1.75 percent (175 basis points) difference between tax-exempt debt and taxable debt (the basis for this assumption is discussed in detail in Section 9).
Table 10 - Value of Tax-Exempt Financing
Scenario
Required Capital
Investment Over Next 30
Years – Path 4($’000,000)
Potential Annual Savings Associated With Tax-Exempt
Financing (Assuming 175 Basis Point
Differential) ($’000,000)
A – Hydro/Renewables/DSM $8,070 $141 B – Natural Gas $2,475 $43 C – Coal $3,769 $66 D – Mixed $5,840 $102
This table shows the annual savings in interest payments based upon an assumed 1.75 percent (175 basis points) difference in the taxable interest rate and the tax-exempt interest rate. As can be seen, annual savings range from approximately $40 million to $140 million depending upon the region’s future resource portfolio. We also show the resulting percentage savings in power costs, as well as the impact on typical monthly residential bills.
There are a number of issues and restrictions related to the regional entity’s ability to issue tax-exempt debt. These issues are discussed in Section 6 and Appendix G. We have identified a few strategies for addressing these issues; these strategies are discussed in Section 9 and Appendix G.
Conclusions and Recommendations The following summarizes the overall organizational structure recommendations arising from the REGA Study. • As shown in Figure 6, a new Railbelt regional entity with responsibility for
generation and transmission operations and future ownership should be formed; the existing Railbelt utilities would retain the responsibility for providing traditional distribution services, such as moving power from

SECTION 1 - EXECUTIVE SUMMARY ALASKA REGA STUDY
Black & Veatch 19 September 12, 2008
“The State should do what the State does best; the
utilities should do what the utilities do best.”
State Agency Representative
“The economic stability of the State relies upon the
Railbelt and consequently there has to be a
substantive investment by the State in it so that the State attracts businesses
and development.”
Financial Community Representative
transmission/distribution substations to individual customers, meter reading, turn-ons/offs, and responding to customer inquiries. More specifically, the functional responsibilities of this new regional entity should include: ♦ Independent, coordinated operation of the Railbelt electric transmission system ♦ Economic dispatch of the Railbelt region’s generation facilities ♦ Railbelt region resource and transmission expansion planning ♦ Joint development of new generation and transmission facilities for the Railbelt region
• To maximize the economic benefits associated with regionalization, the legal structure for this new regional entity should be a State Power Authority for the following reasons: ♦ It is projected that the Railbelt region will need to issue new debt between $2.5 - $8.1 billion over the
next 30 years to build new generation and transmission facilities to reliably serve the electric needs of citizens and businesses in the region. This level of investment, which is dependent upon the future generation resource options and transmission expansion projects chosen in a regional planning process, represents a significant challenge for the Railbelt region given its small size. Having the good faith and credit of the State supporting the regional entity will minimize the financial risks and result in a lower cost for debt.
♦ State financial assistance, whether in the form of a grant(s) or low interest loan(s), would provide a significant benefit to the Railbelt region. This potential assistance represents the single most significant way to reduce the burden on Railbelt citizens and businesses associated with the financing of required generation and transmission investments.
♦ It seems reasonable to conclude that the Governor and State Legislature would be more willing to provide some level of financial assistance to the Railbelt region if the new regional entity was formed as a State Power Authority, as opposed to a private business such as a G&T Cooperative.
♦ In addition to potential State financial assistance, forming the new Railbelt regional entity in a manner that would allow it to issue tax-exempt debt would provide a significant economic benefit to the region. A State Power Authority is in a better position to be able to issue tax-exempt municipal debt, although significant restrictions exist that make this a challenge.
♦ Generally speaking, a G&T Cooperative is unable to issue tax-exempt debt due to Internal Revenue Service (IRS) restrictions. A G&T Cooperative, as well as a State Power Authority, could obtain taxable debt through the Rural Utilities Service (RUS)/Federal Financing Bank (FFB) at favorable interest rates relative to the rates that are available in the taxable municipal bond market. However, RUS/FFB funding is subject to Congressional appropriations (approximately $3.2 billion in fiscal year (FY) 2008 for generation and transmission facilities) and the region would need to compete against other requests from cooperatives throughout the country. Additionally, RUS/FFB money is intended for rural communities; given that the majority of the Railbelt would not qualify as rural under the RUS/FFB rules, the amount of money that would be available from the RUS/FFB would be further restricted. As a result, the region will not be able to rely upon the RUS/FFB to meet all of its financing requirements. Furthermore, obtaining financing through the RUS/FFB can take up to two years with no assurance of success, and the resulting covenants are typically more restrictive than what can be negotiated in the municipal bond market. As a result, obtaining RUS/FFB financing is more risky than the municipal bond market.
♦ If a State Power Authority is formed, it is very important that its Board of Directors and management team consists of individuals with substantive knowledge and understanding of the electric or energy

SECTION 1 - EXECUTIVE SUMMARY ALASKA REGA STUDY
Black & Veatch 20 September 12, 2008
industry, specifically generation and transmission, and consumer issues. Furthermore, the Board needs to be sufficiently insulated from State political cycles so that effective long-term planning and project development can occur. Without such industry expertise and independence, the Board and management team will not be able to effectively address the issues and risks facing the Railbelt region and manage the region’s very substantial capital improvement program.

SECTION 1 EXECUTIVE SUMMARY ALASKA REGA STUDY
Black & Veatch 21 September 12, 2008
Figure 6 - Summary of Recommendations – Organizational Structure
Distribution Utilities (note 1)GVEA
Existing Railbelt Structure Regional Issues Evaluation MEAML&P
GVEA Uniqueness of Railbelt Alternative Organizational Paths CEARelative to Evaluation Scenarios HEA
MEA Cost Issues SESPower Costs
ML&P Natural Gas Issues Fuel CostsCapital and Production Costs Functional
CEA Load Uncertainties Economy Sales Separation
HEA Infrastructure Issues Organizational CostsStart-up Costs
SES Future Resource Options Annual Operating Costs
State Political Issues Net Present Worth Savings (Costs)Form a State Power Authority With the Following
Risk Management Functional Responsibilities: 1) Independent, Coordinated Operation of the Railbelt Transmission System
Other Issues 2) Economic Dispatching of the Region's Generation Facilities 3) Regional Resource and Transmission Expansion Planning
4) Joint Development of new Generation and Transmission FacilitiesNote 1: The distribution utilities would retain ownership, but not operational control, of their existing generation facilities.

SECTION 1 EXECUTIVE SUMMARY ALASKA REGA STUDY
Black & Veatch 22 September 12, 2008
Additional recommendations related to some of the organizational issues discussed in Section 6 are provided in the following table.
Table 11 - Summary of Recommendations - Formational Issues
Issue Recommendation Location Anchorage Area Transfer Ownership of Existing Assets No Establish “Hold Harmless” Requirement Regarding Allocation of Costs and Benefits of Regional Entity With Transition Plan
Yes
Transfer Selected Existing Employees Yes Extensive Expansion of Transmission Grid Yes Governance Structure Depends on Legal Structure of Entity Develop Open Access Transmission Tariff Yes Develop Generator Interconnection Standards
Yes
Develop Competitive Power Procurement Process
Yes (to provide Independent Power Producers an equal opportunity to compete)
Establish Postage-Stamp or Mileage-Based Rates
Generation Postage-Stamp Over Time Transmission Postage-Stamp Regional Development of Renewables Yes Regional Development of DSM/Energy Efficiency Programs
Yes (in Close Coordination With Distribution Utilities to Tailor and Deliver Programs to Individual Service Territories)
RCA Oversight No (due to the following reasons: 1) regional generation and transmission entities are typically not subject to state regulatory oversight, 2) the potential conflict when one state agency oversees another state agency, and 3) we do not believe that the benefits of regulation outweigh the incremental costs)
Elements of Integrated Resource/ Transmission Expansion Planning Process
Consistency With State Energy Plan and Related Policies
Yes
Consistent Evaluation of Supply-Side and Demand-Side Resource Options
Yes
Interactive Analysis of Resource and Transmission Options
Yes
Economic Analysis of Replacement/Life Extension of Aging Generation Facilities
Yes
Innovative Rate Structures Yes (in Coordination With Distribution Utilities) Response to CO2 and Other Environmental Restrictions
Yes
Re-evaluate Reserve Margin Targets Yes Public Participation Yes

SECTION 1 EXECUTIVE SUMMARY ALASKA REGA STUDY
Black & Veatch 23 September 12, 2008
Next Steps and Implementation Plan
Next Steps The following list of actions represents the next steps that need to be taken with regard to the formation of a new regional entity. • The Railbelt utilities, in conjunction with the State, need to make the decision whether to form a new
Railbelt regional entity and finalize the functional responsibilities of that entity. It is critical that this decision be made as soon as possible; the challenges confronting the Railbelt region require that action be taken now. Delay will only make the challenges greater and, if the regional entity is not formed now, decisions will need to be made by individual utilities and these decisions will not result in optimal results from a regional persepctive.
• A conclusive determination regarding the ability of the new regional entity to issue tax-exempt debt needs to be made and an appropriate strategy developed. The Railbelt utilities and the State should secure the services of one of more bond counsels and bond underwriters to support this effort.
• The legal form (i.e., State Power Authority, G&T Cooperative, or 63-20 Corporation) of the regional entity needs to be finalized.
• The Railbelt utilities and the State need to establish a transition management team to oversee the formation of the new entity.
• Required legislative actions should be introduced in the new legislative session, addressing the following: ♦ Formation of the regional entity (including powers, legal form, governance structure, ability to
purchase property, and selected bylaw requirements). ♦ Modification of existing utilities’ service territory certificates, as necessary. ♦ Establishing direct privity with retail customers if the Retail Requirements Approach is adopted (the
Retail Requirements Approach is discussed in Section 9). ♦ Implementation of market structure changes (e.g., OATT and a competitive power procurement
process). ♦ Secure State financial assistance (e.g., grants or loans) for the development of regional generation and
transmission infrastructure (based upon results of regional Integrated Resource Plan). • Complete the formation of the new entity, including the following actions:
♦ Establish utility/state implementation team ♦ Determine need for outside assistance ♦ Revise start-up implementation plan
• Develop initial regional Integrated Resource Plan and Transmission Expansion Plan. We have two important additional comments regarding the development of these two plans. First, it is very important that these initial regional plans be developed as soon as possible to identify the Railbelt region’s future fuels strategy and transmission expansion program. Second, as part of this effort, a formal public participation process should be established, providing for transparency and broad participation by stakeholders throughout the process. The Hawaii Electric Company has such a public participation process in place which we believe provides a good example of how such a process should be established.
• The Railbelt utilities and the State need to determine how to finance the formation of the new regional entity, and develop a process to manage this seed money.
• Develop a methodology for the allocation of the costs and benefits associated with the regional entity during the recommended ten-year transition period, consistent with the hold-harmless philosophy.
SECTION 1 EXECUTIVE SUMMARY ALASKA REGA STUDY
Black & Veatch 24 September 12, 2008
Start-up Implementation Plan The actual formation of a new Railbelt regional entity, once the decision is made to form such an entity, involves a significant number of actions. These actions, which are described in more detail in Section 10, have been grouped into the following categories: • Overall Program Management/Governance • Finalize Business Structure • Secure New Facility • Develop Business Policies, Processes and Procedures • Complete Operations Transition Planning • HR and Recruiting • Complete Operations and Economic Dispatch Transition • Complete Generation and Transmission Planning Transition • Develop IT Infrastructure • Develop Business Systems • Employee Training • Transition and Cutover Execution • Other
Based upon experience elsewhere regarding the formation of similar entities, we believe that a 12-month start-up period, while a challenge, can be achieved. An overall implementation budget and schedule for the formation of the recommended regional entity are provided in Section 10.

SECTION 2 - PROJECT OVERVIEW AND REPORT OUTLINE ALASKA REGA STUDY
Black & Veatch 25 September 12, 2008
SECTION 2 - PROJECT OVERVIEW AND REPORT OUTLINE This section provides a historical backdrop for this report, along with a summery of the project’s objectives, scope of work, and an overview of Black & Veatch’s approach to the completion of this study. We also provide a summary of the stakeholder input process and discuss the role of the REGA Advisory Working Group. Finally, this section provides an overview of the models used and a description of the remaining sections of this report.
Historical Context and Background Two similar studies have been completed for the Railbelt region in the past decade. The first study, “Power Pooling/Central Dispatch Planning Study,” was completed in 1998 and the second study, “Railbelt Energy Study,” was completed in 2004.
The first study was completed by Black & Veatch and was prepared for the Alaska Public Utilities Commission (APUC), which has since become the Regulatory Commission of Alaska (RCA), under contract with the Alaska Electric Generation and Transmission Cooperative, Inc. (AEG&T). In that study, Black & Veatch analyzed the potential benefits of a power pool with central dispatch among the Railbelt utilities. Black & Veatch evaluated the following three expansion cases: 1) the Individual Case, 2) the Pooled Case, and 3) the Joint Case. The Individual Case assumed that the status quo was maintained. The Pooled Case assumed that each utility would continue to meet its own capacity requirements, but that all of the regional generation assets would be centrally dispatched. The Joint Case assumed that the utilities jointly met capacity requirements and jointly dispatch all regional generation assets as if they were one utility.
The results of this study showed production and capital cost-related savings of $30.0 million over the 20-year planning horizon of the study, or 2.1%, for the Pooled Case relative to the Individual Case on a cumulative present worth (CPW) basis. For the Joint Case, the study showed CPW production and capital cost-related savings of $48.1 million, or 3.4%, relative to the Individual Case.
When the costs associated with the formation and operation of a “Railbelt Utility Operator,” including equipment and staffing, were considered the net savings were reduced for the Pooled Case to $6.6 million, or 0.5%, and for the Joint Case to $24.7 million, or 1.7%.
The second study was completed by R.W. Beck and Ater Wynne and the objective of the study was to identify the combination of generation and transmission capital investments in the Railbelt region over a 30-year period (2004-2033) that would: 1) minimize future power supply costs, and 2) maintain current levels of power supply reliability. In this study, R.W. Beck/Ater Wynne identified alternative generation and transmission investment plans taking into account uncertainties regarding future loads, fuel prices, and resource options, assuming that the six Railbelt utilities act collectively. Results were shown for: 1) retirements, 2) reliability, 3) load-resource balances, 4) base case investment strategies, 5) effects of risk aversion on investment decisions, and 6) analysis of unique investment opportunities and sensitivity cases.
“Heard the one about the boiling frog? Sure you
have. A frog is in a pot of water. The pot is placed on
the stove. The frog is unconcerned for a while.
Then it figures it can’t handle the warmer water.
It squirms as things get hot, but figures it’s gotten along
so far. And then it’s boiled.”

SECTION 2 - PROJECT OVERVIEW AND REPORT OUTLINE ALASKA REGA STUDY
Black & Veatch 26 September 12, 2008
“We can talk this issue to death or we can get serious
and begin to do something.”
Local Political Representative
* * * *
“A unified system operator
should manage the generating and
transmission assets of the Railbelt. This could be
through dispatch management or actual
ownership. It should also plan and implement future
generation asset acquisition for the Railbelt utilities, and manage fuel purchases and policies to
encourage a robust supply and low price.”
Fuel Supplier
* * * *
“The situation is near-dire
now.”
Utility Representative
Project Scope of Work The stated objectives of this study were to: • Identify and assess a list of options for the management, operation, access
rules, ownership, resource planning, and regulatory structures of the Railbelt generation and transmission system.
• For certain agreed-upon options, further analyze and provide recommendations of possible alternative structures to manage and dispatch electric power throughout the Railbelt region.
• Provide a final work product for stakeholders and decision-makers to consider in planning how to meet the Railbelt region’s energy needs over the next 30 years.
The completion of this study including the following activities: • Reviewing existing reports and available Railbelt electric system data, and
conducting interviews and discussions with utilities and stakeholders. • Reviewing available Railbelt utility modeling tools and capabilities, and
providing additional modeling to provide a range of options supported by legal, regulatory, and economic analysis.
• Analyzing a range of scenarios and developing recommendations on whether and how the Railbelt electric system should be reconfigured to provide for a REGA.
• Assessing whether a REGA can be implemented cooperatively by utilities or whether a separate business entity is required.
• Identifying and considering all aspects of grid operation including procurement, ownership, control, management, and operation and maintenance.
• Determining whether economic dispatch should be through a pooled arrangement or through a separate entity.
• Assessing whether utilities should continue to develop service area-specific integrated resource plans, or should there be a single, regional integrated resource plan.
• Identifying any necessary changes in the market structure of the Railbelt region to implement the REGA.
• Understanding and considering the current regulatory regime under which utilities operate, including compliance with the RCA statutes and optional Federal Energy Regulatory Commission (FERC) rules under Orders Nos. 888 and 2000.
• Assessing whether the entity should be regulated by the RCA, what role the RCA should play in the regional planning, whether the regional plan should require RCA approval, and any state statutory and regulatory changes necessary for REGA implementation.
• Assessing whether all Railbelt utilities should be required to participate in and be bound by regional integrated resource planning decisions.
• Assessing whether investment decisions under the REGA should be subject to individual Railbelt utility Board of Director’s approval.
• Developing an implementation plan for the most feasible scenarios, including specific implementation actions to be taken by utilities and stakeholders, including an implementation budget and schedule.

SECTION 2 - PROJECT OVERVIEW AND REPORT OUTLINE ALASKA REGA STUDY
Black & Veatch 27 September 12, 2008
Project Approach The following graphic provides an overview of the approach that Black & Veatch took in the completion of this study.
Figure 7 - Project Approach Overview
Task 1 – Initiate Project
Task 2 – Collect and Evaluate Existing Reports and Documents
Task 3 – Attend and Assist in a Technical Conference
Task 4 – Collect Additional Information from Stakeholders
Task 5 – Participate in Advisory Working Group Meetings
Task 6 – Develop and Evaluate REGA Scenarios
Task 7 – Develop Implementation Plan
Task 8 – Make Presentation of Preliminary Results to Stakeholders
Task 9 – Prepare Draft Report
Task 10 – Prepare Final Report

SECTION 2 - PROJECT OVERVIEW AND REPORT OUTLINE ALASKA REGA STUDY
Black & Veatch 28 September 12, 2008
“The biggest issue is one of convergence: 1) declining Cook Inlet gas reserves, 2) increasing gas prices, 3) industrial users being
driven out of the local gas market and either shifting to a new energy feedstock
or looking at changing their business model, and 4) the six Railbelt electric utilities entrenched in a status quo of natural gas generation with a pricing
structure that rewards high-volume usage and passes natural gas costs
and future increases on to the consumer.”
Renewable Energy Advocate
* * * *
“The utilities have
basically been doing nothing and holding their breath hoping a miracle
falls from the sky.”
Fuel Supplier
Key activities for each of the project tasks is described below.
Task 1 – Initiate Project Black & Veatch and key AEA management personnel held a general kick-off meeting, during which the following items were discussed:
Confirm project objectives and deliverables • Discuss general strategic issues and considerations • Identify joint AEA/Black & Veatch team members • Discuss AEA management and staff involvement • Discuss procedures for interacting with stakeholders • Finalize project schedule
Task 2 – Collect and Evaluate Existing Reports and Documents Black & Veatch developed two data requests for the Railbelt utilities to collect available resource material regarding Railbelt energy issues and resources. The utilities provided a significant amount of information in response to these data requests.
Task 3 – Attend and Assist in a Technical Conference Black & Veatch worked closely with AEA personnel to organize, and participate in, a Technical Conference in November 2007. The purpose of this Technical Conference was to: 1) bring experts and stakeholders together to discuss important Railbelt issues, 2) inform stakeholders of the current status and condition of the Railbelt generation and transmission systems, and 3) develop public awareness of the issues surrounding the Railbelt grid. Approximately 120 people attended this Technical Conference.
Task 4 – Collect Additional Information From Stakeholders Based on discussions during the Technical Conference and review of the data received from the Railbelt utilities, Black & Veatch collected additional information from Railbelt stakeholders regarding their plans and views towards implementation of a REGA. This data collection effort included a general survey instrument that was sent to all stakeholders that were invited to attend the Technical Conference. Black & Veatch also conducted interviews and used other sources to complete this data collection effort.
Task 5 – Participate in Advisory Working Group Meetings Black & Veatch participated in a series of five Advisory Working Group meetings to brief the group on progress, to solicit input on project issues, and to collect additional information.
Task 6 – Develop and Evaluate REGA Scenarios Black & Veatch developed five feasible REGA organizational structures (Organizational Paths), complete with an assessment of the related costs and benefits under four differing resource scenarios (Evaluation Scenarios), and assessed the collective and individual impacts on the Railbelt utilities.

SECTION 2 - PROJECT OVERVIEW AND REPORT OUTLINE ALASKA REGA STUDY
Black & Veatch 29 September 12, 2008
“There is what I would call institutional neurosis. The
individual utilities have established interconnected
“fiefdoms” that have experienced differing levels
of historical ego and control battles that have led to generational bitterness.
Plus they have been operating in an isolated
market that has not spurned innovative policies comparable to the lower-48 and some developing world
markets.”
Renewable Energy Advocate
Task 7 – Develop Implementation Plan Black & Veatch developed an implementation plan for the most feasible REGA scenario. This implementation plan includes: • Narrative description of implementation tasks • Pro forma budget defining implementation costs • A implementation schedule organized by work activity
Task 8 – Make Presentation of Preliminary Results to Stakeholders We prepared a presentation that summarized our preliminary results for presentation to stakeholders at a second Technical Conference in July 2008. The presentation also included our preliminary conclusions and recommendations, and it provided stakeholders the opportunity to provide comments, which were incorporated in the Draft Report.
Task 9 – Prepare Draft Report Black & Veatch prepared a Draft Report and provided it to the AEA, which made it available to all stakeholders, for review and comment. This Draft Report included: • An Executive Summary that summarized the study methodology,
evaluation scenarios considered, assumptions used, and the recommended organizational structure for the REGA.
• A detailed analysis of five feasible alternative organizational structures, including the following for each structure: ♦ Business structure ♦ Market structures ♦ Regulatory issues ♦ Costs and issues related to power generation, transmission lines, and
organizational formation and ongoing operations • A comparative analysis of each alternative organizational structure relative
to different energy futures. • Preliminary implementation plans and schedules for the most feasible
REGA organization(s). • A bibliography.
Task 10 – Prepare Final Report Based upon comments received on the Draft Report, Black & Veatch developed this Final Report.
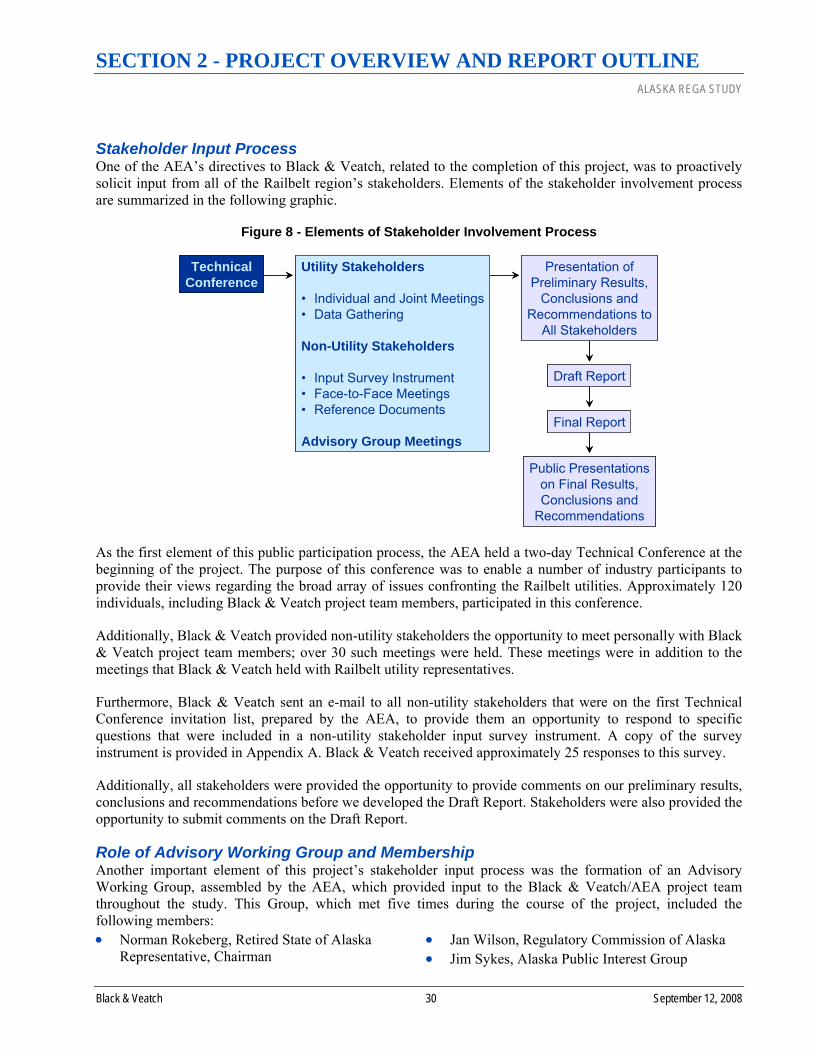
SECTION 2 - PROJECT OVERVIEW AND REPORT OUTLINE ALASKA REGA STUDY
Black & Veatch 30 September 12, 2008
Stakeholder Input Process One of the AEA’s directives to Black & Veatch, related to the completion of this project, was to proactively solicit input from all of the Railbelt region’s stakeholders. Elements of the stakeholder involvement process are summarized in the following graphic.
Figure 8 - Elements of Stakeholder Involvement Process
TechnicalConference
Utility Stakeholders
• Individual and Joint Meetings• Data Gathering
Non-Utility Stakeholders
• Input Survey Instrument• Face-to-Face Meetings• Reference Documents
Advisory Group Meetings
Presentation ofPreliminary Results,
Conclusions andRecommendations to
All Stakeholders
Draft Report
Final Report
Public Presentationson Final Results,Conclusions and
Recommendations
As the first element of this public participation process, the AEA held a two-day Technical Conference at the beginning of the project. The purpose of this conference was to enable a number of industry participants to provide their views regarding the broad array of issues confronting the Railbelt utilities. Approximately 120 individuals, including Black & Veatch project team members, participated in this conference.
Additionally, Black & Veatch provided non-utility stakeholders the opportunity to meet personally with Black & Veatch project team members; over 30 such meetings were held. These meetings were in addition to the meetings that Black & Veatch held with Railbelt utility representatives.
Furthermore, Black & Veatch sent an e-mail to all non-utility stakeholders that were on the first Technical Conference invitation list, prepared by the AEA, to provide them an opportunity to respond to specific questions that were included in a non-utility stakeholder input survey instrument. A copy of the survey instrument is provided in Appendix A. Black & Veatch received approximately 25 responses to this survey.
Additionally, all stakeholders were provided the opportunity to provide comments on our preliminary results, conclusions and recommendations before we developed the Draft Report. Stakeholders were also provided the opportunity to submit comments on the Draft Report.
Role of Advisory Working Group and Membership Another important element of this project’s stakeholder input process was the formation of an Advisory Working Group, assembled by the AEA, which provided input to the Black & Veatch/AEA project team throughout the study. This Group, which met five times during the course of the project, included the following members: • Norman Rokeberg, Retired State of Alaska
Representative, Chairman • Jan Wilson, Regulatory Commission of Alaska • Jim Sykes, Alaska Public Interest Group

SECTION 2 - PROJECT OVERVIEW AND REPORT OUTLINE ALASKA REGA STUDY
Black & Veatch 31 September 12, 2008
• Chris Rose, Renewable Energy Alaska Project, Vice Chairman
• Brad Janorschke, Homer Electric Association • Brian Newton, Golden Valley Electric
Association • Colleen Starring, Enstar Natural Gas Company • Debra Schnebel, Scott Balice Strategies
• Kip Knudson, Tesoro • Lois Lester, AARP • Marilyn Leland, Alaska Power Association • Mitch Little/Les Webber, Marathon Oil
Company • Nick Goodman, TDX Power, Inc. • Steve Denton, Usibelli Coal Mine, Inc. • Tony Izzo, TMI Consulting
The Advisory Working Group provided input on a number of project-related issues, including • Project objectives, scope, and approach • Organizational Paths to be evaluated • Evaluation Scenarios to be considered • Input assumptions for each Evaluation Scenario • Tax and legal issues • Preliminary results, conclusions and recommendations • Draft Report
Overview of Strategist™ and Organizational Cost Models Black & Veatch primarily used two models to complete the necessary detailed cost analysis that led to our conclusions and recommendations. This is shown in the following graphic.
Figure 9 - Overview of Models
For EachEvaluation Scenario
Input AssumptionsRelated to Existing
and PotentialResource Options
StrategistTM
Load ForecastAdjustment (LFA) Module
Generation and Fuel (GAF) Module
PROVIEW (PRV) Module
InputAssumptions
Related toOrganizational
Paths
PrescriptiveResource
Plan for EachOrganizational
Path
Electric Capitaland AnnualProduction
Costs
OrganizationalPath Cost
Spreadsheet
Net AnnualBenefit (or Cost)
of EachOrganizational
Path
OrganizationalCost Model
To model the production cost and capital cost impacts of the various Evaluation Scenarios under each of the Organizational Paths, Black & Veatch used Strategist™, which is an investment optimization model developed by New Energy Associates. Strategist™ is available for use as a least-cost resource optimization system to develop optimal portfolios of resources. In Strategist™, integrated resource screening and
SECTION 2 - PROJECT OVERVIEW AND REPORT OUTLINE ALASKA REGA STUDY
Black & Veatch 32 September 12, 2008
optimization is accomplished within a single system for demand- and supply-side analysis of all resource types.
Production costing models use two analytical modeling devices to assess costs. The process uses either a deterministic simulation or a probabilistic simulation of system operation. Both options produce reasonable cost estimates. The essential difference between the two models results from the treatment of forced outage rates (i.e., times when generation is not available on an unscheduled basis). The deterministic model spreads forced outages over the operating hours of the capacity by reducing the plant’s output in every hour to reflect the equivalent availability. The probabilistic model uses a random draw to determine the times when the unit is unavailable based on the forced outage rate for the unit. In either case, the impacts of factors that influence production costs given unit characteristics are reflected in the modeling. Strategist™ uses both a deterministic and probabilistic approach. The deterministic approach is used in selecting the optimal expansion plans and the probabilistic approach is used in determining the production costs.
Strategist™ is comprised of several modules. A flexible control system ties the application modules together and automates data transfer from one module to another. A user interface allows users to interact with the Strategist™ database containing all inputs and outputs. Strategist’s™ user interface includes features such as full-screen spreadsheet data entry/edit capability, on-line documentation, graphic display of data, program execution, and reporting.
Strategist™ consists of the following modules: • Load Forecast Adjustment (LFA) Module
The LFA module is a multi-purpose tool for creating and modifying load forecasts. Using the LFA module, a planner may address key issues related to future electricity or gas demand, and evaluate the impacts attributed to each defined customer group. Results from this analysis can be automatically transferred to other Strategist™ modules to determine production costs, system reliability, financing and revenue requirements, and a variety of other indicators affected by loads. The LFA module may be used in conjunction with the PROVIEW module to perform integrated demand/supply optimization.
• Generation and Fuel (GAF) Module The GAF module provides the production costs, system reliability indicators, fuel usage, and emissions information that are important in evaluating long-range system operating costs associated with particular generation plans. The GAF module simulates the effects on an electric utility of changes in operating characteristics, fuel prices and availability, contractual sale and purchase arrangements including economy interchange, and alternative generation resource plans. The GAF module will also dispatch and calculate interchange accounting for a multi-company system.
• PROVIEW Module The PROVIEW module is an automatic expansion planning module which can determine the optimal balanced supply-side and demand-side plan for a utility system under a prescribed set of constraints and assumptions. It enables planners to study a wide variety of long-range expansion planning options including alternative technologies, unit conversions, unit capacity sizes, load management, marketing and conservation programs, fuel costs, reliability limits, and financial constraints in order to develop a coordinated integrated plan which would be best suited for the utility. The PROVIEW module simulates the operation of a utility system to determine the cost and reliability effects of adding resources to the system or modifying the load through marketing programs, and it examines the impact on the construction budget of building new units.
To estimate the costs associated with the formation and operation of a new entity under Organizational Paths 2, 3, 4, and 5, Black & Veatch developed detailed an Organizational Cost Model based upon the detailed implementation plans, which are discussed in Sections 7 and 10 of this report.

SECTION 2 - PROJECT OVERVIEW AND REPORT OUTLINE ALASKA REGA STUDY
Black & Veatch 33 September 12, 2008
The Organizational Cost Model (note: a copy of this model is provided on the AEA web site) is an Excel-based workbook that summarizes a 30-year pro forma projection of the benefits and costs related to the formation of a new regional G&T entity. Its purpose is to: 1) document the detailed organizational cost assumptions, 2) detail the estimated Implementation Plan labor costs, 3) detail the estimated personnel requirements and total personnel costs, 4) summarize Strategist™ results, and 5) detail the estimated organizational operating costs for all Organizational Path under each Evaluation Scenario.
The following graphic shows the basic dataflow within the Organizational Cost Model, which consists of the following worksheets: 1. Organizational Assumptions Worksheet – this worksheet details the assumptions and non-labor costs for
the new regional entity under each Path. 2. Start-up Labor Worksheets (Paths 2, 3, 4, and 5) – these worksheets detail the Implementation Plan and
estimated level of effort for each activity for each Organizational Path. 3. Personnel Worksheet – this worksheet outlines the estimated required personnel (on a full-time equivalent
basis) by position for the new regional entity under each Organizational Path and the total salary dollars required (note: salary figures for each position are not shown due to the confidential nature of this information).
4. Summary Scenario Worksheets (Scenarios A, B, C, and D) – these worksheets summarize the results of the production costs worksheets and the operating costs worksheets for each Evaluation Scenario. Each scenario worksheet contains the production and operating costs for each Organizational Path under the specific Evaluation Scenario, including the sensitivity analysis for taxable debt financing.
5. Production Costs Worksheets (Scenarios A, B, C, and D) – these worksheets summarize the 30-year pro forma results of the Strategist™ production cost model for each Evaluation Scenario and shows the net present value.
6. Operating Costs Worksheets (Paths 2, 3, 4, and 5) – these worksheets generate the 30-year pro forma costs from the single year costs in the Personnel, Start-up Labor and Organizational Assumptions Worksheets. Each worksheet summarizes the start-up and operating costs for each Organizational Path and shows the net present value.

SECTION 2 - PROJECT OVERVIEW AND REPORT OUTLINE ALASKA REGA STUDY
Black & Veatch 34 September 12, 2008
Figure 10 - Organizational Cost Model
Report Outline The remainder of this report contains the following sections:
Section 3 – Situational Assessment This section provides an overview of the various issues currently facing the Railbelt utilities.
Section 4 – Organizational Paths and Evaluation Scenarios In this section, we provide descriptions of the alternative Organizational Paths and Evaluation Scenarios that were analyzed during the course of this project.
Section 5 – Existing and Future Resource Options This section includes a detailed summary of the generation and transmission assets that currently exist in the Railbelt region. We also provide information regarding future resource options that are available to meet the electric demand of residential and business customers in the Railbelt region.
Production Costs
Worksheets – Scenarios A/B/C/D
Operating Costs
Worksheets – Paths 2/3/4/5
Personnel Worksheet
Summary Scenario
Worksheets – Scenarios A/B/C/D
Input Data Worksheets
Organizational Assumptions Worksheet
Strategist™ Results
Start-up Labor Worksheets – Paths 2/3/4/5
Implementation Plan
Non-labor Start-up Costs
Salaries
Information Technology Costs
Office and Equipment Costs
Administration and General Costs

SECTION 2 - PROJECT OVERVIEW AND REPORT OUTLINE ALASKA REGA STUDY
Black & Veatch 35 September 12, 2008
Section 6 – Organizational Issues This section provides an overview of the various organizational issues that are related to the formation of a new regional entity, including scope of responsibilities, tax and legal issues, regulatory oversight issues, required legislative actions, and so forth.
Section 7 – Summary of Assumptions In this section, we provide an overview of the input assumptions that underlie our detailed analysis. These assumptions relate to existing generation and transmission assets, future generation and transmission resources, organizational formation and ongoing operations.
Section 8 – Summary of Results This section provides a summary of the results of our detailed economic analysis, including generation and transmission costs, organizational costs, and net benefits.
Section 9 – Conclusions and Recommendations In this section, we provide a summary of our conclusions arising from the results of this study and a detailed description of our recommendations regarding the reconfiguration of the Railbelt utilities.
Section 10 – Implementation Plan In this final section of the report, we provide a detailed plan for the implementation of the recommended regional organizational structure.
This report also contains the following appendices:
Appendix A - Non-Utility Stakeholder Input Survey Instrument This appendix provides the survey instrument that was sent to non-utility stakeholders to solicit input on the issues facing the Railbelt region.
Appendix B - Profiles of Example Regional Organizations This appendix includes summary descriptions of some of the State and Federal Power Authorities, G&T Cooperatives, JAAs, and centralized energy efficiency organizations that exist throughout the country.
Appendix C – Scenario A Results This appendix provides tables that summarize the results of Scenario A.
Appendix D – Scenario B Results This appendix provides tables that summarize the results of Scenario B.
Appendix E – Scenario C Results This appendix provides tables that summarize the results of Scenario C.
Appendix F – Scenario D Results This appendix provides tables that summarize the results of Scenario D.
Appendix G – Tax-Exempt Bond Financing Options for Construction of a New Electric Generation and Transmission Facility to Serve the Railbelt This appendix provides a detailed description of the issues associated with issuing tax-exempt debt and related strategies for dealing with these issues.
Appendix H – Bibliography This appendix provides a listing of the reference documents that were reviewed as part of this study.

SECTION 2 - PROJECT OVERVIEW AND REPORT OUTLINE ALASKA REGA STUDY
Black & Veatch 36 September 12, 2008
Appendix I – Public Comments Received on Draft Report This appendix provides the public comments that were received on the Draft Report. Black & Veatch reviewed these comments and made numerous changes when finalizing this report to reflect those comments as appropriate.

SECTION 3 - SITUATIONAL ASSESSMENT ALASKA REGA STUDY
Black & Veatch 37 September 12, 2008
“The key issues facing the Railbelt electric utilities fall into four primary topics or
categories: aging generation, heavy reliance on a single fuel source, a
delicate transmission system, and conflicting
interests of local utilities.”
Native Corporation Representative
“Big Ten Strategic Issues Facing the Power Industry • Aging/Inadequate
Infrastructure • Aging Workforce • Security • Reliability • Environment • Investment • Technology • Fuel Policy • Market Structure • Regulation “2007 Strategic Directions in the
Electric Utility Industry,” published by Black & Veatch
Corporation, 2007
“The key issues of concern in the Railbelt electric
utility market are easy to define and have been
recognized for many years. To date, however, attempts to resolve those issues have
been unsuccessful. Industry-driven progress in
addressing these issues requires a champion with a clear vision for the future and the skills capable of
rallying the forces of change necessary to re-
shape the system.”
Native Corporation Representative
SECTION 3 - SITUATIONAL ASSESSMENT This section begins with an overview of the key issues facing the U.S. electric utility industry. This is followed by a discussion of current situation facing the Railbelt region.
U.S. Electric Industry Issues The electric utility industry throughout the U.S. is facing a number of critical issues as shown in the sidebar
on the right. These issues were identified as the result of a national survey of industry participants that was conducted by Black & Veatch in 2007. • Aging/inadequate infrastructure – like other industries, existing
generation and transmission assets are deteriorating and, in many ways, are inadequate for today’s and tomorrow’s industry structure. Older assets also operate less efficiently than newer technologies.
• Aging workforce – the “baby boomers” are retiring in record numbers and there are not an adequate number of younger employees entering the industry to fully compensate for the resulting loss of skills and expertise.
• Security – from cyber attacks to terrorism, adequately protecting the industry’s assets from intentional harm is an increasing challenge.
• Reliability – the reliability of the delivery of electricity has declined at the same time that the need for greater reliability has increased.
• Environment – the electric industry and the environment are, in many ways, two sides of the same coin and changing environmental
regulations will continue to challenge the industry. • Investment – significant investments are required in all aspects of the industry to “catch up” from past
investment levels and to enable the industry to continue its movement to greater competition. • Technology – technological developments present challenges in term of
electricity demand as well as offer promising opportunities for the industry to address the challenges facing it.
• Fuel policy - developing a comprehensive fuel policy that takes new risks into account has become a major challenge for power producers and their customers.
• Market structure - the repeal of the Public Utility Holding Company Act, the creation of new types of companies in restructured markets, and the creation of new market structures have fundamentally changed, and will continue to change, the “rules of the game.”
• Regulation - even after a decade of trying, regulators still need to develop firm boundaries between regulated and unregulated pricing, provide incentives that would cause electricity suppliers to act efficiently and on behalf of consumers, and signals that would bring in needed investment capital.
The current situation facing the Railbelt utilities is the result of thousands of historic decisions, resulting in the electric systems as they exist today, as well as a number of factors (e.g., rising natural gas prices) that are outside of the control of utility managers. We received significant comments related to the
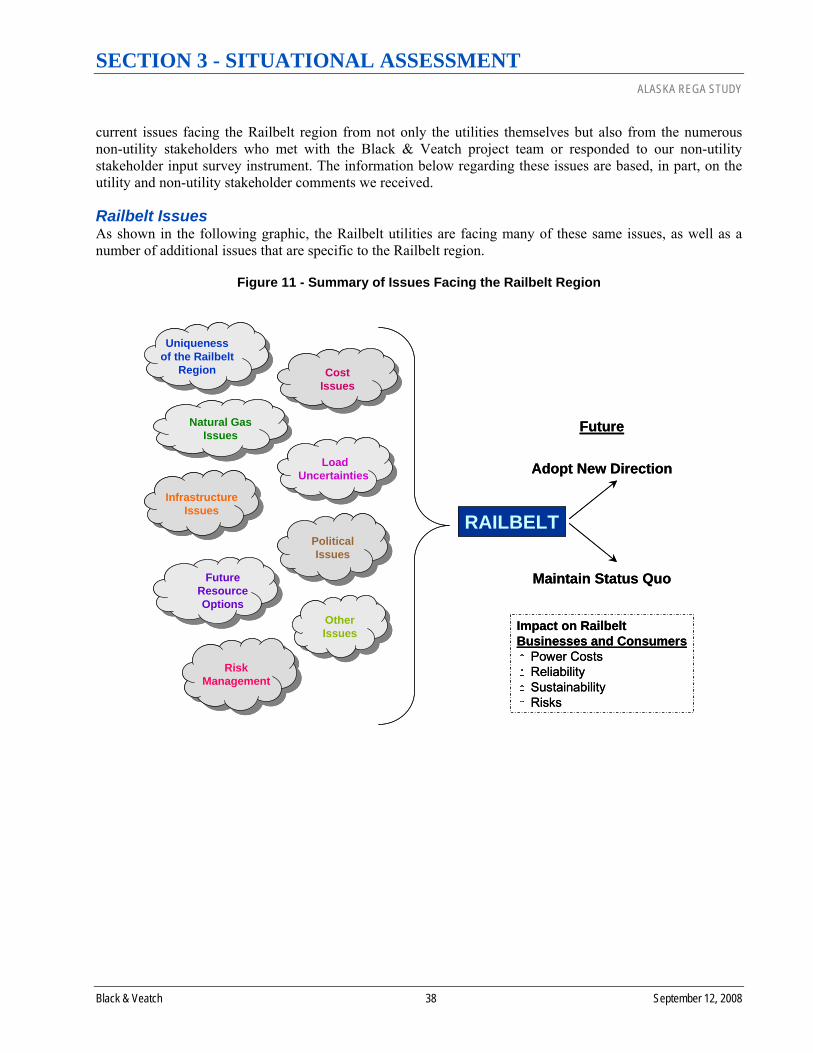
SECTION 3 - SITUATIONAL ASSESSMENT ALASKA REGA STUDY
Black & Veatch 38 September 12, 2008
current issues facing the Railbelt region from not only the utilities themselves but also from the numerous non-utility stakeholders who met with the Black & Veatch project team or responded to our non-utility stakeholder input survey instrument. The information below regarding these issues are based, in part, on the utility and non-utility stakeholder comments we received.
Railbelt Issues As shown in the following graphic, the Railbelt utilities are facing many of these same issues, as well as a number of additional issues that are specific to the Railbelt region.
Figure 11 - Summary of Issues Facing the Railbelt Region
CostIssues
RAILBELT
Future
Adopt New Direction
Maintain Status Quo
Impact on RailbeltBusinesses and Consumers
Power CostsReliabilitySustainabilityRisks
FutureResourceOptions
Uniquenessof the Railbelt
Region
Natural GasIssues
InfrastructureIssues
LoadUncertainties
PoliticalIssues
RiskManagement
OtherIssues
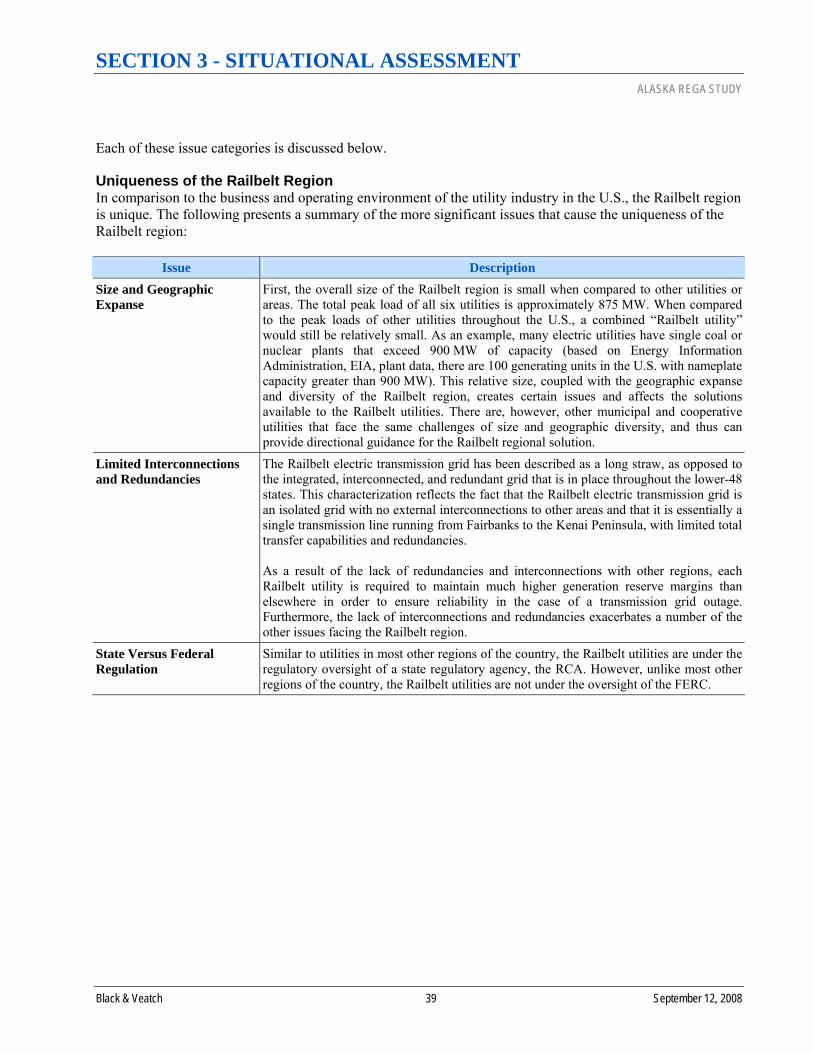
SECTION 3 - SITUATIONAL ASSESSMENT ALASKA REGA STUDY
Black & Veatch 39 September 12, 2008
Each of these issue categories is discussed below.
Uniqueness of the Railbelt Region In comparison to the business and operating environment of the utility industry in the U.S., the Railbelt region is unique. The following presents a summary of the more significant issues that cause the uniqueness of the Railbelt region:
Issue Description Size and Geographic Expanse
First, the overall size of the Railbelt region is small when compared to other utilities or areas. The total peak load of all six utilities is approximately 875 MW. When compared to the peak loads of other utilities throughout the U.S., a combined “Railbelt utility”would still be relatively small. As an example, many electric utilities have single coal or nuclear plants that exceed 900 MW of capacity (based on Energy Information Administration, EIA, plant data, there are 100 generating units in the U.S. with nameplate capacity greater than 900 MW). This relative size, coupled with the geographic expanse and diversity of the Railbelt region, creates certain issues and affects the solutions available to the Railbelt utilities. There are, however, other municipal and cooperative utilities that face the same challenges of size and geographic diversity, and thus can provide directional guidance for the Railbelt regional solution.
Limited Interconnections and Redundancies
The Railbelt electric transmission grid has been described as a long straw, as opposed to the integrated, interconnected, and redundant grid that is in place throughout the lower-48states. This characterization reflects the fact that the Railbelt electric transmission grid is an isolated grid with no external interconnections to other areas and that it is essentially a single transmission line running from Fairbanks to the Kenai Peninsula, with limited total transfer capabilities and redundancies. As a result of the lack of redundancies and interconnections with other regions, each Railbelt utility is required to maintain much higher generation reserve margins than elsewhere in order to ensure reliability in the case of a transmission grid outage. Furthermore, the lack of interconnections and redundancies exacerbates a number of the other issues facing the Railbelt region.
State Versus Federal Regulation
Similar to utilities in most other regions of the country, the Railbelt utilities are under the regulatory oversight of a state regulatory agency, the RCA. However, unlike most other regions of the country, the Railbelt utilities are not under the oversight of the FERC.
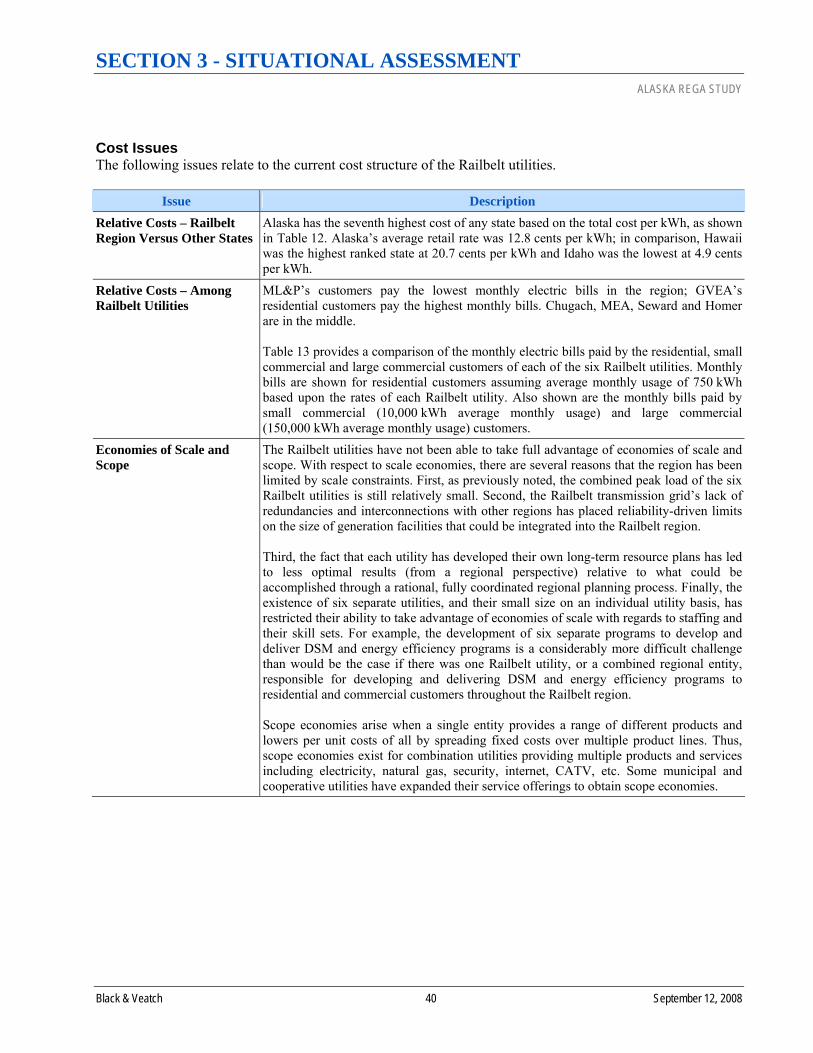
SECTION 3 - SITUATIONAL ASSESSMENT ALASKA REGA STUDY
Black & Veatch 40 September 12, 2008
Cost Issues The following issues relate to the current cost structure of the Railbelt utilities.
Issue Description Relative Costs – Railbelt Region Versus Other States
Alaska has the seventh highest cost of any state based on the total cost per kWh, as shown in Table 12. Alaska’s average retail rate was 12.8 cents per kWh; in comparison, Hawaii was the highest ranked state at 20.7 cents per kWh and Idaho was the lowest at 4.9 cents per kWh.
Relative Costs – Among Railbelt Utilities
ML&P’s customers pay the lowest monthly electric bills in the region; GVEA’s residential customers pay the highest monthly bills. Chugach, MEA, Seward and Homer are in the middle. Table 13 provides a comparison of the monthly electric bills paid by the residential, small commercial and large commercial customers of each of the six Railbelt utilities. Monthly bills are shown for residential customers assuming average monthly usage of 750 kWh based upon the rates of each Railbelt utility. Also shown are the monthly bills paid by small commercial (10,000 kWh average monthly usage) and large commercial (150,000 kWh average monthly usage) customers.
Economies of Scale and Scope
The Railbelt utilities have not been able to take full advantage of economies of scale and scope. With respect to scale economies, there are several reasons that the region has been limited by scale constraints. First, as previously noted, the combined peak load of the six Railbelt utilities is still relatively small. Second, the Railbelt transmission grid’s lack of redundancies and interconnections with other regions has placed reliability-driven limits on the size of generation facilities that could be integrated into the Railbelt region. Third, the fact that each utility has developed their own long-term resource plans has led to less optimal results (from a regional perspective) relative to what could be accomplished through a rational, fully coordinated regional planning process. Finally, the existence of six separate utilities, and their small size on an individual utility basis, has restricted their ability to take advantage of economies of scale with regards to staffing and their skill sets. For example, the development of six separate programs to develop and deliver DSM and energy efficiency programs is a considerably more difficult challenge than would be the case if there was one Railbelt utility, or a combined regional entity, responsible for developing and delivering DSM and energy efficiency programs to residential and commercial customers throughout the Railbelt region. Scope economies arise when a single entity provides a range of different products and lowers per unit costs of all by spreading fixed costs over multiple product lines. Thus, scope economies exist for combination utilities providing multiple products and services including electricity, natural gas, security, internet, CATV, etc. Some municipal and cooperative utilities have expanded their service offerings to obtain scope economies.
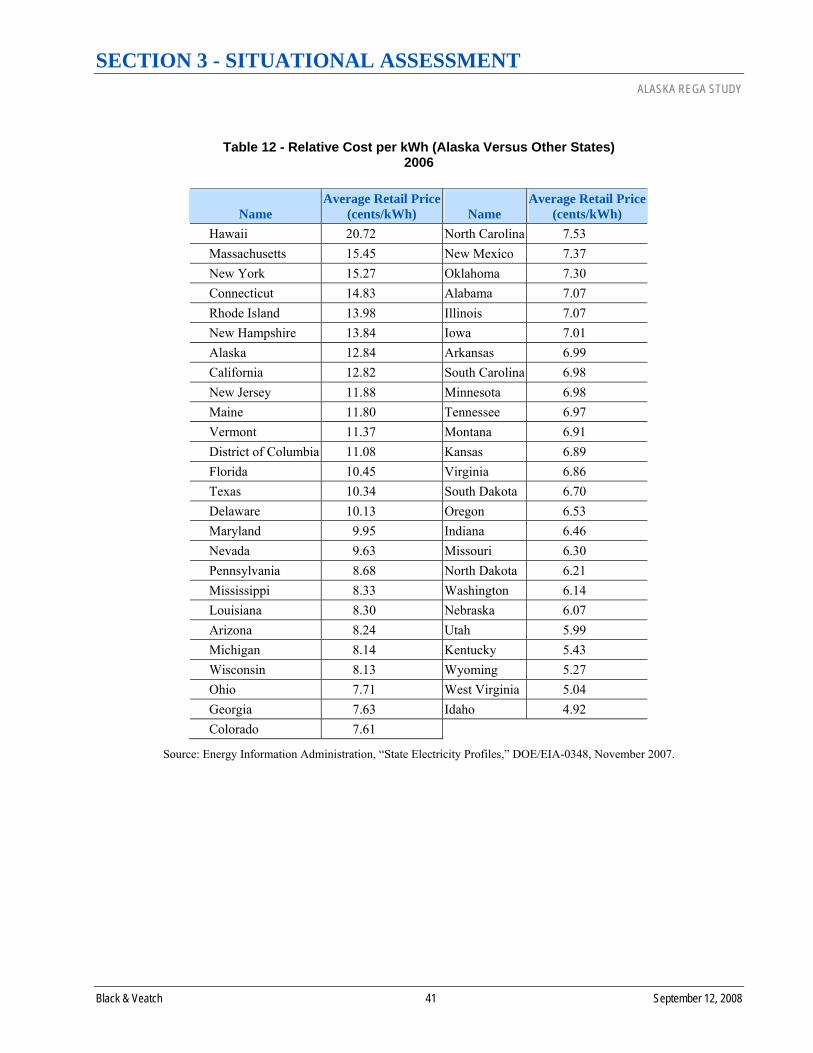
SECTION 3 - SITUATIONAL ASSESSMENT ALASKA REGA STUDY
Black & Veatch 41 September 12, 2008
Table 12 - Relative Cost per kWh (Alaska Versus Other States) 2006
Name Average Retail Price
(cents/kWh)
Name Average Retail Price
(cents/kWh) Hawaii 20.72 North Carolina 7.53 Massachusetts 15.45 New Mexico 7.37 New York 15.27 Oklahoma 7.30 Connecticut 14.83 Alabama 7.07 Rhode Island 13.98 Illinois 7.07 New Hampshire 13.84 Iowa 7.01 Alaska 12.84 Arkansas 6.99 California 12.82 South Carolina 6.98 New Jersey 11.88 Minnesota 6.98 Maine 11.80 Tennessee 6.97 Vermont 11.37 Montana 6.91 District of Columbia 11.08 Kansas 6.89 Florida 10.45 Virginia 6.86 Texas 10.34 South Dakota 6.70 Delaware 10.13 Oregon 6.53 Maryland 9.95 Indiana 6.46 Nevada 9.63 Missouri 6.30 Pennsylvania 8.68 North Dakota 6.21 Mississippi 8.33 Washington 6.14 Louisiana 8.30 Nebraska 6.07 Arizona 8.24 Utah 5.99 Michigan 8.14 Kentucky 5.43 Wisconsin 8.13 Wyoming 5.27 Ohio 7.71 West Virginia 5.04 Georgia 7.63 Idaho 4.92 Colorado 7.61
Source: Energy Information Administration, “State Electricity Profiles,” DOE/EIA-0348, November 2007.

SECTION 3 - SITUATIONAL ASSESSMENT ALASKA REGA STUDY
Black & Veatch 42 September 12, 2008
Table 13 - Relative Monthly Electric Bills Among Alaska Railbelt Utilities
RESIDENTIALFuel
AdjustmentRegulatory
Cost ChargeEnergy Charge
Total Energy Charge
Customer Charge
Usage Factor (kWh) Typical Bill
Railbelt vs. IOU Average
Railbelt vs. Cooperatives
AverageGVEA 0.05903 0.000274 0.11153 0.170834 15 750 $143.13 173% 193%Chugach 0.02478 0.000274 0.09282 0.117874 8.42 750 $96.83 117% 130%MEA 0.03084 0.000274 0.09447 0.125584 5.65 750 $99.84 121% 134%ML&P -0.00655 0.000274 0.09476 0.088484 6.56 750 $72.92 88% 98%Homer (North of Kachemak Bay) 0.00078 0.000274 0.12718 0.128234 11 750 $107.18 130% 144%Homer (South of Kachemak Bay) 0.00078 0.000274 0.13056 0.131614 11 750 $109.71 133% 148%City of Seward NA NA NA NA NA NA NA NA NAAverage $104.93
SMALL COMMERCIALFuel
AdjustmentRegulatory
Cost ChargeEnergy Charge
Total Energy Charge
Customer Charge
Usage Factor (kWh) Typical Bill
Railbelt vs. IOU Average
GVEA 0.05903 0.000274 0.10957 0.168874 20 10,000 $1,708.74 161%Chugach 0.02478 0.000274 0.08001 0.105064 18.26 10,000 $1,068.90 100%MEA 0.03084 0.000274 0.07677 0.107884 5.65 10,000 $1,084.49 102%ML&P -0.00655 0.000274 0.09182 0.085544 12.88 10,000 $868.32 82%Homer (Non-demand metered) 0.00078 0.000274 0.1181 0.119154 24 10,000 $1,215.54 114%Homer (South of Kachemak Bay) 0.00078 0.000274 0.11479 0.115844 40 10,000 $1,198.44 113%City of Seward NA NA NA NA NA NA NA NAAverage $1,190.74
LARGE COMMERCIALFuel
AdjustmentRegulatory
Cost ChargeEnergy Charge
Total Energy Charge
Customer Charge
Demand Charge
Usage Factor (kWh)
Demand Usage (KW) Typical Bill
Railbelt vs. IOU Average
GVEA 0.05903 0.000274 0.07835 0.137654 50 8.55 150,000 500 $24,973.10 175%Chugach 0.02478 0.000274 0.0462 0.071254 58.85 11.65 150,000 500 $16,571.95 116%MEA 0.03084 0.000274 0.06004 0.091154 13.37 4.85 150,000 500 $16,111.47 113%ML&P -0.00655 0.000274 0.05351 0.047234 44.15 11.85 150,000 500 $13,054.25 91%Homer (South of Kachemak Bay) 0.00078 0.000274 0.11479 0.115844 40 6.73 150,000 500 $20,781.60 145%City of Seward NA NA NA NA NA NA NA NA NAAverage $18,298.47
Natural Gas Issues The Railbelt utilities use domestic natural gas as a significant generation fuel source and have done so for decades; the future ability of the Railbelt region to continue to rely on natural gas is in question.
Issue Description Historical Dependence Natural gas has been the predominant source of fuel for electric generation used by the
customers of ML&P, Chugach, MEA, Homer and Seward. Additionally, customers in Fairbanks have benefited from natural gas-generated economy energy sales in recent years. For example, Figure 12 shows the current dependence that Chugach (as well as MEA, Homer and Seward as a result of their full-requirements contracts with Chugach) has on natural gas-fired generation. ML&P has a similar level of dependence on natural gas.
Expiring Contracts There are a number of inherent risks whenever a utility or region is so dependent upon one fuel source; risks with regard to prices, availability and deliverability. An additional risk faced by Chugach is the fact that its current gas supply contracts are expected to expire in the 2010-2012 timeframe, as shown in Figure 13. Chugach is currently working with its natural gas suppliers to renegotiate these contracts. Although those negotiations are have not been finalized, it is expected that future natural gas prices paid by Chugach will increase once the existing contracts expire.
Declining Developed Reserves and Deliverability
An additional problem faced by the Railbelt utilities, due to their dependence on natural gas, is the fact that existing developed reserves in the Cook Inlet are declining as well as the current deliverability of that gas. This is shown in Figure 14.
SECTION 3 - SITUATIONAL ASSESSMENT ALASKA REGA STUDY
Black & Veatch 43 September 12, 2008
Issue Description As can be seen in Figure 14, the population of the Anchorage, Mat-Su, and Kenai Peninsula areas has increased 170% since 1970. At the same time, known reserves in the Cook Inlet have declined by 80%. As a result, one prediction is that gas supplies from known reserves will meet less than one-half of the residential and commercial demand for heating and electricity by 2017. This will have a significant impact on all Railbelt utilities, including ML&P as its owned gas supply is experiencing the same dynamics. The predicted future supply versus demand balance for Cook Inlet gas is further detailed in Figure 15. Related to the decline in reserves is the decline in deliverability. Historically, deliverability of natural gas to electric generation facilities, and to residential and commercial customers in the Railbelt region for heating, was not a problem. However, deliverability is increasingly becoming an issue as the Cook Inlet gas fields age, reserves decline, and pressures drop. Consequently, the Railbelt region will not be able to continue its dependence upon natural gas in the future unless additional reserves are discovered in the Cook Inlet, new sources of supply become available from the North Slope, or an liquefied natural gas (LNG)import terminal is developed to supplement Cook Inlet supplies.
Historical Increase in Gas Prices
Railbelt residential and commercial customers are directly feeling the rise in natural gas prices that have occurred in recent years. These price increases are shown in Figure 16, which shows historical gas prices paid by Chugach. Figure 17 shows the resulting rise in Chugach’s residential bills from 1994 to 2007. As can be seen, the fuel component of the customer’s bill has increased significantly in recent years while the base rate component has remained roughly the same until the last year or so. With natural gas prices expected to continue increasing, Railbelt consumers and businesses will experience even greater electric prices in the future. Figure 18 provides additional details regarding how recent Cook Inlet gas prices compare to gas prices in other parts of the country. As can be seen, Cook Inlet prices are not as high as the national average but they have increased significantly in recent years and they are expected to continue to increase.
Potential Gas Supplies and Prices
Whether new gas supplies from the Cook Inlet become available or gas from the North Slope is brought to the Railbelt region, one reality can not be escaped: future gas supply prices will be higher. For additional gas supplies in the Cook Inlet to become available, prices will need to increase to encourage exploration. This results from the fact that oil and gas producers make investment decisions based upon expected returns relative to investment opportunities available elsewhere in the world. In the case of North Slope gas supplies, the cost, probability and timing of potential gas flows to the Railbelt region are unknown at this time. Nevertheless, given the construction lead times for a potential gas pipeline to provide gas from the North Slope, gas from that region is unlikely to be available for a number of years. Furthermore, if gas from the North Slope becomes available in the Railbelt region through either the Bullet or Spur Line, prices will be tied to market prices since potential natural gas flows to the Railbelt region will be just one of the competing demands for the available gas. Additionally, the pipeline transmission rates that will be paid to move gas to the Railbelt region will be significantly higher than the transportation rates that are imbedded in the delivered cost of gas from Cook Inlet suppliers under existing contracts.
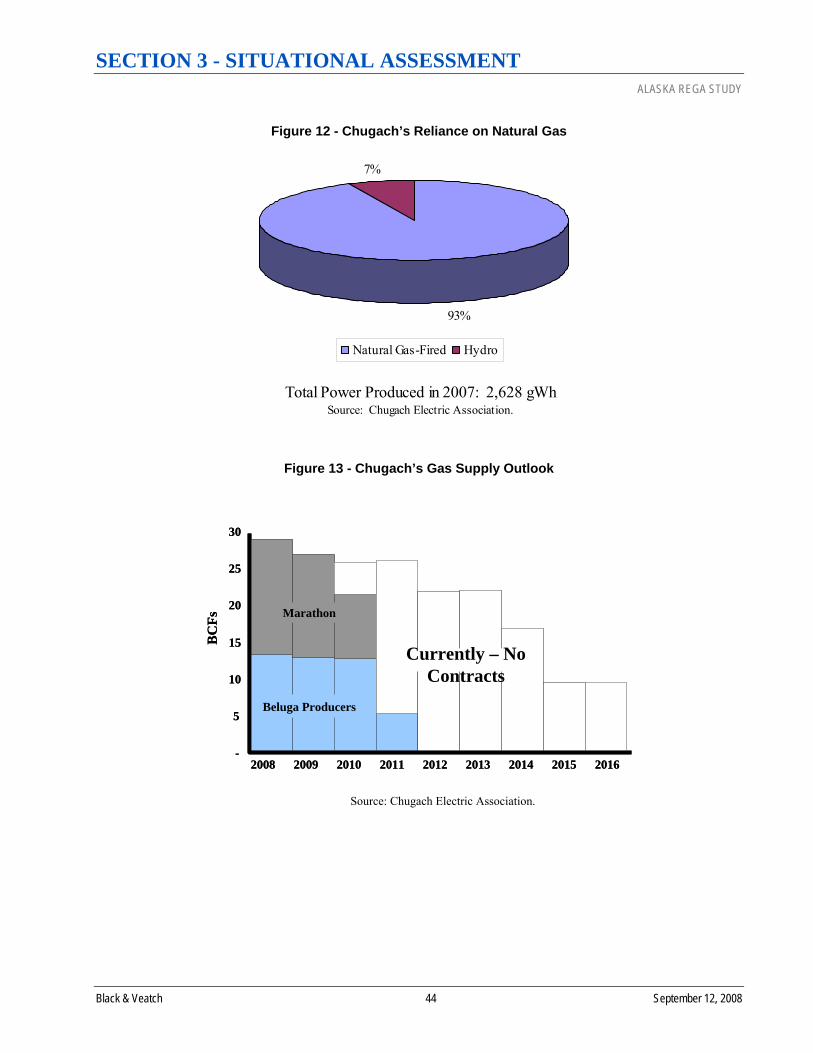
SECTION 3 - SITUATIONAL ASSESSMENT ALASKA REGA STUDY
Black & Veatch 44 September 12, 2008
Figure 12 - Chugach’s Reliance on Natural Gas
7%
93%
Natural Gas-Fired Hydro
Total Power Produced in 2007: 2,628 gWhSource: Chugach Electric Association.
Figure 13 - Chugach’s Gas Supply Outlook
5
10
15
20
25
30
2008 2009 2010 2011 2012 2013 2014 2015 2016
BC
Fs
-
Beluga Producers
Marathon
Currently – No Contracts
5
10
15
20
25
30
2008 2009 2010 2011 2012 2013 2014 2015 2016
BC
Fs
-
Beluga Producers
Marathon
Currently – No Contracts
Source: Chugach Electric Association.

SECTION 3 - SITUATIONAL ASSESSMENT ALASKA REGA STUDY
Black & Veatch 45 September 12, 2008
Figure 14 - Overview of Cook Inlet Gas Situation
1970 2005
147,150
398,626
Population ofAnchorage, Mat-Su,and Kenai Peninsulaup 170% Since 1970
Source: Alaska Department of Labor, Alaska Division of Oil and Gas, and Science Applications International Corporation.
8.8
1.7
AllDiscoveries
2005Reserves
Remaining ReservesDown 80%
(In trillion cubic feet)
Supply Demand
Supply From KnownReserves Projected
to Meet Half ofDemand for
Residential andCommercial Heating
and ElectricityBy 2017
(In billion cubic feet)
44
95
1970 2005
147,150
398,626
Population ofAnchorage, Mat-Su,and Kenai Peninsulaup 170% Since 1970
1970 2005
147,150
398,626
Population ofAnchorage, Mat-Su,and Kenai Peninsulaup 170% Since 1970
Source: Alaska Department of Labor, Alaska Division of Oil and Gas, and Science Applications International Corporation.
8.8
1.7
AllDiscoveries
2005Reserves
Remaining ReservesDown 80%
(In trillion cubic feet)
8.8
1.7
AllDiscoveries
2005Reserves
Remaining ReservesDown 80%
(In trillion cubic feet)
Supply Demand
Supply From KnownReserves Projected
to Meet Half ofDemand for
Residential andCommercial Heating
and ElectricityBy 2017
(In billion cubic feet)
44
95
Supply Demand
Supply From KnownReserves Projected
to Meet Half ofDemand for
Residential andCommercial Heating
and ElectricityBy 2017
(In billion cubic feet)
44
95
Figure 15 - Projected Supply and Demand for Cook Inlet Gas
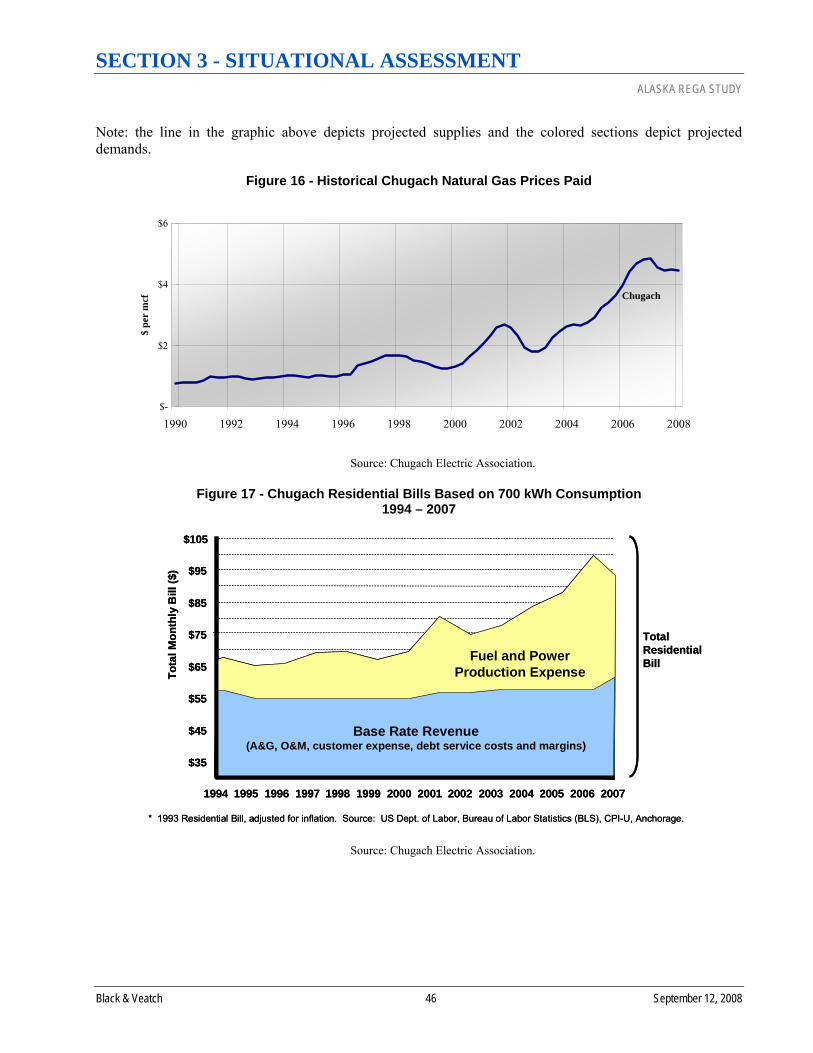
SECTION 3 - SITUATIONAL ASSESSMENT ALASKA REGA STUDY
Black & Veatch 46 September 12, 2008
Note: the line in the graphic above depicts projected supplies and the colored sections depict projected demands.
Figure 16 - Historical Chugach Natural Gas Prices Paid
$-
$2
$4
$6
1990 1992 1994 1996 1998 2000 2002 2004 2006 2008
$ pe
r m
cf Chugach
Source: Chugach Electric Association.
Figure 17 - Chugach Residential Bills Based on 700 kWh Consumption 1994 – 2007
Total Residential Bill
* 1993 Residential Bill, adjusted for inflation. Source: US Dept. of Labor, Bureau of Labor Statistics (BLS), CPI-U, Anchorage.
$35
$45
$55
$65
$75
$85
$95
$105
1994 1995 1996 1997 1998 1999 2000 2001 2002 2003 2004 2005 2006
Tota
l Mon
thly
Bill
($)
Fuel and Power Production Expense
Base Rate Revenue (A&G, O&M, customer expense, debt service costs and margins)
2007
Source: Chugach Electric Association.
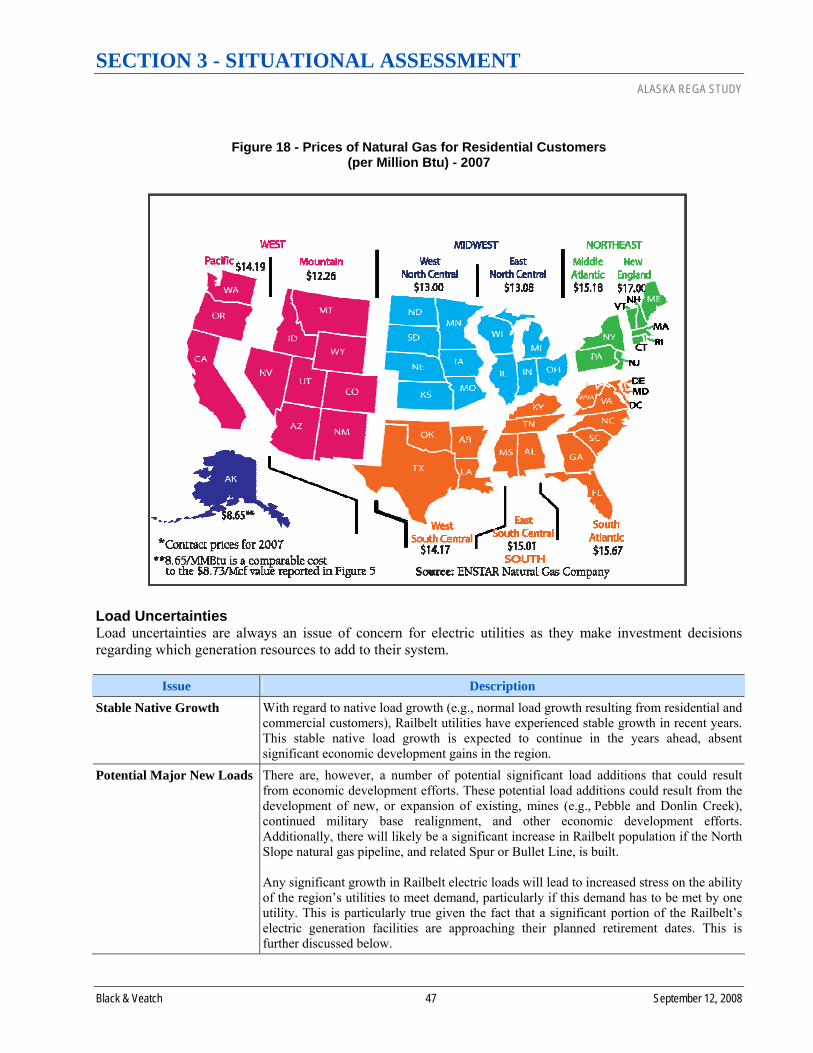
SECTION 3 - SITUATIONAL ASSESSMENT ALASKA REGA STUDY
Black & Veatch 47 September 12, 2008
Figure 18 - Prices of Natural Gas for Residential Customers (per Million Btu) - 2007
Load Uncertainties Load uncertainties are always an issue of concern for electric utilities as they make investment decisions regarding which generation resources to add to their system.
Issue Description Stable Native Growth With regard to native load growth (e.g., normal load growth resulting from residential and
commercial customers), Railbelt utilities have experienced stable growth in recent years. This stable native load growth is expected to continue in the years ahead, absent significant economic development gains in the region.
Potential Major New Loads There are, however, a number of potential significant load additions that could result from economic development efforts. These potential load additions could result from the development of new, or expansion of existing, mines (e.g., Pebble and Donlin Creek), continued military base realignment, and other economic development efforts. Additionally, there will likely be a significant increase in Railbelt population if the North Slope natural gas pipeline, and related Spur or Bullet Line, is built. Any significant growth in Railbelt electric loads will lead to increased stress on the ability of the region’s utilities to meet demand, particularly if this demand has to be met by one utility. This is particularly true given the fact that a significant portion of the Railbelt’s electric generation facilities are approaching their planned retirement dates. This is further discussed below.
SECTION 3 - SITUATIONAL ASSESSMENT ALASKA REGA STUDY
Black & Veatch 48 September 12, 2008
Infrastructure Issues The challenges faced by the Railbelt utilities are magnified by the aging nature of existing generation facilities in the region.
Issue Description Aging Generation Infrastructure
Approximately 48 percent of the existing generation capability within the Railbelt region is scheduled to be retired within 15 years. During this period, decisions relative to retirement, refurbishment, and life extension must be made. Replacing this capacity with more efficient capacity requires substantial new capital investment, offset by the lower cost of generation when plants incorporate lower fuel cost resources, such as coal.
Baseload Usage of Inefficient Generation Facilities
Another issue that is directly related to the aging nature of the existing Railbelt generation fleet is the fact that certain older, inefficient generation units are being used as baseload, or near-baseload, generation facilities, raising regional operating costs. Since the cost of energy production is a combination of fuel cost and heat rate, the combination of rising energy costs and more production from high heat rate units causes larger increases in the cost of energy. A simple example illustrates the compound nature of the problem. At a heat rate of 10,000 BTU/kWh and a gas cost of six dollars per Mcf, a kilowatt-hour costs six cents to produce. If the heat rate increases to 15,000BTU/kWh, that same kilowatt-hour now costs nine cents. As more high heat rate units operate more hours, the average cost of power increases even without a fuel cost increase. In addition, it is typical that as generation units mature past the mid-point of their average life there is a strong likelihood that heat rates will rise the further their age goes beyond the mid-point of expected life.
Operating and Spinning Reserve Requirements
Railbelt reliability procedures require spinning reserves equal to the largest operating unit and an operating reserve level of an additional 50% of the largest unit. In addition, the region’s system target reserve margin is set at 30%. These reserve levels reflect the absence of interconnections, the relative operating impacts of limited resources and the necessity of maintaining reliability with the existing size of the system. Such high reserve margins affect total fuel and maintenance costs.
Future Resource Options There are several issues regarding the future resource options that will be available to meet demand within the Railbelt region.
Issue Description Acceptability of Large Hydro and Coal
Much discussion has occurred in recent years about the future role that large hydroelectric and coal projects might play in meeting the electricity needs of the Railbelt region. Like other parts of the country and the world, the acceptability and economics of large hydroelectric and coal facilities are uncertain. As might be expected, we received different comments from various utility and non-utility stakeholders regarding the acceptability of these technologies. Resolving the acceptability issues, and other related economic and environmental issues, associated with large hydro and coal will require the active involvement of the Governor and Legislature, as well as the Railbelt utilities and other stakeholders.
Carbon Tax and Other Environmental Restrictions
Another uncertainty facing the Railbelt utilities relates to the restrictions on carbon emissions, and the related economic impact, that might be imposed by Federal and/or State legislation, as well as other environmental restrictions (e.g., mercury limits) that will impact the technical and economic feasibility of various generation technologies. In the case of the imposition of carbon taxes, there are a number of competing bills currently working their way through the Federal legislative process. These bills each have different targets for the reduction of carbon emissions, and each will result in different levels of carbon taxes and/or different costs for the capturing and sequestering of carbon emissions. Depending upon the form of Federal and/or State carbon legislation ultimately
SECTION 3 - SITUATIONAL ASSESSMENT ALASKA REGA STUDY
Black & Veatch 49 September 12, 2008
Issue Description enacted, the economics of fossil-fueled generation technologies could be significantly impacted.
Optimal Size and Location of New Generation and Transmission Facilities
Given the need to replace existing generation facilities and meet expected load growth, significant investments in new generation resources will be required. A very important issue that needs to be addressed by the Railbelt utilities is the optimal size and location of new generation and transmission facilities. This is, in fact, one of the factors driving the interest in the formation of a regional generation and transmission entity. When individual utilities make resource decisions that optimize the future resource mix for their own needs, the resulting regional resource mix will simply not be as optimal relative to the resource mix that would result from a regional planning process. Additionally, decisions that will be made with regard to improving and expanding the Railbelt electric transmission grid will have a direct bearing of determining the optimal size and location of future generation resources. The economics of new generation and its location includes the investment in transmission to deliver the generation to remote load centers. Further, optimal decisions require analysis of both generation and transmission costs across the interconnected grid.
Limited Development – Renewables
Renewable generation technologies represent a significant opportunity for the Railbelt utilities relative to replacing aging generation facilities and meeting future load growth. To date, the Railbelt utilities have developed renewable resource technologies to a very limited degree, relative to the technical potential of these resources as well as relative to the level of deployment of these technologies in other regions of the country. While this limited use of renewable resources may reflect the challenges of integrating such resources into a transmission constrained grid and managing the power fluctuations on an individual utility basis, enhanced transmission infrastructure and regional coordination may create additional opportunities for renewables as part of the portfolio of resources. The issue of integrating technologies having variable outputs, such as wind and solar, into a fossil-fueled grid presents substantial operational challenges including the determination of the optimal level of these resources. As evidence of the growing reliance on renewable resources throughout the country, Figure 19 shows those states that have adopted a Renewables Portfolio Standard (RPS). Typically, these programs call for renewables to represent a certain percentage of the overall resource mix of an individual utility or region by a certain point in time. It is important to note that these renewable resource standards raise the cost of power because the technologies used cost more than conventional generation. Given the high cost of power and absence of scale economies, any decision to mandate an RPS will likely increase power costs further for customers in the Railbelt region absent contributions from the State to buy down the costs of these resources. An important issue related to the implementation of renewable resources that needs to be addressed is whether the development of renewable resources should be accomplished by the individual Railbelt utilities or whether a regional approach would result in the more efficient and cost-effective deployment of these resources.
Limited Development – DSM/Energy Efficiency Programs
Similar to the comments above related to renewable resource technologies, the Railbelt utilities have limited experience with the planning, developing and delivering of DSM and energy efficiency programs. To date, the majority of efforts in the Railbelt region and the State as a whole have been focused on the implementation of home weatherization programs. These programs can significantly reduce the energy consumption within individual homes; however, given the limited saturation of electric space heating equipment and the general lack of air conditioning loads, the potential for DSM and energy programs are limited from the perspective of the Railbelt electric utilities.
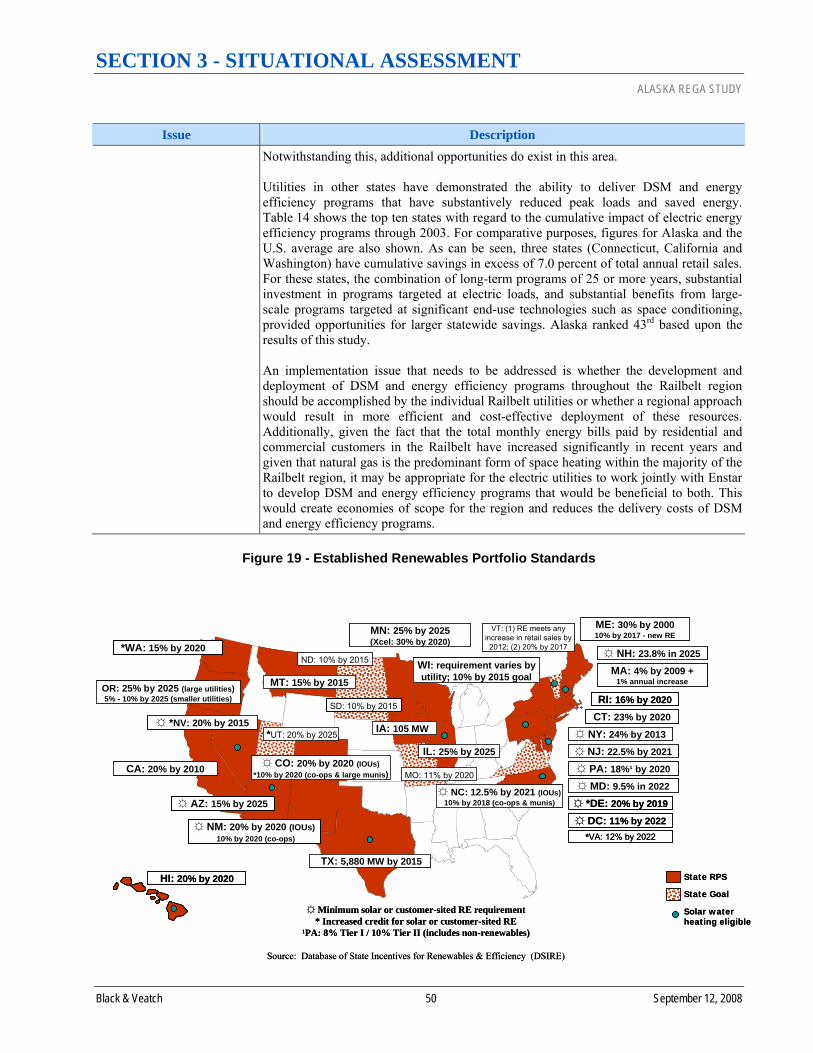
SECTION 3 - SITUATIONAL ASSESSMENT ALASKA REGA STUDY
Black & Veatch 50 September 12, 2008
Issue Description Notwithstanding this, additional opportunities do exist in this area. Utilities in other states have demonstrated the ability to deliver DSM and energy efficiency programs that have substantively reduced peak loads and saved energy. Table 14 shows the top ten states with regard to the cumulative impact of electric energy efficiency programs through 2003. For comparative purposes, figures for Alaska and the U.S. average are also shown. As can be seen, three states (Connecticut, California and Washington) have cumulative savings in excess of 7.0 percent of total annual retail sales. For these states, the combination of long-term programs of 25 or more years, substantial investment in programs targeted at electric loads, and substantial benefits from large-scale programs targeted at significant end-use technologies such as space conditioning,provided opportunities for larger statewide savings. Alaska ranked 43rd based upon the results of this study. An implementation issue that needs to be addressed is whether the development and deployment of DSM and energy efficiency programs throughout the Railbelt regionshould be accomplished by the individual Railbelt utilities or whether a regional approach would result in more efficient and cost-effective deployment of these resources. Additionally, given the fact that the total monthly energy bills paid by residential and commercial customers in the Railbelt have increased significantly in recent years and given that natural gas is the predominant form of space heating within the majority of the Railbelt region, it may be appropriate for the electric utilities to work jointly with Enstar to develop DSM and energy efficiency programs that would be beneficial to both. This would create economies of scope for the region and reduces the delivery costs of DSM and energy efficiency programs.
Figure 19 - Established Renewables Portfolio Standards
State Goal
☼ PA: 18%¹ by 2020
☼ NJ: 22.5% by 2021
CT: 23% by 2020
MA: 4% by 2009 +1% annual increase
WI: requirement varies by utility; 10% by 2015 goal
IA: 105 MW
MN: 25% by 2025(Xcel: 30% by 2020)
TX: 5,880 MW by 2015
☼ AZ: 15% by 2025
CA: 20% by 2010
☼ *NV: 20% by 2015
ME: 30% by 200010% by 2017 - new RE
State RPS
☼ Minimum solar or customer-sited RE requirement* Increased credit for solar or customer-sited RE
¹PA: 8% Tier I / 10% Tier II (includes non-renewables)
Source: Database of State Incentives for Renewables & Efficiency (DSIRE)
HI: 20% by 2020
RI: 16% by 2020
☼ CO: 20% by 2020 (IOUs)*10% by 2020 (co-ops & large munis)
☼ DC: 11% by 2022
☼ NY: 24% by 2013
MT: 15% by 2015
IL: 25% by 2025
VT: (1) RE meets any increase in retail sales by 2012; (2) 20% by 2017
Solar water heating eligible
*WA: 15% by 2020
☼ MD: 9.5% in 2022
☼ NH: 23.8% in 2025
OR: 25% by 2025 (large utilities)5% - 10% by 2025 (smaller utilities)
*VA: 12% by 2022
MO: 11% by 2020
☼ *DE: 20% by 2019
☼ NM: 20% by 2020 (IOUs)10% by 2020 (co-ops)
☼ NC: 12.5% by 2021 (IOUs)10% by 2018 (co-ops & munis)
ND: 10% by 2015
SD: 10% by 2015
*UT: 20% by 2025

SECTION 3 - SITUATIONAL ASSESSMENT ALASKA REGA STUDY
Black & Veatch 51 September 12, 2008
Table 14 - Cumulative Impacts of Electric Efficiency Programs as a Percentage of Total Retail Sales
2003
Rank
State
Cumulative Annual Energy Savings as a Percentage
of Annual Total Retail Sales1 Connecticut 7.8% 2 California 7.5% 3 Washington 7.2% 4 Minnesota 6.7% 5 Rhode Island 6.2% 6 Oregon 6.0% 7 Massachusetts 5.8% 8 Vermont 4.8% 9 Wisconsin 4.4%
10 Montana 3.9% 43 Alaska 0.1%
U.S. Average 1.9%
“Source: ACEEE’s 3rd National Scorecard on Utility and Public Benefit Energy Efficiency Programs: A National Review and Update of State-Level Activity,” Report U054, October 2005, pages 8 and 18.
Political Issues The following political issues impact the current situation in the Railbelt region.
Issue Description Historical Dependence on State Funding
The Railbelt utilities have been dependent upon State funding for certain portions of theregional generation and transmission infrastructure, as well as for certain local infrastructure investments. Some of these investments have been made through the Railbelt Energy Fund; others have been direct appropriations by the Legislature. Regional State-funded infrastructure investments include the Alaska Intertie and Bradley Lake Hydroelectric Plant.
Proper Role for State Historical State infrastructure-related investments have provided significant benefits to the residential and commercial customers in the Railbelt. Going forward, one question that needs to be answered is what the proper role of the State should be relative to the further development of the Railbelt region’s generation and transmission infrastructure.
Risk Management The following issues relate to risk management, which has become increasingly important for all utilities.
Issue Description Need to Maintain Flexibility As previously discussed, the recent increase in natural gas prices highlights the dangers
inherent with an over-reliance on one fuel source or generation technology. Just as investors rely on a portfolio of assets, it is important for utilities to develop a portfolio of assets to insure safe, reliable and cost-effective service to customers. It also demonstrates the importance of maintaining flexibility.
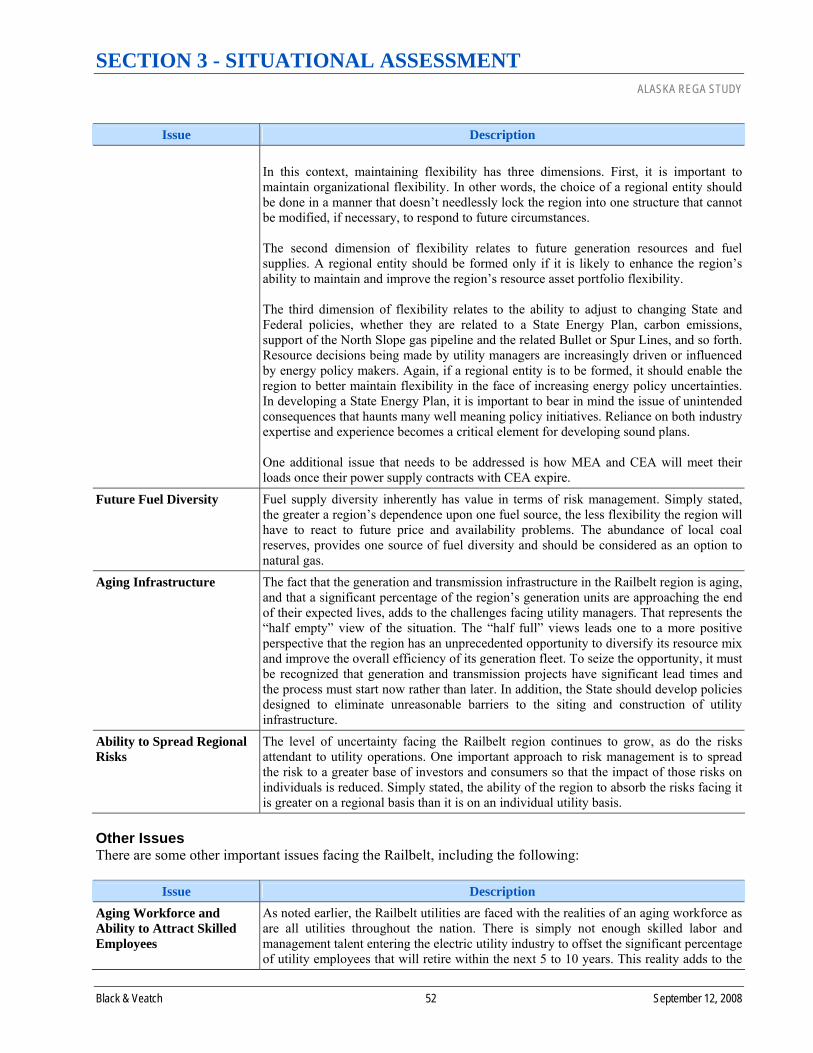
SECTION 3 - SITUATIONAL ASSESSMENT ALASKA REGA STUDY
Black & Veatch 52 September 12, 2008
Issue Description In this context, maintaining flexibility has three dimensions. First, it is important to maintain organizational flexibility. In other words, the choice of a regional entity should be done in a manner that doesn’t needlessly lock the region into one structure that cannot be modified, if necessary, to respond to future circumstances. The second dimension of flexibility relates to future generation resources and fuel supplies. A regional entity should be formed only if it is likely to enhance the region’s ability to maintain and improve the region’s resource asset portfolio flexibility. The third dimension of flexibility relates to the ability to adjust to changing State and Federal policies, whether they are related to a State Energy Plan, carbon emissions, support of the North Slope gas pipeline and the related Bullet or Spur Lines, and so forth. Resource decisions being made by utility managers are increasingly driven or influenced by energy policy makers. Again, if a regional entity is to be formed, it should enable the region to better maintain flexibility in the face of increasing energy policy uncertainties. In developing a State Energy Plan, it is important to bear in mind the issue of unintended consequences that haunts many well meaning policy initiatives. Reliance on both industry expertise and experience becomes a critical element for developing sound plans. One additional issue that needs to be addressed is how MEA and CEA will meet their loads once their power supply contracts with CEA expire.
Future Fuel Diversity Fuel supply diversity inherently has value in terms of risk management. Simply stated, the greater a region’s dependence upon one fuel source, the less flexibility the region will have to react to future price and availability problems. The abundance of local coal reserves, provides one source of fuel diversity and should be considered as an option to natural gas.
Aging Infrastructure The fact that the generation and transmission infrastructure in the Railbelt region is aging, and that a significant percentage of the region’s generation units are approaching the end of their expected lives, adds to the challenges facing utility managers. That represents the “half empty” view of the situation. The “half full” views leads one to a more positive perspective that the region has an unprecedented opportunity to diversify its resource mix and improve the overall efficiency of its generation fleet. To seize the opportunity, it must be recognized that generation and transmission projects have significant lead times and the process must start now rather than later. In addition, the State should develop policies designed to eliminate unreasonable barriers to the siting and construction of utility infrastructure.
Ability to Spread Regional Risks
The level of uncertainty facing the Railbelt region continues to grow, as do the risks attendant to utility operations. One important approach to risk management is to spread the risk to a greater base of investors and consumers so that the impact of those risks on individuals is reduced. Simply stated, the ability of the region to absorb the risks facing it is greater on a regional basis than it is on an individual utility basis.
Other Issues There are some other important issues facing the Railbelt, including the following:
Issue Description Aging Workforce and Ability to Attract Skilled Employees
As noted earlier, the Railbelt utilities are faced with the realities of an aging workforce as are all utilities throughout the nation. There is simply not enough skilled labor and management talent entering the electric utility industry to offset the significant percentage of utility employees that will retire within the next 5 to 10 years. This reality adds to the

SECTION 3 - SITUATIONAL ASSESSMENT ALASKA REGA STUDY
Black & Veatch 53 September 12, 2008
Issue Description importance of achieving economies of scale with regard to staffing and skill sets. It will become increasingly harder for the Railbelt utilities, on an individual basis, to attract and retain the necessary staffing levels and skill sets to effectively address the challenges ahead. This is particularly true with regard to the development of new technologies (e.g., renewable resources), increasing customer services (e.g., expansion of DSM and energy efficiency programs), and more sophisticated risk management (e.g., managingthe risks associated with market-based natural gas prices).
Reliability Historically, the Railbelt utilities have done a good job of maintaining reliable electric service. Maintaining future reliability requires planning for additional generation and transmission, and replacing aging infrastructure.
Proposed ML&P/Chugach Merger
ML&P and Chugach are exploring the potential benefits of merging, or increasing the level of joint operations and project development. At the time that this study was completed, no final decisions have been made by the Anchorage City Council or the Chugach Board of Directors. Certainly, a decision to merge or consolidate ML&P and Chugach operations could be viewed as a step towards the formation of a regional entity; it could also prove to be an impediment in that it could be viewed as a competing proposal to, or reducing the net incremental benefits associated with, the formation of a region-wide entity.
Sustainability Increasing demands are being placed on utility managers to conduct operations in as sustainable of a manner as possible. The underlying notion of good stewardship is a characteristic that is second nature to most utility Board members, managers, and employees; this is even more true within not-for-profit cooperatives and municipal utilities. Nothwithstanding this, the need to incorporate sustainability concepts more fully in future planning and operational decisions is a challenge that must be met by the Railbelt utilities.

SECTION 4 - ORGANIZATIONAL PATHS AND EVALUATION SCENARIOS
ALASKA REGA STUDY
Black & Veatch 54 September 12, 2008
SECTION 4 - ORGANIZATIONAL PATHS AND EVALUATION SCENARIOS In this section, we provide descriptions of the alternative Organizational Paths that were evaluated during the course of this project and a summary of the Evaluation Scenarios that were analyzed.
Describe Each Organizational Path Evaluated The following graphic summarizes the various organizational options that were available for consideration as part of this study. This table is intended to be inclusive of the primary options; there are other less relevant options and variations of the options shown in the table.
Table 15 - Summary of Organizational Options
Railbelt Utilities Consolidated
Functional Area Current
StructurePublic
Entity(ies)Investor-Owned
Voluntary Agreements
JAA/G&T Cooperative
RTO/ISO
State Agency
Other
Generation Infrastructure Planning Project Development Operations Transmission Infrastructure Planning Project Development Operations Economic Dispatch
Distribution
Customer Services DSM/Energy Efficiency Programs Other Services
Competitive Procurement Power Supplies Fuel Supplies Other Products and Services
Market Development
On the left-hand side of this table, we have shown the primary functional areas, or requirements, involved in the provision of electric service. These functional areas include: • Generation Infrastructure
♦ Planning – planning of future generation resources (both traditional and renewables). ♦ Project Development – development of new generation facilities. ♦ Operations – day-to-day operations of existing and future generation facilities.
• Transmission Infrastructure ♦ Planning – planning of future transmission grid expansions. ♦ Project Development – development of new transmission assets. ♦ Operations – day-to-day operations of the transmission grid to meet reliability, security, congestion
management, and ancillary services requirements.

SECTION 4 - ORGANIZATIONAL PATHS AND EVALUATION SCENARIOS
ALASKA REGA STUDY
Black & Veatch 55 September 12, 2008
• Economic Dispatch – centralized economic dispatch of all generation resources within the Railbelt region.
• Distribution – provision of distribution services to move power from the transmission grid to individual businesses and residences (note: this is outside of the scope of this project but is included here for completeness sake).
• Customer Services ♦ DSM/Energy Efficiency Programs – the provision of DSM and energy efficiency programs to
customers. ♦ Other Services - provision of other customer services (e.g., metering and customer call centers)
(note: again, this is outside of the scope of this project but is included here for completeness sake). • Competitive Procurement
♦ Power Supplies – competitive solicitation of power supplies, either on an individual utility or regional basis.
♦ Fuel Supplies – regional, competitive procurement of fuel supplies. ♦ Other Products and Services – competitive procurement of other required products and services
(e.g., procurement of power poles). • Market Development – development and operation of a competitive power market.
Going across the table, we show a number of potential organizational options for the provision of the functional requirements of electric service. These include: • Railbelt Utilities
♦ Current Structure – this represents the continuation of the current utility structure and functional operations provided by the Railbelt utilities.
♦ Consolidated Options – these columns represent for-profit and not-for-profit consolidated organizational structures for the Railbelt utilities. • Public Entity(ies) – this organizational option involves the consolidation of the existing six
utilities into one or more public utilities. • IOU - this option involves the consolidation of the existing six utilities into an IOU.
• Voluntary Agreements – this option involves maintaining the existing utility structure within the Railbelt region but entering into additional cooperative agreements.
• JAA/G&T – this option consists of the formation of a new JAA or G&T Cooperative. • RTO/ISO – this option consists of the formation of a RTO or ISO. • State Agency – this option involves expanding the responsibilities of an existing, or the formation of a
new, State agency. • Other – this includes other entities (e.g., independent power producers).
The check marks shown in the table indicate that the organizational option provides the specified functional requirements involved in the provision of electric service.
The task then became to determine which organizational options to evaluate further in detail. Based upon input from the Advisory Working Group, five organizational structures (herein referred to as Organizational Paths) were chosen for detailed evaluation. These chosen Paths are shown in the following graphic and discussed below.
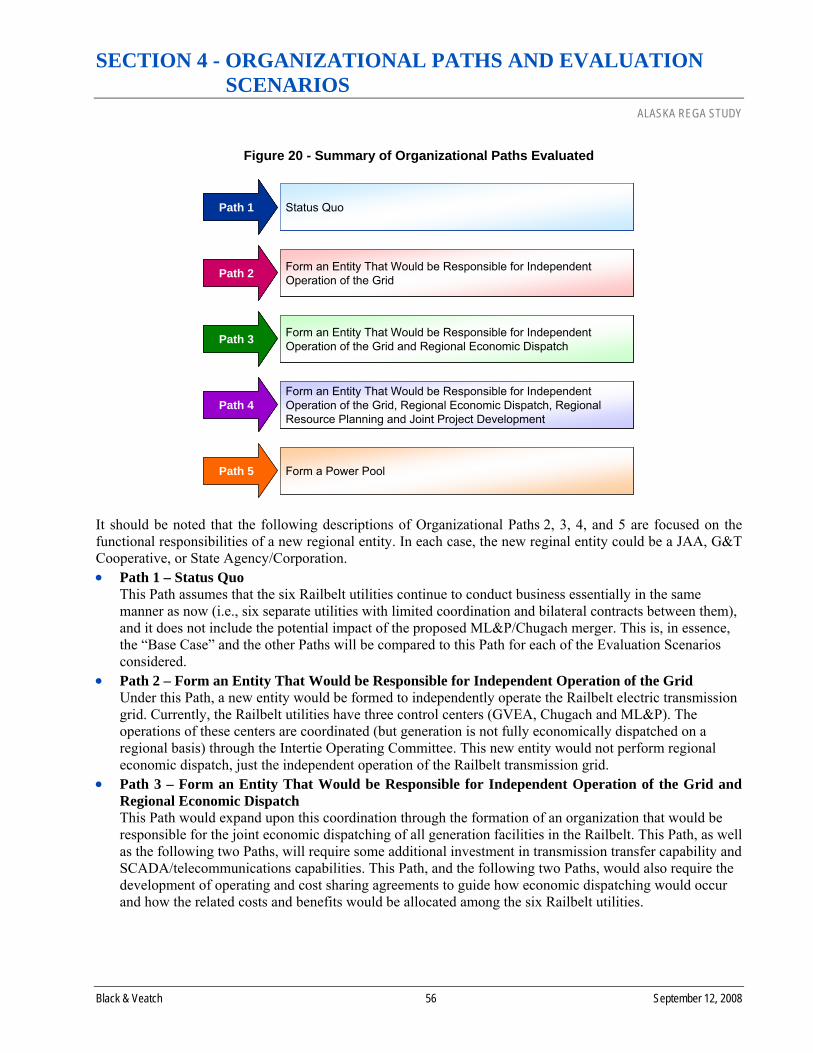
SECTION 4 - ORGANIZATIONAL PATHS AND EVALUATION SCENARIOS
ALASKA REGA STUDY
Black & Veatch 56 September 12, 2008
Figure 20 - Summary of Organizational Paths Evaluated
Status QuoPath 1
Form an Entity That Would be Responsible for Independent Operation of the GridPath 2
Form an Entity That Would be Responsible for Independent Operation of the Grid and Regional Economic DispatchPath 3
Form an Entity That Would be Responsible for Independent Operation of the Grid, Regional Economic Dispatch, Regional Resource Planning and Joint Project Development
Path 4
Form a Power PoolPath 5
Status QuoPath 1 Status QuoPath 1
Form an Entity That Would be Responsible for Independent Operation of the GridPath 2 Form an Entity That Would be Responsible for Independent Operation of the GridPath 2
Form an Entity That Would be Responsible for Independent Operation of the Grid and Regional Economic DispatchPath 3 Form an Entity That Would be Responsible for Independent Operation of the Grid and Regional Economic DispatchPath 3
Form an Entity That Would be Responsible for Independent Operation of the Grid, Regional Economic Dispatch, Regional Resource Planning and Joint Project Development
Path 4Form an Entity That Would be Responsible for Independent Operation of the Grid, Regional Economic Dispatch, Regional Resource Planning and Joint Project Development
Path 4
Form a Power PoolPath 5
It should be noted that the following descriptions of Organizational Paths 2, 3, 4, and 5 are focused on the functional responsibilities of a new regional entity. In each case, the new reginal entity could be a JAA, G&T Cooperative, or State Agency/Corporation. • Path 1 – Status Quo
This Path assumes that the six Railbelt utilities continue to conduct business essentially in the same manner as now (i.e., six separate utilities with limited coordination and bilateral contracts between them), and it does not include the potential impact of the proposed ML&P/Chugach merger. This is, in essence, the “Base Case” and the other Paths will be compared to this Path for each of the Evaluation Scenarios considered.
• Path 2 – Form an Entity That Would be Responsible for Independent Operation of the Grid Under this Path, a new entity would be formed to independently operate the Railbelt electric transmission grid. Currently, the Railbelt utilities have three control centers (GVEA, Chugach and ML&P). The operations of these centers are coordinated (but generation is not fully economically dispatched on a regional basis) through the Intertie Operating Committee. This new entity would not perform regional economic dispatch, just the independent operation of the Railbelt transmission grid.
• Path 3 – Form an Entity That Would be Responsible for Independent Operation of the Grid and Regional Economic Dispatch This Path would expand upon this coordination through the formation of an organization that would be responsible for the joint economic dispatching of all generation facilities in the Railbelt. This Path, as well as the following two Paths, will require some additional investment in transmission transfer capability and SCADA/telecommunications capabilities. This Path, and the following two Paths, would also require the development of operating and cost sharing agreements to guide how economic dispatching would occur and how the related costs and benefits would be allocated among the six Railbelt utilities.
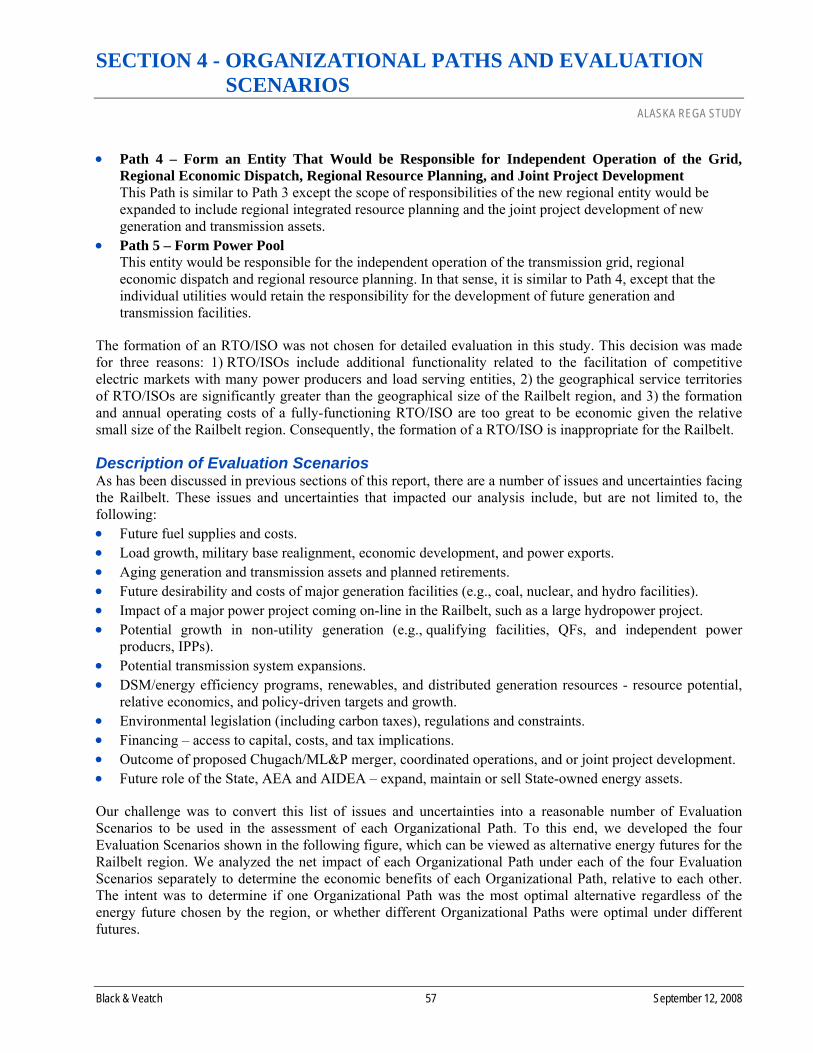
SECTION 4 - ORGANIZATIONAL PATHS AND EVALUATION SCENARIOS
ALASKA REGA STUDY
Black & Veatch 57 September 12, 2008
• Path 4 – Form an Entity That Would be Responsible for Independent Operation of the Grid, Regional Economic Dispatch, Regional Resource Planning, and Joint Project Development This Path is similar to Path 3 except the scope of responsibilities of the new regional entity would be expanded to include regional integrated resource planning and the joint project development of new generation and transmission assets.
• Path 5 – Form Power Pool This entity would be responsible for the independent operation of the transmission grid, regional economic dispatch and regional resource planning. In that sense, it is similar to Path 4, except that the individual utilities would retain the responsibility for the development of future generation and transmission facilities.
The formation of an RTO/ISO was not chosen for detailed evaluation in this study. This decision was made for three reasons: 1) RTO/ISOs include additional functionality related to the facilitation of competitive electric markets with many power producers and load serving entities, 2) the geographical service territories of RTO/ISOs are significantly greater than the geographical size of the Railbelt region, and 3) the formation and annual operating costs of a fully-functioning RTO/ISO are too great to be economic given the relative small size of the Railbelt region. Consequently, the formation of a RTO/ISO is inappropriate for the Railbelt.
Description of Evaluation Scenarios As has been discussed in previous sections of this report, there are a number of issues and uncertainties facing the Railbelt. These issues and uncertainties that impacted our analysis include, but are not limited to, the following: • Future fuel supplies and costs. • Load growth, military base realignment, economic development, and power exports. • Aging generation and transmission assets and planned retirements. • Future desirability and costs of major generation facilities (e.g., coal, nuclear, and hydro facilities). • Impact of a major power project coming on-line in the Railbelt, such as a large hydropower project. • Potential growth in non-utility generation (e.g., qualifying facilities, QFs, and independent power
producrs, IPPs). • Potential transmission system expansions. • DSM/energy efficiency programs, renewables, and distributed generation resources - resource potential,
relative economics, and policy-driven targets and growth. • Environmental legislation (including carbon taxes), regulations and constraints. • Financing – access to capital, costs, and tax implications. • Outcome of proposed Chugach/ML&P merger, coordinated operations, and or joint project development. • Future role of the State, AEA and AIDEA – expand, maintain or sell State-owned energy assets.
Our challenge was to convert this list of issues and uncertainties into a reasonable number of Evaluation Scenarios to be used in the assessment of each Organizational Path. To this end, we developed the four Evaluation Scenarios shown in the following figure, which can be viewed as alternative energy futures for the Railbelt region. We analyzed the net impact of each Organizational Path under each of the four Evaluation Scenarios separately to determine the economic benefits of each Organizational Path, relative to each other. The intent was to determine if one Organizational Path was the most optimal alternative regardless of the energy future chosen by the region, or whether different Organizational Paths were optimal under different futures.

SECTION 4 - ORGANIZATIONAL PATHS AND EVALUATION SCENARIOS
ALASKA REGA STUDY
Black & Veatch 58 September 12, 2008
Figure 21 - Summary of Evaluation Scenarios
Scenario ALarge Hydro /
Renewables / DSM / Energy Efficiency
Scenario
Scenario BNatural Gas
Scenario
Scenario CCoal
Scenario
Scenario DMixed Resource
Portfolio Scenario
Scenario ALarge Hydro /
Renewables / DSM / Energy Efficiency
Scenario
Scenario ALarge Hydro /
Renewables / DSM / Energy Efficiency
Scenario
Scenario BNatural Gas
Scenario
Scenario BNatural Gas
Scenario
Scenario CCoal
Scenario
Scenario CCoal
Scenario
Scenario DMixed Resource
Portfolio Scenario
Scenario DMixed Resource
Portfolio Scenario
For each Evaluation Scenario, we developed prescriptive generation supply resource plans, which are representative resource plans to determine the economic benefits of each Organizational Path. These prescriptive resource plans are not the same as integrated resource plans for each Evaluation Scenario, which are optimal long-term resource plans given all considered factors.
Therefore, as noted earlier, it would be inappropriate to compare one Evaluation Scenario to another, as the resulting evaluation plans and power costs under the different Scenarios are not necessarily indicative of what they would be under an optimized integrated resource plan. They do, however, provide a solid foundation for the evaluation of the various Organizational Paths to each other under alternative futures. • Scenario A -Large Hydro/Renewables/DSM/Energy Efficiency Scenario
This Scenario assumes that the majority of the future regional generation resources that are added to the region include one or more large hydroelectric plants (greater than 200 MW), other renewable resources, and DSM and energy efficiency programs.
• Scenario B - Natural Gas Scenario In this Scenario, we assumed that all of the future generation resources will be natural gas-fired facilities, continuing the region’s dependence upon natural gas.
• Scenario C - Coal Scenario The central resource option in this Scenario is the addition of coal plants to meet the future needs of the region.
• Scenario D - Mixed Resource Portfolio Scenario In this Scenario, we assumed that a combination of large hydroelectric, renewables, DSM/energy efficiency programs, coal and natural gas resources is added over the next 30 years to meet the future needs of the region.

SECTION 5 - EXISTING AND FUTURE RESOURCE OPTIONS ALASKA REGA STUDY
Black & Veatch 59 September 12, 2008
SECTION 5 - EXISTING AND FUTURE RESOURCE OPTIONS This section includes a detailed summary of the generation and transmission assets that currently exist in the Railbelt region. We also provide a high-level overview of the supply-side and demand-side resource options that are available to meet the electric demand of residential and business customers in the Railbelt region.
Description of Existing Resources
Existing Generation Resources This section contains a general description of the generation and transmission resources currently in use in the Railbelt region. The existing system data was provided by the Railbelt utilities in response to data requests by Black & Veatch. Black & Veatch reviewed the data and, where necessary, applied judgment to the data to obtain a consistent set of existing system data for planning purposes.
ML&P operates seven combustion turbines (Units 1-5, 7, and 8) between two power plants, which operate on natural gas, and one steam turbine (Unit 6), which derives its steam from un-fired heat recovery steam generators (HRSGs). Units 1, 2, and 4 are unavailable for commercial operation and are not considered in ML&P’s approximate 400 MW of generating capability. Combustion turbines 5 and 7 have HRSGs, which allow them to operate in a combined cycle mode with the Unit 6 steam turbine. Unit 5 is frequently cycled when used in combined cycle or simple cycle mode. Unit 5 or Unit 7 may be operated in simple cycle mode when the steam turbine is unavailable. ML&P’s existing thermal units are shown in the following table.
Table 16 - ML&P Existing Thermal Units
Name Unit Primary Fuel Winter Rating (MW)Projected
Retirement DateAnchorage ML&P - Plant 1 1* Natural Gas 16.2 n/aAnchorage ML&P - Plant 1 2* Natural Gas 16.2 n/aAnchorage ML&P - Plant 1 3 Natural Gas 32.0 n/aAnchorage ML&P - Plant 1 4* Natural Gas 34.1 n/aAchorage ML&P - Plant 2 5 Natural Gas 37.4 n/a
Anchorage ML&P - Plant 2 5/6 Natural Gas 49.2 n/aAnchorage ML&P - Plant 2 7 Natural Gas 81.8 2030Anchorage ML&P - Plant 2 7/6 Natural Gas 109.5 2030Anchorage ML&P - Plant 2 8 Natural Gas 87.6 2030Anchorage ML&P - Plant 2 6 n/a n/a 2030
* Denotes units not available for commercial operation
CEA operates 13 combustion turbines between three power plants (Bernice 2-4, Beluga 1-7, and International 1-3) which operate on natural gas and one steam turbine (Beluga 8) which derives its steam from HRSGs. CEA’s existing thermal units are shown below.
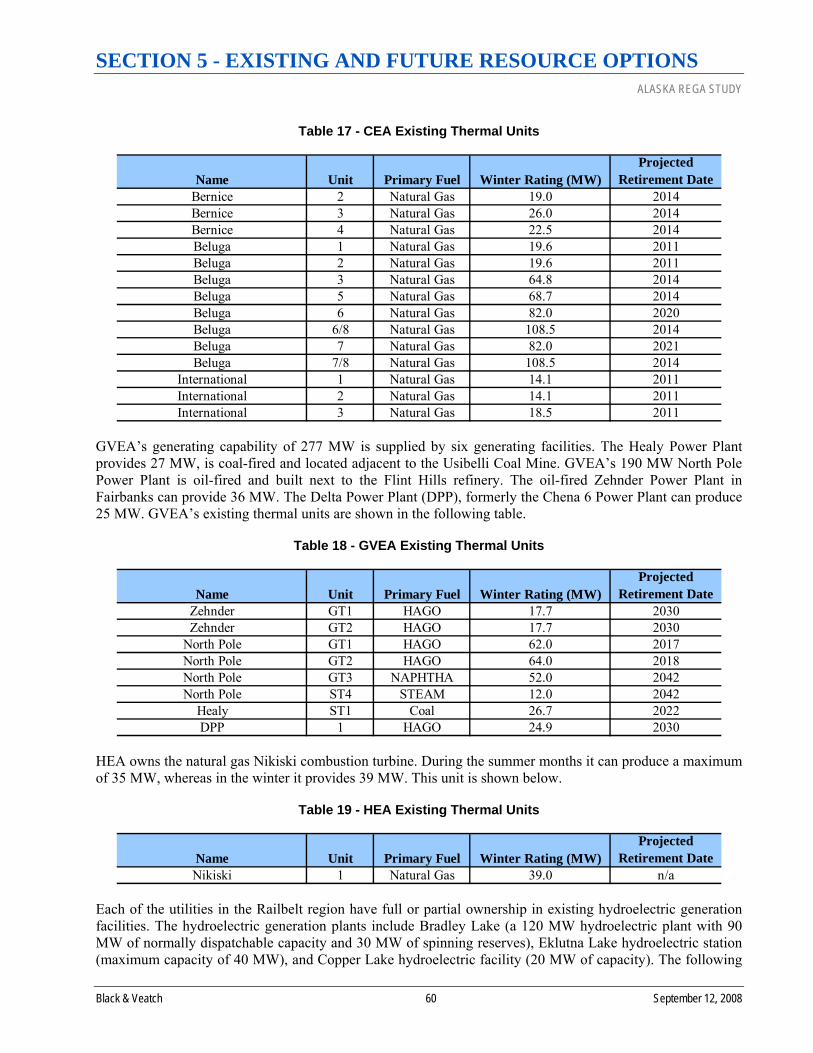
SECTION 5 - EXISTING AND FUTURE RESOURCE OPTIONS ALASKA REGA STUDY
Black & Veatch 60 September 12, 2008
Table 17 - CEA Existing Thermal Units
Name Unit Primary Fuel Winter Rating (MW)Projected
Retirement DateBernice 2 Natural Gas 19.0 2014Bernice 3 Natural Gas 26.0 2014Bernice 4 Natural Gas 22.5 2014Beluga 1 Natural Gas 19.6 2011Beluga 2 Natural Gas 19.6 2011Beluga 3 Natural Gas 64.8 2014Beluga 5 Natural Gas 68.7 2014Beluga 6 Natural Gas 82.0 2020Beluga 6/8 Natural Gas 108.5 2014Beluga 7 Natural Gas 82.0 2021Beluga 7/8 Natural Gas 108.5 2014
International 1 Natural Gas 14.1 2011International 2 Natural Gas 14.1 2011International 3 Natural Gas 18.5 2011
GVEA’s generating capability of 277 MW is supplied by six generating facilities. The Healy Power Plant provides 27 MW, is coal-fired and located adjacent to the Usibelli Coal Mine. GVEA’s 190 MW North Pole Power Plant is oil-fired and built next to the Flint Hills refinery. The oil-fired Zehnder Power Plant in Fairbanks can provide 36 MW. The Delta Power Plant (DPP), formerly the Chena 6 Power Plant can produce 25 MW. GVEA’s existing thermal units are shown in the following table.
Table 18 - GVEA Existing Thermal Units
Name Unit Primary Fuel Winter Rating (MW)Projected
Retirement DateZehnder GT1 HAGO 17.7 2030Zehnder GT2 HAGO 17.7 2030
North Pole GT1 HAGO 62.0 2017North Pole GT2 HAGO 64.0 2018North Pole GT3 NAPHTHA 52.0 2042North Pole ST4 STEAM 12.0 2042
Healy ST1 Coal 26.7 2022DPP 1 HAGO 24.9 2030
HEA owns the natural gas Nikiski combustion turbine. During the summer months it can produce a maximum of 35 MW, whereas in the winter it provides 39 MW. This unit is shown below.
Table 19 - HEA Existing Thermal Units
Name Unit Primary Fuel Winter Rating (MW)Projected
Retirement DateNikiski 1 Natural Gas 39.0 n/a
Each of the utilities in the Railbelt region have full or partial ownership in existing hydroelectric generation facilities. The hydroelectric generation plants include Bradley Lake (a 120 MW hydroelectric plant with 90 MW of normally dispatchable capacity and 30 MW of spinning reserves), Eklutna Lake hydroelectric station (maximum capacity of 40 MW), and Copper Lake hydroelectric facility (20 MW of capacity). The following

SECTION 5 - EXISTING AND FUTURE RESOURCE OPTIONS ALASKA REGA STUDY
Black & Veatch 61 September 12, 2008
table gives the percent ownership, annual energy, and capacity for each utility for each of the hydroelectric plants.
Table 20 - Railbelt Hydroelectric Generation Plants
Percent Allocation
Annual Energy (MWh) Capacity
Spinning Reserves
Percent Allocation
Annual Energy (MWh) Capacity
Percent Allocation
Annual Energy (MWh) Capacity
MEA 13.8 50,508 12.4 3.7 16.7 27,388 6.7 0.0 0 0.0HEA 12.0 41,139 10.8 3.2 0.0 0 0.0 0.0 0 0.0CEA 30.4 111,269 27.4 8.2 30.0 49,200 12.0 100.0 50,000 20.0GVEA 16.9 52,894 15.2 4.6 0.0 0 0.0 0.0 0 0.0ML&P 25.9 90,333 23.3 7.0 53.3 87,412 21.3 0.0 0 0.0SES 1.0 3,660 0.9 0.3 0.0 0 0.0 0.0 0 0.0Total 100.0 349,803 90.0 27.0 100.0 164,000 40.0 100.0 50,000 20.0
Utility
Bradley Lake Eklutna Lake Cooper Lake
The table below shows the resulting total capacity for each utility within the Railbelt region.
Table 21 - Railbelt Installed Capacity
MEA 0.0 12.4 6.7 0.0 19.1 HEA 39.0 10.8 0.0 0.0 49.8 CEA 504.0 27.4 12.0 20.0 563.4 GVEA 277.0 15.2 0.0 0.0 292.2 ML&P 278.0 23.3 21.3 0.0 322.6 SES 0.0 0.9 0.0 0.0 0.9 Total 1,098.0 90.0 40.0 20.0 1,248.0
UtilityThermal Existing
Capacity Total Bradley Lake
CapacityEklutna Lake
CapacityCooper Lake
Capacity
Existing DSM/Energy Efficiency Programs Savings from existing DSM/energy efficiency programs are included in the Railbelt utilities’ load forecasts. In general, the Railbelt utilities’ DSM/energy efficiency programs are educational in nature. Of the Railbelt utilities, GVEA has the most substantive set of DSM/energy efficiency programs with their Energy$ense suite of programs, consisting of the Builder$ense, Home$ense, and Business$ense programs.
The Builder$ense program is a rebate program that provides the following rebates to home builders. • Lighting:
♦ $25 rebate for interior hard-wired fluorescent lamp fixtures or compact fluorescent lamp fixtures. ♦ $5 rebate for screw-in fluorescent light bulbs used in hard-wired light fixtures, such as track lighting
or recessed fixtures. ♦ $30 rebate for combination photocell/motion detectors for exterior light fixtures. ♦ $75 rebate for high-pressure sodium (HPS) exterior light fixtures.
• Vehicle engine preheating plug-ins: ♦ $40 rebate for the installation of a timer to control an exterior vehicle plug-in outlet. ♦ $20 rebate for the installation of a switch to control an exterior vehicle plug-in outlet.
• Electric water heater: ♦ $20 rebate for R-11+ insulating blankets installed on an electric water heater. ♦ $75 rebate for the installation of timers that control electric water heater.

SECTION 5 - EXISTING AND FUTURE RESOURCE OPTIONS ALASKA REGA STUDY
Black & Veatch 62 September 12, 2008
“While the transmission system serving the
population centers of Anchorage / Mat-Su is
robust, the same cannot be said for communities closer
to the north and south terminuses of the system.”
Native Corporation
Representative
“While the resource potential for renewables is probably high in Alaska,
the small number of generation units/plants and
the current limitations of the Intertie (not a true grid)
render the economic dispatch of wind-sourced
power (in significant amounts) difficult if not
nearly impossible.”
Industry Consultant
The Home$ense program is an audit program that provides the following benefits. During a Home$ense audit, participants receive: • Education materials and best practices in energy efficiency and use. • Up to 12 compact fluorescent lamps installed to replace incandescent bulbs. • A refrigerator thermometer and coil cleaning brush. • An adjustable weather-proof vehicle plug-in timer, if applicable.
In addition, if the house has a 220-volt hard-wired electric water heater, participants may also receive: • An electric water heater insulating blanket. • Up to 10 lineal feet of pipe wrap. • Two faucet aerators. • One low-flow shower head.
The Business$ense program is a commercial lighting program that provides up to a $20,000 rebate per customer. Rebates can be applied to the cost of the products and their installation. Rebates will not be applied toward consultation or design fees. Customers must contribute two years of anticipated electric bill savings toward the project cost. Rebates can be up to $1,000/kW, or 50% of the project cost, not to exceed $20,000 per project.
While ML&P has not yet implemented any DSM programs, Grimason Associates recently conducted a study and provided a report to ML&P, entitled “Recommendations on Potential Energy Efficiency Incentives and Programs to be Offered by Municipal Light and Power.” This study identifies a wide range of DSM/energy efficiency programs and evaluates several strategies for the introduction of DSM/energy efficiency programs within ML&P’s service territory.
The other Railbelt Utilities’ existing DSM/energy efficiency programs consist primarily of audit programs and educational programs.
Existing Transmission Grid For the Railbelt transmission system, the Railbelt Utilities are separated into three main load centers: northern, central, and southern. Within each load center, capacity and energy are assumed to flow freely without transmission constraints.
GVEA’s service area makes up the northern load center and is connected with 138 kV lines that flow through Delta Junction, Fairbanks, and Healy.
The northern and the central load centers are interconnected via the Alaska Intertie, and the Healy-Fairbanks and Teeland-Douglas transmission lines. The Alaska Intertie is a 345 kV (operated at 138 kV), 170 mile transmission line that is owned by the AEA and runs between the Douglas and Healy substations. The Healy-Fairbanks transmission line is a 230 kV, 90-mile transmission line from the Healy to the Wilson substations which delivers power from the Alaska Intertie directly into the city of Fairbanks. Another 138 kV transmission line also runs from Healy to Nenana to Goldhill and delivers power to Fairbanks. The 138 kV, 20-mile Douglas-Teeland transmission line stretches between the Douglas and Teeland substations and connects the southern portion of the Alaska Intertie to the central load center.

SECTION 5 - EXISTING AND FUTURE RESOURCE OPTIONS ALASKA REGA STUDY
Black & Veatch 63 September 12, 2008
“The Intertie’s ability to offset natural gas
consumption for electrical generation could alleviate
the Anchorage Bowl’s current reserve depletion issues for many years to
come.”
Industry Consultant
“There is little or no talk about further improving
the existing Intertie’s capacity and reliability to permit increased power
deliveries from alternative proven fuel reserves such
as Healy coal and prospective natural gas
reserves. Increasing these capacities in both
directions can relieve the power cost escalation now occurring along the entire
Railbelt’s corridor.”
Industry Consultant
The transfer capability of the Alaska Intertie and Healy-Fairbanks transmission lines is assumed to be 75 MW and 140 MW, respectively.
The central load center consists of MEA’s, ML&P’s, and CEA’s service territories. MEA serves customers down the southern half of the intertie and south of the intertie through the towns of Wasilla and Palmer. ML&P serves the load of the residents of Anchorage. CEA serves some residents of Anchorage along with the area south of Anchorage and into the northern portion of the Kenai Peninsula.
The central and southern load centers are connected via a 135-mile, 115 kV transmission line which connects the Chugach system to that of the Kenai Peninsula. The transfer capability of the southern intertie is assumed to be 75 MW.
The southern load center consists of SES and HEA’s service territories. SES serves the customers of the city of Seward. The HEA service area includes the cities of Homer and Soldotna.
Figure 22 shows the Railbelt transmission lines and Figure 23 shows the region’s three load centers and the existing transfer capability.

SECTION 5 - EXISTING AND FUTURE RESOURCE OPTIONS ALASKA REGA STUDY
Black & Veatch 64 September 12, 2008
Figure 22 - Generation, Transmission, and Distribution Facilities

SECTION 5 - EXISTING AND FUTURE RESOURCE OPTIONS ALASKA REGA STUDY
Black & Veatch 65 September 12, 2008
Figure 23 - Existing Load Centers as Modeled

SECTION 5 - EXISTING AND FUTURE RESOURCE OPTIONS ALASKA REGA STUDY
Black & Veatch 66 September 12, 2008
Available Supply-Side and Demand-Side Resource Options The following graph provides a high-level summary of the various supply-side and demand-side resource options that are available for meeting the future electric needs of the Railbelt.
The Alaska Intertie
The Alaska Intertie is a 170-mile long, 345 KV transmission line between Willow and Healy that is owned by the AEA. The Intertie was built in the mid-1980s with State of Alaska appropriations totaling $124 million. There is no outstanding debt associated with this asset. The Intertie is one of a number of transmission segments that, when connected together, can move power throughout the network from Delta, through Fairbanks to Anchorage down to the southern most limit at Seldovia. This interconnected system of utilities, tied together with the Intertie is collectively termed the “Railbelt Electric Grid System.” The operation of the Intertie is governed by an agreement that was negotiated in 1985 between the predecessor of AEA, the Alaska Power Authority (APA), and four utility participants: ML&P, CEA, GVEA, and AEG&T Cooperative, Inc. All of the utility participants are connected to the Intertie and can move power on and off the Intertie. For example, GVEA uses the Intertie to purchase non-firm economy energy from ML&P and CEA. As another example, the Railbelt Electric Grid System is used to transfer power from the Bradley Lake Hydroelectric Plant, which is located east of Homer just below the glacier-fed Bradley Lake. Each of the Railbelt utilities has rights for a specified percentage of the power output from Bradley Lake. GVEA owns a portion of the capacity and energy available from Bradley Lake, and it transmits this power north to its service area over the AEA Intertie. Both functional operation of the transmission line, as well as arrangements for the collection of and expenditure of annual operations and maintenance funds, are a part of this agreement. The agreement also specifies a governance structure that consists of representatives from the participating utilities and AEA. The agreement specifies, through interconnection terms and conditions, how utilities are allowed access to the Intertie. Each utility is required to maintain a certain level of spinning reserve to preserve the reliability of electrical supply throughout the network. AEA is in the process of renegotiating this agreement with interested Railbelt Grid utilities.
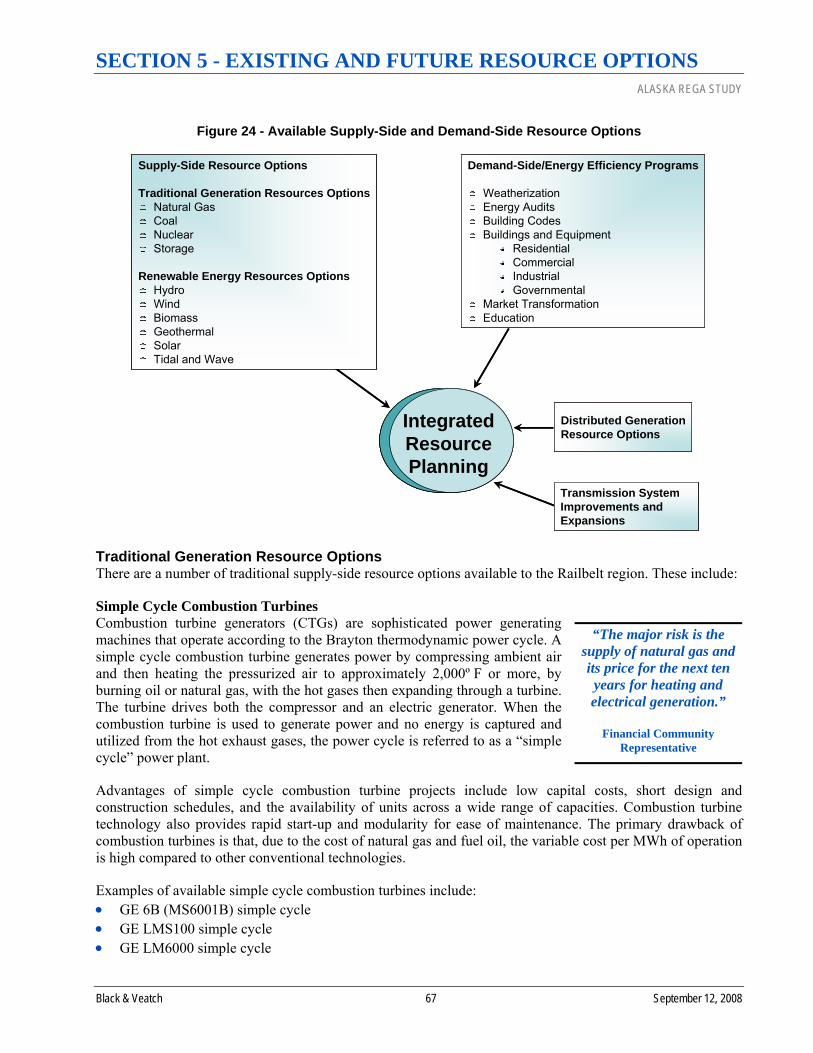
SECTION 5 - EXISTING AND FUTURE RESOURCE OPTIONS ALASKA REGA STUDY
Black & Veatch 67 September 12, 2008
“The major risk is the supply of natural gas and its price for the next ten years for heating and electrical generation.”
Financial Community
Representative
Figure 24 - Available Supply-Side and Demand-Side Resource Options
Supply-Side Resource Options
Traditional Generation Resources OptionsNatural GasCoalNuclearStorage
Renewable Energy Resources OptionsHydroWindBiomassGeothermalSolarTidal and Wave
Demand-Side/Energy Efficiency Programs
WeatherizationEnergy AuditsBuilding CodesBuildings and Equipment
ResidentialCommercialIndustrialGovernmental
Market TransformationEducation
Distributed GenerationResource Options
IntegratedResourcePlanning
Transmission SystemImprovements andExpansions
Supply-Side Resource Options
Traditional Generation Resources OptionsNatural GasCoalNuclearStorage
Renewable Energy Resources OptionsHydroWindBiomassGeothermalSolarTidal and Wave
Demand-Side/Energy Efficiency Programs
WeatherizationEnergy AuditsBuilding CodesBuildings and Equipment
ResidentialCommercialIndustrialGovernmental
Market TransformationEducation
Distributed GenerationResource Options
IntegratedResourcePlanning
IntegratedResourcePlanning
Transmission SystemImprovements andExpansions
Traditional Generation Resource Options There are a number of traditional supply-side resource options available to the Railbelt region. These include:
Simple Cycle Combustion Turbines Combustion turbine generators (CTGs) are sophisticated power generating machines that operate according to the Brayton thermodynamic power cycle. A simple cycle combustion turbine generates power by compressing ambient air and then heating the pressurized air to approximately 2,000º F or more, by burning oil or natural gas, with the hot gases then expanding through a turbine. The turbine drives both the compressor and an electric generator. When the combustion turbine is used to generate power and no energy is captured and utilized from the hot exhaust gases, the power cycle is referred to as a “simple cycle” power plant.
Advantages of simple cycle combustion turbine projects include low capital costs, short design and construction schedules, and the availability of units across a wide range of capacities. Combustion turbine technology also provides rapid start-up and modularity for ease of maintenance. The primary drawback of combustion turbines is that, due to the cost of natural gas and fuel oil, the variable cost per MWh of operation is high compared to other conventional technologies.
Examples of available simple cycle combustion turbines include: • GE 6B (MS6001B) simple cycle • GE LMS100 simple cycle • GE LM6000 simple cycle
SECTION 5 - EXISTING AND FUTURE RESOURCE OPTIONS ALASKA REGA STUDY
Black & Veatch 68 September 12, 2008
“Major risks include running out of natural gas
for generation, building new generation plants
before existing plants wear out, and the ability to
upgrade the transmission grid so that it is reliable.”
State Agency Representative
“The major future risk is over dependence on
natural gas. Natural gas is a great fuel but
overdependence on anything is extremely
risky. All risk is currently born by ratepayers. A diversified portfolio is
necessary to spread risk.”
Project Developer
“A major opportunity exists to pursue new clean coal technologies, to build
generation that uses stable fuel supplies and
much more efficient generation, while also
meeting future possible carbon tax issues.”
State Agency Representative
“In my opinion, a bullet line from the North Slope
is our greatest opportunity. It will
provide energy for both electric and home heating loads and offer economic activity for industrials and future large mine projects
such as Pebble.”
Utility Representative
“Coal makes sense, but hydro is better.”
Industry Consultant
Combined Cycle Combustion Turbines Combined cycle power plants use one or more CTGs and one or more steam turbine generators (STGs) to produce energy. Combined cycle power plants operate according to a combination of both the Brayton and Rankine thermodynamic power cycles. High power steam is produced when the hot exhaust gas from the CTG is passed through a HRSG. The high pressure steam is then expanded through a steam turbine, which spins an electric generator.
Combined cycle configurations have several advantages over simple cycle combustion turbines. Advantages include increased efficiency and potentially greater operating flexibility if duct burners are used. Disadvantages of combined cycles relative to simple cycles include a small reduction in plant reliability and an increase in the overall staffing and maintenance requirements because of added plant complexity.
The 1x1 combined cycle generating unit includes one CTG, one HRSG, and one STG. The 2x1 combined cycle generating unit includes two CTGs, two HRSGs, and one STG. The HRSG will convert waste heat from the combustion turbine exhaust to steam for use in driving the STG.
Examples of available combined cycle combustion turbines include: • 1x1 GE 6FA (MS6001FA) combined cycle • 2x1 GE 6FA (MS6001FA) combined cycle
Pulverized Coal Coal is the most widely used fuel for the production of power in the U.S., and most coal burning power plants use pulverized coal boilers. Pulverized coal units have the advantage of utilizing a proven technology with a very high reliability level. Pulverized coal units are relatively easy to operate and maintain. In a pulverized coal power plant, coal is ground to the texture of flour and blown into a boiler where it burns. A network of tubes circulates water through the boiler. The heat from the fireball caused by the burning coal makes steam. The super-heated steam is directed at the blades of the STG to make electricity.

SECTION 5 - EXISTING AND FUTURE RESOURCE OPTIONS ALASKA REGA STUDY
Black & Veatch 69 September 12, 2008
National Renewables Cooperative Organization
(NRCO)
“It was recently announced that a number of electric cooperatives
are joining together to form a National Renewables
Cooperative Organization to develop renewable energy
projects. This organization is viewed as an opportunity to pool the resources and efforts of the
cooperatives into a single national program. This program is in response to the fact that 26
states have already adopted renewable energy mandates and Congress is debating whether to
adopt a national renewable portfolio standard.
Generation and transmission cooperatives, unaffiliated
distribution cooperatives, and partial requirements cooperatives
that have the legal ability to participate in the wholesale
market are eligible for membership in the NRCO. The
structures and rules for the NRCO are still being developed.
Sunflower Electric Power Corporation, Tri-State
Generation & Association, Inc., and Basin Electric Power
Cooperative are among NRCO’s founding members.
“True energy security means distributed
generation systems based on geothermal and
renewable resources. In the near-term we should
utilize natural gas resources as a bridge to renewables, including
geothermal.”
Renewable Energy Advocate
“We believe the prospects for distributed generation
are excellent given Alaska’s Railbelt interconnected
load/distance ratios.”
Industry Consultant
“We all know the acceptability issues of coal
and nuclear as we see them in the media. Place the questions to the voters in the form of an initiative ballot if you really want to know the true opinion of Alaskans – you may be
surprised.”
Industry Consultant
Renewable Energy Resource Options There are a number of renewable resources that can be part of the Railbelt’s future resource mix. These resources include: • Hydroelectric • Wind • Biomass • Geothermal • Solar • Ocean (Tidal and Wave)
Each of the potential resources is discussed briefly below. These descriptions are based, in large part, on the AEA’s Renewable Energy Atlas of Alaska.
Hydroelectric Hydroelectric power is currently the State’s largest source of renewable energy, responsible for approximately 24 percent of the State’s electrical energy. In 2007, 27 hydro projects provided power to Alaska utility customers, ranging in size from the 105 kW Akutan hydro project in the Aleutians to the 126 MW State-owned Bradley Lake project near Homer.
Many of the State’s developed hydro resources are located near communities in South central, the Alaska Peninsula, and Southeast.
Hydro projects include those that involve storage, both with and without dam construction, and smaller “run-of-river” projects.
A number of potential hydro projects exist within or near the Railbelt region, including the Susitna and Chakachamna projects.
Wind Alaska has abundant wind resources suitable for power development. Much of the best wind sites are located in the western and coastal portions of the State. The wind in these regions tends to be associated with strong high and low pressure systems and related storm tracks.
SECTION 5 - EXISTING AND FUTURE RESOURCE OPTIONS ALASKA REGA STUDY
Black & Veatch 70 September 12, 2008
“In my mind the development of renewables is probably the only way we are going to be
able to stabilize our electrical rates. Hydroelectric
development has the potential to provide all or almost all of
our electrical needs if someone would ever have the
foresight to develop it.”
Financial Community Representative
“Renewables offer the best opportunity. A mix of
renewables and natural gas generation will serve the
ratepayers best over time.”
Project Developer
“New technologies and the potential for energy
efficiency, renewables, and pricing are emerging
constantly, but Alaska seems stuck in the 1960s with ideas far outdated. RCA action and
a push from the Governor would help.”
State Agency Representative
Wind power technologies being used or planned in Alaska range from small wind chargers at off-grid homes or remote camps, to medium-sized machines displacing diesel fuel in isolated village wind-diesel hybrid systems, to large turbines greater than 1 MW. On the Railbelt, several of the utilities are examining wind power projects, including the proposed Fire Island and Eva Creek projects.
Biomass Alaska’s primary biomass fuels are wood, sawmill wastes, fish byproducts, and municipal waste. For example, wood is currently used for space heating throughout the State. Recent increases in oil and natural gas prices have increased the interest in using sawdust and wood wastes as fuel for lumber drying, space heating and small-scale power production.
Eielson Air Force Base densifies paper separated from the local waste stream and then co-fires the resulting cubes at the base’s coal-fired power plant, providing up to 1.5 percent of the base’s heat and power.
Energy recovery from Anchorage landfill gas is viable, according to a report prepared in 2005 for the Municipality of Anchorage. According to this study, this gas could be used to heat nearby military or school facilities or be converted to 2.5 MW of electrical power.
Geothermal Alaska has four distinct geothermal resource regions: 1) the Interior hot springs, 2) the Southeast hot springs, 3) the Wrangell Mountains, and 4) the Ring of Fire volcanoes. The Interior and Southeast hot springs are low- to moderate-temperature geothermal systems with surface expression as hot springs. The Wrangell Mountains consists of several active volcanoes that may have geothermal energy development potential. The Ring of Fire hosts high-temperature hydrothermal systems.
Three large-scale geothermal electric power generation projects have been proposed in Alaska: 1) the Mt. Makushin project to provide power to the City of Unalaska, 2) the Akutan project to provide power to the City of Akutan, and 3) the Mt. Spurr project to provide power to the Railbelt region.
In the Interior, the Chena Hot Springs Resort is an example of the diverse use of geothermal energy. The resort has installed the first geothermal power plant in Alaska, including two 200 kW organic Rankine cycle generators. In addition to the electric power plant, the Chena Resort uses its geothermal resources for outdoor baths, district heating, swimming pool heating, refrigeration, and to provide heat and carbon dioxide to its greenhouses.
Solar Alaska’s northern location presents the challenge of minimal solar energy during the long winter when energy demand is greatest; notwithstanding this, solar energy is used for space heating (i.e., passive solar design) and off-grid power generation. “Active solar” heating systems use pumps or fans to move energy to a point of use, such as a domestic hot water tank. The State’s largest utility-connected photovoltaic power system is in the remote community of Lime Village, which can generate up to 12 kW.
Significant utility-scale solar generation is unlikely in Alaska due to high capital costs and low yearly solar power output.

SECTION 5 - EXISTING AND FUTURE RESOURCE OPTIONS ALASKA REGA STUDY
Black & Veatch 71 September 12, 2008
“The increased viability and growth of wind generation
world-wide is well documented. What is lacking
now is a strong standard bearer that can get beyond
the view that, for many years in this State, has pegged anyone wanting to save
energy or promote renewables as a “greeny” without seeing the bottom-
line benefits.”
Renewable Energy Advocate “Natural gas should be used as the bridging fuel as we
develop systems based upon geothermal and renewable
resources.”
Renewable Energy Advocate
“With big picture planning, renewable energy could fuel the grid, with long-term rates
held in place, drawing big enterprises, like Google or
Microsoft, who want flat-rate green power long into the
future.”
State Agency Representative
“Alaska has a wealth of hydroelectric alternatives within the State but the
Governor and the Legislature have not been able to look at the long-term (i.e., they see only a four-year term as a Governor and two to three
years as a Legislator). Until they get rid of their short-
term mentality, the hydroelectric potential that
the State has will continue to go undeveloped.”
Financial Community
Representative
“Alaska has a vast potential for dispatchable renewable
energy projects. The transition to renewable
energy technologies will help buffer the Railbelt from
increasing fossil fuel costs.”
Source: Consumer Advocate
“Small-scale hydro, wind, and solar generators could allow Alaska residents to harness viable renewable resources with advancing and increasingly cheaper
technologies, without incurring fuel costs.”
Source: Renewable Energy
Advocate
“Conservation is job one and the cheapest alternative.”
Renewable Energy Advocate
Ocean (Tidal and Wave) Alaska has 34,000 miles of coastline, more than all other states combined. As a result, there is interest in harvesting energy from the ocean. Ocean energy falls into three general categories: 1) ocean thermal energy conversion (OTEC), 2) tidal energy, and 3) wave energy.
OTEC applications are limited to tropical areas and are not suitable for development in Alaska. That leaves tidal and wave energy, although the technologies for exploiting these potential resources are not yet commercially available.
Tidal energy is a concentrated form of the gravitational energy exerted by the moon and, to a lesser extent, the sun. This energy can be converted into electricity by using dams that force water through turbines at high and low tidal stages, or by underwater turbines that are turned by tidal flow.
In 2006, the Electric Power Research Institute (EPRI), in partnership with the AEA, CEA, and ML&P, completed a tidal energy study at Cairn Point on Knik Arm. The study showed that an estimated 17 MW of power could be generated using tidal energy. Since the report, FERC has issued eight preliminary tidal energy permits to energy developers for Alaska projects.
Wave energy is the result of wind acting on the ocean surface. Alaska has one of the best wave resources in the world; the total wave power flux on southern Alaska’s coast alone is estimated at 1,250 TWh, or almost 300 times the amount of electricity that Alaskans use every year. As with other renewable energy sources in Alaska, a challenge to using wave energy is the lack of energy demand near the resource.

SECTION 5 - EXISTING AND FUTURE RESOURCE OPTIONS ALASKA REGA STUDY
Black & Veatch 72 September 12, 2008
“There are some economic benefits to DSM. However
these are small. It is unlikely that DSM would make a substantial deferral of generation investment
possible.”
Project Developer
“Demand-side management will be the fastest route to cost and energy savings;
Statewide, energy conservation and energy
efficiencies measures should be aggressively pursued.”
Consumer Advocate
“Energy efficiency has never been considered for use
along the Railbelt, and is largely underutilized. Much could be done in that area.”
State Agency Representative
“The current rate structures seem to hinder efficiency and conservation measures and
reward higher volume.”
Renewable Energy Advocate
“There are major opportunities for load
reduction through education campaigns, incentives to use non-peak power, providing energy efficient light bulbs,
etc.”
Consumer Advocate
Demand-Side Management/Energy Efficiency Resource Options There are numerous potential DSM/energy efficiency measures and programs that can assist customers reduce their annual energy consumption and peak demands. Some of these measures and programs include:
On-Site Energy Audit Programs Energy audit programs provide customers the opportunity to gain an understanding of why they consumed their billed energy. The customer receives advice on ways to conserve and reduce their bills, and may also be advised on the feasibility of installing more insulation or more energy efficient appliances.
On-Line Energy Audits On-line energy audits have become a popular DSM/energy efficiency solution, and can be easily accessed from the utility’s web site. These are “do-it-yourself” types of energy audits, using an evaluation framework developed by the utility.
Load Management Programs Load management programs are intended for customers who have electric water heaters, central air conditioning units, and central heating units. The programs allow the utility to interrupt non-critical electric services for certain specified amounts of time during peak utility system demand hours.
Energy Saving Tips Advice on energy conservation is made available from utility staff and or literature provided by the utility. For example, in addition to distributing traditional pamphlets, bill inserts and web site information, the utility works with local schools to promote conservation among students. Additional programs include: monthly newsletters, energy conservation calendars, energy tips brochures, and local radio advertisements.
Appliance and Other Rebates Rebates can be made available to residential and small commercial customers to upgrade to more efficient heating, ventilation, and air conditioning (HVAC) equipment. Additionally, rebates can also be offered to provide an incentive for customers to install residential attic insulation to prevent heat and cooling loss. Possible other rebate programs include customer rebates for: duct leak repair, annual HVAC maintenance, and light-emitting diode (LED) exit signs in buildings.
Load Profiling for Commercial Customers Recording meters can be provided to allow commercial customers to monitor their electrical consumption. Commercial customers can also request monthly reports from the utility of their consumption profile.
Retrofit Programs Qualifying customers and homes can apply for assistance in having their home remodeled with additional insulation and weatherization. An energy audit is usually necessary to determine if the requested home is qualified for such assistance. If the audit results in qualifying the home, a grant can be
SECTION 5 - EXISTING AND FUTURE RESOURCE OPTIONS ALASKA REGA STUDY
Black & Veatch 73 September 12, 2008
“Demand-side management and energy efficiency programs are vastly
underutilized in the Railbelt, especially by utilities.”
State Agency Representative
provided to the homeowner through the utility or some other program, such as the program offered by the Alaska Housing Finance Corporation.
Compact Fluorescent Bulbs (CFLs) CFLs can be provided by the utility free of charge, or at a discounted rate to its customers. In most cases the CFLs use nearly 75% less electricity than an incandescent bulb, helping to effectively reduce the energy demand due to lighting.
ENERGY STAR® Program The ENERGY STAR® program, which is backed by the U.S. Environmental Protection Agency and Department of Energy, provides strategies and tools to help utilities promote different energy-saving campaigns. Utilities participate in the ENERGY STAR® program by including links on their web sites, posters and displays in their lobbies, as well as providing other promotional materials to their customers on ENERGY STAR® programs, appliances, conservation tools, and other features.
SECTION 6 - ORGANIZATIONAL ISSUES ALASKA REGA STUDY
Black & Veatch 74 September 12, 2008
“Splitting off generation and transmission from
distribution makes a lot of sense. Some way to stop the feuds between the utilities
and get at least the generation side working
together is required.”
State Agency Representative
SECTION 6 - ORGANIZATIONAL ISSUES This section provides an overview of the various organizational issues that are related to the formation of a new regional entity, including scope of responsibilities, tax and legal issues, regulatory oversight issues, required legislative actions, and various other factors.
Experience with Other Business Models The formation of regional entities to focus on generation and transmission issues is a common practice throughout the country. Typically, the legal structure of the entities falls into one of the following four business models: • State/Federal Power Authorities • Joint Action Agencies • G&T Cooperatives • RTOs/ISOs
Within the not-for-profit segment of the industry, the G&T Cooperative and JAA business models are the most common. State Power Authorities exist in a limited number of states. RTOs/ISOs are typically “super regional” organizations as they cover large regions (e.g., Texas or multiple states) in the lower-48 states, and IOUs, G&T Cooperatives, JAAs, and State Power Authorities operate within the regions under their direction.
In Appendix B, we provide descriptions of a number of State and Federal Power Authorities, G&T Cooperatives, JAAs, and other types of regional G&T organizations that currently exist within the U.S. Many other examples exist but this summary provides a representative overview of these types of organizations.
Notwithstanding the experience that has been gained elsewhere with the formation of regional G&T entities, there are a number of organizational issues that need to be addressed if the Railbelt region is to successfully create such an entity. Specific categories of these organizational issues are identified in the following graphic.
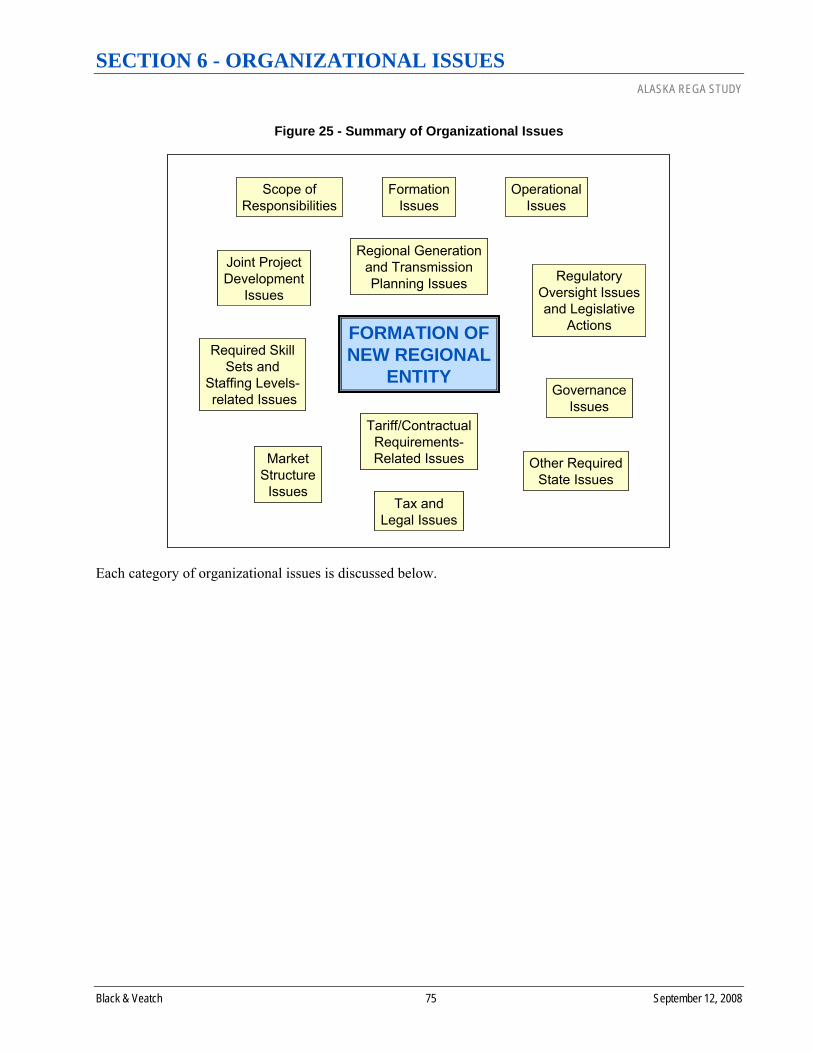
SECTION 6 - ORGANIZATIONAL ISSUES ALASKA REGA STUDY
Black & Veatch 75 September 12, 2008
Figure 25 - Summary of Organizational Issues
Scope ofResponsibilities
FORMATION OFNEW REGIONAL
ENTITY
FormationIssues
OperationalIssues
Regional Generationand TransmissionPlanning Issues
Joint ProjectDevelopment
Issues
Required SkillSets and
Staffing Levels-related Issues
Tax andLegal Issues
RegulatoryOversight Issuesand Legislative
Actions
Other RequiredState Issues
MarketStructure
Issues
Tariff/ContractualRequirements-Related Issues
GovernanceIssues
Each category of organizational issues is discussed below.

SECTION 6 - ORGANIZATIONAL ISSUES ALASKA REGA STUDY
Black & Veatch 76 September 12, 2008
Definitions Coordinated Grid Operations – relates to the coordinated operations of the transmission grid to ensure the reliability of electric service throughout the region. Economic Dispatch – involves the operation of generation facilities to produce energy at the lowest cost to reliably serve consumers, recognizing any operational limits of generation and transmission facilities. Regional Integrated Resource Planning - a planning process for electric utilities that evaluates many different generation and transmission supply-side and demand-side options for meeting future electricity demands and selects the optimal mix of resources that minimizes the cost of electricity supply while meeting reliability needs and other objectives. Joint Project Development – involves the coordinated development of future generation and transmission projects by multiple parties for the joint benefit of all participants.
“An entity that would take on power supply for all utilities
would have the greatest benefit. They could
undertake the planning and joint project development, as
well as undertake the dispatch function.”
Utility Representative
* * *
“Our system is way too small for there to be three or more dispatch centers, planning
processes, etc. If it were within one organization, I
believe they would be able to reduce their costs overall and
hopefully meet all of the needs of the Railbelt.”
Financial Community
Representative
* * * “The formation and
implementation of a single entity (e.g., a G & T
cooperative or as the AEA) would allow for a single voice to be heard by Legislators in
Juneau on major projects that needed equity capital to
get them off the ground. Additionally, our
Congressional delegation has repeated asked for a single voice to be developed by the
Railbelt utilities so that a single priority list could be
worked on.”
Financial Community Representative
“The central issues with all forms of collectivization are the allocation of costs and governance. It is easy enough to
dispatch jointly for minimum cost, but how do you decide who pays what, particularly if the allocation of costs or payments is
a function of the dispatch?”
Utility Representative
Scope of Responsibilities The first important issue that must be addressed is to determine the specific scope of responsibilities for the new entity. Based on the Organizational Paths for the new regional entity that were chosen for evaluation, the most narrowly-defined scope of responsibilities would be the independent and coordinated operation of the grid (Coordinated Grid Operations). The next increment in scope of responsibility is conducting regional economic dispatch (Economic Dispatch). Finally, the last increments to be added to the scope of responsibility for a new regional entity is to provide regional integrated resource planning (Regional Integrated Resource Planning) and, finally, joint project development (Joint Project Development). This hierarchy of responsibilities is reflected in how the Organizational Paths evaluated in this study were constructed.
The following table further defines the operational scope for each of the four increments identified above.

SECTION 6 - ORGANIZATIONAL ISSUES ALASKA REGA STUDY
Black & Veatch 77 September 12, 2008
Formation Issues There are several issues specific to the start-up formation of a new regional entity. These issues include:
Issue Description Legal Structure Should the new entity be a JAA, G&T Cooperative or State Agency/Corporation?
Location Should the new regional entity be located in Anchorage, Fairbanks, or elsewhere?
Transfer of Existing Assets and Fuel Supply Contracts
Determine whether the ownership, or just some level of dispatch control, of existing assets should be transferred to the new entity.
Whether to Adopt a “Hold Harmless” Requirement
Should a rule be adopted whereby the formation of the new entity cannot harm any groups of existing customers? Adopting such a rule is common when these types of regional entities are formed. To meet this criteria, it is often necessary to develop a mechanism to fairly allocate the benefits of the type of entity to all customers within a region; this allocation methodology is usually put in place for some defined period of time.
Transition Period Related to the issue above is the question of how long the transition period should be until the final cost/benefit allocation methodology is enacted?
Operational Issues Operational issues that need to be addressed include the following:
Issue Description O&M Responsibility Who will have responsibility for the ongoing operation and maintenance of the
Railbelt region’s generation and transmission assets and where will the line be drawn between transmission and local distribution facilities, the new regional entity or the existing six Railbelt utilities, or a combination?
Consolidation of Control Centers
The Railbelt region currently has three control centers, which are operated by GVEA, ML&P and CEA. If a regional entity is formed, is there a continued need to have three control centers or can they be consolidated into two centers (i.e., one primary and one back-up center)?
Required SCADA/Telecommunications Investments
To fully enable regional economic dispatch, certain investments in SCADA and telecommunications equipment will be required.
Determination of Transmission Voltage Level and Treatment of Large Customers Currently Served at Transmission Voltage Levels
Should a regional entity be formed, it will be important to make a determination as to which voltages will be considered transmission and which voltages are distribution. Additionally, it will be necessary to determine how to handle large customers which are currently served at transmission voltage levels.
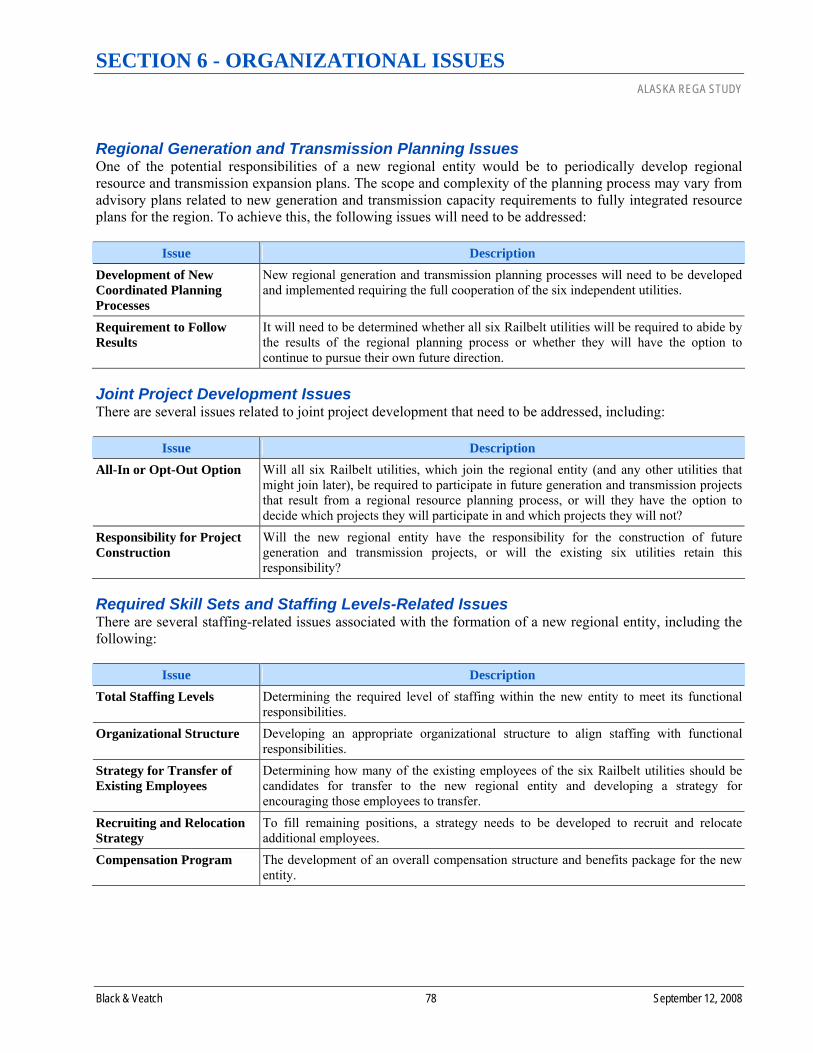
SECTION 6 - ORGANIZATIONAL ISSUES ALASKA REGA STUDY
Black & Veatch 78 September 12, 2008
Regional Generation and Transmission Planning Issues One of the potential responsibilities of a new regional entity would be to periodically develop regional resource and transmission expansion plans. The scope and complexity of the planning process may vary from advisory plans related to new generation and transmission capacity requirements to fully integrated resource plans for the region. To achieve this, the following issues will need to be addressed:
Issue Description Development of New Coordinated Planning Processes
New regional generation and transmission planning processes will need to be developed and implemented requiring the full cooperation of the six independent utilities.
Requirement to Follow Results
It will need to be determined whether all six Railbelt utilities will be required to abide by the results of the regional planning process or whether they will have the option to continue to pursue their own future direction.
Joint Project Development Issues There are several issues related to joint project development that need to be addressed, including:
Issue Description All-In or Opt-Out Option Will all six Railbelt utilities, which join the regional entity (and any other utilities that
might join later), be required to participate in future generation and transmission projects that result from a regional resource planning process, or will they have the option to decide which projects they will participate in and which projects they will not?
Responsibility for Project Construction
Will the new regional entity have the responsibility for the construction of future generation and transmission projects, or will the existing six utilities retain this responsibility?
Required Skill Sets and Staffing Levels-Related Issues There are several staffing-related issues associated with the formation of a new regional entity, including the following:
Issue Description Total Staffing Levels Determining the required level of staffing within the new entity to meet its functional
responsibilities. Organizational Structure Developing an appropriate organizational structure to align staffing with functional
responsibilities.
Strategy for Transfer of Existing Employees
Determining how many of the existing employees of the six Railbelt utilities should be candidates for transfer to the new regional entity and developing a strategy for encouraging those employees to transfer.
Recruiting and Relocation Strategy
To fill remaining positions, a strategy needs to be developed to recruit and relocate additional employees.
Compensation Program The development of an overall compensation structure and benefits package for the new entity.

SECTION 6 - ORGANIZATIONAL ISSUES ALASKA REGA STUDY
Black & Veatch 79 September 12, 2008
Tax and Legal Issues Certain tax and legal issues need to be addressed related to the formation of a new regional entity. These issues include:
Issue Description Ability to Issue Tax-Exempt Debt
This is a very important issue given the magnitude of generation and transmission investments that need to be made within the Railbelt region over the next 30 years. There are two categories of tax-exempt bonds: government obligations and private activity bonds. Both categories contain their own restrictions regarding how the bond proceeds can be used by the issuing entity. The fact that the Railbelt utilities include four cooperatives complicates this issue. This is discussed further immediately following this table.
Transfer of Ownership of Existing Assets
Legal restrictions exist related to the transfer of the ownership of existing assets to a new entity. For example, in the cases of Chugach and GVEA related to the sale, lease or other disposition of more than 15 percent of its total assets, its bylaws require an affirmative vote of members constituting not less than two-thirds of the members voting, where the number of members voting also constitutes a majority of all members of the Chugach Association; the only exception to this requirement is that if the disposition of assets is to another cooperative or the State of Alaska, such disposition must be approved by a majority of the members voting in an election in which at least 10% of the members vote.
Transfer of the City of Anchorage’s Ownership of Gas Reserves in the Cook Inlet
The City of Anchorage’s ownership in Cook Inlet gas reserves was financed using tax-exempt bonds. As a result, the use of this gas is limited to the generation of electricity in ML&P-owned generation facilities.
Governance As a practical matter, for the new entity to rely on tax-exempt debt to finance a large percentage of future infrastructure investments, it will need to be formed as a public entity. This has implications related to governance because the required structure for the Board of Directors for a public entity is different than how Boards are typically established for JAAs or G&T Cooperatives.
As noted in the table above, there are a number of issues related with tax-exempt financing, which are summarized below; a more detailed discussion of each of these issues is provided in Appendix G.
There are differences between government obligations that are not private activity bonds (government obligations) and government obligations that are private activity bonds (private activity bonds). Tax-exempt bond financing can be done with both government obligations and private activity bonds. The following summarizes the differences between the two types of bonds: • Government Obligations
♦ Generally, government obligation bonds must be issued by either a state or municipal government. ♦ The advantages of government obligations that are not private activity bonds are: 1) they are
presumed to be tax-exempt unless the government issuer does something to cause them to be taxable, and 2) they are not subject to the alternative minimum tax.
♦ The ability of a regional public entity to issue tax-exempt debt and sell power to electric cooperatives or other private entities, or purchase their assets is generally limited by tax law; electric cooperatives generally don’t have a way of directly participating in the benefits of a regional public entity’s tax-exemption.
♦ A government obligation bond becomes a private activity bond if: • More than 5% of the proceeds of the bonds are used to provide a facility that is used in the trade
or business of a person that is not a governmental entity (the “private use test”), and

SECTION 6 - ORGANIZATIONAL ISSUES ALASKA REGA STUDY
Black & Veatch 80 September 12, 2008
• More than 5% of the money that will be used to pay the bonds is derived from a private business source (the “private security test”).
♦ Management contracts (e.g., a contract between the issuer and a private utility under which the private utility agrees to provide certain services to the issuer) can also cause a government obligation to become a private activity bond.
• Private Activity Bonds ♦ Private activity bonds are taxable unless there is a specific Internal Revenue Code provision that
permits it to be tax-exempt. In the case of an electric output facility, for a private activity bond to be tax-exempt: • The facility can be used to provide electricity to no more than two contiguous counties (boroughs
in Alaska) or one county and one contiguous city (the “two county rule”), and. • The user of the facility must have provided electric service in the area that the facility will serve
since at least January 1, 1997 or be a successor to such an entity (the “sunset rule”). ♦ The alternative minimum tax applies to private activity bonds, but not government obligation bonds.
This makes the tax exemption less valuable because the alternative minimum tax applies a tax to these bonds for certain investors even though the bonds are otherwise tax-exempt. In this sense, private activity bonds are not exactly taxable and not exactly tax-exempt.
♦ Private activity bonds are subject to each state’s annual private activity bond cap (for Alaska, approximately $262 million). This restriction does not apply to government obligation bonds.
• Provisions Applicable to All Tax-Exempt Bonds In addition to the above, there are a number of provisions that the Internal Revenue Code imposes on all tax-exempt bonds, whether government obligations or private activity bonds. ♦ No tax-exempt bonds may be federally guaranteed. ♦ Tax-exempt bonds can be used to reimburse expenditures that were incurred before the issuance of
the bonds only if the expenditures to be reimbursed occurred not more than 60 days before the issuer adopts an “official intent.” The “official intent” can be made in any reasonable form, but usually the Board of Directors of the issuer adopts a resolution for this purpose.
♦ Tax-exempt bonds are subject to arbitrage and arbitrage rebate provisions of the Internal Revenue Code and regulations.
What is the significance of turning a government obligation into a private activity bond? Most importantly, while a government obligation is tax-exempt unless the issuer does something that causes the bond to become taxable, a private activity bond is taxable unless there is a specific Internal Revenue Code provision that permits it to be tax-exempt. The Internal Revenue Code does permit private activity bonds that are used to finance electric output facilities to be tax-exempt, but only if certain conditions are satisfied. Specific strategies for addressing these issues are discussed in Section 9.

SECTION 6 - ORGANIZATIONAL ISSUES ALASKA REGA STUDY
Black & Veatch 81 September 12, 2008
Regulatory Oversight Issues and Legislative Actions The following issues relate to the regulatory oversight of the new regional entity, as well as legislative actions that need to be taken to facilitate the formation of a new entity:
Issue Description Regional Integrated Resource Plans
Will the RCA have the authority to review and approve the regional integrated resource plans that are developed by the regional entity?
Joint Project Development Will the RCA have the authority to review and approve specific generation and transmission projects that are developed by the new regional entity, including the determination of need, the approval of the costs to be recovered from customers, and overall siting authority?
Fuel Contracts Will the RCA have the authority to review and approve the fuel supply contracts that are entered into by the regional entity?
Cost/Benefit Allocation Methodology
Will the RCA have the authority to review and approve the methodology used by the regional entity to allocate the costs and benefits of regionalization to each of the six existing utilities?
Transmission Tariff Will the new regional entity develop a transmission tariff to define the terms, conditions, and rates for transmission service and will the RCA have the authority to review and approve this tariff?
Annual Reporting Requirements
What annual reporting requirements should be established to enable the RCA and other parties to monitor the performance of the regional entity?
Other Required State Actions Other State actions required to facilitate the achievement of the benefits of regionalization include:
Issue Description State Energy Plan and Related Policies
The Governor has directed that a State Energy Plan be developed. Her administration is also addressing other related issues such as climate change. A new regional entity will play an important role in the implementation of the policies resulting from these initiatives.
Market Structure Issues The following market structure issues need to be addressed in the formation of a new regional generation and transmission entity:
Issue Description Required Changes to Market Structure
Should any changes to the existing Railbelt market structure be implemented to enable IPPs to participate in the market?
Adoption of a Competitive Power Procurement Process
Should the regional entity be required to develop and implement a competitive power procurement process whereby utility- and IPP-proposed projects are evaluated on a consistent basis?
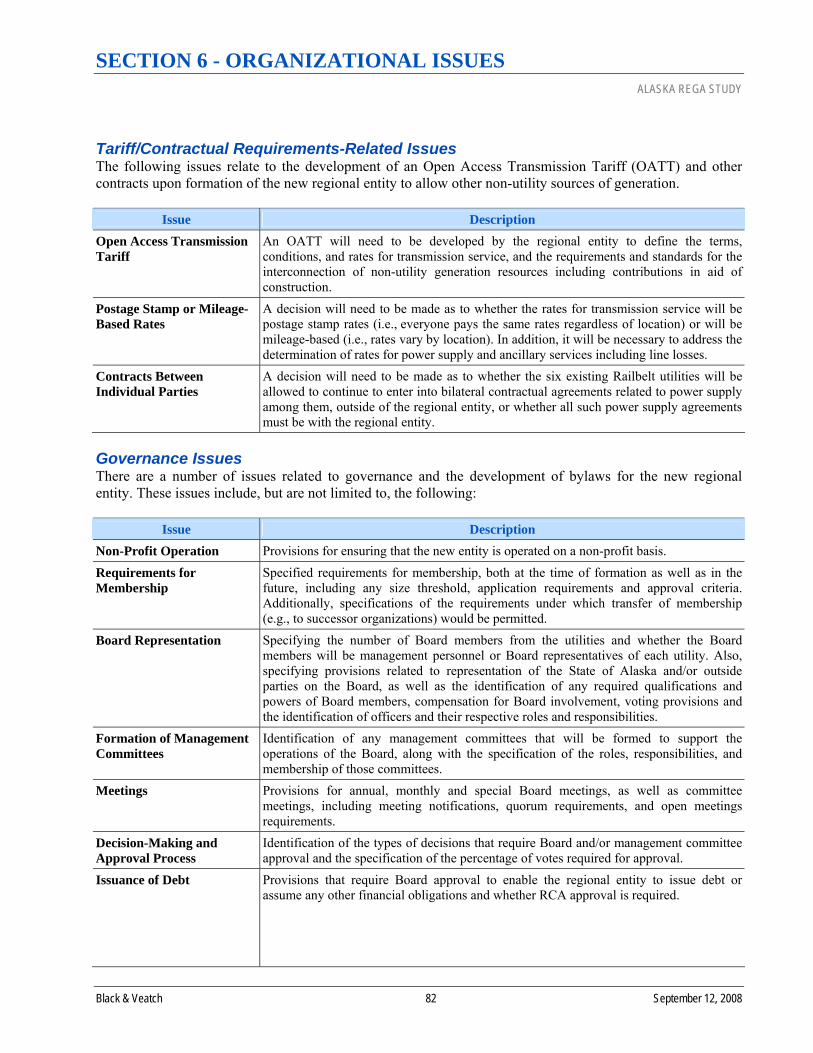
SECTION 6 - ORGANIZATIONAL ISSUES ALASKA REGA STUDY
Black & Veatch 82 September 12, 2008
Tariff/Contractual Requirements-Related Issues The following issues relate to the development of an Open Access Transmission Tariff (OATT) and other contracts upon formation of the new regional entity to allow other non-utility sources of generation.
Issue Description Open Access Transmission Tariff
An OATT will need to be developed by the regional entity to define the terms, conditions, and rates for transmission service, and the requirements and standards for the interconnection of non-utility generation resources including contributions in aid of construction.
Postage Stamp or Mileage-Based Rates
A decision will need to be made as to whether the rates for transmission service will be postage stamp rates (i.e., everyone pays the same rates regardless of location) or will be mileage-based (i.e., rates vary by location). In addition, it will be necessary to address the determination of rates for power supply and ancillary services including line losses.
Contracts Between Individual Parties
A decision will need to be made as to whether the six existing Railbelt utilities will be allowed to continue to enter into bilateral contractual agreements related to power supply among them, outside of the regional entity, or whether all such power supply agreements must be with the regional entity.
Governance Issues There are a number of issues related to governance and the development of bylaws for the new regional entity. These issues include, but are not limited to, the following:
Issue Description Non-Profit Operation Provisions for ensuring that the new entity is operated on a non-profit basis.
Requirements for Membership
Specified requirements for membership, both at the time of formation as well as in the future, including any size threshold, application requirements and approval criteria. Additionally, specifications of the requirements under which transfer of membership (e.g., to successor organizations) would be permitted.
Board Representation Specifying the number of Board members from the utilities and whether the Board members will be management personnel or Board representatives of each utility. Also, specifying provisions related to representation of the State of Alaska and/or outside parties on the Board, as well as the identification of any required qualifications and powers of Board members, compensation for Board involvement, voting provisions and the identification of officers and their respective roles and responsibilities.
Formation of Management Committees
Identification of any management committees that will be formed to support the operations of the Board, along with the specification of the roles, responsibilities, and membership of those committees.
Meetings Provisions for annual, monthly and special Board meetings, as well as committee meetings, including meeting notifications, quorum requirements, and open meetings requirements.
Decision-Making and Approval Process
Identification of the types of decisions that require Board and/or management committee approval and the specification of the percentage of votes required for approval.
Issuance of Debt Provisions that require Board approval to enable the regional entity to issue debt or assume any other financial obligations and whether RCA approval is required.

SECTION 6 - ORGANIZATIONAL ISSUES ALASKA REGA STUDY
Black & Veatch 83 September 12, 2008
Issue Description Purchase of Power, Adherence to Results of Economic Dispatch, Regional Planning Process and Joint Project Development
Specification of the responsibilities of the utilities with regard to purchasing power from the regional entity, and abiding by the decisions of the regional entity with regard to economic dispatch, regional resource planning and joint project development.
Termination of Membership
Specifying the conditions under which a utility can terminate their participation in the regional entity, including required notice provisions and related approval process.
Merger, Consolidation or Dissolution of Regional Entity
Specifying the conditions under which the regional entity can be merged, consolidated or dissolved including any restrictions regarding the period of time before such action can be taken. Also, specification of how the assets, property, debts and other liabilities of the regional entity will be dissolved if such action is taken.
Indemnification of Directors, Management Personnel, Employees, and Agents
Providing, under certain circumstances, for indemnification of present and former Directors, management personnel, employees and agents for their acts or omissions during the course of their official responsibilities.
Contracting Provisions under which the regional entity can enter into contractual arrangements and the required approval process for such contracts.
Rules, Regulations and Rate Schedules
Provisions for the development of rules, regulations and rate schedules, related to the management, administration and regulation of the business and affairs of the regional entity.

SECTION 7 - SUMMARY OF ASSUMPTIONS ALASKA REGA STUDY
Black & Veatch 84 September 12, 2008
SECTION 7 - SUMMARY OF ASSUMPTIONS In this section, we provide an overview of the input assumptions that underlie our detailed analysis of the various Organizational Paths and Evaluation Scenarios. These assumptions relate to existing generation and transmission assets, future generation and transmission resources, as well as organizational formation and ongoing operations.
Existing System Data Our detailed evaluation of power costs was conducted over a forward looking 30-year evaluation period between 2008 through 2037 (since the new regional entity would not begin operations until 2009, we adjusted these 2008-2037 power cost values to 2009-2038 to make the time horizon consistent to the estimated organizational costs). Accordingly the Railbelt utilities needed to provide this information for the same period for their systems. The evaluations of each Organizational Path and Evaluation Scenario were conducted in nominal dollars with the annual costs discounted to 2009 dollars for comparison using various discount rates, which were selected to represent the range of discount rates that could be considered reasonable for the Railbelt utilities. The specific discount rates used were 6.0 percent, 8.0 percent, 10.0 percent, and 15.0 percent, with 6.0 percent used as the base case. For evaluation purposes, a general inflation and escalation rate of 3.0 percent has been assumed.
Fixed charge rates were developed for new capital additions based on the cost of capital for each utility for new generating unit additions. A joint fixed charge rate was used based for the joint commitment, dispatch, and planning path. The joint fixed charge rate was based on the assumption of being able to obtain taxable and tax-exempt financing, and further assumed 100 percent debt. The assumed cost of capital and fixed charge rates are presented in the following table. In developing the cost of capital assumptions, financial advisors were consulted and a general consensus developed for purposes of estimating the cost of capital for evaluation purposes. MEA, HEA, and CEA were assumed to use National Rural Utilities Cooperative Finance Corporation (CFC) financing with an interest rate of 6.75 percent. GVEA was assumed to use RUS financing with an interest rate of 5.0 percent. ML&P was assumed to use tax-exempt municipal bond financing with an interest rate of 5.0 percent. The tax-exempt joint paths were assumed to have an interest rate of 5.0 percent and the taxable joint paths were assumed to have an interest rate of 6.75 percent. Fixed charge rates were developed only considering principle and interest for financing terms of 20, 25, and 30 years based on the expected financing lifetimes of the various alternatives.
Table 22 - Cost of Capital and Fixed Charge Rates
Fixed Charge Rate (%) Financing Terms (Years)
Utility Cost of Capital (%) 20 25 30 MEA 6.75 9.26 8.39 7.86 HEA 6.75 9.26 8.39 7.86 CEA 6.75 9.26 8.39 7.86 GVEA 5.00 8.02 7.10 6.51 ML&P 5.00 8.02 7.10 6.51 Joint Tax-Exempt 5.00 8.02 7.10 6.51 Joint Taxable 6.75 9.26 8.39 7.86
A load forecast was developed for each utility through the end of the study period based on the load forecasts provided by the utilities. The load forecast includes consideration of existing DSM and conservation programs, but does not include future plans for additional DSM and conservation. The table below presents the load forecast for each utility from 2008 through 2037.

SECTION 7 - SUMMARY OF ASSUMPTIONS ALASKA REGA STUDY
Black & Veatch 85 September 12, 2008
Table 23 - Railbelt Load Forecast for Evaluation (2008 – 2037)
ML&P CEA GVEA HEA MEA SES2008 158 477 230 81 141 102010 168 489 237 78 149 102015 172 272 218 80 172 112020 177 285 226 80 186 122025 180 296 234 81 201 122030 185 307 243 82 216 132035 189 319 252 83 231 142037 191 324 256 84 237 14
YearUtility Peak Demand (MW)
For consistency purposes, a single reference fuel price forecast was developed and used for all of the utilities in this analysis. The fuel price forecast reflects the general inflation rate of 3.0 percent and fuel prices are on a $/MMBtu basis. Henry Hub spot natural gas prices were taken from the EIA 2008 Annual Energy Outlook (AEO) projections and used as a starting point to forecast the price of natural gas. Natural gas is assumed to be available from the North Slope in 2020. Natural gas from the North Slope is assumed to be at a $2.00/MMBtu discount to Henry Hub, but transportation costs to the central and southern portions of the Railbelt will offset that discount. ML&P owns gas in the Beluga River Unit (BRU) gas fields. Projected prices and volumes for BRU gas were provided by ML&P. Coal price forecasts were developed by escalating the given price per ton annually at two-thirds (66 percent) the general inflation rate (2.0 percent). Average crude wellhead prices for the lower 48 states were taken from the EIA’s 2008 Annual Energy Outlook and used as a starting point for developing heavy atmospheric gas oil (HAGO) and naphtha fuel price forecasts. Distillate fuel oil prices were based on the EIA’s 2008 AEO distillate fuel oil price forecast. These fuel cost projections are shown in the following table.
Table 24 - Fuel Price Reference Forecast ($/MBtu)
Year
Henry Hub Natural
Gas Coal HAGO Naphtha Distillate Fuel Oil
2008 7.67 2.59 17.33 18.75 18.41 2009 8.03 2.67 17.91 19.40 15.57 2010 7.77 2.75 17.65 19.00 15.33 2011 7.61 2.83 17.49 18.73 14.98 2012 7.61 2.92 17.06 18.13 14.56 2013 7.58 3.01 16.60 17.49 14.17 2014 7.58 3.10 16.26 17.00 14.26 2015 7.65 3.19 15.85 16.41 13.93 2016 7.82 3.29 15.46 15.85 13.79 2017 8.16 3.38 15.87 16.25 14.22 2018 8.51 3.49 16.04 16.36 14.85 2019 8.89 3.59 16.60 16.96 15.53 2020 9.00 3.70 17.04 17.40 16.18

SECTION 7 - SUMMARY OF ASSUMPTIONS ALASKA REGA STUDY
Black & Veatch 86 September 12, 2008
Year
Henry Hub Natural
Gas Coal HAGO Naphtha Distillate Fuel Oil
2021 9.06 3.81 17.69 18.08 16.83 2022 9.55 3.92 18.38 18.82 17.54 2023 10.05 4.04 19.14 19.63 18.41 2024 10.64 4.16 19.82 20.35 19.38 2025 11.21 4.29 20.72 21.35 20.33 2026 11.84 4.42 21.72 22.44 21.41 2027 12.29 4.55 22.70 23.52 22.40 2028 13.15 4.69 23.83 24.77 23.47 2029 13.93 4.83 24.79 25.81 24.68 2030 14.68 4.97 25.69 26.78 25.83 2031 15.48 5.12 26.80 27.99 27.07 2032 16.34 5.27 27.95 29.25 28.37 2033 17.24 5.43 29.15 30.58 29.73 2034 18.18 5.59 30.41 31.96 31.15 2035 19.18 5.76 31.72 33.40 32.65 2036 20.24 5.94 33.09 34.92 34.21 2037 21.35 6.11 34.52 36.50 35.85
ML&P has an ownership interest in the BRU natural gas fields and, as a result, has natural gas available at below market prices. These prices and the volume of gas available are confidential and, as such, are not presented in this report. Production from the Beluga River natural gas field is projected to decrease over time. Likewise, that information is also confidential and not presented in this report. For evaluation purposes, the confidential price projections and annual volumes available are modeled in the production costing runs. For purposes of economy transactions, ML&P has limited the use of BRU gas for economy sales to 1 BCF per year.
Spinning reserve requirements for the Railbelt utilities are based on the largest unit on line. ML&P, CEA, GVEA, and HEA share that spinning reserve requirement in relation to their largest units on line. The current allocation of spinning reserves is presented in the following table. Spinning reserve requirements were adjusted when larger units were added for the scenarios. Non-spinning operating reserves are half of the spinning reserves.
Table 25 - Railbelt Spinning Reserve Requirements
Utility Largest Unit Capacity
(MW) Percentage of Largest Unit
Spinning Reserve Requirement (MW)
ML&P Plant 2, Units 7-6 109.6 34.3 37.5 CEA Beluga 7/8 108.6 34.0 37.2
GVEA North Pole 2 62.6 19.6 21.4 HEA Nikiski 39.0 12.2 13.4 Total 319.5 100.1 109.5
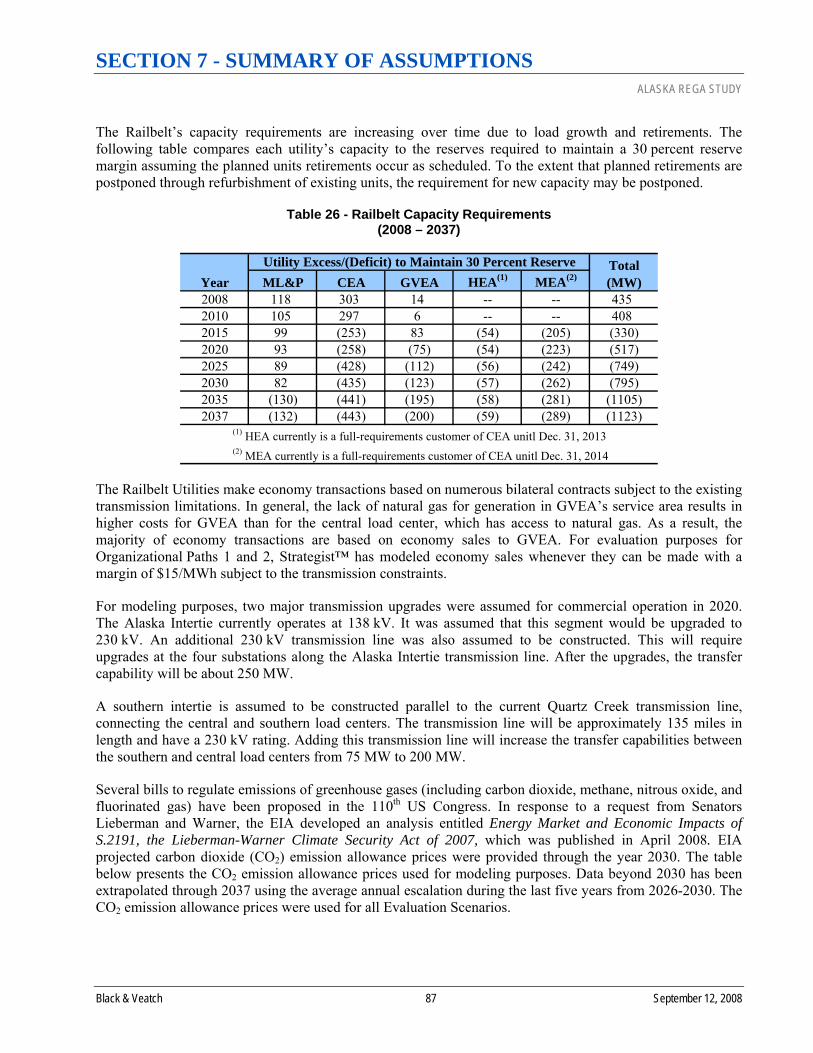
SECTION 7 - SUMMARY OF ASSUMPTIONS ALASKA REGA STUDY
Black & Veatch 87 September 12, 2008
The Railbelt’s capacity requirements are increasing over time due to load growth and retirements. The following table compares each utility’s capacity to the reserves required to maintain a 30 percent reserve margin assuming the planned units retirements occur as scheduled. To the extent that planned retirements are postponed through refurbishment of existing units, the requirement for new capacity may be postponed.
Table 26 - Railbelt Capacity Requirements (2008 – 2037)
ML&P CEA GVEA HEA(1) MEA(2)
2008 118 303 14 -- -- 4352010 105 297 6 -- -- 4082015 99 (253) 83 (54) (205) (330)2020 93 (258) (75) (54) (223) (517)2025 89 (428) (112) (56) (242) (749)2030 82 (435) (123) (57) (262) (795)2035 (130) (441) (195) (58) (281) (1105)2037 (132) (443) (200) (59) (289) (1123)
(1) HEA currently is a full-requirements customer of CEA unitl Dec. 31, 2013 (2) MEA currently is a full-requirements customer of CEA unitl Dec. 31, 2014
YearUtility Excess/(Deficit) to Maintain 30 Percent Reserve Total
(MW)
The Railbelt Utilities make economy transactions based on numerous bilateral contracts subject to the existing transmission limitations. In general, the lack of natural gas for generation in GVEA’s service area results in higher costs for GVEA than for the central load center, which has access to natural gas. As a result, the majority of economy transactions are based on economy sales to GVEA. For evaluation purposes for Organizational Paths 1 and 2, Strategist™ has modeled economy sales whenever they can be made with a margin of $15/MWh subject to the transmission constraints.
For modeling purposes, two major transmission upgrades were assumed for commercial operation in 2020. The Alaska Intertie currently operates at 138 kV. It was assumed that this segment would be upgraded to 230 kV. An additional 230 kV transmission line was also assumed to be constructed. This will require upgrades at the four substations along the Alaska Intertie transmission line. After the upgrades, the transfer capability will be about 250 MW.
A southern intertie is assumed to be constructed parallel to the current Quartz Creek transmission line, connecting the central and southern load centers. The transmission line will be approximately 135 miles in length and have a 230 kV rating. Adding this transmission line will increase the transfer capabilities between the southern and central load centers from 75 MW to 200 MW.
Several bills to regulate emissions of greenhouse gases (including carbon dioxide, methane, nitrous oxide, and fluorinated gas) have been proposed in the 110th US Congress. In response to a request from Senators Lieberman and Warner, the EIA developed an analysis entitled Energy Market and Economic Impacts of S.2191, the Lieberman-Warner Climate Security Act of 2007, which was published in April 2008. EIA projected carbon dioxide (CO2) emission allowance prices were provided through the year 2030. The table below presents the CO2 emission allowance prices used for modeling purposes. Data beyond 2030 has been extrapolated through 2037 using the average annual escalation during the last five years from 2026-2030. The CO2 emission allowance prices were used for all Evaluation Scenarios.

SECTION 7 - SUMMARY OF ASSUMPTIONS ALASKA REGA STUDY
Black & Veatch 88 September 12, 2008
Table 27 - Carbon Dioxide Emission Allowance Price Forecast
Year $/ton2008 -2010 -2015 27.442020 43.472025 69.152030 110.332035 141.692037 175.33
Supply-Side Alternatives Considered This section characterizes the supply-side technologies that were considered for capacity resource additions. These alternatives include conventional, emerging, and renewable technologies. Estimated performance characteristics, emissions profiles, capital and operating costs, and availability are presented.
Cost and performance estimates have been estimated for several conventional thermal generation technologies that are proven, commercially available, and widely used in the power industry. The conventional technologies considered include simple cycle combustion turbines, combined cycle configurations, and sub-critical pulverized coal units. Additionally, cost and performance estimates were estimated for the GE LMS100 simple cycle combustion turbine, which may be considered an emerging technology.
The cost and performance estimates for conventional and emerging alternatives were developed by Black & Veatch based on a combination of estimates developed specifically for clients in Alaska, and estimates for projects in other regions of the U.S. that were adjusted for costs and conditions in Alaska. Capital costs were adjusted to 2008 dollars based on recent Black & Veatch estimates and actual project costs for equipment, materials, and labor reflecting the recent increases in costs for power plants. Performance estimates were based on specific projects in Alaska or other projects and adjusted for ambient conditions in Alaska.
Renewable energy technologies are diverse; as previously discussed, they include wind, solar, biomass, biogas, geothermal, hydroelectric, and ocean energy. The field is rapidly expanding from occupying niche markets to making meaningful contributions to the world’s electricity supply. This trend is driven by two major factors ─ subsidies and mandates.
For the purpose of this study, wind and hydroelectric are the only two renewable technologies assumed for future generation resource additions. These two resource options were included in both Evaluation Scenarios 1 and 4. Estimates for costs and performance parameters were based on Black & Veatch project experience, vendor inquiries, and a literature review; the generic cost estimates for renewable technologies developed by Black & Veatch included consideration of specific projects in Alaska, where available, and numerous other projects with costs adjusted for Alaska. Capital costs are in 2008 dollars and reflect the total project cost, including direct and indirect costs.
The following table shows the unit characteristics assumed for the conventional and emerging technologies; it should be noted that the options shown in the following table are representative but not exhaustive. Resource additions in Evaluation Scenario 2 were based on the natural gas alternatives shown below; additionally, they were used as “filler” resources in Evaluation Scenarios 1, 3, and 4 to match total generation to peak demands after other resource options were included. Coal was the primary resource addition in Evaluation Scenario 3.

SECTION 7 - SUMMARY OF ASSUMPTIONS ALASKA REGA STUDY
Black & Veatch 89 September 12, 2008
Table 28 - Conventional and Emerging Technology Unit Characteristics (All Costs in 2008 Dollars)
Name
Net Output (MW)
Total Cost ($millions)
Primary Fuel
Forced Outage
Rate (%)
Full Load Net Heat
rate (Btu/kWh)
HHV
Annual Scheduled
Maintenance (Days/Yr)
CO2 Emission
Rate (lb/MMbtu)
GE 6B Simple Cycle
42.1 52.8 Natural Gas 2.0% 12,270 10 115
GE LMS100 Simple Cycle
98.8 123.4 Natural Gas 2.0% 8,260 10 115
GE LM6000 Simple Cycle
43.0 74.0 Natural Gas 2.0% 9,020 10 115
1x1 GE 6FA Combined Cycle
116.0 253.8 Natural Gas 3.0% 7,300 14 115
2x1 GE 6FA Combined Cycle
235.0 402.5 Natural Gas 4.0% 7,160 17 115
Sub-critical Pulverized Coal
100.0 462.4 Coal 5.0% 10,140 21 211
For the purpose of this study, wind generation project were assumed to be installed in 50 MW blocks. The wind generation was apportioned to each of the Railbelt Utilities in proportion to their 2007 peak demands. The estimated total installed cost for the wind generation was $2,500/kW in 2008 dollars. The estimated annual capacity factor was 35 percent. The estimated fixed O&M costs were $18.00/kW-year in 2008 dollars. Ten (10) percent of the net capacity of the wind generation was assumed to contribute to the planning reserve margins. Transmission losses to deliver the wind generation to the transmission system are assumed to be 3.0 percent.
For the purpose of this study, large hydroelectric generation projects were assumed to be installed in 300 MW blocks. Each hydroelectric project was assumed to have four hydroelectric turbines, each with 75 MW capacity. The hydroelectric generation was apportioned to each of the Railbelt Utilities in proportion to their 2007 peak demands. The estimate total installed cost for the hydroelectric projects was $5,600/kW in 2008 dollars. The estimated fixed O&M and variable O&M costs were $7.50/kW-year and $6.00/MWh, respectively in 2008 dollars. Transmission losses to deliver the hydroelectric generation to the transmission system were assumed to be 3.0 percent.
Demand-Side and Energy Efficiency Alternatives Considered DSM and energy efficiency alternatives were assumed to cost $120/MWh. DSM/energy efficiency programs are assumed to commence at the rate of 0.5 percent of net electric load (NEL) each year beginning in 2015 and continue until 5.0 percent of NEL for load is met by DSM/energy efficiency programs.
The cost and level of DSM/energy efficiency programs were estimated by Black & Veatch based on a review of specific plans and studies for the Railbelt utilities, as well as DSM/energy efficiency program experience in the lower-48 states. The cost and level of DSM/energy efficiency programs reflect the actual situation facing the Railbelt utilities. One of the more significant factors included is the relatively low use per customer for the Railbelt utilities compared to utilities in the lower-48 states.

SECTION 7 - SUMMARY OF ASSUMPTIONS ALASKA REGA STUDY
Black & Veatch 90 September 12, 2008
Organizational Formation and Ongoing Operations Costs In this subsection, we summarize the assumptions used to estimate the start-up costs associated with the formation of a new regional entity, as well as the ongoing annual A&G costs.
Start-up Formation Costs As the first step is developing an estimate of the start-up costs, we developed a detailed implementation plan for each alternative Organizational Path. Each of these implementation plans included a detailed listing of tasks in each of the following categories: • Program management/governance • Business structure • New facility • Business policies, processes, and procedures • Transition planning • HR and recruiting • Operations and economic dispatch transition • Generation and transmission planning transition • IT infrastructure • Business systems • Employee training • Transition and cutover • Other
For each category identified above, we: • Estimated the total number of days required to complete • Estimated the breakdown of effort between utility personnel (management and staff) and outside
contractors (including consulting and legal assistance) • Estimated the total level of effort (days) for each category of utility personnel and contractors • Estimated and applied a daily cost for each category of utility personnel and outside contractors • Calculated the total start-up labor cost using the above factors
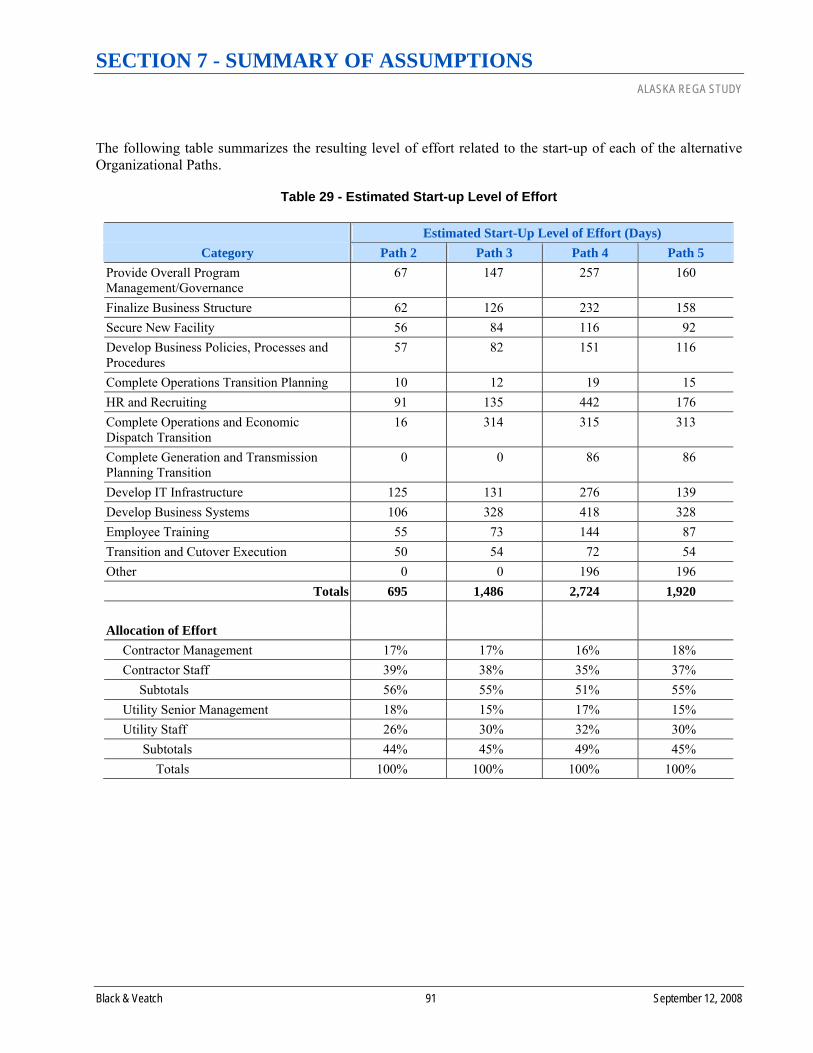
SECTION 7 - SUMMARY OF ASSUMPTIONS ALASKA REGA STUDY
Black & Veatch 91 September 12, 2008
The following table summarizes the resulting level of effort related to the start-up of each of the alternative Organizational Paths.
Table 29 - Estimated Start-up Level of Effort
Estimated Start-Up Level of Effort (Days) Category Path 2 Path 3 Path 4 Path 5
Provide Overall Program Management/Governance
67 147 257 160
Finalize Business Structure 62 126 232 158 Secure New Facility 56 84 116 92 Develop Business Policies, Processes and Procedures
57 82 151 116
Complete Operations Transition Planning 10 12 19 15 HR and Recruiting 91 135 442 176 Complete Operations and Economic Dispatch Transition
16 314 315 313
Complete Generation and Transmission Planning Transition
0 0 86 86
Develop IT Infrastructure 125 131 276 139 Develop Business Systems 106 328 418 328 Employee Training 55 73 144 87 Transition and Cutover Execution 50 54 72 54 Other 0 0 196 196
Totals 695 1,486 2,724 1,920 Allocation of Effort Contractor Management 17% 17% 16% 18% Contractor Staff 39% 38% 35% 37% Subtotals 56% 55% 51% 55% Utility Senior Management 18% 15% 17% 15% Utility Staff 26% 30% 32% 30% Subtotals 44% 45% 49% 45% Totals 100% 100% 100% 100%

SECTION 7 - SUMMARY OF ASSUMPTIONS ALASKA REGA STUDY
Black & Veatch 92 September 12, 2008
The following table summarizes the resulting labor costs related to the start-up of each of the alternative Organizational Paths.
Table 30 - Estimated Start-up Costs – Labor Estimated Start-Up Labor Cost ($’000)
Category Path 2 Path 3 Path 4 Path 5 Provide Overall Program Management/Governance
$68 $168 $294 $199
Finalize Business Structure 96 193 353 243 Secure New Facility 80 121 167 133 Develop Business Policies, Processes and Procedures
78 113 207 159
Complete Operations Transition Planning 13 15 23 18 HR and Recruiting 57 82 252 104 Complete Operations and Economic Dispatch Transition
12 310 310 310
Complete Generation and Transmission Planning Transition
0 0 96 96
Develop IT Infrastructure 189 199 405 211 Develop Business Systems 166 511 652 511 Employee Training 67 88 176 105 Transition and Cutover Execution 76 82 110 82 Other 0 0 285 285
Subtotals $902 $1,882 $3,331 $2,457 Out-of-Pocket Expenses (15%) 135 282 500 369 Contingency (25%) 259 541 958 706
Totals $1,296 $2,705 $4,788 $3,532
These implementation plans are discussed in greater detail in Section 10.
In addition to labor costs, there are a number of non-labor costs that will be incurred during the start-up of a new regional entity. Therefore, the next step in the process was to develop cost estimates for each Organizational Path related to the following: • Control center system enhancements • Economic dispatch and resource planning software • Transmission planning software • Enterprise back-office systems • Office equipment (e.g., furniture and printers) • Servers and network infrastructure • Telecommunications • Desktop hardware and software

SECTION 7 - SUMMARY OF ASSUMPTIONS ALASKA REGA STUDY
Black & Veatch 93 September 12, 2008
The following table summarizes the resulting non-labor start-up costs for each alternative Organizational Path.
Table 31 - Estimated Start-up Costs – Non-Labor Estimated Start-Up Non-Labor Cost ($’000)
Category Path 2 Path 3 Path 4 Path 5 Software Capital Investment Control Center $0 $500 $500 $500 Economic Dispatch/Resource Planning 0 34 34 34 Transmission Planning 0 0 154 99 Enterprise Back-Office 100 200 200 200
Subtotals $100 $734 $888 $832 Other Office Equipment 127 183 591 246 Servers 72 88 92 89 Network Infrastructure 27 35 62 41 Telecommunications 54 54 54 54 Desktop PCs 43 65 211 86
Subtotals $324 $425 $1,010 $515
Totals $424 $1,159 $1,898 $1,348
Annual A&G Costs The first step in developing estimates of the 30-year annual A&G costs for each Organizational Path was to develop a prototype organizational chart. We then developed an estimate of the required number of positions in each of the following areas for each Organizational Path: • General Manager’s office • Finance and administration • Legal and corporate affairs • Information technology • Power supply • Power delivery
We then estimated salary levels for each position and developed estimates of the number of transferred employees for each Organizational Path.
The following graphic shows the general organizational chart that would apply to each Organizational Path. Also shown is the total number of positions for each Path.

SECTION 7 - SUMMARY OF ASSUMPTIONS ALASKA REGA STUDY
Black & Veatch 94 September 12, 2008
Figure 26 - Organizational Chart
Board of Directors
General Manager
Executive Secretary
Finance and Administration Legal and Corporate Affairs Information Technology Power Supply Power Delivery
Vice President and Chief Financial Officer Vice President, Legal and Corporate Affairs Vice President, Information Technology Vice President, Power Supply Vice President, Power DeliveryExecutive Secretary Executive Secretary Executive Secretary Executive Secretary Executive Secretary
Financial Operations Legal Affairs Network and Personal Computers Generation Planning Transmission and Substation Planning
Financial Planning Human Resources Business and Financial Applications Fuel Management Transmission and Substation Engineering and Construction
Procurement and Facilities Safety Telecommunications Plant Engineering and Construction Transmission and Substation Operations
Environemntal Services IT Systems Training Plant Operations Outage Management
Communications System Protection
Rate and Regulatory Energy Control Center
Total Positions External Affairs Energy Management Systems and Applications
Path 2 - 17.5Path 3 - 26.0 Corporate Real EstatePath 4 - 85.0Path 5 - 34.5
The following graphic summarizes the total number of positions in each functional area for each Organizational Path.
Figure 27 - Number of Positions by Department
Board of DirectorsP2 P3 P4 P5
General Manager 1.0 1.0 1.0 1.0P2 P3 P4 P5
Executive Secretary 0.5 0.5 1.0 0.5
Finance and Administration Legal and Corporate Affairs Information Technology Power Supply Power DeliveryP2 P3 P4 P5 P2 P3 P4 P5 P2 P3 P4 P5 P2 P3 P4 P5 P2 P3 P4 P53.0 3.5 14.0 4.5 1.0 2.5 18.0 2.5 1.5 3.5 13.5 3.5 0.0 0.0 10.5 3.5 10.5 15.0 27.0 19.0
Total PositionsPath 2 17.5Path 3 26.0Path 4 85.0Path 5 34.5
Next, we developed annual estimates for each Organizational Path related to the following: • Five-year amortization of start-up labor and non-labor costs • Total salaries and benefits • Software licensing and maintenance costs • Hardware maintenance and replacement • Other non-labor costs (e.g., rent, office supplies, insurance and outside services)
The resulting annual A&G costs are summarized in Section 8.

SECTION 8 - SUMMARY OF RESULTS ALASKA REGA STUDY
Black & Veatch 95 September 12, 2008
SECTION 8 - SUMMARY OF RESULTS This section provides a summary of the results of our detailed economic analysis, including generation and transmission costs, organizational costs, and net benefits.
As previously discussed, we evaluated each of the five alternative organizational structures shown in the following graphic.
Figure 28 - Summary of Organizational Paths Evaluated
Status QuoPath 1
Form an Entity That Would be Responsible for Independent Operation of the GridPath 2
Form an Entity That Would be Responsible for Independent Operation of the Grid and Regional Economic DispatchPath 3
Form an Entity That Would be Responsible for Independent Operation of the Grid, Regional Economic Dispatch, Regional Resource Planning and Joint Project Development
Path 4
Form a Power PoolPath 5
Status QuoPath 1 Status QuoPath 1
Form an Entity That Would be Responsible for Independent Operation of the GridPath 2 Form an Entity That Would be Responsible for Independent Operation of the GridPath 2
Form an Entity That Would be Responsible for Independent Operation of the Grid and Regional Economic DispatchPath 3 Form an Entity That Would be Responsible for Independent Operation of the Grid and Regional Economic DispatchPath 3
Form an Entity That Would be Responsible for Independent Operation of the Grid, Regional Economic Dispatch, Regional Resource Planning and Joint Project Development
Path 4Form an Entity That Would be Responsible for Independent Operation of the Grid, Regional Economic Dispatch, Regional Resource Planning and Joint Project Development
Path 4
Form a Power PoolPath 5
These five alternative Organizational Path structures were evaluated under each of the following four Evaluation Scenarios.

SECTION 8 - SUMMARY OF RESULTS ALASKA REGA STUDY
Black & Veatch 96 September 12, 2008
Note to the Readers of This Report
It is important to
understand that the focus of this study is on the
evaluation of alternative organizational structures for the reconfiguration of
the generation and transmission functions of the Railbelt utilities. In
completing this analysis, Black & Veatch evaluated alternative energy futures
and developed prescriptive resource plans for each
energy future considered. These prescriptive
resource plans were developed to assist in the evaluation of alternative
organizational paths. These prescriptive
resource plans are not alternative integrated
resource plans; as such, readers should not
compare the prescriptive resource plans to each
other nor should they draw any conclusions from this
analysis as to what the optimal resource mix for the Railbelt over the next 30 years might include.
Figure 29 - Summary of Scenarios Evaluated
Scenario ALarge Hydro /
Renewables / DSM / Energy Efficiency
Scenario
Scenario BNatural Gas
Scenario
Scenario CCoal
Scenario
Scenario DMixed Resource
Portfolio Scenario
Scenario ALarge Hydro /
Renewables / DSM / Energy Efficiency
Scenario
Scenario ALarge Hydro /
Renewables / DSM / Energy Efficiency
Scenario
Scenario BNatural Gas
Scenario
Scenario BNatural Gas
Scenario
Scenario CCoal
Scenario
Scenario CCoal
Scenario
Scenario DMixed Resource
Portfolio Scenario
Scenario DMixed Resource
Portfolio Scenario
Power Cost Results In this subsection, we summarize the economic results of our analysis of power costs under each of the alternative Organizational Paths for each of the Evaluation Scenarios. This analysis was based upon the following: • The power cost model, Strategist™, which is described in Section 2. • The cost and performance characteristics of the region’s existing
generation and transmission assets, as described in Section 5. • The cost and performance characteristics of various resources that could
be added to the region’s resource portfolio, as described in Section 6.
Under the base case, we assumed that the new regional entity would be able to issue tax-exempt debt under each Organizational Path and Evaluation Scenario. As a sensitivity case, we also evaluated Organizational Path 4, for each Evaluation Scenario, under the assumption that the new regional entity would be required to issue taxable municipal bonds to finance the region’s future generation and transmission assets.
The following table summarizes the average annual present worth savings in power costs, including both generation and transmission costs, for each Organizational Path and Evaluation Scenario. To calculate the average annual present worth figures shown in the tables in this Section, we discounted the 30-year stream of costs to a present worth value in 2009 using a discount rate of 6.0 percent. We then divided this value by 30 to calculate the average annual present worth value.

SECTION 8 - SUMMARY OF RESULTS ALASKA REGA STUDY
Black & Veatch 97 September 12, 2008
Table 32 - Average Annual Power Cost Savings ($’000)
Path 2 Path 3 Path 4 Path 5
Tax-Exempt Debt Scenario A -- $10,688 $49,228 $49,228 Scenario B -- $9,658 $19,341 $19,341 Scenario C -- $13,104 $43,722 $43,722 Scenario D -- $11,263 $40,740 $40,740
Taxable Debt Scenario A $34,712 Scenario B $16,997 Scenario C $37,417 Scenario D $31,659
The top half of the above table shows the average annual power cost savings associated with the formation of a new regional G&T entity, assuming that the entity would be able to finance future generation and transmission asset additions using tax-exempt debt. As can be seen, the most significant savings result from Organizational Paths 4 and 5. As previously discussed, the only difference between Paths 4 and 5 is that, under Path 5, the existing Railbelt utilities would remain responsible for the joint development of future generation and transmission facilities; the resulting power cost savings are the same for both Organizational Paths because we assumed that the investment decisions made by the individual utilities under the Path 5 power pool would align and track completely with the regional resource planning decisions made by the new regional entity.
As can be seen in the table above, there are not any power cost savings associated with Organizational Path 2. This is because Path 2 involves the coordinated operation of the Railbelt transmission grid by an independent entity; the only difference between Path 2 and the status quo (Organizational Path 1) is that the transmission grid operation function would be performed by an independent entity, as opposed to the existing Railbelt which are fulfilling this responsibility today. Hence, there is not any additional power costs savings associated with this organizational Path.
Finally, the bottom half of this table shows the power costs savings under Organizational Path 4 assuming that taxable debt must be used to finance future generation and transmission asset additions. As can be seen, this sensitivity case results in lower average annual power cost savings, under each Evaluation Scenario, due to the additional financing costs associated with taxable debt relative to tax-exempt debt.
More detailed information regarding these power cost savings results are provided in Appendices C-F.
Organizational Cost Results As discussed in Section 7, we developed a detailed estimate of the average annual present worth costs associated with the creation of a new regional entity for each of the alternative Organizational Paths. We also developed a 30-year estimate of the annual operating costs for each alternative organization, including the amortization of the start-up costs over the first five years of operations.
The following table summarizes the average annual A&G costs for each Organizational Path. As discussed previously, the total annual A&G costs include the following components: • Five-year amortization of start-up labor and non-labor costs
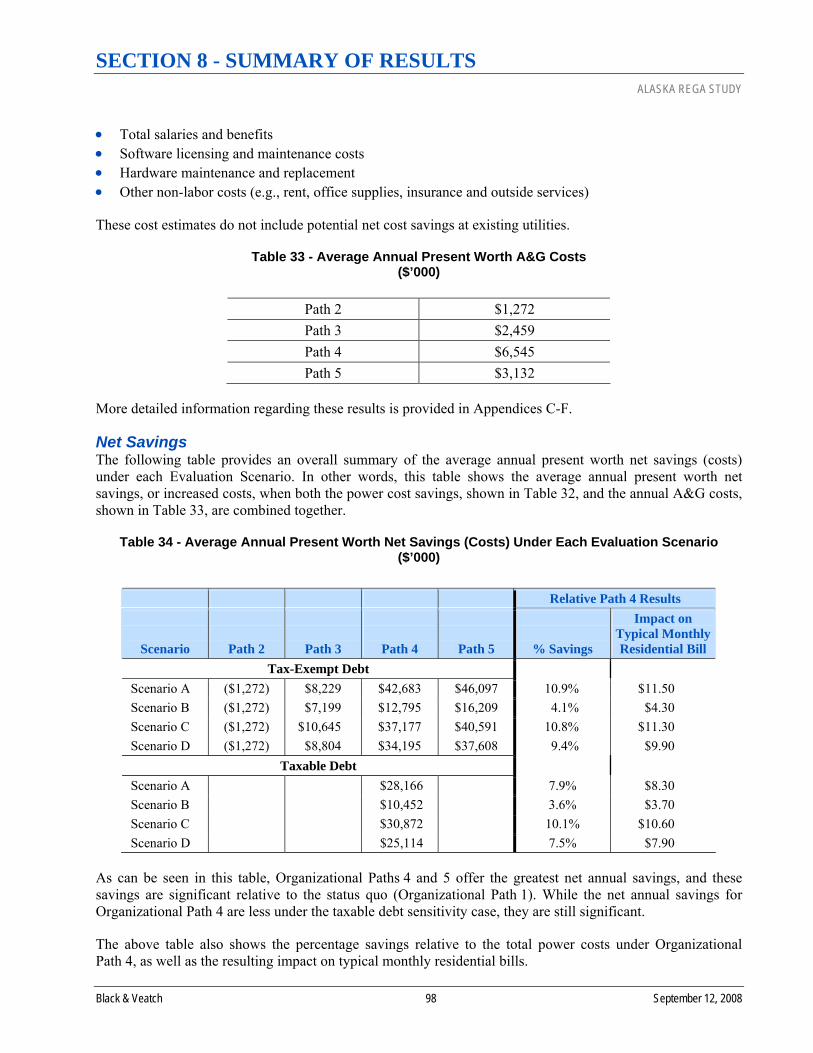
SECTION 8 - SUMMARY OF RESULTS ALASKA REGA STUDY
Black & Veatch 98 September 12, 2008
• Total salaries and benefits • Software licensing and maintenance costs • Hardware maintenance and replacement • Other non-labor costs (e.g., rent, office supplies, insurance and outside services)
These cost estimates do not include potential net cost savings at existing utilities.
Table 33 - Average Annual Present Worth A&G Costs ($’000)
Path 2 $1,272 Path 3 $2,459 Path 4 $6,545 Path 5 $3,132
More detailed information regarding these results is provided in Appendices C-F.
Net Savings The following table provides an overall summary of the average annual present worth net savings (costs) under each Evaluation Scenario. In other words, this table shows the average annual present worth net savings, or increased costs, when both the power cost savings, shown in Table 32, and the annual A&G costs, shown in Table 33, are combined together.
Table 34 - Average Annual Present Worth Net Savings (Costs) Under Each Evaluation Scenario ($’000)
Relative Path 4 Results
Scenario
Path 2
Path 3
Path 4
Path 5
% Savings
Impact on Typical Monthly Residential Bill
Tax-Exempt Debt Scenario A ($1,272) $8,229 $42,683 $46,097 10.9% $11.50 Scenario B ($1,272) $7,199 $12,795 $16,209 4.1% $4.30 Scenario C ($1,272) $10,645 $37,177 $40,591 10.8% $11.30 Scenario D ($1,272) $8,804 $34,195 $37,608 9.4% $9.90
Taxable Debt Scenario A $28,166 7.9% $8.30 Scenario B $10,452 3.6% $3.70 Scenario C $30,872 10.1% $10.60 Scenario D $25,114 7.5% $7.90
As can be seen in this table, Organizational Paths 4 and 5 offer the greatest net annual savings, and these savings are significant relative to the status quo (Organizational Path 1). While the net annual savings for Organizational Path 4 are less under the taxable debt sensitivity case, they are still significant.
The above table also shows the percentage savings relative to the total power costs under Organizational Path 4, as well as the resulting impact on typical monthly residential bills.

SECTION 8 - SUMMARY OF RESULTS ALASKA REGA STUDY
Black & Veatch 99 September 12, 2008
Cumulative Capital Requirements The following figure shows the cumulative capital requirements over the next 30 years resulting from the generation and transmission expansion plans for each of the four Evaluation Scenarios. As can be seen, the future cumulative capital requirements range from $2.5 billion for Evaluation Scenario B to $8.1 billion for Scenario A. This graphic also shows the fact that these capital expenditures do not occur evenly over the 30-year period. In developing this graph, we assumed that all of the capital expenditures associated with a specific project would occur in the initial year of commercial operation since we did not develop a detailed cash flow projection for each project. While this assumption is not reflective of reality, since project construction costs occur over several years, this graphic does demonstrate that there are specific periods during the 30-year planning horizon during which capital requirements will be particularly high.
Figure 30 - Required Cumulative Capital Investment
01,0002,0003,0004,0005,0006,0007,0008,0009,000
2008
2010
2012
2014
2016
2018
2020
2022
2024
2026
2028
2030
2032
2034
2036
Year
Cum
ulat
ive
Inve
stm
ent (
$ m
illio
ns)
Scenario A Scenario B Scenario C Scenario D
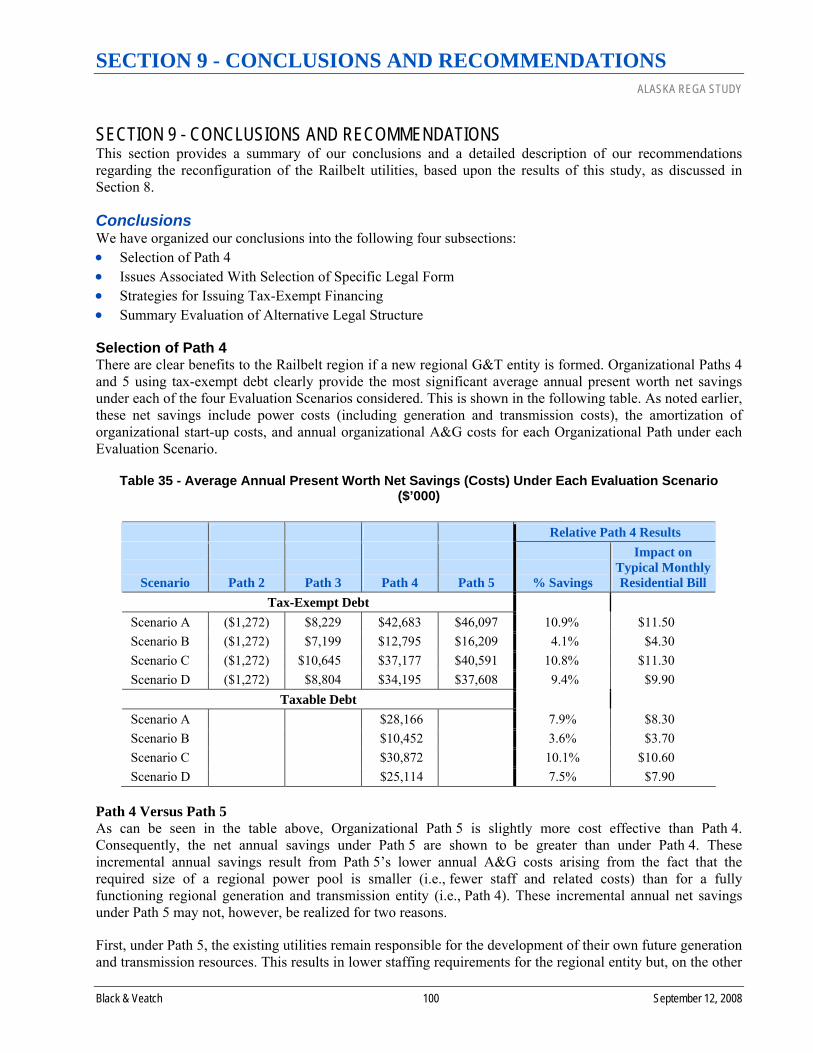
SECTION 9 - CONCLUSIONS AND RECOMMENDATIONS ALASKA REGA STUDY
Black & Veatch 100 September 12, 2008
SECTION 9 - CONCLUSIONS AND RECOMMENDATIONS This section provides a summary of our conclusions and a detailed description of our recommendations regarding the reconfiguration of the Railbelt utilities, based upon the results of this study, as discussed in Section 8.
Conclusions We have organized our conclusions into the following four subsections: • Selection of Path 4 • Issues Associated With Selection of Specific Legal Form • Strategies for Issuing Tax-Exempt Financing • Summary Evaluation of Alternative Legal Structure
Selection of Path 4 There are clear benefits to the Railbelt region if a new regional G&T entity is formed. Organizational Paths 4 and 5 using tax-exempt debt clearly provide the most significant average annual present worth net savings under each of the four Evaluation Scenarios considered. This is shown in the following table. As noted earlier, these net savings include power costs (including generation and transmission costs), the amortization of organizational start-up costs, and annual organizational A&G costs for each Organizational Path under each Evaluation Scenario.
Table 35 - Average Annual Present Worth Net Savings (Costs) Under Each Evaluation Scenario ($’000)
Relative Path 4 Results
Scenario
Path 2
Path 3
Path 4
Path 5
% Savings
Impact on Typical Monthly Residential Bill
Tax-Exempt Debt Scenario A ($1,272) $8,229 $42,683 $46,097 10.9% $11.50 Scenario B ($1,272) $7,199 $12,795 $16,209 4.1% $4.30 Scenario C ($1,272) $10,645 $37,177 $40,591 10.8% $11.30 Scenario D ($1,272) $8,804 $34,195 $37,608 9.4% $9.90
Taxable Debt Scenario A $28,166 7.9% $8.30 Scenario B $10,452 3.6% $3.70 Scenario C $30,872 10.1% $10.60 Scenario D $25,114 7.5% $7.90
Path 4 Versus Path 5 As can be seen in the table above, Organizational Path 5 is slightly more cost effective than Path 4. Consequently, the net annual savings under Path 5 are shown to be greater than under Path 4. These incremental annual savings result from Path 5’s lower annual A&G costs arising from the fact that the required size of a regional power pool is smaller (i.e., fewer staff and related costs) than for a fully functioning regional generation and transmission entity (i.e., Path 4). These incremental annual net savings under Path 5 may not, however, be realized for two reasons.
First, under Path 5, the existing utilities remain responsible for the development of their own future generation and transmission resources. This results in lower staffing requirements for the regional entity but, on the other
SECTION 9 - CONCLUSIONS AND RECOMMENDATIONS ALASKA REGA STUDY
Black & Veatch 101 September 12, 2008
hand, it means that the individuals at the existing utilities who are currently responsible for these activities would remain at the existing Railbelt utilities and, therefore, the Railbelt utilities would continue to incur the full payroll costs associated with these individuals. This was not fully reflected in our cost analysis. As a result, the incremental net annual savings of Path 5 would be less.
Additionally, we assumed that the power cost savings under Path 5 would be the same as Path 4. This, in essence, means that the decisions made by the individual Railbelt utilities regarding investments in future generation and transmission resources would completely align and track with the results of the regional resource planning process conducted by the regional entity. While incentives and penalties can be incorporated in the power pool’s cost allocation methodology to induce the individual utilities to behave in this manner, there is no guarantee that this will happen. Hence, it is very possible that the actual power cost savings under Path 5 would, in fact, be less than under Path 4, and the resulting decrease in power cost savings could easily be greater than the savings in A&G costs under Path 5.
Therefore, we view Path 5 as more of a transition strategy towards the development of a fully functioning regional generation and transmission entity, not the ultimate optimal end-state for the region. We further believe that the region should move directly to the optimal end-state; therefore, we are not recommending the formation of a power pool, even as a transitional strategy.
Improving the Economics of Path 4 We used conservative assumptions in our organizational cost estimate (i.e., we tried to present the worst case scenario in terms of the start-up and annual operating costs associated with the formation of a new regional entity). As a result, there are several ways that the start-up and annual operating costs could be reduced, thereby improving the overall economics of Path 4. Specifically, Black & Veatch did not assume: • Any savings at the existing utilities resulting from greater coordination; in fact, such savings are possible.
As an example, the formation of a regional entity is likely to result in greater coordination of maintenance activities throughout the Railbelt region. This increased coordination would increase the net savings associated with the formation of a regional generation and transmission entity.
• That the new entity would staff up rapidly which would have reduced the total start-up labor costs. As the regional entity adds staff, those individuals can take on additional responsibilities related to the formation of the new entity. Quickly adding staff to the new regional entity could reduce the level of consulting and legal assistance that we assumed would be required to form the new entity, thereby potentially reducing overall start-up costs.
• That any of the existing Railbelt utilities’ business systems, policies, and procedures would be transferred to the new regional entity. As with any new organization, the new regional entity will need to develop business systems, policies and procedures. Potential savings could occur if some of these systems, policies or procedures were, in fact, transferred to the new regional entity, and then modified to meet its own unique needs.
• Any savings from the consolidation of the three existing control centers. We recommend that the three control centers be consolidated into two centers, one primary and one back-up. Such consolidation most likely would result in some savings that we did not include in our analysis; based on discussions with utility representatives, these potential savings are not expected to be significant.
Non-Economic Benefits Associated With Formation of a Regional Entity There are a number of benefits associated with the creation of a fully functioning regional generation and transmission entity (i.e., a Path 4-type entity) that go beyond the economics that were modeled in our analysis. These additional benefits include the following: • Economies of scale and coordination related to staffing. Examples include:
♦ Better coordination is possible if all regional employees with generation and transmission responsibilities are part of one organization.

SECTION 9 - CONCLUSIONS AND RECOMMENDATIONS ALASKA REGA STUDY
Black & Veatch 102 September 12, 2008
♦ Depth of bench – it is easier to take advantage of the depth of everyone’s skills and expertise when everyone works for one organization, and greater specialization can occur.
♦ The concentration of staff increases the ability of the regional entity to keep abreast of new technologies (e.g., renewables) and industry trends.
♦ The concentration of staff also increases the ability of the Railbelt region to develop and support the delivery of cost effective renewables and DSM/energy efficiency programs.
• The concentration of staff would likely lead to more sophisticated generation and transmission planning, resulting in better regional resource planning decisions.
• A regional entity, with rational regional planning, enables the region to identify and prioritize projects on a regional basis and it puts the State in a better position to evaluate, award and monitor funding.
• The formation of a regional entity could lead to a reduction in the required levels of reserve margins over time.
• A regional entity is better able to integrate non-dispatchable resources, such as wind and solar. • With regard to project development, the concentration of staff within one organization increases the
ability to make timely and effective mid-course corrections, as required. • A regional entity is in a better position to manage risks which is particularly important given the current
circumstances in the Railbelt region. • A regional entity is more likely in a better position to compete in a competitive marketplace for human
resources and to offset, somewhat, the impacts of an aging workforce. • A regional entity could also result in other cost savings not captured in our economic modeling,
including: ♦ The region would need to develop only one regional Integrated Resource Plan, as opposed to three or
more Integrated Resource Plans, every three to five years. ♦ Legal and consulting expenses can be reduced as more issues are addressed on a regional basis versus
on an individual utility basis. ♦ Total staffing levels in certain areas on a regional basis can likely be reduced. ♦ Better access to lower cost financing due to the overall financial strength of the regional entity
relative to the six individual utilities. • The formation of a regional entity can increase the flexibility of the region to respond to major events
(e.g., a large load increase, such as a new or expanded mine). • A regional entity would be in a better position to work with Enstar Natural Gas Company and the gas
producers to address the region’s energy issues in a more comprehensive manner.
Issues Associated With Selection of Specific Legal Form In this subsection, we will discuss the following issues that relate to the choice of the specific legal form for the formation of a regional Path 4-type entity. It is clear that the formation of a new regional entity will result in significant benefits. The question then becomes whether the new entity should be a State Power Authority, G&T Cooperative, or some other legal form. We believe that there are a number of factors that should be considered in making the decision as to which legal form to select. The following discussion addresses what we consider the most significant factors regarding this choice. • Examples of Alternative Business Structures • Region’s Ability to Finance the Future • Value of State Financial Assistance • Value of RUS/FFB Financing • Value of Tax-Exempt Financing • Overall Summary of Issues Associated With the Selection of Specific Legal Form
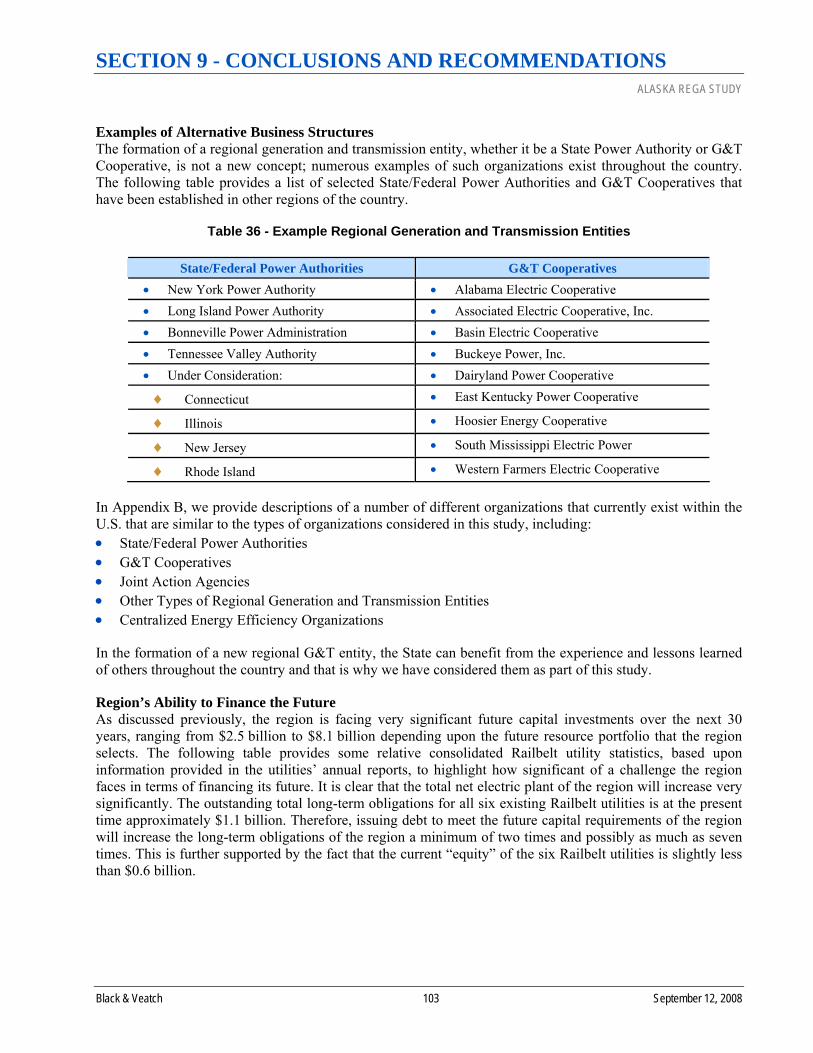
SECTION 9 - CONCLUSIONS AND RECOMMENDATIONS ALASKA REGA STUDY
Black & Veatch 103 September 12, 2008
Examples of Alternative Business Structures The formation of a regional generation and transmission entity, whether it be a State Power Authority or G&T Cooperative, is not a new concept; numerous examples of such organizations exist throughout the country. The following table provides a list of selected State/Federal Power Authorities and G&T Cooperatives that have been established in other regions of the country.
Table 36 - Example Regional Generation and Transmission Entities
State/Federal Power Authorities G&T Cooperatives • New York Power Authority • Alabama Electric Cooperative • Long Island Power Authority • Associated Electric Cooperative, Inc. • Bonneville Power Administration • Basin Electric Cooperative • Tennessee Valley Authority • Buckeye Power, Inc. • Under Consideration: • Dairyland Power Cooperative
♦ Connecticut • East Kentucky Power Cooperative
♦ Illinois • Hoosier Energy Cooperative
♦ New Jersey • South Mississippi Electric Power
♦ Rhode Island • Western Farmers Electric Cooperative
In Appendix B, we provide descriptions of a number of different organizations that currently exist within the U.S. that are similar to the types of organizations considered in this study, including: • State/Federal Power Authorities • G&T Cooperatives • Joint Action Agencies • Other Types of Regional Generation and Transmission Entities • Centralized Energy Efficiency Organizations
In the formation of a new regional G&T entity, the State can benefit from the experience and lessons learned of others throughout the country and that is why we have considered them as part of this study.
Region’s Ability to Finance the Future As discussed previously, the region is facing very significant future capital investments over the next 30 years, ranging from $2.5 billion to $8.1 billion depending upon the future resource portfolio that the region selects. The following table provides some relative consolidated Railbelt utility statistics, based upon information provided in the utilities’ annual reports, to highlight how significant of a challenge the region faces in terms of financing its future. It is clear that the total net electric plant of the region will increase very significantly. The outstanding total long-term obligations for all six existing Railbelt utilities is at the present time approximately $1.1 billion. Therefore, issuing debt to meet the future capital requirements of the region will increase the long-term obligations of the region a minimum of two times and possibly as much as seven times. This is further supported by the fact that the current “equity” of the six Railbelt utilities is slightly less than $0.6 billion.

SECTION 9 - CONCLUSIONS AND RECOMMENDATIONS ALASKA REGA STUDY
Black & Veatch 104 September 12, 2008
Table 37 - Estimated Required Capital to Finance the Region’s Future
Scenario
Required Capital Investment Over Next 30 Years – Path 4
($’000,000) A – Hydro/Renewables/DSM $8,070 B – Natural Gas $2,475 C – Coal $3,769 D – Mixed $5,840
Combined Railbelt Utility Financial Information - 2007 ($’000,000)
• Total Net Electric Plant $1,475 • Total Revenues $729 • Total Long-Term Obligations $1,081 • Total “Equity” $588
An important point to keep in mind is that regardless of whether the future required investment is $2.5 billion or $8.1 billion, that investment will need to be recovered through rates, thereby resulting in higher monthly bills for residential and commercial customers.
Value of State Financial Assistance As a result of these very significant capital requirements and their resulting impact on rates, obtaining financial assistance from the State of Alaska will be very important. This assistance could come in a variety of forms, including grants and or loans. This type of assistance is the most direct way to minimize the impact on monthly electric bills as it lowers the amount of debt that would need to be raised from other sources of financing.
The following table shows the direct impact of State financial assistance per $1 billion of assistance versus financing the capital needs from the Railbelt utilities and recovering these financing costs from customers. We show the annual savings that would result under two cases: 1) the assistance is provided in the form of a grant, and 2) the assistance is provided in the form of a zero-interest loan. These annual savings are based on the potential reduction in annual financial carrying costs (7.86 percent in the case of a grant and 4.52 percent in the case of a zero-interest loan) associated with each $1 billion in avoided debt raised in the municipal bond market.
Table 38 - Value of State Financial Assistance (per $1 Billion of Assistance)
Form of
Assistance
Annual Savings
($’000,000) Grant $78.6 Zero-Interest Loan $45.2

SECTION 9 - CONCLUSIONS AND RECOMMENDATIONS ALASKA REGA STUDY
Black & Veatch 105 September 12, 2008
“The major hurdle for any type of development is cash equity in the project
and the appropriate amount of financing that would allow a stabilized rate that the utility and the customer can rely
upon. The only way that I see that happening is with some major involvement
and buy-in by the State of Alaska and that must
include the Governor’s Office and the Legislature.”
Financial Community
Representative
“I suggest that the State get involve in a major way
to implement infrastructure to support
the electrical system in the State. The reason being
that without it, there is no economic development in
the State and consequently no reason
for people to come here or stay here.”
Financial Community
Representative
“I believe the State of Alaska has a vested
interest in future matters of the Railbelt utilities
from a “maximum benefit” perspective, an
economic stability perspective, a military
security perspective, and a public heating/electrical
crisis management perspective.”
Renewable Energy Advocate
“Where the State could get involved is the
installation of infrastructure. We often speak of transmission as
highways that carry energy. Social planners
know that where roads go economic activity follows. If the State were to make infrastructure funding
available, private investment could be attracted for hydro projects such as the
Chakachamna hydro project.”
Project Developer
Value of RUS/FFB Financing One source of financing for a Path 4-type entity available to the region is the United States Department of Agriculture’s (USDA) Rural Development Electric Program. This program, which is administered through the RUS, makes loans and loan guarantees to finance the construction of electric distribution, transmission and generation facilities, including system improvements and replacements required to furnish and import electric service in rural areas, for demand-side management and energy conservation programs, and for on- and off-grid renewable energy systems.
Under this program, loans are made to corporations; states; territories and subdivisions; and agencies such as municipalities, public utility districts, and cooperatives; non-profit, limited-dividend, or mutual associations that provide retail electric service to rural areas or supply the power needs of distribution borrowers in rural areas. USDA Rural Development also provides financial assistance to rural communities with extremely high energy costs to acquire, construct, extend, upgrade, and otherwise improve energy generation, transmission, or distribution facilities. USDA Rural Development services approximately 700 active electric borrowers in 47 states.
Guaranteed loans are provided by USDA Rural Development primarily through the FFB, CFC, and the National Bank for Cooperatives (CoBank). The FFB is an agency within the Treasury Department, providing funding in the form of loans for various government lending programs, including the guaranteed loan program. FFB loans are guaranteed by the USDA and are available to all electric utilities that meet certain requirements. FFB interest rates are fixed to the prevailing cost of money to the United States Treasury, plus an administrative fee of one-eighth of one percent. Under this program, loans are executed by the borrower and FFB, CFC, or CoBank, with payment of principal and interest guaranteed by USDA. CFC and CoBank rates are negotiated between the lender and the borrower.

SECTION 9 - CONCLUSIONS AND RECOMMENDATIONS ALASKA REGA STUDY
Black & Veatch 106 September 12, 2008
Important elements of this financing source include: • Attractive interest rate, set at the Treasury rate plus 1/8 percent; historically, this rate has been slightly
greater than the tax-exempt municipal rate for similar credit ratings. • RUS/FFB financing is capped, through Congressional appropriations, at a level that will make it difficult
for the region to rely solely on this source: ♦ The current appropriation is $6.6 billion, including $3.2 billion for generation- and transmission-
related investments. ♦ Over the past 30 years, the average level of total appropriation has been $1.85 billion.
• RUS/FFB money is intended for rural communities; given that the majority of the Railbelt region would not qualify as rural under the RUS/FFB rules, the amount of money that would be available from the RUS/FFB would be further restricted.
• RUS/FFB currently has a technology preference related to renewables, including hydroelectric facilities. • RUS/FFB financing is available to both a State Power Authority and G&T Cooperative.
Based upon the above, the RUS/FFB represents one potential source of financing for the future; however, this source cannot be relied upon to provide all of the financing that will be needed to meet the future needs of the region.
Value of Tax-Exempt Financing As previously discussed, the ability of a regional entity to issue tax-exempt debt would also have significant benefits. The amount of this benefit is a direct function of the region’s “fuel future” in that the greater the up-front capital costs (e.g., development of a large hydroelectric or coal plant), the greater the savings. This is shown in the following table.
Table 39 - Value of Tax-Exempt Financing
Scenario
Required Capital
Investment Over Next 30
Years – Path 4($’000,000)
Potential Annual Savings Associated With Tax-Exempt
Financing (Assuming 175 Basis Point
Differential) ($’000,000)
A – Hydro/Renewables/DSM $8,070 $141 B – Natural Gas $2,475 $43 C – Coal $3,769 $66 D – Mixed $5,840 $102
This table shows the annual savings in interest payments based upon an assumed 1.75 percent (175 basis points) difference in the taxable interest rate and the tax-exempt interest rate. As can be seen, annual savings range from approximately $40 million to $140 million depending upon the region’s future resource portfolio. We also show the resulting percentage savings in power costs, as well as the impact on typical monthly residential bills.
In a perfect world, the interest rate applicable to a tax-exempt bond would, at least, approximate the rate applicable to a taxable bond with similar maturity and similar security, but the interest rate would be lower to reflect the value to the bondholder of not having to pay federal income tax on the interest earned on the tax-exempt bond. Of course, in the real world, the difference between taxable and tax-exempt interest rates varies from day to day and from bond issue to bond issue. It is a matter that is affected by a wide variety of factors.

SECTION 9 - CONCLUSIONS AND RECOMMENDATIONS ALASKA REGA STUDY
Black & Veatch 107 September 12, 2008
There is no generally applicable spread between taxable and tax-exempt rates. It is generally true that tax-exempt rates are lower than taxable rates (assuming all other factors, such as those discussed below, are identical), but there is no specific guideline that can be relied on at all times. Nevertheless, historical experience has shown that a 1.5 percent to 2.0 percent (or 150 to 200 basis points) differential is a good general guideline. Accordingly, that is why we have assumed the 175 basis point mid-point as an average differential for purposes of this study.
The most significant factor that pertains to the interest rate that would apply to a given tax-exempt financing on any given day, beyond the general difference between the taxable and tax-exempt bond markets, is the security for the particular bond issuance. This is where ratings are particularly important. The rating agencies (Standard & Poor’s, Moody’s, and Fitch) assess the financial strength of the issue and assign a rating that is meant to reflect that strength. The strongest rating is AAA (or Aaa, in the case of Moody’s). Minimum investment grade ratings (i.e., minimum ratings that will qualify a bond for being purchased by managers of large investment funds) are no lower than the B category. So-called “junk bonds” carry the highest interest rates because of the perceived security risk involved and are generally rated (if rated at all) in the C category or below. On any given day of issuance, the higher the rating assigned to the bond, the lower the likely interest rate applicable to it. Conversely, a lower rating should result in a higher interest rate. If all other factors are equal, one would expect that two bonds with equal ratings would trade at identical interest rates on a given day. Again, the real world intercedes, and on any given day two bonds with identical ratings will not necessarily bear the same interest rate even if other factors (e.g., the type of bond, the terms of the bond, the particular issuer, and others) are substantially the same.
Another aspect of the security for the bonds is the financial strength of the issuer and the financial strength of the issuer’s project or program. This is the reason that the official statement (or other offering document) for a series of bonds usually goes into some detail in discussing the issuer of the bonds, the project or program being financed with proceeds of the bonds, the source of money expected to be used to repay the bonds, and other matters relating to the financial backing for the bonds.
Overall Summary of Issues Associated With the Selection of Specific Legal Form The discussion above was intended to highlight the significant challenges facing the region in terms of financing the future and to discuss the value of, and challenges associated with, State financial assistance, RUS/FFB financing, and tax-exempt financing.
Given the magnitude of the required future capital investments, Black & Veatch believes that minimizing the costs associated with financing the future is a critical objective and should have a direct impact on the choice of the legal form (i.e., State Power Authority, G&T Cooperative, or another form) for the new regional entity.
The purpose of the following graphic is to summarize the importance of State financial assistance and tax-exempt financing.

SECTION 9 - CONCLUSIONS AND RECOMMENDATIONS ALASKA REGA STUDY
Black & Veatch 108 September 12, 2008
Figure 31 - Summary of Potential Savings
$0 $10,000 $20,000 $30,000 $40,000 $50,000
Cas
e
Average Annual Savings $ millions)Path 4 Tax-Exempt (With State Grant) Path 4 Tax-Exempt (With State Loan)Path 4 Tax-Exempt (Base) Path 4 Taxable (With State Grant)Path 4 Taxable (With State Loan) Path 4 Taxable (Base)Path 3
First, the graphic above shows how the savings associated with Organizational Path 3 compared to various estimates of the savings associated with Path 4. As can be seen, Path 4, regardless of the source of financing, provides significant incremental savings relative to Path 3.
SECTION 9 - CONCLUSIONS AND RECOMMENDATIONS ALASKA REGA STUDY
Black & Veatch 109 September 12, 2008
“The solution probably lies in increasing the
mission and authority of the regulatory commission
so they can engage in practices that facilitate the energy policy goals. Chief in these new roles would be proactive and future
focused rate making actions and approvals for new generation projects.”
Fuel Supplier
* * *
“All of these things will be developed appropriately, either by utilities or by customers, if the prices
are appropriate, and they will not be developed
appropriately if the prices are not appropriate. Our
suggestion, therefore, is to concentrate on ways to get
the prices right.”
Utility Representative
* * * “The regulatory environment is
inconsistent and reactive, thus increasing business
risks and reducing reliability and consistency.”
Anchorage Chamber of
Commerce, Findings and Conclusions About Alaska’s
Energy Crisis
The following cases are shown for Path 4: • Taxable (Base) – the savings shown are based upon our detailed
analysis of Path 4 assuming financing with taxable debt. • Taxable (With State Loan) – these are the savings resulting from a
$1.0 billion zero-interest loan from the State and taxable debt for the rest of the required financing.
• Taxable (With State Grant) – these are the savings resulting from a $1.0 billion grant from the State and taxable debt for the rest of the required financing.
• Non-taxable (Base) – the savings shown are based upon our detailed analysis of Path 4 assuming financing with tax-exempt debt.
• Non-taxable (With State Loan) – these are the savings resulting from a $1.0 billion zero-interest loan from the State and tax-exempt debt for the rest of the required financing.
• Non-taxable (With State Grant) – these are the savings resulting from a $1.0 billion grant from the State and tax-exempt debt for the rest of the required financing.
This graphic shows that State financial assistance provides the greatest direct benefit; the savings shown would increase proportionally if the level of State financial assistance, either in the form of a grant or low-interest loan, is greater than $1 billion. The graphic also shows the significant benefits that will result if the new regional entity is able to issue tax-exempt debt.
Strategies for Issuing Tax-Exempt Financing While the potential benefits of tax-exempt financing are significant, so are the challenges associated with meeting the specific restrictions of the Internal Revenue Code and regulations. These challenges are summarized in Section 6 and are discussed in detail in Appendix G. Since the operations of the new regional entity would exceed two counties (boroughs in Alaska) and it would not satisfy the sunset rule, private activity bonds are not available for tax-exempt financing (unless a special permission is obtained through passage of a federal law). To obtain tax-exempt financing for future generation and transmission resources that are built by the new regional entity, the bonds would need to be government obligations bonds.
There are a limited number of potential solutions to enable the regional entity to issue tax-exempt government obligation bonds, including: • Retail Requirements Approach (in Appendix G, this is referred to as
the “Pirog/Boness Approach”) • 63-20 Corporation • Alaska Railbelt Corporation • Tax Exemption Through an Act of Congress (e.g., Bradley Lake Hydroelectric Plant)

SECTION 9 - CONCLUSIONS AND RECOMMENDATIONS ALASKA REGA STUDY
Black & Veatch 110 September 12, 2008
Each of these strategies are discussed below.
Retail Requirements Approach Under the Revenue Requirements Approach, a public corporation of the State would be created (or the Alaska Energy Authority could be legislatively retrofitted) to issue bonds to finance the construction of future generation and transmission assets and own these assets. The Railbelt utilities would continue to provide traditional distribution services, such as moving power from transmission/distribution substations to individual customers, meter reading, turn-ons/offs, responding to customer inquiries, etc.; however, the public corporation would sell the electricity generated by the new generation facilities directly to retail consumers on a “requirements” basis. There would be no minimum purchase obligation and there would be no power sales agreement with any of the cooperative utilities, as discussed below. Since this arrangement would not result in private business use of the facilities, the bonds would not pass the private business use test and, thereby, they would remain government obligations and not private activity bonds. It is worth noting that this strategy is being considered as part of the Chugach/ML&P merger discussions.
This approach is summarized in the following graphic and discussed below.
Figure 32 - Overview of Retail Requirements Approach
Traditional Model
Regional G&T Wholesale Power Distribution Distribution RetailEntity Sales Agreements Utilities Services Customers
Retail Requirements Approach
Regional G&T Power Through RetailEntity Power Cost Rates Customers
Distribution Distribution ServicesUtilities Through Distribution Rates
Under the Retail Requirements Approach: • A public entity would be formed to:
♦ Determine which generation and transmission assets to add in the future ♦ Oversee the development, and fully or partially finance these asset additions
• The regional public entity would finance a sole or undivided ownership interest in future generation and transmission facilities using tax-exempt debt, and: ♦ Supply its governmental customers (i.e., ML&P and SES) on a wholesale basis ♦ Sell directly to the retail customers of the electric cooperatives.
It should be noted that two of the existing Railbelt utilities are publicly-owned municipal entities. As such, the State Power Authority could sell electricity to these utilities for distribution by these utilities to their customers. The sale of electricity from one governmental entity to another does not create private business use.
• The existing utilities would continue to serve their customers with electricity generated by their own facilities. The electricity generated by the public corporation’s facility would supplement the existing utilities’ electricity. The public corporation would enter into contracts with the existing utilities for the use of their distribution systems and for billing services.
SECTION 9 - CONCLUSIONS AND RECOMMENDATIONS ALASKA REGA STUDY
Black & Veatch 111 September 12, 2008
• The question of how the regional public entity would sell to retail customers in an electric cooperative’s service territory raises a number of policy and practical questions (for example, the cooperatives are regulated by the RCA and would probably require amendments to their Certificate of Public Convenience and Necessity, CPCN, to permit such a sale).
• The power generated by the regional public entity would be dispatched and distributed throughout the region using the distribution lines of the existing utilities: ♦ The regional public entity would be in direct privity with each retail cooperative customer by
individual contract, tariff or statutory provision. ♦ The existing cooperatives would not take “ownership” of the power generated by the regional entity. ♦ Each cooperative retail customer would be required to take power only to the extent that it has
requirements and would only be obligated to pay for the power it takes. ♦ Each cooperative retail customer would have a separate line item on their bills to pay for the power
from the regional entity. ♦ Each cooperative retail customer would receive a ratable amount of power from the regional entity
with the remainder of their power coming from their existing utility. ♦ The existing cooperatives would act in the capacity as a limited agent of the regional entity in billing,
collecting monies from retail customers, and holding such monies in trust for the benefit of the regional entity.
♦ The existing cooperatives would also distribute the power over their distribution lines and charge a separate charge for such service.
♦ A monthly settlements process would be established. • As a variation of the above, the existing utilities would enter into power sales contracts with the regional
public entity, under which all of the generation from their existing generation assets would be sold to the regional entity, pooled together with other power supplies, and then resold (at cost) to retail customers using the existing utilities’ distribution lines and services.
The advantage of this approach is that it is currently available for use under present Internal Revenue Code provisions. The disadvantage is that it requires that a new entity be given access to at least the private utilities’ service areas to provide electricity directly to those private utilities’ customers. Moreover, to maintain its status as a true public entity, which is essential to this approach, the Board of Directors of the public authority could not be controlled by the Railbelt utilities. This is understandably a matter of concern to the utilities.
63-20 Corporation This concern over control of the new regional entity can be mitigated somewhat through the use of a 63-20 Corporation. In Revenue Ruling 63-20, the Internal Revenue Service set forth conditions under which private corporations may issue tax-exempt bonds on behalf of state and municipal governments. These corporations have become known as 63-20 Corporations. The conditions set forth in Revenue Ruling 63-20 include the following: • The corporation must be formed under the general non-profit corporation law of a state for the purpose of
stimulating industrial development within a political subdivision of the State. • The corporation must engage in activities which are essentially public in nature. • The corporation must be an entity which is not organized for profit. • The corporate income must not insure to any private person. • The state or political subdivision thereof must have a beneficial interest in the corporation while the
indebtedness remains outstanding and it must obtain full legal title to the property of the corporation with respect to which the indebtedness was incurred upon retirement of such indebtedness.

SECTION 9 - CONCLUSIONS AND RECOMMENDATIONS ALASKA REGA STUDY
Black & Veatch 112 September 12, 2008
♦ The requirement that the governmental unit must have a beneficial interest in the corporation while the indebtedness remains outstanding will be met if one of the following three requirements is satisfied: • The governmental unit has exclusive beneficial possession and use of a portion of the property
financed by the obligations and additions to that property equivalent to 95 percent or more of its fair rental value for the life of the obligations; or
• Both of the following are satisfied: • The non-profit corporation has exclusive beneficial possession and use of a portion of the
property financed by the obligations, and any additions to that property, equivalent to 95 percent or more of its fair rental value for the life of the obligations; and
• The governmental unit on whose behalf the non-profit corporation is issuing the obligations: 1) appoints or approves the appointment of at least 80 percent of the members of the governing Board of the corporation, and 2) has the power to remove, for cause, either directly or through judicial proceedings, any member of the governing Board and appoint a successor; or
• The governmental unit has the right, at any time, to obtain unencumbered fee title and exclusive possession of the property financed by the obligations, and any additions to that property, by: 1) placing into escrow an amount that will be sufficient to defease the obligations, and 2) paying reasonable costs incident to the defeasance. However, the governmental unit, at any time before it defeases the obligations, may not agree or otherwise be obligated to convey any interest in the property to any person for any period extending beyond or beginning after the unit defeases the obligations. In addition, generally the unit may not agree or otherwise be obligated to convey a fee interest in the property to any person who was a user of the property, or a related person, before the defeasance within 90 days after the unit defeases the obligations.
♦ The requirement that the governmental unit must obtain full legal title to the property of the corporation with respect to which the indebtedness was incurred upon retirement of the indebtedness will be met if: • The obligations of the non-profit corporation are issued on behalf of no more than one
governmental unit and unencumbered fee title to the property will vest solely in that governmental unit when the obligations are discharged.
• All of the original proceeds and investment proceeds of the obligations are used to provide tangible real or tangible personal property.
• The governmental unit obtains, upon discharge of the obligations, unencumbered fee title and exclusive possession and use of the property financed by the obligations, including any additions to the property, without demand or further action on its part.
• Before the obligations are issued, the governmental unit adopts a resolution stating that it will accept title to the property financed by the obligations, including any additions to that property, when the obligations are discharged.
• The indenture or other documents under which the obligations are issued provide that any other obligations issued by the non-profit corporation either to make improvements to the property or to refund a prior issue of the non-profit corporation’s obligations will be discharged no later than the latest maturity date of the original obligations, regardless of whether the original obligations are callable at an earlier date. In addition, the maturity date of the original obligations or any other obligations issued by the non-profit corporation with respect to the property may not be extended beyond the latest maturity date of the original obligations, regardless of whether the original obligations are callable at an earlier date. If the governmental unit has the beneficial interest described above, the obligations need not meet the requirements of this bullet.
• The proceeds of fire or other casualty insurance policies received in connection with damage to or destruction of the property financed by the obligations will, subject to the claims of the holders of
SECTION 9 - CONCLUSIONS AND RECOMMENDATIONS ALASKA REGA STUDY
Black & Veatch 113 September 12, 2008
the obligations: 1) be used to reconstruct the property, regardless of whether the insurance proceeds are sufficient to pay for the reconstruction, or 2) be remitted to the governmental unit.
• A reasonable estimate of the fair market value of the property on the latest maturity date of the obligations, regardless of whether the obligations are callable at an earlier date, is equal to at least 20 percent of the original cost of the property financed by the obligations, and a reasonable estimate of the remaining useful life of the property on the latest maturity date of the obligations is the longer of one year or 20 percent of the originally estimated useful life of the property financed by the obligations.
• The corporation must have been approved by the state or a political subdivision thereof, either of which must also have approved the specific obligations issued by the corporation.
Assuming that the requirements of Revenue Ruling 63-20, as amplified by Revenue Procedure 82 26, are met, the Retail Requirements Approach could be implemented through a non-profit corporation with a Board of Directors controlled by the utilities involved. Instead of having bonds issued, and the facility owned, by a State Power Authority, the 63-20 Corporation could issue the bonds, and own and operate the facility.
Alaska Railroad Corporation A very special circumstance exists with the Alaska Railroad Corporation. The federal act that transferred ownership of the railroad from the federal government to the State of Alaska stipulated that bonds issued by the Alaska Railroad Corporation would be treated as government obligations and would never be treated as private activity bonds. With this special power, the Alaska Railroad Corporation could issue bonds to finance the construction of a generation and transmission facility, and the bonds would be tax-exempt government obligations and would not be private activity bonds. Theoretically, this would apply even if the facility financed with the bonds were owned by one or more of the utilities.
The State law that governs the Alaska Railroad Corporation requires the enactment of special legislation before the Alaska Railroad Corporation may issue any bonds. As a result of this State law limitation, the corporation could not issue bonds to build a generation and transmission facility until after enactment of State authorizing legislation. This imposes the time constraint of waiting for the process of passage of a State law to be completed.
In addition to requiring State legislation, involving the use of the Railroad’s special power will require seeking a ruling from the Internal Revenue Service to confirm that the power actually applies to this situation. Bringing this question to the attention of the Internal Revenue Service could very well result in an effort to close the Railroad’s special power. This, then, becomes a political question of what is the best use of the Railroad’s power assuming that there is at least a chance that it will only be able to be used once before the federal law is changed to eliminate the power.
Tax Exemption Through an Act of Congress Other than using the Retail Requirements Approach (through a State Power Authority or through a 63-20 Corporation) or using the Alaska Railroad Corporation, the present federal tax laws and regulations provide no realistic avenue for tax-exempt financing of future generation and transmission assets. Pursuit of tax-exempt financing without using one of these two approaches would require obtaining special federal legislative permission. This has been done at least twice in Alaska for electric generation facilities.
The Bradley Lake Hydroelectric Project received a special exemption from the two-county rule in 1984. In 1995, the Snettisham Hydroelectric Project received a special exemption from the rule that requires rehabilitation expenditures to be made when tax-exempt private activity bond proceeds are used to acquire existing property. A special exemption from the two-county rule and the sunset rule for a new generation and transmission facility would permit such a facility to be financed with tax-exempt private activity bonds.

SECTION 9 - CONCLUSIONS AND RECOMMENDATIONS ALASKA REGA STUDY
Black & Veatch 114 September 12, 2008
The difficulty in obtaining a special federal exemption for bonds to finance the proposed generation and transmission facility is Congress’ scoring rule. Before any tax reduction measure can be enacted, Congress now requires that a corresponding measure be enacted to balance the loss of revenue to the Federal Treasury Department. This scoring requirement did not exist when the Bradley Lake exemption was granted in 1984. The scoring requirement was in place in 1995 when Snettisham received its special exemption; however, the exemption for Snettisham was granted in connection with the sale of the Snettisham facility from the federal government to the Alaska Energy Authority.
Summary Evaluation of Alternative Legal Structures The most readily available and viable tax-exempt bond option available to the new regional entity for the financing of future generation and transmission facilities to serve the Railbelt area of Alaska is the Retail Requirements Approach. It has the advantage of being immediately available and involving the lowest interest rate kind of bonds without the need for involvement from either Congress or the Internal Revenue Service. On the other hand, it will require State legislation and it requires that customers of at least the private utilities be served directly (i.e., not through the cooperatives) by the new regional entity. If it is a State Power Authority that issues the bonds, the control over the State Power Authority will be in the hands of the State government.
The Retail Requirements Approach could be modified by using a 63-20 Corporation, which could provide a greater level of control over the regional entity by the utilities. This would still require State legislation, but it could give the utilities greater control while the initially issued bonds are still outstanding.
An alternative is to seek bond financing from the Alaska Railroad Corporation. This will also require State legislation. Further, it will require requesting a ruling from the Internal Revenue Service and, in so doing, will bring the Alaska Railroad Corporation’s special bonding power to the attention of the Internal Revenue Service. This introduces the political question of finding the best use of the Railroad’s power considering the possibility that it could be the only use before the power is eliminated. The advantages of this approach are that: 1) it can be used to finance a facility owned by the utilities, 2) it does not require any other entity to provide electric service directly to the utilities’ customers, and 3) it also involves the use of the lowest interest rate kind of bonds.
Finally, special federal legislation can be sought through the Alaska congressional delegation. Such federal legislation could permit ownership of the facility by the utilities without a new entity providing service to the utilities’ customers. Most likely, the special exemption would still leave the bonds as private activity bonds; so, this approach would probably not involve the lower interest rates generally available to government obligations that are not private activity bonds. Also, this approach would have to address the congressional scoring requirement.
The following table provides a comparison of the alternative legal forms for the regional entity relative to certain criteria, including the discussion above regarding tax-exempt financing, as well as other considerations.

SECTION 9 - CONCLUSIONS AND RECOMMENDATIONS ALASKA REGA STUDY
Black & Veatch 115 September 12, 2008
Table 40 - Comparison of Alternative Legal Forms
Organizational FormState Power Authority
Criteria G&T Cooperative 63-20 Corporation
Retail Requirements
ApproachAlaska Railroad
CorporationCongressional Tax
Exemption
Core Function Yes Yes Yes No Yes
Ability to Issue Tax-Exempt Debt No Yes, With Restrictions Yes, With Restrictions Yes, With Restrictions Yes, With Restrictions
Risks Associated With Ability to Issue Tax-Exempt Debt
Not Applicable Limited Limited Moderate Significant
State Oversight Related to State Financial Assistance
Depends on Number of Voting State
Representatives on Board of Directors
Depends on Number of Voting State
Representatives on Board of Directors
Greatest Greatest Greatest
Overall Strength of Organizational Structure, Board and Management Team
Greatest Depends Upon Level of Board/Management
Energy Expertise
Depends Upon Level of Board/Management
Energy Expertise
Current Board/Management
Lacks Energy Expertise
Depends Upon Level of Board/Management
Energy Expertise
Potential Impact of Changing State Political Environment
Limited Limited Potentially Significant, Depending Upon Level of Board Independence
Potentially Significant, Depending Upon Level of Board Independence
Potentially Significant, Depending Upon Level of Board Independence
Flexibility Greatest Some Limitations Potential Limitations Potential Limitations Potential Limitations
Ability to Spread Risks Significant Significant Greatest Greatest Greatest
Direct Customer-Owned Control Moderate Moderate Limited Limited Limited
Ability to Fund Large Projects Moderate Significant Greatest Greatest Greatest
As shown in the table above, the generation and transmission functions of the new regional entity would be a core function for each of the alternative legal forms, except in the case of the Alaska Railroad Corporation. As has been discussed above, a G&T Cooperative would not be able to issue tax-exempt debt; under the other legal forms, the regional entity could issue tax-exempt debt, albeit with restrictions.
The risk associated with raising tax-exempt debt is limited in the case of the 63-20 Corporation and the Retail Requirements Approach, as both forms are known to qualify for tax-exempt status. This risk increases in the case of the Alaska Railroad Corporation and becomes significant relative to obtaining a Congressional tax exemption.
The next criteria in the table relates to the level of State oversight inherent with each legal form, which could have a direct impact on the willingness of the State to provide financial assistance. As can be seen, all three variations shown for the State Power Authority offers the greatest level of State oversight. This level of oversight is less for a 63-20 Corporation, and even less for a G&T Cooperative.
Next is the issue of the overall strength of the organizational structure, Board and management team. The G&T Cooperative ranks highest under this criteria because of the cumulative expertise of the likely members of the Board and management team, assuming that these individuals will come from the existing Railbelt utilities. The strength of the other legal forms relative to this criteria will depend upon the level of energy industry expertise of the individuals that comprise the entity’s Board and management team.
The next criteria shows that the G&T Cooperative and 63-20 Corporation forms are the most insulated against the potential impacts of changes in the State political environment. Similarly, the G&T Cooperative legal form provides the greatest organizational flexibility.
All legal forms provide a solid foundation for spreading risks across the region. The State Power Authority offers the greatest strength relative to this criterion.
With regard to customer control of the new regional entity, the G&T Cooperative and 63-20 Corporation offer an advantage. The existing Railbelt utilities each provide local citizens and customers with the opportunity to directly influence decisions. This level of control and influence is lessened in the case of a regional G&T Cooperative or 63-20 Corporation, and is lessened even more in the case of a State Power Authority.

SECTION 9 - CONCLUSIONS AND RECOMMENDATIONS ALASKA REGA STUDY
Black & Veatch 116 September 12, 2008
Finally, with regard to the ability of the regional entity to fund large projects, the State Power Authority is ranked the highest, followed by a 63-20 Corporation and then by a G&T Cooperative.
Recommendations The following summarizes the overall recommendations arising from this study, broken down into the following three categories: • Recommendations Related to Organizational and Legal Structure Recommendations • Recommendations Related to Organizational Issues • Recommendations Related to the Issues Identified in the AEA Request-for-Proposals
Recommendations Related to Organizational and Legal Structure The following summarizes our recommendations with regard to the structure of the new regional entity. • As shown in Figure 33, a new regional entity with responsibility for generation and transmission
operations and future ownership should be formed; the existing Railbelt utilities would retain the responsibility for providing traditional distribution services, such as moving power from transmission/distribution substations to individual customers, meter reading, turn-ons/offs, and responding to customer inquiries. More specifically, the functional responsibilities of this new regional entity should include: ♦ Independent, coordinated operation of the Railbelt electric transmission system ♦ Economic dispatch of the Railbelt region’s generation facilities ♦ Railbelt region resource and transmission expansion planning ♦ Joint development of new generation and transmission facilities for the Railbelt region
• To maximize the economic benefits associated with regionalization, the legal structure for this new regional entity should be a State Power Authority for the following reasons: ♦ It is projected that the Railbelt region will need to fund between $2.5 - $8.1 billion of new capital
investment over the next 30 years to build new generation and transmission facilities to reliably serve the electric needs of citizens and businesses in the region. This level of investment, which is dependent upon the future generation resource options and transmission expansion projects chosen in a regional planning process, represents a significant challenge for the Railbelt region given its small size. Having the good faith and credit of the State supporting the regional entity will minimize the financial risks and result in a lower cost for debt.
♦ State financial assistance, whether in the form of a grant(s) or low interest loan(s), would provide a significant benefit to the Railbelt region. This potential assistance represents the single most significant way to reduce the burden on Railbelt citizens and businesses associated with the financing of required generation and transmission investments.
♦ It seems reasonable to conclude that the Governor and State Legislature would be more willing to provide some level of financial assistance to the Railbelt region if the new regional entity was formed as a State Power Authority, as opposed to a private business such as a G&T Cooperative.
♦ In addition to potential State financial assistance, forming the new Railbelt regional entity in a manner that would allow it to issue tax-exempt debt would provide a significant economic benefit to the region. A State Power Authority is in a better position to be able to issue tax-exempt municipal debt, although restrictions exist that make this a challenge.
♦ Generally speaking, a G&T Cooperative is unable to issue tax-exempt debt due to Internal Revenue Code restrictions. A G&T Cooperative, as well as a State Power Authority, could obtain taxable debt through RUS/FFB at favorable interest rates relative to the rates that are available in the taxable municipal bond market. However, RUS/FFB funding is subject to Congressional appropriations (approximately $3.2 billion in FY2008 for generation and transmission facilities) and the region would need to compete against other requests from cooperatives throughout the country. Additionally, RUS/FFB money is intended for rural communities; given that the majority of the

SECTION 9 - CONCLUSIONS AND RECOMMENDATIONS ALASKA REGA STUDY
Black & Veatch 117 September 12, 2008
Railbelt region would not qualify as rural under the RUS/FFB rules, the amount of money that would be available from the RUS/FFB would be further restricted. As a result, the region will not be able to rely upon the RUS/FFB to meet all of its financing requirements. Furthermore, obtaining financing through the RUS/FFB can take up to two years with no assurance of success, and the resulting covenants are typically more restrictive than what can be negotiated in the municipal bond market. As a result, obtaining RUS/FFB financing is more risky than the municipal bond market.
♦ If a State Power Authority is formed, it is very important that its Board of Directors and management team consists of individuals with substantive knowledge and understanding of the electric or energy industry, specifically generation and transmission, and consumer issues. Furthermore, the Board needs to be sufficiently insulated from State political cycles so that effective long-term planning and project development can occur. Without such industry expertise and independence, the Board and management team will not be able to effectively address the issues and risks facing the Railbelt region and manage the region’s very substantial capital improvement program.
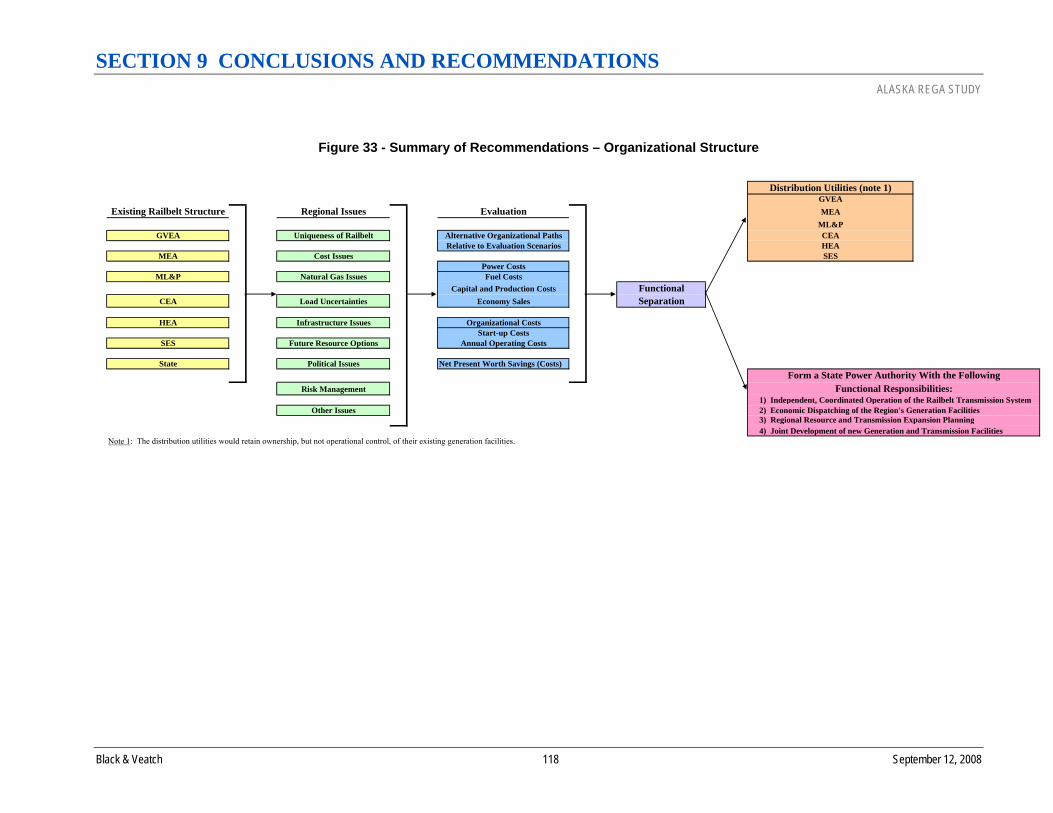
SECTION 9 CONCLUSIONS AND RECOMMENDATIONS ALASKA REGA STUDY
Black & Veatch 118 September 12, 2008
Figure 33 - Summary of Recommendations – Organizational Structure
Distribution Utilities (note 1)GVEA
Existing Railbelt Structure Regional Issues Evaluation MEAML&P
GVEA Uniqueness of Railbelt Alternative Organizational Paths CEARelative to Evaluation Scenarios HEA
MEA Cost Issues SESPower Costs
ML&P Natural Gas Issues Fuel CostsCapital and Production Costs Functional
CEA Load Uncertainties Economy Sales Separation
HEA Infrastructure Issues Organizational CostsStart-up Costs
SES Future Resource Options Annual Operating Costs
State Political Issues Net Present Worth Savings (Costs)Form a State Power Authority With the Following
Risk Management Functional Responsibilities: 1) Independent, Coordinated Operation of the Railbelt Transmission System
Other Issues 2) Economic Dispatching of the Region's Generation Facilities 3) Regional Resource and Transmission Expansion Planning
4) Joint Development of new Generation and Transmission FacilitiesNote 1: The distribution utilities would retain ownership, but not operational control, of their existing generation facilities.

SECTION 9 CONCLUSIONS AND RECOMMENDATIONS ALASKA REGA STUDY
Black & Veatch 119 September 12, 2008
Recommendations Related to Organizational Issues The following summarizes our recommendations regarding the various organizational issues that were discussed in Section 6.
Scope of Responsibilities
Functional Responsibility
New Regional Entity
Coordinated Operation of the Transmission Grid
Regional Economic Dispatch
Regional Resource Planning
Joint Project Development
Formation Issues
Issue Recommendations Legal Structure Form as a State Power Authority. Location Anchorage area, due to:
• Centralized location • Concentration of skilled workforce • Location of majority of total regional load.
Transfer of Existing Assets and Fuel Supply Contracts
Ownership of existing assets – no. Dispatch and operational control of existing assets – yes.
Whether to Adopt a “Hold Harmless” Requirement
Yes; this is a matter of fairness and equity to stakeholders.
Transition Period To move to average regional rates over time, consistent with hold harmless philosophy. With regard to regional transmission facilities, there is a need to develop a cost/benefit allocation methodology as part of the OATT. Existing generation facilities - fully regionalized rates by end of 10 years. Future generation facilities - costs regionalized immediately.

SECTION 9 CONCLUSIONS AND RECOMMENDATIONS ALASKA REGA STUDY
Black & Veatch 120 September 12, 2008
Operational Issues
Issue Recommendations O&M Responsibility Existing generation and transmission facilities:
• Initially, keep O&M responsibility with existing utilities • Utilities to develop a plan to transition O&M responsibilities to the new
regional entity as soon as practical. Future generation and transmission facilities - regional entity.
Consolidation of Control Centers
Consolidate three existing control centers (GVEA, ML&P and CEA) into two control centers, one primary (either ML&P or CEA) and one back-up (GVEA), using existing systems and equipment to the extent possible.
Required SCADA/Telecommunications Investments
Limited expansion of existing systems that are in place.
Determination of Transmission Voltage Level and Treatment of Large Customers Currently Served at Transmission Voltage Levels
The new regional entity will need to make a determination regarding what will be the point of demarcation between transmission and distribution voltage levels. Additionally, the new entity will need to work with the Railbelt utilities to determine how to handle those large customers which are currently served at transmission voltage levels.
Regional Generation and Transmission Planning Issues
Issue Recommendations Development of New Coordinated Planning Processes
A new regional generation and transmission planning process needs to be developed, based on best practices, to provide a consistent approach to resource planning.
Requirement to Follow Results
Regional entity would take the lead in the development of future generation and transmission facilities.
Joint Project Development Issues
Issue Recommendations All-In or Opt-Out Option New entity will make regional resource planning decisions and take the lead in the
development of future generation and transmission facilities with all existing utilities sharing in the related costs.
Responsibility for Project Construction
Regional entity would take the lead in the development of future generation and transmission facilities.
Required Skill Sets and Staffing Levels-Related Issues
Issue Recommendations Total Staffing Levels Black & Veatch’s estimate of the required staffing levels for a Path 4-type entity was
previously discussed in Section 7.
Organizational Structure Black & Veatch’s proposed organizational structure for a Path 4-type entity was previously discussed in Section 7.
Strategy for Transfer of Existing Employees
Utilities, collectively and individually, need to develop a strategy related to the transfer of existing employees to the new regional entity; this strategy should: 1) identify the total

SECTION 9 CONCLUSIONS AND RECOMMENDATIONS ALASKA REGA STUDY
Black & Veatch 121 September 12, 2008
Issue Recommendations number of employees to be transferred, 2) identify specific employees to be transferred, 3) develop an overall compensation structure and benefits package, 4) retain each transferred employee’s tenure relative to the benefits package, and 5) specify the relocation package to be offered to each transferred employee. It would be a mistake to form a new regional entity without transferring a substantive number of employees, due to:
• The transfer of functional responsibilities to the new regional entity • The need to transfer regional, institutional knowledge to the new entity.
Recruiting and Relocation Strategy
The utilities will need to develop a strategy to make accepting a transfer attractive to existing employees and to recruit other employees to the new entity.
Compensation Program It is common practice, in similar cases, to develop a compensation program for a new regional entity that is equal to or greater than existing compensation programs to provide existing employees with an incentive to transfer to the new entity. Union issues will need to be addressed in the formation of the new regional entity.
Tax and Legal Issues
Issue Recommendations Ability to Issue Tax-Exempt Debt
The ability of the new regional entity to issue tax-exempt debt would provide a significant economic benefit to the Railbelt region; as previously discussed, achieving this is a challenging issue and the utilities and the State of Alaska will need to further investigate this issue as the new regional entity is formed.
Transfer of Ownership of Existing Assets
Ownership of existing assets should remain with the existing utilities to: • Protect ML&P against the potential loss of its tax-exempt financing status • Eliminate the need to refinance the existing debt of existing utilities.
Transfer of the City of Anchorage’s Ownership of Gas Reserves in the Cook Inlet
Under Internal Revenue Code regulations, ML&P’s existing gas reserves, which were financed using tax-exempt debt, must be used within ML&P’s generation facilities; therefore, ownership of existing assets should remain with the existing utilities.
Governance As a public entity, the majority of the Board of Directors would need to be independent of the existing Railbelt utilities.
Regulatory Oversight Issues and Legislative Actions
Issue Recommendations Regional Integrated Resource Plans
RCA oversight limited to investigation of filed complaints. We conclude this for the following reasons: 1) regional generation and transmission entities are typically not subject to state regulatory oversight, 2) the potential conflict when one state agency oversees another state agency, and 3) we do not believe that the benefits of regulation outweigh the incremental costs.
Joint Project Development RCA oversight limited to investigation of filed complaints. Fuel Contracts RCA should retain the responsibility for reviewing and approving fuel contracts related to
existing generation facilities. For new generation facilities - RCA oversight limited to investigation of filed complaints.

SECTION 9 CONCLUSIONS AND RECOMMENDATIONS ALASKA REGA STUDY
Black & Veatch 122 September 12, 2008
“AEA and AIEDA can assist our resource
development through the identification of
renewable energy projects and the means to fund
such projects. The RCA should not falter when it comes to enforcing our
Governor’s “mandate” to the utilities nor should it falter when enforcing the regulations by which the
utilities are governed. The Palin administration
should continue to show leadership on energy
matters.”
Consumer Advocate
“In general, open access to the State’s natural
resources, transmission infrastructure, and
monopolized load centers needs to be legislatively
improved to improve competition.”
Industry Consultant
“A State net-metering law would go a long way to encouraging distributed
generation.”
Renewable Energy Advocate Consultant
“Legislators could instill improvements in open-
access and more accurate filings of “avoidable cost”
rate filings.”
Industry Consultant
Issue Recommendations Cost/Benefit Allocation Methodology
With regard to regional transmission facilities, there is a need to develop a cost/benefit allocation methodology as part of the OATT. Existing generation facilities - fully regionalized rates by end of 10 years. Future generation facilities – costs regionalized immediately.
Transmission Tariff An OATT should be developed, with rates based on common industry standards and modeled after the FERC pro forma OATT with appropriate modifications to reflect Railbelt circumstances. Annual revenue requirement calculations should be based upon a formulaic rate structure that would be included in the OATT.
Annual Reporting Requirements
Additional annual reporting requirements should not be established.
Other Required State Actions
Issue Recommendations State Energy Plan and Related Policies
The regional Integrated Resource Plan and Transmission Expansion Plan developed by the regional entity should be developed consistent with the State Energy Plan, which is under development, and related policies.

SECTION 9 CONCLUSIONS AND RECOMMENDATIONS ALASKA REGA STUDY
Black & Veatch 123 September 12, 2008
“I believe the State, through the AEA, should
play a major role in matters affecting Railbelt
utilities and their customers. It should expand its ownership
and/or control of primary assets in the Railbelt to best serve all Railbelt consumers. The State
should also encourage the private sector to compete
for providing the new generation needs for the
Railbelt.”
Project Developer
“The State should aggressively work with all energy market players to determine the most viable and economic potential
energy sources, work with a G&T entity to plan and
fund infrastructure accordingly, and work with the RCA to write
statutes and regulations that enable “safe, reliable
and least-cost” power. The State should also work with the RCA to create incentives for
residential, commercial and industrial energy
efficiency and conservation education
and measures.”
Renewable Energy Advocate
“In a state as diverse, scattered, and sparse as
Alaska is, the State has an extremely important role
to play. It can provide seed money, bonds,
training, educational development, incentives
and goals that will provide a better energy future for
all of us.”
Consumer Advocate
“A small market in Alaska makes IPP development
difficult.”
Utility Representative
“I do not see IPP as a solution to the Railbelt
problems; in fact I see any involvement by them as another hindrance in putting in place a real
solution. Their motive is not to stabilize rates for the consumer or to work
on behalf of the consumer.”
Financial Community
Representative
“In general, open access to the State’s natural
resources, transmission infrastructure, and
monopolized load centers needs to be legislatively
improved to improve competition.”
Industry Consultant
Market Structure Issues
Issue Recommendations Required Changes to Market Structure
The Railbelt utilities are currently in the process of developing regional generator interconnection standards; these standards should be finalized and implemented. The OATT to be developed by the new regional entity should apply also to projects developed by IPPs.
Adoption of a Competitive Power Procurement Process
A competitive power procurement process should be developed by the regional entity that will establish a “level playing field” for IPP-proposed projects.

SECTION 9 CONCLUSIONS AND RECOMMENDATIONS ALASKA REGA STUDY
Black & Veatch 124 September 12, 2008
Tariff/Contractual Requirements-Related Issues
Issue Recommendations Open Access Transmission Tariff
An OATT should be developed, with rates based on common industry standards and modeled after the FERC pro forma OATT with appropriate modifications to reflect Railbelt circumstances. Annual revenue requirement calculations should be based upon a formulaic rate structure that would be included in the OATT.
Postage Stamp or Mileage-Based Rates
Generation-related costs – over time, move to postage rates. Transmission-related costs – postage rates.
Contracts Between Individual Parties
Existing contracts – retain as is, unless they can be transferred to the new regional entity and there is a benefit.
New contracts - not allowed.
Governance Issues
Issue Recommendations Non-Profit Operation Yes. Requirements for Membership
Rules for participation would need to be established.
Board Representation As a public entity, the majority of the Board of Directors would need to be independent of the existing utilities.
Formation of Management Committees
Yes (e.g., finance, planning, operations, and joint project development whenever a new project is under development).
Meetings Annual and monthly Board meetings with public notification requirement. Special meetings as required.
Decision-Making and Approval Process
Management committees develop analysis and recommendations under the Board’s and their own direction. Need clear definition of the nature and financial size of decisions that require Board approval and which decisions can be made by management committees.
Issuance of Debt Any issuance of debt must be approved by Board. Purchase of Power, Adherence to Results of Economic Dispatch, Regional Planning Process and Joint Project Development
All utilities required to adhere to the economic dispatch, regional planning, and project development decisions made by the regional entity.
Termination of Membership Provisions need to be specified in bylaws (including length of notice and repayment of debt).
Merger, Consolidation or Dissolution of Regional Entity
Provisions need to be specified in bylaws.

SECTION 9 CONCLUSIONS AND RECOMMENDATIONS ALASKA REGA STUDY
Black & Veatch 125 September 12, 2008
Issue Recommendations Indemnification of Directors, Management Personnel, Employees, and Agents
Provisions need to be specified in bylaws.
Contracting Provisions need to be specified in bylaws.
Rules, Regulations and Rate Schedules
Provisions need to be specified in bylaws.
Recommendations Related to the Issues Identified in the AEA Request-for-Proposals The following summarizes our recommendations related to the specific issues that were identified in the original Request-for-Proposals.
Issue Recommendations Identify any State Statutory and Regulatory Changes Necessary for REGA Implementation
The following issues would require State statutory changes: • Formation of regional entity (including powers, legal form, governance
structure, ability to purchase property, and selected bylaw requirements) • Modification of existing utilities’ service territory certificates, as necessary • Establish direct privity with retail customers if the Retail Requirements
Approach is adopted • Implementation of market structure changes (e.g., OATT and competitive power
procurement process) • State financial assistance (e.g., grants or loans) for the development of regional
generation and transmission infrastructure (based upon the results of the regional Integrated Resource Plan, once completed).
Identify Required Changes in the Regulatory Regime Under Which Utilities Operate (Including Compliance with RCA Statutes, Consideration of the Optional FERC Rules Under Order 888, and FERC Order 2000) and Determine Whether the Entity Should be Regulated by the RCA
New regional entity should not be under the jurisdiction of FERC or the RCA. We conclude this for the following reasons: 1) regional generation and transmission entities are typically not subject to state regulatory oversight, 2) the potential conflict when one state agency oversees another state agency, and 3) we do not believe that the benefits of regulation outweigh the incremental costs.
Determine What Role the RCA Should Play in Regional Planning and Whether the Regional Plan Should Require RCA Approval
RCA oversight limited to investigation of filed complaints.
Deteremine the Appropriate Relationship of the REGA to Serving Utilities
Regional entity has generation and transmission functional responsibilities and sells power to distribution utilities (or directly to their retail customers); also, perhaps, work with distribution utilities on matters of significant regional importance (e.g., development of DSM/energy efficiency programs). Existing Railbelt utilities would retain the responsibility for providing distribution services to their customers.

SECTION 9 CONCLUSIONS AND RECOMMENDATIONS ALASKA REGA STUDY
Black & Veatch 126 September 12, 2008
Issue Recommendations Determine Whether Economic Dispatch Should be Through a Pooled Arrangement or Through a Separate Entity
Separate entity.
Determine Whether Utilities Should Continue to do Service Area-Specific Integrated Resource Planning, or Whether There Should be a Single Regional IRP
The regional entity would be responsible for the development of one regional Integrated Resource Plan on a periodic basis (e.g., every three years).
Determine Whether all Railbelt Utilities Should be Required to Participate in and be Bound by the Regional Integrated Resource Planning Decisions
Yes, once the regional Integrated Resource Plan is approved by the regional entity’s Board of Directors.
Determine Whether Investment Decisions Under a REGA Should be Subject to Individual Utility Board of Director’s Approval
No, decisions would be made by the regional entity’s Board of Directors.
Identify any Required Changes to Market Structure
Need to develop: • Regional generator interconnection standards • Competitive power procurement process executed by regional entity • OATT.
Determine Whether the REGA Should Consider Future Sources of Generation That Could be Provided by IPPs and, if Yes, What New System Operating Rules Would be Necessary to Allow Access to These Power Sources by Utilities in Need of Future Generation
A competitive power procurement process should be developed by the regional entity that will establish a “level playing field” for IPP-proposed projects.
Determine Whether Open-Access Tariffs Should be Required for All Transmission Lines in the Railbelt to Allow IPPs to Transmit Power to Customers
An OATT should be developed, with rates based on common industry standards and modeled after the FERC pro forma OATT with appropriate modifications to reflect Railbelt circumstances. Annual revenue requirement calculations should be based upon a formulaic rate structure that would be included in the OATT.
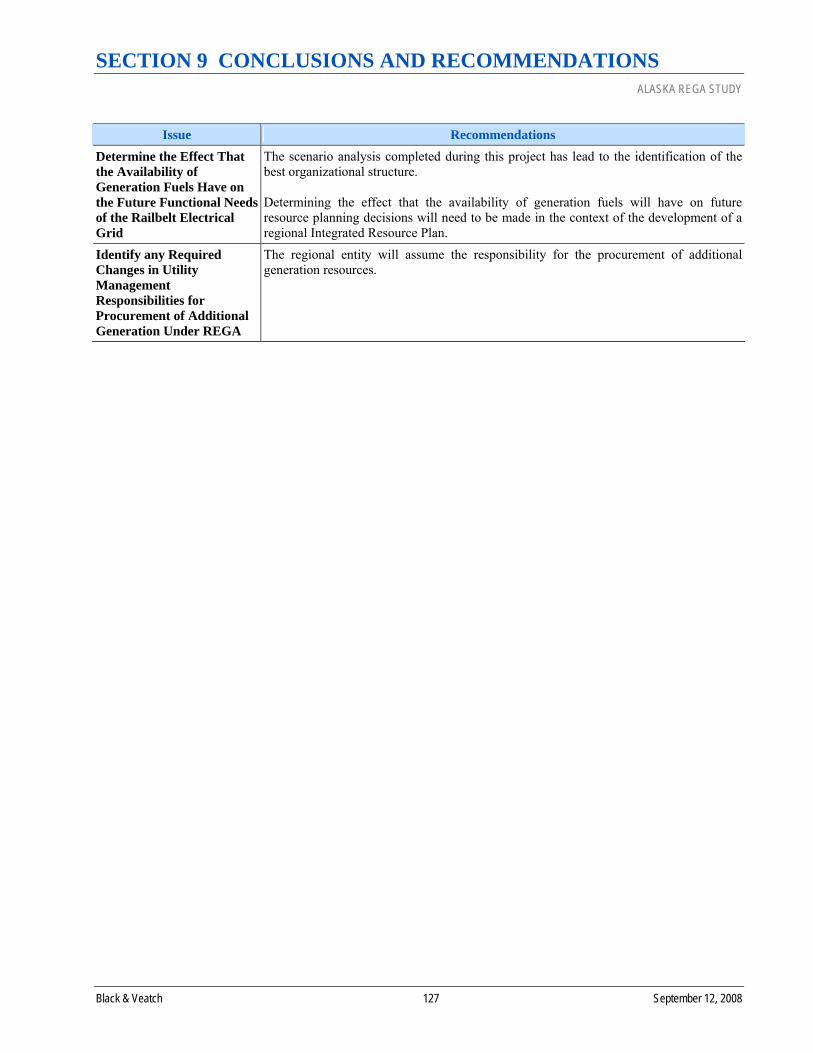
SECTION 9 CONCLUSIONS AND RECOMMENDATIONS ALASKA REGA STUDY
Black & Veatch 127 September 12, 2008
Issue Recommendations Determine the Effect That the Availability of Generation Fuels Have on the Future Functional Needs of the Railbelt Electrical Grid
The scenario analysis completed during this project has lead to the identification of the best organizational structure. Determining the effect that the availability of generation fuels will have on future resource planning decisions will need to be made in the context of the development of a regional Integrated Resource Plan.
Identify any Required Changes in Utility Management Responsibilities for Procurement of Additional Generation Under REGA
The regional entity will assume the responsibility for the procurement of additional generation resources.

SECTION 10 - NEXT STEPS AND IMPLEMENTATION PLAN ALASKA REGA STUDY
Black & Veatch 128 September 12, 2008
“The AEA could (maybe should) be strengthened. The State will need some
sort of facilitator, and maybe enforcer, to take the concept of a Railbelt
G&T from idea to implementation. I do not have any confidence that the utilities will do it on
their own. The AEA could also be valuable in
planning and evaluating infrastructure
requirements for the Railbelt and Statewide.”
Fuel Supplier
SECTION 10 - NEXT STEPS AND IMPLEMENTATION PLAN In this final section of the report, we discuss the next steps to be taken and provide a detailed plan for the implementation of the recommended regional organizational structure.
Next Steps The following list of actions represents the most immediate steps that need to be taken with regard to the formation of a new regional entity. • The Railbelt utilities, in conjunction with the State, need to make the
decision whether to form a new Railbelt regional entity and finalize the functional responsibilities of that entity. It is critical that this decision be made as soon as possible; the challenges confronting the Railbelt region require that action be taken now. Delay will only make the challenges greater and, if the regional entity is not formed now, decisions will need to be made by individual utilities and these decisions will not result in optimal results from a regional perspective.
• A conclusive determination regarding the ability of the new regional entity to issue tax-exempt debt needs to be made and an appropriate strategy developed. The Railbelt utilities and the State should secure the services of one or more bond counsels and bond underwriters to support this effort.
• The legal form (i.e., State Power Authority, G&T Cooperative, or 63-20 Corporation) of the regional entity needs to be finalized.
• The Railbelt utilities and the State need to establish a transition management team to oversee the formation of the new entity.
• Required legislative actions should be introduced in the new legislative session, addressing the following: ♦ Formation of the regional entity (including powers, legal form,
governance structure, ability to purchase property, and selected bylaw requirements). ♦ Modification of existing utilities’ service territory certificates, as necessary. ♦ Establishing direct privity with retail customers if the Retail Requirements Approach is adopted. ♦ Implementation of market structure changes (e.g., OATT and a competitive power procurement
process). ♦ Secure State financial assistance (e.g., grants or loans) for the development of regional generation and
transmission infrastructure (based upon results of the regional Integrated Resource Plan, once completed).
• Complete the formation of the new entity, including the following actions: ♦ Establish utility/state implementation team. ♦ Determine need for outside assistance. ♦ Revise start-up implementation plan.
• Develop initial regional Integrated Resource Plan and Transmission Expansion Plan. We have two important additional comments regarding the development of these two plans. First, it is very important that these initial regional plans be developed as soon as possible to identify the Railbelt region’s future fuels strategy and transmission expansion program. Second, as part of this effort, a formal public participation process should be established, providing for transparency and broad participation by stakeholders throughout the process. The Hawaii Electric Company has such a public participation process in place which we believe provides a good example of how such a process should be established.
• The Railbelt utilities and the State need to determine how to finance the formation of the new regional entity, and develop a process to manage this seed money.

SECTION 10 - NEXT STEPS AND IMPLEMENTATION PLAN ALASKA REGA STUDY
Black & Veatch 129 September 12, 2008
Start-up Implementation Plan Categories
• Overall Program
Management/Governance • Finalize Business Structure • Secure New Facility • Develop Business Policies,
Processes, and Procedures • Complete Operations
Transition Planning • HR and Recruiting • Complete Operations and
Economic Dispatch Transition • Complete Generation and
Transmission Planning Transition
• Develop IT Infrastructure • Develop Business Systems • Employee Training • Transition and Cutover
Execution • Other
• Develop a methodology for the allocation of the costs and benefits associated with the regional entity during the recommended ten-year transition period, consistent with the hold harmless philosophy.
Start-up Implementation Plan The actual formation of a new Railbelt regional entity, once the decision is made to form such an entity, involves a significant number of actions. These actions have been grouped into the following categories: • Overall Program Management/Governance
♦ Provide overall program management ♦ Provide utility management/Board oversight ♦ Provide administrative support ♦ Manage formation seed money
• Finalize Business Structure ♦ Finalize organizational roles and responsibilities ♦ Finalize legal form ♦ Form Board of Directors and related committees ♦ Develop initial guiding principles ♦ Develop bylaws ♦ Complete legal formation requirements ♦ Develop OATT and other required contracts ♦ Modify existing contracts, as required ♦ Develop strategy for establishing management team ♦ Implement required legislative and regulatory changes
• Secure New Facility ♦ Identify building requirements ♦ Complete initial layout design ♦ Secure and evaluate build/lease proposals ♦ Make build/lease decision ♦ Manage facility build out
• Develop Business Policies, Processes and Procedures, including: ♦ Systems operations ♦ Planning and engineering ♦ Legal and HR ♦ Financial and corporate services ♦ IT operations ♦ Finance and accounting ♦ Payroll and benefits ♦ Web site ♦ Document management
• Complete Operations Transition Planning ♦ Complete transition planning ♦ Plan, mobilize and manage transition program
• HR and Recruiting ♦ Implement HR policies and procedures ♦ Recruit new employees and transfer existing employees
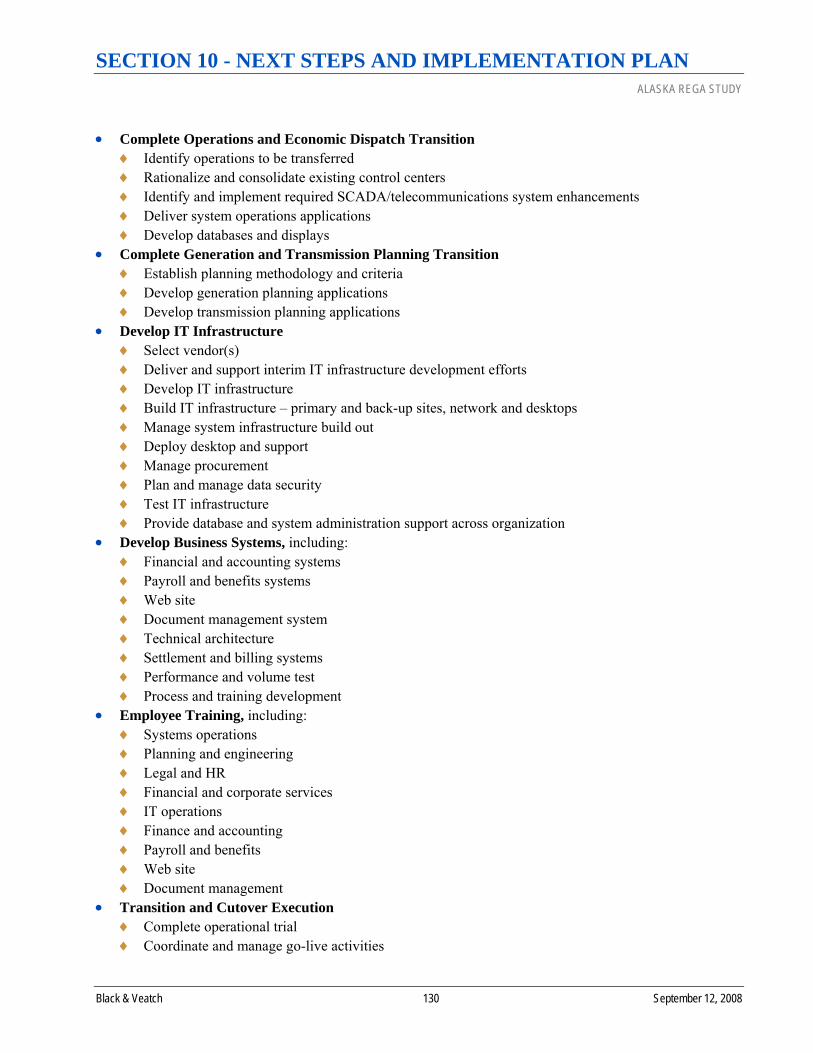
SECTION 10 - NEXT STEPS AND IMPLEMENTATION PLAN ALASKA REGA STUDY
Black & Veatch 130 September 12, 2008
• Complete Operations and Economic Dispatch Transition ♦ Identify operations to be transferred ♦ Rationalize and consolidate existing control centers ♦ Identify and implement required SCADA/telecommunications system enhancements ♦ Deliver system operations applications ♦ Develop databases and displays
• Complete Generation and Transmission Planning Transition ♦ Establish planning methodology and criteria ♦ Develop generation planning applications ♦ Develop transmission planning applications
• Develop IT Infrastructure ♦ Select vendor(s) ♦ Deliver and support interim IT infrastructure development efforts ♦ Develop IT infrastructure ♦ Build IT infrastructure – primary and back-up sites, network and desktops ♦ Manage system infrastructure build out ♦ Deploy desktop and support ♦ Manage procurement ♦ Plan and manage data security ♦ Test IT infrastructure ♦ Provide database and system administration support across organization
• Develop Business Systems, including: ♦ Financial and accounting systems ♦ Payroll and benefits systems ♦ Web site ♦ Document management system ♦ Technical architecture ♦ Settlement and billing systems ♦ Performance and volume test ♦ Process and training development
• Employee Training, including: ♦ Systems operations ♦ Planning and engineering ♦ Legal and HR ♦ Financial and corporate services ♦ IT operations ♦ Finance and accounting ♦ Payroll and benefits ♦ Web site ♦ Document management
• Transition and Cutover Execution ♦ Complete operational trial ♦ Coordinate and manage go-live activities
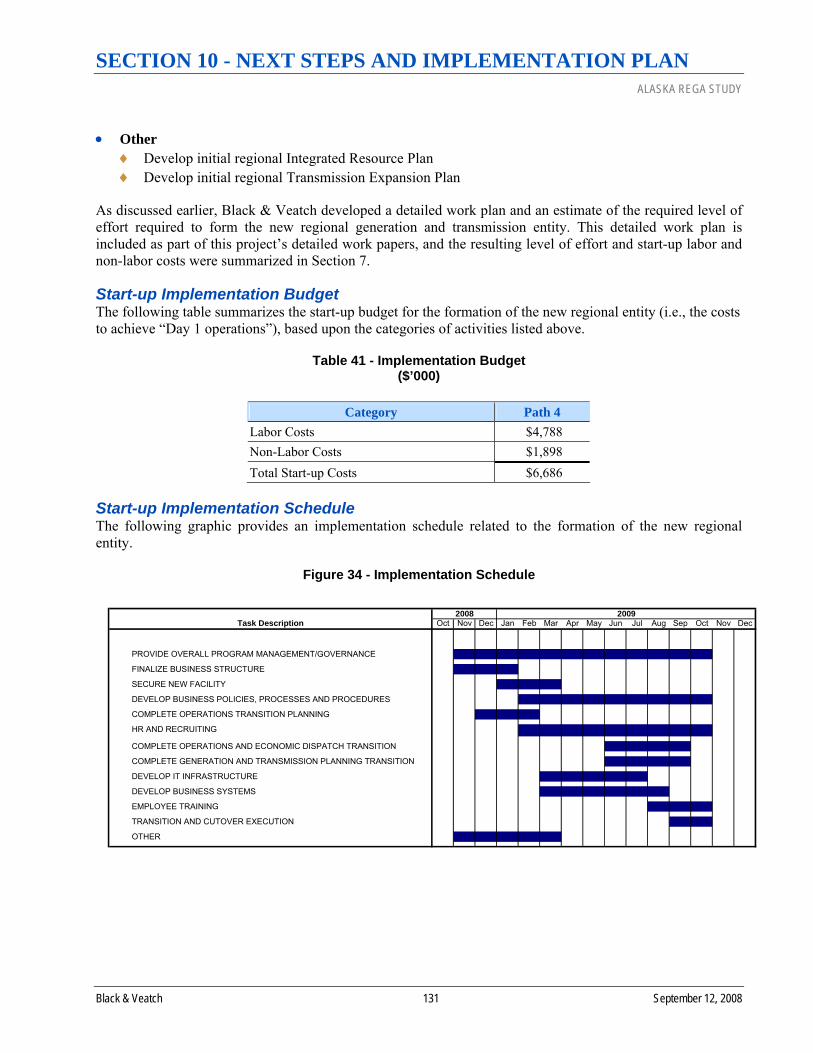
SECTION 10 - NEXT STEPS AND IMPLEMENTATION PLAN ALASKA REGA STUDY
Black & Veatch 131 September 12, 2008
• Other ♦ Develop initial regional Integrated Resource Plan ♦ Develop initial regional Transmission Expansion Plan
As discussed earlier, Black & Veatch developed a detailed work plan and an estimate of the required level of effort required to form the new regional generation and transmission entity. This detailed work plan is included as part of this project’s detailed work papers, and the resulting level of effort and start-up labor and non-labor costs were summarized in Section 7.
Start-up Implementation Budget The following table summarizes the start-up budget for the formation of the new regional entity (i.e., the costs to achieve “Day 1 operations”), based upon the categories of activities listed above.
Table 41 - Implementation Budget ($’000)
Category Path 4
Labor Costs $4,788 Non-Labor Costs $1,898 Total Start-up Costs $6,686
Start-up Implementation Schedule The following graphic provides an implementation schedule related to the formation of the new regional entity.
Figure 34 - Implementation Schedule
Task Description Oct Nov Dec Jan Feb Mar Apr May Jun Jul Aug Sep Oct Nov Dec
PROVIDE OVERALL PROGRAM MANAGEMENT/GOVERNANCE
FINALIZE BUSINESS STRUCTURE
SECURE NEW FACILITY
DEVELOP BUSINESS POLICIES, PROCESSES AND PROCEDURES
COMPLETE OPERATIONS TRANSITION PLANNING
HR AND RECRUITING
COMPLETE OPERATIONS AND ECONOMIC DISPATCH TRANSITION
COMPLETE GENERATION AND TRANSMISSION PLANNING TRANSITION
DEVELOP IT INFRASTRUCTURE
DEVELOP BUSINESS SYSTEMS
EMPLOYEE TRAINING
TRANSITION AND CUTOVER EXECUTION
OTHER
20092008

APPENDIX A ALASKA REGA STUDY
Black & Veatch A-1 September 12, 2008
APPENDIX A - NON-UTILITY STAKEHOLDER INPUT SURVEY INSTRUMENT

APPENDIX A ALASKA REGA STUDY
Black & Veatch A-2 September 12, 2008
Appendix A Non-Utility Stakeholder Input Survey Instrument
1. In your view, what are the key issues and uncertainties regarding the future of the Railbelt electrical grid?
2. What are the major future risks (e.g., loads, generation, technology, fuel supplies, etc.) facing the Railbelt utilities?
3. What are the major future opportunities (e.g., loads, generation, technology, fuel supplies, etc.) available to the Railbelt utilities?
4. It was mentioned during the Technical Conference that there have been previous studies of the Railbelt, but they are all “sitting on the shelf.” What was lacking in those studies that caused them to not be implemented?
5. What are the key elements that would make this study more valuable, successful and/or more likely to be implemented as compared to previous studies?
6. What material changes (e.g., generation, loads, transmission, costs, new projects, etc.) have occurred since previous studies that you believe could affect the results of this study? In your view, what actions have been taken by the Railbelt utilities, or other parties, since the previous studies? What actions have been successful, which have been unsuccessful?
7. How acceptable or desirable are coal and nuclear generation plants within the State? In your view, what are the major issues and challenges associated with the future use of coal and nuclear?
8. What carbon-related restrictions, taxes or fees should be established in Alaska?
9. What are your views regarding the resource potential and economics of demand-side management/energy efficiency programs within the Railbelt?
10. What are your views regarding the resource potential and economics of renewable energy technologies within the Railbelt?
11. What are your views regarding the resource potential for, and economics of, distributed generation programs within the Railbelt?
12. What are your views regarding the potential and economics of green pricing programs within the Railbelt?
13. Are there any market, legislative, or regulatory hurdles that negatively affect investments in energy efficiency and demand-side management programs, distributed generation technologies, renewable resources, and green pricing? If so, do you have any suggestions regarding how these hurdles should be addressed?
14. Are there any market, legislative, or regulatory hurdles that negatively affect the development of independent power projects? If so, do you have any suggestions regarding how these hurdles should be addressed?
15. If a separate organization was created to manage unified system operations of the Railbelt Electric Grid, what do you think its main responsibilities should be?

APPENDIX A ALASKA REGA STUDY
Black & Veatch A-3 September 12, 2008
16. What are your views regarding the costs, benefits and shortcomings of joint economic dispatch, regional integrated resource planning, joint project development and investment, and the formation of a power exchange, Independent System Operator and/or Regional Transmission Organization?
17. Please identify any business models related to joint economic dispatch; regional integrated planning; or joint power project development and delivery of energy efficiency and/or renewables programs, etc., which you believe should be considered. Please identify specific examples where possible.
18. What role do you believe the State, and agencies such as the Alaska Energy Authority, should play in the future related to matters affecting the Railbelt utilities and their customers? In particular, do you believe that the State should expand or dispose of its ownership and/or control of primary energy assets in the Railbelt?
19. Please provide any additional comments you might have.

APPENDIX B ALASKA REGA STUDY
Black & Veatch B-1 September 12, 2008
APPENDIX B - PROFILES OF EXAMPLE REGIONAL ORGANIZATIONS

APPENDIX B ALASKA REGA STUDY
Black & Veatch B-2 September 12, 2008
Appendix B Profiles of Example Regional Organizations
This appendix provides summary descriptions of selected existing regional entities grouped into the following categories: • State/Federal Power Authorities • G&T Cooperatives • Joint Action Agencies • Other types of regional generation and transmission organizations • Centralized energy efficiency organizations
Profiles of Example State/Federal Power Authorities
Bonneville Power Administration (BPA) BPA, headquartered in Portland, Oregon, is a federal agency under the U.S. Department of Energy. BPA was established in 1937 and serves the Pacific Northwest through operating an extensive electricity transmission system and marketing wholesale electrical power at cost from federal dams, one non-federal nuclear plant and other nonfederal hydroelectric and wind energy generation facilities. BPA aims to be a national leader in providing high reliability, low rates consistent with sound business principles, responsible environmental stewardship and accountability to the region.
BPA provides about half the electricity used in the Northwest and operates over three-fourths of the region’s high-voltage transmission.
While BPA is part of the Department of Energy, it is not tax-supported through government appropriations. Instead, BPA recovers all of its costs through sales of electricity and transmission and repays the U.S. Treasury in full with interest for any money it borrows.
System Data • Service area size (square miles): 300,000 • Transmission line (circuit miles): 15,190 • BPA substations: 259 • Employees (FTE): 2,896
BPA Customers • Cooperatives: 57 • Municipalities: 42 • Public utility districts: 29 • Federal agencies: 7 • Investor-owned utilities: 6 • Direct-service industries: 4 • Port districts: 1 • Tribal: 2 • Power marketers: 87 • Transmission customers: 339
APPENDIX B ALASKA REGA STUDY
Black & Veatch B-3 September 12, 2008
Board of Directors BPA does not have a Board of Directors. The organization consists of just an executive management team, that consists of the following: • Administrator • Deputy Administrator • Chief Operating Officer • Senior Vice President – Power Services • Senior Vice President – Transmission Services • Executive Vice President General Counsel • Executive Vice President Internal Business Systems • Executive Vice President CFO
Long Island Power Authority (LIPA)
Overview In May of 1998, LIPA became Long Island, New York’s primary electric service provider, operating as a non-profit entity. As a not-for-profit municipal electric utility, LIPA seeks to recover only enough money from its customers to cover its operating costs, maintain reserve accounts as required by good business practices, and for emergencies such as damage caused by a severe storm.
System Data • Electric revenues: $3.54 billion • Customers: 1.1 million • Square miles of service territory: 1,230
Board of Directors The LIPA organization consists of a Board of Trustees with a total of 13 members. The Chairman and Vice Chairman are appointed by the State Governor of New York. All remaining board members are either appointed by the State Governor, Senate Majority Leader, or Speaker of the Assembly. These members are also placed into four separate committees: Personnel & Compensation Committee, Finance & Audit Committee, Energy Efficiency and Environmental Committee and Governance Committee.
New York Power Authority (NYPA)
Overview NYPA is America’s largest state-owned power organization. It provides some of the lowest-cost electricity in New York State. They sell power to government agencies; to community-owned electric systems and rural electric cooperatives; to job-producing companies; to private utilities for resale—without profit—to their customers; and to neighboring states, under federal requirements.
The Power Authority has a long history. Governor Franklin D. Roosevelt established New York’s model for public power through legislation signed in 1931. This effort to secure public control of New York’s hydropower resources was the result of a bipartisan effort that began with Governor Charles Evans Hughes in 1907.
Today, the Power Authority serves as a non-profit, public-benefit energy corporation that does not use any tax revenue or state credit. NYPA finances construction of their projects through bond sales to private investors, repaying bondholders with proceeds from their operations.

APPENDIX B ALASKA REGA STUDY
Black & Veatch B-4 September 12, 2008
NYPA serves the following customers: • Over 700 businesses and industrial customers • 115 government entities in New York City and Westchester County • 47 municipal and four rural cooperative electric systems, municipal and utility service agencies • Public Agencies in seven neighboring states • The state’s six investor-owned utilities all purchase NYPA electricity which they sell to their customers • 188 non-profit health-care, educational and cultural institutions across the state including museums,
colleges and universities and hospitals
System Data • Operating revenues: $2.96 billion • Net assets: $2.27 billion • 18 generating facilities - hydropower and fossil-fueled • More than 1,400 circuit-miles of transmission lines
Board of Directors The NYPA organization consists of a Board of Trustees with a total of seven members. The Chairman of the board is elected by fellow trustees. Remaining board members are either selected by others on the panel, or in most cases is nominated by the State Governor and then approved by that New York State Senate. Trustees have a term of five years and can be re-appointed by the Governor.
Santee Cooper (aka, South Carolina Public Service Authority)
Overview Santee Cooper, also known as the South Carolina Public Service Authority, is South Carolina’s state-owned electric and water utility. The Santee Cooper Regional Water System began commercial operation in October 1994, treating water from Lake Moultrie as the source of water to customers served by the Moncks Corner Public Works Commission, city of Goose Creek, Summerville Commissioners of Public Works and Berkeley County Water and Sanitation Authority. Today, 125,000 end-users are the beneficiaries of this stable supply of one of life’s most precious commodities.
System Data • Serves over 155,000 residential and commercial electric customers in Berkeley, Georgetown and Horry
counties. • Generate the power distributed by the state’s 20 electric cooperatives to more than 625,000 customers in
all 46 counties. • More than 1.8 million South Carolinians receive their power directly or indirectly from Santee Cooper.
Tennessee Valley Authority (TVA)
Overview The Tennessee Valley Authority is a federal corporation and the nation’s largest public power company. As a regional development agency, TVA supplies affordable, reliable power, supports a thriving river system, and stimulates sustainable economic development in the public interest. TVA operates fossil-fuel, nuclear, and hydropower plants, and also produces energy from renewable sources. It manages the nation’s fifth-largest river system to minimize flood risk, produce power, maintain navigation, provide recreational opportunities, and protect water quality in the 41,000-square-mile watershed.
TVA operates in 7 states: Alabama, Georgia, Kentucky, Mississippi, North Carolina, Tennessee and Virginia.

APPENDIX B ALASKA REGA STUDY
Black & Veatch B-5 September 12, 2008
TVA has revenues of over $9 billion a year from sales to its three customer groups. It receives no public tax dollars but finances all of its programs, including those for environmental protection, integrated river management, and economic development, through power sales and the sale of bonds in the financial markets. The total amount of outstanding bonds and banknotes represents TVA’s debt. All of its programs are paid for with power revenues.
TVA consists of a nine-member TVA Board of Directors which sets policy and strategy for TVA. The members are nominated by the President and confirmed by the U.S. Senate to serve five-year terms.
System Data • Provides wholesale power to 159 municipal and cooperative power distributors, and by directly serving
53 large industries and government installations in the Valley. • Transmission system serves some 8.7 million residents in an 80,000-square-mile area spanning portions
of seven states • Supplies the electricity needs of 8.7 million people • Eleven coal-fired plants, 15,075 megawatts • Six combustion turbine plants, 6,003 megawatts • Three nuclear plants, 6,900 megawatts • Twenty-nine hydroelectric dams • One pumped-storage plant
Board of Directors In accordance with the TVA Act, the Board of Directors consists of nine members appointed by the President of the United States by and with the advice and consent of the United States Senate. The Board of Directors selects one of its members to serve as Chairman of the Board.
Profiles of Example G&T Cooperatives
Alabama Electric Cooperative (PowerSouth)
Overview PowerSouth Energy Cooperative, headquartered in Andalusia, Alabama, is a G&T cooperative that provides the wholesale power needs of 20 distribution members — 16 electric cooperatives and four municipal electric systems — in Alabama and northwest Florida. PowerSouth provides electric energy to nearly 400,000 consumers in 39 Alabama counties and 10 Florida counties. The company was known as Alabama Electric Cooperative prior to January 1, 2008.
PowerSouth has a combined generating capacity of more than 1,600 MWs, from their six generating facilities throughout Alabama. The generating mix consists of natural gas, coal, and hydroelectric facilities. PowerSouth also utilizes long-term purchased power agreements with other utilities to ensure an economic and reliable power supply for our members.
PowerSouth’s distribution members vary in size, number of employees and service area characteristics. While PowerSouth’s distribution members serve primarily rural areas, the service areas of some extend into rapidly expanding suburban areas.
Board of Directors PowerSouth is owned by its 20 distribution members, who govern and set policy through a 40-member Board of Trustees composed of two voting delegates from each distribution system. The President and Chief Executive Officer and his staff carry out the daily management of PowerSouth.

APPENDIX B ALASKA REGA STUDY
Black & Veatch B-6 September 12, 2008
PowerSouth has five operating divisions: Power Delivery, Power Supply, Financial Services, External Affairs, and Legal & Corporate Affairs.
System Data
Transmission Lines in Service: • 46 kV – 681 miles • 115 kV - 1,350 miles • 230 kV – 183 miles • Total - 2,214 miles
Substations (PowerSouth and Member-owned): 283
Employees: 554
Total consumers served: 397,129
Financial Data ($’000): • Assets: $1,217,120 • Net Sales: $617,661 • Net Margins: $14,427
Sales Composition: • Distribution Cooperatives: 84% • Municipalities: 6% • Other: 10%
Arkansas Electric Cooperative Corporation (AECC)
Overview AECC is based in Little Rock and provides power for about 460,000 members of Arkansas’ 17 electric distribution cooperatives. AECC has assets of about $1.1 billion and annual energy sales of about $468 million. AECC provides power to its 17 electric distribution cooperative members through its diverse generation assets, which include three hydroelectric plants; three natural gas/oil-fired plants and two natural gas-fired-only plants. AECC also co-owns portions of three coal-fired plants.
AECC was created in 1949 to provide Arkansas’ distribution cooperatives with a reliable and affordable power supply. At the time, the cooperatives were faced with rising electricity costs and shrinking power supplies. Although the cooperatives had built their own distribution systems they had not built power plants and were prohibited by state law from doing so.
System Data • Generation resources: 2,977 MW • Annual energy sales: 11.6 million MWh • Operating revenues: $518 million • Assets: $1.13 billion • Employees: 212
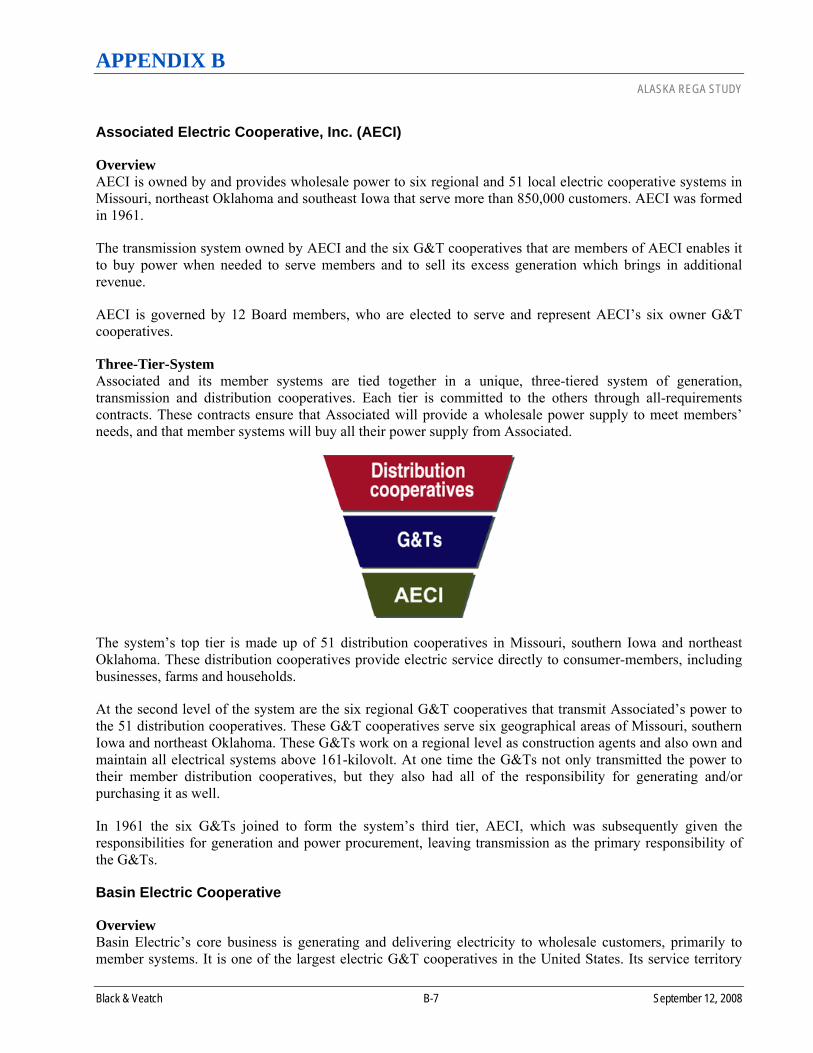
APPENDIX B ALASKA REGA STUDY
Black & Veatch B-7 September 12, 2008
Associated Electric Cooperative, Inc. (AECI)
Overview AECI is owned by and provides wholesale power to six regional and 51 local electric cooperative systems in Missouri, northeast Oklahoma and southeast Iowa that serve more than 850,000 customers. AECI was formed in 1961.
The transmission system owned by AECI and the six G&T cooperatives that are members of AECI enables it to buy power when needed to serve members and to sell its excess generation which brings in additional revenue.
AECI is governed by 12 Board members, who are elected to serve and represent AECI’s six owner G&T cooperatives.
Three-Tier-System Associated and its member systems are tied together in a unique, three-tiered system of generation, transmission and distribution cooperatives. Each tier is committed to the others through all-requirements contracts. These contracts ensure that Associated will provide a wholesale power supply to meet members’ needs, and that member systems will buy all their power supply from Associated.
The system’s top tier is made up of 51 distribution cooperatives in Missouri, southern Iowa and northeast Oklahoma. These distribution cooperatives provide electric service directly to consumer-members, including businesses, farms and households.
At the second level of the system are the six regional G&T cooperatives that transmit Associated’s power to the 51 distribution cooperatives. These G&T cooperatives serve six geographical areas of Missouri, southern Iowa and northeast Oklahoma. These G&Ts work on a regional level as construction agents and also own and maintain all electrical systems above 161-kilovolt. At one time the G&Ts not only transmitted the power to their member distribution cooperatives, but they also had all of the responsibility for generating and/or purchasing it as well.
In 1961 the six G&Ts joined to form the system’s third tier, AECI, which was subsequently given the responsibilities for generation and power procurement, leaving transmission as the primary responsibility of the G&Ts.
Basin Electric Cooperative
Overview Basin Electric’s core business is generating and delivering electricity to wholesale customers, primarily to member systems. It is one of the largest electric G&T cooperatives in the United States. Its service territory
APPENDIX B ALASKA REGA STUDY
Black & Veatch B-8 September 12, 2008
spans 430,000 square miles from the Canadian to the Mexican border (KMH to verify). Basin Electric consists of 125 member systems distributing electricity to 2.5 million consumers in parts of North Dakota, South Dakota, Wyoming, Colorado, Minnesota, Iowa, Nebraska, Montana, and New Mexico.
In 1961, Upper Midwest rural electric cooperatives incorporated Basin Electric to plan, design, construct and operate generation and transmission facilities required to meet future electricity needs of their member-owners. Today, Basin Electric’s members distribute electricity to 2.5 million customers.
Basin Electric owns 2,595 MW and operates 3,508 MW of electric generating capacity of which 953 MW is for participants of the Missouri Basin Power Project (MBPP), and 80 MW is jointly owned by Basin Electric and its Class D member, Corn Belt Power Cooperative in Humboldt, Iowa. Its electric generation facilities are located in North Dakota, South Dakota, Wyoming and Iowa.
Basin Electric has eight subsidiaries, including two major subsidiaries, Dakota Gasification Company and Dakota Coal Company. Basin Electric and its subsidiaries employ more than 1,800 employees.
Basin Electric has a 10-member Board of Directors elected by the system membership. The directors have been elected to the boards of their local distribution systems and then, with the exception of Districts 9 and 10, to their respective intermediate G&T cooperative systems.
Basin Electric is a not-for-profit cooperative; as such any electric revenues in excess of cost of service, referred to as margins, are returned to its members on a patronage basis. Such margins are often retained for a period to provide working capital.
The qualifications for membership and the rights and obligations of the four classes of membership (Class A, Class B, Class C and Class D) are provided by law and established in the corporate bylaws.
Three-Tier System Basin Electric is part of a three-tier delivery system. It sells wholesale power to its Class A members and others. The Class A members sell power to their distribution cooperatives (Basin Electric classifies distribution cooperatives as Class “C” members) who, in turn, sell power to retail customers. There are also special membership categories entitled Class B and Class D.
Buckeye Power, Inc. In 1959, Ohio’s electric cooperatives formed Buckeye Power. It was established as a statewide G&T cooperative with the objective of obtaining a power-producing facility.
Three years later, representatives of Buckeye Power and American Electric Power (AEP), parent company of Ohio Power, started discussions about working together. The final agreement to build the Cardinal Station was announced Oct. 28, 1963. It provided that Buckeye Power and Ohio Power would join to build the 1,200 MW facility, which at the time made it the world’s largest and most efficient coal-fired power plant. AEP would build and operate the station and each company would own one of the 600 MW units. Buckeye’s surplus capacity would be made available to Ohio Power at cost through a banked power agreement, under which Buckeye is able to buy back the capacity as it needs it.
Cardinal Unit 2 went on line in July 1967 and almost a year later, it became the property of Buckeye Power. Buckeye’s share of the project cost was $62 million, all financed without federal REA funds.
As the population of the state continued to grow in the 1960s and 1970s, so did the demand for electricity. In 1977, Buckeye added Cardinal Unit 3 to its inventory, adding another 630 MW of capacity.

APPENDIX B ALASKA REGA STUDY
Black & Veatch B-9 September 12, 2008
Today, there are 25 electric distribution cooperatives serving members in Ohio.
Dairyland Power Cooperative With headquarters in La Crosse, Wisconsin, Dairyland Power Cooperative is a G&T cooperative that provides the wholesale electrical requirements and other services for 25 electric distribution cooperatives and 19 municipal utilities in the Upper Midwest. In turn, these cooperatives and municipals deliver the electricity to consumers, meeting the energy needs of nearly 600,000 people.
In 1938, 10 northern Wisconsin electric cooperatives created the Wisconsin Power Cooperative and Tri-State Power Cooperative was formed by five southern Wisconsin electric cooperatives. In 1941, Tri-State and Wisconsin Power Cooperative merged to create Dairyland Power Cooperative.
Today, Dairyland’s generating stations, which include coal, hydroelectric, natural gas, landfill gas, and animal waste) have more than 1,100 MW capacity. It delivers electricity via more than 3,100 miles of transmission lines and nearly 300 substations located throughout the system’s 44,500 square mile service area.
Dairyland’s service area encompasses 62 counties in Wisconsin, Minnesota, Iowa and Illinois. The following provides additional information regarding Dairyland’s operations: • Dairyland member systems: 25 • Total member-consumer meters: 255,745 • Municipal customers: 19 • Approximate population served: 575,000 • Peak demand: 887 MW • Power sales: 6.12 billion kWh • Total operating revenue: $284 million • Margins: $11.8 million • Total assets: $946 million • Owned generation capacity:
♦ Coal: 979 MW ♦ Hydroelectric: 24 MW ♦ Natural gas/oil: 94 MW
• Other generation capacity: ♦ Landfill gas: 11 MW ♦ Manure digesters: 2 MW ♦ Wind: 18 MW ♦ Diesel: 92 MW
• Miles of transmission line: 3,111 • Substations: 294 • Employees: 599
East Kentucky Power Cooperative (EKPC)
Overview In 1941 Kentuckians launched several not-for-profit distribution cooperatives. They got together and formed EKPC to make and supply the energy that these distribution cooperatives needed.
The member cooperatives set up EKPC as a not-for-profit G&T cooperative with headquarters in Winchester, Kentucky. EKPC’s purpose is to generate energy and transmit it to cooperatives that distribute it to retail

APPENDIX B ALASKA REGA STUDY
Black & Veatch B-10 September 12, 2008
customers. Today, EKPC provides wholesale energy and services to 16 distribution cooperatives through power plants and more than 2,800 miles of transmission lines. The distribution cooperatives supply energy to 503,000 Kentucky homes, farms, businesses and industries across 87 counties.
Each of the 16 distribution cooperatives own EKPC and they have representatives on EKPC’s board.
System Facts EKPC supplies electricity through three coal-fired stations: H.L. Spurlock Power Station located near Maysville; John Sherman Cooper Power Station located near Somerset; and William C. Dale Power Station, located near Winchester.
There are also natural gas combustion turbines at J.K. Smith Station, located in Trapp, near Winchester.
EKPC also obtains about 170 MW of hydroelectric power through arrangements with Laurel and Wolf Creek dams and the federal Southeastern Power Administration.
Hoosier Energy Rural Electric Cooperative, Inc. Hoosier Energy is a G&T cooperative providing wholesale electric power and services to 17 member electric distribution cooperatives in 48 central and southern Indiana counties and it provides electricity and related services to nearly 700,000 residents, businesses, industries and farms in a 15,000 square mile service territory in the southern half of Indiana.
With headquarters in Bloomington, Indiana, Hoosier Energy operates two coal-fired electric power production facilities: the 1,070 MW Merom Generating Station and the 250 MW Ratts Generating Station. Additionally, Hoosier owns a 174 MW peaking plant at Worthington and a 258 MW natural gas-fired generating facility, located on a 50 acre site between Bedford and Mitchell in Lawrence County.
High-voltage electric power is delivered over a system of 1,400 miles of transmission lines, 14 primary substation facilities and more than 200 distribution substations and delivery points.
KAMO Electric Cooperative, Inc. KAMO, with headquarters in Vinita, Oklahoma, is a G&T cooperative serving 17 member distribution cooperatives in northeast Oklahoma and southwest Missouri. KAMO is one of six G&T utilities that own Associated Electric Cooperative, Inc. (AECI). AECI provides the capacity and energy needs for KAMO and the other five G&Ts.
KAMO’s annual sales to members exceed 5,000,000 MWhs, which represents approximately 290,000 member-owners.
South Mississippi Electric Power Association South Mississippi Electric is a non-profit G&T cooperative which generates, transmits and sells electric energy on a wholesale basis to 11 member distribution cooperatives. These 11 member systems own and maintain approximately 54,500 miles of distribution line and provide service to more than 405,000 meters in 56 counties in Mississippi.
In 1941 there were 24 cooperatives formed within the state. With no generating facilities, the rural distribution cooperatives purchased wholesale power from investor-owned utilities. The differing philosophies between the non-profit distribution cooperatives and the profit-oriented, investor-owned utilities led to the formation of South Mississippi Electric Power Association.

APPENDIX B ALASKA REGA STUDY
Black & Veatch B-11 September 12, 2008
In April 1941, seven electric power associations chartered South Mississippi Electric. The Association employs more than 290 employees.
The base load generating fleet of South Mississippi Electric includes a coal-fired plant near Purvis and a 10 percent undivided interest in the Grand Gulf Nuclear Station in Port Gibson. Gas- and/or fuel oil-fired generation equipment includes units near Moselle and a total of eight combustion turbine units located at Sylvarena, Silver Creek, Benndale, and Paulding, utilized as generating capacity to meet peak demand.
Western Farmers Electric Cooperative (WFEC) In existence for over 65 years, WFEC has grown into Oklahoma’s largest locally-owned power supply system. WFEC is a G&T cooperative that provides essential electric service to 19 member-owner cooperatives, Altus Air Force Base, and other power users.
WFEC was organized in 1941 when western Oklahoma rural electric distribution cooperatives were unable to secure an adequate power supply at rates the farmers and rural industrial developers could afford.
The incorporators provided for individual rural electric distribution cooperatives to petition for membership. On April 25, 1941, the cooperative approved the membership of six cooperatives. These six members were joined by four other cooperatives later that year. Eight eastern Oklahoma rural electric distribution cooperatives joined WFEC in 1968, bringing the total number of member-owners to 19.
With three generating plants located at Mooreland, Anadarko and Hugo, WFEC has total power capacity of more than 1,400 MWs when the purchased hydropower is included. Today WFEC supplies the electrical needs of more than two-thirds of rural Oklahoma.
Profiles of Example Joint Action Agencies
American Municipal – Ohio (AMP-Ohio) States: Ohio, Pennsylvania, West Virginia, Virginia and Michigan Year Established: 1971 Number of Members: 81 Member Types: 81 public power communities in Ohio, 27 in Pennsylvania, two in West Virginia, four in Virginia and seven in Michigan
Organizational Structure The AMP-Ohio Board of Trustees consists of 16 communities. Eight of these trustee communities are selected by their fellow public power communities in each of eight service areas of the organization. The other eight are elected at large. Various Board of Trustees committees concentrate on vital functions of the organization. Current committees include: Baseload Generation, Board Oversight, By-laws Review, Finance, Generation/Clean Air, Gorsuch Station Project, Green Power Development, Joint Ventures Oversight, Legislative, Member Services, Mutual Aid, Nominating, Non-electric, Personnel, Policy, Power Supply and Generation, Scholarship, and Transmission/RTO.
Coordination Efforts AMP-Ohio has a control center that on a daily basis manages the full load requirements of the Northeast AMP-Ohio Service Group, Northwest AMP-Ohio Service Group and 11 members of the Western AMP-Ohio Service Group. The center also performs the same duties for individual cities in Ohio and Pennsylvania. Power coordinators also remotely operate the distributed generation units of AMP-Ohio and three joint ventures as needed. Through its SCADA Department, AMP-Ohio can also provide supervisory control and data acquisition services for member communities that are installing, upgrading or performing maintenance on their own systems.

APPENDIX B ALASKA REGA STUDY
Black & Veatch B-12 September 12, 2008
Blue Ridge Power Agency (BRPA) State: Virginia Year Established: 1988 Number of Members: 10 Member Types: Seven municipalities, one state institution and two electric cooperatives
Organizational Structure BRPA operates under the direction of its Board of Directors, to which each member appoints one Director and one or more Alternate from its organization. The ultimate goal of the organization is to pursue activities that will insure the most reliable and lowest cost wholesale electric power supplies possible for its members.
Coordination Efforts BRPA provides a number of services to its wholesale and/or retail power supply, energy and transmission services and/or facilities procurement, contract negotiation, contract administration, consolidated billing, state and federal regulatory support and litigation, state and federal legislation, and joint purchasing.
Delaware Municipal Electric Corp. (DEMEC) State: Delaware Year Established: 1979 Number of Members: 9 Member Types: Municipal utilities
Organizational Structure DEMEC is governed by a nine-member Board of Directors, with one director from each of the nine member municipal electric utilities. The responsibility for day-to-day operations of the Agency resides with a President appointed by the Board. The President directs the efforts of staff members and various contractors in place to meet the service requirements of the members.
Coordination Efforts In addition to power supply, DEMEC provides legal and technical consulting services to its members, as well as representation in the federal and regional arenas regarding electric industry regulation and operation. DEMEC also provides its members with the benefits of joint and combined buying power and negotiating strength. It also assists member utilities in customer retention, economic development, customer education, system improvements and technical information sharing efforts for improved operating efficiency in their individual systems.
Florida Municipal Power Agency (FMPA) State: Florida Year Established: 1978 Number of Members: 30 Member Types: Municipal electric utilities
Organizational Structure Each member appoints one representative to FMPA’s Board of Directors, which governs the Agency’s activities. Due to the diverse needs of the 30 municipal electric systems, FMPA was established as a project-oriented agency. Under this structure, each member has the option whether or not to participate in a project. Members may join more than one project; however, each project is independent from the others, so no revenues or funds available from one project can be used to pay the costs of another project.

APPENDIX B ALASKA REGA STUDY
Black & Veatch B-13 September 12, 2008
Coordination Efforts FMPA has five power supply projects and one pooled financing project. The Agency supplies all the power needs for 15 of its members and some of the power needs for five of its members. Some members do not currently participate in a project. FMPA supplies more than 40% of its members’ power needs. They also offer additional members services, including: joint purchase and contract services, safety-related services, environmental services, energy conservation and customer service programs, T&D-related services, as well as training and workshops, information systems services, and utility rate services.
Illinois Municipal Electric Agency (IMEA) States: Illinois Number of Members: 31 Member Types: Municipalities that own and operate their own electric generation and/or distribution system
Organizational Structure IMEA is governed by a Board of Directors, with one director representing each member community. The Board members are appointed by the mayors and confirmed by the individual municipal governing bodies. An Executive Board is elected annually from the full board. The Executive Board’s job is to review policies and make recommendations to the full board for its consideration. A professional staff handles day-to-day operations.
Coordination Efforts IMEA’s primary function is to provide power supplies to its members. IMEA also provides engineering, communications, and economic development services, including engineering consultation, state and federal legislative lobbying, load retention and new business location services, and various communications programs.
Indiana Municipal Power Agency (IMPA) State: Indiana Year Established: 1980 Number of Members: 51 Member Types: Cities and towns that operate their own electric distribution systems and purchase generation and transmission service from IMPA
Organizational Structure IMPA consists of a Management Team and Board of Commissioners. There are also are staff members that coordinate the following areas: Power System Coordination, Planning Engineering & Operations, Finance, and Member Services and Administration.
Coordination Efforts IMPA provides its member systems with generation and transmission services, as well as power supply planning, engineering, economic development, government relations and communications services. IMPA uses a portfolio of generating resources to meet the power supply needs of its member systems. This includes a combination of IMPA- and member-owned generation with long-term, firm power purchases and some seasonal market purchases.
Louisiana Energy Power Authority (LEPA) State: Louisiana Year Established: 1979 Number of Members: 18 Member Types: Consists of Louisiana cities and towns, each maintaining its own independent municipal power system
APPENDIX B ALASKA REGA STUDY
Black & Veatch B-14 September 12, 2008
Organizational Structure LEPA has a Board of Directors that consists of 18 individuals, one from each member, and a staff of 12.
Coordination Efforts Since 1989, LEPA has entered into all-requirements power contracts with many of its members and has coordinated the operation of its generation and transmission system through the use of a Energy Control Center.
Massachusetts Municipal Wholesale Electric Company (MMWEC) State: Massachusetts Year Established: 1969 Number of Members: 25 Member Types: Of the 40 municipal utilities in Massachusetts, 25 are Members of MMWEC and 28 are MMWEC project participants
Organizational Structure MMWEC is governed by a 12-member Board of Directors. Seven of the directors are managers or commissioners of MMWEC Member utilities elected by the membership. Two directors are appointed by the Governor of Massachusetts, and three representatives are appointed by the governing bodies of the towns of Hampden, Ludlow and Wilbraham to vote on matters affecting their respective towns.
Coordination Efforts MMWEC provides wholesale power supply, financial and other services to its members. It also provides numerous power supply-related services, including power supply forecasting and planning, project and contract development, power supply and demand management, and a range of services facilitating municipal utility participation in wholesale power markets. MMWEC also provides a variety of financial services, including bond issuance, money management, treasury, accounting and budgeting services. Other services include engineering and project operations, risk management, information systems and business services, as well as legal, regulatory and litigation support.
Michigan Public Power Agency (MPPA) State: Michigan Year Established: 1978 Number of Members: 14 Member Types: Municipal electric utilities
Organizational Structure MPPA’s Board of Commissioners consists of one representative and up to two alternates from each member city. They are appointed by their respective municipal utility.
Coordination Efforts MPPA provides economic benefits to its 14 municipal members and is involved in joint ownership of electrical generating plants and transmission facilities, as well as the pooling of utility resources.
Missouri River Energy Services (MRES) States: Iowa, Minnesota, North Dakota and South Dakota Year Established: 1965 Number of Members: 60 Member Types: Local electric utilities
APPENDIX B ALASKA REGA STUDY
Black & Veatch B-15 September 12, 2008
Organizational Structure MRES is governed by a 13-member Board of Directors who are elected by and from the ranks of our member representatives.
Coordination Efforts MRES provides energy supplies to its members and associates, as well as the following additional services: review of engineering work, large retail customer retention and marketing programs, new business opportunities coordination, retail rate studies, Integrated Resource Plan preparation, distribution maintenance services, cost unbundling services, participation and intervention in pertinent state and federal cases, load forecasting, long-term power and energy planning, transmission services and contract negotiations, training and education, and active monitoring and advocacy of relevant state and national legislation.
Additional Information MRES was the first multi-state joint action agency, and the third overall, to be established in the United States.
Northern California Power Agency (NCPA) State: California Year Established: 1968 Number of Members: 17 member communities and districts in northern and central California Member Types: Municipalities, rural electric cooperatives, irrigation districts and other publicly-owned entities interested in the purchase, aggregation, scheduling and management of electrical energy
Organizational Structure NCPA is organized into four separate business units: Power Management, Generation Services, Finance & Administrative Services, and Legislative & Regulatory.
Coordination Efforts NCPA provides scale and skill economies devoted to the purchase, generation, transmission, pooling and conservation of electrical energy and capacity for its members. With the onset of electric utility restructuring, the Agency has become a primary supplier of power scheduling and interchange management services to power marketers and public agencies.
Additional Information Following the passage of Assembly Bill 1890 in 1996, all California utilities were required to set aside a portion of their gross revenues for various community and environmental programs, including renewable energy programs. Every single one of NCPA’s members’ local governing bodies has adopted Renewable Portfolio Standards (RPS) that are tailored to their individual communities.
Piedmont Municipal Power Agency (PMPA) State: South Carolina Year Established: 1979 Number of Members: 10 Member Types: Municipal utilities
Organizational Structure PMPA is governed by a Board of Directors, which consists of one director and one alternate from each member that are appointed by the elected city councils or utility commissions governing the local utilities.

APPENDIX B ALASKA REGA STUDY
Black & Veatch B-16 September 12, 2008
Coordination Efforts PMPA provides wholesale electric service to its Members primarily through a 25 percent ownership interest in the Catawba Nuclear Station, located in York County, South Carolina. PMPA also provides its Member utilities with other services such as PowerPartners, which is a DSM program that helps to postpone the need for building new generating facilities. PMPA also provides a forum for collaborative, long-range planning that benefits its Member utilities and legislative support.
Southern California Power Authority (SCPA) State: California Year Established: 1980 Number of Members: 12 Member Types: 11 municipal utilities and 1 irrigation district
Organizational Structure The SCPPA Board of Directors consists of three committees: 1) Finance Committee, which is responsible for reviewing all financial matters that come before the Board, 2) Public Benefits Committee, which serves as an association of SCPPA member utility staff in charge of public benefits fund administration, pursuant to Assembly Bill 1890, and 3) Magnolia Coordinating Committee, which consists of representatives of the Magnolia Project participants and is responsible for governing the Project, through the approval of budgets, construction and operating plans and major contracts. The recently completed Magnolia Power Project is a clean, high-efficiency, combined-cycle unit on three acres of the Burbank Water & Power generating station complex adjacent to Magnolia Boulevard.
Coordination Efforts SCPPA was formed to finance the acquisition of generation and transmission resources for its members. Currently, SCPPA has three generation projects and three transmission projects, which bring power from Arizona, New Mexico, Utah, and Nevada. SCPPA members deliver electricity to approximately two million customers over an area of 7,000 square miles. SCPA’s role has evolved over the years to include legislative advocacy at the state and national levels, and cooperative efforts to reduce member costs and improve efficiency.
Profiles of Other Types of Regional Generation and Transmission Organizations
American Transmission Company (ATC) ATC started business in January 2001 as the first multi-state, transmission-only utility in the United States solely focused on transmission.
ATC was formed as a result of the provisions of the Reliability 2000 legislation contained in Wisconsin Governor Tommy Thompson’s 1999-2001 budget. Under the new law, major Midwest utilities were encouraged to combine their high-voltage transmission lines and related facilities to form an independent transmission company. ATC manages the systems, develops solutions for reliability challenges, and provides fair and open access to transmission facilities.
The formation of ATC was made possible by a combination of 28 utilities, municipalities, municipal electric companies and electric cooperatives from Wisconsin, Michigan and Illinois that have invested transmission assets or money for an ownership stake in ATC and are now equity owners in ATC.
ATC provides high voltage transmission service to utilities and retail electric cooperatives. ATC does not own distribution or generation facilities, which remain with the participating utility companies, who obtain transmission service from ATC.
APPENDIX B ALASKA REGA STUDY
Black & Veatch B-17 September 12, 2008
ATC is also a transmission-owning member of the Midwest Independent System Operator (MISO) and the Mid-American Interconnected Network (MAIN).
ATC is regulated by FERC for rates and tariff, and regulated by the states of Michigan, Illinois and Wisconsin for siting transmission infrastructure.
ATC operates the electric transmission system from two system operations centers. From these centers, they monitor and operate the flow of electricity over 9,081 miles of transmission lines and through 480 electric substations in its service area.
ElectriCities
Overview ElectriCities is a not-for-profit government service organization formed back in 1965 to protect the interests of public power customers, and to provide a unified voice to speak out in the North Carolina legislature. Electricities is financed through membership fees and dues, as well as through rate and service revenue and tuition from training programs and workshops.
ElectriCities is a service organization, not a power supplier. Fifty-one of its members receive their electricity from their participation in one of the State’s two Power Agencies (North Carolina Municipal Power Agency Number 1, NCMPA1, and North Carolina Eastern Municipal Power Agency, NCEMPA). Other members purchase power from investor-owned utilities such as Duke Power and Carolina Power & Light or from other power suppliers like the cooperatives.
ElectriCities provides management services to both Power Agencies, a sharing arrangement that prevents duplication in costs, including: 1) representation and advocacy for the members and their customers in the legislative and regulatory processes, and 2) information, expertise and other resources that enhance the members’ ability to meet or exceed the expectations of the communities they serve.
The Power Agencies provide: 1) economic and reliable generation and transmission services that enable the members to meet the needs of their customers, and 2) additional opportunities that enhance the Members’ ability to provide excellent services to their customers.
Board of Directors ElectriCities is governed by a 14-member board of directors elected by the membership. The Board consists of 12 members from Power Agency cities and two from cities not affiliated with the power agencies.
International Transmission Company (ITC) ITC is in the business of transmitting high-voltage electricity throughout southeastern Michigan, supplying the gateway for energy delivery to the Midwest and Canada. ITC began operations in March 2003.
ITC’s service territory covers approximately 7,600 square miles throughout 13 counties in Michigan, including the metropolitan areas of Detroit and Ann Arbor, which have a population of approximately 4.9 million. ITC’s facilities include approximately 2,700 circuit miles of overhead and underground transmission lines, 17,000 towers and poles, and 155 stations and substations connecting our facilities. ITC also owns and manages the Michigan Electric Power Coordination Center (MEPCC) located in Ann Arbor, Michigan. Corporate headquarters is located in Novi, Michigan.
History In 1994, the Michigan Public Service Commission (MPSC) issued an order outlining a limited program that would allow customers to choose alternate suppliers of generation for the territories covered by Detroit
APPENDIX B ALASKA REGA STUDY
Black & Veatch B-18 September 12, 2008
Edison and Consumers Energy. This was the first step towards implementing electric retail choice in Michigan.
Two years later, FERC issued Order No. 888, directing utilities to file OATTs, breaking the host utility’s monopoly on the transmission system and allowing any electric marketer to use the host utility’s transmission lines for a cost-based fee.
Later that year, Detroit Edison and Consumers Energy, which had been working in partnership through the MEPCC, applied for and received approval from FERC for a joint OATT. This ensured that only a single rate would be charged for transmission throughout most of Michigan’s Lower Peninsula.
In November 1999, ITC was created as an independently functioning business unit within Detroit Edison. This was the first step in the formation of a truly independent, stand-alone transmission company. In May 2000, ITC, Detroit Edison and DTE Energy filed a joint application with FERC, seeking permission to transfer all jurisdictional transmission assets from Detroit Edison to ITC. This permission was granted in June 2000.
In June 2001, ITC began operations as a wholly-owned subsidiary of DTE Energy. In December of that year, ITC joined the MISO, a FERC-approved regional transmission organization.
In December 2002, DTE announced an agreement to sell ITC to affiliates of Kohlberg Kravis Roberts & Co. (KKR) and Trimaran Capital Partners L.L.C. for $610 million. The FERC order approving this sale was issued in February 2003.
In April 2004, ITC became a stand-alone transmission company following the sale of transmission assets from DTE Energy.
Recently, ITC’s parent company, ITC Holdings Corp., acquired the Michigan Electric Transmission Company, LLC (METC). Together, ITC and METC will have responsibility over majority of the transmission system in Michigan’s Lower Peninsula and for improving the transmission infrastructure.
Lower Colorado River Authority (LCRA)
Overview LCRA plays a variety of roles in Central Texas: delivering electricity, managing the water supply and environment of the lower Colorado River basin, developing water and wastewater utilities, providing public recreation areas, and supporting community and economic development.
LCRA is a conservation and reclamation district created by the Texas Legislature in 1934. It has no taxing authority and operates solely on utility revenues and fees generated from supplying energy, water and community services.
System Data • Electric service area: 29,809 square miles, covering all or part of 53 counties • More than 3,300 miles of transmission lines • Manages water supplies along a 600-mile stretch • Operates six dams on the Colorado River • Regulates water discharges to manage floods, and releases water for sale to municipal, agricultural and
industrial users • Owns or operates 16,614 acres of parks and recreational areas

APPENDIX B ALASKA REGA STUDY
Black & Veatch B-19 September 12, 2008
Utah Associated Municipal Power Systems (UAMPS) Utah Associated Municipal Power Systems is a governmental cooperative of municipalities, service districts, and political subdivisions that own their own public power systems. The Cooperative works to pool electrical energy resources to provide power to the various public power customers such as businesses and residents of the member utilities.
The UAMPS membership represents 52 members from Utah, Arizona, California, Idaho, Nevada, New Mexico and Oregon.
Nebo Power Station is owned by UAMPS and is a combined cycle natural gas fired 140 MW plant in Payson, Utah. UAMPS uses a variety of sources to meet the demand of its members with electrical supply. These include coal fired electrical plants, wind turbine electrical farms, hydroelectric power, and the Association’s Nebo Power Station a natural gas combined cycle electrical plant.
Vermont Electric Power Company (VELCO)
Overview VELCO the nation’s first ever “transmission only” company, was formed in 1956 as the most efficient solution for moving newly available St. Lawrence power into Vermont. In response to rising demand for services and the oil embargo of the early seventies, VELCO’s role grew to include acting as the agent for out- of state power contracts for all of Vermont’s utilities.
Assuming this responsibility saved money and substantially increased reliability through newly interconnected operations. Later, VELCO was specifically tasked to serve as the representative of Vermont’s combined utilities at what was the precursor to today’s ISO-New England. VELCO gave these utilities a voice where individually they would never have been heard.
Lastly, it was VELCO’s construction of a new converter in Highgate that made interconnected operations with Hydro Quebec a possibility and so played a role in securing the HQ power contract.
System Data The initial 224-mile 115 kV VELCO system was placed in service in September 1958. Since that time, VELCO has expanded its facilities and services as required by the needs of its participants and the evolution of the industry. Currently, its transmission system consists of: • 610 miles of transmission lines • 34 substations • 200 MW back-to-back HVDC converter; to monitor and control this system VELCO uses an extensive
fiber optic communication network • 558 miles owned by VT TRANSCO, LLC • 52 miles VETCO (HVDC) • Highgate converter, jointly owned by several Vermont utilities. (Burlington Electric Department, Central
Vermont Public Service Corp., Citizens Utilities, Green Mountain Power Corp., Rochester Electric Light & Power Co., Vermont Public Power Supply Authority and Village of Johnson Electric Light Department); the so called Highgate Joint Owners.
VT Transco, LLC VT Transco, LLC was officially established on June 30, 2006 as a limited liability company formed by VELCO and Vermont’s distribution companies, and owns Vermont’s high-voltage electric transmission system. VELCO is the manager of the LLC, and in that capacity, operates and maintains Vermont’s electric transmission system, as it has for fifty years.
APPENDIX B ALASKA REGA STUDY
Black & Veatch B-20 September 12, 2008
Profiles of Example Centralized Energy Efficiency Organizations
New Jersey Clean Energy Program™ New Jersey’s Clean Energy Program™, administered by the New Jersey Board of Public Utilities (BPU), promotes increased energy efficiency and the use of clean, renewable sources of energy including solar, wind, geothermal, and sustainable biomass. The program offers financial incentives, programs, and services for residential, commercial, and municipal customers.
In 2003, the BPU established a Clean Energy Council (CEC) comprised of a cross-section of government and industry representatives, energy experts, public interest groups, and academicians to engage stakeholders in the New Jersey Clean Energy Program’s™ development and to advise the BPU on its administration. The Council provides input to the BPU regarding the design, budgets, objectives, goals, administration, and evaluation of the program. The Council is organized into three committees: 1) Energy Efficiency, 2) Renewable Energy, and 3) Outreach and Education.
The Office of Clean Energy (OCE), while serving as administrator of New Jersey’s Clean Energy Program™, is assisted by Market Managers for the Residential, Commercial & Industrial, and Renewable Energy Programs. The OCE’s Clean Energy Council is organized into three committees: 1) Energy Efficiency, 2) Renewable Energy, and 3) Marketing and Communications.
New York State Energy Research and Development Authority (NYSERDA) NYSERDA is a public benefit corporation created in 1975 through the reconstitution of the New York State Atomic and Space Development Authority. NYSERDA’s earliest efforts focused solely on research and development with the goal of reducing the State’s petroleum consumption. Subsequent research and development projects focused on topics including environmental effects of energy consumption, development of renewable resources, and advancement of innovative technologies.
Currently, NYSERDA is primarily funded by state customers through the System Benefits Charge (SBC), which was established on May 20, 1996. These SBC funds were allocated towards energy-efficiency programs, research and development initiatives, low-income energy programs, and environmental disclosure activities. Part of this funding went into the creation of New York Energy SmartSM which helps to maintain momentum for the State’s efforts to develop competitive markets for energy efficiency; demand management; outreach and education services; research, development, and demonstration; low-income services; and to provide direct economic and environmental benefits to New York citizens and businesses. The SBC has been extended through June 30, 2011.
NYSERDA is governed by a Board consisting of 13 members, including the Commissioner of the Department of Transportation, the Commissioner of the Department of Environmental Conservation, the Chair of the Public Service Commission, and the Chair of the Power Authority of the State of New York. The remaining nine members are appointed by the Governor of the State of New York with the advice and consent of the Senate and include, as required by statute, an engineer or research scientist, an economist, an environmentalist, a consumer advocate, an officer of a gas utility, an officer of an electric utility, and three at-large members.
NYSERDA administers the New York Energy SmartSM program, which is designed to support certain public benefit programs during the transition to a more competitive electricity market. Some 2,700 projects in 40 programs are funded by a charge on the electricity transmitted and distributed by the State’s investor-owned utilities. The New York Energy SmartSM program provides energy efficiency services, including those directed at the low-income sector, research and development, and environmental protection activities.
APPENDIX B ALASKA REGA STUDY
Black & Veatch B-21 September 12, 2008
NYSERDA’s other responsibilities include: • Conducting a multifaceted energy and environmental research and development program to meet New
York State’s diverse economic needs. • Making energy more affordable for residential and low-income households. • Helping industries, schools, hospitals, municipalities, not-for-profits, and the residential sector, including
low-income residents, implement energy efficiency measures. • Providing objective, credible, and useful energy analysis and planning to guide decisions made by major
energy stakeholders in the private and public sectors. • Managing the Western New York Nuclear Service Center at West Valley, including: 1) overseeing the
State’s interests and share of costs at the West Valley Demonstration Project, a federal/State radioactive waste clean-up effort, and 2) managing wastes and maintaining facilities at the shut-down State-Licensed Disposal Area.
• Coordinating the State’s activities on nuclear energy matters including the regulation of radioactive materials, and monitoring low-level radioactive waste generation and management in the State.
• Financing energy-related projects, reducing costs for customers.
Oregon Energy Trust Energy Trust of Oregon, Inc., began operation in March 2002, and is charged by the Oregon Public Utility Commission (OPUC) with: 1) investing in cost-effective energy conservation, 2) helping to pay the above-market costs of renewable energy resources, and 3) encouraging energy market transformation in Oregon.
Energy Trust funds come from a 1999 energy restructuring law, which required Oregon’s two largest investor-owned utilities to collect a three percent “public purposes charge” from their customers. The law also dedicated a separate portion of the public-purpose funding to energy conservation efforts in low-income housing energy assistance and K-12 schools.
The law authorized the OPUC to direct these funds to a non-governmental entity for investment. Energy Trust was organized as a nonprofit organization for this purpose. Energy Trust organized as a nonprofit corporation and entered into a November 2001 grant agreement with the OPUC to guide Energy Trust’s electric energy work. The grant agreement was developed with extensive input from key stakeholders and interested parties, and has been amended several times since 2001.
In addition to its work under the 1999 energy restructuring law, the Energy Trust administers gas conservation programs for residential and commercial customers of NW Natural Gas and Cascade Natural Gas Corporation, and select programs for the residential customers of Avista Corporation in Oregon.

APPENDIX C ALASKA REGA STUDY
Black & Veatch C-1 September 12, 2008
APPENDIX C - SCENARIO A RESULTS

APPENDIX C ALASKA REGA STUDY
Black & Veatch C-2 September 12, 2008
CEA GVEA HEA MEA MLP Taxable Non Taxable
2008 GE LM6000 SC (1) 43.0 MW (Capital Cost $74.0
Million)
2009 GE LM6000 SC (1) 43.0 MW (Capital Cost $76.2
Million) 201020112012 Wind (1) 13.4 MW
(Capital Cost $71.3 Million)
Wind (1) 13.0 MW (Capital Cost $70.2
Million)
Wind (1) 4.6 MW (Capital Cost $46.8
Million)
Wind (1) 8.3 MW (Capital Cost $57.1
Million)
Wind (1) 10.7 MW (Capital Cost $64.0
Million)
Wind (1) 50.0 MW (Capital Cost $174.5
Million)
Wind (1) 50.0 MW (Capital Cost $174.5
Million) 201320142015 GE LMS100 SC (2)
197.6 MW (Capital Cost $294.7 Million)
201620172018 GE LM6000 SC (1) 43.0
MW (Capital Cost $99.4 Million); Wind (1) 13.4
MW (Capital Cost $44.8 Million)
Wind (1) 13.0 MW (Capital Cost $43.5
Million)
Wind (1) 4.6 MW (Capital Cost $15.6
Million)
Wind (1) 8.3 MW (Capital Cost $27.9
Million)
Wind (1) 10.7 MW (Capital Cost $36.1
Million)
GE LM6000 SC (1) 43.0 MW in MEA (Capital Cost $99.4 Million); Wind (1) 50.0 MW (Capital Cost
$168.0 Million)
GE LM6000 SC (1) 43.0 MW in MEA (Capital
Cost $99.4 Million); Wind (1) 50.0 MW (Capital Cost $168.0 Million)
2019 GE 6B SC (1) 42.1 MW (Capital Cost $73.1
Million)
2020 Hydro (1) 80.1 MW (Capital Cost $782.4
Million)
Hydro (1) 77.7 MW (Capital Cost $763.2
Million)
Hydro (1) 27.9 MW (Capital Cost $365.1
Million)
Hydro (1) 49.8 MW (Capital Cost $540.4
Million)
Hydro (1) 64.5 MW (Capital Cost $657.2
Million)
Hydro (1) 300 MW (Capital Cost $2537.9
Million)
Hydro (1) 300 MW (Capital Cost $2537.9
Million)
2021 GE LM6000 SC (2) 86.0 MW in MEA (Capital Cost
$217.3 Million)
GE LM6000 SC (2) 86.0 MW in MEA (Capital Cost $217.3 Million)
2022 GE LMS100 SC (1) 98.8 MW(Capital Cost
$186.7 Million) 202320242025 Hydro (1) 80.1 MW
(Capital Cost $907.0 Million)
Hydro (1) 77.7 MW (Capital Cost $884.7
Million)
Hydro (1) 27.9 MW (Capital Cost $423.3
Million)
Hydro (1) 49.8 MW (Capital Cost $626.4
Million)
Hydro (1) 64.5 MW (Capital Cost $761.8
Million)
Hydro (1) 300 MW (Capital Cost $2942.1
Million)
Hydro (1) 300 MW (Capital Cost $2942.1
Million)
2026 GE LMS100 SC (1) 98.8 MW (Capital Cost
$210.1 Million)
GE 6B SC (1) 42.1 MW (Capital Cost $89.9
Million) 2027202820292030 GE 6B SC (1) 42.1 MW
(Capital Cost $101.2 Million)
GE LMS100 SC (1) 98.8 MW (Capital Cost $236.4
Million)
2x1 GE 6FA CC (1) 235.0 MW
in CEA (Capital Cost $771.2 Million)
2x1 GE 6FA CC (1) 235.0 MW
in CEA (Capital Cost $771.2 Million)
2031 GE 6B SC (1) 42.1 MW (Capital Cost $104.2
Million)
GE LMS100 SC (1) 98.8 MW in GVEA (Capital Cost $243.5 Million)
GE LMS100 SC (1) 98.8 MW in GVEA (Capital Cost $243.5 Million)
2032203320342035 GE LMS100 SC (2)
197.6 MW (Capital Cost $548.2 Million)
20362037 GE 6B SC (1) 42.1
MW (Capital Cost $124.4 Million)
1x1 NP CC Repwr (1) 64.0 MW
in GVEA (Capital Cost $195.8 Million)
1x1 NP CC Repwr (1) 64.0 MW
in GVEA (Capital Cost $195.8 Million)
Subtotal Capital Cost (Millions $) $2,091.6 $2,400.4 $850.8 $2,309.0 $1,755.5 $7,349.7 $7,349.7
Northern and Southern Intertie Upgrades (Million $) - $720.0
Year
Paths 1,2, and 3
Scenario APath 1 Through Path 4 Expansion Plans
Path 4
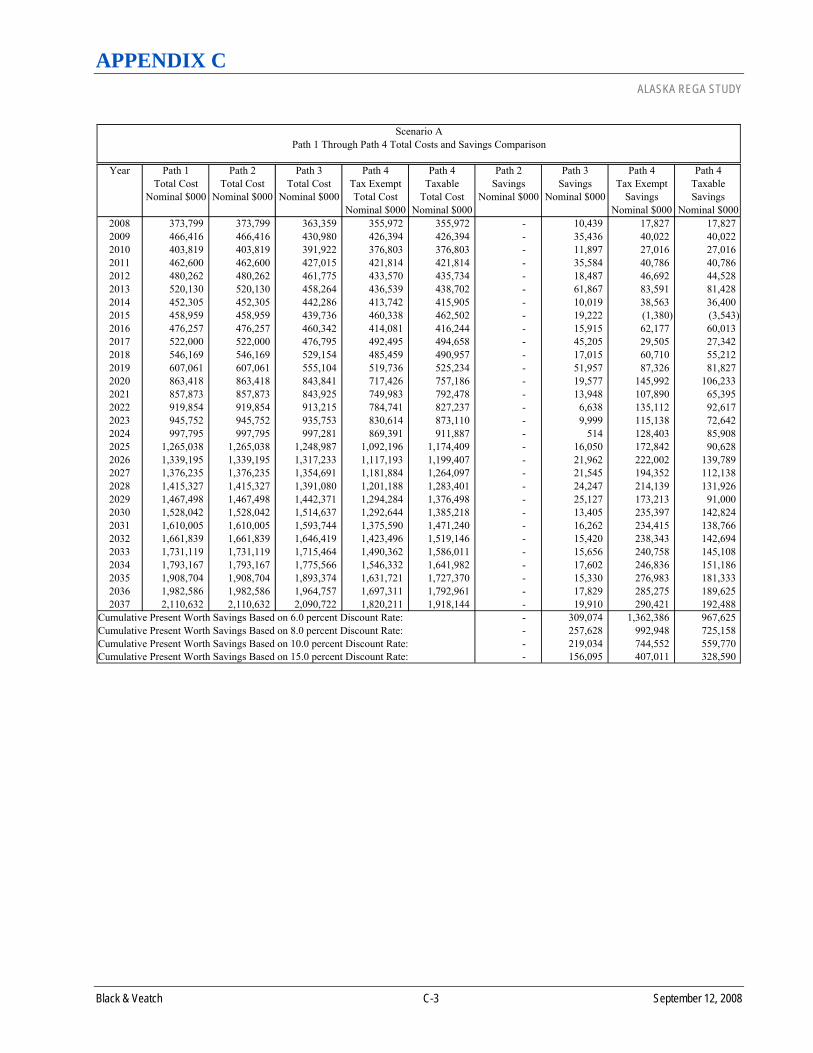
APPENDIX C ALASKA REGA STUDY
Black & Veatch C-3 September 12, 2008
Year Path 1 Total Cost
Nominal $000
Path 2 Total Cost
Nominal $000
Path 3 Total Cost
Nominal $000
Path 4 Tax ExemptTotal Cost
Nominal $000
Path 4 Taxable
Total CostNominal $000
Path 2 Savings
Nominal $000
Path 3 Savings
Nominal $000
Path 4 Tax Exempt
SavingsNominal $000
Path 4 TaxableSavings
Nominal $0002008 373,799 373,799 363,359 355,972 355,972 - 10,439 17,827 17,827 2009 466,416 466,416 430,980 426,394 426,394 - 35,436 40,022 40,022 2010 403,819 403,819 391,922 376,803 376,803 - 11,897 27,016 27,016 2011 462,600 462,600 427,015 421,814 421,814 - 35,584 40,786 40,786 2012 480,262 480,262 461,775 433,570 435,734 - 18,487 46,692 44,528 2013 520,130 520,130 458,264 436,539 438,702 - 61,867 83,591 81,428 2014 452,305 452,305 442,286 413,742 415,905 - 10,019 38,563 36,400 2015 458,959 458,959 439,736 460,338 462,502 - 19,222 (1,380) (3,543) 2016 476,257 476,257 460,342 414,081 416,244 - 15,915 62,177 60,013 2017 522,000 522,000 476,795 492,495 494,658 - 45,205 29,505 27,342 2018 546,169 546,169 529,154 485,459 490,957 - 17,015 60,710 55,212 2019 607,061 607,061 555,104 519,736 525,234 - 51,957 87,326 81,827 2020 863,418 863,418 843,841 717,426 757,186 - 19,577 145,992 106,233 2021 857,873 857,873 843,925 749,983 792,478 - 13,948 107,890 65,395 2022 919,854 919,854 913,215 784,741 827,237 - 6,638 135,112 92,617 2023 945,752 945,752 935,753 830,614 873,110 - 9,999 115,138 72,642 2024 997,795 997,795 997,281 869,391 911,887 - 514 128,403 85,908 2025 1,265,038 1,265,038 1,248,987 1,092,196 1,174,409 - 16,050 172,842 90,628 2026 1,339,195 1,339,195 1,317,233 1,117,193 1,199,407 - 21,962 222,002 139,789 2027 1,376,235 1,376,235 1,354,691 1,181,884 1,264,097 - 21,545 194,352 112,138 2028 1,415,327 1,415,327 1,391,080 1,201,188 1,283,401 - 24,247 214,139 131,926 2029 1,467,498 1,467,498 1,442,371 1,294,284 1,376,498 - 25,127 173,213 91,000 2030 1,528,042 1,528,042 1,514,637 1,292,644 1,385,218 - 13,405 235,397 142,824 2031 1,610,005 1,610,005 1,593,744 1,375,590 1,471,240 - 16,262 234,415 138,766 2032 1,661,839 1,661,839 1,646,419 1,423,496 1,519,146 - 15,420 238,343 142,694 2033 1,731,119 1,731,119 1,715,464 1,490,362 1,586,011 - 15,656 240,758 145,108 2034 1,793,167 1,793,167 1,775,566 1,546,332 1,641,982 - 17,602 246,836 151,186 2035 1,908,704 1,908,704 1,893,374 1,631,721 1,727,370 - 15,330 276,983 181,333 2036 1,982,586 1,982,586 1,964,757 1,697,311 1,792,961 - 17,829 285,275 189,625 2037 2,110,632 2,110,632 2,090,722 1,820,211 1,918,144 - 19,910 290,421 192,488
- 309,074 1,362,386 967,625 - 257,628 992,948 725,158 - 219,034 744,552 559,770 - 156,095 407,011 328,590 Cumulative Present Worth Savings Based on 15.0 percent Discount Rate:
Scenario APath 1 Through Path 4 Total Costs and Savings Comparison
Cumulative Present Worth Savings Based on 6.0 percent Discount Rate:Cumulative Present Worth Savings Based on 8.0 percent Discount Rate:Cumulative Present Worth Savings Based on 10.0 percent Discount Rate:
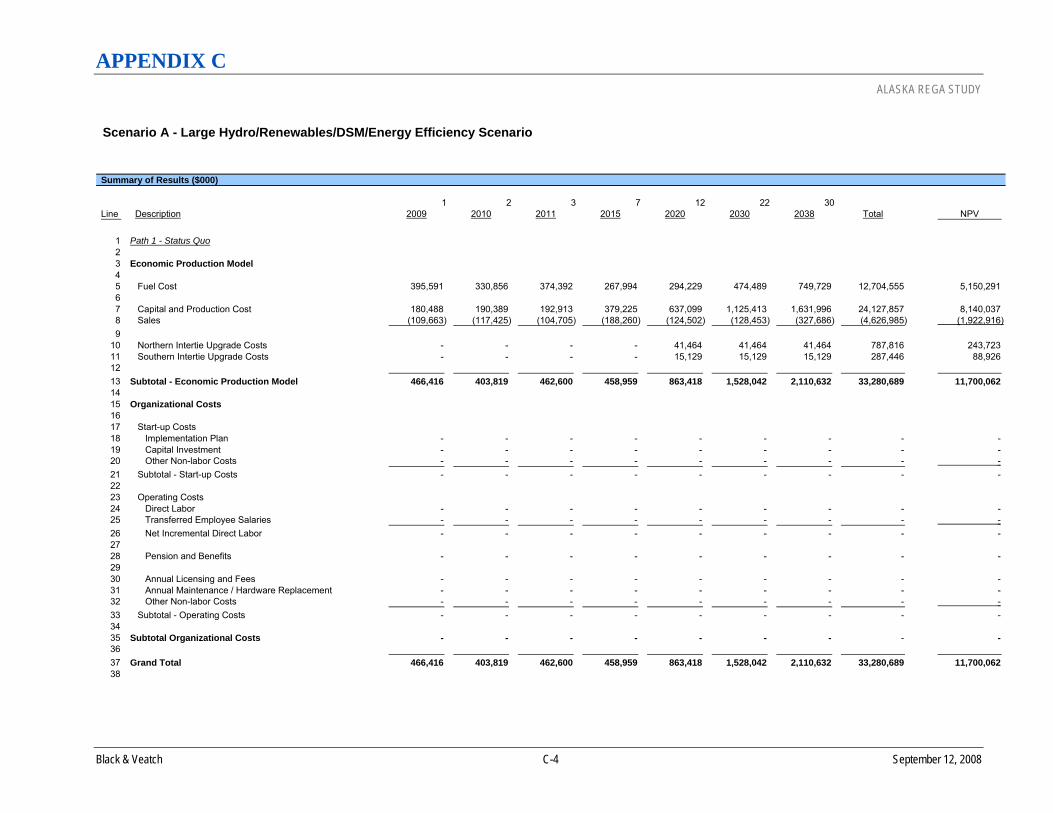
APPENDIX C ALASKA REGA STUDY
Black & Veatch C-4 September 12, 2008
Scenario A - Large Hydro/Renewables/DSM/Energy Efficiency Scenario
1 2 3 7 12 22 30Line Description 2009 2010 2011 2015 2020 2030 2038 Total NPV
1 Path 1 - Status Quo2 3 Economic Production Model4 5 Fuel Cost 395,591 330,856 374,392 267,994 294,229 474,489 749,729 12,704,555 5,150,291 6 7 Capital and Production Cost 180,488 190,389 192,913 379,225 637,099 1,125,413 1,631,996 24,127,857 8,140,037 8 Sales (109,663) (117,425) (104,705) (188,260) (124,502) (128,453) (327,686) (4,626,985) (1,922,916) 9
10 Northern Intertie Upgrade Costs - - - - 41,464 41,464 41,464 787,816 243,723 11 Southern Intertie Upgrade Costs - - - - 15,129 15,129 15,129 287,446 88,926 12 13 Subtotal - Economic Production Model 466,416 403,819 462,600 458,959 863,418 1,528,042 2,110,632 33,280,689 11,700,062 14 15 Organizational Costs16 17 Start-up Costs18 Implementation Plan - - - - - - - - - 19 Capital Investment - - - - - - - - - 20 Other Non-labor Costs - - - - - - - - - 21 Subtotal - Start-up Costs - - - - - - - - - 22 23 Operating Costs24 Direct Labor - - - - - - - - - 25 Transferred Employee Salaries - - - - - - - - - 26 Net Incremental Direct Labor - - - - - - - - - 27 28 Pension and Benefits - - - - - - - - - 29 30 Annual Licensing and Fees - - - - - - - - - 31 Annual Maintenance / Hardware Replacement - - - - - - - - - 32 Other Non-labor Costs - - - - - - - - - 33 Subtotal - Operating Costs - - - - - - - - - 34 35 Subtotal Organizational Costs - - - - - - - - - 36 37 Grand Total 466,416 403,819 462,600 458,959 863,418 1,528,042 2,110,632 33,280,689 11,700,062 38
Summary of Results ($000)

APPENDIX C ALASKA REGA STUDY
Black & Veatch C-5 September 12, 2008
Scenario A - Large Hydro/Renewables/DSM/Energy Efficiency Scenario
1 2 3 7 12 22 30Line Description 2009 2010 2011 2015 2020 2030 2038 Total NPV
39 Path 2 - Independent Operation of the Railbelt Grid40 41 Economic Production Model42 43 Fuel Cost 395,591 330,856 374,392 267,994 294,229 474,489 749,729 12,704,555 5,150,291 44 45 Capital and Production Cost 180,488 190,389 192,913 379,225 637,099 1,125,413 1,631,996 24,127,857 8,140,037 46 Sales (109,663) (117,425) (104,705) (188,260) (124,502) (128,453) (327,686) (4,626,985) (1,922,916) 47 48 Northern Intertie Upgrade Costs - - - - 41,464 41,464 41,464 787,816 243,723 49 Southern Intertie Upgrade Costs - - - - 15,129 15,129 15,129 287,446 88,926 50 51 Subtotal - Economic Production Model 466,416 403,819 462,600 458,959 863,418 1,528,042 2,110,632 33,280,689 11,700,062 52 53 Organizational Costs54 55 Start-up Costs56 Implementation Plan 67 267 267 - - - - 1,335 1,077 57 Capital Investment 5 21 21 - - - - 103 83 58 Other Non-labor Costs 17 67 67 - - - - 332 268 59 Subtotal - Start-up Costs 89 354 354 - - - - 1,770 1,428 60 61 Operating Costs62 Direct Labor 450 1,854 1,910 2,149 2,491 3,349 4,242 84,282 33,368 63 Transferred Employee Salaries 225 927 955 1,075 1,246 1,674 2,121 42,142 16,684 64 Net Incremental Direct Labor 225 927 955 1,075 1,246 1,674 2,121 42,140 16,684 65 66 Pension and Benefits 90 371 382 430 498 670 848 16,856 6,674 67 68 Annual Licensing and Fees 19 19 20 22 24 31 38 815 337 69 Annual Maintenance / Hardware Replacement 34 34 35 80 90 116 141 2,866 1,116 70 Other Non-labor Costs 657 674 690 762 862 1,104 1,345 28,849 11,918 71 Subtotal - Operating Costs 1,024 2,025 2,082 2,368 2,721 3,594 4,493 91,527 36,728 72 73 Subtotal Organizational Costs 1,113 2,379 2,436 2,368 2,721 3,594 4,493 93,297 38,156 74 75 Grand Total 467,529 406,198 465,035 461,326 866,139 1,531,636 2,115,124 33,373,986 11,738,218 76
Summary of Results ($000)
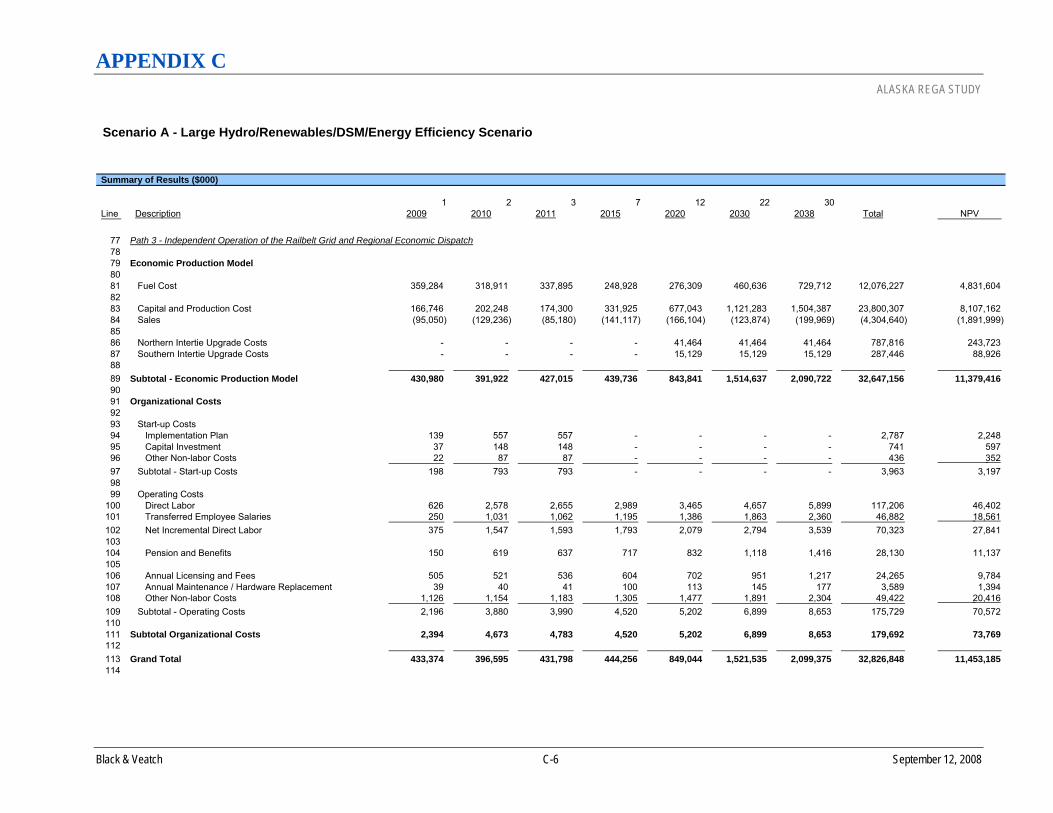
APPENDIX C ALASKA REGA STUDY
Black & Veatch C-6 September 12, 2008
Scenario A - Large Hydro/Renewables/DSM/Energy Efficiency Scenario
1 2 3 7 12 22 30Line Description 2009 2010 2011 2015 2020 2030 2038 Total NPV
77 Path 3 - Independent Operation of the Railbelt Grid and Regional Economic Dispatch78 79 Economic Production Model80 81 Fuel Cost 359,284 318,911 337,895 248,928 276,309 460,636 729,712 12,076,227 4,831,604 82 83 Capital and Production Cost 166,746 202,248 174,300 331,925 677,043 1,121,283 1,504,387 23,800,307 8,107,162 84 Sales (95,050) (129,236) (85,180) (141,117) (166,104) (123,874) (199,969) (4,304,640) (1,891,999) 85 86 Northern Intertie Upgrade Costs - - - - 41,464 41,464 41,464 787,816 243,723 87 Southern Intertie Upgrade Costs - - - - 15,129 15,129 15,129 287,446 88,926 88 89 Subtotal - Economic Production Model 430,980 391,922 427,015 439,736 843,841 1,514,637 2,090,722 32,647,156 11,379,416 90 91 Organizational Costs92 93 Start-up Costs94 Implementation Plan 139 557 557 - - - - 2,787 2,248 95 Capital Investment 37 148 148 - - - - 741 597 96 Other Non-labor Costs 22 87 87 - - - - 436 352 97 Subtotal - Start-up Costs 198 793 793 - - - - 3,963 3,197 98 99 Operating Costs
100 Direct Labor 626 2,578 2,655 2,989 3,465 4,657 5,899 117,206 46,402 101 Transferred Employee Salaries 250 1,031 1,062 1,195 1,386 1,863 2,360 46,882 18,561 102 Net Incremental Direct Labor 375 1,547 1,593 1,793 2,079 2,794 3,539 70,323 27,841 103 104 Pension and Benefits 150 619 637 717 832 1,118 1,416 28,130 11,137 105 106 Annual Licensing and Fees 505 521 536 604 702 951 1,217 24,265 9,784 107 Annual Maintenance / Hardware Replacement 39 40 41 100 113 145 177 3,589 1,394 108 Other Non-labor Costs 1,126 1,154 1,183 1,305 1,477 1,891 2,304 49,422 20,416 109 Subtotal - Operating Costs 2,196 3,880 3,990 4,520 5,202 6,899 8,653 175,729 70,572 110 111 Subtotal Organizational Costs 2,394 4,673 4,783 4,520 5,202 6,899 8,653 179,692 73,769 112 113 Grand Total 433,374 396,595 431,798 444,256 849,044 1,521,535 2,099,375 32,826,848 11,453,185 114
Summary of Results ($000)

APPENDIX C ALASKA REGA STUDY
Black & Veatch C-7 September 12, 2008
Scenario A - Large Hydro/Renewables/DSM/Energy Efficiency Scenario
1 2 3 7 12 22 30Line Description 2009 2010 2011 2015 2020 2030 2038 Total NPV
115 Path 4 - Independent Operation of the Railbelt Grid, Regional Economic Dispatch, Regional Resource Planning and Joint Project Development (Tax-Exempt)116 117 Economic Production Model118 119 Fuel Cost 368,643 318,950 346,714 328,087 281,968 440,650 673,526 12,276,450 5,015,934 120 121 Capital and Production Cost 162,776 205,298 172,510 215,685 567,651 1,176,870 1,480,658 22,162,017 7,335,167 122 Sales (105,025) (147,445) (97,410) (83,433) (188,785) (381,468) (390,566) (6,695,934) (2,460,532) 123 124 Northern Intertie Upgrade Costs - - - - 41,464 41,464 41,464 787,816 243,723 125 Southern Intertie Upgrade Costs - - - - 15,129 15,129 15,129 287,446 88,926 126 127 Subtotal - Economic Production Model 426,394 376,803 421,814 460,338 717,426 1,292,644 1,820,211 28,817,796 10,223,219 128 129 Organizational Costs130 131 Start-up Costs132 Implementation Plan 247 986 986 - - - - 4,932 3,979 133 Capital Investment 45 180 180 - - - - 899 725 134 Other Non-labor Costs 52 207 207 - - - - 1,035 835 135 Subtotal - Start-up Costs 343 1,373 1,373 - - - - 6,867 5,539 136 137 Operating Costs138 Direct Labor 1,954 8,050 8,291 9,332 10,818 14,539 18,418 365,957 144,886 139 Transferred Employee Salaries 645 2,656 2,736 3,080 3,570 4,798 6,078 120,766 47,812 140 Net Incremental Direct Labor 1,309 5,393 5,555 6,252 7,248 9,741 12,340 245,191 97,073 141 142 Pension and Benefits 524 2,157 2,222 2,501 2,899 3,897 4,936 98,077 38,829 143 144 Annual Licensing and Fees 522 537 553 623 723 979 1,251 24,988 10,083 145 Annual Maintenance / Hardware Replacement 54 55 57 182 206 263 321 6,498 2,508 146 Other Non-labor Costs 2,334 2,392 2,452 2,707 3,062 3,920 4,776 102,460 42,328 147 Subtotal - Operating Costs 4,742 10,535 10,839 12,264 14,139 18,800 23,624 477,214 190,822 148 149 Subtotal Organizational Costs 5,086 11,909 12,212 12,264 14,139 18,800 23,624 484,080 196,361 150 151 Grand Total 431,480 388,711 434,026 472,603 731,565 1,311,444 1,843,835 29,301,876 10,419,580 152
Summary of Results ($000)

APPENDIX C ALASKA REGA STUDY
Black & Veatch C-8 September 12, 2008
Scenario A - Large Hydro/Renewables/DSM/Energy Efficiency Scenario
1 2 3 7 12 22 30Line Description 2009 2010 2011 2015 2020 2030 2038 Total NPV
153 Path 4 - Independent Operation of the Railbelt Grid, Regional Economic Dispatch, Regional Resource Planning and Joint Project Development (Taxable)154 155 Economic Production Model156 157 Fuel Cost 368,643 318,950 346,714 328,087 281,968 440,650 673,526 12,276,450 5,015,934 158 159 Capital and Production Cost 162,776 205,298 172,510 217,848 607,410 1,269,443 1,578,590 23,669,139 7,770,665 160 Sales (105,025) (147,445) (97,410) (83,433) (188,785) (381,468) (390,566) (6,695,934) (2,460,532) 161 162 Northern Intertie Upgrade Costs - - - - 41,464 41,464 41,464 787,816 243,723 163 Southern Intertie Upgrade Costs - - - - 15,129 15,129 15,129 287,446 88,926 164 165 Subtotal - Economic Production Model 426,394 376,803 421,814 462,502 757,186 1,385,217 1,918,144 30,324,917 10,658,717 166 167 Organizational Costs168 169 Start-up Costs170 Implementation Plan 247 986 986 - - - - 4,932 3,979 171 Capital Investment 45 180 180 - - - - 899 725 172 Other Non-labor Costs 52 207 207 - - - - 1,035 835 173 Subtotal - Start-up Costs 343 1,373 1,373 - - - - 6,867 5,539 174 175 Operating Costs176 Direct Labor 1,954 8,050 8,291 9,332 10,818 14,539 18,418 365,957 144,886 177 Transferred Employee Salaries 645 2,656 2,736 3,080 3,570 4,798 6,078 120,766 47,812 178 Net Incremental Direct Labor 1,309 5,393 5,555 6,252 7,248 9,741 12,340 245,191 97,073 179 180 Pension and Benefits 524 2,157 2,222 2,501 2,899 3,897 4,936 98,077 38,829 181 182 Annual Licensing and Fees 522 537 553 623 723 979 1,251 24,988 10,083 183 Annual Maintenance / Hardware Replacement 54 55 57 182 206 263 321 6,498 2,508 184 Other Non-labor Costs 2,334 2,392 2,452 2,707 3,062 3,920 4,776 102,460 42,328 185 Subtotal - Operating Costs 4,742 10,535 10,839 12,264 14,139 18,800 23,624 477,214 190,822 186 187 Subtotal Organizational Costs 5,086 11,909 12,212 12,264 14,139 18,800 23,624 484,080 196,361 188 189 Grand Total 431,480 388,711 434,026 474,766 771,324 1,404,017 1,941,767 30,808,997 10,855,079 190
Summary of Results ($000)

APPENDIX C ALASKA REGA STUDY
Black & Veatch C-9 September 12, 2008
Scenario A - Large Hydro/Renewables/DSM/Energy Efficiency Scenario
1 2 3 7 12 22 30Line Description 2009 2010 2011 2015 2020 2030 2038 Total NPV
191 Path 5 - Power Pool192 193 Economic Production Model194 195 Fuel Cost 368,643 318,950 346,714 328,087 281,968 440,650 673,526 12,276,450 5,015,934 196 197 Capital and Production Cost 162,776 205,298 172,510 215,685 567,651 1,176,870 1,480,658 22,162,017 7,335,167 198 Sales (105,025) (147,445) (97,410) (83,433) (188,785) (381,468) (390,566) (6,695,934) (2,460,532) 199 200 Northern Intertie Upgrade Costs - - - - 41,464 41,464 41,464 787,816 243,723 201 Southern Intertie Upgrade Costs - - - - 15,129 15,129 15,129 287,446 88,926 202 203 Subtotal - Economic Production Model 426,394 376,803 421,814 460,338 717,426 1,292,644 1,820,211 28,817,796 10,223,219 204 205 Organizational Costs206 207 Start-up Costs208 Implementation Plan 182 728 728 - - - - 3,638 2,935 209 Capital Investment 42 168 168 - - - - 842 679 210 Other Non-labor Costs 26 106 106 - - - - 529 427 211 Subtotal - Start-up Costs 250 1,002 1,002 - - - - 5,008 4,040 212 213 Operating Costs214 Direct Labor 837 3,448 3,551 3,997 4,634 6,228 7,890 156,763 62,063 215 Transferred Employee Salaries 335 1,379 1,421 1,599 1,854 2,491 3,156 62,705 24,825 216 Net Incremental Direct Labor 502 2,069 2,131 2,398 2,780 3,737 4,734 94,058 37,238 217 218 Pension and Benefits 201 828 852 959 1,112 1,495 1,894 37,623 14,895 219 220 Annual Licensing and Fees 522 537 553 623 723 979 1,251 24,988 10,083 221 Annual Maintenance / Hardware Replacement 41 42 43 112 127 163 199 2,210 1,560 222 Other Non-labor Costs 1,441 1,477 1,514 1,671 1,890 2,420 2,949 13,621 26,131 223 Subtotal - Operating Costs 2,707 4,953 5,093 5,764 6,633 8,794 11,026 223,950 89,906 224 225 Subtotal Organizational Costs 2,957 5,954 6,095 5,764 6,633 8,794 11,026 228,959 93,946 226 227 Grand Total 429,351 382,757 427,909 466,102 724,060 1,301,438 1,831,237 29,046,754 10,317,165 228
* Note: The total and NPV columns sum the entire 30-year cash flow.
Summary of Results ($000)

APPENDIX D ALASKA REGA STUDY
Black & Veatch D-1 September 12, 2008
APPENDIX D - SCENARIO B RESULTS

APPENDIX D ALASKA REGA STUDY
Black & Veatch D-2 September 12, 2008
CEA GVEA HEA MEA MLP Taxable Non Taxable2008 GE LM6000 SC (1) 43.0
MW (Capital Cost $74.0 Million)
2009 GE LM6000 SC (1) 43.0 MW (Capital Cost $76.2
Million) 201020112012201320142015 GE LMS100 SC (2) 197.6
MW (Capital Cost $303.5 Million)
201620172018 GE LMS100 SC (1) 98.8
MW (Capital Cost $165.8 Million)
2019 GE LMS100 SC (1) 98.8 MW (Capital Cost $170.8
Million)
1x1 NP CC Repwr (1) 64.0 MW
in GVEA (Capital Cost $115.0 Million)
1x1 NP CC Repwr (1) 64.0 MW
in GVEA (Capital Cost $115.0 Million)
20202021 GE 6B SC (1) 42.1 MW
(Capital Cost $77.5 Million) GE LMS100 SC (1) 98.8
MW in MEA (Capital Cost $181.2 Million)
GE LMS100 SC (1) 98.8 MW in MEA (Capital Cost
$181.2 Million)
2022 GE LMS100 SC (1) 98.8 MW (Capital Cost $186.7
Million)
GE LM6000 SC (2) 86.0 MW in MEA (Capital Cost
$223.9 Million)
GE LM6000 SC (2) 86.0 MW in MEA (Capital Cost
$223.9 Million)
20232024
GE LM6000 SC (1) 43.0 MW in GVEA (Capital Cost
$118.7 Million)
GE LM6000 SC (1) 43.0
MW in GVEA (Capital Cost $118.7 Million)
202520262027 GE LM6000 SC (1) 43.0
MW in MEA (Capital Cost $129.8 Million)
GE LM6000 SC (1) 43.0 MW in MEA (Capital Cost
$129.8 Million) 2028 1X1 GE 6FA CC (1) 116.0
MW (Capital Cost $458.4 Million)
20292030 GE LMS100 SC (1) 98.8
MW (Capital Cost $236.4 Million)
2x1 GE 6FA CC (1) 235.0 MW
in CEA (Capital Cost $771.2 Million)
2x1 GE 6FA CC (1) 235.0 MW
in CEA (Capital Cost $771.2 Million)
2031 GE 6B SC (1) 42.1 MW (Capital Cost $104.2 Million)
GE 6B SC (1) 42.1 MW in GVEA (Capital Cost $104.2
Million)
GE 6B SC (1) 42.1 MW in GVEA (Capital Cost $104.2
Million)
2032 GE 6B SC (1) 42.1 MW (Capital Cost $107.3 Million)
2033 GE 6B SC (1) 42.1 MW in GVEA (Capital Cost $110.6
Million)
GE 6B SC (1) 42.1 MW in GVEA (Capital Cost $110.6
Million)
20342035 GE LMS100 SC (2) 197.6
MW (Capital Cost $548.2 Million)
20362037 GE LM6000 SC (1) 43.0
MW (Capital Cost $174.4 Million)
Subtotal Capital Cost (Millions $) $352.5 $883.6 $0.0 $1,036.5 $410.8 $1,754.6 $1,754.6
Northern and Southern Intertie Upgrades (Millions $) - $720.0
YearPaths 1, 2, and 3 Path 4
Scenario BPath 1 Through Path 4 Expansion Plans
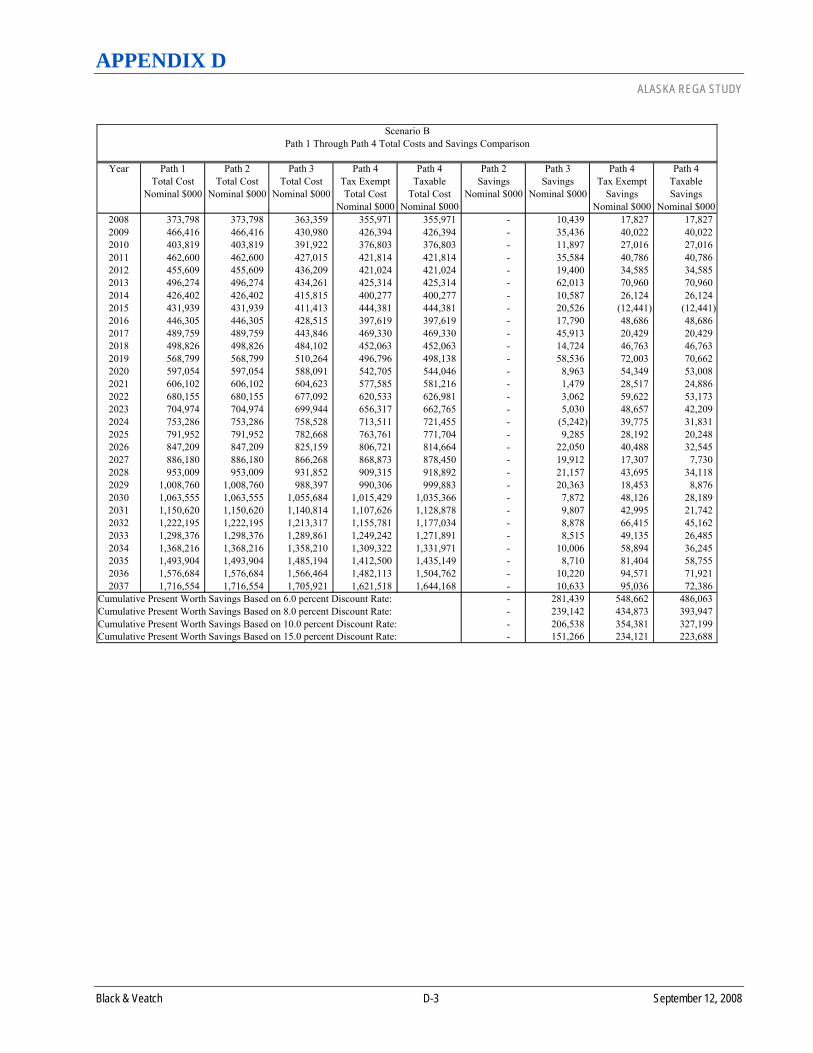
APPENDIX D ALASKA REGA STUDY
Black & Veatch D-3 September 12, 2008
Year Path 1 Total Cost
Nominal $000
Path 2 Total Cost
Nominal $000
Path 3 Total Cost
Nominal $000
Path 4 Tax ExemptTotal Cost
Nominal $000
Path 4 Taxable
Total CostNominal $000
Path 2 Savings
Nominal $000
Path 3 Savings
Nominal $000
Path 4 Tax Exempt
SavingsNominal $000
Path 4 TaxableSavings
Nominal $0002008 373,798 373,798 363,359 355,971 355,971 - 10,439 17,827 17,827 2009 466,416 466,416 430,980 426,394 426,394 - 35,436 40,022 40,022 2010 403,819 403,819 391,922 376,803 376,803 - 11,897 27,016 27,016 2011 462,600 462,600 427,015 421,814 421,814 - 35,584 40,786 40,786 2012 455,609 455,609 436,209 421,024 421,024 - 19,400 34,585 34,585 2013 496,274 496,274 434,261 425,314 425,314 - 62,013 70,960 70,960 2014 426,402 426,402 415,815 400,277 400,277 - 10,587 26,124 26,124 2015 431,939 431,939 411,413 444,381 444,381 - 20,526 (12,441) (12,441) 2016 446,305 446,305 428,515 397,619 397,619 - 17,790 48,686 48,686 2017 489,759 489,759 443,846 469,330 469,330 - 45,913 20,429 20,429 2018 498,826 498,826 484,102 452,063 452,063 - 14,724 46,763 46,763 2019 568,799 568,799 510,264 496,796 498,138 - 58,536 72,003 70,662 2020 597,054 597,054 588,091 542,705 544,046 - 8,963 54,349 53,008 2021 606,102 606,102 604,623 577,585 581,216 - 1,479 28,517 24,886 2022 680,155 680,155 677,092 620,533 626,981 - 3,062 59,622 53,173 2023 704,974 704,974 699,944 656,317 662,765 - 5,030 48,657 42,209 2024 753,286 753,286 758,528 713,511 721,455 - (5,242) 39,775 31,831 2025 791,952 791,952 782,668 763,761 771,704 - 9,285 28,192 20,248 2026 847,209 847,209 825,159 806,721 814,664 - 22,050 40,488 32,545 2027 886,180 886,180 866,268 868,873 878,450 - 19,912 17,307 7,730 2028 953,009 953,009 931,852 909,315 918,892 - 21,157 43,695 34,118 2029 1,008,760 1,008,760 988,397 990,306 999,883 - 20,363 18,453 8,876 2030 1,063,555 1,063,555 1,055,684 1,015,429 1,035,366 - 7,872 48,126 28,189 2031 1,150,620 1,150,620 1,140,814 1,107,626 1,128,878 - 9,807 42,995 21,742 2032 1,222,195 1,222,195 1,213,317 1,155,781 1,177,034 - 8,878 66,415 45,162 2033 1,298,376 1,298,376 1,289,861 1,249,242 1,271,891 - 8,515 49,135 26,485 2034 1,368,216 1,368,216 1,358,210 1,309,322 1,331,971 - 10,006 58,894 36,245 2035 1,493,904 1,493,904 1,485,194 1,412,500 1,435,149 - 8,710 81,404 58,755 2036 1,576,684 1,576,684 1,566,464 1,482,113 1,504,762 - 10,220 94,571 71,921 2037 1,716,554 1,716,554 1,705,921 1,621,518 1,644,168 - 10,633 95,036 72,386
- 281,439 548,662 486,063 - 239,142 434,873 393,947 - 206,538 354,381 327,199 - 151,266 234,121 223,688 Cumulative Present Worth Savings Based on 15.0 percent Discount Rate:
Scenario BPath 1 Through Path 4 Total Costs and Savings Comparison
Cumulative Present Worth Savings Based on 6.0 percent Discount Rate:Cumulative Present Worth Savings Based on 8.0 percent Discount Rate:Cumulative Present Worth Savings Based on 10.0 percent Discount Rate:

APPENDIX D ALASKA REGA STUDY
Black & Veatch D-4 September 12, 2008
Scenario B - Natural Gas Scenario
1 2 3 7 12 22 30Line Description 2009 2010 2011 2015 2020 2030 2038 Total NPV
1 Path 1 - Status Quo2 3 Economic Production Model4 5 Fuel Cost 395,591 330,856 374,392 271,403 306,617 564,887 883,027 14,337,719 5,600,757 6 7 Capital and Production Cost 180,487 190,389 192,913 347,559 311,972 466,515 891,336 12,748,234 4,756,032 8 Sales (109,662) (117,425) (104,705) (187,023) (78,128) (24,439) (114,401) (2,579,127) (1,348,443) 9
10 Northern Intertie Upgrade Costs - - - - 41,464 41,464 41,464 787,816 243,723 11 Southern Intertie Upgrade Costs - - - - 15,129 15,129 15,129 287,446 88,926 12 13 Subtotal - Economic Production Model 466,416 403,819 462,600 431,939 597,054 1,063,555 1,716,554 25,582,088 9,340,995 14 15 Organizational Costs16 17 Start-up Costs18 Implementation Plan - - - - - - - - - 19 Capital Investment - - - - - - - - - 20 Other Non-labor Costs - - - - - - - - - 21 Subtotal - Start-up Costs - - - - - - - - - 22 23 Operating Costs24 Direct Labor - - - - - - - - - 25 Transferred Employee Salaries - - - - - - - - - 26 Net Incremental Direct Labor - - - - - - - - - 27 28 Pension and Benefits - - - - - - - - - 29 30 Annual Licensing and Fees - - - - - - - - - 31 Annual Maintenance / Hardware Replacement - - - - - - - - - 32 Other Non-labor Costs - - - - - - - - - 33 Subtotal - Operating Costs - - - - - - - - - 34 35 Subtotal Organizational Costs - - - - - - - - - 36 37 Grand Total 466,416 403,819 462,600 431,939 597,054 1,063,555 1,716,554 25,582,088 9,340,995 38
Summary of Results ($000)

APPENDIX D ALASKA REGA STUDY
Black & Veatch D-5 September 12, 2008
Scenario B - Natural Gas Scenario
1 2 3 7 12 22 30Line Description 2009 2010 2011 2015 2020 2030 2038 Total NPV
39 Path 2 - Independent Operation of the Railbelt Grid40 41 Economic Production Model42 43 Fuel Cost 395,591 330,856 374,392 271,403 306,617 564,887 883,027 14,337,719 5,600,757 44 45 Capital and Production Cost 180,487 190,389 192,913 347,559 311,972 466,515 891,336 12,748,234 4,756,032 46 Sales (109,662) (117,425) (104,705) (187,023) (78,128) (24,439) (114,401) (2,579,127) (1,348,443) 47 48 Northern Intertie Upgrade Costs - - - - 41,464 41,464 41,464 787,816 243,723 49 Southern Intertie Upgrade Costs - - - - 15,129 15,129 15,129 287,446 88,926 50 51 Subtotal - Economic Production Model 466,416 403,819 462,600 431,939 597,054 1,063,555 1,716,554 25,582,088 9,340,995 52 53 Organizational Costs54 55 Start-up Costs56 Implementation Plan 67 267 267 - - - - 1,335 1,077 57 Capital Investment 5 21 21 - - - - 103 83 58 Other Non-labor Costs 17 67 67 - - - - 332 268 59 Subtotal - Start-up Costs 89 354 354 - - - - 1,770 1,428 60 61 Operating Costs62 Direct Labor 450 1,854 1,910 2,149 2,491 3,349 4,242 84,282 33,368 63 Transferred Employee Salaries 225 927 955 1,075 1,246 1,674 2,121 42,142 16,684 64 Net Incremental Direct Labor 225 927 955 1,075 1,246 1,674 2,121 42,140 16,684 65 66 Pension and Benefits 90 371 382 430 498 670 848 16,856 6,674 67 68 Annual Licensing and Fees 19 19 20 22 24 31 38 815 337 69 Annual Maintenance / Hardware Replacement 34 34 35 80 90 116 141 2,866 1,116 70 Other Non-labor Costs 657 674 690 762 862 1,104 1,345 28,849 11,918 71 Subtotal - Operating Costs 1,024 2,025 2,082 2,368 2,721 3,594 4,493 91,527 36,728 72 73 Subtotal Organizational Costs 1,113 2,379 2,436 2,368 2,721 3,594 4,493 93,297 38,156 74 75 Grand Total 467,528 406,198 465,035 434,307 599,775 1,067,150 1,721,047 25,675,385 9,379,151 76
Summary of Results ($000)
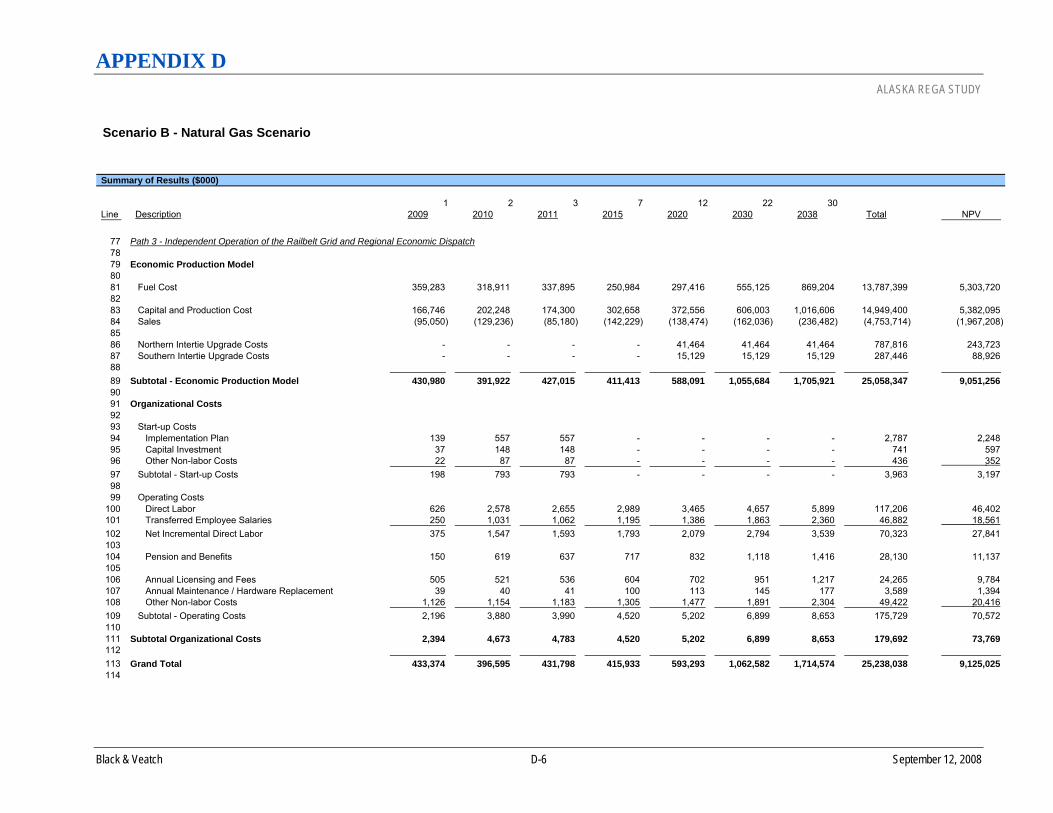
APPENDIX D ALASKA REGA STUDY
Black & Veatch D-6 September 12, 2008
Scenario B - Natural Gas Scenario
1 2 3 7 12 22 30Line Description 2009 2010 2011 2015 2020 2030 2038 Total NPV
77 Path 3 - Independent Operation of the Railbelt Grid and Regional Economic Dispatch78 79 Economic Production Model80 81 Fuel Cost 359,283 318,911 337,895 250,984 297,416 555,125 869,204 13,787,399 5,303,720 82 83 Capital and Production Cost 166,746 202,248 174,300 302,658 372,556 606,003 1,016,606 14,949,400 5,382,095 84 Sales (95,050) (129,236) (85,180) (142,229) (138,474) (162,036) (236,482) (4,753,714) (1,967,208) 85 86 Northern Intertie Upgrade Costs - - - - 41,464 41,464 41,464 787,816 243,723 87 Southern Intertie Upgrade Costs - - - - 15,129 15,129 15,129 287,446 88,926 88 89 Subtotal - Economic Production Model 430,980 391,922 427,015 411,413 588,091 1,055,684 1,705,921 25,058,347 9,051,256 90 91 Organizational Costs92 93 Start-up Costs94 Implementation Plan 139 557 557 - - - - 2,787 2,248 95 Capital Investment 37 148 148 - - - - 741 597 96 Other Non-labor Costs 22 87 87 - - - - 436 352 97 Subtotal - Start-up Costs 198 793 793 - - - - 3,963 3,197 98 99 Operating Costs
100 Direct Labor 626 2,578 2,655 2,989 3,465 4,657 5,899 117,206 46,402 101 Transferred Employee Salaries 250 1,031 1,062 1,195 1,386 1,863 2,360 46,882 18,561 102 Net Incremental Direct Labor 375 1,547 1,593 1,793 2,079 2,794 3,539 70,323 27,841 103 104 Pension and Benefits 150 619 637 717 832 1,118 1,416 28,130 11,137 105 106 Annual Licensing and Fees 505 521 536 604 702 951 1,217 24,265 9,784 107 Annual Maintenance / Hardware Replacement 39 40 41 100 113 145 177 3,589 1,394 108 Other Non-labor Costs 1,126 1,154 1,183 1,305 1,477 1,891 2,304 49,422 20,416 109 Subtotal - Operating Costs 2,196 3,880 3,990 4,520 5,202 6,899 8,653 175,729 70,572 110 111 Subtotal Organizational Costs 2,394 4,673 4,783 4,520 5,202 6,899 8,653 179,692 73,769 112 113 Grand Total 433,374 396,595 431,798 415,933 593,293 1,062,582 1,714,574 25,238,038 9,125,025 114
Summary of Results ($000)

APPENDIX D ALASKA REGA STUDY
Black & Veatch D-7 September 12, 2008
Scenario B - Natural Gas Scenario
1 2 3 7 12 22 30Line Description 2009 2010 2011 2015 2020 2030 2038 Total NPV
115 Path 4 - Independent Operation of the Railbelt Grid, Regional Economic Dispatch, Regional Resource Planning and Joint Project Development (Tax-Exempt)116 117 Economic Production Model118 119 Fuel Cost 368,642 318,950 346,714 329,796 308,358 528,600 846,170 13,940,131 5,463,091 120 121 Capital and Production Cost 162,776 205,298 172,510 196,848 348,347 746,618 1,186,714 15,901,842 5,421,429 122 Sales (105,025) (147,445) (97,410) (82,263) (170,593) (316,382) (467,958) (6,760,585) (2,456,393) 123 124 Northern Intertie Upgrade Costs - - - - 41,464 41,464 41,464 787,816 243,723 125 Southern Intertie Upgrade Costs - - - - 15,129 15,129 15,129 287,446 88,926 126 127 Subtotal - Economic Production Model 426,394 376,803 421,814 444,381 542,705 1,015,429 1,621,518 24,156,649 8,760,777 128 129 Organizational Costs130 131 Start-up Costs132 Implementation Plan 247 986 986 - - - - 4,932 3,979 133 Capital Investment 45 180 180 - - - - 899 725 134 Other Non-labor Costs 52 207 207 - - - - 1,035 835 135 Subtotal - Start-up Costs 343 1,373 1,373 - - - - 6,867 5,539 136 137 Operating Costs138 Direct Labor 1,954 8,050 8,291 9,332 10,818 14,539 18,418 365,957 144,886 139 Transferred Employee Salaries 645 2,656 2,736 3,080 3,570 4,798 6,078 120,766 47,812 140 Net Incremental Direct Labor 1,309 5,393 5,555 6,252 7,248 9,741 12,340 245,191 97,073 141 142 Pension and Benefits 524 2,157 2,222 2,501 2,899 3,897 4,936 98,077 38,829 143 144 Annual Licensing and Fees 522 537 553 623 723 979 1,251 24,988 10,083 145 Annual Maintenance / Hardware Replacement 54 55 57 182 206 263 321 6,498 2,508 146 Other Non-labor Costs 2,334 2,392 2,452 2,707 3,062 3,920 4,776 102,460 42,328 147 Subtotal - Operating Costs 4,742 10,535 10,839 12,264 14,139 18,800 23,624 477,214 190,822 148 149 Subtotal Organizational Costs 5,086 11,909 12,212 12,264 14,139 18,800 23,624 484,080 196,361 150 151 Grand Total 431,479 388,711 434,026 456,645 556,843 1,034,229 1,645,142 24,640,729 8,957,138 152
Summary of Results ($000)

APPENDIX D ALASKA REGA STUDY
Black & Veatch D-8 September 12, 2008
Scenario B - Natural Gas Scenario
1 2 3 7 12 22 30Line Description 2009 2010 2011 2015 2020 2030 2038 Total NPV
153 Path 4 - Independent Operation of the Railbelt Grid, Regional Economic Dispatch, Regional Resource Planning and Joint Project Development (Taxable)154 155 Economic Production Model156 157 Fuel Cost 368,642 318,950 346,714 329,796 308,358 528,600 846,170 13,940,131 5,463,091 158 159 Capital and Production Cost 162,776 205,298 172,510 196,848 349,688 766,554 1,209,364 16,171,952 5,491,727 160 Sales (105,025) (147,445) (97,410) (82,263) (170,593) (316,382) (467,958) (6,760,585) (2,456,393) 161 162 Northern Intertie Upgrade Costs - - - - 41,464 41,464 41,464 787,816 243,723 163 Southern Intertie Upgrade Costs - - - - 15,129 15,129 15,129 287,446 88,926 164 165 Subtotal - Economic Production Model 426,394 376,803 421,814 444,381 544,046 1,035,366 1,644,168 24,426,758 8,831,076 166 167 Organizational Costs168 169 Start-up Costs170 Implementation Plan 247 986 986 - - - - 4,932 3,979 171 Capital Investment 45 180 180 - - - - 899 725 172 Other Non-labor Costs 52 207 207 - - - - 1,035 835 173 Subtotal - Start-up Costs 343 1,373 1,373 - - - - 6,867 5,539 174 175 Operating Costs176 Direct Labor 1,954 8,050 8,291 9,332 10,818 14,539 18,418 365,957 144,886 177 Transferred Employee Salaries 645 2,656 2,736 3,080 3,570 4,798 6,078 120,766 47,812 178 Net Incremental Direct Labor 1,309 5,393 5,555 6,252 7,248 9,741 12,340 245,191 97,073 179 180 Pension and Benefits 524 2,157 2,222 2,501 2,899 3,897 4,936 98,077 38,829 181 182 Annual Licensing and Fees 522 537 553 623 723 979 1,251 24,988 10,083 183 Annual Maintenance / Hardware Replacement 54 55 57 182 206 263 321 6,498 2,508 184 Other Non-labor Costs 2,334 2,392 2,452 2,707 3,062 3,920 4,776 102,460 42,328 185 Subtotal - Operating Costs 4,742 10,535 10,839 12,264 14,139 18,800 23,624 477,214 190,822 186 187 Subtotal Organizational Costs 5,086 11,909 12,212 12,264 14,139 18,800 23,624 484,080 196,361 188 189 Grand Total 431,479 388,711 434,026 456,645 558,184 1,054,165 1,667,791 24,910,838 9,027,437 190
Summary of Results ($000)
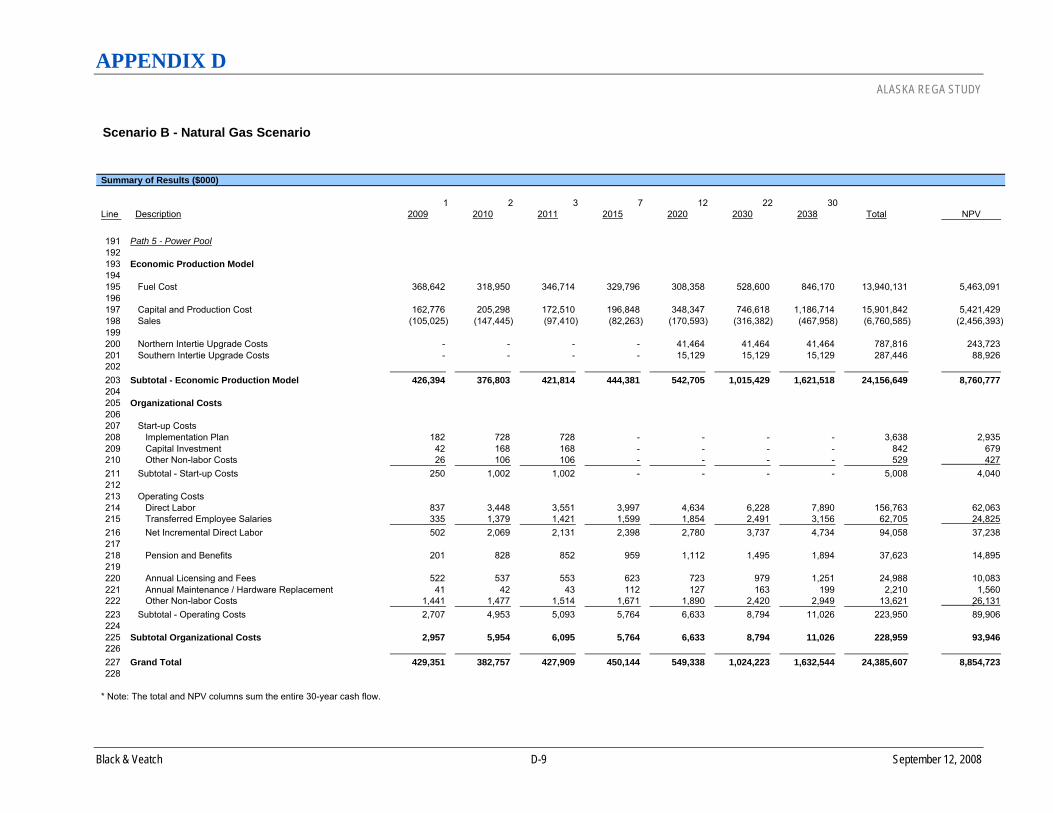
APPENDIX D ALASKA REGA STUDY
Black & Veatch D-9 September 12, 2008
Scenario B - Natural Gas Scenario
1 2 3 7 12 22 30Line Description 2009 2010 2011 2015 2020 2030 2038 Total NPV
191 Path 5 - Power Pool192 193 Economic Production Model194 195 Fuel Cost 368,642 318,950 346,714 329,796 308,358 528,600 846,170 13,940,131 5,463,091 196 197 Capital and Production Cost 162,776 205,298 172,510 196,848 348,347 746,618 1,186,714 15,901,842 5,421,429 198 Sales (105,025) (147,445) (97,410) (82,263) (170,593) (316,382) (467,958) (6,760,585) (2,456,393) 199 200 Northern Intertie Upgrade Costs - - - - 41,464 41,464 41,464 787,816 243,723 201 Southern Intertie Upgrade Costs - - - - 15,129 15,129 15,129 287,446 88,926 202 203 Subtotal - Economic Production Model 426,394 376,803 421,814 444,381 542,705 1,015,429 1,621,518 24,156,649 8,760,777 204 205 Organizational Costs206 207 Start-up Costs208 Implementation Plan 182 728 728 - - - - 3,638 2,935 209 Capital Investment 42 168 168 - - - - 842 679 210 Other Non-labor Costs 26 106 106 - - - - 529 427 211 Subtotal - Start-up Costs 250 1,002 1,002 - - - - 5,008 4,040 212 213 Operating Costs214 Direct Labor 837 3,448 3,551 3,997 4,634 6,228 7,890 156,763 62,063 215 Transferred Employee Salaries 335 1,379 1,421 1,599 1,854 2,491 3,156 62,705 24,825 216 Net Incremental Direct Labor 502 2,069 2,131 2,398 2,780 3,737 4,734 94,058 37,238 217 218 Pension and Benefits 201 828 852 959 1,112 1,495 1,894 37,623 14,895 219 220 Annual Licensing and Fees 522 537 553 623 723 979 1,251 24,988 10,083 221 Annual Maintenance / Hardware Replacement 41 42 43 112 127 163 199 2,210 1,560 222 Other Non-labor Costs 1,441 1,477 1,514 1,671 1,890 2,420 2,949 13,621 26,131 223 Subtotal - Operating Costs 2,707 4,953 5,093 5,764 6,633 8,794 11,026 223,950 89,906 224 225 Subtotal Organizational Costs 2,957 5,954 6,095 5,764 6,633 8,794 11,026 228,959 93,946 226 227 Grand Total 429,351 382,757 427,909 450,144 549,338 1,024,223 1,632,544 24,385,607 8,854,723 228
* Note: The total and NPV columns sum the entire 30-year cash flow.
Summary of Results ($000)

APPENDIX E ALASKA REGA STUDY
Black & Veatch E-1 September 12, 2008
APPENDIX E - SCENARIO C RESULTS
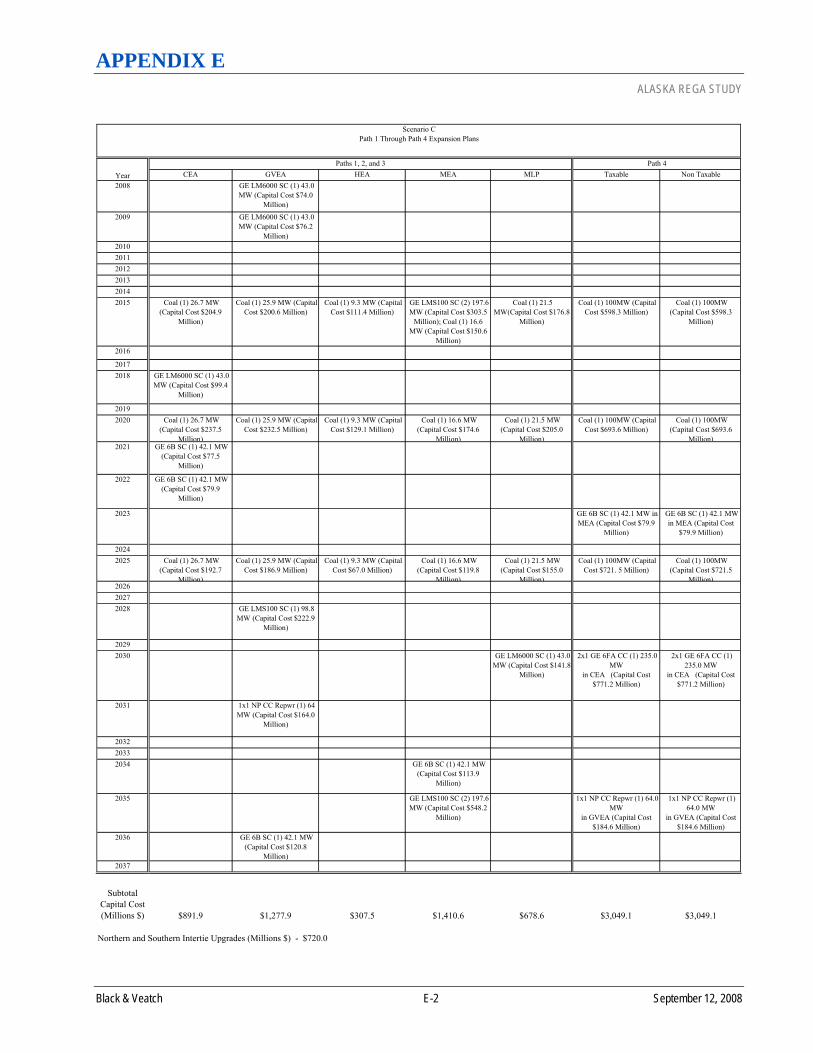
APPENDIX E ALASKA REGA STUDY
Black & Veatch E-2 September 12, 2008
CEA GVEA HEA MEA MLP Taxable Non Taxable2008 GE LM6000 SC (1) 43.0
MW (Capital Cost $74.0 Million)
2009 GE LM6000 SC (1) 43.0 MW (Capital Cost $76.2
Million) 201020112012201320142015 Coal (1) 26.7 MW
(Capital Cost $204.9 Million)
Coal (1) 25.9 MW (Capital Cost $200.6 Million)
Coal (1) 9.3 MW (Capital Cost $111.4 Million)
GE LMS100 SC (2) 197.6 MW (Capital Cost $303.5
Million); Coal (1) 16.6 MW (Capital Cost $150.6
Million)
Coal (1) 21.5 MW(Capital Cost $176.8
Million)
Coal (1) 100MW (Capital Cost $598.3 Million)
Coal (1) 100MW (Capital Cost $598.3
Million)
2016
20172018 GE LM6000 SC (1) 43.0
MW (Capital Cost $99.4 Million)
20192020 Coal (1) 26.7 MW
(Capital Cost $237.5 Million)
Coal (1) 25.9 MW (Capital Cost $232.5 Million)
Coal (1) 9.3 MW (Capital Cost $129.1 Million)
Coal (1) 16.6 MW (Capital Cost $174.6
Million)
Coal (1) 21.5 MW (Capital Cost $205.0
Million)
Coal (1) 100MW (Capital Cost $693.6 Million)
Coal (1) 100MW (Capital Cost $693.6
Million)2021 GE 6B SC (1) 42.1 MW
(Capital Cost $77.5 Million)
2022 GE 6B SC (1) 42.1 MW (Capital Cost $79.9
Million)
2023 GE 6B SC (1) 42.1 MW in MEA (Capital Cost $79.9
Million)
GE 6B SC (1) 42.1 MW in MEA (Capital Cost
$79.9 Million)
20242025 Coal (1) 26.7 MW
(Capital Cost $192.7 Million)
Coal (1) 25.9 MW (Capital Cost $186.9 Million)
Coal (1) 9.3 MW (Capital Cost $67.0 Million)
Coal (1) 16.6 MW (Capital Cost $119.8
Million)
Coal (1) 21.5 MW (Capital Cost $155.0
Million)
Coal (1) 100MW (Capital Cost $721. 5 Million)
Coal (1) 100MW (Capital Cost $721.5
Million)202620272028 GE LMS100 SC (1) 98.8
MW (Capital Cost $222.9 Million)
20292030 GE LM6000 SC (1) 43.0
MW (Capital Cost $141.8 Million)
2x1 GE 6FA CC (1) 235.0 MW
in CEA (Capital Cost $771.2 Million)
2x1 GE 6FA CC (1) 235.0 MW
in CEA (Capital Cost $771.2 Million)
2031 1x1 NP CC Repwr (1) 64 MW (Capital Cost $164.0
Million)
203220332034 GE 6B SC (1) 42.1 MW
(Capital Cost $113.9 Million)
2035 GE LMS100 SC (2) 197.6 MW (Capital Cost $548.2
Million)
1x1 NP CC Repwr (1) 64.0 MW
in GVEA (Capital Cost $184.6 Million)
1x1 NP CC Repwr (1) 64.0 MW
in GVEA (Capital Cost $184.6 Million)
2036 GE 6B SC (1) 42.1 MW (Capital Cost $120.8
Million) 2037
Subtotal Capital Cost (Millions $) $891.9 $1,277.9 $307.5 $1,410.6 $678.6 $3,049.1 $3,049.1
Northern and Southern Intertie Upgrades (Millions $) - $720.0
YearPaths 1, 2, and 3 Path 4
Scenario CPath 1 Through Path 4 Expansion Plans

APPENDIX E ALASKA REGA STUDY
Black & Veatch E-3 September 12, 2008
Year Path 1 Total Cost
Nominal $000
Path 2 Total Cost
Nominal $000
Path 3 Total Cost
Nominal $000
Path 4 Tax ExemptTotal Cost
Nominal $000
Path 4 Taxable
Total CostNominal $000
Path 2 Savings
Nominal $000
Path 3 Savings
Nominal $000
Path 4 Tax Exempt
SavingsNominal $000
Path 4 TaxableSavings
Nominal $0002008 373,532 373,532 363,359 355,971 355,971 - 10,173 17,561 17,561 2009 466,238 466,238 430,980 426,394 426,394 - 35,259 39,845 39,845 2010 403,643 403,643 391,922 376,803 376,803 - 11,721 26,841 26,841 2011 462,450 462,450 427,015 421,814 421,814 - 35,434 40,636 40,636 2012 455,019 455,019 436,209 421,024 421,024 - 18,810 33,995 33,995 2013 496,225 496,225 434,261 425,314 425,314 - 61,964 70,911 70,911 2014 426,726 426,726 415,815 400,277 400,277 - 10,911 26,448 26,448 2015 487,408 487,408 461,070 434,821 442,899 - 26,338 52,587 44,509 2016 501,956 501,956 486,220 418,073 426,151 - 15,736 83,883 75,805 2017 524,721 524,721 493,388 472,595 480,672 - 31,333 52,127 44,049 2018 551,824 551,824 534,719 457,681 465,758 - 17,105 94,143 86,065 2019 586,051 586,051 538,608 486,668 494,745 - 47,444 99,384 91,306 2020 719,028 719,028 695,313 587,631 605,073 - 23,715 131,396 113,955 2021 726,207 726,207 707,134 604,116 621,557 - 19,073 122,091 104,649 2022 791,667 791,667 777,923 651,133 668,575 - 13,744 140,534 123,092 2023 810,976 810,976 790,473 691,736 710,217 - 20,502 119,239 100,758 2024 871,802 871,802 857,897 739,849 758,330 - 13,905 131,953 113,472 2025 947,460 947,460 919,864 811,068 839,288 - 27,596 136,393 108,172 2026 994,950 994,950 957,363 846,602 874,822 - 37,587 148,348 120,128 2027 1,038,539 1,038,539 1,001,569 904,083 932,303 - 36,970 134,457 106,236 2028 1,098,013 1,098,013 1,063,751 939,805 968,025 - 34,262 158,208 129,987 2029 1,156,902 1,156,902 1,119,408 1,021,850 1,050,071 - 37,494 135,052 106,832 2030 1,212,390 1,212,390 1,182,680 1,081,600 1,120,180 - 29,710 130,790 92,210 2031 1,305,425 1,305,425 1,273,902 1,146,607 1,185,187 - 31,524 158,819 120,238 2032 1,370,568 1,370,568 1,337,953 1,210,141 1,248,721 - 32,616 160,427 121,847 2033 1,451,246 1,451,246 1,416,769 1,282,778 1,321,358 - 34,477 168,468 129,887 2034 1,540,873 1,540,873 1,504,798 1,355,483 1,394,063 - 36,075 185,390 146,810 2035 1,675,650 1,675,650 1,636,561 1,465,136 1,505,868 - 39,089 210,514 169,782 2036 1,778,562 1,778,562 1,738,940 1,549,103 1,589,835 - 39,621 229,458 188,726 2037 1,912,745 1,912,745 1,868,854 1,674,171 1,714,903 - 43,891 238,574 197,842
- 373,252 1,214,798 1,043,040 - 299,660 906,956 787,971 - 246,936 695,591 611,522 - 166,649 397,882 359,665 Cumulative Present Worth Savings Based on 15.0 percent Discount Rate:
Scenario CPath 1 Through Path 4 Total Costs and Savings Comparison
Cumulative Present Worth Savings Based on 6.0 percent Discount Rate:Cumulative Present Worth Savings Based on 8.0 percent Discount Rate:Cumulative Present Worth Savings Based on 10.0 percent Discount Rate:
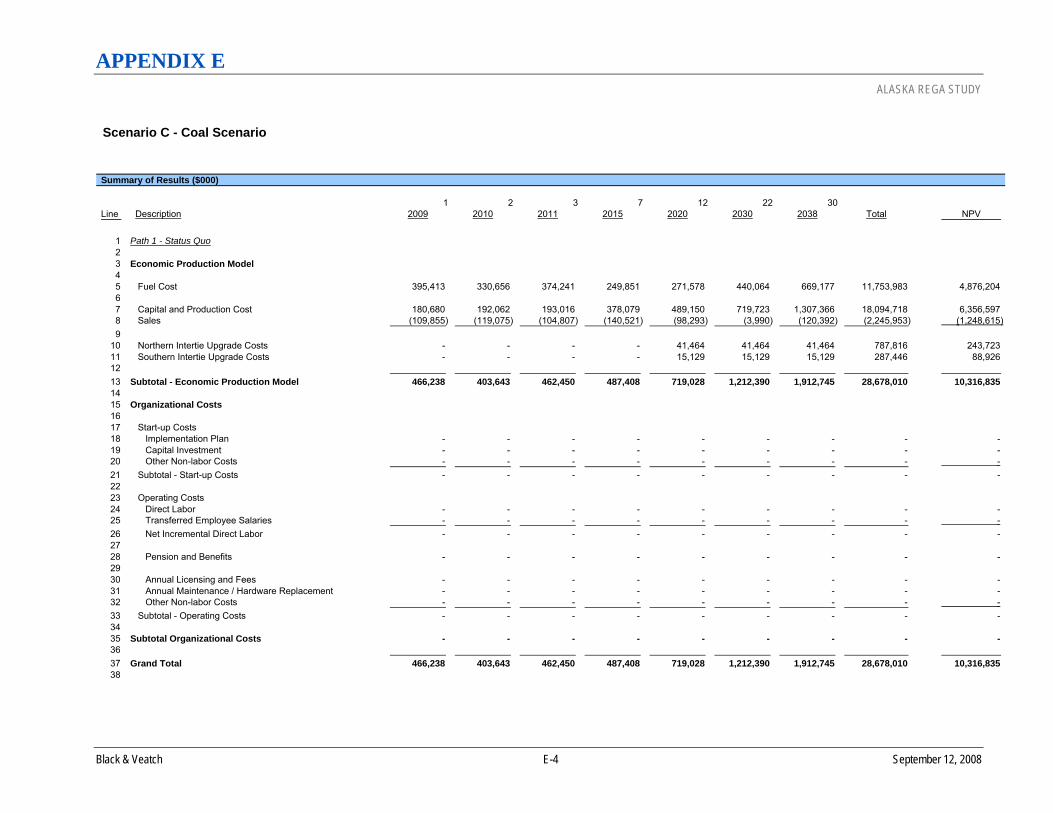
APPENDIX E ALASKA REGA STUDY
Black & Veatch E-4 September 12, 2008
Scenario C - Coal Scenario
1 2 3 7 12 22 30Line Description 2009 2010 2011 2015 2020 2030 2038 Total NPV
1 Path 1 - Status Quo2 3 Economic Production Model4 5 Fuel Cost 395,413 330,656 374,241 249,851 271,578 440,064 669,177 11,753,983 4,876,204 6 7 Capital and Production Cost 180,680 192,062 193,016 378,079 489,150 719,723 1,307,366 18,094,718 6,356,597 8 Sales (109,855) (119,075) (104,807) (140,521) (98,293) (3,990) (120,392) (2,245,953) (1,248,615) 9
10 Northern Intertie Upgrade Costs - - - - 41,464 41,464 41,464 787,816 243,723 11 Southern Intertie Upgrade Costs - - - - 15,129 15,129 15,129 287,446 88,926 12 13 Subtotal - Economic Production Model 466,238 403,643 462,450 487,408 719,028 1,212,390 1,912,745 28,678,010 10,316,835 14 15 Organizational Costs16 17 Start-up Costs18 Implementation Plan - - - - - - - - - 19 Capital Investment - - - - - - - - - 20 Other Non-labor Costs - - - - - - - - - 21 Subtotal - Start-up Costs - - - - - - - - - 22 23 Operating Costs24 Direct Labor - - - - - - - - - 25 Transferred Employee Salaries - - - - - - - - - 26 Net Incremental Direct Labor - - - - - - - - - 27 28 Pension and Benefits - - - - - - - - - 29 30 Annual Licensing and Fees - - - - - - - - - 31 Annual Maintenance / Hardware Replacement - - - - - - - - - 32 Other Non-labor Costs - - - - - - - - - 33 Subtotal - Operating Costs - - - - - - - - - 34 35 Subtotal Organizational Costs - - - - - - - - - 36 37 Grand Total 466,238 403,643 462,450 487,408 719,028 1,212,390 1,912,745 28,678,010 10,316,835 38
Summary of Results ($000)

APPENDIX E ALASKA REGA STUDY
Black & Veatch E-5 September 12, 2008
Scenario C - Coal Scenario
1 2 3 7 12 22 30Line Description 2009 2010 2011 2015 2020 2030 2038 Total NPV
39 Path 2 - Independent Operation of the Railbelt Grid40 41 Economic Production Model42 43 Fuel Cost 395,413 330,656 374,241 249,851 271,578 440,064 669,177 11,753,983 4,876,204 44 45 Capital and Production Cost 180,680 192,062 193,016 378,079 489,150 719,723 1,307,366 18,094,718 6,356,597 46 Sales (109,855) (119,075) (104,807) (140,521) (98,293) (3,990) (120,392) (2,245,953) (1,248,615) 47 48 Northern Intertie Upgrade Costs - - - - 41,464 41,464 41,464 787,816 243,723 49 Southern Intertie Upgrade Costs - - - - 15,129 15,129 15,129 287,446 88,926 50 51 Subtotal - Economic Production Model 466,238 403,643 462,450 487,408 719,028 1,212,390 1,912,745 28,678,010 10,316,835 52 53 Organizational Costs54 55 Start-up Costs56 Implementation Plan 67 267 267 - - - - 1,335 1,077 57 Capital Investment 5 21 21 - - - - 103 83 58 Other Non-labor Costs 17 67 67 - - - - 332 268 59 Subtotal - Start-up Costs 89 354 354 - - - - 1,770 1,428 60 61 Operating Costs62 Direct Labor 450 1,854 1,910 2,149 2,491 3,349 4,242 84,282 33,368 63 Transferred Employee Salaries 225 927 955 1,075 1,246 1,674 2,121 42,142 16,684 64 Net Incremental Direct Labor 225 927 955 1,075 1,246 1,674 2,121 42,140 16,684 65 66 Pension and Benefits 90 371 382 430 498 670 848 16,856 6,674 67 68 Annual Licensing and Fees 19 19 20 22 24 31 38 815 337 69 Annual Maintenance / Hardware Replacement 34 34 35 80 90 116 141 2,866 1,116 70 Other Non-labor Costs 657 674 690 762 862 1,104 1,345 28,849 11,918 71 Subtotal - Operating Costs 1,024 2,025 2,082 2,368 2,721 3,594 4,493 91,527 36,728 72 73 Subtotal Organizational Costs 1,113 2,379 2,436 2,368 2,721 3,594 4,493 93,297 38,156 74 75 Grand Total 467,351 406,022 464,885 489,776 721,749 1,215,984 1,917,237 28,771,306 10,354,992 76
Summary of Results ($000)

APPENDIX E ALASKA REGA STUDY
Black & Veatch E-6 September 12, 2008
Scenario C - Coal Scenario
1 2 3 7 12 22 30Line Description 2009 2010 2011 2015 2020 2030 2038 Total NPV
77 Path 3 - Independent Operation of the Railbelt Grid and Regional Economic Dispatch78 79 Economic Production Model80 81 Fuel Cost 359,283 318,911 337,895 224,854 252,511 404,674 597,851 10,802,472 4,480,153 82 83 Capital and Production Cost 166,746 202,248 174,300 392,700 646,564 1,118,223 1,921,271 25,612,979 8,489,737 84 Sales (95,050) (129,236) (85,180) (156,484) (260,355) (396,811) (706,862) (9,720,499) (3,378,821) 85 86 Northern Intertie Upgrade Costs - - - - 41,464 41,464 41,464 787,816 243,723 87 Southern Intertie Upgrade Costs - - - - 15,129 15,129 15,129 287,446 88,926 88 89 Subtotal - Economic Production Model 430,980 391,922 427,015 461,070 695,313 1,182,680 1,868,854 27,770,213 9,923,718 90 91 Organizational Costs92 93 Start-up Costs94 Implementation Plan 139 557 557 - - - - 2,787 2,248 95 Capital Investment 37 148 148 - - - - 741 597 96 Other Non-labor Costs 22 87 87 - - - - 436 352 97 Subtotal - Start-up Costs 198 793 793 - - - - 3,963 3,197 98 99 Operating Costs
100 Direct Labor 626 2,578 2,655 2,989 3,465 4,657 5,899 117,206 46,402 101 Transferred Employee Salaries 250 1,031 1,062 1,195 1,386 1,863 2,360 46,882 18,561 102 Net Incremental Direct Labor 375 1,547 1,593 1,793 2,079 2,794 3,539 70,323 27,841 103 104 Pension and Benefits 150 619 637 717 832 1,118 1,416 28,130 11,137 105 106 Annual Licensing and Fees 505 521 536 604 702 951 1,217 24,265 9,784 107 Annual Maintenance / Hardware Replacement 39 40 41 100 113 145 177 3,589 1,394 108 Other Non-labor Costs 1,126 1,154 1,183 1,305 1,477 1,891 2,304 49,422 20,416 109 Subtotal - Operating Costs 2,196 3,880 3,990 4,520 5,202 6,899 8,653 175,729 70,572 110 111 Subtotal Organizational Costs 2,394 4,673 4,783 4,520 5,202 6,899 8,653 179,692 73,769 112 113 Grand Total 433,374 396,595 431,798 465,590 700,515 1,189,578 1,877,507 27,949,905 9,997,487 114
Summary of Results ($000)
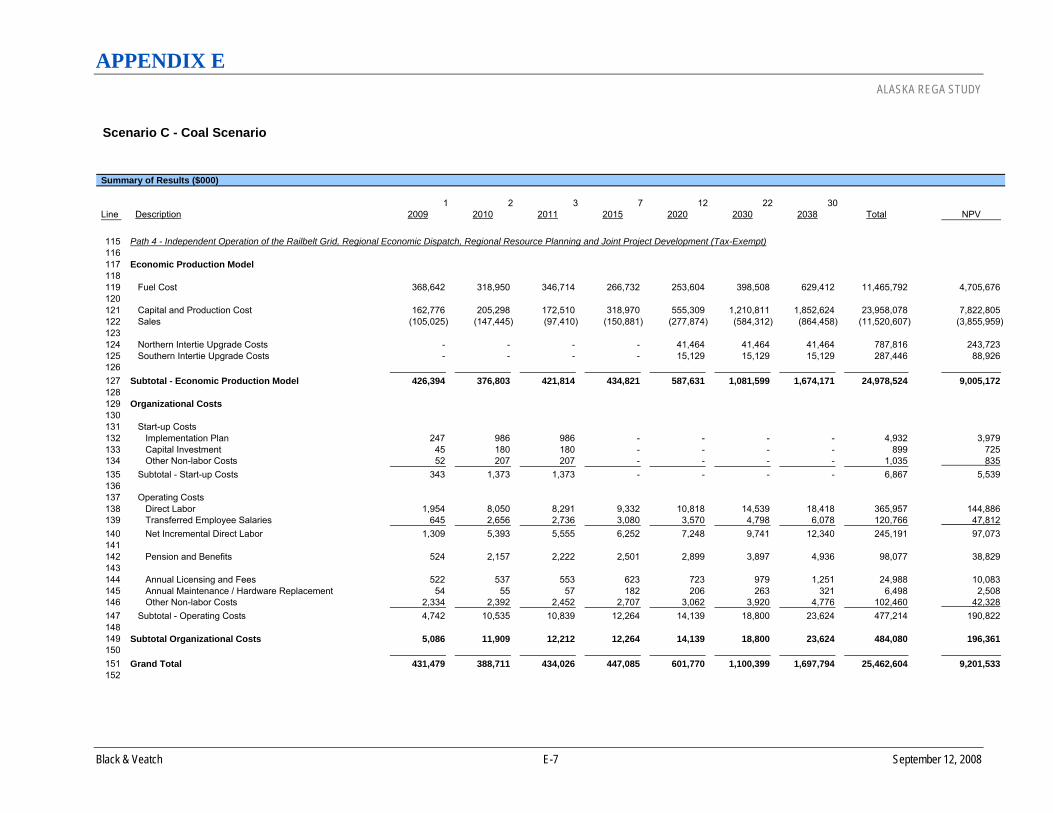
APPENDIX E ALASKA REGA STUDY
Black & Veatch E-7 September 12, 2008
Scenario C - Coal Scenario
1 2 3 7 12 22 30Line Description 2009 2010 2011 2015 2020 2030 2038 Total NPV
115 Path 4 - Independent Operation of the Railbelt Grid, Regional Economic Dispatch, Regional Resource Planning and Joint Project Development (Tax-Exempt)116 117 Economic Production Model118 119 Fuel Cost 368,642 318,950 346,714 266,732 253,604 398,508 629,412 11,465,792 4,705,676 120 121 Capital and Production Cost 162,776 205,298 172,510 318,970 555,309 1,210,811 1,852,624 23,958,078 7,822,805 122 Sales (105,025) (147,445) (97,410) (150,881) (277,874) (584,312) (864,458) (11,520,607) (3,855,959) 123 124 Northern Intertie Upgrade Costs - - - - 41,464 41,464 41,464 787,816 243,723 125 Southern Intertie Upgrade Costs - - - - 15,129 15,129 15,129 287,446 88,926 126 127 Subtotal - Economic Production Model 426,394 376,803 421,814 434,821 587,631 1,081,599 1,674,171 24,978,524 9,005,172 128 129 Organizational Costs130 131 Start-up Costs132 Implementation Plan 247 986 986 - - - - 4,932 3,979 133 Capital Investment 45 180 180 - - - - 899 725 134 Other Non-labor Costs 52 207 207 - - - - 1,035 835 135 Subtotal - Start-up Costs 343 1,373 1,373 - - - - 6,867 5,539 136 137 Operating Costs138 Direct Labor 1,954 8,050 8,291 9,332 10,818 14,539 18,418 365,957 144,886 139 Transferred Employee Salaries 645 2,656 2,736 3,080 3,570 4,798 6,078 120,766 47,812 140 Net Incremental Direct Labor 1,309 5,393 5,555 6,252 7,248 9,741 12,340 245,191 97,073 141 142 Pension and Benefits 524 2,157 2,222 2,501 2,899 3,897 4,936 98,077 38,829 143 144 Annual Licensing and Fees 522 537 553 623 723 979 1,251 24,988 10,083 145 Annual Maintenance / Hardware Replacement 54 55 57 182 206 263 321 6,498 2,508 146 Other Non-labor Costs 2,334 2,392 2,452 2,707 3,062 3,920 4,776 102,460 42,328 147 Subtotal - Operating Costs 4,742 10,535 10,839 12,264 14,139 18,800 23,624 477,214 190,822 148 149 Subtotal Organizational Costs 5,086 11,909 12,212 12,264 14,139 18,800 23,624 484,080 196,361 150 151 Grand Total 431,479 388,711 434,026 447,085 601,770 1,100,399 1,697,794 25,462,604 9,201,533 152
Summary of Results ($000)

APPENDIX E ALASKA REGA STUDY
Black & Veatch E-8 September 12, 2008
Scenario C - Coal Scenario
1 2 3 7 12 22 30Line Description 2009 2010 2011 2015 2020 2030 2038 Total NPV
153 Path 4 - Independent Operation of the Railbelt Grid, Regional Economic Dispatch, Regional Resource Planning and Joint Project Development (Taxable)154 155 Economic Production Model156 157 Fuel Cost 368,642 318,950 346,714 266,732 253,604 398,508 629,412 11,465,792 4,705,676 158 159 Capital and Production Cost 162,776 205,298 172,510 327,048 572,751 1,249,391 1,893,356 24,584,683 8,011,961 160 Sales (105,025) (147,445) (97,410) (150,881) (277,874) (584,312) (864,458) (11,520,607) (3,855,959) 161 162 Northern Intertie Upgrade Costs - - - - 41,464 41,464 41,464 787,816 243,723 163 Southern Intertie Upgrade Costs - - - - 15,129 15,129 15,129 287,446 88,926 164 165 Subtotal - Economic Production Model 426,394 376,803 421,814 442,899 605,073 1,120,180 1,714,903 25,605,129 9,194,327 166 167 Organizational Costs168 169 Start-up Costs170 Implementation Plan 247 986 986 - - - - 4,932 3,979 171 Capital Investment 45 180 180 - - - - 899 725 172 Other Non-labor Costs 52 207 207 - - - - 1,035 835 173 Subtotal - Start-up Costs 343 1,373 1,373 - - - - 6,867 5,539 174 175 Operating Costs176 Direct Labor 1,954 8,050 8,291 9,332 10,818 14,539 18,418 365,957 144,886 177 Transferred Employee Salaries 645 2,656 2,736 3,080 3,570 4,798 6,078 120,766 47,812 178 Net Incremental Direct Labor 1,309 5,393 5,555 6,252 7,248 9,741 12,340 245,191 97,073 179 180 Pension and Benefits 524 2,157 2,222 2,501 2,899 3,897 4,936 98,077 38,829 181 182 Annual Licensing and Fees 522 537 553 623 723 979 1,251 24,988 10,083 183 Annual Maintenance / Hardware Replacement 54 55 57 182 206 263 321 6,498 2,508 184 Other Non-labor Costs 2,334 2,392 2,452 2,707 3,062 3,920 4,776 102,460 42,328 185 Subtotal - Operating Costs 4,742 10,535 10,839 12,264 14,139 18,800 23,624 477,214 190,822 186 187 Subtotal Organizational Costs 5,086 11,909 12,212 12,264 14,139 18,800 23,624 484,080 196,361 188 189 Grand Total 431,479 388,711 434,026 455,163 619,211 1,138,979 1,738,526 26,089,209 9,390,688 190
Summary of Results ($000)

APPENDIX E ALASKA REGA STUDY
Black & Veatch E-9 September 12, 2008
Scenario C - Coal Scenario
1 2 3 7 12 22 30Line Description 2009 2010 2011 2015 2020 2030 2038 Total NPV
191 Path 5 - Power Pool192 193 Economic Production Model194 195 Fuel Cost 368,642 318,950 346,714 266,732 253,604 398,508 629,412 11,465,792 4,705,676 196 197 Capital and Production Cost 162,776 205,298 172,510 318,970 555,309 1,210,811 1,852,624 23,958,078 7,822,805 198 Sales (105,025) (147,445) (97,410) (150,881) (277,874) (584,312) (864,458) (11,520,607) (3,855,959) 199 200 Northern Intertie Upgrade Costs - - - - 41,464 41,464 41,464 787,816 243,723 201 Southern Intertie Upgrade Costs - - - - 15,129 15,129 15,129 287,446 88,926 202 203 Subtotal - Economic Production Model 426,394 376,803 421,814 434,821 587,631 1,081,599 1,674,171 24,978,524 9,005,172 204 205 Organizational Costs206 207 Start-up Costs208 Implementation Plan 182 728 728 - - - - 3,638 2,935 209 Capital Investment 42 168 168 - - - - 842 679 210 Other Non-labor Costs 26 106 106 - - - - 529 427 211 Subtotal - Start-up Costs 250 1,002 1,002 - - - - 5,008 4,040 212 213 Operating Costs214 Direct Labor 837 3,448 3,551 3,997 4,634 6,228 7,890 156,763 62,063 215 Transferred Employee Salaries 335 1,379 1,421 1,599 1,854 2,491 3,156 62,705 24,825 216 Net Incremental Direct Labor 502 2,069 2,131 2,398 2,780 3,737 4,734 94,058 37,238 217 218 Pension and Benefits 201 828 852 959 1,112 1,495 1,894 37,623 14,895 219 220 Annual Licensing and Fees 522 537 553 623 723 979 1,251 24,988 10,083 221 Annual Maintenance / Hardware Replacement 41 42 43 112 127 163 199 2,210 1,560 222 Other Non-labor Costs 1,441 1,477 1,514 1,671 1,890 2,420 2,949 13,621 26,131 223 Subtotal - Operating Costs 2,707 4,953 5,093 5,764 6,633 8,794 11,026 223,950 89,906 224 225 Subtotal Organizational Costs 2,957 5,954 6,095 5,764 6,633 8,794 11,026 228,959 93,946 226 227 Grand Total 429,351 382,757 427,909 440,585 594,265 1,090,393 1,685,197 25,207,483 9,099,118 228
* Note: The total and NPV columns sum the entire 30-year cash flow.
Summary of Results ($000)

APPENDIX F ALASKA REGA STUDY
Black & Veatch F-1 September 12, 2008
APPENDIX F - SCENARIO D RESULTS

APPENDIX F ALASKA REGA STUDY
Black & Veatch F-2 September 12, 2008
CEA GVEA HEA MEA MLP Taxable Non Taxable2008 GE LM6000 SC (1) 43.0
MW (Capital Cost $74.0 Million)
2009 GE LM6000 SC (1) 43.0 MW (Capital Cost $76.2
Million) 201020112012 Wind (1) 13.4 MW
(Capital Cost $71.3 Million)
Wind (1) 13.0 MW (Capital Cost $70.2
Million)
Wind (1) 4.6 MW (Capital Cost $46.8
Million)
Wind (1) 8.3 MW (Capital Cost $57.1
Million)
Wind (1) 10.7 MW (Capital Cost $64.0
Million)
Wind (1) 50.0 MW (Capital Cost $174.5
Million)
Wind (1) 50.0 MW (Capital Cost $174.5
Million) 201320142015 Coal (1) 26.7 MW
(Capital Cost $204.9 Million)
Coal (1) 25.9 MW (Capital Cost $200.6
Million)
Coal (1) 9.3 MW (Capital Cost $111.4
Million)
GE LMS100 SC (2) 197.6 MW (Capital Cost $303.6 Million); Coal (1) 16.6 MW (Capital Cost
$150.6 Million)
Coal (1) 21.5 MW(Capital Cost $176.8 Million)
201620172018 GE LM6000 SC (1) 43.0
MW (Capital Cost $99.4 Million); Wind (1) 13.4
MW (Capital Cost $44.8 Million)
Wind (1) 13.0 MW (Capital Cost $43.5
Million)
Wind (1) 4.6 MW (Capital Cost $15.6
Million)
Wind (1) 8.3 MW (Capital Cost $27.9
Million)
Wind (1) 10.7 MW (Capital Cost $36.1
Million)
GE LM6000 SC (1) 43.0 MW in MEA (Capital Cost $99.5
Million)
GE LM6000 SC (1) 43.0 MW in MEA (Capital Cost $99.5
Million)
2019 GE 6B SC (1) 42.1 MW (Capital Cost $73.1
Million)
2020 Hydro (1) 80.1 MW (Capital Cost $782.4
Million); Coal (1) 26.7 MW (Capital Cost $237.5
Million)
Hydro (1) 77.7 MW (Capital Cost $763.2
Million) ; Coal (1) 25.9 MW (Capital Cost $232.5
Million)
Hydro (1) 27.9 MW (Capital Cost $365.1
Million); Coal (1) 9.3 MW (Capital Cost
$129.1 Million)
Hydro (1) 49.8 MW (Capital Cost $540.4
Million); Coal (1) 16.6 MW (Capital Cost
$174.6 Million)
Hydro (1) 64.5 MW (Capital Cost $657.2
Million); Coal (1) 21.5 MW (Capital Cost
$205.0 Million)
Hydro (1) 300 MW (Capital Cost $2537.9 Million)
Hydro (1) 300 MW (Capital Cost
$2537.9 Million)
2021 GE LM6000 SC (2) 86.0 MW in MEA
(Capital Cost $217.3 Million)
GE LM6000 SC (2) 86.0 MW in MEA
(Capital Cost $217.3 Million)
2022 GE LMS100 SC (1) 98.8 MW (Capital Cost $186.7
Million) 202320242025 Hydro (1) 80.1 MW
(Capital Cost $907.0 Million); Coal (1) 26.7
MW (Capital Cost $192.7 Million)
Hydro (1) 77.7 MW (Capital Cost $884.7
Million); Coal (1) 25.9 MW (Capital Cost $186.9
Million)
Hydro (1) 27.9 MW (Capital Cost $423.3
Million); Coal (1) 9.3 MW (Capital Cost $67.0
Million)
Hydro (1) 49.8 MW (Capital Cost $626.4
Million); Coal (1) 16.6 MW (Capital Cost
$119.8 Million)
Hydro (1) 64.5 MW (Capital Cost $761.8
Million); Coal (1) 21.5 MW (Capital Cost
$155.0 Million)
Coal (1) 100.0 MW (Capital Cost $721.
5 Million)
Coal (1) 100.0 MW (Capital Cost $721.5
Million)
202620272028 GE LMS100 SC (1) 98.8
MW (Capital Cost $222.9 Million)
20292030 GE LM6000 SC (1)
43.0 MW (Capital Cost $141.8 Million)
GE 2X1 6FA CC (1) 235.0 MW in
CEA (Capital Cost $771.2 Million)
GE 2X1 6FA CC (1) 235.0 MW in CEA
(Capital Cost $771.2 Million)
2031 GE 6B SC (1) 42.1 MW (Capital Cost $104.2
Million)
2032203320342035 GE 1X1 6FA CC (1)
116.0 MW (Capital Cost $563.8 Million); GE LMS100 SC (1) 98.8
MW(Capital Cost $274.1 Million)
20362037 GE LMS100 (1)
98.8 MW in GVEA (Capital Cost $290.8
Million)
GE 1X1 6FA CC (1) 116.0 MW in GVEA (Capital Cost $598.1
Million)
Subtotal Capital Cost (Millions $) $2,726.7 $2,932.0 $1,158.3 $2,838.3 $2,197.7 $4,812.7 $5,120.0
Northern and Southern Intertie Upgrades (Millions $) - $720.0
YearPaths 1, 2, and 3
Scenario DPath 1 Through Path 4 Expansion Plans
Path 4

APPENDIX F ALASKA REGA STUDY
Black & Veatch F-3 September 12, 2008
Year Path 1 Total Cost
Nominal $000
Path 2 Total Cost
Nominal $000
Path 3 Total Cost
Nominal $000
Path 4 Tax ExemptTotal Cost
Nominal $000
Path 4 Taxable
Total CostNominal $000
Path 2 Savings
Nominal $000
Path 3 Savings
Nominal $000
Path 4 Tax Exempt
SavingsNominal $000
Path 4 TaxableSavings
Nominal $0002008 373,799 373,799 363,359 355,972 355,972 - 10,439 17,827 17,827 2009 466,416 466,416 430,980 426,394 426,394 - 35,436 40,022 40,022 2010 403,819 403,819 391,922 376,803 376,803 - 11,897 27,016 27,016 2011 462,600 462,600 427,015 421,814 421,814 - 35,584 40,786 40,786 2012 478,524 478,524 460,037 431,832 433,996 - 18,487 46,692 44,528 2013 520,130 520,130 458,264 436,539 438,702 - 61,867 83,591 81,428 2014 452,305 452,305 442,286 413,742 415,905 - 10,019 38,563 36,400 2015 458,959 458,959 439,736 460,338 462,502 - 19,222 (1,380) (3,543) 2016 476,257 476,257 460,342 414,081 416,244 - 15,915 62,177 60,013 2017 522,000 522,000 476,795 492,495 494,658 - 45,205 29,505 27,342 2018 532,447 532,447 515,047 473,543 476,958 - 17,400 58,904 55,489 2019 594,451 594,451 542,438 506,465 509,880 - 52,014 87,986 84,571 2020 850,414 850,414 830,680 705,844 743,520 - 19,734 144,570 106,894 2021 845,250 845,250 831,156 739,445 779,857 - 14,093 105,805 65,393 2022 908,504 908,504 901,952 774,754 815,167 - 6,552 133,750 93,338 2023 934,457 934,457 924,576 822,392 862,804 - 9,882 112,065 71,653 2024 986,928 986,928 986,218 859,669 900,081 - 710 127,259 86,847 2025 1,063,548 1,063,548 1,051,320 931,294 981,446 - 12,228 132,254 82,101 2026 1,114,375 1,114,375 1,090,277 976,322 1,026,475 - 24,098 138,053 87,901 2027 1,154,740 1,154,740 1,131,289 1,025,692 1,075,844 - 23,451 129,048 78,896 2028 1,215,862 1,215,862 1,190,163 1,063,485 1,113,637 - 25,699 152,377 102,224 2029 1,270,010 1,270,010 1,244,118 1,137,638 1,187,790 - 25,892 132,372 82,220 2030 1,321,964 1,321,964 1,301,310 1,179,742 1,240,254 - 20,654 142,222 81,710 2031 1,409,441 1,409,441 1,384,580 1,243,804 1,304,316 - 24,861 165,636 105,124 2032 1,465,159 1,465,159 1,441,632 1,297,640 1,358,152 - 23,527 167,519 107,007 2033 1,541,357 1,541,357 1,516,005 1,367,133 1,427,645 - 25,352 174,223 113,711 2034 1,609,185 1,609,185 1,581,989 1,430,531 1,491,042 - 27,196 178,654 118,142 2035 1,729,213 1,729,213 1,706,688 1,521,299 1,581,811 - 22,525 207,913 147,401 2036 1,810,219 1,810,219 1,784,456 1,594,802 1,655,313 - 25,763 215,418 154,906 2037 1,928,576 1,928,576 1,901,576 1,729,468 1,717,665 - 27,001 199,109 210,912
- 324,172 1,137,193 871,813 - 266,968 847,000 662,861 - 224,881 648,717 518,849 - 158,002 371,688 313,684 Cumulative Present Worth Savings Based on 15.0 percent Discount Rate:
Scenario DPath 1 Through Path 4 Total Costs and Savings Comparison
Cumulative Present Worth Savings Based on 6.0 percent Discount Rate:Cumulative Present Worth Savings Based on 8.0 percent Discount Rate:Cumulative Present Worth Savings Based on 10.0 percent Discount Rate:

APPENDIX F ALASKA REGA STUDY
Black & Veatch F-4 September 12, 2008
Scenario D - Mixed Resource Portfolio Scenario
1 2 3 7 12 22 30Line Description 2009 2010 2011 2015 2020 2030 2038 Total NPV
1 Path 1 - Status Quo2 3 Economic Production Model4 5 Fuel Cost 395,591 330,856 374,392 267,994 295,377 454,321 687,288 12,264,054 5,049,269 6 7 Capital and Production Cost 180,488 190,389 192,913 379,225 620,812 1,084,896 1,770,285 24,169,418 8,051,673 8 Sales (109,663) (117,425) (104,705) (188,260) (122,367) (273,845) (585,589) (7,053,047) (2,501,851) 9
10 Northern Intertie Upgrade Costs - - - - 41,464 41,464 41,464 787,816 243,723 11 Southern Intertie Upgrade Costs - - - - 15,129 15,129 15,129 287,446 88,926 12 13 Subtotal - Economic Production Model 466,416 403,819 462,600 458,958 850,414 1,321,964 1,928,576 30,455,687 10,931,741 14 15 Organizational Costs16 17 Start-up Costs18 Implementation Plan - - - - - - - - - 19 Capital Investment - - - - - - - - - 20 Other Non-labor Costs - - - - - - - - - 21 Subtotal - Start-up Costs - - - - - - - - - 22 23 Operating Costs24 Direct Labor - - - - - - - - - 25 Transferred Employee Salaries - - - - - - - - - 26 Net Incremental Direct Labor - - - - - - - - - 27 28 Pension and Benefits - - - - - - - - - 29 30 Annual Licensing and Fees - - - - - - - - - 31 Annual Maintenance / Hardware Replacement - - - - - - - - - 32 Other Non-labor Costs - - - - - - - - - 33 Subtotal - Operating Costs - - - - - - - - - 34 35 Subtotal Organizational Costs - - - - - - - - - 36 37 Grand Total 466,416 403,819 462,600 458,958 850,414 1,321,964 1,928,576 30,455,687 10,931,741 38
Summary of Results ($000)

APPENDIX F ALASKA REGA STUDY
Black & Veatch F-5 September 12, 2008
Scenario D - Mixed Resource Portfolio Scenario
1 2 3 7 12 22 30Line Description 2009 2010 2011 2015 2020 2030 2038 Total NPV
39 Path 2 - Independent Operation of the Railbelt Grid40 41 Economic Production Model42 43 Fuel Cost 395,591 330,856 374,392 267,994 295,377 454,321 687,288 12,264,054 5,049,269 44 45 Capital and Production Cost 180,488 190,389 192,913 379,225 620,812 1,084,896 1,770,285 24,169,418 8,051,673 46 Sales (109,663) (117,425) (104,705) (188,260) (122,367) (273,845) (585,589) (7,053,047) (2,501,851) 47 48 Northern Intertie Upgrade Costs - - - - 41,464 41,464 41,464 787,816 243,723 49 Southern Intertie Upgrade Costs - - - - 15,129 15,129 15,129 287,446 88,926 50 51 Subtotal - Economic Production Model 466,416 403,819 462,600 458,958 850,414 1,321,964 1,928,576 30,455,687 10,931,741 52 53 Organizational Costs54 55 Start-up Costs56 Implementation Plan 67 267 267 - - - - 1,335 1,077 57 Capital Investment 5 21 21 - - - - 103 83 58 Other Non-labor Costs 17 67 67 - - - - 332 268 59 Subtotal - Start-up Costs 89 354 354 - - - - 1,770 1,428 60 61 Operating Costs62 Direct Labor 450 1,854 1,910 2,149 2,491 3,349 4,242 84,282 33,368 63 Transferred Employee Salaries 225 927 955 1,075 1,246 1,674 2,121 42,142 16,684 64 Net Incremental Direct Labor 225 927 955 1,075 1,246 1,674 2,121 42,140 16,684 65 66 Pension and Benefits 90 371 382 430 498 670 848 16,856 6,674 67 68 Annual Licensing and Fees 19 19 20 22 24 31 38 815 337 69 Annual Maintenance / Hardware Replacement 34 34 35 80 90 116 141 2,866 1,116 70 Other Non-labor Costs 657 674 690 762 862 1,104 1,345 28,849 11,918 71 Subtotal - Operating Costs 1,024 2,025 2,082 2,368 2,721 3,594 4,493 91,527 36,728 72 73 Subtotal Organizational Costs 1,113 2,379 2,436 2,368 2,721 3,594 4,493 93,297 38,156 74 75 Grand Total 467,529 406,198 465,035 461,326 853,135 1,325,558 1,933,069 30,548,984 10,969,897 76
Summary of Results ($000)
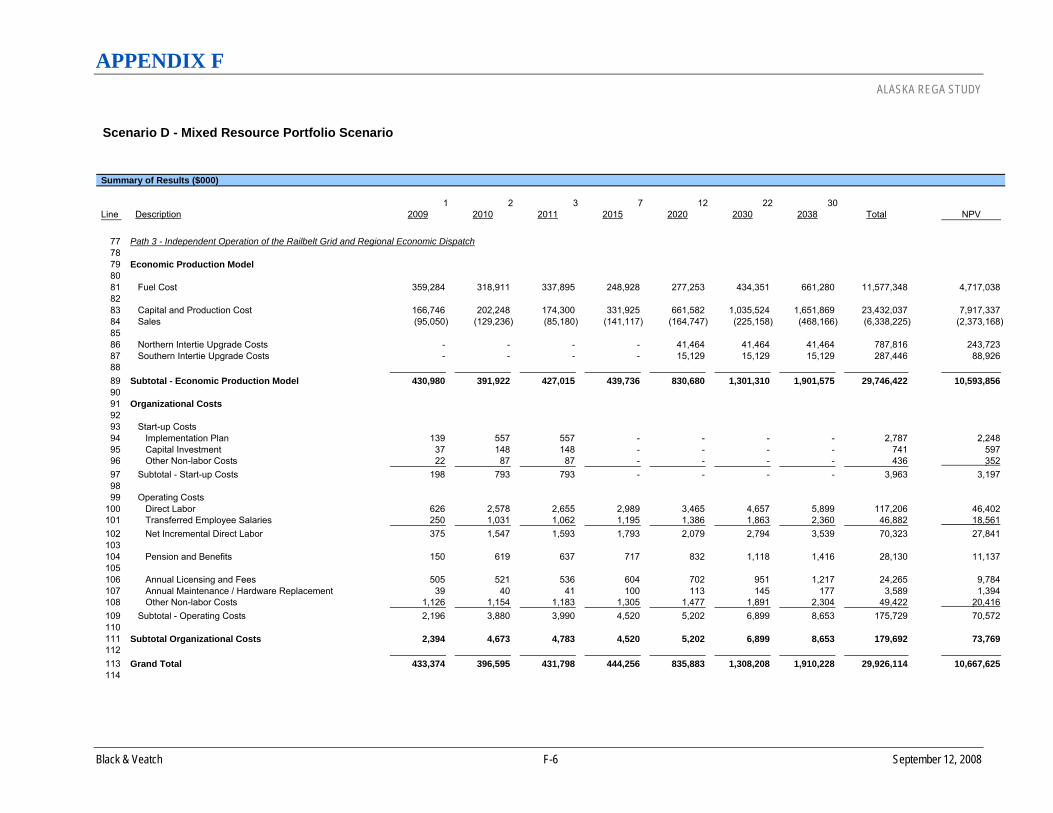
APPENDIX F ALASKA REGA STUDY
Black & Veatch F-6 September 12, 2008
Scenario D - Mixed Resource Portfolio Scenario
1 2 3 7 12 22 30Line Description 2009 2010 2011 2015 2020 2030 2038 Total NPV
77 Path 3 - Independent Operation of the Railbelt Grid and Regional Economic Dispatch78 79 Economic Production Model80 81 Fuel Cost 359,284 318,911 337,895 248,928 277,253 434,351 661,280 11,577,348 4,717,038 82 83 Capital and Production Cost 166,746 202,248 174,300 331,925 661,582 1,035,524 1,651,869 23,432,037 7,917,337 84 Sales (95,050) (129,236) (85,180) (141,117) (164,747) (225,158) (468,166) (6,338,225) (2,373,168) 85 86 Northern Intertie Upgrade Costs - - - - 41,464 41,464 41,464 787,816 243,723 87 Southern Intertie Upgrade Costs - - - - 15,129 15,129 15,129 287,446 88,926 88 89 Subtotal - Economic Production Model 430,980 391,922 427,015 439,736 830,680 1,301,310 1,901,575 29,746,422 10,593,856 90 91 Organizational Costs92 93 Start-up Costs94 Implementation Plan 139 557 557 - - - - 2,787 2,248 95 Capital Investment 37 148 148 - - - - 741 597 96 Other Non-labor Costs 22 87 87 - - - - 436 352 97 Subtotal - Start-up Costs 198 793 793 - - - - 3,963 3,197 98 99 Operating Costs
100 Direct Labor 626 2,578 2,655 2,989 3,465 4,657 5,899 117,206 46,402 101 Transferred Employee Salaries 250 1,031 1,062 1,195 1,386 1,863 2,360 46,882 18,561 102 Net Incremental Direct Labor 375 1,547 1,593 1,793 2,079 2,794 3,539 70,323 27,841 103 104 Pension and Benefits 150 619 637 717 832 1,118 1,416 28,130 11,137 105 106 Annual Licensing and Fees 505 521 536 604 702 951 1,217 24,265 9,784 107 Annual Maintenance / Hardware Replacement 39 40 41 100 113 145 177 3,589 1,394 108 Other Non-labor Costs 1,126 1,154 1,183 1,305 1,477 1,891 2,304 49,422 20,416 109 Subtotal - Operating Costs 2,196 3,880 3,990 4,520 5,202 6,899 8,653 175,729 70,572 110 111 Subtotal Organizational Costs 2,394 4,673 4,783 4,520 5,202 6,899 8,653 179,692 73,769 112 113 Grand Total 433,374 396,595 431,798 444,256 835,883 1,308,208 1,910,228 29,926,114 10,667,625 114
Summary of Results ($000)
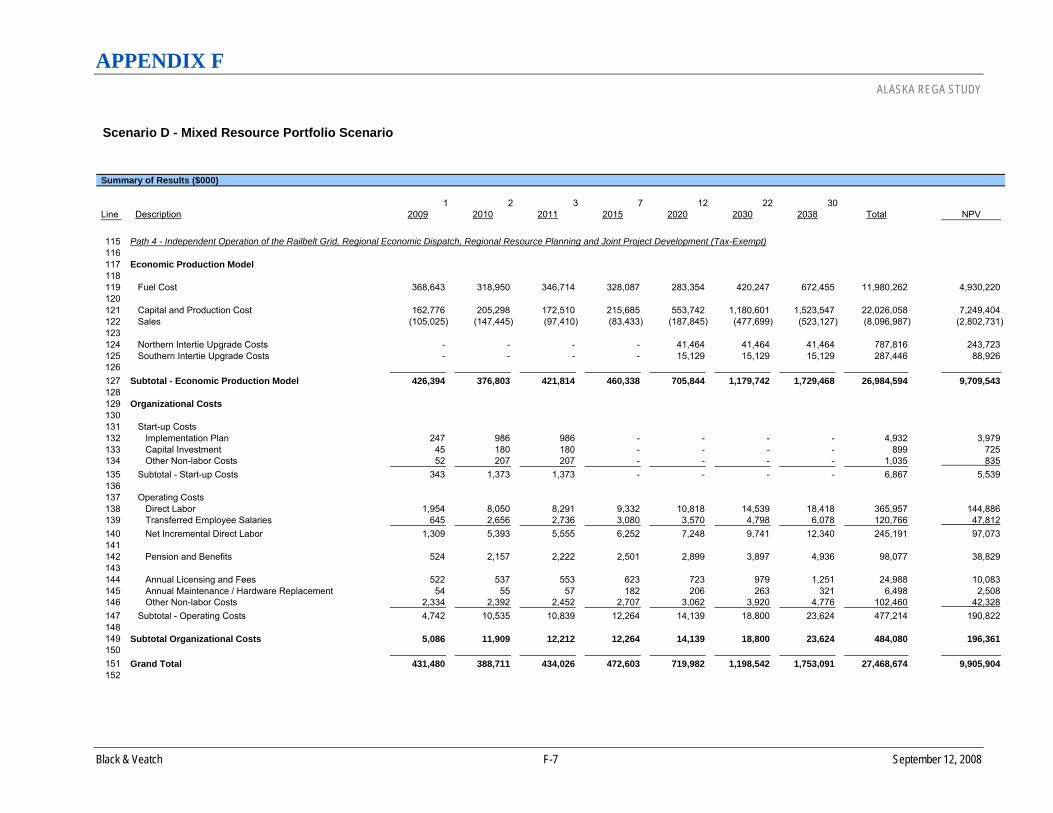
APPENDIX F ALASKA REGA STUDY
Black & Veatch F-7 September 12, 2008
Scenario D - Mixed Resource Portfolio Scenario
1 2 3 7 12 22 30Line Description 2009 2010 2011 2015 2020 2030 2038 Total NPV
115 Path 4 - Independent Operation of the Railbelt Grid, Regional Economic Dispatch, Regional Resource Planning and Joint Project Development (Tax-Exempt)116 117 Economic Production Model118 119 Fuel Cost 368,643 318,950 346,714 328,087 283,354 420,247 672,455 11,980,262 4,930,220 120 121 Capital and Production Cost 162,776 205,298 172,510 215,685 553,742 1,180,601 1,523,547 22,026,058 7,249,404 122 Sales (105,025) (147,445) (97,410) (83,433) (187,845) (477,699) (523,127) (8,096,987) (2,802,731) 123 124 Northern Intertie Upgrade Costs - - - - 41,464 41,464 41,464 787,816 243,723 125 Southern Intertie Upgrade Costs - - - - 15,129 15,129 15,129 287,446 88,926 126 127 Subtotal - Economic Production Model 426,394 376,803 421,814 460,338 705,844 1,179,742 1,729,468 26,984,594 9,709,543 128 129 Organizational Costs130 131 Start-up Costs132 Implementation Plan 247 986 986 - - - - 4,932 3,979 133 Capital Investment 45 180 180 - - - - 899 725 134 Other Non-labor Costs 52 207 207 - - - - 1,035 835 135 Subtotal - Start-up Costs 343 1,373 1,373 - - - - 6,867 5,539 136 137 Operating Costs138 Direct Labor 1,954 8,050 8,291 9,332 10,818 14,539 18,418 365,957 144,886 139 Transferred Employee Salaries 645 2,656 2,736 3,080 3,570 4,798 6,078 120,766 47,812 140 Net Incremental Direct Labor 1,309 5,393 5,555 6,252 7,248 9,741 12,340 245,191 97,073 141 142 Pension and Benefits 524 2,157 2,222 2,501 2,899 3,897 4,936 98,077 38,829 143 144 Annual Licensing and Fees 522 537 553 623 723 979 1,251 24,988 10,083 145 Annual Maintenance / Hardware Replacement 54 55 57 182 206 263 321 6,498 2,508 146 Other Non-labor Costs 2,334 2,392 2,452 2,707 3,062 3,920 4,776 102,460 42,328 147 Subtotal - Operating Costs 4,742 10,535 10,839 12,264 14,139 18,800 23,624 477,214 190,822 148 149 Subtotal Organizational Costs 5,086 11,909 12,212 12,264 14,139 18,800 23,624 484,080 196,361 150 151 Grand Total 431,480 388,711 434,026 472,603 719,982 1,198,542 1,753,091 27,468,674 9,905,904 152
Summary of Results ($000)

APPENDIX F ALASKA REGA STUDY
Black & Veatch F-8 September 12, 2008
Scenario D - Mixed Resource Portfolio Scenario
1 2 3 7 12 22 30Line Description 2009 2010 2011 2015 2020 2030 2038 Total NPV
153 Path 4 - Independent Operation of the Railbelt Grid, Regional Economic Dispatch, Regional Resource Planning and Joint Project Development (Taxable)154 155 Economic Production Model156 157 Fuel Cost 368,643 318,950 346,714 328,087 283,354 420,247 673,526 11,982,404 4,930,604 158 159 Capital and Production Cost 162,776 205,298 172,510 217,848 591,418 1,241,113 1,359,060 22,590,565 7,473,889 160 Sales (105,025) (147,445) (97,410) (83,433) (187,845) (477,699) (390,566) (7,831,865) (2,755,185) 161 162 Northern Intertie Upgrade Costs - - - - 41,464 41,464 41,464 787,816 243,723 163 Southern Intertie Upgrade Costs - - - - 15,129 15,129 15,129 287,446 88,926 164 165 Subtotal - Economic Production Model 426,394 376,803 421,814 462,502 743,520 1,240,254 1,698,613 27,816,366 9,981,957 166 167 Organizational Costs168 169 Start-up Costs170 Implementation Plan 247 986 986 - - - - 4,932 3,979 171 Capital Investment 45 180 180 - - - - 899 725 172 Other Non-labor Costs 52 207 207 - - - - 1,035 835 173 Subtotal - Start-up Costs 343 1,373 1,373 - - - - 6,867 5,539 174 175 Operating Costs176 Direct Labor 1,954 8,050 8,291 9,332 10,818 14,539 18,418 365,957 144,886 177 Transferred Employee Salaries 645 2,656 2,736 3,080 3,570 4,798 6,078 120,766 47,812 178 Net Incremental Direct Labor 1,309 5,393 5,555 6,252 7,248 9,741 12,340 245,191 97,073 179 180 Pension and Benefits 524 2,157 2,222 2,501 2,899 3,897 4,936 98,077 38,829 181 182 Annual Licensing and Fees 522 537 553 623 723 979 1,251 24,988 10,083 183 Annual Maintenance / Hardware Replacement 54 55 57 182 206 263 321 6,498 2,508 184 Other Non-labor Costs 2,334 2,392 2,452 2,707 3,062 3,920 4,776 102,460 42,328 185 Subtotal - Operating Costs 4,742 10,535 10,839 12,264 14,139 18,800 23,624 477,214 190,822 186 187 Subtotal Organizational Costs 5,086 11,909 12,212 12,264 14,139 18,800 23,624 484,080 196,361 188 189 Grand Total 431,480 388,711 434,026 474,766 757,659 1,259,054 1,722,236 28,300,446 10,178,319 190
Summary of Results ($000)

APPENDIX F ALASKA REGA STUDY
Black & Veatch F-9 September 12, 2008
Scenario D - Mixed Resource Portfolio Scenario
1 2 3 7 12 22 30Line Description 2009 2010 2011 2015 2020 2030 2038 Total NPV
191 Path 5 - Power Pool192 193 Economic Production Model194 195 Fuel Cost 368,643 318,950 346,714 328,087 283,354 420,247 672,455 11,980,262 4,930,220 196 197 Capital and Production Cost 162,776 205,298 172,510 215,685 553,742 1,180,601 1,523,547 22,026,058 7,249,404 198 Sales (105,025) (147,445) (97,410) (83,433) (187,845) (477,699) (523,127) (8,096,987) (2,802,731) 199 200 Northern Intertie Upgrade Costs - - - - 41,464 41,464 41,464 787,816 243,723 201 Southern Intertie Upgrade Costs - - - - 15,129 15,129 15,129 287,446 88,926 202 203 Subtotal - Economic Production Model 426,394 376,803 421,814 460,338 705,844 1,179,742 1,729,468 26,984,594 9,709,543 204 205 Organizational Costs206 207 Start-up Costs208 Implementation Plan 182 728 728 - - - - 3,638 2,935 209 Capital Investment 42 168 168 - - - - 842 679 210 Other Non-labor Costs 26 106 106 - - - - 529 427 211 Subtotal - Start-up Costs 250 1,002 1,002 - - - - 5,008 4,040 212 213 Operating Costs214 Direct Labor 837 3,448 3,551 3,997 4,634 6,228 7,890 156,763 62,063 215 Transferred Employee Salaries 335 1,379 1,421 1,599 1,854 2,491 3,156 62,705 24,825 216 Net Incremental Direct Labor 502 2,069 2,131 2,398 2,780 3,737 4,734 94,058 37,238 217 218 Pension and Benefits 201 828 852 959 1,112 1,495 1,894 37,623 14,895 219 220 Annual Licensing and Fees 522 537 553 623 723 979 1,251 24,988 10,083 221 Annual Maintenance / Hardware Replacement 41 42 43 112 127 163 199 2,210 1,560 222 Other Non-labor Costs 1,441 1,477 1,514 1,671 1,890 2,420 2,949 13,621 26,131 223 Subtotal - Operating Costs 2,707 4,953 5,093 5,764 6,633 8,794 11,026 223,950 89,906 224 225 Subtotal Organizational Costs 2,957 5,954 6,095 5,764 6,633 8,794 11,026 228,959 93,946 226 227 Grand Total 429,351 382,757 427,909 466,102 712,477 1,188,536 1,740,494 27,213,552 9,803,489 228
* Note: The total and NPV columns sum the entire 30-year cash flow.
Summary of Results ($000)

APPENDIX G ALASKA REGA STUDY
Black & Veatch G-1 September 12, 2008
APPENDIX G - TAX-EXEMPT BOND FINANCING OPTIONS FOR CONSTRUCTION OF A NEW ELECTRIC GENERATION AND TRANSMISSION FACILITY TO SERVE THE RAILBELT
Tax-Exempt Bond Financing Optionsfor Construction of a New Electric Generation and
Transmission Facility to Serve the Railbelt
July 10, 2008
Prepared byKenneth E. Vassar
Birch, Horton, Bittner and Cherot
Disclaimer: This paper has been prepared at the request of the Alaska Energy Authorityto assist the REGA Advisory Working Group in its process of decidingwhether and how to finance the construction of an electric generation andtransmission facility to benefit the Railbelt area of Alaska. This paper is nota bond opinion and may not be relied upon by anybody as such. This paperis prepared solely for the benefit of the Alaska Energy Authority and theREGA Advisory Working Group and for inclusion in a report to beprepared by Black & Veatch as consultants to the REGA Advisory WorkingGroup. Except as set forth above, this paper may not be relied upon by anyother person or used for any other purpose or published in any other mannerwithout the express written consent of the author. The author disclaims anyresponsibility to update this paper.
The purpose of this paper is to set forth some options that are available to provide tax-exempt bond financing for the construction of a new electric generation and transmission facilityto service the Railbelt area of Alaska. This paper is being prepared in connection with, and toaid, the efforts of the “REGA Advisory Working Group” in its discussions relating to theimprovement of electric power distribution in the Railbelt area. To understand the options thatare available, it is helpful to understand some of the basic provisions of the Internal RevenueCode that will apply.
Internal Revenue Code Considerations
The Internal Revenue Code and the regulations adopted under it control with respect tomost tax-exempt bond financing, and the Code and regulations contain many detailed provisionsthat a general synopsis, such as this, cannot incorporate or discuss. It is important to keep this inmind before reaching any conclusions regarding a specific financing.
Another fact about the Internal Revenue Code and the regulations adopted under it is this:most projects are either clearly eligible for financing with proceeds of tax-exempt bonds or areclearly not eligible, but there are some projects which are not so clear. Occasionally, there aredifferences of opinion among bond attorneys regarding the eligibility of a given project for tax-

- 2 -
exempt bond financing. Those situations that are not so clear will generally require an answer bythe Internal Revenue Service (in response to a ruling request) before a bond counsel opinion canbe given.
Finally, it should be kept in mind that this paper sets forth general rules applicable to tax-exempt bond financing without addressing the exceptions that apply to almost every rule underthe Internal Revenue Code and the regulations adopted under it. Where an exception to a generalrule is applicable, I have addressed the exception as well as the general rule.
With the preceding caveats in mind, this discussion of tax-exempt bond financing beginswith a description of the difference between government obligations that are not private activitybonds (“government obligations”) and government obligations that are private activity bonds(“private activity bonds”). Tax-exempt bond financing can be done with government obligationsand with private activity bonds. The differences between the two are described in the next twosubsections of this paper.
Government Obligations
Most tax-exempt bonds must be issued by either a state or municipal government. If astate or municipal government issues a bond, the bond is a government obligation. If the issuerof the bond takes certain actions as described below under “Private Activity Bonds,” the issuercan cause its government obligation to become a private activity bond. In most cases, this is aresult that the issuer would prefer to avoid if possible.
The advantages of government obligations that are not private activity bonds are: (1) theyare presumed to be tax-exempt unless the government issuer does something to cause them to betaxable, and (2) they are not subject to the alternative minimum tax. While both governmentobligations and private activity bonds can be tax-exempt, the applicability of the alternativeminimum tax to most private activity bonds means that those private activity bonds are reallyonly partially tax-exempt. As a result, there is a smaller market for private activity bonds, andthe interest rate demanded by the bond-buying market will, generally speaking, be slightly higherthan the interest rate that would be demanded for an alternative-minimum-tax-free governmentobligation of substantially equivalent terms and credit strength (although the interest ratedemanded for the private activity bond would, generally speaking, still be lower than the interestrate demanded for a fully taxable bond of substantially equivalent terms and credit strength).
The most likely things that an issuer can do to cause a government obligation to becometaxable are: (1) to allow the proceeds of the bonds to be used differently than as described andcontemplated in the original bond issuance documents and (2) to violate arbitrage restrictions.
For example, if a state or local government issuer were to issue bonds for the purpose ofbuilding a new administration building to be owned and occupied entirely by the issuer for theissuer’s governmental purposes, this would qualify for tax-exempt bond financing. If, afterissuing the bonds, the issuer allowed a private company to rent the entire building, this would be

- 3 -
a use that was not contemplated in the original bond issuance documents and would most likelycause the bonds to become taxable.
Violating arbitrage restrictions is another way that government obligations can becometaxable. The Internal Revenue Code and regulations contain complex provisions relating toarbitrage. Generally, they aim to prevent issuers from taking advantage of the difference betweentax-exempt and taxable interest rates. Issuers are not permitted to issue tax-exempt bonds for thepurpose of investing the proceeds in taxable investments and making earnings from thedifference between the tax-exempt rate on the bonds and the taxable rate on the investments. Toenforce this concept, the Internal Revenue Service has adopted many pages of intricately detailedregulations and has issued many rulings. Most bond attorneys apply these regulations and rulingsto the particular bond issuance through a tax or arbitrage certificate or agreement.
Assuming the issuer uses the proceeds of the bonds as contemplated by the bonddocuments and does not violate the arbitrage rules, then the bonds will likely remain tax-exemptas government obligations. This means that the purchaser of the bond will not have to declarethe interest income as part of that purchaser’s gross income for federal income tax purposes, andthe interest will also not be counted toward the alternative minimum tax. The fact that the ownerof the bond does not pay taxes on the interest income the owner receives means that the ownershould be willing to accept a lower interest payment for a government obligation than the ownerwould receive for either a tax-exempt private activity bond or a taxable bond of similar creditstrength and terms.
Private Activity Bonds
A government obligation becomes a private activity bond when it passes the private useand private security tests or when a substantial amount of the proceeds of the bond is used tomake a loan to a private person. Since we are not talking about using tax-exempt bonds forprivate loans, I will ignore that test for purposes of this discussion.
To cause a government obligation to become a private activity bond, the bond mustsatisfy both the private use test and the private security or payment test. The private use test ismet if more than more than 10% (5% in the case of electric generation, transmission, anddistribution facilities) of the proceeds of the bonds will be used to provide a facility that is usedin the trade or business of a person that is not a governmental entity.
If a state authority issues bonds and uses the proceeds of the bonds to build an electricgenerating facility, those bonds would pass the private use test if more than 5% of the proceedsof the bonds were used to build a facility that is used in the trade or business of a person that isnot a governmental entity (such as a private utility). The Internal Revenue Service will measureuse of the facility by taking into account all of the facts and circumstances of the relationshipbetween the issuer and the private entity. They will consider a contract that provides for the saleof more than 5% of the electricity generated by the facility to a private user to equal use of morethan 5% of the utility by that private user. To put it in more straightforward terms, if the issuer of

- 4 -
the bonds enters into a power sale agreement for the sale of more than 5% of the electricityproduced by the generating facility to a private business, then the bonds will pass the private usetest. It bears noting that if the arrangement is only a “requirements” contract (i.e., the purchaserof the electricity only purchases as much as the purchaser requires and is not obligated topurchase any amount), such contract would not create a “use” by the purchaser for purposes ofdetermining whether the 5% limit is reached.
Another, more subtle, way of passing the private business use test is through managementcontracts. If the issuer of the bonds, instead of entering into a power sale agreement with aprivate utility, enters into a management contract with a private utility under which the privateutility agrees to operate or maintain the generating facility for the issuer, that agreement couldcreate private business use unless the management contract complies with the Internal RevenueService’s regulations relating to management contracts. In general, those regulations require thatthe management contracts be limited to a certain term of years. In the case of output facilitymanagement contracts, the term can be as long as 20 years, but at the end of the term the issuermust have absolute discretion to end the contract or to enter into a contract with anothercontractor. It is worth noting here that a contract for an electric generation and transmissionfacility owner to use the distribution system of a utility would not be a management contract forpurposes of determining use of the generation and transmission facility.
The private business use test is only half of the analysis regarding whether a governmentobligation is a private activity bond. The other half is the private security or payment test. Thistest is passed if more than 5% (for bonds issued to finance electric output facilities; 10% for mostother kinds of bonds) of the money that will be used to pay the bonds is derived from a privatebusiness source. So, if the issuer of the bonds enters into a power sales agreement and thenpledges the revenues it will receive from the power sales agreement to the payment of the bonds,the bonds will pass the private security or payment test assuming that the revenues from thepower sales agreement are greater than 5% of the total payments on the bonds. In most caseswhere there is private business use there will also be private business security or payment.
What is the significance of turning a government obligation into a private activity bond? Most importantly, while a government obligation is tax-exempt unless the issuer does somethingthat causes the bond to become taxable, a private activity bond is taxable unless there is aspecific Internal Revenue Code provision the permits it to be tax-exempt. The Internal RevenueCode does permit private activity bonds that are used to finance electric output facilities to betax-exempt but only if certain conditions are satisfied.
For a private activity bond that finances an electric output facility to be tax-exempt, theInternal Revenue Code requires (i) that the facility be used to provide electricity to no more thantwo contiguous counties (boroughs in Alaska) or one county and one contiguous city (the “two-county rule”) and (ii) that the user of the facility must have provided electric service in the areathat the facility will serve since at least January 1, 1997, or be a successor to such an entity (the“sunset rule”). This is another important distinction between government obligations and privateactivity bonds when the proceeds of the bonds will be used to finance an electric generating

- 5 -
facility: private activity bonds will have to meet the two-county rule and the sunset rule, whilegovernment obligations do not.
Another distinction between government obligations and private activity bonds is theapplicability of the alternative minimum tax. Generally speaking, it applies to private activitybonds and does not apply to government obligations. The effect of the alternative minimum taxis to make the tax-exemption of private activity bonds slightly less valuable. This is because thealternative minimum tax applies a tax to these bonds for certain investors even though the bondsare otherwise tax-exempt. In this regard, private activity bonds are not exactly taxable and notexactly tax-exempt. They are somewhere in the middle, and the interest rates that apply toprivate activity bonds reflect that status.
There are a number of other limitations that also apply to private activity bonds but notgovernment obligations. Private activity bonds are subject to each state’s private activity bondvolume cap imposed by the Internal Revenue Code. In Alaska the limit for 2008 is$262,095,000. The volume cap for each state changes each year to adjust for changes in theconsumer price index. Since the inception of the volume cap in 1986, Alaska has never used allof its volume cap in a single year. The annual volume cap amount can be carried forward for upto three years to the extent that it is not used entirely within a single year, and users of the volumecap in Alaska have routinely used the carry forward feature to preserve the availability of thevolume cap for their projects or programs. In 2008, for example, there is approximately$360,000,000 of carried forward volume cap. However, volume cap that is carried forward mustbe carried forward for a specific use and cannot be re-directed to another use after the carryforward election is made. Each year, there is typically some competition for the availablevolume cap from bond issuers in Alaska. The determination of how to allocate available volumecap is in the hands of the State Bond Committee. By far the largest portion of the state’s volumecap is used by the Alaska Housing Finance Corporation to help finance its home mortgagefinancing programs and by the Alaska Student Loan Corporation to help finance its student loanprogram.
The weighted average maturity of a private activity bond may not exceed 120% of thereasonably expected economic life of the project being financed. No more than 25% of theproceeds of private activity bonds may be used for the acquisition of land. Private activity bondscannot be used to acquire existing property unless capital expenditures are made for therehabilitation of the property. The rehabilitation expenditures must be made within two yearsafter the issuance of the private activity bonds and must equal at least 15% of the amount of theprivate activity bonds used to pay for the acquisition of the property. The 15% figure applies ifthe existing property being purchased is a building; if the property is personal property orequipment, then the rehabilitation expenditures must equal 100% of the amount of the bondsused to acquire the property. No more than 2% of the proceeds of private activity bonds may beused to pay for the costs of issuance of the private activity bonds, and the issuance of tax-exemptprivate activity bonds must be given public approval by the chief elected officer of the issuingentity and also the chief elected officer of each jurisdiction in which the project is located. Theapproval must follow a public hearing, and the public hearing must be given at least 14 days

- 6 -
public notice.
Provisions Applicable to All Tax-Exempt Bonds
In addition to the provisions noted above that apply only to private activity bonds, thereare a number of provisions that the Internal Revenue Code imposes on all tax-exempt bonds,whether government obligations or private activity bonds.
No tax-exempt bond may be federally guaranteed.
Tax-exempt bonds can be used to reimburse expenditures that were incurred before theissuance of the bonds only if the expenditures to be reimbursed occurred not more than 60 daysbefore the issuer adopts an “official intent.” An “official intent” is the issuer’s declaration that itintends to incur debt to pay for the costs of the project. The “official intent” can be made in anyreasonable form, but usually the board of directors of the issuer adopts a resolution for thispurpose. The “official intent” must include a description of the project and must state themaximum principal amount of the bonds to be issued. The use of the proceeds of the bonds toreimburse the original expenditures must occur no later than 18 months after the later of (i) thedate of the original expenditure or (ii) the date the project is placed in service or abandoned, but,in any event, no more than 3 years after the original expenditure.
Finally, all tax-exempt bonds are subject to the arbitrage and arbitrage rebate provisionsof the Internal Revenue Code and regulations. The arbitrage and arbitrage rebate provisions arefar too complex to attempt to summarize here. As part of any tax-exempt bond issuance, bondcounsel will prepare a document, generally referred to as an Arbitrage Certificate or as a TaxCertificate or some similar name, that will set forth in detail the issuer’s (and sometimes thefacility user’s) statements demonstrating compliance with the arbitrage and arbitrage rebateprovisions. For purposes of this narration, it is probably sufficient to simply say that thearbitrage and arbitrage rebate provisions prevent issuers from issuing bonds and making moneyby investing the bond proceeds in an amount greater than the amount that must be paid on thebonds.
The Difference between Taxable and Tax-Exempt Bond Interest Rates
As a bond attorney, knowledge of the market and the interest rates that may apply tobonds on any given day is not my focus. I include this section to pass along what information Ihave learned over 26 or so years of working with underwriters and financial advisors and to passalong information from recent discussions with underwriters regarding the REGA AdvisoryWorking Group efforts; however, I defer to the greater knowledge and expertise of underwritersand financial advisors, for whom this kind of information is the focus of their professions.
In a perfect world, the interest rate applicable to a tax-exempt bond would at leastapproximate the rate applicable to a taxable bond with similar maturity and similar security, butthe interest rate would be lower to reflect the value to the bondholder of not having to pay federal

- 7 -
income tax on the interest earned on the tax-exempt bond. Of course, in the real world thedifference between taxable and tax-exempt interest rates varies from day to day and from bondissue to bond issue. It is a matter that is affected by a wide variety of factors.
There is no generally applicable spread between taxable and tax-exempt rates. It isgenerally true that tax-exempt rates are lower than taxable rates (assuming all other factors, suchas those discussed below, are identical), but there is no specific guideline that can be relied on atall times. Nevertheless, it seems fair to say that 1.5% (or 150 basis points) is a good generalguideline. This is only a general guideline that reflects more or less average differences over aspan of years. The difference from day to day will vary based upon many variables.
The most significant factor that pertains to the interest rate that would apply to a giventax-exempt financing on any given day, beyond the general difference between the taxable andtax-exempt bond markets, is the security for the particular bond issuance. This is where ratingsare particularly important. The rating agencies (Standard & Poor’s, Moody’s, and Fitch) assessthe financial strength of the issue and assign a rating that is meant to reflect that strength. Thestrongest rating is AAA (or Aaa, in the case of Moody’s). Minimum investment grade ratings(i.e., minimum ratings that will qualify a bond for being purchased by managers of largeinvestment funds) are no lower than the B category. So-called “junk bonds” carry the highestinterest rates because of the perceived security risk involved and are generally rated (if rated atall) in the C category or below. On any given day of issuance, the higher the rating assigned tothe bond, the lower the likely interest rate applicable to it. Conversely, a lower rating shouldresult in a higher interest rate. If all other factors are equal, one would expect that two bondswith equal ratings would trade at identical interest rates on a given day. Again, the real worldintercedes, and on any given day two bonds with identical ratings will not necessarily bear thesame interest rate even if other factors (the type of bond, the terms of the bond, the particularissuer, and others) are substantially the same.
Issuers frequently “borrow” ratings for their issuances if they think it is worth the cost. Bond insurers (such as FSA, Ambac, MBIA, FGIC, and others) maintain their own ratings sothat, if an issuer purchases bond insurance from the insurer, the issuer’s bond will be rated at therating level of the insurer. The bond insurance is a promise by the insurer that it will maketimely principal and interest payments on the bond if the issuer defaults. Because of thispromise, the rating agencies are willing to rate the bond at (or, in recent history, occasionallyabove) the rating of the bond insurer. An issuer would only purchase bond insurance if the costof the insurance is less than the present value savings in interest costs that the issuer expects toreceive as a result of the insurance. An issuer would expect an interest rate savings if the bondinsurer’s rating is higher than the rating the bonds would receive without the bond insurance.
Until recently, bond insurers were generally rated in the highest categories by all threerating agencies. Recent developments resulting from the sub-prime mortgage lending debaclehave caused significant distress in the bond insurance industry, and, now, the only bond insurerthat remains rated in the highest category by all three rating agencies is FSA. All the other bondinsurers have been downgraded by at least one of the rating agencies, and some of the bond

- 8 -
insurers are now unable to continue issuing bond insurance. This has significantly changed thestrategies regarding use of bond insurance at least temporarily.
Another aspect of the security for the bonds is the financial strength of the issuer and thefinancial strength of the issuer’s program. This is the reason that the official statement (or otheroffering document) for a series of bonds usually goes into some detail in discussing the issuer ofthe bonds, the project or program being financed with proceeds of the bonds, the source ofmoney expected to be used to repay the bonds, and other matters relating to the financial backingfor the bonds. This is also the reason that newly created bond issuing agencies sometimes havedifficulty selling their bonds in the market, or at least selling their bonds at the lowest possibleinterest rates. The bond market simply is not familiar with the new issuer and is uncertain as tothe strength of the issuer’s management or program.
There are other factors that influence the interest rate applicable to an issuance of bonds. Underwriters attempt to match the structure of a bond issuance to the needs of their bond-buyingcustomers. The success of a bond issue depends in part on the underwriter’s ability to match thebond to the buyer. When a bond is structured to match the highest demand in the market, there ismore competition to purchase the bond. More competition means lower interest rates. On theother hand, the most appealing structure to the bond purchasers may not be the structure that bestmatches the issuer’s needs. Ongoing discussions with the underwriters and financial advisor arethe best way to match the two interests.
The lowest rates available are generally short-term rates. Issuers usually have to paymore to borrow for a longer term, although there have been times when this has not been true. For most projects, borrowing on a short-term basis (with maturities of less than a year or two)would be extremely inefficient. Underwriters can try to obtain short-term rates for the issuerwithout requiring the issuer to borrow on a short-term basis by creating a “synthetic” short-termborrowing. This is accomplished with “put” options. Under this structure, the holder of the bondcan tender the bond for purchase on short notice and, therefore, is willing to accept lower, short-term interest rates. The issuer will usually have to purchase a liquidity facility so that the bondpurchasers have assurance that the issuer will be able to honor the puts when they occur. Thisadds to the cost of the issuance. As with bond insurance, the issuer will purchase the liquidityfacility only if the issuer is satisfied that the cost of the liquidity facility factored into the variableinterest rates to be borne by the bond is still less than the interest rate that would apply if theissuer issued fixed rate bonds instead of variable rate bonds. The risk factor associated withfloating interest rates can then be mitigated through the use of a swap agreement, but this addsyet another cost element to the financing.
Because of the problems created by the sub-prime mortgage lending fiasco, the tax-exempt bond market has changed in recent months. Some of the options that may have beenconsidered to achieve the lowest possible interest rate on bonds are no longer desirable or evenavailable (the auction rate bond market, for example, has collapsed, and auction rate bonds are nolonger an option). The economic advantages of tax-exempt bonds may not be so great now asthey have been at times in the past because of the current upheaval in the bond market. The

- 9 -
relative advantages of tax-exempt financing will change from time to time in the future as it hasin the past. The best approach to determining the actual benefit that can be achieved with tax-exempt bonds is to discuss the matter thoroughly with your financial advisors and yourunderwriters.
Tax-Exempt Bond Financing Options
Financing with Government Obligations
Since the generation and transmission facility that has been discussed would exceed twocounties and the owner and operator of the facility would not satisfy the sunset rule, privateactivity bonds are not available for tax-exempt financing of the facility (unless a specialpermission is obtained through passage of a federal law as discussed below). To obtain tax-exempt financing for the facility, the bonds would need to be government obligations that are notprivate activity bonds.
There are two ways to accomplish this result that we have discussed at the REGAAdvisory Working Group meetings: one is the approach advanced by John Pirog of Hawkins,Delafield & Wood and Fred Boness, former Municipal Attorney for the Municipality ofAnchorage and currently on contract with the Municipality; the other is the Alaska Railroadapproach.
Pirog/Boness Approach. Under the Pirog/Boness approach, a public corporation of theState could be created (or the Alaska Energy Authority could be legislatively retrofitted) to issuebonds to finance the construction of the facility and which would own the facility. Theoretically,a city or borough government could own the facility, but it seems more feasible to have a stateauthority involved in this instance. The public corporation would sell electricity generated by thefacility directly to retail consumers on a “requirements” basis. There would be no minimumpurchase obligation and there would be no power sales agreement with any of the utilities. Sincethis results in no private business use of the facility, the bonds would not pass the privatebusiness use test and would remain government obligations and not private activity bonds.
I should note that two of the six utilities participating in the REGA Advisory WorkingGroup are publicly owned municipal entities. As such, the state authority could sell electricity tothese utilities for distribution by these utilities to their customers. The sale of electricity fromone governmental entity to another does not create private business use. For the remainder ofthis paper, in discussing the sale of electricity directly to customers of a utility, this is meant torefer to private utilities, although the public utilities could certainly enter into the sameagreements with the state authority.
The existing utilities would continue to serve their customers with electricity generated bytheir own facilities. The electricity generated by the public corporation’s facility wouldsupplement the existing utilities’ electricity. The public corporation would enter into contractswith the existing utilities for the use of the existing utilities’ distribution systems and for billing
- 10 -
services.
The advantage of the Pirog/Boness approach is that it is available under present InternalRevenue Code provisions. It would not be necessary to seek a ruling from the Internal RevenueService, nor would it be necessary to seek any change of existing law. On July 4 of this year theInternal Revenue Service released its Private Letter Ruling 200827023, which addressed asituation similar to that proposed by the Pirog/Boness approach. Private letter rulings cannot beused as precedence with the Internal Revenue Service, which means that the Service is free tocome to a different conclusion in a different ruling. However, the Service does attempt to beconsistent, and private letter rulings are a good indication of how the Service approaches taxquestions. In Private Letter Ruling 200827023, the Service stated:
The issue presented is whether Utility 1 and Utility 2, by transmitting anddistributing the electricity purchased with the proceeds of the Certificates, will beprivate business users of the electricity.
Neither Utility 1 nor Utility 2 is entering into any arrangement to purchase thefinanced electricity or that otherwise conveys special legal entitlement to actual orbeneficial use of the electricity. Utility 1 and Utility 2 will use their facilities toprovide transmission and distribution services to Authority and itscustomers....Authority will set and receive the electricity supply charges from itscustomers, and Utility 1 and Utility 2 will continue to assess and retain thedelivery and other utility charges.
The Service concluded that “neither Utility 1 nor Utility 2 will be considered to use the electricityfinanced with proceeds of the Certificates in a private business use within the meaning of sec.1.141-3.”
So, the advantage of this approach is that it is currently available for use. Thedisadvantage is that it requires that a new entity be given access to at least the private utilities’service areas to provide electricity directly to those private utilities’ customers. Moreover, tomaintain its status as a true public entity, which is essential to this approach, the board ofdirectors of the public authority would have to be appointed by the Governor. This isunderstandably a matter of concern to the utilities.
63-20 Corporation. The concern over control of the entity owning the facility can bemitigated somewhat through the use of a “63-20 corporation.” In Revenue Ruling 63-20, theInternal Revenue Service set forth conditions under which private corporations may issuetax-exempt bonds on behalf of state and municipal governments. These corporations havebecome known as "63-20 corporations." The conditions set forth in Revenue Ruling 63-20 are asfollows:
· The corporation must be formed under the general nonprofit corporation law of astate for the purpose of stimulating industrial development within a political subdivision

- 11 -
of the state.
· The corporation must engage in activities which are essentially public in nature.
· The corporation must be one which is not organized for profit.
· The corporate income must not inure to any private person.
· The state or political subdivision thereof must have a beneficial interest in thecorporation while the indebtedness remains outstanding and it must obtain full legal titleto the property of the corporation with respect to which the indebtedness was incurredupon retirement of such indebtedness.
· The corporation must have been approved by the state or a political subdivisionthereof, either of which must also have approved the specific obligations issued by thecorporation.
Following the issuance of Revenue Ruling 63-20, the Internal Revenue Service explainedsome of the rules of Revenue Ruling 63-20 through the issuance of its Revenue Procedure 82-26. The following bullets summarize the explanations contained in Revenue Procedure 82-26:
· The requirement that the nonprofit corporation must engage in activities that areessentially public in nature will be met if:
o The activities and purposes of the corporation are those permitted underthe general nonprofit corporation law of the state; and
o The property to be provided by the corporation's obligations is locatedwithin the geographical boundaries of or has a substantial connection with thegovernmental unit on whose behalf the obligations are issued.
· The requirement that the corporation must not be organized for profit will be metif:
o The corporation is organized under the general nonprofit corporation lawof the state in which is located the governmental unit on whose behalf thecorporation will issue its obligations; and
o The articles of incorporation of the corporation provide that thecorporation is one that is not organized for profit.
· The requirement that the corporate income not inure to any private person will bemet if the articles of incorporation provide that the corporate income will not inure to anyprivate person, and, in fact, the corporate income does not inure to any private person.

- 12 -
· The requirement that the governmental unit must have a beneficial interest in thecorporation while the indebtedness remains outstanding will be met if:
o One of the following three requirements is satisfied:
· The governmental unit has exclusive beneficial possession and useof a portion of the property financed by the obligations and additions tothat property equivalent to 95% or more of its fair rental value for the lifeof the obligations; or
· Both of the following are satisfied:
· The nonprofit corporation has exclusive beneficialpossession and use of a portion of the property financed by theobligations, and any additions to that property, equivalent to 95%or more of its fair rental value for the life of the obligations; and
· The governmental unit on whose behalf the nonprofitcorporation is issuing the obligations (A) appoints or approves theappointment of at least 80% of the members of the governingboard of the corporation, and (B) has the power to remove, forcause, either directly or through judicial proceedings, any memberof the governing board and appoint a successor; or
· The governmental unit has the right at any time to obtainunencumbered fee title and exclusive possession of the property financedby the obligations, and any additions to that property, by (1) placing intoescrow an amount that will be sufficient to defease the obligations, and (2)paying reasonable costs incident to the defeasance. However, thegovernmental unit, at any time before it defeases the obligations, may notagree or otherwise be obligated to convey any interest in the property toany person for any period extending beyond or beginning after the unitdefeases the obligations. In addition, generally the unit may not agree orotherwise be obligated to convey a fee interest in the property to anyperson who was a user of the property, or a related person, before thedefeasance within 90 days after the unit defeases the obligations; and
o In the event the nonprofit corporation defaults in its payments under theobligations, the governmental unit has an exclusive option to purchase theproperty financed by the obligations and additions to the property for the amountof the outstanding indebtedness and accrued interest to the date of default.
· The requirement that the governmental unit must obtain full legal title to theproperty of the corporation with respect to which the indebtedness was incurred upon

- 13 -
retirement of the indebtedness will be met if:
o The obligations of the nonprofit corporation are issued on behalf of nomore than one governmental unit and unencumbered fee title to the property willvest solely in that governmental unit when the obligations are discharged.
o All of the original proceeds and investment proceeds of the obligation sare used to provide tangible real or tangible personal property.
o The governmental unit obtains upon discharge of the obligationsunencumbered fee title and exclusive possession and use of the property financedby the obligations, including any additions to the property, without demand orfurther action on its part.
o Before the obligations are issued, the governmental unit adopts aresolution stating that it will accept title to the property financed by theobligations, including any additions to that property, when the obligations aredischarged.
o The indenture or other documents under which the obligations are issuedprovide that any other obligations issued by the nonprofit corporation either tomake improvements to the property or to refund a prior issue of the nonprofitcorporation's obligations will be discharged no later than the latest maturity dateof the original obligations, regardless of whether the original obligations arecallable at an earlier date. In addition, the maturity date of the original obligationsor any other obligations issued by the nonprofit corporation with respect to theproperty may not be extended beyond the latest maturity date of the originalobligations, regardless of whether the original obligations are callable at an earlierdate. If the governmental unit has the beneficial interest described above, theobligations need not meet the requirements of this bullet.
o The proceeds of fire or other casualty insurance policies received inconnection with damage to or destruction of the property financed by theobligations will, subject to the claims of the holders of the obligations, (a) be usedto reconstruct the property, regardless of whether the insurance proceeds aresufficient to pay for the reconstruction, or (b) be remitted to the governmentalunit.
o A reasonable estimate of the fair market value of the property on the latestmaturity date of the obligations, regardless of whether the obligations are callableat an earlier date, is equal to at least 20% of the original cost of the propertyfinanced by the obligations, and a reasonable estimate of the remaining useful lifeof the property on the latest maturity date of the obligations is the longer of oneyear or 20% of the originally estimated useful life of the property financed by the

- 14 -
obligations.
· The requirement that the governmental unit must approve both the nonprofitcorporation and the specific obligations to be issued by the corporation will be met if,within one year prior to the issuance of the obligations, the governmental unit adopts aresolution approving the purposes and activities of the corporation and the specificobligations to be issued by the corporation. If the corporation intends to issue obligationsfor a single project through a series of obligations to be issued over a period not to exceedfive years, the governmental unit may meet the requirements of this bullet by adopting asingle resolution, approving the purposes and activities of the corporation and allobligations to be issued in the series, within one year prior to the issuance of the first inthe series.
Assuming that the requirements of Revenue Ruling 63-20, as amplified by RevenueProcedure 82-26, are met, the Pirog/Boness approach could be implemented through a nonprofitcorporation with a board of directors controlled by the utilities involved. Instead of having bondsissued, and the facility owned, by a state authority, the 63-20 corporation could issue the bondsand own and operate the facility.
Alaska Railroad Corporation. A very special circumstance exists with the AlaskaRailroad Corporation. The federal act that transferred ownership of the railroad from the federalgovernment to the State of Alaska stipulated that bonds issued by the Alaska RailroadCorporation would be treated as government obligations and would never be treated as privateactivity bonds. With this special power, the Alaska Railroad Corporation could issue bonds tofinance the construction of a generation and transmission facility, and the bonds would be tax-exempt government obligations and would not be private activity bonds. Theoretically, thiswould apply even if the facility financed with the bonds were owned by one or more of theutilities.
The state law that governs the Alaska Railroad Corporation requires the enactment ofspecial legislation before the Alaska Railroad Corporation may issue any bonds. As a result ofthis state law limitation, the corporation could not issue bonds to build a generation andtransmission facility until after enactment of state authorizing legislation. This imposes the timeconstraint of waiting for the process of passage of a state law to be completed.
In addition to requiring state legislation, involving the use of the railroad’s special powerwill require seeking a ruling from the Internal Revenue Service to confirm that the power actuallyapplies to this situation. In my reading of the railroad transfer act, I see no reason that therailroad’s power cannot be used for this purpose, and I would expect a favorable ruling to resultfrom the Internal Revenue Service. Bringing this question to the attention of the InternalRevenue Service, however, could very well result in an effort to close the railroad’s specialpower. This, then, becomes a political question of what is the best use of the railroad’s powerassuming that there is at least a chance that it will only be able to be used once before the federallaw is changed to eliminate the power.

- 15 -
Financing with the help of Special Federal Legislation
Other than using the Pirog/Boness approach (through a state authority or through a 63-20corporation) or using the Alaska Railroad Corporation, the present federal tax laws andregulations provide no realistic avenue for tax-exempt financing of the proposed generation andtransmission facility. Pursuit of tax-exempt financing without using one of these two approacheswould require obtaining special federal legislative permission. This has been done at least twicein Alaska for electric generation facilities.
The Bradley Lake Hydroelectric Project received a special exemption from the twocounty rule in 1984. In 1995, the Snettisham Hydroelectric Project received a special exemptionfrom the rule that requires rehabilitation expenditures to be made when tax-exempt privateactivity bond proceeds are used to acquire existing property. A special exemption from the twocounty rule and the sunset rule for a new generation and transmission facility would permit sucha facility to be financed with tax-exempt private activity bonds.
The difficulty in obtaining a special federal exemption for bonds to finance the proposedgeneration and transmission facility is Congress’ scoring rule. Before any tax reduction measurecan be enacted, Congress now requires that a corresponding measure be enacted to balance theloss of revenue to the federal treasury. This scoring requirement did not exist when the BradleyLake exemption was granted in 1984. The scoring requirement was in place in 1995 whenSnettisham received its special exemption; however, the exemption for Snettisham was grantedin connection with the sale of the Snettisham facility from the federal government to the AlaskaEnergy Authority.
Conclusions
The most readily available and viable tax-exempt bond financing option for a generationand transmission facility to serve the Railbelt area of Alaska is the Pirog/Boness approach. It hasthe advantage of being immediately available and involving the lowest interest rate kind of bondswithout the need for involvement from either Congress or the Internal Revenue Service. On theother hand, it will require state legislation and it requires that customers of at least the privateutilities be served directly (i.e., not through a utility) by the owner of the facility. If it is a stateauthority that issues the bonds, the control over the state authority will be in the hands of the stategovernment.
The Pirog/Boness approach could be modified by using a 63-20 corporation, which couldprovide a greater level of control over the facility by the utilities. This would still require statelegislation, but it could give the utilities some control over the facility while the initially issuedbonds are still outstanding.
An alternative is to seek bond financing from the Alaska Railroad Corporation. This willalso require state legislation. Further, it will require requesting a ruling from the InternalRevenue Service and, in so doing, will bring the Alaska Railroad Corporation’s special bondingpower to the attention of the Internal Revenue Service. This introduces the political question of

- 16 -
finding the best use of the railroad’s power considering the possibility that it could be the onlyuse before the power is eliminated. The advantages of this approach are that (1) it can be used tofinance a facility owned by the utilities, (2) it does not require any other entity to provide electricservice directly to the utilities’ customers, and (3) it also involves the use of the lowest interestrate kind of bonds.
Finally, special federal legislation can be sought through the Alaska congressionaldelegation. Such federal legislation could permit ownership of the facility by the utilities withouta new entity providing service to the utilities’ customers. Most likely, the special exemptionwould still leave the bonds as private activity bonds; so, this approach would probably notinvolve the lower interest rates generally available to government obligations that are not privateactivity bonds. Also, this approach would have to address the congressional scoring requirement.

APPENDIX H ALASKA REGA STUDY
Black & Veatch H-1 September 12, 2008
APPENDIX H - BIBLIOGRAPHY

APPENDIX H ALASKA REGA STUDY
Black & Veatch I-2 September 12, 2008
Appendix H Bibliography
Alaska Economic Development Corporation, “Alaska’s Future Workforce Demand – Haven’t We Been Here Before?,” January 3, 2008.
Alaska Energy Authority, “Alaska Intertie Upgrade Project,” September 7, 2005.
Alaska Energy Authority, Alaska Railbelt Electrical Grid Authority Technical Conference, Various Presentations, November 26 and 27, 2007.
Alaska Energy Authority, “Alternative Energy and Energy Efficiency Overview,” March 2007.
Alaska Energy Policy Task Force, “Report on the Railbelt,” December 2003.
“Alaska Intertie Agreement, Addendum No. 1, Reserve Capacity and Operating Reserve Responsibility,” December 23,1985.
Alaska Power Association, “New Energy for Alaska,” March 2004.
Anchorage Municipal Light and Power – various documents were provided by the utility and reviewed, including: • EES Consulting, “Draft Preliminary 2007 Integrated Resource Plan Results,” February 6, 2008. • EES Consulting, “Integrated Resource Plan,” November 2004. • “2006 Annual Report.”
Ater Wynne, LLP, “First Amended and Restated Joint Action Agency Agreement Relating to the Alaska Railbelt Energy Authority,” August 1, 2005.
Ater Wynne and R.W. Beck, “Railbelt Energy Study,” January 15, 2004.
Black & Veatch International, Inc., “Power Pooling/Central Dispatch Planning Study,” Alaska Public Utility Commission (Docket U-97-140), October 1998.
Borell, Steven C., Alaska Miners Association, “Alaska Mining Industry Update for AIDEA,” 2007.
Borell, Steven C., Alaska Miners Association, “Prospects for Use of Alaska’s Coals and Status of the Alaska Coal Industry,” 2007.
Bradley Lake Hydroelectric Project, “Agreement for the Sale and Purchase of Electric Power,” December 8, 1987.
Bradley Lake Hydroelectric Project, “Agreement for the Dispatch of Electric Power and for Related Services,” August 1996.
CH2MHill, “Report to the Alaska Public Utilities Commission and the Alaska State Legislature: Study of Electric Utility Restructuring in Alaska,” June 1999.
Chugach Electric Association – various documents were provided by the utility and reviewed, including: • “Blue Ribbon Panel Report,” November 2007. • Cooley, John, “Railbelt Reliability for the Energy Policy Task Force,” November 4, 2004. • “Long-Term Energy and Demand Forecasts Covering the Period of Time Including 2008 Through 2040,”
February 22, 2008. • Presentation to Regulatory Commission of Alaska related to the status of gas supply contract negotiations,
February 29, 2008. • R.W. Beck, “Independent Analysis and Risk Assessment of Chugach’s 2006 Generation Plan,” April
2007. • R.W. Beck, “Integrated Resource Plan,” June 2004.

APPENDIX H ALASKA REGA STUDY
Black & Veatch I-3 September 12, 2008
• UMS Group, “Chugach Electric Association Macro Benchmarking Analysis,” August 13, 2007. • “2007-2011 Corporate Financial Management Plan.” • “2006 Generation Plan,” May 2007. • “2006 Annual Report.”
Chugach Electric Association, Inc., Matanuska Electric Association, Inc., and Alaska Electric Generation and Transmission Cooperative, Inc., “Modified Agreement for the Sale and Purchase of Electric Power and Energy,” April 5, 1989.
Dunmire Consulting, “Cook Inlet Energy Supply Alternatives Study,” March 30, 2006.
Ecology and Environment, Inc., “Draft Final Report: ANGDA Energy Scenarios Study,” January 22, 2008.
Fairbanks Economic Development Corporation, “Fairbanks Energy Strategic Business Plan,” November 2007.
Federal Energy Regulatory Commission, “Staff Report on Cost Ranges for the Development and Operation of a Day One Regional Transmission Organization,” Docket No. PL04-16-000, October 2004.
Four Dam Power Pool Agency • “Bylaws of the Four Dam Power Pool Agency,” January 28, 2002. • “First Amended and Restated Joint Action Agency Agreement,” January 1, 2002.
Golden Valley Electric Association – various documents were provided by the utility and reviewed, including: • “Amendments to Tariff No. 1: Transmission Service Offering,” June 5, 2007. • Black & Veatch, “Integrated Resource Plan,” May 4, 2005. • Green Power Advisory Committee, “Recommendations to the Board of Directors,” March 2004. • “GVEA Green Power Pledge.” • R.W. Beck, “GVEA 2006 Load Forecast Update,” May 8, 2006. • “2006 Annual Report.”
Goodman, Nicholas and Yould, Eric, “Hydropower Prospects for South Central Alaska,” October 30, 2007.
Hannett, Louis N., “Application of Aero-Derivative Engines in Railbelt System,” General Electric International, Inc., February 10, 2005.
Harza-Ebasco Joint Venture, “Susitna Hydroelectric Project,” June 1987.
Homer Electric Association – various documents were provided by the utility and reviewed, including: • “Audited Financial Statements – December 31, 2006 and 2005,” February 17, 2007. • “Simplified Rate Filings for the 12 Months Ending December 31, 2007 for Rates Effective April 1,
2008,” February 12, 2007.
Information Insights, Inc. “Alaska Energy Efficiency Program and Policy Recommendations,” Interim Report to the Cold Climate Housing Research Center, March 5, 2008.
Kolker, Amanda, “Geothermal Energy in Alaska: Overview and Project Update.”
Letter to Ron Miller, Alaska Energy Authority Executive Director, “Written Testimony of CEA, GVEA, and ML&P in Response to MEA’s Proposal to Purchase Alaska Intertie,” March 12, 2007.
Mark A. Foster & Associates, “Alaska Rural Energy Plan: Initiatives for Improving Energy Efficiency and Reliability,” April 2004.
Mark A. Foster & Associates, “Review of Matanuska Electric Association (MEA) Integrated Resource Plan (IRP), Executive Summary and Public Presentation,” May 19, 2007.

APPENDIX H ALASKA REGA STUDY
Black & Veatch I-4 September 12, 2008
Matanuska Electric Association – various documents were provided by the utility and reviewed, including: • CH2MHill, “2007 Integrated Resource Plan,” June 1, 2007. • James L. Walker, Senior Counsel, “Comments on CEA’s July 13, 2006 Transmission Long-Range Plan
Update,” January 11, 2008. • James L Walker, Senior Counsel, “Presentation of Matanuska Electric Association to the Alaska Energy
Authority Board of Directors Regarding Purchase of Alaska Intertie,” December 1, 2002. • “Response of MEA to Comments Authorized by Ordering Paragraph No. 1 of Order No. R-07-001(2),”
Docket No. R-07-001, March 4, 2008. • “2006 Annual Report.”
Navigant, “Phase 1 – Draft Report on Cost Savings From Alternative Combination of Municipal Light & Power ands Chugach Electric Association,” November 5, 2007.
Nebesky, William, Alaska Department of Natural Resources, “Cook Inlet Natural Gas Demand,” September 20, 2006.
Regulatory Commission of Alaska, “Fiscal Year 2006 Annual Report.”
Regulatory Commission of Alaska, “Order Accepting Settlement Agreements, Amending Procedural Schedule, and Permitting Supplemental Testimony, Docket U-06-134 (Related to Request by Chugach for a Rate Increase and Rate Design),” Order No. 15, July 27, 2007.
Regulatory Commission of Alaska, “Order Establishing Revenue Requirement for Wholesale Customer, Modifying Rate Design, Requiring Filings, and Affirming Electronic Ruling,” Docket U-06-134 (Relating to Request by Chugach for a Rate Increase and Rate Design,” Order No. 21, April 1, 2008.
Regulatory Commission of Alaska, “Railbelt Contract Summary: Fuel, Wholesale Electric and Transmission.”
Science Applications International Corporation, “Cook Inlet Natural Gas Reservoir & Storage,” December 31, 2007.
U.S. Department of Energy, “Annual Report of U.S. Wind Power Installation, Cost and Performance Trends: 2006,” May 2007.
U.S. Department of Energy, “State and Regional Policies That Promote Energy Efficiency Programs Carried Out by Electric and Gas Utilities,” March 2007.
U.S. Department of Energy, “The Value of Economic Dispatch: A Report to Congress Pursuant to Section 1234 of the Energy Policy Act of 2005,” March 2007.
U.S. Department of Energy, National Energy Technology Laboratory, “Alaska Natural Gas Needs and Market Assessment,” June 2006.
Utility Wind Integration Group, “Wind Power and Electricity Markets,” UWIG 2007 Technical Meetings, Anchorage, Alaska, July 23-25, 2007.

APPENDIX I ALASKA REGA STUDY
Black & Veatch I-1 September 12, 2008
APPENDIX I - PUBLIC COMMENTS RECEIVED ON DRAFT REPORT

August 20, 2008 Kevin Harper, Black & Veatch Jim Strandberg, AIDEA Dear Kevin & Jim, Golden Valley Electric Association (GVEA) submits these comments in regards to the Alaska Railbelt Electrical Grid Authority (REGA) Study draft report dated July 23, 2008.
1) Overall, GVEA favors the formation of a generation and transmission entity that would align with Path 4 of the study. This includes an entity that would be responsible for independent operation of the grid, conduct regional dispatching, and coordinate regional resource planning and joint project development.
2) If “hope is not a strategy,” then why has the study recommended that a State
Power Authority entity be formed in hopes that the Governor and State Legislature would more inclined to provide financial assistance to a public entity? In addition, doesn’t the study also place a great deal of hope in procuring tax exempt financing too.
3) Section 1, Executive Summary, Net Savings (page 15) – GVEA questions
whether monthly savings ranging from $.60 to $3.20 for typical residential consumers are enough to support a public state authority rather than their locally owned and controlled cooperative. The issues, in our opinion, are local control versus state control and member-owned versus publically owned.
4) Section 1, Executive Summary, Conclusion and Recommendations (page 20) -
GVEA does not believe that the Governor and State Legislature would be more willing to provide financial assistance to the Railbelt region if the new regional entity was formed as a State Power Authority rather than a private cooperative. Instead, history has shown that past administrations and State Legislatures have provided significant financial support for numerous cooperative capital projects including the northern Intertie, the Teeland transmission build around, Static Voltage Compensators (SVC) project, and many other distribution line projects.
5) Section 1, Executive Summary, Value of tax-Exempt Financing (page 19) and
Conclusion and Recommendations (page 21) - GVEA does not believe an
1

2
assumed 1.75 percent (175 basis points) savings exist between taxable and tax-exempt interest rates. Instead, as the conclusions and recommendations point out (page 21) interest rates through the Rural Utility Service (RUS)/Federal Finance Bank (FFB) are relative to the rates that are available in the tax-exempt bond market.
6) Section 1, Executive Summary, Conclusion and Recommendations (page 21) -
GVEA agrees that regardless of the entity formed, the Board of Directors and management team should be individuals with substantive knowledge and understanding of the electric business, specifically generation and transmission experience. Also, the Board of Directors should not be subject to political cycles (i.e. political appointed positions) and instead should be comprised of cooperative directors/CEOs and municipal commissioners/managers.
7) Section 6, Organizational Issues, Joint Project Development Issues, All-in or
opt-out option (page 85) – how could cooperatives as private corporations be required to participate in future generation and transmission projects that result from a regional resource planning process if they have elected not to be a member of the regional entity?
8) Section 6, Organizational Issues, Tax and Legal Issues, Transfer of Ownership
of Existing Assets (page 86) – GVEA bylaws also require that the sale, lease, or other disposition of more than 15 percent of its total assets to be approved by an affirmative vote of two-thirds of members voting unless the disposition of assets is to another cooperative or the State of Alaska, then the disposition must be approved by a majority of members voting in an election in which at least 10% of the members vote.
9) Section 6, Organizational Issues, Tax and Legal Issues, Governance (page 86)
– GVEA takes exception to the notion that the new entity will need to be a public entity (state authority) to finance a large percentage of future infrastructure investments. Instead, GVEA believes that a G&T Cooperative structure can finance a large percentage of future infrastructure investments.
A state authority is type of public benefit corporation that takes on a more bureaucratic role that often has broad powers to regulate or maintain public property. Typically state authorities borrow from both municipal corporations and private corporations, in that they resemble private nonprofit companies and take on roles that private corporations might otherwise perform. Authorities often perform a specific, narrow function for the public good. However, many feel that a state authority is "an economist's dream but a manager's nightmare," and that every time government gets involved in these types of things, taxpayers are taken to the cleaners. History has shown that power authorities have a financial advantage over investor-owned electric companies. Because they don’t have to make a profit, they pay less in taxes and have access to tax-free financing. But, power authorities have little financial advantage over cooperative electric companies. Electric cooperatives are also not for profit companies that pay no taxes and too have access to both low-cost federal and private financing.

3
10) Section 1, Executive Summary, Setting a Course for the Future (page 4
paragraph 2) - states that project development will unquestionably lead to better results than the current situation. Currently only Chugach, AML&P and GVEA plan and build Generation and Transmission facilities for the most part. Larger projects have been developed with cooperation between the state and all affected utilities. GVEA questions that the decisions made by a separate G&T entity will be unquestionably better.
11) Section 1, Executive Summary, Organizational Paths and Scenarios
Evaluated, Path 2, (page 5) - states that generation is not economically dispatched on a regional basis. It is in fact economically dispatched within the constraints of the interconnected grid and availability of economic energy. GVEA could import more gas fired energy from Anchorage; however, there are many times when more economic energy is unavailable.
12) Section 1, Executive Summary, non-Economic Benefits (page 17) -There are
several points GVEA disagrees with: a. A regional entity provides more career options - in fact it would offer less
options as it would result in a overall reduction in the workforce which is how it saves money overall. Less engineering staff, fewer managers and fewer dispatchers than currently exist.
b. It increases the ability to monitor developments and project status - there would really be no change in this area as all other projects have had a project manager to provide direction. This statement would be true if project management had been performed by a committee.
c. The concentration of staff would lead to more sophisticated planning - again I don't believe there would be an increase in this area. Currently Integrated Resource Plans and Load forecasts along with system modeling are used to make current decisions. The system models incorporate the entire Railbelt system and not just the individual utilities.
13) Section 3, Situational Assessment, Uniqueness of Railbelt Region, Size and
Geographic Expanse (page 42) - the peak total load of the utilities is not 1,100 MW. It is closer to 850 MW. Table 23 shows that projected peak demand in 2037 adds up to 1,092 MW.
14) Section 5, Existing and Future Resource Options, Existing Transmission Grid
(Page 70) - Map is incomplete - does not include GVEA's Carney to North Pole 138 kV or the Ground-base Missile Defense & Alyeska Pump 9 138 kV transmission lines.
15) Section 7, Summary of Assumptions, Table 26 (page 94) - GVEA’s last IRP
indicates no need for additional capacity until 2026. Incorporating the latest GVEA load forecast will push the need for additional capacity beyond 2030.
16) Section 9, Conclusion and Recommendations, Operational Issues, O&M
Responsibility (page 130) - one major issue GVEA believes has not been discussed in this document would be what voltage level determines which lines are considered transmission. Most of the transmission lines in the Railbelt are

4
considered sub-transmission on interconnected grids in the lower 48. For example should the G&T only be responsible for 138 kV transmission lines and above or should there be tie points where the local utility takes over responsibility which are not voltage dependent. GVEA has many distribution substations tied into 69 kV transmission lines in which case local utility control may be desired.
17) General questions and comments:
a. If the proposed entity (State Authority) is not regulated by the Regulatory Commission of Alaska, in part due to the inappropriateness of one State entity regulating another, should the entity also be exempt from Alaska Department Environmental Conservation regulation?
b. If a driver for choosing a State Power Authority is its ability to undertake
tax-exempt debt, what role will Independent Power Producer’s play considering that the other organizational structures were rejected, in large part because of their inability to obtain tax-exempt debt?
c. The ability to issue tax-exempt debt is sometimes be subject to certain
scoring rules. Therefore, the State should immediately look into getting credit for past and future Permanent Fund Dividends (PFD) payouts as well as the upcoming energy credit added to this year’s PFD. These payments are clearly funds that other states would provide via services, but Alaska chooses to give directly to its residents thus causing a new tax stream that the Feds would not have otherwise had.
d. If a State Power Authority is formed, it is likely that the entity will need to
negotiate fuel contracts. As the Oil companies, a couple of years back, wanted to tie tax issues to the building of a gas line, would the State be willing to use tax issues and risk in kind in their negotiations also?
e. The state has traditionally interpreted “highest price” as the meaning of
best value when selling oil. Will this still be their interpretation when they sell electricity via a State Authority directly to end consumers (some of which will be petroleum-based generation)?
f. It is possible that the SCADA HW/SW costs in the executive summary are
too low, at least for a new system. The cost maybe sufficient for retrofitting an existing system, but then there would not be the benefit of having expertise “down the hall.”
g. Many of the non-economic benefits are not necessarily benefits for an
existing utility entity. For example, the study opines that the new entity would be in a good position to compete for labor in the market place. This marketplace would likely be from existing utilities. In addition, the reduced legal expenses are touted as an advantage, yet the majority of legal challenges is this state have been over power supply issues.
h. The Municipality of Anchorage currently requires most new electrical
services to be underground, which are reflected in higher AMLP rates. Should a State Authority be considered, what would stop the Fairbanks
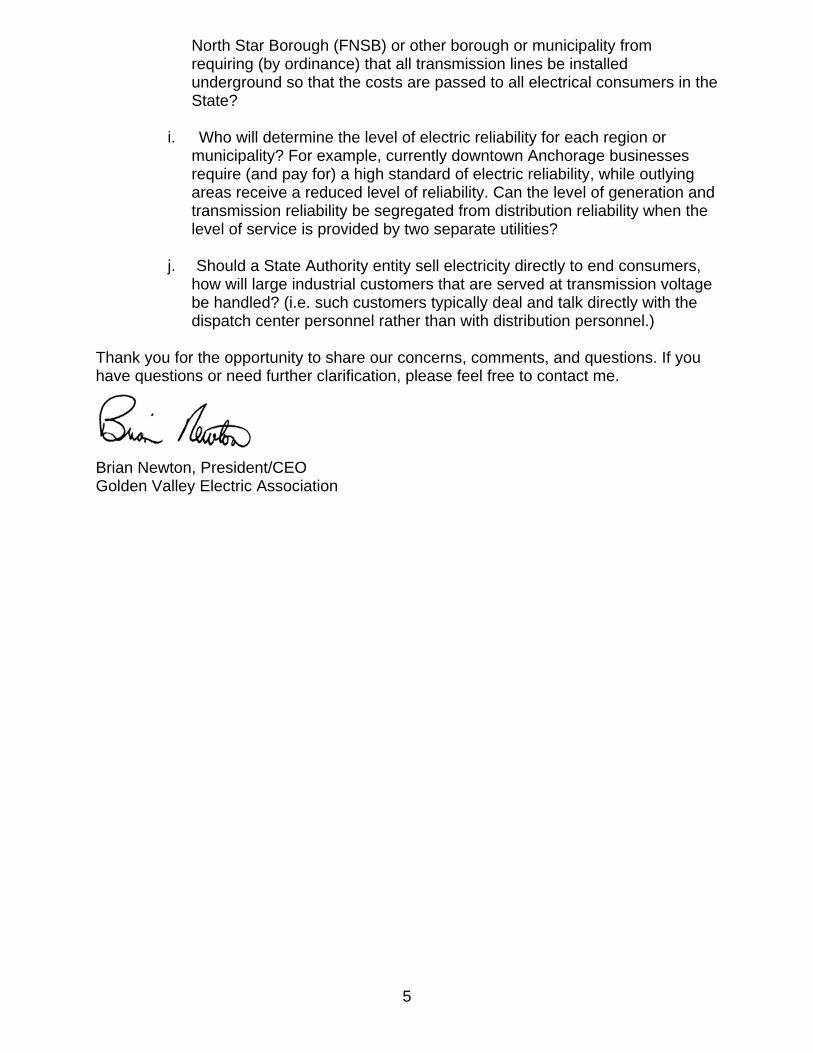
North Star Borough (FNSB) or other borough or municipality from requiring (by ordinance) that all transmission lines be installed underground so that the costs are passed to all electrical consumers in the State?
i. Who will determine the level of electric reliability for each region or
municipality? For example, currently downtown Anchorage businesses require (and pay for) a high standard of electric reliability, while outlying areas receive a reduced level of reliability. Can the level of generation and transmission reliability be segregated from distribution reliability when the level of service is provided by two separate utilities?
j. Should a State Authority entity sell electricity directly to end consumers,
how will large industrial customers that are served at transmission voltage be handled? (i.e. such customers typically deal and talk directly with the dispatch center personnel rather than with distribution personnel.)
Thank you for the opportunity to share our concerns, comments, and questions. If you have questions or need further clarification, please feel free to contact me. Brian Newton, President/CEO Golden Valley Electric Association
5


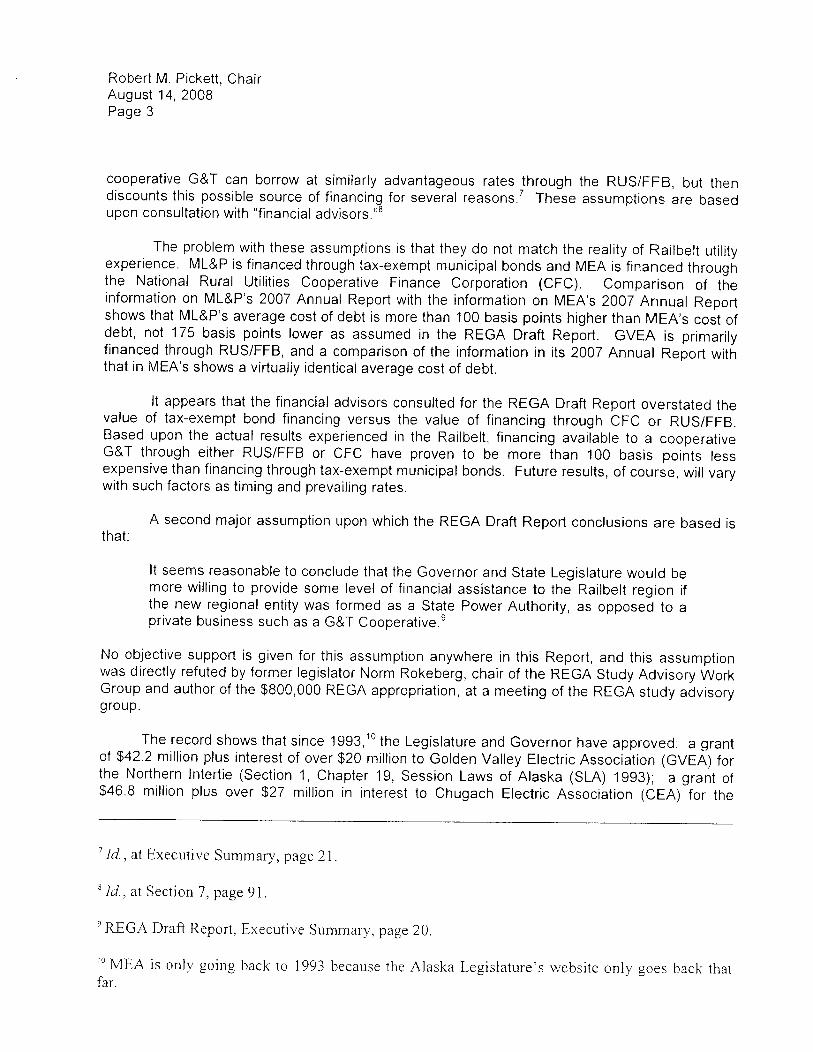
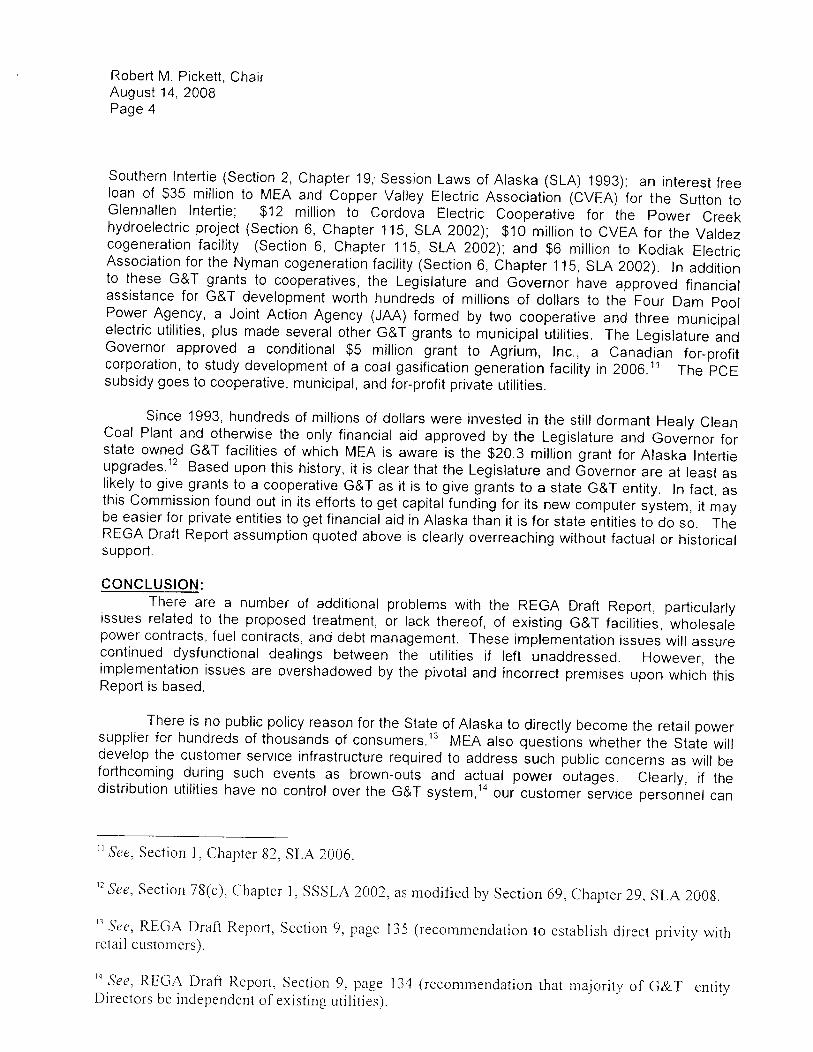


STATE OF ,A.LASKADEPARTMENT OF
COMMERCECOMMUNITY ANDECONOMIC DEVELOPMENT
Sarah Palat, GoænryErnil NoW Ørrnsstører
Ro!ært M. Pi&at, tairrmn
Regulatory fümmission of Alaska
August 20,2008
James S. StrandbergProject ManagerAlaska Energy Authority813 W Northern Lights BlvdAnchorage, AK 99503
Kevin M. HarperDirector, Enterprise Management SolutionsBlack & Veatch Corporation24513 SE 37th Streetlssaquah, WA 98029
RE: Comments on the Alaska Railbelt Electrical Grid Authority Draft Study
Dear Messieurs Strandberg and Harper:
We appreciate the opportunity to comment on the Alaska Railbelt Electrical GridAuthority (REGA) Draft Study (REGA Study).
We strongly support the effortS of the Railbelt Utilities and the State of Alaska workingtogether to create a comprehensive plan for the future of energy generation andtransmission. The REGA Study identified potential economies of scale in jointownership of generation and transmission facilities and has demonstrated thatsubstantial benefit could accrete to Railbelt electric consumers from Homer toFairbanks over the next 50 years. For that, we commend your efforts.
It is well krrown that the relationship between all Railbelt electric utilities over the past 30years has been contentious and frequently the subject of costly litigation before thiscommission and Alaska's state coufts. lt is encouraging to see a future through theeyes of the REGA Study where all parties work together in the best interest of electricutilities and their customers.
However, this future has the best chance to become Alaska's reality only if it results infar less litigation than in the past and lower costs of power for Alaska's consumers. lt iswith this goal in mind that we considered the REGA Study.
201 \í. 8th Avenue, SLrite 300, Anchorage, Alaska 99501-3469Telephone: (907) 276'6222 Fax: (907) 276-0160 Texr Telephone: (907) 276-4533
Vebsite : hnp:,// rca.alaska.govlRCAVeb,/home.aspx
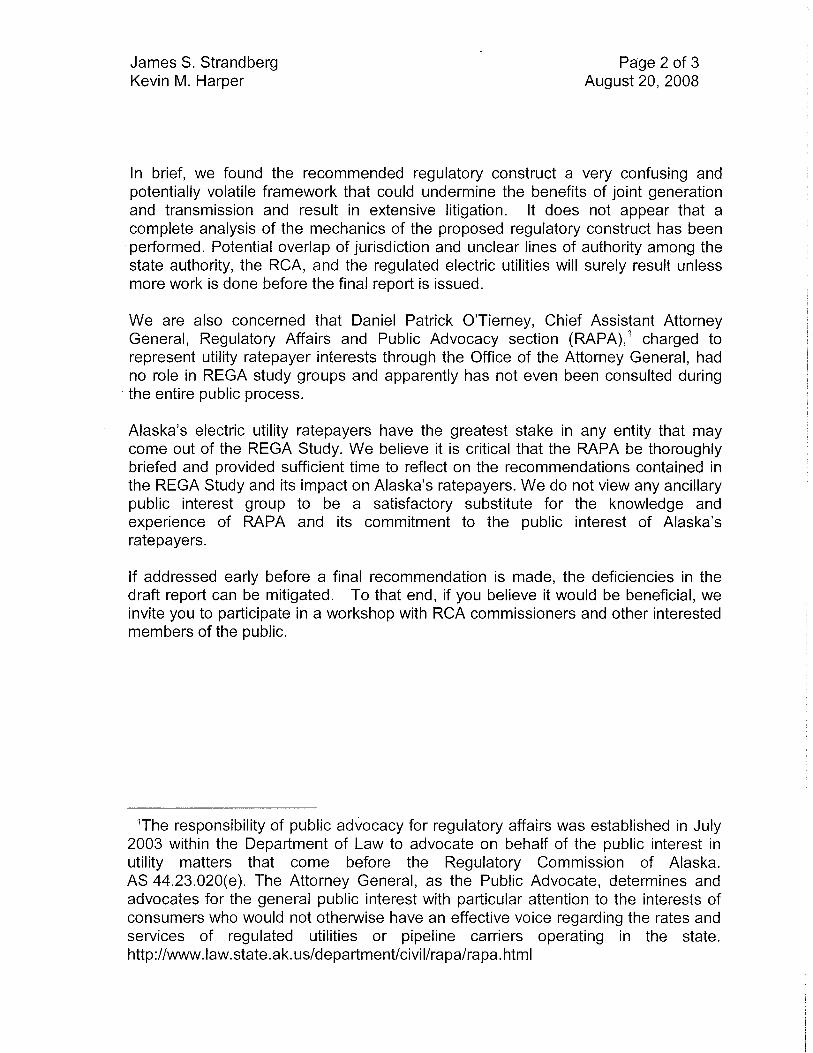
James S. StrandbergKevin M. Harper
Page 2 of 3August 20,2008
In brief, we found the recommended regulatory construct a very confusing andpotentially volatile framework that could undermine the benefits of joint generationand transmission and result in extensive litigation. lt does not appear that acomplete analysis of the mechanics of the proposed regulatory construct has beenperformed. Potential overlap of jurisdiction and unclear lines of auihority among thestate authority, the RCA, and the regulated electric utilities will surely result unlessmore work is done before the final reporl is issued.
We are also concerned that Daniel Patrick O'Tierney, Chief Assistant AttorneyGeneral, Regulatory Affairs and Public Advocacy section (RAPA),' charged torepresent utility ratepayer interests through the Office of the Attorney General, hadno role in REGA study groups and apparently has not even been consulted duringthe entire public process.
Alaska's electric utility ratepayers have the greatest stake in any entity that maycome out of the REGA Study. We believe it is critical that the RAPA be thoroughlybriefed and provided sufficient time to reflect on the recommendations contained inthe REGA Study and its impact on Alaska's ratepayers. We do not view any ancillarypublic interest group to be a satisfactory substitute for the knowledge andexperience of RAPA and its commitment to the public interest of Alaska'sratepayers.
lf addressed early before a final recommendation is made, the deficiencies in thedraft report can be mitigated. To that end, if you believe it would be beneficial, weinvite you to participate in a workshop with RCA commissioners and other interestedmembers of the public.
'The responsibility of public advocacy for regulatory affairs was established in July2003 within the Depaftment of Law to advocate on behalf of the public interest inutility matters that come before the Regulatory Commission of Alaska.AS 44.23.020(e). The Attorney General, as the Public Advocate, determines andadvocates for the general public interest with pafticular attention to the interests ofconsumers who would not othenruise have an effective voice regarding the rates andservices of regulated utilities or pipeline carriers operating in the state.http ://wr.vw. law. state. a k. us/department/ci vill rapal rapa. html

James S. StrandbergKevin M. Harper
Attachment
Page 3 of 3August 20,2008
We have attached, for your consideration, a brief list of the areas we believe needfurther development before release of the final report. We appreciate theoppoftunity to comment and look fonruard to working together in the coming weeks.
Sincerely,
REGULATORY COMMISSION OF ALASKA
CÅ-rYAWRobert PickettChairman
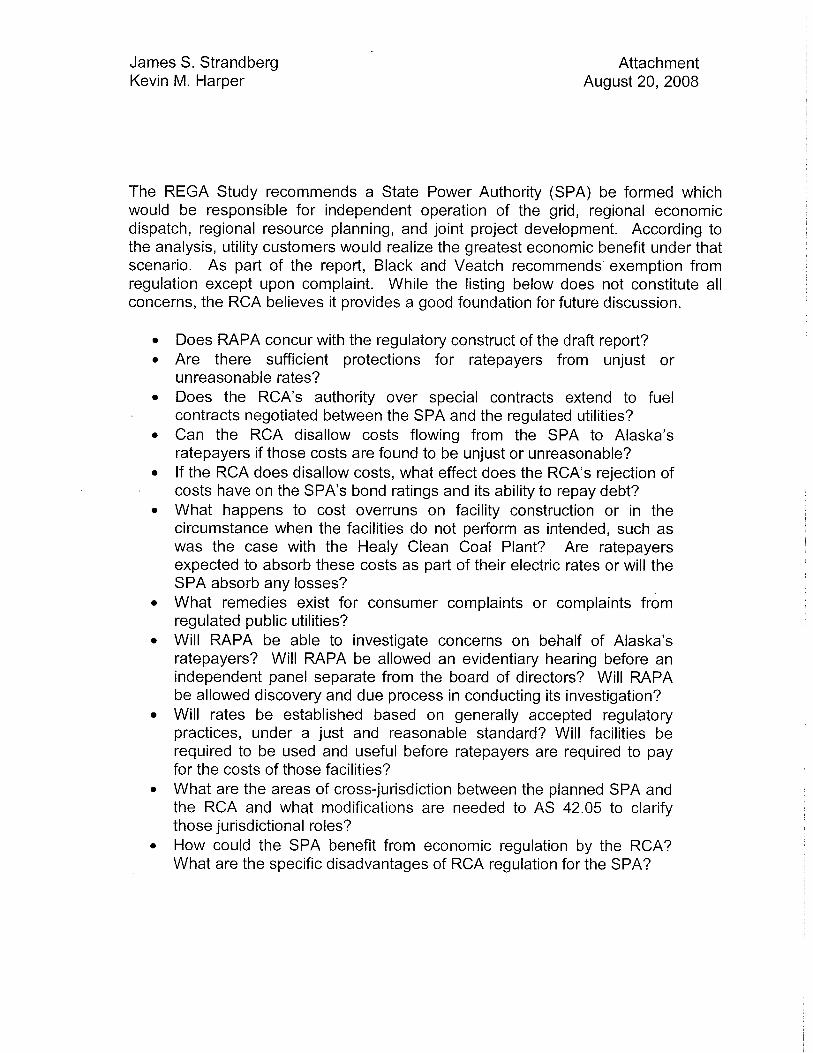
James S. StrandbergKevin M. Harper
AttachmentAugust 20,2008
The REGA Study recommends a State Power Authority (SPA) be formed whichwould be responsible for independent operation of the grid, regional economicdispatch, regional resource planning, and joint project development. According tothe analysis, utility customers would realize the greatest economic benefit under thatscenario. As part of the report, Black and Veatch recommends exemption fromregulation except upon complaint. While the listing below does not constitute allconcerns, the RCA believes it provides a good foundation for future discussion.
. Does RAPA concur with the regulatory construct of the draft report?
. Are there sufficient protections for ratepayers from unjust orunreasonable rates?
. Does the RCA's authority over special contracts extend to fuelcontracts negotiated between the SPA and the regulated utilities?
. Can the RCA disallow costs flowing from the SPA to Alaska'sratepayers if those costs are found to be unjust or unreasonable?
. lf the RCA does disallow costs, what effect does the RCA's rejection ofcosts have on the SPA's bond ratings and its ability to repay debt?
. What happens to cost overruns on facility construction or in thecircumstance when the facilities do not perform as intended, such aswas the case with the Healy Clean Coal Plant? Are ratepayersexpected to absorb these costs as parl of their electric rates or will theSPA absorb any losses?
o What remedies exist for consumer complaints or complaints fromregulated public utilities?
. Will RAPA be able to investigate concerns on behalf of Alaska'sratepayers? Will RAPA be allowed an evidentiary hearing before anindependent panel separate from the board of directors? Will RAPAbe allowed discovery and due process in conducting its investigation?
. Will rates be established based on generally accepted regulatorypractices, under a just and reasonable standard? Will facilities berequired to be used and useful before ratepayers are required to payfor the costs of those facilities?
. What are the areas of cross-jurisdiction between the planned SPA andthe RCA and what modifications are needed to AS 42.05 to clarifythose jurisdictional roles?
. How could the SPA benefit from economic regulation by the RCA?What are the specific disadvantages of RCA regulation for the SPA?

On behalf of the MEA Ratepayers Alliance, Inc., we would like to extend our deep appreciation and commendations to Mr. James Strandberg, Project Manager of the Alaska Railbelt Electrical Grid (REGA) Study; to Mr. Kevin Harper and Mr. Doland Cheung of Black and Veatch,REGA Study Consultants; to the staff and personnel of the Alaska Energy Authority; to the members of the REGA Advisory Working Group; and to all the Railbelt utilities, professionals, REGA stakeholders, and members of the community who gave of their time, energy, expertise, and experience to the REGA Study. We would also like to thank the Alaska State Legislature for its vision and foresight to provide the funding necessary for this tremendous and valuable undertaking and to the Governor of Alaska for directly stating her officeʼs commitment and plans for addressing the energy needs of the state.
In our view, the REGA Study has provided the kind of breadth, depth, and thoroughness of information, analysis, and presentation of the interconnection and complexity of factors that is needed if we are to move ahead intelligently in creating viable and long term solutions to the energy needs that we are and will be facing in Alaska. We think the Study has provided the much needed direction, formulation, and implementation for an organizational structure that will be responsive to the various dynamics, functions, and technologies that will come into play as decisions are made regarding safe, clean, reliable, and affordable energy efficiency, fuel sources, generation, transmission, and distribution. In addition, through the Technical Conference and the formation and regular and consistent involvement of the REGA Study Advisory Working Group, opportunities were provided for direct interaction of a broad range of concerns, players, and perspectives which we found to be invaluable.
As ratepayers and citizens, we have been most impressed with the insistence, perseverance, and integrity of the REGA Study Project Manager and REGA Study consultants to have a formal and responsive process that continues to maximize active participation and input from the diverse professional, technological, and public sectors. This process was open and made available and accessible the pertinent schedules, progress, and information pertaining to the REGA Study on the Alaska Energy Authorityʼs web site. This kind of accessibility of information as well as that of the REGA Project Manager and the REGA Study consultants made it possible for those who have a deep interest and concern about the issues to have the opportunity to be informed and offer their perspectives when they could not directly participate in any of the conferences or meetings because of their job schedules and/or places of residence. We see that his kind of formal, open, and participatory process will be critical and necessary for the work that lies ahead for creating any organizational structure, integrated resource planning, and a State Energy plan that is comprehensive, coordinated, responsive, and economically, environmentally, socially, and culturally responsible to the citizens and energy future of Alaska.
In reviewing the draft and the recommendations for an organizational structure for the Railbelt we find that many of our concerns and ideas for what we saw as specific needs and possible solutions to the situation here were clearly addressed. It is evident to us that the recommendation for the formation of a regional entity with the responsibility for generation and transmission along with the specific functional responsibilities as presented in in the overall organizational structure recommendations, is what is needed and that the entity indeed should be formed as a State Power Authority.
Given the history and the present and future needs of the Railbelt as well as those of Alaska, we see that it is imperative that the recommendations of the Study be implemented and that the recommended steps for implementation be initiated as soon as possible. The convergence of many factors at this particular time, we think , make it possible for the recommendations of the REGA Study to be implemented. We have a

governor who has made it clear that the cooperation and participation of all the utilities, the State, and the public are needed for solutions to be identified and put into action. The energy needs and issues of climate change of the state, the nation, and the world are pushing us to examine our lives and to face the critical need for comprehensive, long-term planning and solutions at and from all levels. The REGA Study itself has brought together through an open, educational, and participatory process critical aspects as well as executive, legislative, and regulatory leadership, interest, and involvement and those of stakeholders from the utilities and community at large. An arena has been established for interaction and direct communication among various players at different levers and within specific fields that we feel that business, politics, and paradigms as usual cannot continue if we are to go into the future together with the knowledge and dynamics that have been established as a result of this study.
If we can do what will ensure intelligent leadership, a Board and organization that is independent, knowledgeable, and committed to the those principles and recommendations that will benefit the region and state as a whole and representative of the aspects of the whole, and formalize a process of oversight and input from the financial, governmental, regulatory, environmental, consumer, and other stakeholder sectors of the community, we can move ahead with confidence to create the kind of organizational structure that work in alignment with comprehensive and intelligent planning responsive to the energy needs of the Railbelt as well as those of the state as a whole.
Thank you for the opportunity for comment and for the all the work that has and is being done. We look forward to the next REGA Advisory Working Group meeting to see what other comments have been submitted and what will be the next steps to be considered and taken.
Respectfully submitted,
Tim LeachChristine VecchioMEA Ratepayers Alliance, Inc.
Comment from Les Webber, Marathon Oil
REGA STUDY
JULY 23, 2008 DRAFT REPORT
COMMENTS EXECUTIVE SUMMARY
o Page 1 I would prefer to see a very short summary of the conclusions and recommendations right up front on page 1 rather than waiting to find them on page 20.
o Page 3, fourth line from bottom
“stakeholders”, not “stakeholders”
o Page 4, last paragraph I do not know how to best convey the immediate need for integrated resource planning across the Railbelt. I see the proposed Chugach Electric/ML&P project delaying that process, with the possible result that key decisions that should be taken in the near term (such as hydroelectric generation) are delayed. Also, such a project may not allow for the optimal reduction in reserve margins over time.
o Page 11 I am trying to find where you refer to Section 8 in terms of “Summary of Results”
o Page 12 In terms of “Organizational Cost Results”, should it be specifically pointed out that these results do not include the cost savings that will inevitably occur in the existing cooperatives and utilities?
o Page 15, Table 7 I question the introduction of “% Savings” in this table, since the “total power costs under each Organizational Path 4” [Scenario] are not shown. It begs the question: “Where is the data?”.
o Page 19, Tables 9 and 10
The annual savings should be expressed in the same units (i.e. millions of $) in both tables. The values in Table 9 seem very low to me. Where in the report are the results in Tables 9 and 10 supported?
o Page 21 The second bullet point on this page is absolutely key. Is
there any way to emphasize it? The Regulatory Commission of Alaska today lacks such expertise.
o Page 24 About half way down the page, the “Retail Requirements Approach” concept is introduced. I did not see that it was previously defined or explained.
o Page 25 The “Start-up Implementation Plan” appears to be a daunting task. The time and effort to do this could be discussed, i.e. it is “doable” over a period of x months.
o Page 27 The description of AEA seems a little out of place. o Page 41 In the first full paragraph, in the third line, “raising
natural gas prices” should be “rising …” and “outside on the” should be “outside of the”. In the fifth line of the same paragraph, “themselves” is spelled incorrectly.
o Page 45, Table 13 In the “Large Commercial” section, there is no “Homer (North of Kachemak Bay: category shown.
o Page 48, Figure 13 The top line could be labeled as “Gas Demand”. o Page 48, Figure 14 Re “Known Reserves”, the 2005 figure is “Remaining
Reserves”. o Page 49, Figure 15 The line represents “Supply”, the colored sections
“Demand”. o Page 50, Figure 17 Y-axis represents “Total Monthly Bill ($)”. o Page 51 In the section, “Potential Major New Loads”, has the
subject of the Railbelt’s ability to handle such loads in the absence of a regional G&T been adequately addressed, especially if the Anchorage area forms a municipal G&T? It is likely that a major new load will be outside the Municipality of Anchorage. In addition, has the Study focused at all on the situation that will be faced by the smaller cooperatives, HEA and MEA, as they try to proceed on their own, once their contracts with CEA expire? They may be exposed to significant risk and high costs if they are unable to proceed with their own generation. The regional G&T would assure them of equitable treatment. Plus, there is the issue of operating and spinning reserve requirements (page 52).
o Page 56. “Future Fuel Diversity”
No comma needed in line 4, after “reserves”.
o Page 57, “Proposed ML&P/Chugach Merger”
This merger could also be viewed as an impediment to the formation of a regional entity.
o Page 65 and thereafter It would be interesting to include, in all the existing units, the capability to consume an alternative fuel (as a backstop) as well as their ability to “black start” with the alternative fuel. Are the “Retirement Dates” shown firm or estimated?

o Page 74 Is the term “HRSG” in line 5 of the “Combined Cycle Combustion Turbines” description defined?
o Page 92 Three lines above Table 24, HAGO is “heavy atmospheric gas oil”.
o Page 93 Regarding the first full paragraph, “BRU” means the Beluga River Unit (not defined). While the ML&P price/value/cost of its share of BRU gas is confidential, the Alaska Department of Natural Resources does publish a production forecast for all fields, including the Beluga River field, on a periodic (annual) basis.
o Page 96 Second last paragraph, fourth line – should be “fixed O&M costs”
o Page 106, Table 34 Total power costs are not shown (re % savings). o Page 113, Table 38 Annual savings appear very low. o Page 117, Figure 31 I do not know where the data in this table comes from.
How derived? Moreover, there has to be a better way to arrange the bars to demonstrate the points made. In addition, the legend colors are not distinctive enough.

Comments Received Within E-Mail Transmittals
Elizabeth Brown, Alaska State Legislature
I have reviewed your REGA Study Draft. I like the Pirog/Boness Approach. One matter was not addressed though, and that was the future "Road to Nome" project being currently considered. Would the newly created board format the energy abilities of many native villages there? Just wondering.
© Black & Veatch Holding Company 2008. All Rights Reserved. The Black & Veatch name and logo are registered trademarks of Black & Veatch Holding Company. Other services marks and trademarks included herein are the trademarks or registered trademarks of their respective companies.
CONTACT INFORMATION:
For more information, please contact: Kevin M. Harper Black & Veatch Corporation 24513 S.E. 37th Street Issaquah, Washington 98029 Tel: 425.427.1652 Fax: 425.313.0519 Email: [email protected] Web site: www.bv.com