alan leonard koller - vtechworks.lib.vt.edu · of, diploid tissue, and apogamy, the development of...
TRANSCRIPT
Growth and Development of the Megagametophyte of the Vascular Plant
Selaginella (Lycopsida) on Defined Media
by
Alan Leonard Koller
Thesis submitted to the Faculty of the
Virginia Polytechnic Institute and State University
in partial fulfillment of the requirements for the degree of
APPROVED:
B.C. Parker
r:i. A1• / Stetler
MASTER OF SCIENCE
in
Botany
S.B. Scheckler
J. c;S"'ervai tes
July, 1982 Blacksburg, Virginia

ACKNOWLEDGEMENTS
I wish to thank the members of my committee for all the
advice, guidance, and knowledge that they have provided to
me, as well as for the use of their laboratories and
equipment, which was of the utmost aid in allowing me to
initiate and complete this work. I am especially grateful
to have had the opportunity to learn about plants from Dr.
Stephen E. Scheckler. My knowledge in all areas of Botany
is much greater because of him.
I also wish to express my gratitude to all faculty,
staff, and fellow graduate students at VPI & SU who have
helped to shape these past three years. Those who stand out
most clearly include Dr. Bruce C. Parker, Professor of
Botany, for both insight and good humor along the way, Mrs.
June Almond, secretary par excellence, who has helped to oil
the gears, David Banks, who really knows his statistics, and
John Randall and Carrie Rouse, fellow graduate students, for
the feelings of hope and friendship both for and from them.
Finally, I wish to express my deepest gratitude to Janet
Lee Paul, who has provided me with support, encouragement,
confidence, patience, and love throughout this important
stage in my life, and who deserves the best in return.
ii

CONTENTS
ACKNOWLEDGEMENTS . . . . ii
~hapter
I.
II.
INTRODUCTION
MATERIALS AND METHODS
Media Preparation Collection and Inoculation of Megaspores Data Collection . . . . . . . . . Additional Nutritional Treatments
Sorbitol as an Osmotic Control Repeat of Trehalose Treatments
Correlation Analysis . . . . . Determining the Presence of Chlorophyll Cell Size Analysis . . . . . . . . Cellular Organization of Selected
Megagametophytes
1
9
9 10 12 14 14 15 15 16 17
20
III. RESULTS 22
IV.
Number of Days to Germination Percent Germination . . . . . Differences In Final Volume
Growth on K Medium With and Without B
22 38 43
Vitamins . . . . . . . . . 51 Growth on Glucose With and Without B Vitamins 55 Growth on Sucrose With and Without B Vitamins 65 Growth on Trehalose With and Without B
Vitamins . . . . . . . . . . . . . . 73 Growth on Sorbitol With B Vitamins . . . 82
Response to the Second Trehalose Treatments 88 Correlation Analysis . . . . . . 93 Results of Fluorescence Analysis . . . . . 97 Cell Size Analysis . . . . . . . . . 99 Cellular Organization of Megagametophytes 101
DISCUSSION
The Effects of B Vitamins Utilization of B Vitamins and Sugars Germination Timing and Nutrition . Percent Germination and Nutrition
iii
105
105 107 108 111

Growth and Nutrition . . . . . 115 Metabolism of Sorbitol . . . . 119 Correlation Between Responses 121 Repeated Trehalose Treatments 122 The Presence of Chlorophyll-a in
Megagametophytes . 124 Cell Size Analysis . . . . . . . 126 Cellular Organization of the Tissues 127 The Original Hypothesis versus the Results 128
v. CONCLUSIONS . . 134
LITERATURE CITED 136
Appendix
A.
B.
c. D.
VI.
MEDIA COMPONENTS
GERMINATION RATE AND VOLUME MEASUREMENTS - ALL DATA ....
PERCENT GERMINATION
FLUORESCENCE DATA
CURRICULUM VITAE
iv
140
142
154
156
157

LIST OF FIGURES
Figure
1. Differences in Average Number of Days to Germinate Without B Vitamins at 2 Confidence Intervals . 25
2. Differences in Average Number of Days to Germinate With B Vitamins 26
3. Average Number of Days to Germinate ±1 Standard Deviation 27
4. Time to Reach 100% Germination - Control (Knudson's Medium With and Without B Vitamins) 28
5. Time to Reach 100% Germination - Glucose 30
6. Time to Reach 100% Germination - Glucose With B Vitamins
7. Time to Reach 100% Germination - Sucrose
8. Time to Reach 100% Germination - Sucrose With B Vitamins
9. Time to Reach 100% Germination - Trehalose
10. Time to Reach 100% Germination - Trehalose With B Vitamins
11. Time to Reach 100% Germination - 3% Glucose With B
31
32
33
34
35
Vitamins (1st and 2nd Experiments) 36
12. Time to Reach 100% Germination - Sorbitol With B Vitamins 37
13. Percent Germination Among Treatments With and Without B Vitamins 39
14. Differences in Final Volume for Treatments Without B Vitamins 45
15. Differences in Final Volume for Treatments With B Vitamins 47
16. Average Growth on Each Substrate Type 48
v

17. Highest Growth on Each Substrate Type 50
18. Growth on K Medium With and Without B Vitamins 52
19. Response of Megagametophytes Grown on K Medium 53
20. Response of Megagametophytes Grown on K Medium With B Vitamins 54
21. Growth on Glucose 56
22. Response of Megagametophytes Grown on 1% Glucose 57
23. Response of Megagametophytes Grown on 3% Glucose 58
24. Response of Megagametophytes Grown on 5% Glucose 59
25. Growth on Glucose With B Vitamins 61
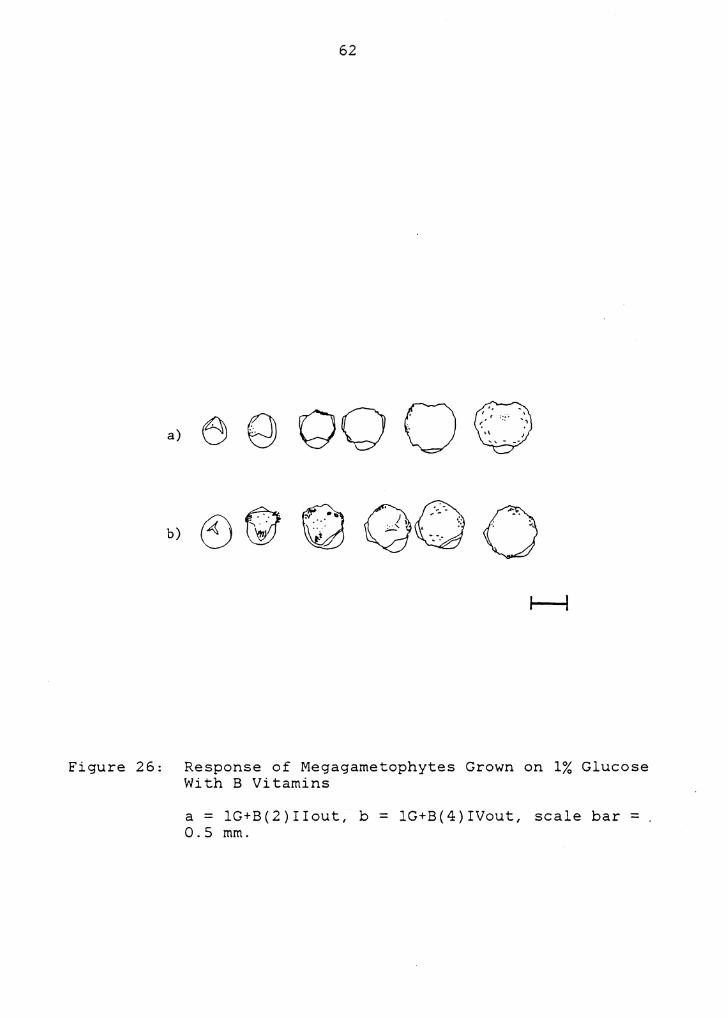
26. Response of Megagametophytes Grown on 1% Glucose With B Vitamins . . . . . . . . . . . . . . . . 62
27. Response of Megagametophytes Grown on 3% Glucose With B Vitamins . . . . . . . . . . . . . 63
28. Response of Megagametophytes Grown on 5% Glucose With B Vitamins 64
29. Growth on Sucrose 66
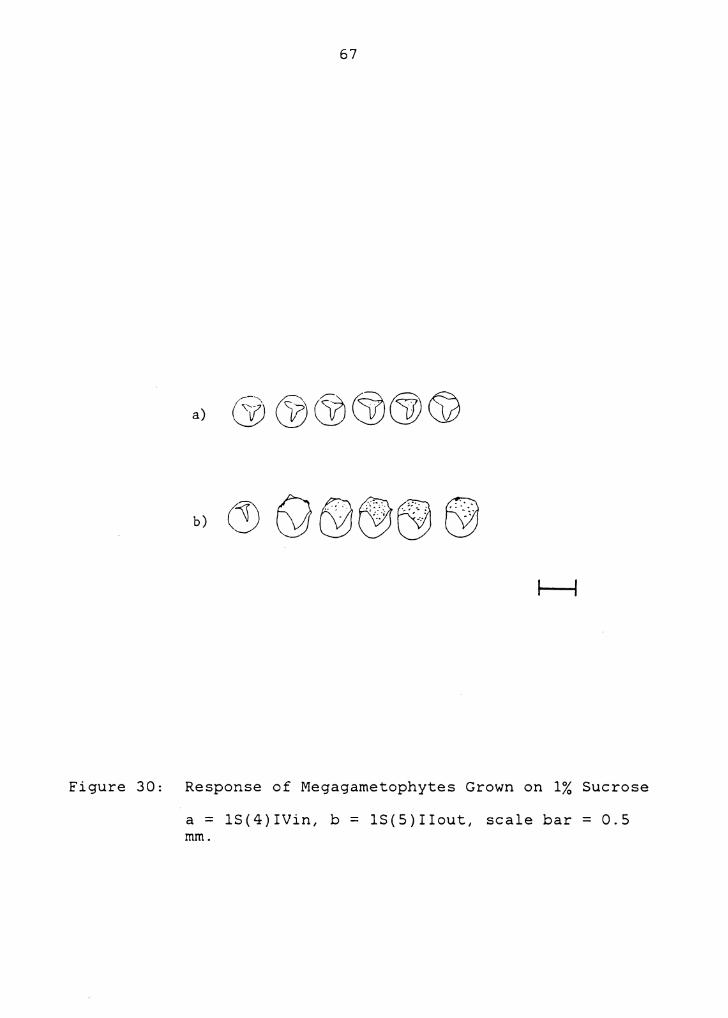
30. Response of Megagametophytes Grown on 1% Sucrose 67
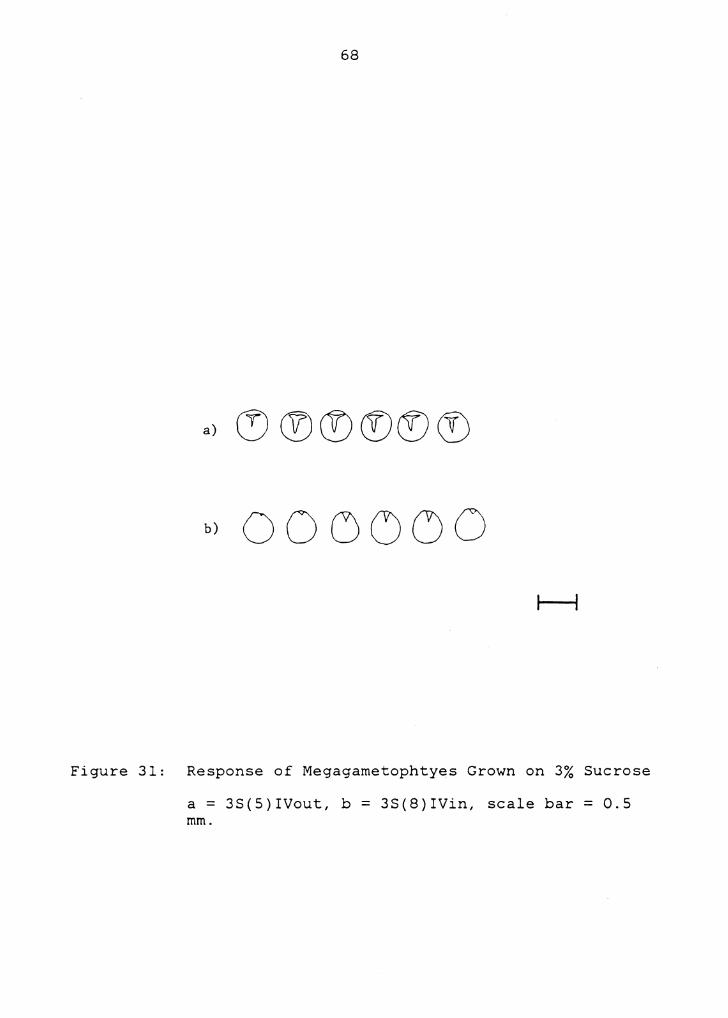
31. Response of Megagametophtyes Grown on 3% Sucrose 68
32. Response of Megagametophytes Grown on 5% Sucrose 69
33. Growth on Sucrose With B Vitamins 71
34. Response of Megagametophytes Grown on l, 3, and 5% Sucrose With B Vitamins 72
35. Growth on Trehalose 74
36. Response of Megagametophytes Grown on 1% Trehalose 75
37. Response of Megagametophytes Grown on 3 and 5% Trehalose . . . . . . . . 76
38. Growth on Trehalose With B Vitamins 78
vi

39. Response of Megagametophytes Grown on 1% Trehalose With B Vitamins . . . . . . . . . . . . 79
40. Response of Megagametophytes Grown on 3% Trehalose With B Vitamins . . . . . . . . . . . 80
41. Response of Megagametophytes Grown on 5% Trehalose With B Vitamins . . . . . . . . . . . . . 81
42. Growth on 3% Glucose With B Vitamins - June and December Experiments . . . . . 83
43. Growth on Sorbitol With B Vitamins 84
44. Response of Megagametophytes Grown on 1% Sorbitol With B Vitamins . . . . . . . . . . . . . . . 85
45. Response of Megagametophytes Grown on 3% Sorbitol With B Vitamins . . . . . . . . . . . . . . 86
46. Response of Megagametophytes Grown on 5% Sorbitol With B Vitamins . . 87
47. Growth on Trehalose - 2nd Set 91
48. Differences In Final Volume - Trehalose (1st and 2nd Sets) . . . . . . . . . . . . . . . . . . 92
49. Correlation Between % Germination and Final Volume 94
50. Correlation Between Time to Reach 50% Germination and Final Volume . . . . . . . . . . . . . . 95
51. Correlation Between Time to Reach 50% Germination and % Germination . . . . . . . . . . . . . 96
52. Normal and Enhanced Growth of Megagametophytes -External and Internal Observations . . . . 103
vii

LIST OF TABLES
Table
1. Differences in Average Number of Days to Germinate With and Without B Vitamins 23
2. Differences in% Germination Among All Treatments at the 0.05 Confidence Level 40
3. Differences in Average Final Volume With and Without B Vitamins . 44
4. Percent Germination on 1st and 2nd Trehalose Treatments (July and December) . . 89
5. Amount of Chlorophyll-a Present in Megagametophyte and Sporophyte Tissue . 98
6. Cell Size Analysis 100
viii

Chapter I
INTRODUCTION
The life cycle of the vascular plants involves an
alternation of two morphologically different generations,
the smaller and anatomically less complex gametophyte, and
the larger, more complex sporophyte (Whittier, 1971; Foster
and Gifford, 1974). The sporophyte generation begins with
the fertilization of the egg cell to form a diploid zygote.
Meiosis and the production of haploid spores initiate the
gametophyte generation. Upon observing the general pattern
of this life cycle, one might assume that ploidy level plays
a major role in determining sporophyte versus gametophyte
morphology. It follows from this that haploid growing
tissue should develop into a gametophyte solely because the
cells of this tissue contain 1 set of chromosomes instead of
2. However, Lang (1898), Manton (1950), Freeberg (1957),
Bell (1958), Morlang (1967), Whittier (1965, 1971) and
others (see White, 1971), working with homosporous vascular
plants, have documented both naturally-occurring and
experimentally-induced abnormalities in the life cycle that
cast serious doubts on the presumed determinative role of
the ploidy level. These abnormalities include apospory, the
development of a gametophyte directly from, and comprised
1

2
of, diploid tissue, and apogamy, the development of a
sporophyte directly from, and comprised of, haploid tissue.
Thus, in some homosporous vascular plants growing tissue can
develop as either sporophyte or gametophyte without regard
to the ploidy level. The question remains as to what the
determinants of these two different growth types might be.
W. H. Lang (1909) hypothesized that the normal
alternation of morphologically dissimilar generations
results from differences in the physical and chemical
(nutritional) environments at the initiation of the two
generations. Among the homosporous vascular plants the
gametophyte begins as a single cell, the spore, which
germinates by growing out of the sporoderm so that the first
cell division occurs in an environment that is physically
unconstrained, and in which there is only a small amount of
nutrition initially available to the growing tissue. The
sporophyte initiates as the zygote, physically constrained
within the archegonium and having the benefit of a greater
amount of nutrition available from the surrounding
gametophyte tissue. Response to these two different sets of
conditions, according to Lang, is gametophytic and
sporophytic development, respectively. Lang proposed that
the observed life cycle abnormalities resulted from
modifications of these environmental factors. Many workers

3
have since attempted to find support for Lang's hypothesis
through manipulation of physical and chemical factors under
controlled conditions.
Experimental manipulation of physical constraint has
included work by DeMaggio and Wetmore (1961). In an attempt
to mimic the physical environment that confronts the spore
they released the zygote and embryo of a fern, Todea
barbara, from physical constraint by surgically removing
them from the archegonium. The younger the embryo at the
time of liberation the more delayed was normal sporophytic
growth, while liberated zygotes gave rise only to
2-dimensional thallus-like structures that looked very
similar to the early haploid or gametophytic plant.
Apparently, by providing a physical environment like that of
a germinating spore, DeMaggio and Wetmore have triggered
gametophyte-like development. The reciprocal experiment of
placing physical constraint on a germinating spore has not
yet been done successfully (Bell, 1958).
The environment in which a plant develops also consists
of a nutritional component. The first cell of each
generation of the homosporous vascular plants faces a unique
set of conditions. The spore has only its own nutritional
reserves to draw from and, upon germination, the gametophyte
must quickly photosynthesize or associate with a symbiotic

4
fungus to secure a source of nutrition. In these early
stages of development the amount of available nutrients is
likely to be low, and the tissue may develop in response to
this condition. DeMaggio (1963) and Whittier (1978) have
hypothesized that gametophyte morphology may be the result
of a low nutritional (carbohydrate) level that does not
allow for re-establishment of the more vigorous sporophytic
pattern of growth. The zygote, on the other hand, is
embedded within the tissue of the mature gametophyte, and
development into an embryo and young sporophyte is
presumably determined, at least partially, by a greater
amount of nutrients. This may explain the observations that
low levels of carbohydrate and/or light appear most
effective for inducing apospory in cultured tissue (Morlang,
1967; Whittier, 1978), whereas high levels of carbohydrate
and/or light are most effective for induction of apogamy
(Bristow, 1962; Whittier, 1960, 1965). Whether induction of
apogamy and apospory can be interpreted strictly in terms of
the amount of energy available for growth is still not
clear. Whittier (1975), for example, has determined that,
when a basal level of carbohydrate is available, increasing
the osmolarity of the medium with mannitol will increase the
number of apogamous sporophytes produced. In this case
sporophytic growth appears to be triggered by both energy
and osmotic factors.
5
Response of homosporous plant tissue to experimental
manipulation supports Lang's hypothesis. However, little
work of this kind has used the heterosporous vascular
plants. Heterospory refers to the production of two types
of spores that differ in both size and potential. The
megaspore contains the female megagametophyte which, in
lower vascular plants and gymnospermous seed plants, is a
complex organism consisting of nutritional reserve tissue,
vegetative tissue, and reproductive tissue bearing
archegonia which contain the egg cells. The microspore
contains the male microgametophyte, of which most of the
tissue is involved in production of sperm cells. Most of
the heterosporous gametophytes develop from 1 cell to the
mature organism within the confines of the sporoderm and,
hence, are characterized as endosporic in their development.
This is in contrast to the homosporous gametophytes, in
which all cell divisions, growth, and development take place
ouside the sporoderm (exosporic). Thus, both sporophyte and
gametophyte among the heterosporous plants are initiated in
physically constrained environments. However, the cells
surrounding the archegonium do yield to growth and possibly
provide some nutrition or growth substance to the embryo.
The spore wall is nutritionally inert and, except for the
trilete end, is physically unyielding. Nutrition for cell

6
divisions, growth, and development of mega- and micro-
gametophytes is provided by lipid, starch, and protein
reserves incorporated into the young spores before the
sporoderm is complete. Megaspores, especially, show marked
expansion during this stage.
Though physical environments are similar at the beginning
of each generation in the heterosporous vascular plants, the
nutritional environments are different. For example, in the
genus Selaginella the sporophyte is photosynthetic,
providing this tissue with a carbohydrate-based type of
nutrition. Neither male nor female gametophyte, on the
other hand, appear to photosynthesize (though this has not
been confirmed), nor have any relationships with fungal
symbionts been reported (Foster and Gifford, 1974). Within
the megagametophyte there is a large cavity in the basal end
of the megaspore where abundant lipids are stored (Robert,
1971). This suggests that lipid is the major source of
nutrition for the megagametophyte. Unlike the nutritional
difference between homosporous generations of high versus
low amounts of carbohydrate, there appears to be a more
distinct difference in Selaginella. Here the sporophyte
produces and uses carbohydrates while the gametophyte
utilizes lipids. This difference can be taken advantage of
to support or deny Lang's hypothesis. Can a heterosporous
7
gametophyte be experimentally manipulated to induce apogamy,
as has been done so successfully with homosporous
gametophytes, by supplemental nutrition?
Reasons for the neglect of the heterosporous plants, at
least in terms of the seed plants, may involve the
complexity of the relationship between the sporophyte and
the permanently retained and fully enclosed megagametophyte,
with respect to both physical constraint and nutritional
status of the various tissues involved. Response to
manipulation of environmental conditions in culture would
likely prove very difficult to interpret in terms of Lang's
hypothesis. Furthermore, the male gametophyte, or pollen,
of these higher heterosporous plants offers little available
tissue for cultural manipulation, although pollen callus
tissue and regenerated haploid sporophytes have been
obtained (Thomas and Davey, 1975).
The heterosporous lower vascular plants, e.g.
Selaginella, however, exhibit 2 free-living generations,
which may prove to be as useful for gaining an understanding
of the alternation of dissimilar generations as has been the
case with the homosporous plants. This work describes the
experimental culture of the megagametophyte of 1 species of
Selaginella on various types and concentrations of carbon
sources.

8
Selaginella was selected for several reasons over other
heterosporous lower vascular plants for several reasons.
One was the terrestrial habit of Selaginella and, therefore,
its easier propagation, maintenance and handling. A second
reason was the many megaspores that this plant produces
throughout the summer and fall. Thirdly, megagametophytes
of two other species of Selaginella have previously been
cultured successfully by Wetmore and Morel (1951). They
observed that supplemental carbohydrate (glucose) produced
megagametophytes twice as large as normal. The inclusion of
a mixture of B vitamins with glucose produced growth that
was continuous, giving rise to a callus-like mass of tissue
covered with rhizoids and archegonia. No additional
observations were provided by Wetmore and Morel (1951) on
growth of Selaginella megagametophytes, nor did they supply
any data or controls for their experiments. This present
investigation utilized a third species of Selaginella, and
extended the observations of Wetmore and Morel by providing
additional treatments consisting of a variety of carbon
sources in a range of concentrations, as well as control
treatments for interpretations of the results.

Chapter II
· MATERIALS AND METHODS
2.1 MEDIA PREPARATION
Twenty types of culture media were prepared in June,
1981. All types contained Knudson's mineral salts (see
Appendix A) and were solidified with 0.9% agar. Three
sugars, glucose (G), sucrose {S), and trehalose {T), were
utilized as the different carbohydrate substrates. Each
sugar was mixed in concentrations of 1, 3, and 5% (w/v). A
control treatment (K) without sugar was also prepared.
These 10 types of nutritional media were also prepared with
a mixture of B vitamins and growth factors (see Appendix A).
This vitamin mixture was also used by Wetmore and Morel
(1951). All chemicals were obtained from Sigma Chemical Co.
The mineral medium and agar was autoclave-sterilized.
All sugars and vitamins were filter-sterilized using a 0.22
micrometer Millipore filter, and were then added to the
cooled, sterile mineral medium. Media were then poured into
quartered Petri dishes, and the dishes were sealed with
strips of Parafilm and refrigerated.
9

10
2.2 COLLECTION AND INOCULATION OF MEGASPORES
Cuttings from one specimen of Selaginella martensii var.
albovariegata were propagated in the VPI & SU biology
greenhouse. Strobili were collected in late June, 1981, and
air-dried overnight on paper towel. Released megaspores
were collected by rolling them off the paper towel into a
washing device described by Webster (1978). The washer was
placed in a wire test-tube rack and lukewarm water was run
slowly through it for 20 min to wash out microspores. The
washer was immersed in distilled water 24 hrs to encourage
germination of fungal or bacterial spores. All subsequent
manipulations, including inoculation, were conducted in a
laminar-flow hood. The washer was immersed two min in a
freshly prepared solution of 25% Clorox bleach (v/v) in
distilled water, with one drop of Tween 80 per 200 ml, to
surface-sterilize the megaspores. The washer was rinsed
twice in sterile distilled water for 30 sec. After the
second rinse the megaspores were allowed to settle to one
end of the washer as the water drained. The plastic cap
containing the megaspores was removed and placed on the
stage of a Nikon binocular dissecting microscope. Using
fine forceps and sterile technique, megaspores were
inoculated individually and randomly onto Petri dishes
containing the various media over a period of several days.

11
Megaspores were visually selected for large size and lack of
apparent defects, as preliminary studies indicated these
were most likely to be viable. In the first several batches
of Petri dishes 2 megaspores were inoculated per quarter
dish, but this was changed to 3 megaspores per quarter in
later batches. This was done, along with the use of
quartered dishes, to prevent or slow the spread of any
bacterial or fungal contamination. After inoculation each
Petri dish was again sealed with a strip of Parafilm (which
effectively reduced water loss from the agar medium).
Dishes were labeled and placed in a reach-in growth chamber,
where they were maintained for the duration of the
experiment.
Since the sporophyte photosynthesizes, and the
megagametophyte seems not to, consideration was given to the
possibility that a reversion to sporophytic growth might
hinge on the presence of a lighted environment. Bierhorst
(1971) observed, and Webster (1967) showed, that zygotes
remain dormant within megagametophytes until given adequate
light, and only then will they grow and develop fully into
sporophytes. Light (230 microeinsteins m- 2 sec- 1
photosynthetically active radiation - determined with a
Li-Cor, Inc. photometer) was provided by cool fluorescent
and incandescent bulbs on a 12 hr light-dark cycle.

12
Temperature was maintained at 27° and 25° C during the light
and dark periods, respectively.
2.3 DATA COLLECTION
Megaspores were observed daily for 2 wk after
inoculation, then twice a week. Germination was considered
complete if the trilete suture showed any indication of
having opened. Megaspores that were contaminated with
either bacteria or fungi before germination were discarded.
Megaspores that became contaminated after germination,
though not included in growth analyses, were included in the
analysis of percent germination.
A data sheet for each germinated megaspore recorded the
dates of inoculation and germination, and camera lucida
drawings of that megagametophyte at 2 wk intervals through
the twelfth wk after germination. The drawings were made
with a Wild MSA binocular dissecting microscope and camera
lucida attachment. Megagametophytes were also occasionally
photographed using a Wild Photoautomat MPSSS attachment.
Average number of days to germinate was calculated and
compared among the different treatments. Since sample sizes
differed between treatments, Duncan's Multiple Range Test
was used to determine statistical significance at the 0.10
and 0.05 levels. Though the number of days to germinate
13
varied among megaspores within and between treatments, each
megagametophyte was observed 12 wk from the day of its own
germination.
Percent germinations were calculated by dividing the
number of germinated megaspores by the number of
uncontaminated megaspores inoculated, and were analyzed for
significant differences using a Chi-square Test of Fitness
at the 0.05 level.
Length/width measurements of megagametophytes were
calculated from the camera lucida drawings. Average radius
measurements were determined for each megagametophyte for
each 2 wk period after germination. Volume of tissue was
selected as a measure of differences in growth on the
various treatments, since cubing the size measurements
accentuated measured differences. Since most
megagametophytes were spheroidal, the geometric conversion,
V = 4/3 Pix radius 3 , was utilized. Average volume within
each 2 wk period was calculated for each treatment, and
these values were graphed. Average final volumes for all
treatments were analyzed statistically with Duncan's
Multiple Range Test at 0.10 and 0.05 levels.

14
2.4 ADDITIONAL NUTRITIONAL TREATMENTS
2.4.1 Sorbitol as an Osmotic Control
In December, 1981, six months after the initiation of the
experiment, the importance of determining whether osmotic
differences between the various concentrations of sugars
could produce any of the observed responses became apparent.
Sorbitol was selected as an osmotic agent rather than
mannitol, which is also often used for this purpose
(Whittier, 1975). Media containing 1, 3, and 5% sorbitol
(Sb) with B vitamins were prepared in a similar manner as
all previous media types, though in this case the sorbitol
was autoclaved with the mineral salts solution. Sorbitol
was obtained from Fisher Scientific Co. The B vitamin
mixture, which generally enhanced growth, was also included
in these treatments to facilitate germination, and possibly
enhance potential differences between the three
concentrations of sorbitol. A fourth treatment, 3% glucose
with B vitamins, was run as a control to the sorbitol
treatments. Response to this control treatment was compared
to the earlier results on this medium, since there was
concern that megaspores collected in December might respond
differently from those collected in July.

15
2.4.2 Repeat of Trehalose Treatments
A second set of trehalose treatments was prepared and
megaspores inoculated in March, 1982. Media containing 1,
3, and 5% trehalose were prepared in an identical manner as
before. Due to the lack of available growth chamber
facilities at that time, however, Petri dishes were
maintained on a laboratory benchtop. The amount of
photosynthetically active radiation reaching the dishes at
mid-day was 63 microeinsteins m-2 sec-1 • A control
treatment of K medium was run concurrently with the
trehalose treatments. Germination percentage, average
number of days to germinate, and average final volume were
analyzed and compared to the first trehalose treatments.
2.5 CORRELATION ANALYSIS
Percent germination versus final volume, number of days
to 50% germination versus final volume, and percent
germination versus number of days to 50% germination were
analyzed using a linear regression analysis to determine the
degrees of correlation between these responses.

16
2.6 DETERMINING THE PRESENCE OF CHLOROPHYLL
Megagametophytes were examined for any indication of
apogamy. There was a possibility that some component of
sporophyte growth had been induced, which might be measured
by chlorophyll production. While it is generally considered
(Bierhorst, 1971; Foster and Gifford, 1974) that
megagametophytes of Selaginella do not contain chlorophyll,
a study was undertaken to detect chlorophyll-a by extracting
pigments and analyzing by the sensitive fluorescence
technique. Several megagametophytes from each of the
majority of treatments were selected immediately after their
last volume measurements. Megagametophytes within each
treatment were pooled, and extracted in 2.5 ml spectral
grade dimethyl-sulfoxide (DMSO) in glass vials for 18 hrs in
the dark at room temperature. Sections of sporophyte stem,
of the same plants from which the megaspores were collected,
were also extracted to compare the relative amounts of
chlorophyll-a present in megagametophytes. An equal volume
of 90% spectral grade acetone was added to the vials.
Extract solutions were centrifuged for 5 min at 600 x G, and
decanted into fluorometer cuvettes. Fluorescence
measurements were taken for each extract using a Turner
Designs fluorometer. Each extract was acidified with two
drops 50% HCl, mixed and, after 5 min, a second fluorescence

17
reading was taken. A decrease in fluorescence after
acidification, beyond the immediate effect of slight
dilution (accounted for in blank readings), was attributed
to conversion of chlorophyll-a to pheophytin, indicating the
presence of chlorophyll. Blank solutions were measured
before and after acidification, and these background
readings were subtracted from the actual extract readings.
Remaining values of fluorescence, attributable to
chlorophyll-a, were divided by the volume of tissue
extracted in each treatment. Measurements of fluorescence
per mm 3 of tissue were correlated to actual amounts of
chlorophyll-a. These readings were used to construct a
linear regression equation to convert readings from
megagametophyte extracts to actual concentrations of
chlorophyll-a (see Appendix D for all data). The
chlorophyll-a used in producing the linear equation was
obtained from Sigma Chemical Co.
2.7 CELL SIZE ANALYSIS
Megagametophytes cultured on K medium, and 1, 3, and 5%
sorbitol with B vitamins were selected for observation and
analysis of cell size. Megagametophytes that were large
enough to remove the megaspore wall were selected after
their last volume measurements, since this wall was an

18
impediment to adequate infiltration of plastic resins. They
were fixed in 2.5% glutaraldehyde for 2 hrs at room
temperature, washed three times for 90 min in phosphate
buffer (pH 7.4), taken through an ethanol dehydration series
of 50, 60, 70, 80, 90, 95, 100, 100, and 100% (30 min each
step), and through a propylene oxide (po) series of 25, 50,
75, and 100% (30 min each step). Liquid Spurr's resin was
added slowly over a period of 4 days. Through the removal
of po/resin, and the addition of fresh resin, the
concentration was gradually increased to 100%. After 24 hrs
in 100% Spurr's resin, megagametophytes were flat-imbedded,
since a consistent plane of sectioning was considered
important. The resin was polymerized for 24 hrs at 60° C.
The megagametophytes were cut out in plastic blocks using a
jeweler's saw, and were mounted on dummy blocks so that
sectioning of the tissue was from proximal to distal poles.
Tissues often did not dehydrate sufficiently or infiltrate
well enough, and this difficulty appeared due to the
barriers of the megaspore wall, and a layer of mucous
surrounding the tissues that slowed the penetration of
fixatives, dehydrants, and resin. Megagametophytes that had
not grown much beyond the megaspore wall were the most
difficult to prepare. Robert (1971) had similar problems
with his material, and also recognized the mucous layer as a

19
potential culprit. When possible he dissected the megaspore
wall away from the living tissue, and this improved his
results. In this work it was found that, by replacing an
acetone dehydration series with both an ethanol and a
propylene oxide series, results were much improved.
Increasing the concentration of Spurr's resin slowly and
gradually was also effective in producing better
infiltration.
Since it was only necessary to observe cell walls in the
analysis of cell size, megagametophytes that had been
extracted in DMSO for fluorescence analysis also provided
adequate material for sectioning and analysis. After the
fluorescence analysis was completed, DMSO-extracted
megagametophytes were taken into 100% acetone, and Spurr's
resin was added slowly over a period of four days up to 100%
concentration. These megagametophytes infiltrated more
readily than live tissues, possibly due to the dissipation
of the mucous layer. From this point the DMSO-extracted
megagametophytes were handled in the same way as the
previous group.
Megagametophytes were sectioned at 1.5 micrometers, using
a Sorvall ultra-microtome and a glass knife. Sections were
mounted on glass slides, stained with one percent toluidine
blue 0 (Berwyn and Miksche, 1976) for five min on a
20
slide-warming tray, rinsed, dried, covered with mounting
medium and a glass coverslip, and examined under a compound
microscope.
A specific area of the megagametophyte was examined which
was mid-way between the large cells forming on the periphery
of the lipid reserve, and the much smaller cells associated
with the reproductive tissue at top. Using a Leitz compound
microscope with a camera lucida attachment, the cell walls
in this area were outlined in pencil to fill in a pre-drawn
square on paper. A stage micrometer was used in conjunction
with the camera lucida attachment to determine the
microscopic area covered by the square on the paper. The
number of cells that occupied this area was determined for
each megagametophyte, and an average number of cells per mm 2
was determined for each treatment. The average
cross-sectional area per cell (mm 2 ) was determined for each
treatment.
2.8 CELLULAR ORGANIZATION OF SELECTED MEGAGAMETOPHYTES
Megagametophytes sectioned for cell size analysis were
also examined for general appearance of cells, presence and
locations of archegonia, the status of the lipid reserve,
and sites of cell divisions. Sections were photographed
using a Leitz Wetzlar compound microscope with a Nikon

21
camera (Model M-35S) and a Nikon automatic photomicrographic
attachment.

Chapter III
RESULTS
Apogamy was not induced in these experiments. The
effects of the various nutritional treatments on
megagametophyte growth and development evidenced themselves
in varying rates and percentages of germination, final
volume of tissue, and varying levels of chlorophyll-a.
3.1 NUMBER OF DAYS TO GERMINATION
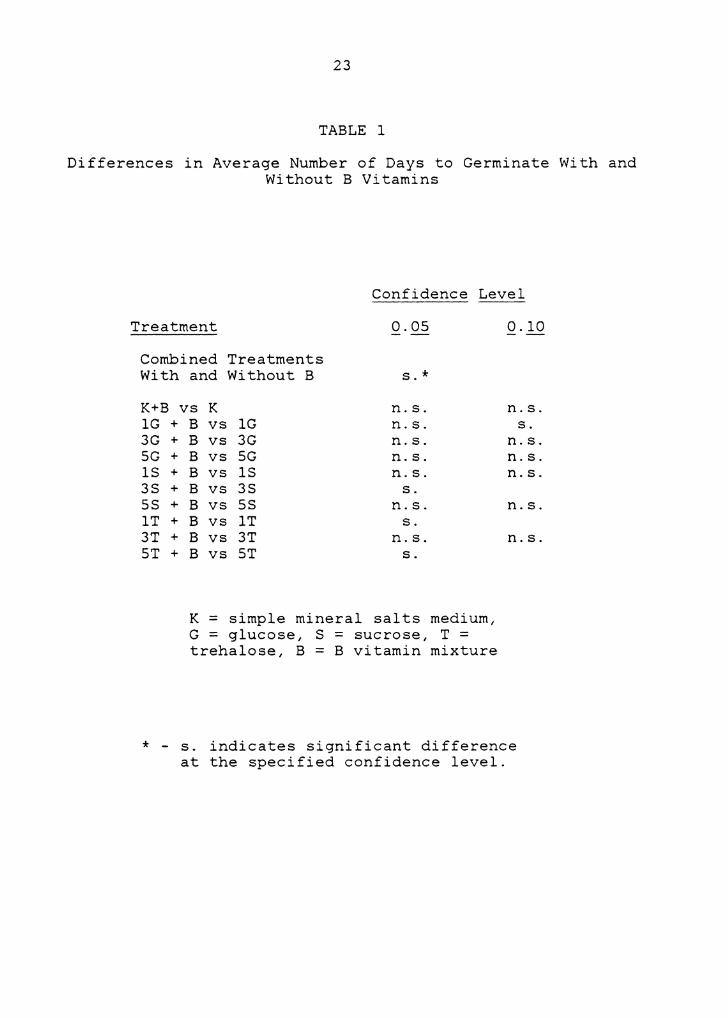
Addition of B vitamins increased the speed of germination
for all treatments (see Appendix B for all data). This
increase was significant at the 0.05 confidence level for
all combined treatments with and without B vitamins, though
within the individual treatments the difference was not
always significant (Table 1).
Of the average number of days to germinate, among
treatments without B vitamins, there was a range of
responses from 10.0 days (3T) to 34.7 (ST). However, at the
O.OS confidence level there were no significant differences
between any treatments, and at the 0.10 confidence level
only treatments with the four most rapid responses (3T, lS,
SG, lG) were significantly different from the slowest
treatment (ST) (Figure 1). Only one megaspore germinated on
22
23
TABLE 1
Differences in Average Number of Days to Germinate With and Without B Vitamins
Confidence Level
Treatment o.os Combined Treatments With
K+B lG + 3G + SG + lS + 3S + SS + lT + 3T + ST +
and Without B s. * vs K n.s.
B vs lG n.s. B vs 3G n.s. B vs SG n. s. B vs lS n.s. B vs 3S s. B vs SS n.s. B vs lT s. B vs 3T n.s. B vs ST s.
K = simple mineral salts medium, G = glucose, S = sucrose, T = trehalose, B = B vitamin mixture
0.10
n. s. s.
n. s. n. s. n.s.
n. s.
n. s.
* - s. indicates significant difference at the specified confidence level.

24
3T and, due to the low sample size, this treatment could not
be seriously compared with the others.
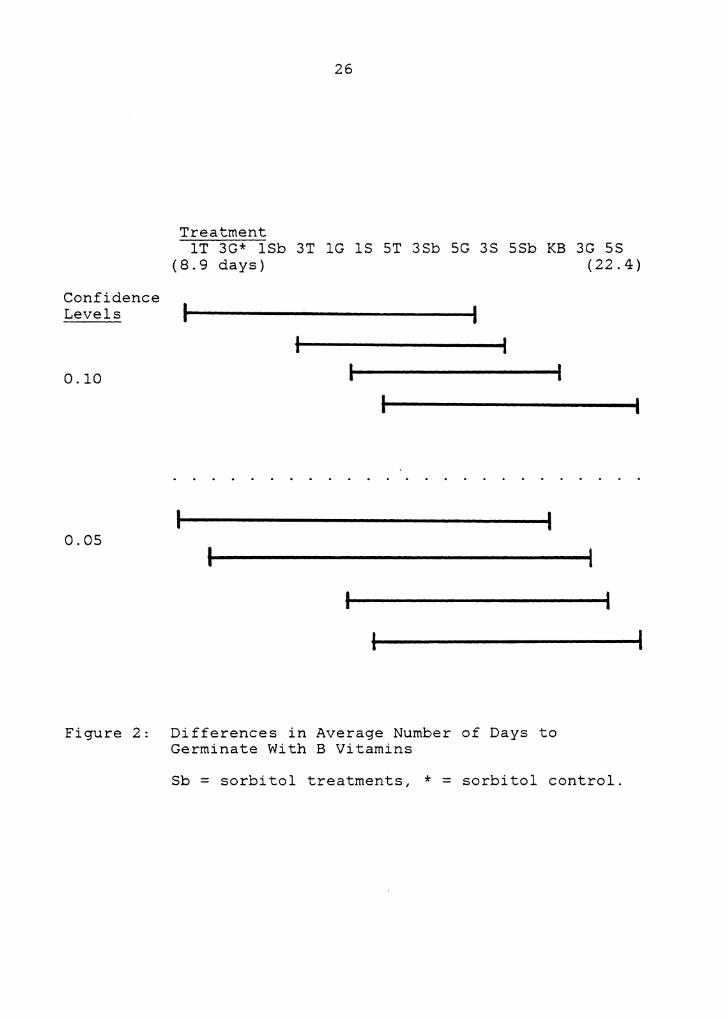
With B vitamins there was a smaller range for the average
number of days to germinate, from 8.9 days (lT) to 22.4
(SS). There were several significant groupings at both the
0.10 and 0.05 confidence intervals, but there were also many
overlaps between them (Figure 2).
Treatments without B vitamins tended to have greater
variation in average number of days to germinate than
treatments with B vitamins (Figure 3), i.e., germinations
were more spread out over time. Figures 4 - 10 contrast the
slower, unclustered germinations without B vitamins with the
faster, more clustered germinations with B vitamins. Though
the average number of days to germinate on K medium with and
without B vitamins were not significantly different from
each other (Figure 4), all other treatments clearly
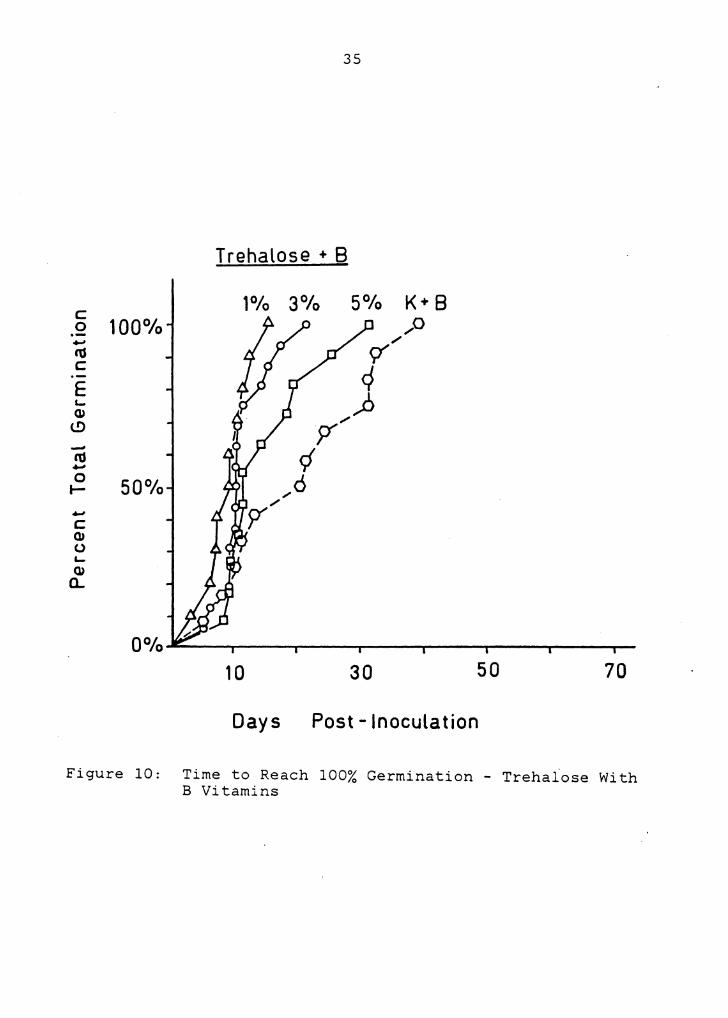
exhibited this distinct pattern.
There were no indications among treatments without B
vitamins that responses were slower with increasing sugar
concentrations. Among treatments with B vitamins, however,
both sucrose and trehalose tended to exhibit patterns of
slower germination with increasing concentration (Figure 2).
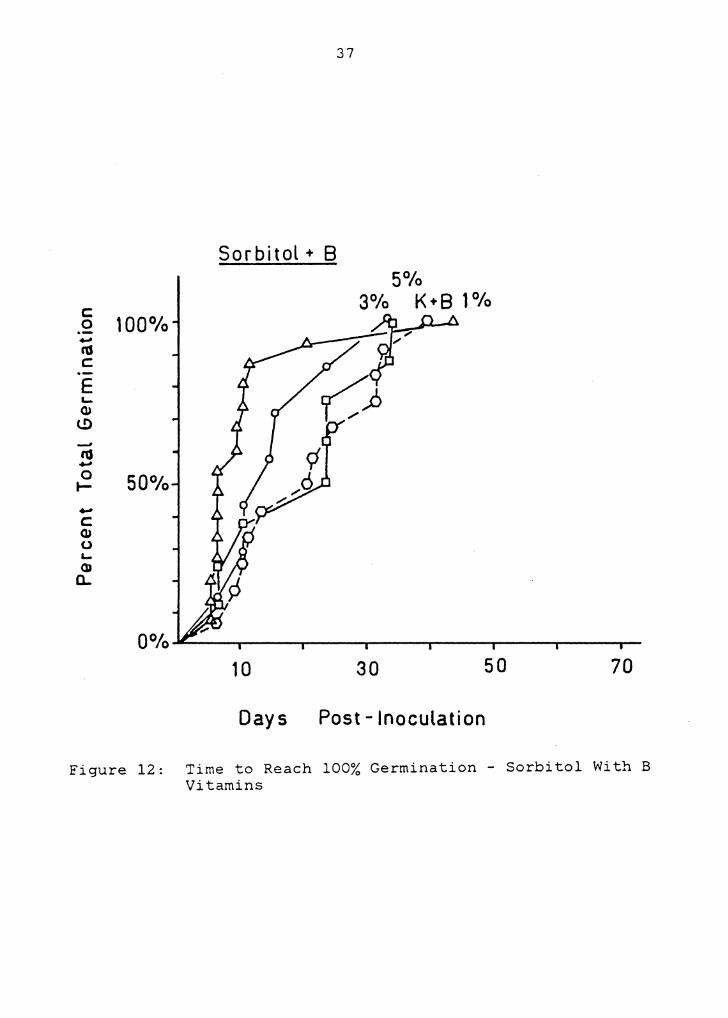
The sorbitol (Sb) control treatment, 3% G with B
vitamins, germinated significantly faster than the first 3%

Confidence Levels
0.10
0.05
Treatment 3T lS SG
(10.0 days)
2S
lG lT 3G K SS 3S ST (34.7)
Figure 1: Differences in Average Number of Days to Germinate Without B Vitamins at 2 Confidence Intervals
Treatments sharing a common line are not significantly different at the specified .confidence level.
Confidence Levels
0.10
0.05
26
Treatment lT 3G* lSb 3T lG 15 ST 3Sb SG 3S SSb KB 3G SS
(8.9 days) (22.4)
Figure 2: Differences in Average Number of Days to Germinate With B Vitamins
Sb = sorbitol treatments, * = sorbitol control.

27
1---<>----i lT
• 3T lSb
~ 3T I 0 I lC
I 0 I lS I 0
I 0
5T 3Sb
5C lS
I 0 .-~.......,>-~--11 JS I • t--~-.~~~t 5C
5Sb lG
K
JC 55
lT K
55 JG
35 5T
0 10 20 30 40 50
Average Number of Days to Germinate
Figure 3: Average Number of Days to Germinate ±1 Standard Deviation •= without B vitamins, O= with B vitamins. .

28
Control
+B -8 100°10
c 0 -m c ·-E '-Q)
l!> -ro 50°10 -~ -c Q) 0 '-Q)
Cl..
10 30 50 70
Days Post - Inoculation
Figure 4: Time to Reach 100% Germination - Control (Knudson's Medium With and Without B Vitamins)
Each point on the graph represents one germinated megaspore.

29
G with B vitamin treatment (Figures 2 and 11) at the .05
confidence level. This suggests that megaspores collected
in December were not responding the same as those collected
in June. The sorbitol treatments were included in Figure 2,
though, and statistically there were few differences between
them and other treatments with B vitamins. As with the
sugar and B vitamin treatments, germinations were relatively
rapid, and tightly clustered in time. This was particularly
evident on 1% Sb with B vitamins (Figure 12). Sorbitol
treatments also exhibited slower germinations with
increasing concentration (Figure 2).

30
Glucose
3°/o 100°/o
c .2 -nJ .s E .... Q)
(.!) __. s 50°/o ~ -c Q) 0 .... Q)
Cl..
00/o 10 30 50 70
Days Post - Inoculation
Figure 5: Time to Reach 100% Germination - Glucose

31
Glucose+ B
3°10 c
100°10 0 -"' c E I L.. .,,6 Cl>
(.!) .....
p' - I
"' <! -0 50°10 ,,J!J I- ,, -c Q) 0 L.. Q)
Cl.
10 30 50 70
Days Post - Inoculation
Figure 6: Time to Reach 100% Germination - Glucose With B Vitamins

c 0 100°10 -"' c ·-E .... QJ
<.!) -"' -:;!. . 50°10 -c QJ u .... QJ
CL
32
Sucrose
1°10 3°/o K 5°/o
10 30 50
Days ·Post- Inoculation
Figure 7: Time to Reach 100% Germination - Sucrose
70

c 1 QQ 0/o 0 -"' c E L-Cl1 ~ ~
nJ -0 50°/o t--c Cl1 0 "-Cl1
Q..
33
Sucrose + B
10
Days
1°/o 3 °/o K + 8 5 °/o p
<f/ ,____9
,D
9 ,,,o
O'"' I
.,,
30 50
Post - Inoculation
70
Figure 8: Time to Reach 100% Germination - Sucrose With B Vitamins

c 0 100°/o
-cu -:=. 50°/o -c cu u L.. cu a..
Trehalose
3°/o 0
10
34
30 50
Days Post - Inoculation
5 °/o
1
70
Figure 9: Time to Reach 100% Germination - Trehalose
1°/o
c 0 ~
tU c E '-Q)
<.!> -J
tU ~
0 r-~
c Q) 0 '-Q)
a..
35
Trehalose + B
1°10 3°10 5°10 K+B 100°/o ,,o
/
<7 9
)J ..,,,.
7 <:/
50°10 ,..d ..,,,.
7
~
001o~~~---~~..--~---..--~---.~~-,.~~--r~~--r-
10 30 50 70
Days Post - Inoculation
Figure 10: Time to Reach 100% Germination - Trehalose With B Vitamins

c 0 100°/o .... td c E ._ Q)
l!> -td -:=. 50°10 -c Q) 0 ._ Q) a.
36
3°10 Glucose + 8 o July • December
10 30 50 70
Days Post - Inoculation
Figure 11: Time to Reach 100% Germination - 3% Glucose With B Vitamins (1st and 2nd Experiments)
c: 0 100°10 -"' c E L. Q)
(.!) __,
"' -:::. 50°10 -c Q) 0 L. CJ> a.
37
Sorbitol + B
10 30 50 70
Days Post - Inoculation
Figure 12: Time to Reach 100% Germination - Sorbitol With B Vitamins

38
3.2 PERCENT GERMINATION
In all cases % germination was higher on sugar treatments
when B vitamins were included (Figure 13, Table 2-b) (see
Appendix C for all data). Statistically, though,
differences were not significant on several sugar treatments
(lG, SS, lT, ST) (Table 2-a).
Without B vitamins % germination for all glucose was
significantly higher than for sucrose, though neither were
significantly different from trehalose (Table 2-e).
Comparisons of concentrations of each sugar type producing
the highest% germination (lT, lG, SS) indicated that there
were no significant differences between them (Table 2-f).
Without B vitamins only 1 and 3% glucose, and 1% trehalose,
enhanced % germination significantly above that on K medium
(Table 2-c). Germination without B vitamins was lowest on
3% trehalose and sucrose, though these were not
significantly lower than on K medium (Table 2-c).
As with speed of germination, the addition of B vitamins
produced the most marked enhancement of % germination.
Significant enhancement occurred on K medium and several
sugar treatments with B vitamins (Table 2-a). Within the
treatments with B vitamins, sugars that produced
enhancements of % germination significantly higher than K
medium with B vitamins included 1 and S% percent glucose,
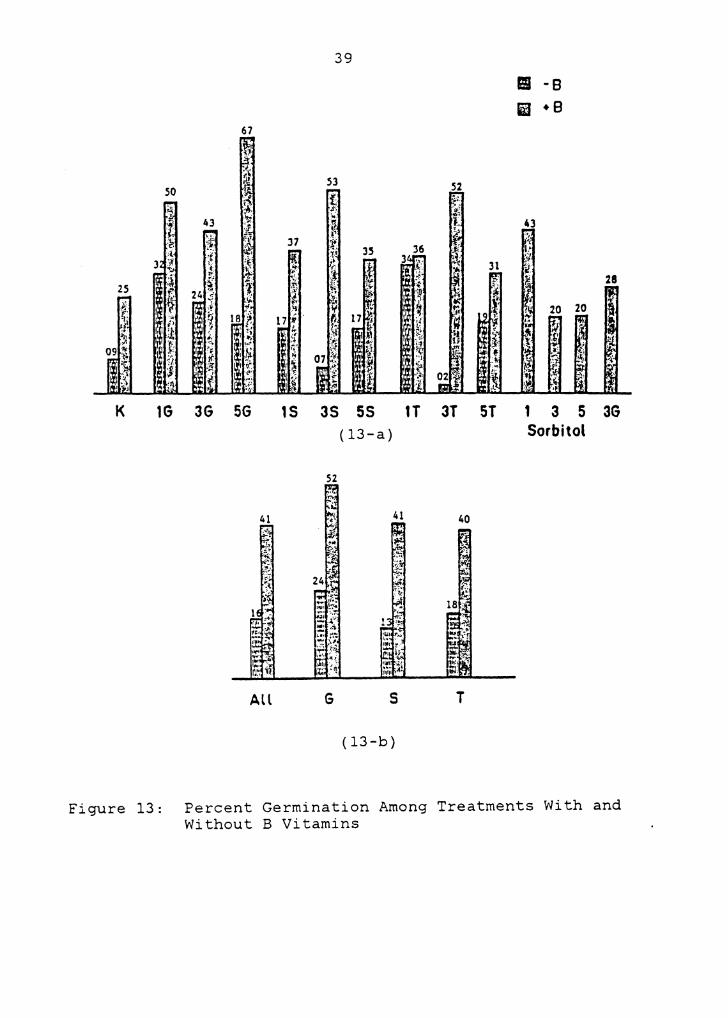
K
Figure 13:
67
37
3G SG 1S
All
39
3S SS (13-a)
52
1T 3T
41 40
G s T
(13-b)
ST
II -B i1 + 8
1 3 5 3G Sorbitol
Percent Germination Among Treatments With and Without B Vitamins

40
TABLE 2
Differences in % Germination Among All Treatments at the O.OS Confidence Level
a) Individual Sugar Treatments
K+B >* K 3S+B > 3S lG+B = lG SS+B = SS 3G+B > 3G lT+B = lT SG+B > SG 3T+B > 3T lS+B > lS ST+B = ST
c) !5: vs Sugars
K < lG = SS < 3G < lT = SG = 3T = lS = ST = 3S
e)Total Sugars
G > S G = T S = T
b)Combined ~ vs Non-B
All +B > All Non-B
G+B > G S+B > s T+B > T
d)K+B vs Sugars With
K+B < lG+B = = 3G+B = < SG+B < = lS+B = < 3S+B
f )Highest Percent Germination on Each Sugar
lT = lG = SS
* = indicates a significantly higher % germination at the O.OS confidence level.
B
SS+B lT+B 3T+B ST+B

Table 2 (cont'd)
g)Total Sugars With B
G+B = S+B = T+B
i)Sorbitol With B and Control vs
Sugars with~
3G+B (1st) = 3G+B (2nd)
G+B > Sb+B S+B > Sb+B T+B > Sb+B
41
h)Highest Percent Germination on Each Sugar With ~ Vitamins
SG+B = 3S+B = = 3T+B
j)Highest Percent Germination on Sorbitol With B
and Sugars With~
SG = lSb 3S = lSb 3T = lSb

42
and 3% percent sucrose and trehalose (Table 2-d). The
highest_% germination occurred on 5% glucose with B
vitamins, and the most remarkable enhancements occurred with
the addition of B vitamins to 3% trehalose and sucrose
(Figure 13). The total combined% germination for each of
the three sugars with B vitamins were not significantly
different from each other (Table 2-g), nor were there
significant differences between concentrations of sugar
types with B vitamins exhibiting the highest % germinations
(SG+B, 3S+B, 3T+B) (Table 2-h).
Percent germination of the control for "the sorbitol
treatments, 3% glucose with B vitamins, was not
significantly different from the original treatment of this
type (Table 2-i). Therefore, a comparison of% germination
between the sorbitol treatments and the other treatments
with B vitamins could be made. Total % germinations for
glucose, sucrose, and trehalose with B vitamins were
significantly higher than for the sorbitol treatments (Table
2-i). Comparison between concentrations of sorbitol and
sugars with B vitamins exhibiting the highest % germinations
indicated that these differences were not significant (Table
2-j).
43
3.3 DIFFERENCES IN FINAL VOLUME
Average final volume for all treatments with B vitamins
(13.2 x 10⁻² mm 3 ) was significantly higher than for those
without B vitamins (5.4) at the 0.05 confidence level (see
Appendix B for all data). All treatments with B vitamins
achieved greater final volumes than corresponding treatments
without B vitamins, though these differences were not all
significant (Table 3) (see Figure 52 a-e for examples of
megagametophytes exhibiting normal and enhanced growth).
Notably, the addition of B vitamins to all three
concentrations of sucrose produced significant growth
enhancement at the 0.05 confidence level.
Without B vitamins, final volume ranged from 2.32 x 10⁻²
mm 3 (3T) to 9.87 (lT). At the 0.05 confidence level 1%
trehalose produced a significantly higher final volume than
any of the other treatments (Figure 14). Megagametophytes
cultured on l, 3, and 5% sucrose and 3 and 5% trehalose,
tended to achieve smaller final volumes than those on K
medium, though these differences were not significant
(Figure 14). All three glucose treatments tended to produce
megagametophytes with greater final volumes than those grown
on K medium, although these differences were also not
significant.

44
TABLE 3
Differences in Average Final Volume With and Without B Vitamins
Confidence
Treatment 0.05
Total +B vs -B s. * KB vs K n.s. BlG vs lG s. B3G vs 3G n.s. BSG vs SG n.s. BlS vs lS s. B3S vs 3S s. BSS vs SS s. BlT vs lT n.s. B3T vs 3T n.s. BST vs ST s.
* s. indicates significant difference at the specified confidence level.
Level
0.10
n.s.
n.s. n.s.
n.s. n.s.

Treatment 3T SS 3S ST
( 2 . 3 2 x 10 - 2 mm 3 )
4S
lS K 3G lG SG lT (9.87)
Confidence Level
0.10
o.os
I
Figure 14: Differences in Final Volume for Treatments Without B Vitamins
Treatments sharing a common line are not significantly different at the specified confidence level.
'

46
Among treatments with B vitamins, average final volume
had a wider range than among those without B vitamins; from
4.86 x 20~2 mm 3 (K+B) to 20.04 (5G+B). There were
significant differences between several groups of treatments
with B vitamins, though there was much overlap between them
(Figure 15). At the 0.05 confidence level, average final
volumes on 1 and 5% glucose with B vitamins, and 1 and 3%
trehalose with B vitamins were significantly higher than on
K+B.
Volume increases for each treatment through the 12 wk
growth period are presented in graphs and camera lucida
drawings in Figures 16 through 46.
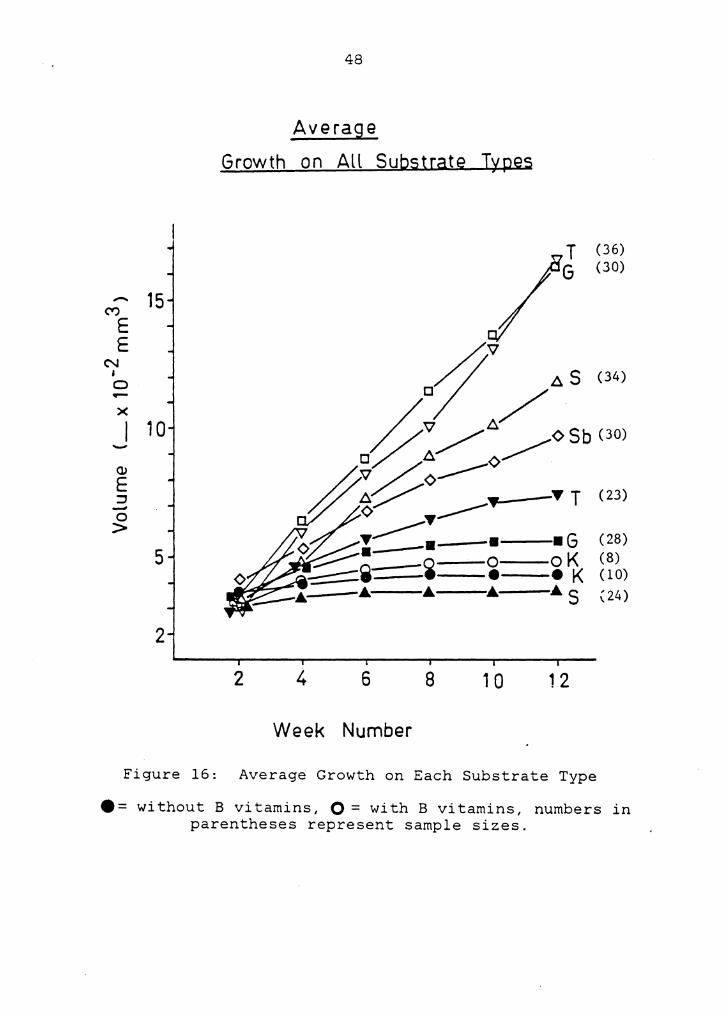
Figure 16 presents the average growth for each substrate
type, which was greatest on trehalose and glucose with B
vitamins. Sucrose and sorbitol with B vitamins produced
megagametophytes of lesser volume. Average final volumes on
K medium with and without B vitamins were not sigficantly
different; both treatments produced little enhancement. As
with germination rates, the addition of B vitamins produced
significant enhancement only in conjunction with sugars.
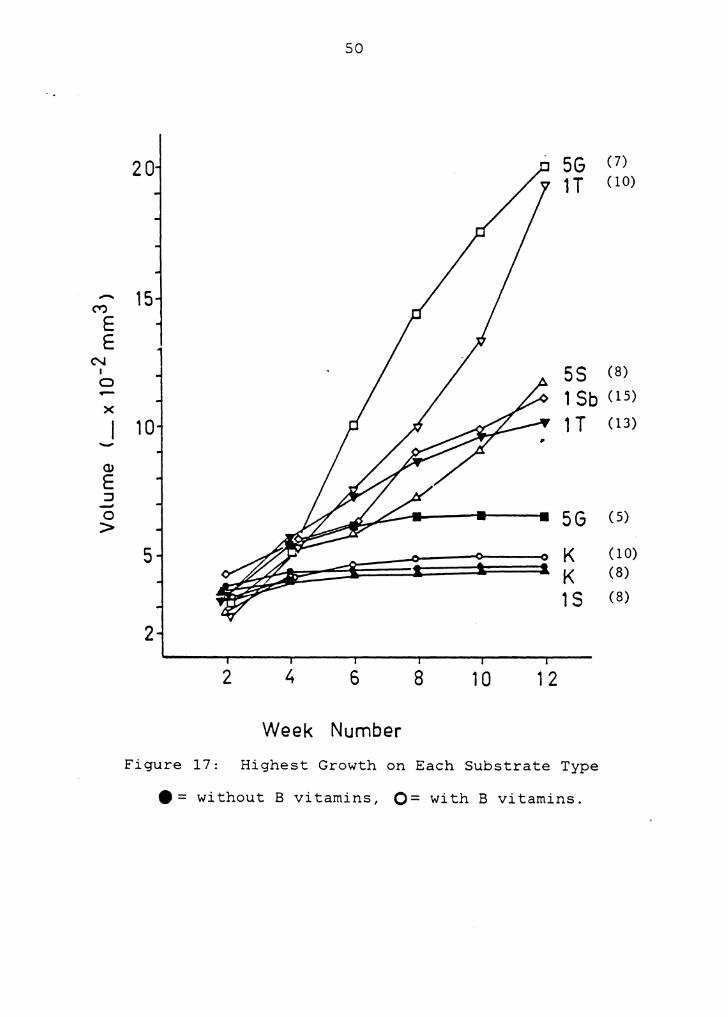
Figure 17 presents growth of megagametophytes on the
concentration of each substrate that had the greatest
effect. Notably, 1% trehalose without B vitamins produced
enhanced growth comparable to 5% sucrose and 1% sorbitol

47
Treatment KB SSb 3Sb 3S lSb 3G lS 3G lS SS ST 3G* lG 3T lT SG
(4.86 x 10~ mm 3 ) (20.04)
Confidence Level
0.10
o.os
Figure lS: Differences in Final Volume for Treatments With B Vitamins
* = sorbitol control.
48
Average
Growth on All Substrate Types
T (36)
G (30)
- 15 M E E Iv ~s N • (34) 0 - a/ x
~:/~~<>Sb CJol I 10 -OJ ~<>--<> E
~;~:--: -•T (23) ::1 -0 > •G (28) 5 oK (8)
~i -~ ~ •K ( 10) ... & • •s (24)
2
2 4 6 8 10 12
Week Number
Figure 16: Average Growth on Each Substrate Type
•= without B vitamins, O = with B vitamins, numbers in parentheses represent sample sizes.

49
with B vitamins. Maximum growth response on glucose was
slightly greater than on K medium, and the maximum volume
achieved on sucrose was slightly below that of K medium.
-M E E
N I 0 -x
-°' E :J -0 >
50
20
15
10
5
2
2 4 6
Week Number
8 10 12
5G en 1 T oo>
55 (8)
1 Sb 0 5> 1 T 03)
5G C5>
K c10) K (8)
1 s (8)
Figure 17: Highest Growth on Each Substrate Type
e = without B vitamins, O= with B vitamins.
51
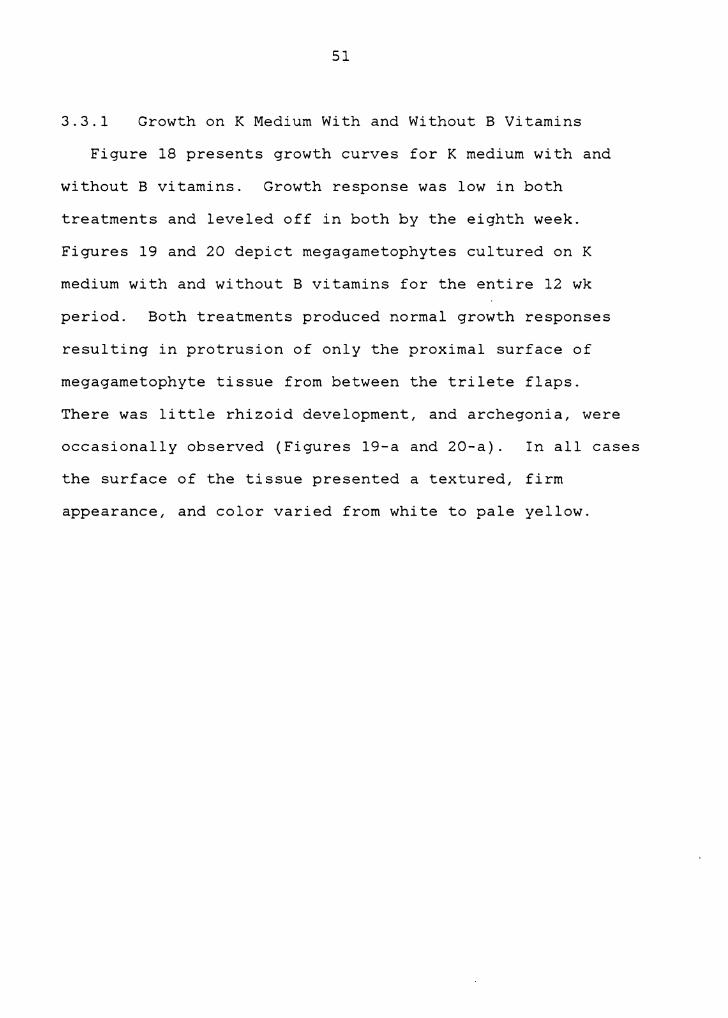
3.3.1 Growth on K Medium With and Without B Vitamins
Figure 18 presents growth curves for K medium with and
without B vitamins. Growth response was low in both
treatments and leveled off in both by the eighth week.
Figures 19 and 20 depict megagametophytes cultured on K
medium with and without B vitamins for the entire 12 wk
period. Both treatments produced normal growth responses
resulting in protrusion of only the proximal surface of
megagametophyte tissue from between the trilete flaps.
There was little rhizoid development, and archegonia, were
occasionally observed (Figures 19-a and 20-a). In all cases
the surface of the tissue presented a textured, firm
appearance, and color varied from white to pale yellow.

52
Control
-("')
E 6 E N
I 0 -x 5 0 +8 I ____...-o 0 (10)
- ,/ JJ ~ V' -8 (8) ~-
OJ 4 :/~ E
::J -~ 0
3
2 4 6 8 10 12
Week Number
Figure 18: Growth on K Medium With and Without B Vitamins

53
Figure 19: Response of Megagametophytes Grown on K Medium
a= K(3)IIin* , b = K(lO)Iin, c = K(7)IIIout,scale bar= 0.5 mm. Drawings were made at 2 wk intervals from germination.
* - notation designates a specific megagametophyte. See Appendix B.
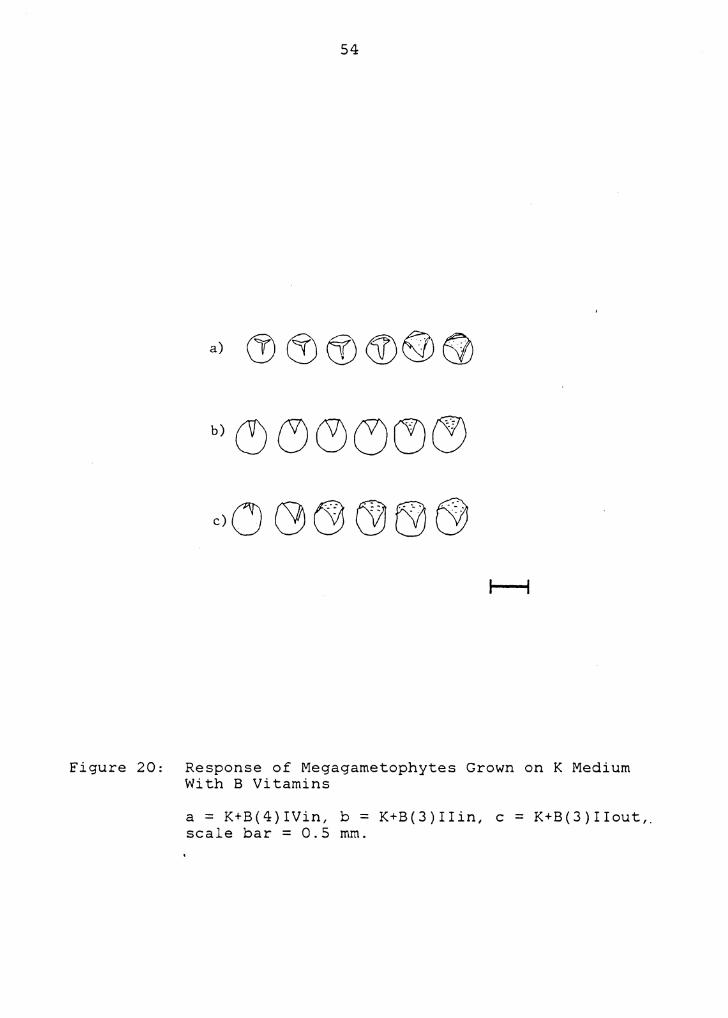
54
Figure 20: Response of Megagametophytes Grown on K Medium With B Vitamins
a= K+B(4)IVin, b = K+B(3)IIin, c = K+B(3)IIout,. scale bar = 0.5 mm.

55
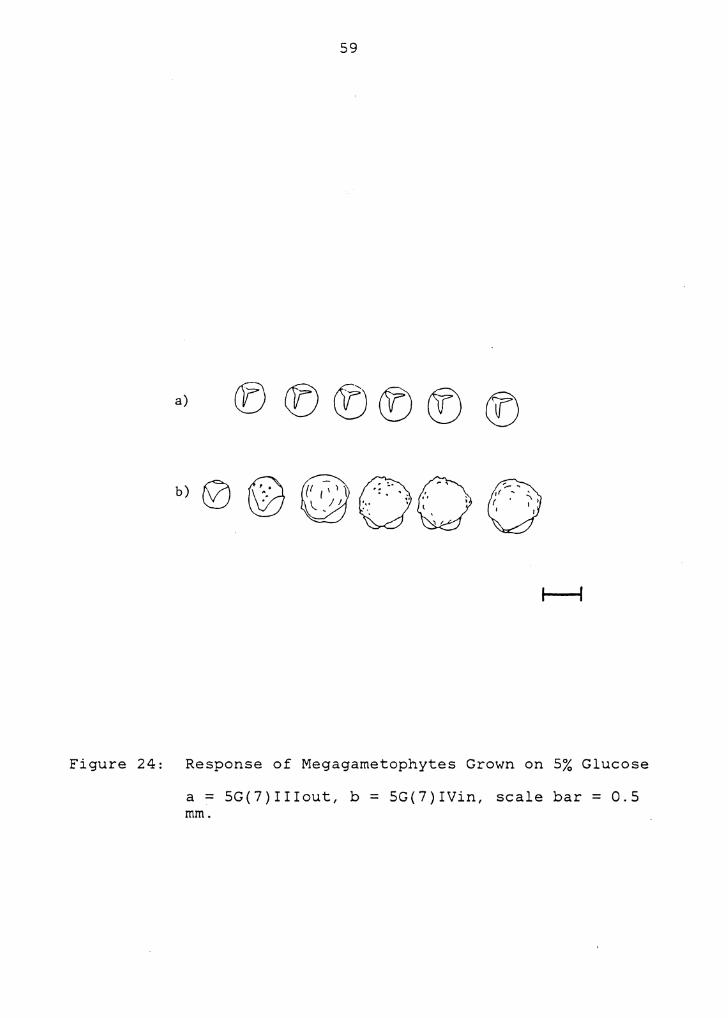
3.3.2 Growth on Glucose With and Without B Vitamins
Figure 21 presents growth on glucose as compared to K
medium, and though average final volume was not
significantly different between any of these treatments,
there was a tendency for 1 and 5% percent glucose to enhance
growth over either K medium or 3% glucose. Growth leveled
off by the tenth week for all concentrations of glucose.
Figures 22 - 24 depict a range of responses to glucose.
There was definite enhancement of growth in comparison to
that on K medium. Several megagametophytes grew entirely
out of their megaspore walls, and spherical, callus-like
masses of tissue developed, which frequently exhibited rough
textures with fissures and folds. Color of the tissue, as
.on K medium, ranged from white to pale yellow, and there was
only slight rhizoid development. One of the
megagametophytes (Figure 22-c) grown on 1% percent glucose
was covered with archegonia from the tenth week on.
Figure 25 displays the greatly enhanced growth that
occurred on glucose with B vitamins in comparison to K+B
medium. Average final volumes on the three concentrations
of glucose with B vitamins were not significantly different
from each other, though 1 and 5% glucose with B vitamins
were significantly greater than on K+B medium (Figure 15).
Unlike glucose without B vitamins, growth did not level off

56
Glucose
-C") 10 E E
N I 0 -x I -
°' E :::i -g.
2 6 8 10 12
Week Number
Figure 21: Growth on Glucose

57
a)
b) 0 @•.t.: ., Q <:jj··.. ~\ C;J-·\ "'• I '" ) ....... l ' '' f~ ... • "'- • ' I •,,•,:~ ' '- - I I • t I
Figure 22: Response of Megagametophytes Grown on 1% Glucose
a = 1G(3)Iin, b = lG(2)IVout, c = lG(6)IIin, scale bar = 0.5 mm.

58
Figure 23: Response of Megagametophytes Grown on 3% Glucose
a = 3G(2)IVout, b = 3G(lO)Iout, scale bar = 0.5 mm.
59
a) ® ([) ®® ® ®
b) 0 ©
Figure 24: Response of Megagametophytes Grown on 5% Glucose
a= SG(7)IIIout, b = SG(7)IVin, scale bar= 0.5 mm.

60
on any of the glucose treatments with B vitamins. Figures
26 - 28 depict the greatly enhanced growth that occurred on
glucose with B vitamins. In most cases megagametophytes
outgrew their megaspore walls, and continued to grow to
large sizes. Megagametophyte tissue was often highly
textured and rough, exhibiting fissures and folds, and
archegonia. Tissue color was often more deeply yellow than
on other treatments.
Average final volume on the sorbitol control, 3% glucose
with B vitamins, was not significantly different from the
first 3% glucose treatment with B vitamins, and a
megagametophyte from the sorbitol control treatment was
included in Figure 27. This megagametophyte became quite
large, and rhizoid development was unusually pronounced.
The megagametophyte depicting growth on 5% glucose with B
vitamins (Figure 28) exhibited the greatest increase in size
of any megagametophyte on any treatment. Final size was so
large that volume data for this individual was not included
in the statistical analysis with the other megagametophytes.
This megagametophyte was marked by a very folded and
sculpted surface, and by a bright yellow color.

61
Glucose + B
-C"')
E E
N ~a 5°/o (7) I 20 0 -x a (15)
/ /61% I - a 6
Q) /~ 03% (8) E 10 ~v --0--:::::J - 0---0 0 > ~ #a o----0----0----0 K + B (10) o------
2 4 6 8 10 12
Week Number
Figure 25: Growth on Glucose With B Vitamins
62
a) () g QQ 0
Figure 26: Response of Megagametophytes Grown on 1% Glucose With B Vitamins
a= lG+B(2)IIout, b = lG+B(4)IVout, scale bar= 0.5 mm.

63
a)
Figure 27: Response of Megagametophytes Grown on 3% Glucose With B Vitamins
a = 3G+B(4)Iout, b = sorbitol control-3G+B(6)IIImid, scale bar= 0.5 mm.

64
Figure 28: Response of Megagametophytes Grown on 5% Glucose With B Vitamins
SG+B(4)IIIout, scale bar = 0.5 mm.

65
3.3.3 Growth on Sucrose With and Without B Vitamins
Growth on all three concentrations of sucrose without B
vitamins was depressed below that on K medium (Figure 29).
Average final volume tended to decrease with increasing
concentration. Though these differences were not
statistically significant by themselves, the appearance of
the tissue supports the idea that this sugar inhibited
megagarnetophyte growth and development. Figures 30 - 32
depict megagametophytes grown on sucrose. These exhibited
weak growth with little development of tissue. Most visible
tissue appeared to lack firmness, appeared watery, and was
always colored white. There was also little development of
rhizoids, and apparent archegonia were rare (Figure 30-a).
One of the most notable observations in these experiments
is the ability of B vitamins to greatly enhance growth on
sugars, or concentrations of sugars, that produced poor
responses otherwise. Growth on sucrose with B vitamins
(Figure 33) is a case in point. All three concentrations of
sucrose with B vitamins produced greatly enhanced growth of
megagametophytes, with no indication that growth was
leveling off by the end of the 12 wk period. Average final
volumes on all concentrations, though, were not
significantly different from that on K+B, which was a
reflection of the amount of variation of response within

-(\')
E E
N I 5 0 -x
-Q)
E ::J -~
2
66
Sucrose
K (8)
---:&:---:&----*---~ 1 O/o (8)
----~ . o? 3010 (6) LY ___.--o -8- -=B B B 5010 (10) g------c- /C
2 4 6 8 10 12
Week Number
Figure 29: Growth on Sucrose
67
a)
b)
Figure 30: Response of Megagametophytes Grown on 1% Sucrose
a= lS(4)IVin, b = lS(S)IIout, scale bar= 0.5 mm.
68
b) 0 0 CJ u 0 0
Figure 31: Response of Megagametophtyes Grown on 3% Sucrose
a= 3S(S)IVout, b = 3S(8)IVin, scale bar= 0.5 mm.

69
Figure 32: Response of Megagametophytes Grown on 5% Sucrose
a= 5S(4)IVin, b = 5S(4)Iout, scale bar= 0.5 mm.

70
these treatments. Though growth of several megagametophytes
was greatly enhanced, others grew only to normal sizes.
Figure 34 depicts the enhancement of growth that occurred on
all concentrations of sucrose with B vitamins. Several
megagametophytes grew out of their megaspore walls, and the
tissues exhibited a textured and firm appearance, with no
indication of the weak growth response observed on sucrose
treatments without B vitamins. There was also some rhizoid
formation, and color of the tissue ranged from white to
yellow.

71
Sucrose + B
5°10 (8) - 1°10 (13) C")
~/J E E / 0 3°/o (13)
N I 10 0 Jo/ -x I -
[J Q) [J/ E ::I -0 5 o ---0----o K+ B (10) > o----- -----
3
2 4 6 8 10 12
Week Number
Figure 33: Growth on Sucrose With B Vitamins

a)
b)
c) 0 ,,.._ __
:~':··; ... ~
72
Figure 34: Response of Megagametophytes Grown on 1, 3, and 5% Sucrose With B Vitamins
a= 1S+B(7)Iin, b = 3S+B(3)Iout, c = 5S+B(4)IIIin, scale bar= 0.5 mm.
73
3.3.4 Growth on Trehalose With and Without B Vitamins
Figure 35 presents the response of megagametophytes to
trehalose treatments without B vitamins. Growth was greatly
enhanced on 1% trehalose, but was depressed on 3 and 5%.
The lack of growth on 3 and 5% is reminiscent of the poor
growth on sucrose treatments. Differences in average final
volume between K medium, and 3 and 5% trehalose were not
significant. Growth on 1% trehalose, however, was
significantly greater than on any other treatments without B
vitamins at the .05 confidence level (Figure 14), and was
comparable to the highest average final volumes achieved on
sucrose and sorbitol treatments with B vitamins. On both 3
and 5% trehalose growth was essentially level from the time
of germination, and on 1% trehalose there was a trend
towards leveling off near the end of the 12 wk period.
Figure 36 depicts the large volumes achieved by
megagametophytes on 1% trehalose, and the similarity with
many megagametophytes cultured on sugar treatments with B
vitamins. Tissue appeared firm and textured, with slight
rhizoid development, and color ranged from white to yellow.
Megagametophytes cultured on 3 and 5% trehalose displayed
little development of firm tissue (Figure 37).
Growth was greatly enhanced on trehalose with B vitamins
for all three concentrations (Figure 38). Average final

74
Trehalose
-("') 10 ~61°/o (13) E E
6/ N I / 0 -x
/ -C1' 5 ~----9----g---~----9~% (8) E (9) ::::J -.g
0 0 0 0 0 0 3°/o (1)
2 4 6 8 10 12
Week Number
Figure 35: Growth on Trehalose

75
a)()® 00 Q b)
c)
Figure 36: Response of Megagarnetophytes Grown on 1% Trehalose
a= lT(l)II, b = 1T(2)III, c = lT(l)I, scale bar. = 0.5 mm.

76
Figure 37: Response of Megagametophytes Grown on 3 and 5% Trehalose
a= 3T(3)IVin, b = 5T(7)Iin, c = ST(l)III, scale bar = 0. 5 mm.
77
volume on 1% trehalose with B vitamins was comparable to
that on 5% glucose with B vitamins, which exhibited the
greatest final volume of any treatment (Figure 17). Average
final volumes on the three concentrations of trehalose with
B vitamins were not significantly different from each other
(Figure 15), but 1% and 3% trehalose with B vitamins were
significantly higher than K+B at the .05 confidence level.
There was no indication that growth was leveling off on any
of the three concentrations at the end of the 12 wk period.
Figures 39 - 41 depict the response of megagametophtyes on
the three concentrations of trehalose with B vitamins, many
of which rapidly grew out of their megaspore walls. Figure
41 depicts a megagametophyte cultured on 5% trehalose with B
vitamins that grew entirely out of its megaspore wall. The
tissues of these megagametophytes, as on all sugar with B
treatments, appeared firm, textured, and had some rhizoid
development. Color of the tissues ranged from white to
yellow.

-C")
E E
N I 0 -x I -
Q)
E :J -0 >
20
10
78
T rehalose + 8
~ 1 O/o (10) 010 3% (16)
o~ ~ c 5°/o oo)
~~a~
(10)
2 4 6 8 10 12
Week Number
Figure 38: Growth on Trehalose With B Vitamins

79
Figure 39: Response of Megagametophytes Grown on 1% Trehalose With B Vitamins
a = lT+B(2)IIIin, b = lT+B(S)IIin, scale bar = 0.5 mm.

80
a) (]) Qe·o·· o··"G .. : ·~·;:.: .. :·:.:: . . ... · . .. ,.: ~ • .L .i .•' . . ' . . .
b) 0 __ ... ~ , ... , ... , ' ' . ·~, ~ \. /I ( 1 • .). .. ..Ji
Figure 40: Response of Megagametophytes.Grown on 3% Trehalose With B Vitamins
a = 3T+B(l)IVin, b = 3T+B(2)IVin, scale bar = 0.5 mm.

81
0000
Figure 41: Response of Megagametophytes Grown on 5% Trehalose With B Vitamins
5T+ff(5)IIIout, scale bar = 0.5 mm.

82
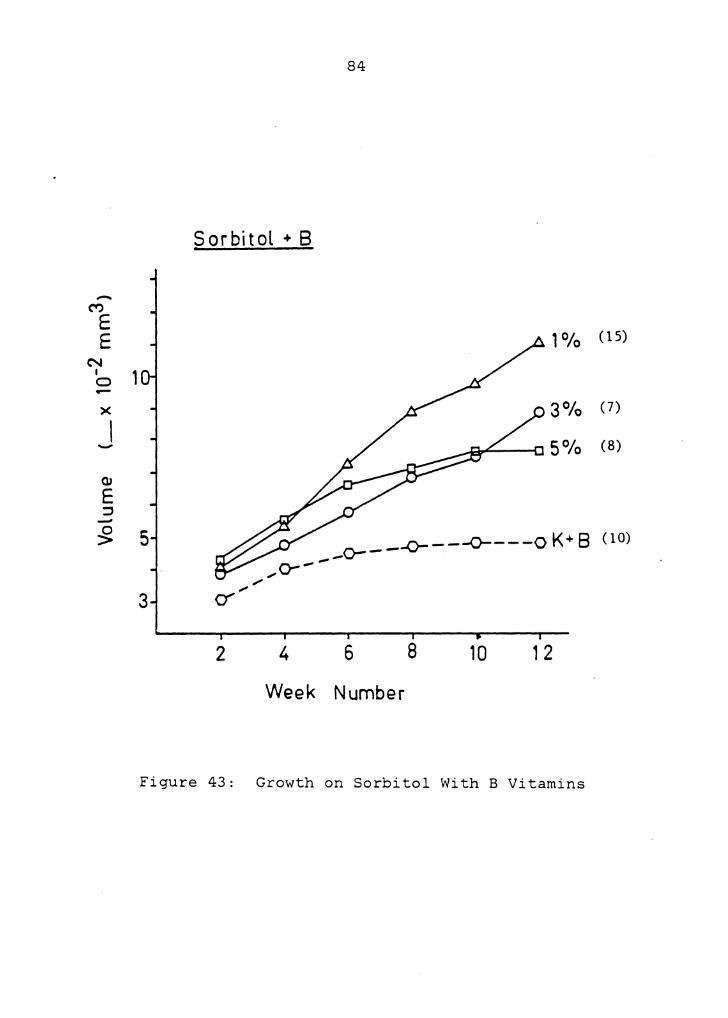
3.3.5 Growth on Sorbitol With B Vitamins
Final volume achieved on the sorbitol control treatment,
3% glucose with B vitamins, was not significantly different
from that on the first of this type (Figure 15). Figure 42
presents the growth of these two treatments. One
megagametophyte cultured on the sorbitol control treatment
was included in Figure 27. Figures 43 - 46 present growth
responses of megagametophytes on sorbitol treatments with B
vitamins, which were enhanced on all three concentrations.
There was no indication of growth leveling off on either 1
or 3% sorbitol with B vitamins, though growth on the 5%
sorbitol treatment with B vitamins did level off. As with
sugar treatments with B vitamins, there was rapid growth,
resulting in firm and textured tissues. Several
megagametophytes grew entirely out of their megaspore walls
(Figures 44-a and 46-a). Some rhizoids developed, and color
of the tissues ranged from white to yellow.

-C")
E E
N I 20 0 -)(
-Q)
§ 10 -0 >
83
3 °/o Glucose + B o July • December
/·-· . •
/ ~o 0----0
• 0---
~ o---.~ 0
2 4 6 8 10 12
Week Number
Figure 42: Growth on 3% Glucose With B Vitamins - June and December Experiments
-M E E
N I 1 0 -x I -
Cl> E ~ -0 >
Sorbitol + B
5 ,,,,. o--,,.. ,,,,.
3 O"
2 4
84
__ o---
6
1 O/o (15)
3°/o (7)
~~---1.J 5 O/o (8)
-0----0----0 K+ 8 oo)
8 10 , 2
Week Number
Figure 43: Growth on Sorbitol With B Vitamins

a)
b)
c)
Figure 44:
85
Response of M~gagametophytes Grown on 1% Sorbitol With B Vitamins
a = 1Sb+B(4)Iin, b = 1Sb+B(6)IIIout, c = 1Sb+B(3)IIIout, scale bar = 0.5 mm.

86
Figure 45: Response of Megagametophytes Grown on 3% Sorbitol With B Vitamins
a= 3Sb+B(8)IIIout, b = 3Sb+B(4)IVin, scale bar = 0.5 mm.

b)
c)
87
~ M ~~A.~~ ~J \2 \JV ~ \J2!) w
Figure 46: Response of Megagametophytes Grown on 5% Sorbitol With B Vitamins
a= 5Sb+B(5)Iin, b = 5Sb+B(l)IIin, c = 5Sb+B(7)IVin, scale bar= 0.5 mm.

88
3.4 RESPONSE TO THE SECOND TREHALOSE TREATMENTS
Responses to the second set of trehalose treatments were
different from the first set. Rates of germination were not
different between the 2 sets, but percent germination and
final volume exhibited different patterns (Table 4 and
Figure 47). Response to the second control treatment (K)
was not significantly different from the first K treatment.
This last observation suggests that megaspores sown in July
and December had a similar potential for response.
Percent germination on 1% trehalose was high in the first
treatment, but significantly lower in the second treatment
(Table 4). A significantly higher percent germination was
exhibited in the second 3% trehalose treatment as compared
to the first. Germination percentage on the second 5%
trehalose treatment was twice as high as in the first, but
this was not a significant difference.
Growth on the two sets of treatments exhibited different
patterns. The first set (Figure 35) produced a pattern of
growth in which 1% trehalose produced the highest average
final volume (9.87 x 10~ mm 3 ), with 3 and 5% trehalose
tending to inhibit growth to levels below that on K medium.
In the second set of trehalose treatments, however, average
final volume increased with increasing concentration of the
sugar (Figure 47). One% trehalose still enhanced growth

89
TABLE 4
Percent Germination on 1st and 2nd Trehalose Treatments (July and December)
Percent Germination Treatment 1st 2nd
*
K 09 - * 10 1T 34 > 07 3T 02 < 19 ST 19 = 37
(=) indicates no significant difference at the 0.05 confidence level. See Appendix C for all data.

90
above that on K medium, and achieved almost the same average
final volume as before (8.76 x 10- 2 mm 3 ). Three and 5%
concentrations, however, produced larger average final
volumes than 1%. In fact, 3 and 5% trehalose produced
larger average final volumes than any treatment in either
the first or second sets. Growth responses to K medium and
1% trehalose in the second set of treatments were not
significantly different from their earlier values (Figure
48).

15
-(") 10 ·E E
N I 0 -x
I -Q.l E ::I -0 >
5
91
Trehalose (2nd)
2 4 6
5°/o (S)
3 O/o (6)
1°/o (2)
---o--- o- - -o K <.3)
8 10 12
Week Number Figure 47: Growth on Trehalose - 2nd Set

92
Treatment 3Ta ST a
( 2. 32 x 20-2
Confidence
Ka mm 3 )
Kb lTb lTa 3Tb STb* (14.13)
Level
0.10
0.05
Figure 48:
I
I
I
I
Differences In Final Volume - Trehalose (1st and 2nd Sets)
a = first set of trehalose experiments, b = second set. Treatments sharing a common line are not significantly different at the specified confidence level.
93
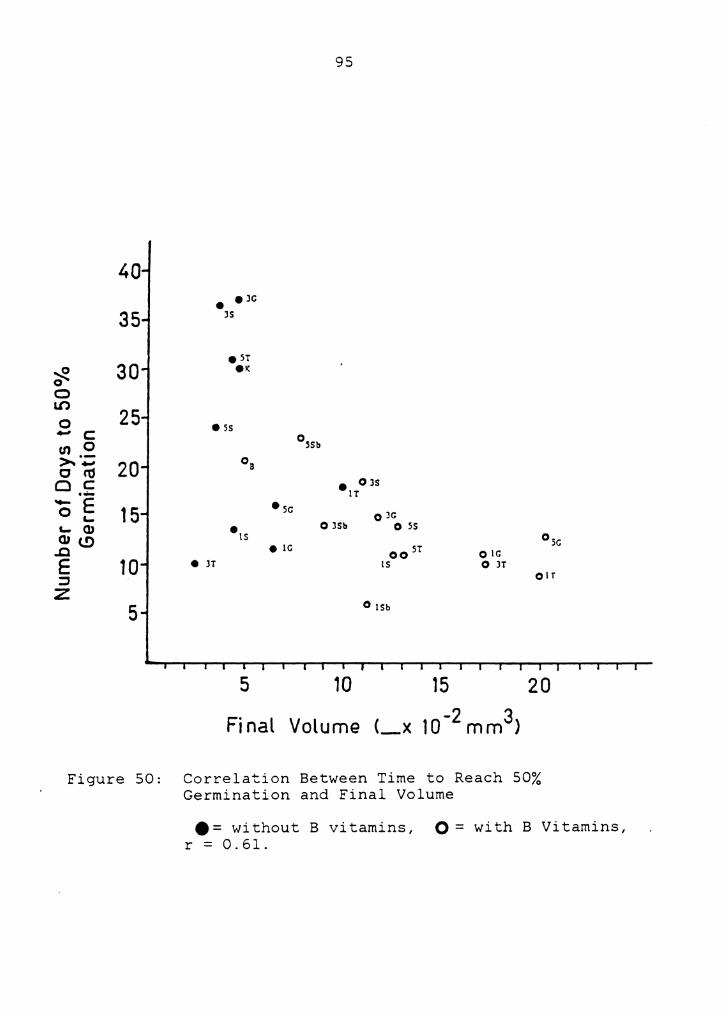
3.5 CORRELATION ANALYSIS
The 3 relationships that were analyzed are presented
graphically in Figures 49 - 51. Percent germination versus
final volume displayed the highest correlation (r~ 0.81) of
the three (Figure 49). Treatments producing high%
germination also tended to produce larger megagametophytes.
Number of days to 50% germination versus final volume
(Figure 50) had a lower correlation (r= 0.61) and,
therefore, a weaker linear relationship between the two
responses. Treatments with rapid germination also tended to
produce larger megagametophytes. Figure 50 indicates that
no treatments produced both slow germination and large
average final size. Number of days to 50% germination
versus % germination (Figure 51) exhibited the lowest
correlation (r= 0.48) There was only a slight tendency for
treatments producing rapid germination to also produce
higher % germination. Figure 51 indicates, however, that no
treatments produced both slow germination and high %
germination.

94
70 0 SG
60
0 JS 0 3T c 50 OIG 0 -"' OJc c OISb
E 40 ~ ois Cl> 01T
(!) 0 SS e IT
30 e IC 0 ST .-c
Cl> OB u .JG ~
Cl> 20 a... e ST OSSb 0 JSb 55 • • •1s Sc
10 •K •Js
•JT ·5 10 15 20
Final Volume (_x 10-2 mm3)
Figure 49: Correlation Between% Germination and Final Volume
e = without B vitamins, O = with B vitamins, r = 0.81.
95
40 • eJc
35 35
30 e5T
~ eK 0 0 LO
25 0 • 55 - c 05Sb en 0
~·;; 20 08 c "' QC e OJS ..... IT - E • 5C 0 '- 15 0 JC '- QJ • 0 JSb 0 5S QJ (.!) IS 0 sc
.J:l e IC 00 5T 0 IC
E 10 • JT IS 0 3T
::I OlT
z 5 0 l5b
5 10 15 20
Figure 50: Correlation Between Time to Reach 50% Germination and Final Volume
e = without B vitamins, O = with B Vitamins, r = 0.61.

0 c: -o l/l -~~ fl)·-OE
'-- °' 0 U> .._ °'~ .0 0
E~ :J z
40
30
20
10 .lT
• 15
• K
10
• ~T
•1r.
0 SSb
• sr;
IS e 0 JSb
•1r.
20
96
30
• 1r
Oss
0 I~
0 IT
40
0 JG
Ir. 0
0 )5
0 JT
50
Percent Germination
60
0 SG
70
Figure 51: Correlation Between Time to Reach 50% Germination and % Germination
•=without B vitamins, Q= with B vitamins, r = 0.48.
97
3.6 RESULTS OF FLUORESCENCE ANALYSIS
Many of the megagametophytes examined contained
chlorophyll-a, though the amount was less than in
sporophyte tissue (Table 5) (see Appendix D for all data).
Whether megagametophytes containing chlorophyll-a were
photosynthesizing in culture is unknown at this time.
Megagametophytes cultured on most of the carbon treatments
had less chlorophyll-a than those cultured on K medium, and
those cultured on trehalose and sucrose had less than those
cultured glucose and sorbitol. The amount of chlorophyll-a
was highest in megagametophytes cultured on 3% Sorbitol with
B vitamins, and there was none in those cultured on 1%
sucrose. The presence or absence of B vitamins did not
appear to determine the amount of chlorophyll-a present,
though the amount of chlorophyll-a present in
megagametophytes cultured on K medium with B vitamins was
less than those cultured on K medium alone. The highest
amount of chlorophyll-a in megagametophyte tissue was ca.
25% of that present in an equivalent amount of sporophyte
tissue.

98
TABLE 5
Amount of Chlorophyll-a Present in Megagametophyte and Sporophyte Tissue
<Chlorophyll-a> Treatment (micrograms/mm 3 )
sporophyte 1.20 x 10⁻²
(stem)
3%Sb +B 4.94 x lo-J K 2.97 II
1%Sb +B 2.40 II
3%G +B 1. 89 II
5%Sb +B 1. 74 II
5%G +B 1. 05 II
K+B 9.60 x 10⁻⁴
1,3,5% G 9.50 II
1,5% T 6.31 II
3%T +B 5.00 II
3%S +B 4.38 II
5%S +B 3.48 II
1%S +B 3.27 II
1%S 0.00
Sb = sorbitol G = glucose T = trehalose s = sucrose B B vitamin mixture

99
3.7 CELL SIZE ANALYSIS
Megagametophytes cultured on K medium, and l, 3, and 5%
sorbitol with B vitamins contained cells of approximately
the same size (Table 6). Average cross-sectional area of
cells in megagametophytes of Selaoinella compared favorably
with that of fern gametophytes as determined by Whittier
(1964a).

100
TABLE 6
Cell Size Analysis
Treatment n Cross-Sectional Area (mm 2 )
Selaginella megagametophytes
K Bl Sb B3Sb B5Sb
2 4 3 4
.0032
.0026
.0028
.0025
±.0008 ±.0008 ±.0007 ±.0011
Fern gametophytes (from Whittier, 1964a)
0% 0.5 2.5 6.0
Sucrose II
II
II
20 II
II
II
.0021
.0021
.0028
.0025

101
3.8 CELLULAR ORGANIZATION OF MEGAGAMETOPHYTES
Sections of several megagametophytes that exhibited
normal or enhanced growth are shown by Figure 52 f-h. The
megagametophyte grown on K medium (Figure 52-f) was
structurally similar to other Selaginella megagametophytes
(Robert, 1971; Foster & Gifford, 1974). There was a basal
zone of lipid reserve tissue with little cellularization in
the distal end of the megagametophyte, and the upper end
(proximal end of megaspore) consisted of highly cellularized
tissue. Unlike the descriptions of Robert (1971), however,
there was no indication of a membranous structure, the
diaphragm, which divides the megagametophyte of Selaginella
kraussiana into upper and lower zones. At this stage of
development there were also no rhizoids nor archegonia
present. The megaspore wall was not removed from this
megagametophyte, and can be seen in section.
Several megagametophytes grown on sorbitol with B
vitamins provided the first observations of the internal
anatomy resulting from enhanced growth. One of these
megagametophytes, cultured on the 1% sorbitol treatment,
that was alive when selected for fixation and imbedding,
displayed a highly cellularized internal anatomy, with some
remnant of the lipid reserve tissue present at the basal end
(Figure 52-h). Notably, enhanced growth did not occur at
102
the expense of the total depletion of the lipid reserve.
Locations of recent cell divisions, determined by the
presence of thin cell walls, indicated that cell divisions
were not located in specific regions, but were dispersed
internally throughout the tissue. One megagametophyte grown
on 3% sorbitol with B vitamins exhibited a smaller, less
cellularized, tissue (Figure 52-g). Both of these
megagametophytes (Figure 52 g,h) had archegonia, with egg
cells, located immediately below their proximal surfaces.

103
Figure 52: Normal and Enhanced Growth of Megagametophytes -External and Internal Observations
a. Growth on K medium. b. on 3% trehalose (2nd set). c. on 5% trehalose (2nd set). d. on 3% glucose with B vitamins. e. on 1% sorbitol with B vitamins. a-e. x 29.
f. Normal internal anatomy (on K medium). g. on 5% sorbitol with B vitamins. h. on 1% sorbitol with B vitamins. f-h. x 110.

104

Chapter IV
DISCUSSION
4.1 THE EFFECTS OF B VITAMINS
The known metabolic roles played by the B vitamins are
important to an understanding of these experiments. The B
vitamin mixture used by Wetmore and Morel (1951) to enhance
growth in megagametophytes of Selaginella was also used by
them (Morel & Wetmore, 1951) to enhance growth in culture of
the gametophyte of the fern, Osmunda cinnamomea. This
vitamin mixture consisted of thiamin, niacin, pantothenate,
pyridoxine, biotin, and inositol. Inositol is not
considered to be a vitamin, but its growth enhancing
properties place it in the category of a growth factor
(Lehninger, 1975). A brief discussion of the known roles of
each of these components now follows.
Thiamin serves as a prosthetic group in the enzyme
cocarboxylase (thiamin pyrophosphate). This enzyme is
involved in the mainstream of carbohydrate metabolism by
allowing pyruvate formed in glycolysis to enter the Krebs
cycle through decarboxylation to form acetaldehyde, which
then reacts with coenzyme-A to form acetyl-coA (Salisbury
and Ross, 1978). Therefore, thiamin is extremely important
105
106
in allowing available carbohydrates to be utilized for
cellular metabolism.
Niacin is a major component of the pyridine nucleotides,
NAD and NADP, which function as coenzymes in a large number
of oxidation-reduction reactions in respiration,
photosynthesis, nitrogen metabolism (nitrate reductase), and
lipid degradation.
Pantothenate (coenzyme A) serves as a carrier of acyl
groups at the beginning of the Krebs cycle, and in lipid
synthesis and degradation.
Pyridoxine, in the form of pyridoxal phosphate, forms an
important part of amino transferase enzymes, through which
the bulk of amino acids are synthesized. The enzyme
transfers amino groups of amino acids to the alpha carbon of
keto acids.
Biotin is a coenzyme used in condensation reactions of
acetate units (from acetyl-coA) to form new fatty acids in
lipid synthesis.
Inositol, a cyclic sugar alcohol, is probably synthesized
in plant and animal tissues by the cyclization of D-glucose
(Cosgrave, 1980). It is not a building-block of any known
coenzyme, but is a component of inositol phosphoglyceride, a
lipid molecule found in membranes. Robert (1971) determined
that granules in the lipid reserve of Selaginella

107
kraussiana, which he likened to aleurone grains, consisted
of inositol hexaphosphate (phytic acid), though the
connection here may be illusory.
4.2 UTILIZATION OF B VITAMINS AND SUGARS
Treatments with B vitamins alone speeded germination and
increased % germination, but did not effect growth. This
suggests that, by themselves, B vitamins had no effect on
the utilization of native reserve foods stored in the
megaspores.
Some sugar treatments alone affected certain aspects of
germination and growth of megagametophytes. This suggests
that, under specific circumstances, the sugars in the media
were used by some megagametophytes.
Sugars with B vitamins in every case enhanced germination
and growth of the megagametophytes. From the above
controls, one can conclude that these effects are due to the
enhanced utilization of sugars in the media when stimulated
by B vitamins. The effects observed are probably not due to
enhanced utilization of the native reserves within the
megaspores.
Specific analyses of the responses of megagametophytes to
the various treatments follows.

108
4.3 GERMINATION TIMING AND NUTRITION
Speed of Germination may have been linked to the stage of
development of the megagametophyte at the time the megaspore
was shed, and to the length of the ensuing time period
during which the megaspore remained dormant before
inoculation onto a medium favorable for germination (i.e.
with continuous water availability). Prolonged dormancy may
have diminished viability in megaspores due to increased
dehydration and depletion of the nutritional reserve tissue.
Megaspores with diminished viability, when inoculated onto
agar, may have recovered to germinate, though the time to do
so may have varied according to the extent of degradation
within the megaspore, and the particular nutritional
treatment on which the megaspore had been inoculated. For
example, if megaspores were placed on a nutritional
treatment consisting of B vitamins with sugar, perhaps less
viable ones recovered quickly to germinate. Fully viable
megaspores may have germinated more quickly than normal, and
younger megaspores may have developed rapidly too. A
pattern of response such as this may explain the more rapid
and tightly clustered germinations that occurred on B
vitamin treatments (Figure 3). The B vitamin mixture may
have played an important role in this enhancement of
germination due to facilitation of any of the following:

109
lipid reserve utilization, membrane synthesis, carbohydrate
utilization, energy production, cell wall synthesis, protein
synthesis.
Variation in number of days to germinate may have been
introduced in three ways. The first was through forced
drying, dehiscence, and dispersal of some megaspores before
they had reached normal maturity. These might require
additional time before they could be anatomically and
physiologically capable of germinating. The second possible
source of variation was the collection and inoculation of
megaspores that matured long before collection, and that had
lain dormant within strobili. Inspection of numerous
strobili has shown that many megaspores are too large to be
dispersed, and remain trapped for varying lengths of time.
Some older megaspores were probably utilized in this
experiment, since larger megaspores were preferentially
used. Many of the megaspores which did not germinate might
have been too old. Much of the variation in germination
rate on treatments without B vitamins might possibly be so
explained. A third cause of variation may have involved
genetic differences amongst megaspores as a result of
segregation and assortment of chromosomes at meiosis. None
of the four megaspores in any tetrad was likely genetically
identical. Support for genetic variation comes from the

110
differing colors and production of rhizoids in
megagametophytes on a single treatment. This genetic
variation may have extended to other, less visible aspects
of metabolism.
Sugar treatments without B vitamins did not produce
significant differences in the average number of days to
germinate (Figure 1). However, a sugar that could be
metabolized by megagametophytes might increase the speed of
germination as a result of enhanced metabolism. A
nutritionally inert sugar could be expected to slow
germination since it would confront megaspores only as an
osmotic agent and make water less available. The increase
in average final size on glucose treatments (Figure 21) over
that on K medium is an indication that megagametophytes can
metabolize this sugar. Further support comes from the
observations that % germination was significantly higher on
3 and 5% glucose than on K medium (Table 2-c), and all 3
concentrations tended to exhibit more rapid germination than
on K medium. One % trehalose and 1% sucrose also tended to
increase the rate of germination, but they appear to have
been inhibitory at 3 and 5%. This may indicate an ability
to use these sugars only in low concentrations. The
differences in average number of days to germinate between
treatments without B vitamins were not significant though
111
average final volumes suggest that some treatments may have
been more favorable than others. The B vitamins may have
allowed more rapid utilization of supplemental
carbohydrates, possibly explaining why total treatments with
B vitamins germinated significantly faster than total
treatments without B vitamins. Ideally, study of the
effects of different sugars on germin~tion response should
use megaspores that are developmental age-mates, though the
difficulties inherent in selecting them are obvious.
4.4 PERCENT GERMINATION AND NUTRITION
Many of the factors influencing the speed of germination
may also have helped determine % germination. The age and
condition of each megaspore undoubtedly influenced
germination. A premature megaspore might develop and
germinate, but a post-mature one might not recover depending
upon the sugar treatment. Table 2-c indicates that among
treatments without B vitamins only 1 and 3% glucose, and 1%
trehalose, significantly increased % germination . This was
in general accord with the ability of these sugar treatments
to enhance growth. This provides further evidence that
these sugars may have been utilized by megagametophytes.
Unlike germination speed, which lacked significant
differences among treatments without B vitamins, %

112
germination showed significant differences among these
treatments. This may be because germination is an
all-or-nothing phenomenon, and variation as a result of
different ages of megaspores was not so strong a factor.
The significant enhancement in % germination among
treatments with B vitamins, even on K medium
(Table 2-d), might be explained in much the same way as for
germination rate. The B vitamins, which play important
roles in carbohydrate, lipid, and protein metabolism, may
have stimulated recovery of lost viability in older
megaspores, which might not have germinated otherwise.
Perhaps the addition of B vitamins to K medium facilitated
utilization of the lipid reserve, resulting in an increase
in available nutrition and viability. This is contradicted,
however, by the lack of any enhancment of growth by B
vitamins on K medium. Work is needed to determine the
actual status of the lipid reserve through time to provide a
clearer picture of the effect of B vitamins on its
utilization.
The addition of B vitamins might have allowed utilization
of all concentrations of sugars which were not previously
usable. There were no significant differences between the
highest % germinations occurring on each of the three sugars
in the presence of B-vitamins (Table 2-h). There is strong
113
evidence that sucrose, which seems not to have been used at
any of the 3 concentrations without B vitamins, was
metabolized readily with the addition of B vitamins. This
is judged by the increase in observed growth. Determining
the biochemical pathways through which sucrose is utilized
only in the presence of B vitamins may provide valuable
future research. Whether these pathways are normally active
in low levels in the megagametophyte, or are completely
absent, will provide an interesting direction for future
research.
In treatments without B vitamins there were suggestions
that higher concentrations of sugars inhibited growth
responses that lower concentrations could induce. On
glucose, for example, 1% enhanced % germination
significantly, as did 3% at a lower level. Five % glucose,
however, did not increase % germination significantly. On
trehalose as well there was great enhancement of %
germination on 1% concentration. On 3 and 5%, however,
significant enhancement did not occur and growth responses
appeared inhibited. Perhaps megagametophytes have the
ability to metabolize these sugars, but only at low rates
due to production of only small amounts of the necessary
enzymes. Higher concentrations may then pose problems due
to osmotic effects. This reasoning is speculative, and

114
further testing is needed. The addition of B vitamins may
possibly have alleviated the deleterious effects of effects
of high concentration by allowing higher rates of
utilization through increased enzyme production. This may
have resulted in enhanced metabolism and higher % germination on all concentrations.
Despite the apparent inhibition of growth below that on K
medium (Figure 29), megagametophytes might be capable of
utilizing some sucrose when grown on much lower
concentrations. The sporophyte contains higher amounts of
trehalose than sucrose (White and Towers). There may,
therefore, be more trehalase available than invertase in the
sporophyte. Based on this observation one can speculate
that there may be a corresponding lower level of invertase
available or inducible in the megagametophyte. If this were
the case then 1% sucrose may have already been too much for
the system to metabolize, and the observed lack of growth on
this treatment may be the result of osmotic difficulty. One
should not yet conclude that megagametophytes are incapable
of metabolizing sucrose. The ability to utilize trehalose,
on the other hand, may have been greater. One % could
possibly be used to enhance metabolism, whereas higher
concentrations might still create problems osmotically for
the tissue. Interesting responses might be observed by
115
culturing megagametophytes on much lower concentrations of
sucrose and trehalose. Quantitatively assaying the
invertase and trehalase present in megagametophytes cultured
on a range of concentrations of each sugar would be
interesting. Future research should focus on whether
trehalase is present in megagametophyte tissue normally, or
if growth on trehalose induces its synthesis.
4.5 GROWTH AND NUTRITION
The enhancement of growth possibly involved the same
metabolic factors that increased speed of germination and %
germination. Glucose enhanced growth at all concentrations.
Trehalose greatly enhanced growth at 1% concentration, and
sucrose concentrations may have been too high to effect any
enhancement. One % trehalose may have been near the correct
concentration for the postulated amount of trehalase
present, or inducible, in the tissue. Therefore, the
megagametophyte may have had the supplemental nutrition
necessary to support enhanced growth. This undoubtedly
entailed higher rates of membrane, cell wall, and protein
synthesis. Additional coenzymes may be necessary to have
enhanced and sustained growth, since growth on most sugar
treatments with B vitamins did not level off within the 12
wk period. The production of additional coenzymes on 1%

116
trehalose may have been stimulated since these were not
supplied in the medium, and growth did not level off on this
treatment. Except for 1% trehalose, growth on all other
non-B treatments leveled off within the 12 wk period.
Leveling off of growth might at first be interpreted to
indicate a general depletion of water and/or sugar from the
agar. However, growth on all sugar treatments with B
vitamins, and on 1% trehalose, did not level off. This
suggests that other factors were responsible for the slowing
of growth. In treatments with B vitamins additional enzyme
cofactors may have provided the means for utilization of
available nutrition, with a resultant continuous increase in
size. This suggests the possibility that growth on
treatments lacking B vitamins was restricted by a depletion
of cofactors in the tissue. The relatively continuous
growth on 1% trehalose was possibly due to the greater
ability of the tissue to metabolize this sugar. If correct,
this would have resulted in a higher level of metabolism,
and possibly a production of the cofactors needed to sustain
enhanced growth. One % trehalose, the sugar found in
substantial quantity in normal sporophytes, may have induced
a certain potential for indeterminate growth in the
megagametophyte, a pattern of growth commonly found in
portions of the sporophyte.
117
Notably, growth on K medium with B vitamins was not
enhanced, and leveled off as rapidly as growth on K medium
without B vitamins (Figure 18). In this case nutrition was
possibly in short supply, resulting in the cessation of
growth. Future observations should include a determination
of whether megagametophytes cultured on K medium with B
vitamins have depleted their lipid reserves as a result of
facilitation by additional enzyme cofactors.
Morel and Wetmore (1951) observed greatly enhanced
growth, and induction of callus tissue, in gametophytes of
the fern, Osmunda cinnamomea, cultured on the identical B
vitamin mixture. Perhaps gametophyte morphology results,
not only from normally limited energy supplies, as
hypothesized by DeMaggio (1963) and Whittier (1978), but
also from the inability of this tissue to produce sufficient
quantities of enzyme cofactors needed to sustain enhanced
metabolism.
The lack of apogamy in the present series of experiments
suggests that neither of these interpretations may be fully
correct. Results from Morel and Wetmore's experiment
(1951), and from the present work, may indicate that
providing these gametophytes with additional enzyme
cofactors to utilize supplemental sugars leads only to
maintenance and growth of the gametophyte morphology. The

118
induction of apogamy with high concentrations of sugars,
shown to occur in many homosporous plants may, therefore,
depend upon more than just the availability of greater
amounts of energy.
The ability of megagametophytes, when in the presence of
B vitamins to utilize all 3 sugars at any of the three
concentrations, to enhance metabolism and growth may
indicate that the megagametophyte of Selaginella is
deficient in enzyme cofactors. This may result in its
normally restricted growth and small size. This would not
be a totally correct interpretation, though, as the addition
of B vitamins alone did not increase growth. Both B
vitamins and carbon sources (sugars and sorbitol) were
necessary to produce growth enhancement. Instead,
consideration should be given to the possibility that the
amount of both cofactors and endogenous nutritional sources
normally strike a balance that allows the organism to
achieve its purpose of producing archegonia and supporting
early development of the sporophyte.

119
4.6 METABOLISM OF SORBITOL
Enhanced growth on sorbitol treatments with B vitamins
suggests that megagametophytes can utilize this polyalcohol
in metabolism. Determining the response of megagametophytes
to simple osmotic differences was not achieved, therefore,
since the selected osmoticum was apparently inappropriate.
Future research concerning the effects of osmotic
differences on megagametophyte growth must include an
osmoticum that can be proven to be nutritionally inert, but
otherwise harmless, to the living tissue. The enhanced
growth of megagametophytes observed on all treatments with B
vitamins (except K medium) may actually result from some
osmotic factors in conjunction with B vitamins. This
alternative explanation, which implies that the various
sugars were not utilized metabolically, seems unlikely.
Since megagametophytes grow to large sizes on sorbitol
and B vitamins , this probably indicates some ability to
utilize this polyalcohol. Since sorbitol is chemically very
similar to manni tol, the use of mannitol by Whittier
(1975), and interpretation of his results as a response to
osmotic factors may be incorrect. That a basal level of
carbohydrate was necessary before increasing concentrations
of mannitol could induce greater amounts of apogamy suggests
that enhanced metabolism, derived from supplemental

120
nutrition, allowed for the metabolic utilization of
mannitol. The induction of apogamy seen by Whittier (1975)
may not have been due to osmotic differences at all. This
remains speculative, however, until the nutritional
inertness of mannitol is examined further.
The sorbitol control treatment, 3% glucose with B
vitamins, exhibited significantly faster rates of
germination than the first such treatment (Figure 2). This
may indicate that there were no longer any premature
megaspores among those inoculated, since these were
collected six months later. Perhaps all megaspores were
either ready to germinate, were less viable due to older
age, or were totally non-viable. The variation in response
possibly introduced through the use of potentially premature
megaspores in the July sowing may have been removed. The
possible reduction may result from the distinctly fewer
cones, and therefore megaspores, that were produced in the
winter months. The megaspores collected in December were
probably somewhat older on the average than those collected
in June, when production of megaspores was higher.
Total % germination on the sorbitol and B vitamin
treatments was significantly lower than that on any other
sugar with B vitamin treatments treatment (Table 2).
Average final volumes were also lower (Figure 16). Perhaps

121
the decrease in percent germination resulted from fewer
viable megaspores in a population of older megaspores.
Another possible factor may have involved a less efficient
utilization of sorbitol as a carbon source in comparison to
the sugars. The lower final volume achieved on the sorbitol
treatments may corroborate the interpretation that it could
not be utilized so easily as the sugars.
4.7 CORRELATION BETWEEN RESPONSES
The high correlation (r= 0.81) between percent
germination and final volume provides evidence that both
responses may have resulted from the ability of a particular
nutritional treatment to enhance general metabolism. The
abilties to germinate successfully and to grow to large
sizes may both depend upon enhancement of synthesis and
degradation reactions within the tissues, thus producing a
high correlation between the two. Succesful germination
possibly also depends to a degree on the ability of the
megagametophyte tissue to imbibe water, and therefore may
not relate strictly to enhanced metabolism. The lower
correlations between germination speed and final volume (r=
0.61), and germination speed and% germination (r= 0.48),
perhaps can be explained by the amount of variation
occurring in germination speed as a result of using

122
megaspores of several developmental stages and levels of
viability. Another possible reason is that the final volume
achieved results from the ability of a treatment to enhance
cell divisions and general metabolism, while germination
speed may simply be a function of the ability of the tissues
to imbibe water and expand. Though both may respond to
supplemental nutrition in a positive manner they are not
directly linked to each other and correlation is lower
between the two. The low correlation between germination
speed and percent germination may also have similar causes.
4~8 REPEATED TREHALOSE TREATMENTS
Initial observations indicated some peculiar patterns of
growth and % germination on intermediate concentrations of
trehalose and sucrose. This prompted the repetition of the
trehalose treatments. Final data analyses, however, failed
to confirm the apparent patterns. None of the
concentrations of sucrose without B vitamins were
significantly different from each other in either % germination or average final volume. Three and 5%
trehalose, as well, did not produce significantly different
results from each other. There was no basis, therefore, for
considering these responses to be peculiar. The
intermediate concentrations of sucrose and trehalose were

123
not significantly depressed below the 1 and 5%
concentrations. However, the very different responses
obtained in the second trehalose treatments still require
discussion and a possible explanation.
Though highly speculative, the difference in results
between the first and second trehalose treatments may
possibly be explained in terms of light availability. In
the higher light environment of the growth chamber the
megagameotphytes may possibly have been light enhanced (see
Discussion - Fluorescence Analysis). In the lower light
environment of the laboratory benchtop metabolism may have
been altered. The presence of a light-absorbing pigment
(chlorophyll-a) perhaps indicates that light might be sensed
and utilized in some way. Dr. William Ruf of Indiana
University (personal communication - August, 1981) has
observed that of 100 megaspores of Selaginella pallescens
cultured in the dark, only one germinated. Percent
germination in the light was much higher. This suggests
that megagametophytes have some requirement for light.
Differences in growth of Selaginella megagametophytes seen
in cultures that differed in light quality, as well as
intensity (and in many other factors as well), may be
similar to the response of many types of algae which will
photosynthesize in high light environments, but when placed

124
under light-limiting conditions will revert to
photoheterotrophy (Droop, 1974; Neilson and Lewin, 1974).
Under these conditions algae will use available light to
provide the energy necessary to absorb organic materials
from the environment. Though this explanation for the
difference in results on the two trehalose treatments is
highly speculative, directions for further experimentation
are indicated.
4.9 THE PRESENCE OF CHLOROPHYLL-A IN MEGAGAMETOPHYTES
Fluorescence analysis has confirmed the presence of
chlorophyll-a in the tissue of the megagametophyte, and also
that different nutritional treatments affect the amount
present. Whether the megagametophyte of Selaginella is a
photosynthetically competent organism, capable of producing
carbohydrates, is an important question that must be
answered before the true nutritional status of this organism
is understood. If, in fact, the megagametophyte is
producing carbohydrates, then the inital premise of the
tissue's reliance on lipids, rather than on carbohydrates,
may be partially incorrect. Work is necessary to determine
if carbon dioxide is being taken up and incorporated into
organic compounds. Though no megagametophytes turned green
in this experiment, many became bright yellow. This was

125
probably due to carotenoid pigments which may have masked
the chlorophyll. The bright yellow color of many
megagametophytes indicated that these tissues were absorbing
blue light. Whether this light was used for photosynthetic
reactions is unknown at present.
The amount of chlorophyll-a present in the tissue was
greatest on 3% sorbitol with B vitamins (Table~).
Inhibition of chlorophyll synthesis appeared to increase
from the monosaccharides to the disaccharides. The
inhibition of chlorophyll synthesis on sucrose media has
been observed in other plants. Edelman and Hanson (1971)
observed that sucrose suppresses chlorophyll formation in
carrot callus cultures, and El Hinnawy (1974) determined
both that sucrose suppresses, and that glucose has little
effect, on chlorophyll synthesis in callus cultures of
Melilotus alba. In this experiment trehalose also inhibited
chlorophyll synthesis. The reason for the greater
inhibition of chlorophyll synthesis on disaccharides is
unknown. Perhaps there is some type of metabolic feedback
inhibition occurring more on disaccharides than on
mono saccharides.
Culture on sorbitol with B vitamins produced the highest
amounts of chlorophyll-a. This may be due to the nature of
the molecule, which is a polyalcohol. Sorbitol may not be

126
metabolized along the same biochemical pathways as sugars.
There may not be a similar type of hypothetical feedback
occurring, and chlorophyll synthesis may be enhanced rather
than inhibited. Further work on the presence of
chlorophyll-a in the megagametophyte of Selaginella, and its
implications, is needed.
4.10 CELL SIZE ANALYSIS
The production of cells of the same cross-sectional area on
4 different substrate concentrations (0, 1, 3, and 5%
sorbitol) in megagametophytes of Selaginella indicates that
cell size here is under some internal control, and cannot be
altered simply by adjusting the osmotic concentration in the
environment. Therefore, the sizes of these cells result
from normal internal metabolism rather than from osmotic
conditions of the external environment. Whittier (1964a)
observed the same result when he cultured fern gametophytes
on a wide range of sucrose concentrations.
The observation that cells were the same sizes on a
variety of treatments and in megagametophytes exhibiting
normal or enhanced growth, provides direct evidence that the
enhancement of growth results from the production of more,
but not bigger, cells.
127
4.11 CELLULAR ORGANIZATION OF THE TISSUES
Megagametophytes exhibiting normal growth appeared to be
organized as is generally recognized for Selaginella
(Bierhorst, 1971
Robert, 1971).
If the lipid reserve is the source of nutrition for young
sporophytes, then the complete cellularization of one normal
megagametophyte was curious. Apparently this
megagametophyte had utilized the lipid reserves, but growth
was not otherwise very different from normal. Foster and
Gifford (1974) state that the basal portion of the
megagametophyte does eventually become totally cellularized
if fertilization does not first occur, so this may not be so
unusual an observation at all.
Enhanced megagametophytes were highly cellularized. From
the patterns of thin-walled cells, divisions occurred
throughout the tissue. There were no indications of
mitoses, which suggests that the rate of cell division may
be low. The tissue could be described as a callus, in
agreement with the description by Wetmore and Morel (1951).
However this should not imply that the tissue was without
any organization. In fact, archegonia were restricted to
the proximal surface of the megagametophyte. The cause of
this polarity is unknown, but research involving the

128
determinants of archegonial initiation and location could
prove to be very interesting from a morphogenetic point of
view.
4.12 THE ORIGINAL HYPOTHESIS VERSUS THE RESULTS
The original intent of this experiment was to determine
if manipulation of nutrition could alter development of the
gametophyte of a heterosporous plant in a manner that would
lend support to Lang's hypothesis. Culturing the
megagametophytes of Selaginella on supplemental
carbohydrates, with and without the enhancement provided by
B vitamins, has produced results that would seem, at first,
to fail to support Lang's hypothesis. Supplying
megagametophytes with carbohydrates, and possibly enhancing
their ability to use them, produced larger megagametophytes
with no indication of sporophytic development.
The possible explanations for the failure of apogamy to
be induced in these series of experiments, using only
Selaginella martensii, may be several. The first one
involves a misinterpretation of the actual nutritional
conditions that may exist during the inceptions of the 2
generations. The presence of a large amount of lipid
material in the megagametophyte led to my presumption that
lipid-based nutrition may have helped determine gametophyte

129
morphology, and the presence of carbohydrates in the
sporophyte were presumed to determine this morphology.
Perhaps the actual situation is different. Future work
should involve culture of megaspores on lipids. The actual
source of nutrition for megagametophytes, whether from the
lipid reserve, any starch grains in the cells, or possibly
even some amount of photosynthesis, needs to be determined.
Normally the most basal areas of the lipid reserve do not
cellularize until fertilization and the beginning of
sporophyte development (Foster and Gifford, 1974). The
occurrence of cellularization at this point may indicate
that the nutrition stored in the reserve is being made
available to the developing sporophyte for early growth and
development. If the megagametophyte can be shown to derive
nourishment from starch grains, or photosynthesis, then
perhaps the real function of the lipid reserve is to give
the embryo the resources necessary to reorganize sporophyte
morphology. Whether the maintenance of gametophyte
morphology is a result of a loss of organization due to some
type of nutritional starvation of the tissue is unknown.
The culture of sporophyte tissue on very low levels of
carbohydrates in the dark might provide further observations
concerning the ability of nutritional level to determine
morphology.

130
Another possible explanation of why apogamy was not
induced in megagametophytes of Selaginella martensii could
derive from the reason why apogamy does occur in other
plants. Gametophytes of some ferns, and of some species of
Lycopodium, can produce sporophytes without fertilization.
In these instances, both gametophytes and sporophytes will
contain the same amount of genetic material. These plants
also tend to have high ploidy levels (Manton, 1950). In
some species of Lycopodium the haploid number of chromosomes
is 104, 110, or 136. There is evidence that these plants
are polyploid. Halving and doubling the chromosome number
can not be considered to produce truly haploid and diploid
organisms. If a gametophyte is diploid and the sporophyte
tetraploid, for example, a reversion to sporophytic growth
might be a relatively simple event in the gametophyte
tissue. In these cases the alternation of dissimilar
generations may occur as a result of the normal
environmental differences described by Lang (1909). Perhaps
the control of ploidy level over morphology may have been
weakened because the gametophyte is no longer really
haploid, and the sporophyte in no longer really diploid.
Cultural manipulation of gametophytes on high sugar
concentrations may easily disrupt the normal alternation of
generations. Ploidy level may determine gametophyte versus
131
sporophyte morphology, but only when the two generations are
truly haploid and diploid. Selaginella, on the other hand,
has low numbers of chromosomes, and there is little
indication of polyploidy in any of the species examined
(Jermy, et. al., 1967). In most species of Selaginella the
haploid number of chromosomes is 8, 9, 10, or 11. The
megagametophyte, as well as having half the number of
chromosomes as the sporophyte, may actually be haploid.
Manipulation of nutrition in this case may not be enough to
convert growth to the sporophytic mode. One way of testing
Lang's hypothesis more effectively may involve obtaining
diploid gametophyte tissue by culturing the sporophyte under
conditions of low light and low nutrient availability. If
this occurs the possible control of the ploidy level over
morphology may be loosened, and cultural manipulations of
the type carried out in the present series of experiments
may prove more fruitful in determining the validity of
Lang's hypothesis.
One xerically-adapted species of Selaginella (~.
rupestris) has been described, in which microspores are
apparently never produced (Webster and Steeves, 1974).
Sporelings are produced, however, through either
parthenogenesis or apogamy. This indicates that under
conditions of extreme stress some species of Selaginella can
132
adapt to survive in a similar manner as homosporous plants.
Determining the ploidy level of megagametophytes of these
xeric species would be of great interest, as would growing
them under various nutritional regimes.
Finally, despite all the possibilities mentioned to
explain why apogamy did not occur in Selaginella, a
re-evaluation of Lang's hypothesis may be in order. The
amount of supplemental nutrition most likely made available
to megagametophytes cultured on sugars with B vitamins must
have been very great. Even with this great increase of
available energy, megagametophyte morphology was still
maintained. Though Lang's hypothesis seems to fit well the
experimental and empirical data from homosporous plants, it
may be too simplistic for the heterosporous plants. One
consistent distinguishing feature between homosporous and
heterosporous plants is that homosporous gametophytes are
exosporic in their development, and heterosporous
gametophytes are endosporic. These two different
developmental paths diverged hundreds of millions of years
ago (e.g. Selaginella has existed since Middle
Pennsylvanian time, about 300 million years ago), and
heterosporous gametophytes have probably been selected for
remaining reduced in size. Although many homosporous groups
have produced heterosporous derivatives, the reverse has

133
never happened. The heterosporous plants benefited from
separation of the sexes, allowing outcrossing to occur more
frequently. Heterosporous gametophytes are reproductively
mature when shed, and are capable of producing sporophyte
offspring almost immediately after germination. They are
thus well adapted both for growth in low light, and for
short, dry growing seasons. The megagametophyte remained
within the megaspore wall, which provided a protective
barrier for the highly nutritional lipid reserve tissue
within. Constant selective pressure would favor those that
remained small and endosporic. Thus, after millions of
years of natural selection, the morphology of the
megagarnetophyte generation may be too deeply entrenched to
allow easy disruption of the normal alternation of
generations.

Chapter V
CONCLUSIONS
Megagametophytes of Selaginella martensii are capable of
enhanced growth on several types of carbon sources. Glucose
and trehalose without B vitamins increase % germination of
megaspores, and final volumes of tissue, over that on simple
mineral salts medium (K medium). Sucrose appeared to lack
any growth enhancing properties. With B vitamins, the 3
sugars and sorbitol enhance all aspects of growth over K
medium. Whether this indicates that B vitamins facilitate
metabolism of these carbon sources is unclear, but
suggestive.
Some megagametophytes of Selaginella martensii contain
chlorophyll-a, and the amount present varies according to
the type of carbon source on which the tissue is cultured.
Sorbitol treatments produced the most chlorophyll-a, and
sucrose treatments produced the least. Whether
megagametophytes are capable of photosynthesis is presently
unknown. A detailed analysis is necessary in order to more
fully understand the nutritional status of this organism.
Response to culture on particular sugars may vary with
changes in the cultures conditions. Different light levels
may have been responsible for observed differences in
134

135
response to trehalose. Determination of the light sensitive
reactions that may exist in megagametophytes is necessary to
provide important information on their growth and
development.
Comparisons of megagametophytes exhibiting normal and
enhanced growth indicated that, since cell sizes were the
same, larger megagametophytes are produced through the
production of more cells.
Megagametophytes cultured on K medium exhibited an
internal anatomy that agreed with past descriptions for
Selaginella. Megagametophytes exhibiting enhanced growth
were highly cellularized organisms, contained archegonia
with eggs, and displayed a pattern of cell divisions
throughout the tissue rather than at localized sites.
Apogamy did not occur with culture on supplemental
nutrition. This may have been due to either a
misinterpretation of the conditions necessary to induce
apogamy, or Lang's hypothesis is too simplistic to explain
alternation of generations in this heterosporous plant, or
perhaps the species of Selaginella chosen was less
susceptible to manipulation than others might have been.

LITERATURE CITED
Bell, P. R. 1959. The Experimental Investigation of the Pteridophyte Life Cycle. Journal of the Linnean Society (Bot.) 56: 188-203
Berwyn, Graeme P. and Jerome P. Miksche. 1976. Botanical Microtechnique and Cytochemistry. Iowa State Press. Ames, Iowa.
Bierhorst, David W. Morphology of Vascular Plants 1971. MacMillan Publishers. New York.
Bold, Harold C. 1973. Morphology of Plants. 3rd Edition. Harper & Row, Publishers. New York.
Bristow, J. Micheal. 1962. The Controlled In Vitro Differentiation of Callus Derived From ~ Fern, Pteris cretica ~., into Gametophytic or Sporophytic Tissues. Developmental Biology. 4: 361
Caponetti, J. D. 1977. Cultural Media (Natural and Synthetic): Pteridophytes. CRC Handbook Series in Nutrition and Food. Section G., Volume III: 569-574
Cosgrave, D. J. 1980. Inositol Phosphates: Their Chemistry, Biochemistry and Physiology. Elsevier Scientific Publishing Company. Amsterdam, Oxford, New York.
DeMaggio, A. E. 1963. Morphogenetic Factors Influencing the Development of
Fern Embryos. Journal of the Linnean Society (Bot.). 58(373): 361-374
DeMaggio, A. E. and R. H. Wetmore. 1961. Morphogenetic Studies on the Fern Todea barbara. III. Experimental Embryology. American Journal of Botany. 48(7): 551-565
Droop, M. R. 1974. Heterotrophy of Carbon. in 'Algal Physiology and Biochemistry'. W.D.P. Stewart (Editor). University of California Press. Berkeley, California.
Edelman, J. and A. D. Hanson. 1971. Sucrose Suppression of Chlorophyll Synthesis in Carrot Callus Culture. Planta (Berl.). 98: 150-156
136

137
El Hinnawy, E. 1974. Ef~ect of So~e Gro\-:th Regulating Substances and Carbohydrates ~~ ~blo~ophyll Production in Melilotus alba (Desr.) Callus Tis_§_ue Cultures. Z. Pflanzenphysiol. 74: 95-105
Foster, A. S. and E. M. Gifford. Vascular Plants. 2nd Edition. San Francisco, U.S.A.
Comparative Morphology of 1974. Harper & Row, Inc.
Freeberg, J. A. 1957. The Apogamous Development of Sporelings ?f Lycop~sium cernuum ~., ~· ~~~_p)anatum var. flabelliforme Fernald ~nd L. selago L. in ~itro. Phytomorphology. 217-229
Jermy A. C. , Keith Jones, F. L. S., and C. Colden. 1967. Cytomorph~_l_gical Variation in Selaginella. Journal of the Linnean Society (Bot.). 60(382): 147-158
Lang, W. H. 1909. In Discussion on "Alternation of Generations" at the Linnean Society. New Phytologist. 8: 104-116
Lehninger, Albert A. 1975. Bio~hemistry. 2nd Edition. The Johns Hopkins University School of Medicine. Worth Publishers.
Manton, I. 1950. Pterido~"t:__~.
Problem_§_ of Cytology ~!?:s! Evolution in the Cambridge University Press. London.
Morel, G. and R. H. Wetmore. 1951. Fern Callus Tissue Culture. American Journal of Botany. 38: 141-143
Morlang, Charles, Jr. 1967. Hvbridiza~ion, Polyploidy, and Adventitious Gr2wth in the Genus Asplenium. American Journal of Botany. 54(7): 887-897
Neilson, A. H. and R. A. Lewin. 1974. !he Uptake and Utilization of Organic g_?!_~_p_o_~ e_y ~lg~~: An Essay in Comparative Bioche_EllS!.!:Y· Phycologia. 13(3): 227-264
Robert, D. 1971. Le 9ametophyte _fem_elle S~ Selaginella kraussiana Kunze A.Br. I: Organisation Generale de la Megaspore:- 1~ Di~bragme et L'Endospore. ~es Reserves. Revue Cytologie et Biologie Vegetale. 34: 93-164
-1971. II: Organisation Bistologique du Tissu Reproducteur et Principau~ Aspects de ~~ Dedifferenciation Cell~baire Preparatoire ~ l'Oogenese. Revue Cytiologie et Biologie Vegetale. 34: 189-232

138
-1972. III. Ultrastructure et Devellopement des Archegones. 35: 165-232
Salisbury, Frank B. and Cleon W. Ross. 1978. Plant Physiology. 2nd Edition. Wadsworth Publishing Co. Inc. Belmont, California.
Steil, W. N. 1939. Apogamy, Apospory, and Parthenogenesis in the Pteridophytes. Botanical Review. 5: 433-453
Stetler, D. A. and W. M. Laetsch. 1965. Kinetin-Induced Chloroplast Maturation in Cultures of Tobacco Tissue. Science. 149(3690): 1387-1388
Roberts, R. M. and K. C. Tovey. 1969. Trehalase Activity in Selaginella martensii. Archives of Biochemistry and Biophysics. 133: 408-412
Thomas, E. and M.R. Davey. 1975. From Single Cells to Plants. Wykeham Publications (London) Ltd. London, Amsterdam.
Webster, Terry R. 1967. The Induction of Selaginella Sporelings Under Greenhouse and Field Conditions. American Fern Journal. 57(4): 161-166
-1979. An Artificial Crossing Techniaue for Selaginella. American Fern Journal. 69(1): 9-13
Webster, Terry R. and Taylor A. Steeves. 1974. Reproductive Strategy in ~ Xerophytic Selaginella. American Journal of Botany. 61(5 suppl): 39
Wetmore, Ralph and Georges Morel. 1951. Sur la Culture du Gametophyte de Selaginelle. Compte Rendu, Academie des Sciences. Seance du 30: 430-431
White, Eleanor and G. H. N. Towers. 1967. Comparative Biochemistry of the Lycopods. Phytochemistry. 6: 663-667
White, Richard A. 1971. Experimental and Developmental Studies of the Fern Sporophyte. Botanical Review. 25 ( 2); 246-249
Whittier, Dean P. 1964. The Influence of Cultural Conditions on the Induction of Apogamv in Pteridium Gametophytes American Journal of Botany. 51(7): 730-736
139
-1964a. The Effect of Sucrose on Apogamy in Cyrtomium falcatum Presl. American Fern Journal. 54: 20-25
-1965. Obligate Apogamy in Cheilanthes tomentosa and C. alabamensis. Botanical Gazette. -- -126(4): 275-281
-1971. The Value of Ferns in an --· Understanding of Alternation of Generations. Bioscience. 21(5): 225-227
-1975. The Influence of Osmotic Conditions on Induced Apogamy in Pteridium Gametophytes. Phytomorphology. 25(2): 246-249
-1978. Apospory in Haploid Leaves of Botrychium. Phytomorphology. 28(2): 215-219
Whittier, Dean P. and Taylor A. Steeves. 1960. The Induction of Apogamy in the Bracken Fern. Canadian Journal of Botany. 38: 925-930
Appendix A
MEDIA COMPONENTS
I.Knudson's Mineral Salts Medium (Caponetti, 1977)
A. Macroelement stock solution (4x strength)
Ingredient
(1) Ca(N03)z4HzO ( 2) (NH 4) 2 SO 4 (3) MgS04-7H20 (4) Water to make
B. Phosphate Stock Solution
Ingredient
(1) K2HP0 4 (2) Water to make
C. Microelement Stock Solution
Ingredient
( 1) H 2so4 (cone. ) (2) Mnc12 -4H2o ( 3) H 3BO 3 ( 4} Zn SO 4 - 7H zO (5) CoClz-6HzO (6) CuClz-2HzO (7) Na2Mo04-2HzO (8) Water to make
D. Ferric Citrate Stock Solution
Ingredient
(1) FeC 6H5 o 7-5H20 (2) Water to make
140
Amount
2.000 gm 1. 000 gm 0.500 gm 1000.0 ml
Amount
25.000 gm 100.0 ml
Amount
0.500 ml 2.500 gm 2.000 gm 0.050 gm 0.030 gm 0.015 gm 0.025 gm 1000.0 ml
Amount
2.500 gm 100.0 ml

141
E. Final Medium
Ingredient
(1) Macroelement solution x4 (2) Water (3) Phosphate solution (4) Microelement solution (S) Ferric citrate solution (6) Water to make
Adjust pH to S.S. Solidify with 0.9% Agar.
Amount
2SO.O ml 700.0 ml
O.S ml 0. S ml 0.4 ml
1000.0 ml
II.B Vitamin Mixture (Wetmore and Morel, 19Sl)
Ingredient Amount
( 1) Thiamine 10 ""." 6 gm/liter* ( 2 ) Niacin l0-6 II
( 3 ) Pantothenate l0-6 II
( 4) Pyridoxine 10-6 II
( s ) Biotin 10 -a II
( 6 ) Inositol 10 - 4 II
* DeMaggio, personal communication.

Appendix B
GERMINATION RATE AND VOLUME MEASUREMENTS - ALL DATA
Treatment Germination Volume(_x 10- 2 mm 3 )
Rate (Days) Yl Y2 Y3 Y4 Y5 --------- ----------- ----- ----- ----- ----- -----K
(3)IIin** 53 2.04 2.04 2.36 2.54 2.73 (4)Iout 20 2.65 3.25 3.60 3.94 3.94 (5)IVout 37 6.09 6.09 6.09 6.09 6.09 (6)IIin 37 5.65 6.63 6.63 6.63 6.63 (7)IIIout 25 3.54 3.83 3.83 4.16 4.16 (lO)Iin 25 3.72 4.22 5.10 5.10 5.10 (9)Iin 35 2.91 2.91 3.45 3.45 3.45 (ll)IIIout 04 3.25 3.25 3.25 3.25 3.25
----- ----- ----- ----- -----mean= 29.5 3.73 4.03 4.29 4.40 4.42
±1 S.D.= 14.5 1.43 1. 58 1. 49 1. 43 1. 39
(* = Yl through Y6 represent volume measurements taken
Y6* -----2.91 3.94 6.09 6.63 4.16 5.10 3.45 3.25
-----4.44
1. 36
at two-week periods from the day of germination through the twelfth week.)
(** =this notation is used to keep track of each germinated megaspore. For example, K(3)IIin means the megaspore growing on plain mineral salts medium, dish number 3, the second quarter of the dish, the inner position on the agar.)
142

143
K+B (l)I 31 2 .13 2.65 2.65 3.25 3.25 3.25 (2)I 31 3.25 3.25 4.70 4.70 5.37 5.37 (3)IIin 32 4.70 4. 70 4.70 4.70 4.70 4.70 (3)IIout 11 3.60 5.16 6.77 7.44 7.44 7.44 ( 4) I in 24 2.65 3.25 3.94 3.94 3.94 3.94 ( 4) I Vin 39 2.65 2.65 2.65 2.65 2.65 2.65 (5)IIout 10 2.81 4.16 4.34 4.34 4.34 4.34 (5)IVin 09 3.88 5.16 5.16 5.37 5.58 5.58 (7)Iin 05 2.51 4.58 4.70 4.70 4.70 4.70 (7)IIIin 13 3.25 4.97 5.94 6.63 6.63 6.63
----- ----- ----- ----- ----- ----- -----mean= 20.5 3.14 4.05 4.56 4.77 4.86 4.86
±1 S.D.= 12.2 0.76 1. 01 1.29 1.44 1. 46 1. 46
lG (l)Iin 47 2.65 2.65 2.65 2.65 2.65 2.65 (2)Iout 51 3.60 3.60 3.60 3.60 3.60 3.60 (2)IVout 05 4.40 7.03 12.48 12.48 12.48 12.48 (3)Iin 17 2.69 3.25 3.60 6.09 7.11 7.11 (3)IIIout 10 2.53 3.51 4.34 4.34 4. 34 4.34 (3)IIout 13 2.49 3.94 3.94 3.94 3.94 3.94 (4)IIin 10 3.39 7.11 8.07 8.07 8.07 8.80 ( 4) IVin 24 3.52 3.52 3.52 3.52 3.52 3.52 ( 4) IVout 10 3 .12 3.88 4.11 4.11 4.11 4.11 (5)IIIin 35 3.25 3.25 3.25 3.25 3.25 3.25 (6)IIin 08 3.05 10.22 13.35 15.06 18.90 18.90 (6)IIIout 05 3.23 3.51 3.51 3.51 3.51 3.51
----- ----- ----- ----- ----- -----mean= 19.6 3.16 4.62 5.54 5.89 6.29 6.35
±1 S.D.= 16.2 0.54 2.27 3.70 4.00 4.87 4.89

144
3G (2)IVout 05 2.32 2.87 3.94 3.94 3.94 3.94 (4)IIin 08 3.34 4.16 4.16 4.16 4.16 4.16 (4)IIIout 46 3.45 3.45 3.45 3.45 3.45 3.45 (6)IVout 16 2.83 2.83 3.11 3.11 3.11 3.11 (7)Iout 42 4.34 5.51 5.51 5.51 5.51 5.51 (7)IIin 27 3.94 4. 34 4.90 4.90 4.90 4.90 (7)IIIin 42 4.04 4.58 4.58 4.58 4.58 4.58 (7)IIIout 18 4.04 4.58 4.58 4.58 4.58 4.58 (7)IVin 37 3.88 3.88 3.88 3.88 3.88 3.88 (7)IVout 37 3.94 5.16 5.58 5.58 5.58 5.58 (lO)Iout 27 4.04 4.70 5.51 5.51 5.51 5.51
----- ----- ----- ----- ----- ----- -----mean= 27.7 3.65 4.19 4.47 4.47 4.47 4.47
±1 S.D.= 14.3 0.61 0.87 0.85 0.85 0.85 0.85
5G (3)Iout 13 2.73 3.66 3.66 3.66 3.66 3.66 (3)IIout 24 3.51 4.58 4.58 4.58 4.58 4.58 (5)IIIin 26 3.05 3.51 4.04 4.04 4.04 4.04 (7)IIIout 15 3.05 3.72 3.72 3.72 3.72 3.72 (7)IVin 16 4.32 11.09 14.11 16.04 16.04 16.04
----- ----- ----- ----- ----- ----- -----mean= 18.8 3.33 5.31 6.02 6.41 6.41 6.41
±1 S.D.= 5.8 0.62 3.26 4.54 5.40 5.40 5.40
lS (l)IIin 26 3.25 3.94 3.94 3.94 3.94 3.94 (2)IIin 27 3.05 3.72 4.04 4.04 4.04 4.04 (2)IV 39 3.51 4.04 5.16 5.41 5.65 5.65 (4)IVin 08 2.69 3.51 3.51 3.51 4.04 4.04 (5)IIout 15 4.70 5.65 5.65 5.65 5.65 5.65 (5)IVin 06 3.34 4.04 4.04 4.04 4.04 4.04 (7)Iin 12 3.94 4.16 4.16 4.58 4.58 4.58
----- ----- ----- ----- ----- ----- -----mean= 17.5 3.37 3.97 4.15 4.24 4.33 4.33
±1 S.D.= 11. 9 0.70 0.82 0.91 0.96 0.96 0.96

145
3S (3)IIin 43 3.72 4.58 4.58 4.58 4.58 4.58 (3)IIIout 43 3.05 3.35 3.35 3.35 3.35 3.35 (S)Iin 36 2.91 2.91 2.91 2.91 2.91 2.91 (S)IVout 18 2.65 3.25 3.25 3.25 3.25 3.25 (8)IIout 27 3.40 3.40 3.40 3.40 3.40 3.40 ( 8) I.Vin 37 3.25 3.25 3.25 3.25 3.25 3.25
----- ----- ----- ----- ----- ----- -----mean= 34.0 3.16 3.46 3.46 3.47 3.47 3.48
±1 S.D.= 9.8 0.38 0.58 0.58 0.57 0.57 0.57
SS (2)! 22 1. 89 2 .13 2.13 2.13 2 .13 2.13 (3)Iout 33 2.65 2.65 2.65 2.65 2.65 2.65 (3)IVin 52 3.40 3.40 3.40 3.40 3.40 3.40 (3)IVout 52 4.04 4.04 4.58 4.58 4.58 4.58 ( 4) I out 24 3.45 3.51 3.66 3.66 3.66 3.66 (4)IIIin 24 2.83 2.91 2.91 3.40 3.40 3.40 (4)IVin 24 2.28 2.65 3.40 3.66 3.66 3.66 (7)IVout 10 2.28 2.91 2.91 2.91 2.91 2.91 (8)Iin 14 2.28 2.28 2.28 2.28 2.28 2.28 (9)IIIout 54 4.34 4.70 4.70 4.70 4.70 4.70
----- ----- ----- ----- ----- ----- -----mean= 30.9 2.94 3.12 3.26 3.34 3.34 3.34
±1.S.D.= 16.2 0.83 0.80 0.87 0.87 0.87 0.87

146
lT (l)I 17 2.S3 4.97 7.62 9.09 10.43 11. 31 (l)II 21 4.33 13.10 13.88 14.6S 16.32 18.11 (2)III 22 3.04 3.94 3.94 3.94 3.94 3.94 (4)Iout 32 4.04 4.04 4.70 4.70 4.70 4.70 (4)Iin 10 1. 92 3.94 6.71 6.71 7.44 7.44 (4)IIIout 72 2.S3 2.S3 2.S3 2.S3 2.S3 2.S3 (4)IVout 42 3.66 3.66 3.66 3.66 3.66 3.66 ( 4) IVin 71 2.73 2.73 2.73 2.73 2.73 2.73 (S)Iin OS 2.S2 4.46 7.98 11. 77 17.36 20. 21 (S)IIout 12 3. 34 6.01 7.98 9.69 9.69 9.69 (S)IIIin 18 4.46 7.98 8.S3 8.S3 8.S3 8.S3 (S)IIIout OS 3.2S S.65 13.10 21.22 24.47 24.47 (S)IVin 09 3.13 7.98 9.21 10.43 10.43 10.98
----- ----- ----- ----- ----- ----- -----mean= 2S.8 3.19 S.46 7.12 8.43 9.40 9.87
±1 S.D.= 22.8 0.77 2.87 3.63 S.37 6.S9 7.10
3T (3)IVin 10 2.32 2.32 2.32 2.32 2.32 2.32
----- ----- ----- ----- ----- ----- -----mean= 10 2.32 2.32 2.32 2.32 2.32 2.32
±1 S.D.=
ST (l)III S8 4.04 4.70 4.70 4.70 4.70 4.70 (l)IV 31 3.S6 3.S6 3.S6 3.S6 3.S6 3.S6 (2)IIIin 30 3.0S 4.04 4.04 4.04 4.04 4.04 (3)IIIin 51 3.40 3.40 4.70 4.97 S.24 5.Sl (3)IIIout 17 2.73 3.40 3.40 3.40 3.40 3.40 (3)IVin 32 4.40 4.40 4.40 4.40 4.40 4.40 (4)IIIin lS 2.49 3.40 3.40 3.40 3.40 3.40 ( 6) IVout Sl 4.04 4.04 4.04 4.04 4.04 4.04 (7)Iin 27 3.40 3.66 4.04 4.34 4.34 4.34
----- ----- ----- ----- ----- ----- -----mean= 34.7 3.46 3.84 4.03 4.09 4.12 4.lS
±1 S.D.= lS.3 0.63 0.48 0.Sl 0.S6 0.62 0.68

147
lG+B (2)Iin 15 2.61 3.40 3.66 4.41 5.16 5.16 (2)IIout 13 2.69 6.79 8.53 10.75 12.97 18.11 (4)IIout 29 4.70 5.51 5.51 5.76 6.01 6.01 (4)IIIin 05 2.73 6.31 11. 66 16.32 21.22 23.17 (4)IIIout 15 3.94 5.16 5.51 5.51 5.51 5.51 (4)IVin 10 3.85 12.36 13.99 16.05 18.11 21. 22 ( 4) IVout 05 3.25 8.53 9.09 10.98 13.99 17.36 (6)Iin 11 3.94 9.69 9.69 15.61 20.04 24.47 (6)IIin 06 2.89 8.53 13.99 19.91 25.82 37.93 (6)IIout 06 2.74 8.53 10.43 14.27 18.11 29.30 (6)IIIout 16 2.65 4.18 5.10 6.01 6.01 6.01 (6)IVin 14 3.45 4.70 5.51 6.39 7.44 9.09 ( 6) IVout 14 3.45 6.39 9.09 13.10 14.65 15.61 (7)Iout 08 3.66 3.66 3.66 3.66 3.66 3.66
----- ----- ----- ----- ----- ----- -----mean= 11. 5 3.37 7.12 9.04 11. 57 13.87 16.98
±1 S.D.= 6.3 0.64 2.97 4.58 6.30 8.13 10.98
3G+B (4)Iout 14 2.89 16.32 22.27 29.23 36.18 45.76 (4)IVin 15 2.33 4.34 5.94 6.17 6.39 7.44 (4)IIout 15 2.88 4.70 5.51 7.02 8.53 11. 77 (4)IIIout 50 3.66 3.66 3.66 3.66 3.66 3.66 (5)Iout 11 3.34 13.10 15.61 15.61 15.61 15.61 (5)IIIin 45 2.73 2.73 2.73 2.73 2.73 2.73 (5)IVin 17 1. 65 2.28 2.28 2.53 2.53 2.53 (6)IIIout 11 2.65 4.34 4.34 4.34 4.34 4.34
----- ----- ----- ----- ----- ----- -----mean= 22.3 2.77 6.43 7.79 8.91 10.00 11. 73
±1 S.D.= 15.8 0.61 5.25 7.21 9.23 11. 42 14.53
5G+B (l)III 20 2.73 4.40 5.16 5.16 5.16 5.16 ( 3 )I in 11 3.25 3.94 7.98 10.43 10.43 10.43 ( 4 )Iin 13 2.73 4.46 19.22 24.47 39.47 48.10 (4)IIout 23 2.83 4.34 6.79 22.27 29.30 37.93 (4)IVin 39 3.05 3.05 4.34 4.34 4.34 4.34 (5)IIIout 09 5.03 11. 77 17.36 21.22 21.22 21.22 (5)IVin 05 2.32 3.94 9.69 12.36 13.10 13.10
----- ----- ----- ----- ----- ----- -----mean= 17.1 3.13 5.12 10.08 14.32 17.57 20.04
±1 S.D.= 11. 5 0.88 2.97 5.90 8.33 13.10 16.92

148
lS+B (3)Iout 08 6.05 7.70 19.22 23.74 28.25 32.16 (3)IIIout 11 3.05 4. 70 4.70 4.70 4.70 4.70 ( 4) I out 06 2.69 5.51 9.09 10.43 11.77 12.36 (4)IIin 06 2.89 4.70 6.01 8.22 10.43 15.61 (4)IIout 08 2.69 3.45 11.77 12.44 13.10 13.10 (4)IVin 08 2.83 3.45 11.80 16.01 20.21 22.30 (5)IIIin 17 3.25 4.04 4.19 4.34 4. 70 4.70 (5)IIIout 11 3.45 3.83 7.44 8.53 9.76 10.98 (6)Iout 14 3.05 3.66 5.51 10.43 11. 77 11. 77 (6)IVout 27 5.16 6.01 6.79 11. 77 11. 77 11. 77 (7)Iin 21 3.66 4.04 6.79 8.53 8.53 8.53 (7)IIin 08 2.65 3.40 4.70 9.09 9.69 9.69 (7)IVin 13 2.73 3.40 3.40 3.40 3.40 3.40
----- ----- ----- ----- ----- ----- -----mean= 12.2 3.40 4.45 7.80 10.13 11. 39 12.39
±1 S.D.= 6.3 1.04 1.28 4.34 5.37 6.67 7.77
3S+B (l)Iin 20 2.73 5.65 6.79 6.79 6.79 7.44 (l)IIIin 25 2.65 4.34 6.01 6.39 6.39 6.39 (l)IV 25 2.29 2.73 2.73 2.73 2.73 2.73 (3)Iin 21 3.05 3.66 4.04 4.34 4. 52 4.70 (3)IIout 19 3.33 7.98 8.53 9.11 9.69 12.36 (3)IIIin 14 2.73 3.45 6.01 7.44 7.44 7.98 ( 4) I in 20 2.65 3.05 4.04 4.34 4.34 4. 34 ( 4) !out 18 2.49 9.09 13.99 15.16 16.32 19.22 (4)IVin 13 1. 92 4.46 9.09 12.40 18.11 23.17 (5)IIIout 17 3.94 7.98 12.36 22.27 24.05 25.82 (6)IIIout 16 5.51 5.51 6.79 6.79 6.79 6.79 (7)Iout 14 5.51 5.51 8.53 9.11 9.69 9.69 (7)IVin 06 6.01 7.98 8.54 9.09 10.43 10.43
----- ----- ----- ----- ----- ----- -----mean= 17.5 3.28 5.53 7.50 8.92 9.79 10.85
±1 S.D.= 5.2 1. 22 2.15 3.21 5.22 6.18 7.37

149
5S+B (3)Iout 13 2.32 3.45 6.79 7.44 13.10 17.36 (3)IIIin 10 1. 92 3.05 3.05 3.05 4.04 17.36 (3)IVout 18 2.89 5.16 9.69 14.46 19.22 22.27 (4)IIin 08 2.73 5.65 7.44 7.98 8.53 9.09 (4)IIout 15 2.28 3.66 4.04 5.16 5. 34 5.51 (4)IIIin 08 2.73 4.97 9.09 12.36 14.65 22.27 (7)IIIout 56 3.40 3.66 3.66 3.66 3.66 3.66 (8)IIin 51 3.66 3.66 3.66 3.66 3.66 3.66
----- ----- ----- ----- ----- ----- -----mean= 22.4 2.74 4.16 5.93 7.22 9.02 12.65
±1 S.D.= 19.6 0.58 0.95 2.65 4.25 5.96 8.06
lT+B ( 1) IV 12 3.83 4.97 11. 20 14.65 14.65 14.65 (2)Iin 15 1. 92 2.32 3.45 5.16 6.79 8.53 (2)IIIin 10 2.73 5.10 8.53 13.10 30.60 70.47 (5)Iin 09 2.59 8.53 11. 77 16.50 21. 22 28.25 (5)IIin 09 2.89 6.95 10.43 15.32 20.21 33.31 (6)IIIin 07 3.01 5.65 6.01 8.53 8.53 8.53 (6)IVin 07 2.73 6.31 8.53 10.15 11. 77 15.61 (7)Iin 11 3.25 4.46 4.70 4.70 6.01 6.01 (7)IIIout 06 1. 74 4.46 6.01 7.44 8.57 9.69 (7)IVout 03 2.53 3.05 3.05 3.05 3.05 3.05
----- ----- ----- ----- ----- ----- -----mean= 8.9 2.72 5.18 7.37 9.86 13.14 19.81
±1 S.D.= 3.4 0.60 1. 82 3.18 4.83 8.56 20.26

150
3T+B (l)IIIin 10 2.32 5.10 8.53 10.43 11. 77 11. 77 (l)IIIout 21 4.40 5.23 5.51 6.39 7.74 9.09 (l)IVin 10 2.73 5.10 9.69 18.11 24.47 24.47 (2)Iin 10 1. 92 3.25 6.01 7.98 9.09 9.69 (2)IIIout 10 1. 92 4.40 5.16 6.01 9.09 9.09 (2)IVin 10 2.73 8.71 11.77 18.11 22.27 37.80 (3)IIin 05 2.32 3.60 4.34 4.70 4.70 4.70 (3)IIIout 15 11.54 18.59 20.21 20.21 20.21 20.21 (3)IVout 10 3.01 5.51 6.01 6.73 7.44 7.44 (5)IIin 17 4.16 4.70 8.53 17.36 20.27 23.17 (5)IIout 06 2.32 4.65 10.43 12.54 14.65 30.60 (5)IIIin 14 5.79 6.95 9.69 13.10 13.10 13.10 (6)IIIin 11 3.25 3.25 3.25 3.25 3.25 3.25 (7)IIout 09 4.40 6.01 10.98 25.82 31.88 37.93 (7)IVin 09 4.40 5.72 6.79 7.98 7.98 7.98 (7)IVout 09 3.83 6.95 13.99 22.63 22.63 22.63
----- ----- ----- ----- ----- ----- -----mean= 11. 0 3.82 6.11 8.81 12.58 14.41 17.06
±1 S.D.= 4.0 2.34 3.62 4.24 6.98 8.26 11. 33
5T+B (2)IIout 18 3.45 5.10 5.16 5.16 5.16 5.16 (2)IVout 10 2.73 3.88 4.34 4.34 4.34 4.34 ( 4) I in 31 3.01 5.16 6.39 6.92 7.45 7.98 (4)Iout 09 2.73 7.70 9.09 13.99 19.22 26.27 (4)IIin 09 3.01 11. 77 19.22 21.85 24.47 26.89 (5)IIin 11 3.25 4.04 4.04 4.04 4.04 4.04 (5)IIIout 19 6.39 13.99 18.58 23.17 29.13 35.09 (6)IIIout 08 3.25 4.16 4.43 4.70 6.39 7.19 (7)IVin 25 4.16 6.01 6.01 6.01 6.01 6.01 ( 7) IVout 11 3.25 5.10 6.01 6.39 6.39 6.39
----- ----- ----- ----- ----- ----- -----mean= 15.1 3.52 6.69 8.33 9.66 11. 26 12.94
±1 S.D.= 7.8 1. 09 3.48 5.76 7.35 9.33 11. 67

151
lSb+B (2)Iout 09 4.16 5.51 7.28 11. 77 12.36 12. 36 (3)Iin 43 4.58 5.51 7.44 7.98 8.26 8.53 (3)IIin 09 4.04 6.39 9.09 11. 77 13.99 19.22 (3)IIout 06 4.04 7.44 10.98 15.61 20.21 26.82 (3)IIIout 06 4.04 4.97 6.79 7.98 8.53 8.53 (4)Iin 10 3.88 5.51 6.79 8.53 10.43 13.99 (4)IIin 05 4.04 5.37 9.09 11. 77 12.36 13.10 (4)IIout 06 5.51 6.95 9.69 10.43 10.98 11. 77 (4)IIIin 05 4.04 5.37 7.98 10.98 11. 77 13.10 (5)IIout 20 5.16 5.51 6.39 6.39 6.39 6.39 (6)IIIin 06 3.51 4. 70 4.70 4.70 5.16 5.16 (8)IIout 10 4.04 4.04 5.51 5.51 5.51 5.51 (8)IVin 06 3.66 6.01 7.98 9.69 9.69, 9.69 ( 8) IVout 11 4.34 4.70 5.51 6.01 6.79 6.79 (9)Iout 05 3.05 3.66 4.04 4.34 4.34 4.34
----- ----- ----- ----- ----- ----- -----mean= 10.5 4.14 5.44 7.28 8.90 9.78 11.02
±1 S.D.= 9.8 0.60 1. 00 1. 92 3.20 4.13 5.97
3Sb+B (l)Iin 33 4.04 4.04 4.04 4.04 4.04 4.04 (4)IVin 15 3.40 4.40 5.16 6.01 6.79 7.44 ( 5) IVout 10 3.66 6.01 6.79 9.09 10.43 14.92 (6)IVout 06 4.70 5.37 5.51 5.51 6.01 6.01 (8)IIout 10 4.04 4.70 5.16 6.39 7.98" 9.09 (8)IIIout 14 4.04 4. 70 7.11 9.09 9.09 12. 36 (9)Iout 23 4.04 4. 34 6.79 7.98 7.98 7.98
----- ----- ----- ----- ----- ----- -----mean= 15.9 3.99 4.79 5.79 6.87 7.47 8.83
±1 S.D.= 9.3 0.40 0.68 1.13 1. 91 2.09 3.72

152
5Sb+B (l)IIin 06 3.66 4.16 5.16 6.01 6.01 6.39 ( 4) I in 06 3.66 4.16 5.51 6.79 6.79 6.79 (5)Iin 10 5.37 9.09 11. 77 13.10 14.65 15.61 (5)IIIin 33 4.58 5.16 5.51 5.51 5.51 5.51 (6)IVout 33 4.34 6.79 9.09 9.09 9.09 9.09 (7)Iin 23 4.34 4.70 5.16 5.16 5.16 5.16 (7)IVin 23 4.58 5.51 6.01 6.79 7.98 7.98 (9)Iout 23 3.66 4.04 4.70 4.70 4.70 4.70
----- ----- ----- ----- ----- ----- -----mean= 19.6 4.27 5.45 6.61 7.14 7.49 7.65
±1 S.D.= 11.1 0.60 1. 73 2.49 2.76 3.25 3.53
Sorbitol Control Treatment
3G+B (3)Iin 12 4.34 6.71 7.97 7.97 7.97 7.97 (3)IVin 08 4.16 6.39 6.92 7.98 7.98 7.98 (4)IImid 08 4.40 8.53 10.43 10.43 10.71 10.98 (6)Iout 27 4.04 6. 39 6.39 7.98 7.98 7.98 (6)I!Imid 10 3.66 7.98 13.99 22.27 23.37 24.47 (7)Imid 10 3.20 7.98 12.85 15.61 15.61 15.61 (9)!Iin 10 4.04 11. 77 25.82 33.31 33.31 33.31
----- ----- ----- ----- ----- ----- -----mean= 9.7 3.97 8.23 12.95 16.26 16.49 16.72
±1 S.D.= 1. 5 0.46 1. 92 6.90 9.99 10.09 10.22

153
Repeat Trehalose Treatments
lT (S)Iin 21 3.66 4.70 5.51 8.53 10.43 12.36 (S)IImid 23 3.66 3.66 4.04 4. 34 4.70 5.16
----- ----- ----- ----- ----- ----- -----mean= 22 3.66 4.18 4.78 6.44 7.57 8.76
±1 S.D.= 1. 41 0.00 0.74 1.04 2.95 4.04 5.09
3T (l)IVmid 13 6.01 6.79 12.36 13.10 16.32 21. 22 (2)IIIin 14 4.34 6.01 12.36 19.22 23.17 26.82 (2)IIImid 27 4. 34 5.16 5.16 5.51 5.51 5.51 ( 4) I I mid 26 4.34 4.34 4.34 4.34 4.34 4.34 (5)Iin 19 3.36 5.51 6.01 6.39 6.39 7.44 (6)Imid 19 4.04 6.79 9.09 14.00 16.32 17.36
----- ----- ----- ----- ----- ----- -----mean= 19.7 4.46 5.77 8.22 10.43 12.00 13.78
±1 S.D.= 5.84 0.87 0.96 3.69 5.91 7.48 9.34
ST 5T(l)Iin 33 6.01 6.39 6.78 6.78 6.78 6.78
(l)IVmid 12 4.70 6.79 13.99 16.32 18.11 20.21 (4)IIIout 22 4.34 6.79 6.79 7.44 7.44 7.44 (S)IVout 13 4.34 6. 39 8.53 9.69 11. 77 11. 77 (6)IIIout 19 4.34 12.36 13.99 19.20 22.27 24.47
----- ----- ----- ----- ----- ----- -----mean= 19.8 4. 75 7.74 10.02 11. 89 13.27 14.13
±1 S.D.= 8.47 0.72 2.59 3.70 5.56 6.76 7.88
Trehalose Control Treatment
K (l)Iout 22 3.05 3.66 4.04 4.04 4.04 4.04
' (l)IIin 23 3.66 4.70 4.70 5.51 5.51 5.51 (6)IVmid 13 5.16 5.16 5.16 5.16 5.16 5.16
----- ----- ----- ----- ----- ----- -----mean= 19.3 3.96 4.51 4.63 4.90 4.90 4.90
±1 S.D.= 5.51 1. 09 0.77 0.56 0.77 0.77 0.77
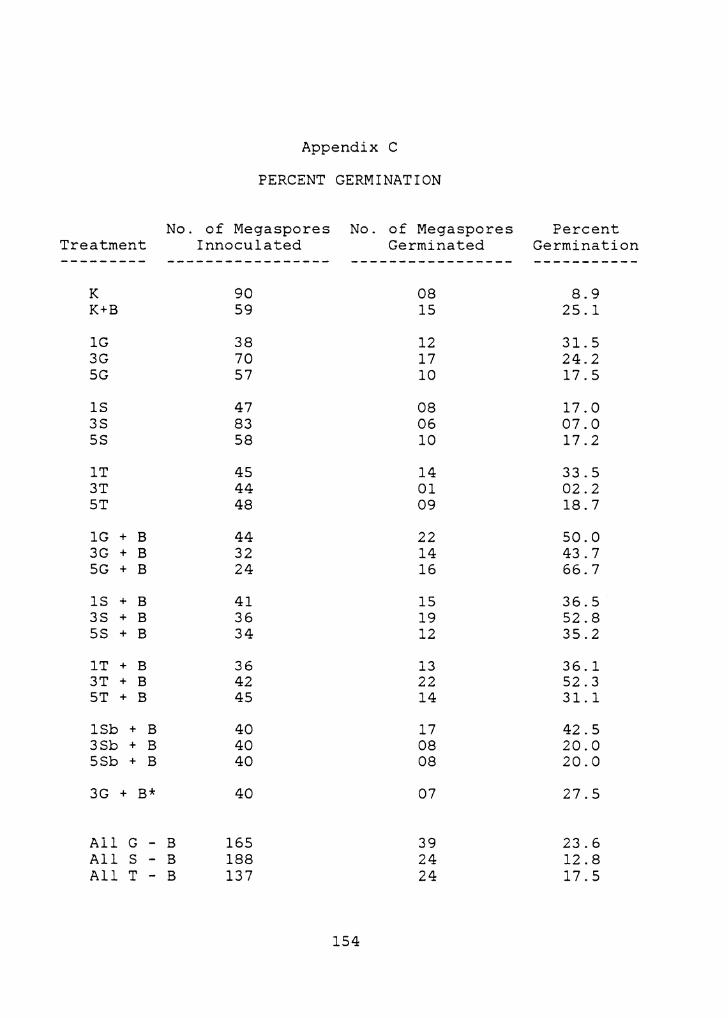
Appendix C
PERCENT GERMINATION
No. of Megaspores No. of Megaspores Percent Treatment Innoculated Germinated Germination --------- ----------------- ----------------- -----------
K 90 08 8.9 K+B S9 lS 2S.l
lG 38 12 31. s 3G 70 17 24.2 SG S7 10 17.S
lS 47 08 17.0 3S 83 06 07.0 SS S8 10 17.2
lT 4S 14 33.S 3T 44 01 02.2 ST 48 09 18.7
lG + B 44 22 so.o 3G + B 32 14 43.7 SG + B 24 16 66.7
lS + B 41 lS 36.S 3S + B 36 19 S2.8 SS + B 34 12 3S.2
lT + B 36 13 36.1 3T + B 42 22 S2.3 ST + B 4S 14 31.1
lSb + B 40 17 42.S 3Sb + B 40 08 20.0 SSb + B 40 08 20.0
3G + B* 40 07 27.S
All G - B 16S 39 23.6 All s - B 188 24 12.8 All T - B 137 24 17.S
1S4

155
All G + B 100 52 52.0 All s + B 111 46 41. 4 All T + B 123 49 39.8
All non-B 580 95 16.0 All +B 393 162 41.0
Repeat Trehalose Treatments
K 39 4 10.3 lT 45 3 6.7 3T 37 7 18.9 ST 27 10 37.0
(* = Sorbitol Control Treatment)
(K = simple mineral salts medium, G = glucose, S = sucrose, T = trehalose, Sb = sorbitol, + B = addition of B vitamin mixture)

Appendix D
FLUORESCENCE DATA
Vol. of Fluorescence No. Megagarn- Tissue due to
etophytes Extracted Chlorophyll Treatment Extracted (xl0- 2 rnrn 3 ) (corrected)*
K 1 9.5 .1943 K+B 8 47.6 .7772 1,3,5% G 13 78.6 1.7487 1% s 5 32.3 0.0000 1,5% T 7 53.9 0.3886 3%G + B 2 21.1 0.5829 5%G + B 2 37.8 0.5829 1%S + B 10 192.6 1. 3601 3%S + B 10 144.1 1. 3601 5%S + B 9 131. 0 0.7772 3%T + B 10 137.7 1. 5544 1%Sb + B 2 21. 4 0.9715 3%Sb + B 2 11. 6 1.1658 5%Sb + B 2 26.2 0.7772
Stem Tissue 4930.0 1975.3
* - The corrected measurements of fluorescence were derived by multiplying actual fluorescence reading by a pre-determined correction factor= 1.943.
Corrected fluorescence readings were divided by the amount of tissue extracted to derive fluorescence per mm 3 •
The linear equation derived by measuring fluorescence of serial dilutions of chlorophyll-A was:
Corrected [Chlorophyll-A] = Fluorescence x .05982773 + .04476125
(micrograms/liter extract)
156

The three page vita has been removed from the scanned
document. Page 1 of 3

The three page vita has been removed from the scanned
document. Page 2 of 3

The three page vita has been removed from the scanned
document. Page 3 of 3

GROWTH AND DEVELOPMENT OF THE MEGAGAMETOPHYTE OF THE
VASCULAR PLANT
SELAGINELLA (LYCOPSIDA) ON DEFINED MEDIA
by
Alan Leonard Koller
(ABSTRACT)
Megagametophytes of the heterosporous lower vascular
plant, Selaginella, were cultured on a variety of types and
concentrations of carbon sources (glucose, sucrose,
trehalose, and sorbitol), with and without B vitamins, in an
attempt to induce apogamy. Without B vitamins growth was
enhanced on glucose and trehalose, but not on sucrose. With
B vitamins growth was enhanced on all types and
concentrations of carbon sources. Enhanced growth involved
the production of greater numbers of cells in the tissue.
Chlorophyll-a was present in megagametophytes cultured on
many of the treatments, including control treatments without
supplemental carbon. Apogamy was not induced.