alabama energy profile - adeca state... · the first edition of the alabama energy profile is...
TRANSCRIPT

Transforming America’s Energy Future
Energy Profile Developed by
Alabama
In Association With:

2

Summary
The first edition of the Alabama Energy Profile is offered by the National Association for State En-ergy Officials (NASEO) and the Kentucky Department for Energy Development and Independence (DEDI) to function as a quick reference for energy information particular to the State of Alabama. Data has been collected for the most recent year available from a variety of sources such as the Energy Information Ad-ministration (EIA), the U.S. Environmental Protection Agency (EPA), the Bureau for Economic Analysis (BEA), the Bureau of Labor Statistics (BLS), and the U.S. Census. This document provides data on the dynamics of en-ergy expenditures, energy consumption, energy production, and electricity generation that describe the economy of Alabama. Summary state-level statistics are provided in aggregate, as well as for specific sec-tors of the economy and individual commodities. Overall, Alabama was a net importer of energy in 2010, and maintained an industrial sector that was the leading consumer of energy resources.
3

4

Table of Contents
5
Alabama Energy Expenditures ............................................................................... 7
Alabama Gross Domestic Product & Population .................................................... 8
Alabama Energy Consumption .............................................................................. 9
Industrial Sector & Commercial Sector ................................................. 10
Residential Sector & Transportation Sector ........................................... 11
Alabama Energy Intensity per Capita .................................................................. 12
Alabama Energy Intensity per Real GDP Dollar ................................................... 13
Alabama Electricity ............................................................................................. 14
Alabama Electricity Intensity per Capita .............................................................. 15
Alabama Electricity Intensity per Real GDP Dollar ............................................... 16
Alabama Renewable Energy ............................................................................... 17
Alabama Natural Gas .......................................................................................... 18
Alabama Power Plant Emissions ......................................................................... 19
Alabama Electricity Prices .................................................................................... 20

6

Alabama Energy Expenditures
Sector Million ($ US) PercentageTotal 21,507 100%
Transportation 9,683 45%Residential 4,707 22%Industrial 4,243 20%
Commercial 2,873 13%
In 2010, total energy expenditures in Alabama were 21.5billion dollars, an increase of 17% from 2009. Dividingthese costs by economic sector, the transportation sectoraccounted for the largest amount of energy expenditures in2010.
Fuel Type Million ($ US) PercentageTotal 21,507 100%
Electricity 7,833 36%Gasoline 6,990 32%
Natural Gas 3,181 15%Diesel 2,984 14%Coal 2,136 10%
Analyzing energy expenditures by fuel type, the purchaseof electricity was the highest concentration of expendituresin Alabama in 2010. Compared with 2009, total electricityexpenditures displayed an increase of 10% in 2010.
7
Gross Domestic Product
Rural & Urban Population Gross Domestic Product per Capita
Energy Expenditures & GDP
Alabama Energy Expenditures
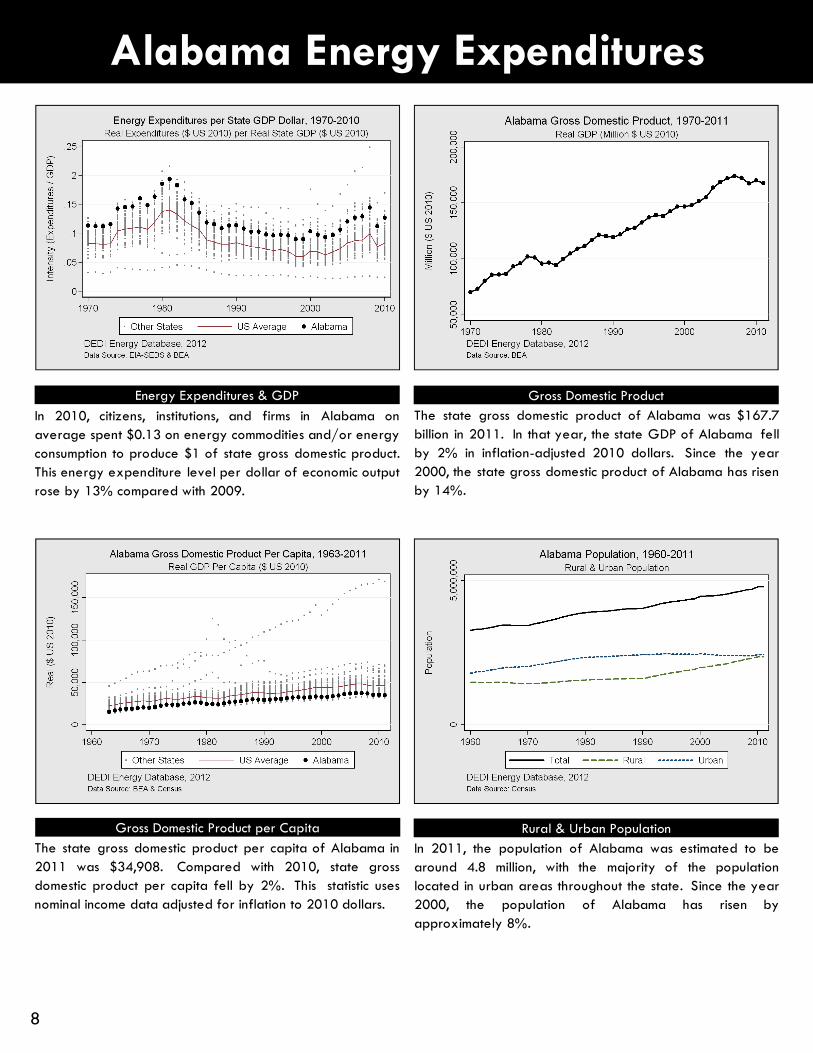
In 2010, citizens, institutions, and firms in Alabama onaverage spent $0.13 on energy commodities and/or energy consumption to produce $1 of state gross domestic product.This energy expenditure level per dollar of economic outputrose by 13% compared with 2009.
The state gross domestic product per capita of Alabama in2011 was $34,908. Compared with 2010, state grossdomestic product per capita fell by 2%. This statistic usesnominal income data adjusted for inflation to 2010 dollars.
The state gross domestic product of Alabama was $167.7billion in 2011. In that year, the state GDP of Alabama fellby 2% in inflation-adjusted 2010 dollars. Since the year2000, the state gross domestic product of Alabama has risenby 14%.
In 2011, the population of Alabama was estimated to bearound 4.8 million, with the majority of the populationlocated in urban areas throughout the state. Since the year2000, the population of Alabama has risen byapproximately 8%.
8

Sector Billion Btu PercentageTotal 1,959,696 100%
Industrial 785,810 40%Transportation 485,514 25%
Residential 417,483 21%Commercial 270,890 14%
In 2010, total energy consumption in Alabama was 1.96quadrillion Btu, an increase of 7% from 2009. Dividing thisconsumption by economic sector, the industrial sectoraccounted for the largest amount of energy consumption in2010.
Fuel Type Billion Btu PercentageTotal* 1,959,696 100%Coal 718,736 29%
Petroleum 567,639 23%Natural Gas 546,917 22%
Nuclear 396,557 16%Renewables 241,056 10%
Characterizing energy consumption by fuel type orcommodity, the use of coal was the highest concentration ofenergy consumption in Alabama in 2010. Compared with2009, the consumption of coal rose by 14% in 2010.*Alabama exported 501,743 Billion Btu of electricity in2010, which is subtracted from the summation of in-stateenergy consumption.
Alabama Energy Consumption
9

Alabama Energy Consumption
Fuel Type Billion Btu PercentageNet Consumed* 567,406 100%
Natural Gas 167,678 30%Wood Products 135,940 24%
Electricity 110,377 19%Petroleum 84,499 15%
Coal 68,870 12%
In 2010, net industrial energy consumption in Alabama was567,406 billion Btu, an increase of 6% from 2009.Accounting for energy use across fuels, natural gasrepresented the largest amount of industrial energyconsumption in 2010. *Net energy consumption does notinclude the associated energy losses of electricity generation and transmission; therefore, the sum of fuel inputs may differfrom the total energy directly consumed by end-users.
Fuel Type Billion Btu PercentageNet Consumed* 115,718 100%
Electricity 78,421 68%Natural Gas 26,934 23%Petroleum 9,612 8%
Wood Products 752 1%Ethanol 10 <1%
Net commercial energy consumption in Alabama rose by 6%in 2010 to over 115,718 billion Btu. During 2010, electricityconstituted the largest portion of commercial energyconsumption and rose by 5% compared with 2009. *Netenergy consumption does not include the associated energylosses of electricity generation and transmission; therefore,the sum of fuel inputs may differ from the total energydirectly consumed by end-users.
10
Alabama Energy Consumption
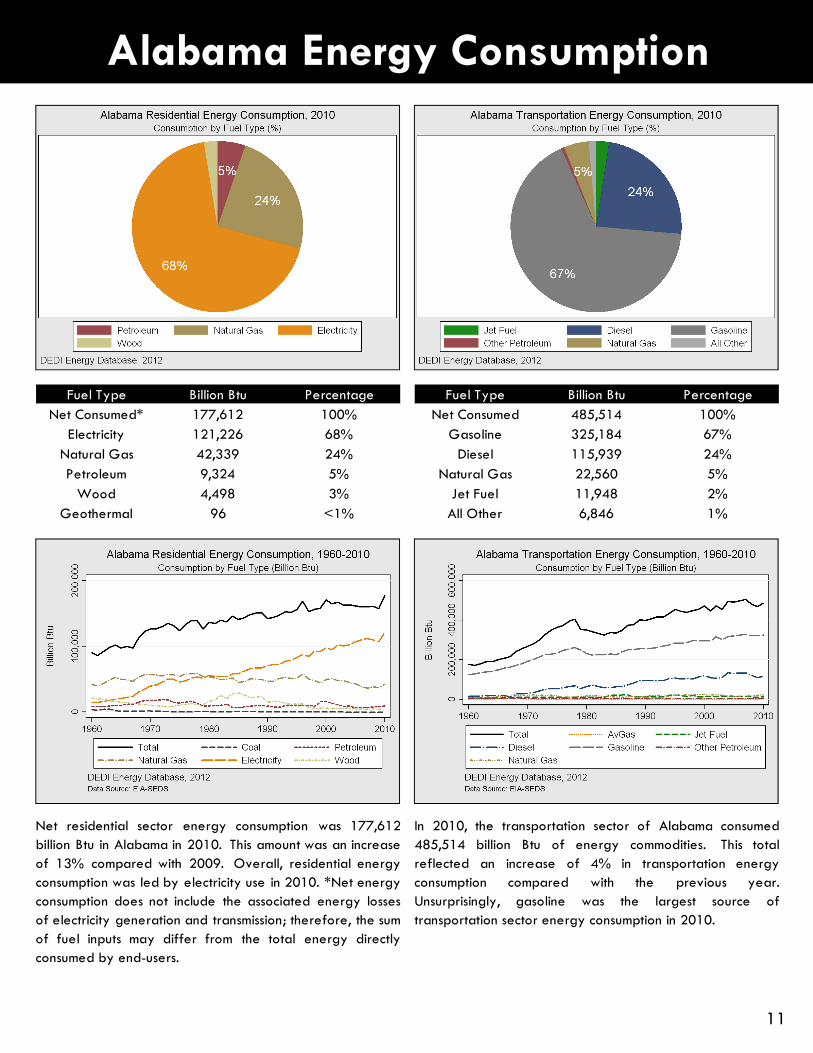
Fuel Type Billion Btu PercentageNet Consumed* 177,612 100%
Electricity 121,226 68%Natural Gas 42,339 24%Petroleum 9,324 5%
Wood 4,498 3%Geothermal 96 <1%
Net residential sector energy consumption was 177,612billion Btu in Alabama in 2010. This amount was an increaseof 13% compared with 2009. Overall, residential energyconsumption was led by electricity use in 2010. *Net energyconsumption does not include the associated energy lossesof electricity generation and transmission; therefore, the sumof fuel inputs may differ from the total energy directlyconsumed by end-users.
Fuel Type Billion Btu PercentageNet Consumed 485,514 100%
Gasoline 325,184 67%Diesel 115,939 24%
Natural Gas 22,560 5%Jet Fuel 11,948 2%All Other 6,846 1%
In 2010, the transportation sector of Alabama consumed485,514 billion Btu of energy commodities. This totalreflected an increase of 4% in transportation energyconsumption compared with the previous year.Unsurprisingly, gasoline was the largest source oftransportation sector energy consumption in 2010.
11

Alabama Energy Intensity
State MMBtu per Capita RankWyoming 113 1stAlabama 57 33rdHawaii 29 50th
Alabama ranked 33rd lowest nationally for commercialenergy consumption per capita in 2010, an increase of 4%compared with 2009. (MMBtu = 1 Million Btu).
State MMBtu per Capita RankLouisiana 595 1stAlabama 164 11thNew York 18 50th
Industrial energy consumption per capita in Alabama was11th highest in the country in 2010. Compared with 2009,industrial energy use per capita rose by 5%.
State MMBtu per Capita RankNorth Dakota 99 1st
Alabama 87 12thHawaii 25 50th
Alabama's residential sector consumed 87 Million Btu ofenergy per capita in 2010, an increase of 11% from 2009.Alabama ranked 12th highest by state.
State MMBtu per Capita RankAlaska 295 1st
Alabama 101 13thNew York 54 50th
Transportation energy consumption per capita in Alabamarose by 2% in 2010. Alabama ranked 13th highest in thecountry for this metric.
12

Alabama Energy Intensity
State Btu / $US GDP RankLouisiana 17,493 1stAlabama 11,513 8thNew York 3,303 50th
Alabama ranked 8th highest for energy consumption used toproduce one dollar of state GDP in 2010. Thismeasurement rose by 5% compared with 2009.
State Btu / $US GDP RankLouisiana 11,636 1stAlabama 4,616 9thNew York 307 50th
Industrial energy consumption per dollar of state GDP inAlabama was 9th highest in 2010. Compared with 2009,industrial energy intensity rose by 5%.
State Btu / $US GDP RankMontana 2,095 1stAlabama 1,591 16thHawaii 607 50th
Alabama's commercial sector ranked 16th highest for theratio of energy use to state GDP dollar in 2010, an increaseof 4% from 2009.
State Btu / $US GDP RankAlaska 4,415 1st
Alabama 2,852 10thNew York 923 50th
Transportation sector energy intensity per state GDP dollarin Alabama rose by 2% in 2010. Overall, Alabama ranked10th highest in the country for this metric.
13
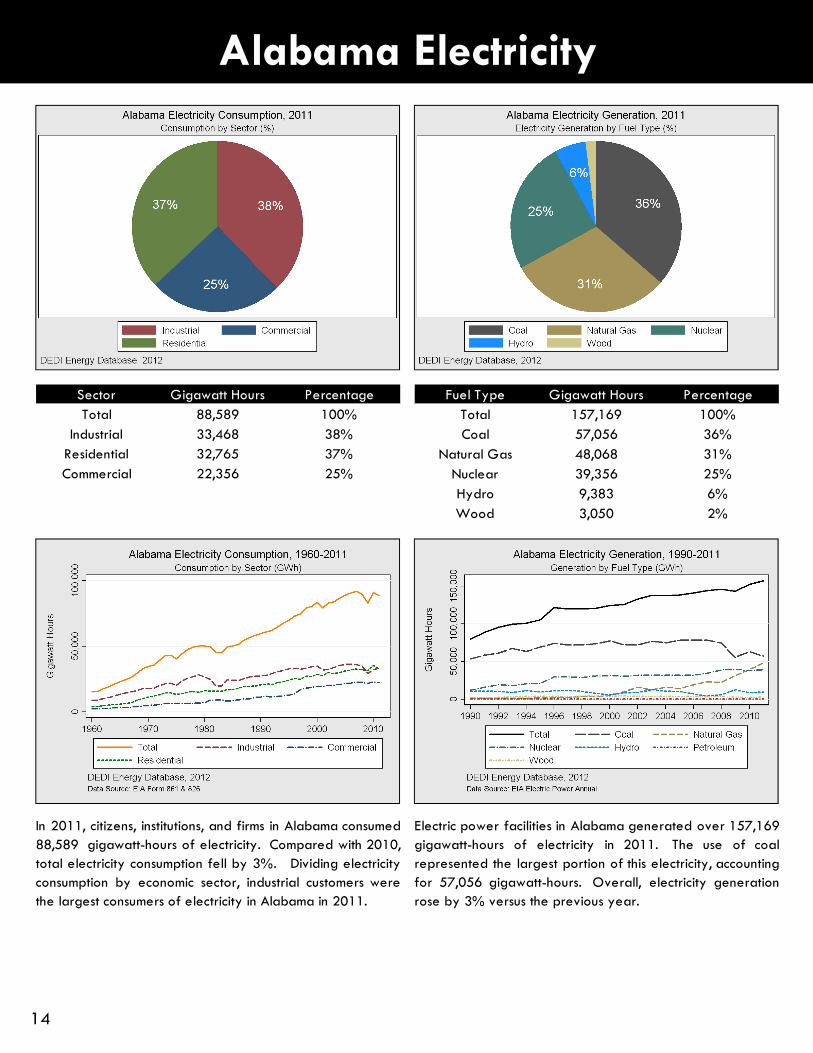
Sector Gigawatt Hours PercentageTotal 88,589 100%
Industrial 33,468 38%Residential 32,765 37%Commercial 22,356 25%
In 2011, citizens, institutions, and firms in Alabama consumed88,589 gigawatt-hours of electricity. Compared with 2010,total electricity consumption fell by 3%. Dividing electricityconsumption by economic sector, industrial customers werethe largest consumers of electricity in Alabama in 2011.
Fuel Type Gigawatt Hours PercentageTotal 157,169 100%Coal 57,056 36%
Natural Gas 48,068 31%Nuclear 39,356 25%Hydro 9,383 6%Wood 3,050 2%
Electric power facilities in Alabama generated over 157,169gigawatt-hours of electricity in 2011. The use of coalrepresented the largest portion of this electricity, accountingfor 57,056 gigawatt-hours. Overall, electricity generationrose by 3% versus the previous year.
Alabama Electricity
14

State MWh per Capita RankWyoming 30.5 1stAlabama 18.4 5thCalifornia 6.7 50th
At 18.4 MWh, Alabama ranked 5th highest nationally fortotal electricity consumption per capita in 2011, a decreaseof 3% from 2010.
State MWh per Capita RankWyoming 17.9 1stAlabama 7.0 4thNew York 0.7 50th
Industrial electricity consumption per capita in Alabama was4th highest in 2011. Versus 2010, industrial electricityconsumption per capita rose by 3%.
State MWh per Capita RankLouisiana 7.1 1stAlabama 6.8 2ndHawaii 2.1 50th
Residents of Alabama used on average 6.8 MWh ofelectricity in 2011. Representing a decrease of 8%, thisamount ranked Alabama 2nd highest by state.
State MWh per Capita RankWyoming 7.6 1stAlabama 4.7 17thHawaii 2.4 50th
Alabama's commercial electricity consumption per capita fellby 3% in 2011 to 4.7 MWh. Overall, Alabama ranked 17thhighest in the country for this metric.
Alabama Electricity Intensity
15

State kWh / $ US GDP RankKentucky 0.56 1stAlabama 0.53 2ndAlaska 0.13 50th
Alabama ranked 2nd highest nationally for total electricityconsumption per state GDP dollar in 2011. This amount fellby 1% to 0.53 kWh per dollar for the year.
State kWh / $ US GDP RankWyoming 0.28 1stAlabama 0.20 3rdNew York 0.01 50th
Industrial electricity consumption per state GDP dollar inAlabama was 3rd highest in the country in 2011. Versus2010, industrial electricity intensity rose by 5%.
State kWh / $ US GDP RankMississippi 0.21 1stAlabama 0.20 2ndAlaska 0.04 50th
In 2011, Alabama ranked 2nd highest for residentialelectricity use relative to one dollar of state GDP. This metricfell by 6% compared to 2010.
State kWh / $ US GDP RankMississippi 0.15 1stAlabama 0.13 3rd
Massachusetts 0.05 50th
Alabama's commercial sector used 0.13 kWh of electricity togenerate one dollar of economic output. A decrease of 1%,this ratio ranked the state 3rd highest.
Alabama Electricity Intensity
16

Fuel Type Billion Btu PercentageTotal 231,591 100%
Wood & Biomass 146,405 63%Hydro 84,919 37%
Geothermal 138 <1%Solar 129 <1%
In 2010, renewable energy production in Alabama was231,591 billion Btu, a decrease of 13% from 2009. Dividingthis production by fuel type, wood & biomass resourcesaccounted for the largest amount of energy production in2010.
Fuel Type Gigawatt Hours PercentageTotal 12,443 100%Hydro 9,383 75%Wood 3,050 25%Biomass 10 <1%
Describing renewable electricity generation by fuel type orcommodity, the production from hydroelectric facilitiesrepresented the largest portion of renewable electricitygeneration in Alabama in 2011. Compared with 2010, theelectrical output of hydroelectric facilities rose by 8% in2011. (Total biomass generation is divided between woodproducts - labeled Wood - and other biomass resources -labeled Biomass - such as landfill gas).
Alabama Renewable Energy
17

Sector Million Cubic Feet PercentageTotal 537,246 100%
Electric Power 281,722 52%Industrial 165,102 31%
Residential 41,689 8%Commercial 26,520 5%
Transportation 22,213 4%
In 2010, natural gas consumption in Alabama was 537billion cubic feet. Compared with 2009, total natural gasconsumption rose by 16% on the year. Dividing natural gasuse by economic sector, the electric power sector was thelargest consumer of natural gas in Alabama in 2010.(Natural gas consumption by the Transportation Sector is thesummation of direct, vehicle fuel use and natural gas used by transmission and distribution pipelines).
Alabama Natural Gas
The average city gate price of natural gas in Alabama was$6.65 per thousand cubic feet in 2010. Versus the previousyear, this average annual price rose by less than 1%. Thecity gate price of natural gas is typically reported at theconnection where a natural gas distribution company orutility takes control of natural gas delivered by a pipeline ortransmission company.
Alabama registered 222.9 billion cubic feet of marketednatural gas production in 2010. Versus 2009, natural gasproduction in the state fell by 6% through 2010.Comparing in-state production levels with in-stateconsumption levels, Alabama was a net importer of naturalgas for the year.
18

19
The last major amendments to the Clean Air Act were implemented in 1990. These amendments focused on National Ambient
Air Quality Standards and the mechanisms which would ensure compliance with emission reduction targets. Subsequently, the
emission of sulfur dioxide (SO2) and nitrogen oxides (NOx) from electric generating plants were regulated and scheduled for
reduction. The dual display of electricity generation and regulated emissions indicates that over time, though electricity de-
mand and generation have increased, the release of targeted pollutants has actually decreased. Therefore, both the aggre-
gate emission as well as intensity of emission per gigawatt-hour of criteria pollutants, such as sulfur dioxide and nitrogen ox-
ides, have been decreasing nationally since 1990. The reductions have been made through a combination of fuel switching
and the installation of pollution mitigation systems at power plants.
Emission Metric Tons Since 1990Carbon Dioxide 69,238,676 31%Sulfur Dioxide 284,909 -44%
Nitrogen Oxides 52,587 -76%
Sulfur dioxide is a highly reactive gas and major pollutantthat is monitored and regulated at the State and Federallevel. In 2009, the electric power sector of Alabama emitted284,909 metric tons of sulfur dioxide, representing adecrease of 22% compared with 2008. Overall, the electricpower sector of Alabama has decreased sulfur dioxideemissions by 44% since 1990.
Nitrogen oxides are a group of highly reactive regulatedpollutants. In 2009, the electric power sector of Alabamaemitted 52,587 metric tons of nitrogen oxides, representinga decrease of 53% compared with 2008. Overall, theelectric power sector of Alabama has decreased nitrogenoxides emissions by 76% since 1990.
Carbon dioxide emissions from fossil fuel power plants aremonitored at the State and Federal level. In 2009, theelectric power sector of Alabama emitted 69,238,676 metrictons of carbon dioxide, a decrease of 17% compared with2008. Overall, power plants in Alabama have increasedcarbon dioxide emissions by 31% since 1990.
Alabama Power Plant Emissions

Sector Cents / kWh Since 2000Average 9.21 64%Industrial 6.33 64%
Commercial 10.47 59%Residential 11.30 60%
Nominal $US
Electricity usage in Alabama is billed in terms of cents perkilowatt-hour of electricity consumed, with differences inprice by classification and electric utility. However, while theprice of electricity varies from sector to sector and from oneutility to another, the above data illustrates the averageprice of electricity delivered to each economic sector.
In 2011, the average price of electricity across economicsectors in Alabama was 9.21¢ per kilowatt-hour. With anincrease of 4% versus 2010, this overall, weighted-averageprice ranked Alabama 21st highest in the country in terms ofelectricity. Since 2000, the average price of electricity inAlabama has risen by 64%.
Fuel Type Real Cents / kWh Since 2000Average 8.92 26%Industrial 6.13 25%
Commercial 10.14 22%Residential 10.94 23%
Real 2010 $US
Adjusting for inflation over time, the trends in the real cost ofelectricity in Alabama between 1970 and 2011 can beplaced in context to the adjacent, nominal graphic. Resetting historical price data to inflation-adjusted 2010 values, theprice of electricity in real economic terms in Alabama hasrisen by 26% since the year 2000. Additionally, in 2011Alabama ranked 21st highest in the nation for the real priceof electricity.
Since 1990, the two most influential factors explaining thechanges in both nominal and real electricity prices havebeen the type of generation portfolio developed within astate, and the price of fossil fuel inputs for the electric powersector. Specifically, these factors involve the type ofgeneration technology (i.e. coal, gas, nuclear) used within astate, the share of each technology in supplying baseloadpower, and the price of the primary fossil fuel commodities.
Alabama Electricity Prices
20

21