al-karam textile mills (private) limited (aktmpl)...vis credit rating company limited 2 al-karam...
TRANSCRIPT
VIS Credit Rating Company Limited www.vis.com.pk
1
RATING REPORT
Al-Karam Textile Mills (Private) Limited (AKTMPL)
REPORT DATE: March 28, 2019 RATING ANALYST: Narendar Shankar Lal [email protected] Madeeh Ahmed [email protected]
COMPANY INFORMATION
Incorporated on 22nd January 1986 External auditors: Kreston Hyder Bhimji & Co.
Chartered Accountants
Private Limited Company Chief Executive Officer/ Managing Director: Mr. Fawad Anwar
Key Shareholders (with stake 5% or more):
Mr. Sajid Haroon - 5.1%
Mr. Abid Umer - 5.0%
Mr. Fawad Anwar - 5.6%
Mr. Anwar Haji Karim - 6.8%
M/s Amna Industries - 20.5%
Mr. Anis Yakoob - 5.0%
Mr. Noman Yakoob - 5.1%
APPLICABLE METHODOLOGY(IES)
VIS Entity Rating Criteria Industrial Corporates (May 2016) http://www.vis.com.pk/docs/Corporate-Methodology-201605.pdf
RATING DETAILS
Rating Category
Initial Rating
Long-term Short-term
Entity A A-2
Rating Outlook Stable
Rating Date March 28, 2019
VIS Credit Rating Company Limited www.vis.com.pk
2
Al-Karam Textile Mills (Private) Limited
OVERVIEW OF THE
INSTITUTION RATING RATIONALE
Al-Karam Textile
Mills (Private) Limited was
incorporated in 1986 as a (Private)
Limited entity. Financial Statements of the company for FY18 were audited by Kreston Hyder
Bhimji & Co. Chartered
Accountants
Profile of CEO
Mr Fawad Anwar has been the
managing director of AKTMPL since 2010. He is also on
the board of six other companies.
Al-Karam Textile Mills (Private) Limited (AKTMPL) is a part of Al-Karam Group. The group has
a presence in textile, beverage, salt, trading house and retail business.
Al-Karam Group
Al-Karam Textile Mills
Pvt. Ltd
Al-Karam is a vertically integrated composite textile mill. It creates
everything from shower curtains to apparel for men and women.
Amna Industries A completely integrated spinning and finishing mill specialized in
knitted fabric.
PSL Caps PSL Caps is engaged in production of plastic and crown caps for
the beverage industry.
Dhabeji Salt Producer of salt for chemical Industries and table salt
Satter Ltd. Local trading house
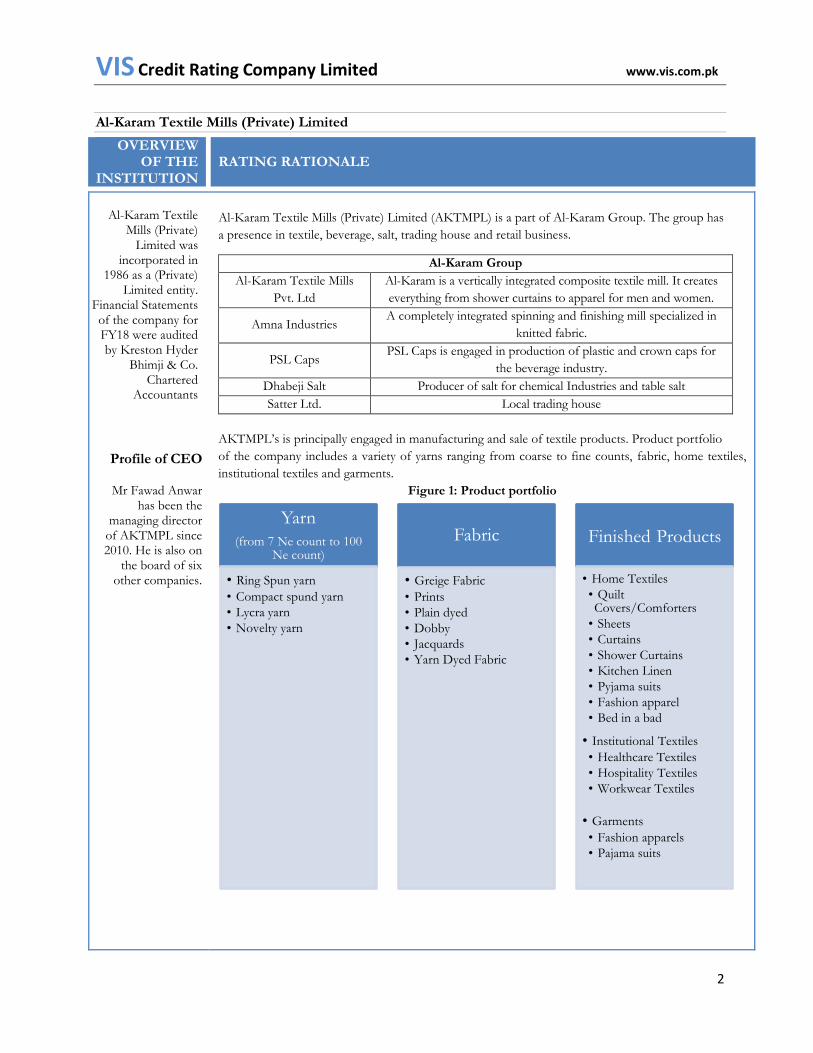
AKTMPL’s is principally engaged in manufacturing and sale of textile products. Product portfolio
of the company includes a variety of yarns ranging from coarse to fine counts, fabric, home textiles,
institutional textiles and garments.
Figure 1: Product portfolio
Yarn
(from 7 Ne count to 100 Ne count)
• Ring Spun yarn
• Compact spund yarn
• Lycra yarn
• Novelty yarn
Fabric
• Greige Fabric
• Prints
• Plain dyed
• Dobby
• Jacquards
• Yarn Dyed Fabric
Finished Products
• Home Textiles
• Quilt Covers/Comforters
• Sheets
• Curtains
• Shower Curtains
• Kitchen Linen
• Pyjama suits
• Fashion apparel
• Bed in a bad
• Institutional Textiles
• Healthcare Textiles
• Hospitality Textiles
• Workwear Textiles
• Garments
• Fashion apparels
• Pajama suits
VIS Credit Rating Company Limited www.vis.com.pk
3
Head office of the company is based in Karachi and the vertically integrated production factory is
located in Landhi Industrial Area. The power requirement of the production unit is met through
internal generation.
Rating Drivers
Industry Dynamics
Textile sector remains a key contributor to overall exports of Pakistan. The Government of Pakistan
(GoP) has introduced a number of favorable measures in order to increase the competitiveness of
textile exports of Pakistan vis-à-vis the regional competitors such as India and Bangladesh, which
enjoy lower cost of production. Some of these measures included reduction in the electricity cost,
exemption of sales tax on import of cotton & textile machinery, and elimination of custom duty on
cotton imports to promote value addition. These factors coupled with currency depreciation are
expected to provide much needed impetus to textile exports of Pakistan. In 7MFY19, growth of 1.2%
was registered in overall low and value added textile exports. Growth was primarily driven by the value
added segment as depicted below:
Exports
USD mn 7MFY19 7MFY18 % change
Cotton Yarn 635 739 -14.1%
Cotton Cloth 1,234 1,249 -1.2%
Others 32 73 -56.2%
Total Low Value
Added 1,901 2,061 -7.8%
Knitwear 1,732 1,557 11.2%
Bedwear 1,352 1,305 3.6%
Garments 1,517 1,482 2.4%
Others 1,321 1,323 -0.2%
Total Value Added 5,922 5,667 4.5%
Total 7,823 7,729 1.2%
Source: Pakistan Bureau of Statistics
In the long term, VIS expects double digit growth in textile exports over the medium term as impact
of planned and ongoing capacity expansion along with supportive government policies kicks in.
Nonetheless, business risk profile remains exposed to slow-down in major markets, and competition
from other regional countries.
Production Capacity and Capacity Utilization
Spinning: With installation of rotors, total installed capacity of the segment increased by 8.6% to 17.2m
kgs (FY17: 15.9m kgs) in FY18. Barring FY17, capacity utilization has remained more than 90% on
timeline basis. Capacity utilization remained low in FY17 due to reduction in the number of installed
spindles.
Weaving: Prior to FY18, capacity utilization remained low due to a considerable number of non-
operational looms. However, both installed capacity and actual production of fabric have witnessed an
increase due to addition of 66 looms in FY18. Capacity utilization was reported at 78.9% (FY17:
49.1%; FY16: 56.0%) in FY18.
VIS Credit Rating Company Limited www.vis.com.pk
4
Finishing: Given a diversified product mix involving varying processes of manufacturing and run length
of order lots, capacity of this particular segment is undeterminable. However, as per management,
capacity utilization is considered to be on the higher side.
Sales Mix
Sales of the company have grown at a 3 year Compound Annual Growth Rate (CAGR) of 5% in the
period from FY16-FY18. Net Sales of the company grew by 18% in FY18 (FY18: Rs. 21.2b; FY17:
Rs. 18.0b; FY16: Rs. 17.2b). The increase in net sales was a function of increase average selling price
and growth in volumes. Around three fourth of the company’s sales are geared towards the export
markets and primarily constitute sales of home textiles. Quantum of export sales was reported at Rs.
16.0b (FY17: Rs. 14.1b; Rs. 13.9b) in FY18. Presently, the company has a showroom in USA for
marketing its products in the US market. Recently, the company has launched a brand in Portugal to
further penetrate the European market. Total export sales accumulated to Rs. 7.7b in HY19.
Local sales of the company constitute sales of yarn, fabric and garments. The company has established
Al-Karam Studio outlets in the country which offer bedding, stitched and unstitched garments to retail
clients in the local market. Local Sales of the company amounted to Rs. 3.1b (FY18: Rs. 5.2b; FY17:
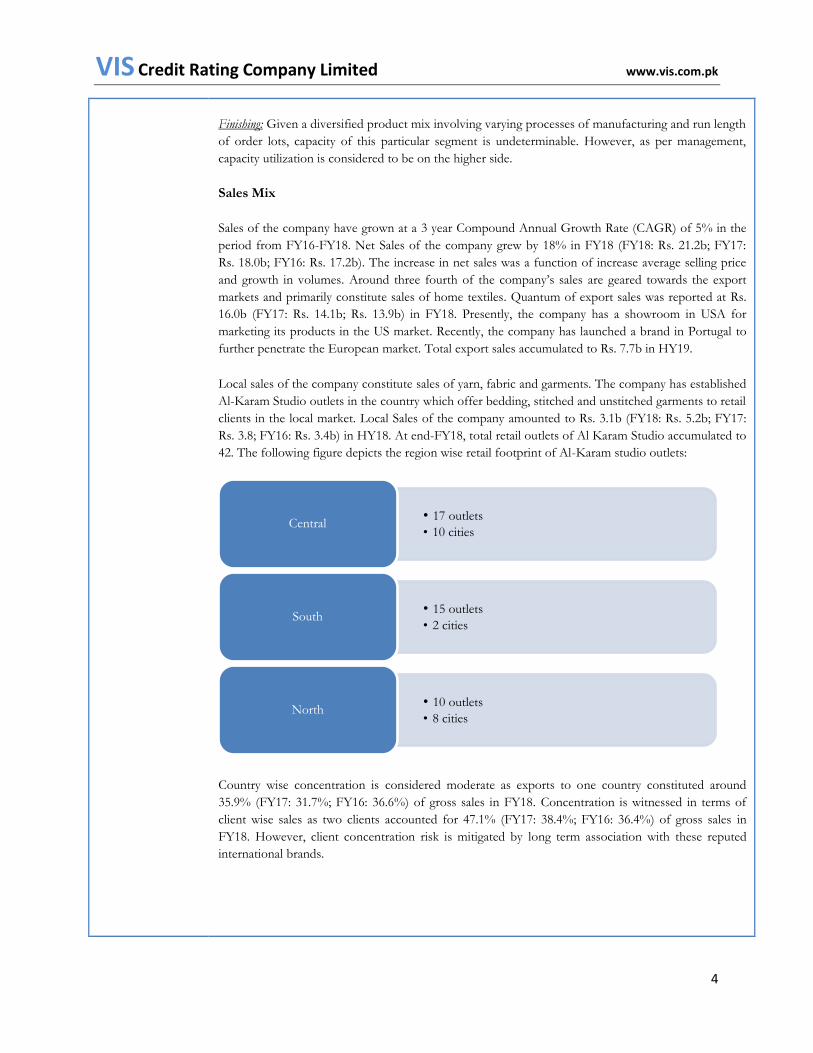
Rs. 3.8; FY16: Rs. 3.4b) in HY18. At end-FY18, total retail outlets of Al Karam Studio accumulated to
42. The following figure depicts the region wise retail footprint of Al-Karam studio outlets:
Country wise concentration is considered moderate as exports to one country constituted around
35.9% (FY17: 31.7%; FY16: 36.6%) of gross sales in FY18. Concentration is witnessed in terms of
client wise sales as two clients accounted for 47.1% (FY17: 38.4%; FY16: 36.4%) of gross sales in
FY18. However, client concentration risk is mitigated by long term association with these reputed
international brands.
• 17 outlets
• 10 citiesCentral
• 15 outlets
• 2 citiesSouth
• 10 outlets
• 8 citiesNorth
VIS Credit Rating Company Limited www.vis.com.pk
5
Profitability
Gross Margins of the company have depicted improvement on timeline basis (HY19: 15.5%; FY18:
13.5%; FY17: 10.8%; FY16: 10.3%). As per management, the growth in margins was witnessed on
account of realization of economies of scale due to growth in production volume and production
efficiencies. Currency depreciation also contributed to improvement in margins in HY19 and FY18
Improvement in gross margins has translated to growth in net profit margins (HY19: 3.1%; FY18:
2.6%; FY17: 2.4%; FY 2.3%) of the company albeit at a slower pace. Net Profit of the company was
reported at Rs. 336.5m (FY18: Rs. 554.4m; FY17: Rs. 429.0m; FY16: 405.3m) in HY19. Sizeable
exchange gains were also a factor in improving net margins. However, growth in selling and
distribution costs created a drag on net profit. Distribution & selling costs have witnessed
considerable growth primarily due to increase in salaries and wages and rental expenses associated
with opening of new retail outlets. Finance cost of the company has also trended upwards due to
higher average short term borrowings to meet working capital requirements and increase in interest
rates.
Going forward, the management believes that the company’s gross and net margin will improve due
to realization of further economies of scale and government’s focus on textile sector. Sustainability in
margins in the given rating horizon would be an important rating determinant.
Capitalization and Funding
Equity base (excluding revaluation) of the company has grown to Rs. 5.1b (FY18: Rs. 4.8b; FY17: Rs.
4.2b; FY16: Rs. 3.8b) at end-HY19. On a timeline basis, equity base (excluding revaluation) of the
company has observed a rising trend owing to profit retention and no dividend payout policy of the
company. Total debt of the company was reported at Rs. 12.8b (FY18: 11.6b; FY17: Rs. 11.1b; FY16:
Rs. 8.0b); short term debt comprises more than three-fourth of the total debt. Short-term borrowings
stood at 10.3b (FY18: Rs. 9.1b; FY17: Rs.8.3b; FY16: Rs. 6.8b) at end-HY19. Short term has
witnessed an increasing trend due to increasing working capital requirements. Long-term borrowing
(LTB) (including current maturity and contingencies & commitments) was reported at Rs. 2.6b (FY18:
2.6b; FY17: 2.9b; FY16: Rs. 1.2b) at end-FY18. Long term borrowing has increased on timeline basis
to fund capital expenditure.
Gearing and leverage ratios stood at 2.5x (FY18: 2.4x; FY17: 2.6x; FY16: 2.1x) and 3.8x (FY18: 3.9x;
FY17: 3.9x; FY16: 3.4x), respectively primarily owing to increase in short term borrowings. With
moderate increase in debt drawdown, and expected improvement in profitability, capitalization
indicators are expected to improve going forward.

VIS Credit Rating Company Limited www.vis.com.pk
6
Liquidity
Fund From Operations (FFO) has grown at a CAGR of 14.6% over the past three years (FY16-
FY18). FFO of the company amounted to Rs 1.3b (FY17: Rs. 0.7b; FY16: Rs. 0.6b) in FY18. Fund
From Operations (FFO) has exhibited a rising trend owing to increase in company’s profitability and
depreciation. Overall liquidity profile of the company is considered adequate in view of sufficient cash
flows in relation to outstanding obligations and satisfactory debt servicing ability which remain within
manageable levels. Current ratio has varied overtime, however the same has remained consistently
above 1.0x (FY18: 1.04x; FY17: 1.03x; FY16: 1.1x), thereby indicating adequate liquidity coverage.
Stock in trade & trade debts as a proportion of short-term borrowing provide adequate coverage in
relation to short term borrowings (FY18: 1.5x; FY17: 1.4x; FY16: 1.6x).
Internal controls and Information Technology (IT) framework
AKTMPL has segregated its internal audit departments catering to Al-Karam Textile Mills and Al-
Karam Studio needs separately. The internal audit (IA) department follows a risk based audit approach
with observations classified into ‘high’, ‘medium’ and ‘low’ risk categories. The company has defined
internal audit Standard Operating Procedure’s (SOP) for every process; employee are required to
adhere to these SOPs.
The company has deployed a completely integrated ERP system. AKTMPL is currently using Oracle
standard solutions, which constitutes modules for various administrative departments barring the
production department. A customized solution is in place for the production department. As per
management, Research and Development (R&D) remains a forte of the company and the company
continues to make sizeable investment to ensure continuous innovation.
VIS Credit Rating Company Limited www.vis.com.pk
7
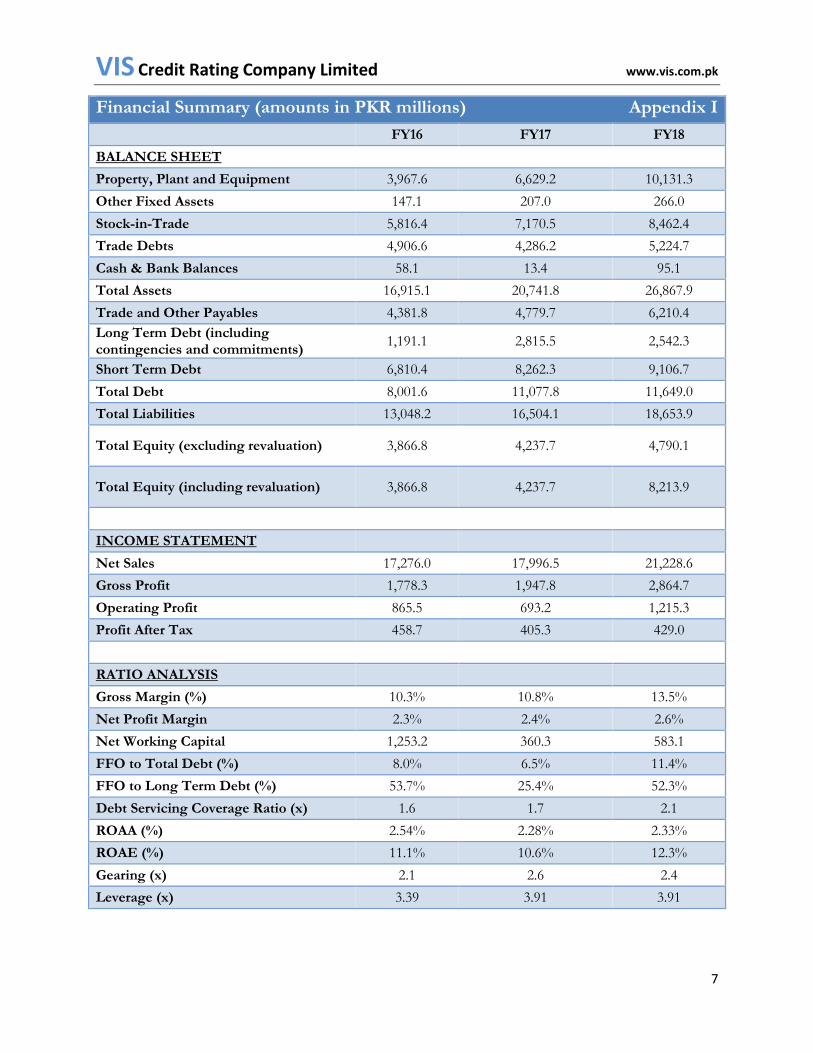
Financial Summary (amounts in PKR millions) Appendix I
FY16 FY17 FY18
BALANCE SHEET
Property, Plant and Equipment 3,967.6 6,629.2 10,131.3
Other Fixed Assets 147.1 207.0 266.0
Stock-in-Trade 5,816.4 7,170.5 8,462.4
Trade Debts 4,906.6 4,286.2 5,224.7
Cash & Bank Balances 58.1 13.4 95.1
Total Assets 16,915.1 20,741.8 26,867.9
Trade and Other Payables 4,381.8 4,779.7 6,210.4
Long Term Debt (including contingencies and commitments)
1,191.1 2,815.5 2,542.3
Short Term Debt 6,810.4 8,262.3 9,106.7
Total Debt 8,001.6 11,077.8 11,649.0
Total Liabilities 13,048.2 16,504.1 18,653.9
Total Equity (excluding revaluation) 3,866.8 4,237.7 4,790.1
Total Equity (including revaluation) 3,866.8 4,237.7 8,213.9
INCOME STATEMENT
Net Sales 17,276.0 17,996.5 21,228.6
Gross Profit 1,778.3 1,947.8 2,864.7
Operating Profit 865.5 693.2 1,215.3
Profit After Tax 458.7 405.3 429.0
RATIO ANALYSIS
Gross Margin (%) 10.3% 10.8% 13.5%
Net Profit Margin 2.3% 2.4% 2.6%
Net Working Capital 1,253.2 360.3 583.1
FFO to Total Debt (%) 8.0% 6.5% 11.4%
FFO to Long Term Debt (%) 53.7% 25.4% 52.3%
Debt Servicing Coverage Ratio (x) 1.6 1.7 2.1
ROAA (%) 2.54% 2.28% 2.33%
ROAE (%) 11.1% 10.6% 12.3%
Gearing (x) 2.1 2.6 2.4
Leverage (x) 3.39 3.91 3.91
VIS Credit Rating Company Limited www.vis.com.pk
8
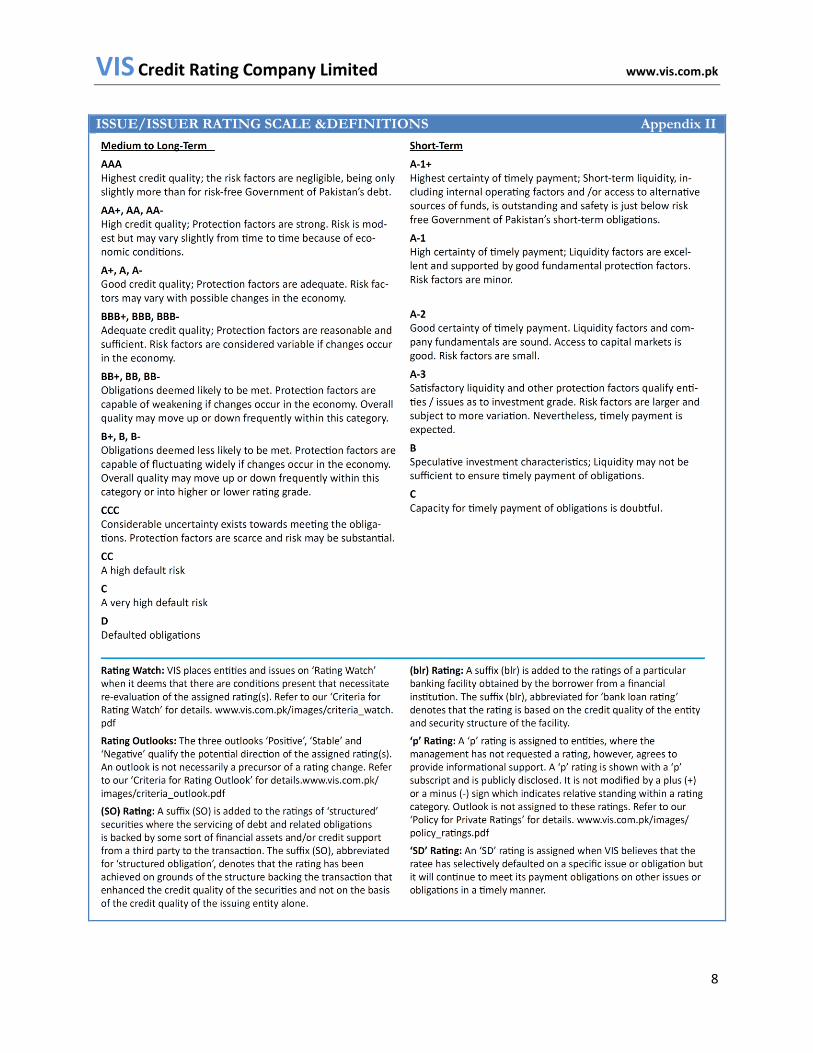
ISSUE/ISSUER RATING SCALE &DEFINITIONS Appendix II
VIS Credit Rating Company Limited www.vis.com.pk
9
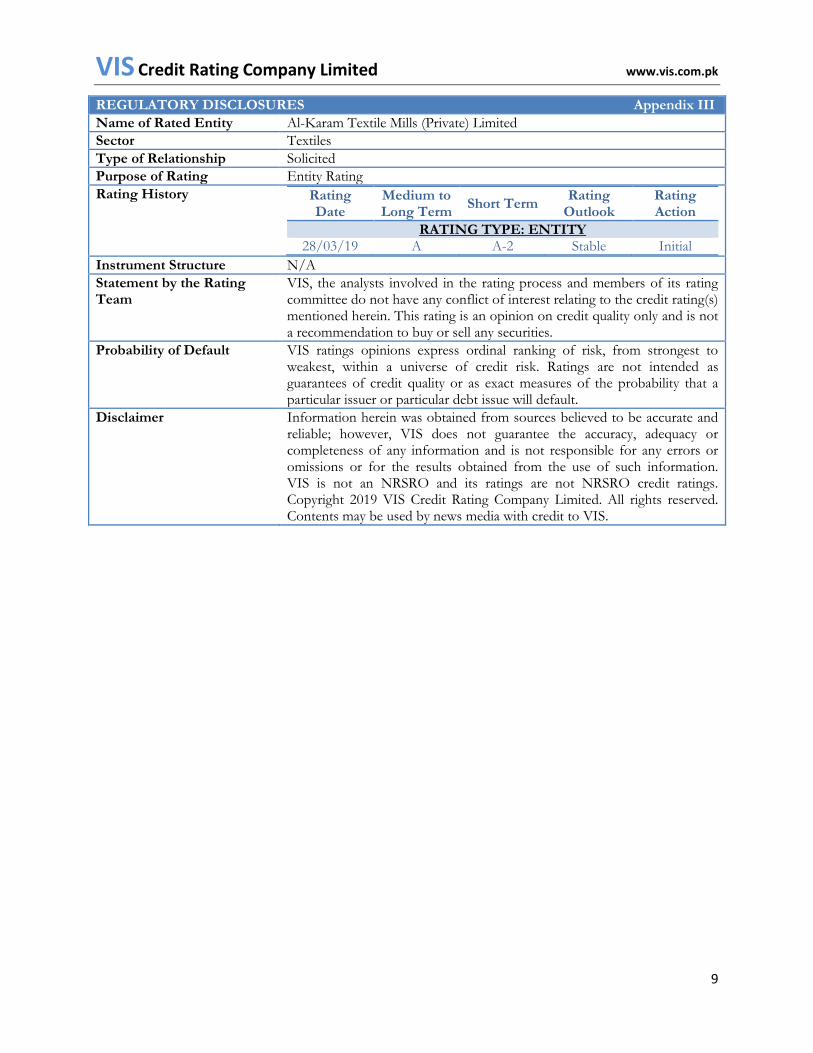
REGULATORY DISCLOSURES Appendix III
Name of Rated Entity Al-Karam Textile Mills (Private) Limited
Sector Textiles
Type of Relationship Solicited
Purpose of Rating Entity Rating
Rating History Rating Date
Medium to Long Term
Short Term Rating
Outlook Rating Action
RATING TYPE: ENTITY 28/03/19 A A-2 Stable Initial
Instrument Structure N/A
Statement by the Rating Team
VIS, the analysts involved in the rating process and members of its rating committee do not have any conflict of interest relating to the credit rating(s) mentioned herein. This rating is an opinion on credit quality only and is not a recommendation to buy or sell any securities.
Probability of Default VIS ratings opinions express ordinal ranking of risk, from strongest to weakest, within a universe of credit risk. Ratings are not intended as guarantees of credit quality or as exact measures of the probability that a particular issuer or particular debt issue will default.
Disclaimer Information herein was obtained from sources believed to be accurate and reliable; however, VIS does not guarantee the accuracy, adequacy or completeness of any information and is not responsible for any errors or omissions or for the results obtained from the use of such information. VIS is not an NRSRO and its ratings are not NRSRO credit ratings. Copyright 2019 VIS Credit Rating Company Limited. All rights reserved. Contents may be used by news media with credit to VIS.