akfen real estate investment trust inc. - … · akfen real estate investment trust inc. ......
TRANSCRIPT

AKFEN REAL ESTATE INVESTMENT TRUST INC.
CITY OF TRABZON, DISTRICT OF YOMRA
BUILDING BLOCK NO. 209, PLOT NO. 12
KAŞÜSTÜ NOVOTEL PROJECT
REAL ESTATE APPRAISAL REPORT
Report No: 2015-020-GYO-004
Appraisal Date: 31.12.2015
Date of Report: 08.01.2016
REAL ESTATE CONSULTANCY AND APPRAISAL INC.

i. APPRAISAL REPORT SUMMARY
Person/Entity Requesting the Appraisal
: Akfen Real Estate Investment Trust Inc.
Institution Preparing the Report : Epos Real Estate Consultancy and Appraisal Inc.
Date of Report : 08.01.2016
Report No : 2015-020-GYO-004
Appraisal Date : 01.10.2015-31.12.2015
Information Concerning the Property Subject to the Appraisal
: Real Estate consisting of a “Concrete Hotel with Appurtenances and Land” with a surface area of 13.450,71 m2, located in the city of Trabzon, district of Yomra, Neighborhood of Kaşüstü/Cumhuriyet, Locality of Yalı, Section No: G43b02c1c2ad2, Block No: 209, Plot No: 12
Subject of Study : Determining the market value of the construction right
of the real estate subject to the appraisal and the updated market value of the annual lease.
Land Area of the Real Estate Subject to the Appraisal
: 13.450,71 m²
Land Area of the Closed Spaces of the Real Estate Subject to the Appraisal
: 15,232 m2
Zoning Status of the Real Estate Subject to the Appraisal
: Central Office Block
As of 31.12.2015
Market Value of the Remaining
Construction Right of the Real Estate EURO)
Market Value of the Remaining Construction Right of the Real Estate (TL)
VAT Excluded 39.990.000 123.561.000
VAT Included 47.188.200 145.801.980
Annual Lease Value of the Real Estate
(EURO) Annual Lease Value of the Real Estate
(TL)
VAT Excluded 2.266.000 7.001.000
VAT Included 2.674.000 8.261.000
1- ) The appraised value is the current value regarding the cash sale price. 2- ) The VAT ratio has been established at 18%. 3-) In this report, Euro buying rate of exchange on 02.11.2015 has been taken/accepted as 3,098 TL, USD as 2,8035 TL. 4-) This report has been prepared within the scope of the related Capital Market Legislation.

Names of the persons participating in the report
Certified Appraiser : Serkan TANRIÖVER
Certified Appraiser : Önder ÖZCAN
Responsible Appraiser : Neşecan ÇEKİCİ
Declaration of Conformity
The findings hereby presented in this report are correct, within the scope of the information that
the Appraisers had at their disposal.
The analysis and their respective results are limited only according to the specified assumptions
and conditions.
The appraisers have no connection whatsoever to the property subject to the appraisal nor will
they ever have.
The appraisers are not biased in relation to the real estate and the related parties.
The appraisal cost does not depend on any single part, analysis opinion or the results of the
report.
The appraisers have carried out the appraisal pursuant to the moral principles and performance
standards.
The appraisers meet the necessary professional education terms and possess the sufficient
experience.
The analysis, opinions and resulting values have been prepared in accordance with the
International Valuation Standards (IVS - UDES).
Assumptions
The value stated within this report is the value specified on the date of its preparation. The
appraisers cannot be held responsible for the economic and/or physical changes that might
affect the value herein stated, occurring after the date of this report.
No comments in this report (even though the matters in question are discussed in the
continuation of the report) have been made with the purpose of clarifying legal affairs, matters
that might require special research and specialty or other issues that are beyond the scope of
the area of expertise of the appraisers.
No changes have been made to the information pertaining to the property. The authorities that
provide the information related to the property and legal descriptions are generally accepted to
be trustworthy; however, no guarantees are given with regard to their truthfulness.
Documents and corresponding related information are found in the report as they have been
procured from public institutions.

The photographs, maps, images and diagrams have been used for illustrative purposes only, in
the interest of further comprehending the matters mentioned in the report; thus, they cannot be
used as a reliable reference for any other purpose.
The projections subject to this appraisal have been performed in order to help the appraisal
process by taking into account a stable economic process, in the case of a demand during the
current market conditions. The projections depend on the variable market conditions, which the
appraisers cannot accurately discern; moreover, it is possible that the value might be affected
from these variable conditions.
The appraisers do not possess the necessary qualifications to determine the dangerous or health
threatening materials found within or in the proximity of the property. Throughout the value
appraisal, it is assumed that such materials that might decrease the value are considered to be
inexistent. No responsibility is accepted concerning this matter.
Predictions and projections or business estimates included in this appraisal report depend on the
current market conditions and short term supply, together with demand factors and a stable
economy; consequently, these may present changes to plausible future conditions. No
responsibility is accepted in the event that the opinions and results presented in the report are
affected due to economic changes that might occur after its herein date.
Unless stated otherwise, underground resources have not been taken into consideration.
It is not possible for the appraisers to carry out a soil contamination investigation, in the matter
of the property in question. For this reason, to the extent that it can be seen, it has been
determined that there is no cause for concern in regard to soil contamination.
On account of the area in question being an established earthquake zone, the subject of ground
stability cannot be clarified without the performance of detailed geological surveys. For this
reason, in behalf of the appraisal studies, it has been assumed that there are no negative issues
presently concerning the ground.
Soil investigation and soil contamination studies in real estate fall within the scope of the
“Environmental Geophysics” field. Our company does not employ such a specialization, thus did
not perform a detailed investigation regarding the aforementioned matter. However, in
accordance with the observations carried at the locale, it has been established that the real
estate poses no threat to the environment. For this reason, this appraisal has been carried out
taking into consideration that there have not been any negative effects against the environment.

TABLE OF CONTENTS
1 REPORT INFORMATION ..................................................................................................................... 4
1.1 The Date, Number and Type of the Appraisal Report ................................................................ 4
1.2 Information Regarding the Responsible Appraiser that has prepared the Appraisal Report .... 4
1.3 Date of Appraisal ........................................................................................................................ 4
1.4 Reference Agreement ................................................................................................................ 4
1.5 Statement Whether the Report Has Been Prepared Within the Scope of the Board
Arrangements for the Purpose of the Appraisal .................................................................................... 4
2 INTRODUCTORY INFORMATION CONCERNING THE COMPANY AND THE CLIENT ............................ 5
2.1 Introductory Information Concerning the Appraisal Company ................................................. 5
2.2 Introductory Information Concerning the Client ....................................................................... 5
2.3 The Scope of the Client’s Demand and the Applied Limitations, If Any ..................................... 5
3 VALUE DEFINITIONS, DESCRIPTION OF APPRAISAL METHODS ......................................................... 6
3.1 Exemplary Comparison Approach (Market Value Approach) .................................................... 6
3.2 Cost Approach ............................................................................................................................ 6
3.3 Revenue Discount Approach ...................................................................................................... 7
4 ECONOMIC STATUS, REAL ESTATE SECTOR DATA AND ANALYSIS OF THE REGION WHERE THE
REAL ESTATE IS LOCATED ........................................................................................................................... 8
4.1 General and Socio-economic Data ............................................................................................. 8
4.1.1 Global Economic Overview ............................................................................................ 10
4.1.2 Turkey Economic Outlook ............................................................................................. 13
4.2 General Status of the Real Estate Industry ................................................................................. 15
4.3 Information Regarding the Tourism Industry ........................................................................... 16
4.4 Analysis of the Region Where the Real Estate is Situated ....................................................... 18
4.4.1 The City of Trabzon ........................................................................................................ 18
4.4.2 The District of Yomra ..................................................................................................... 19
4.4.3 Information Regarding the Tourism Industry in Trabzon and the Hotel Market .......... 21
5 INFORMATION IN REGARD TO THE REAL ESTATE SUBJECT TO THE APPRAISAL ............................. 22

ii Report No: 2015-020-GYO-004
5.1 Information in Regard to the Location, Site and Environment of the Real Estate ................... 22
5.2 Information with Regard to the Land Registry of the Real Estate............................................ 24
5.2.1 Investigation of the Land Registry of the Real Estate.................................................... 25
5.2.2 Changes that Have Occurred in the Land Registry of the Real Estate within the Last
Three Years ................................................................................................................................... 26
5.2.3 Opinion Whether There Is an Obstacle In Including the Investment Trust Portfolio in
Terms of Land Title Records to the Real Estate Within the Scope of the Capital Market Legislation
27
5.3 Inspection of the Zoning Information of the Real Estate ......................................................... 27
5.3.1 Plan, License, Diagram and Similar Documents with Regard to the Real Estate .......... 28
5.3.2 Building Inspection Institution and Maintenance ......................................................... 28
5.3.3 Changes that Have Occurred in the Legal Status (Changes in the Zoning Plan,
Nationalization, etc.) of the Real Estate within the Last Three Years .......................................... 28
5.3.4 Opinion Whether the Necessary Permit and Documents Pursuant to the Legislation are
Accurate and Complete ................................................................................................................ 29
5.3.5 Opinion Whether There Is an Obstacle in Including the Investment Trust Portfolio in
Terms of Zoning Information to the Real Estate within the Scope of the Capital Market Legislation
29
5.3.6 Statement that the Detailed Information, along with the Value in Question Regarding
the Project, are Completely in Connection with the Project and that, in the case of Executing a
Different Project, the Resulting Value Might Vary ....................................................................... 29
5.4 Physical Characteristics of the Real Estate ............................................................................... 30
5.4.1 Structural Construction Characteristics of the Real Estate ........................................... 30
5.4.2 Inspections Performed Within the Premises of the Real Estate ................................... 31
6 FACTORS AFFECTING AND DETERMINING THE VALUE OF THE REAL ESTATE ................................. 33
6.1 Factors that Limit or Negatively Affect the Appraisal Process ................................................. 33
6.2 Swot Analysis ............................................................................................................................ 33
6.3 Exemplary Share Rate in the Projects that Will Be Performed According to the Revenue
Sharing and Flat for Land Methods ...................................................................................................... 34
6.4 Methods and Eligibility Motives Employed in the Appraisal of the Real Estate ...................... 34
iii Report No: 2015-020-GYO-004
6.4.1 Exemplary Approach ..................................................................................................... 34
6.4.1.1 Definitions and Sale Value of the Similar Sales Examples that Has Been Based Upon
During the Appraisal and the Reasons Why They Have Been Employed ..................................... 35
6.4.2 Cost Approach ............................................................................................................... 37
6.4.3 Cost Discount / Development Approach ....................................................................... 38
6.4.4 Value of the Real Estate with Regard to the Lease Revenue ........................................ 43
6.4.5 Lease Value Analysis and Taxes Employed .................................................................... 46
6.4.6 Empty Land and Project Values of the Terrain Where the Project is Being Developed 46
6.4.7 Most Effective and Most Productive Use Analysis ........................................................ 46
6.4.8 Appraisal Analysis of Common or Divided Parts ........................................................... 46
7 7. APPRAISAL OF ANALYSIS RESULTS ............................................................................................... 47
7.1 Alignment of Different Appraisal Methods and Analysis Results, together with the
Explanation of the Method and the Reasons Used for this Purpose ................................................... 47
7.2 Explanation of the Motives Pursuant to the Minimum Information for Not Including Certain
Aspects in the Report ........................................................................................................................... 48
7.3 Information Concerning the Last Three Appraisal of the Real Estate Carried Out by the
Company .............................................................................................................................................. 48
7.4 Opinion Whether There is Any Obstacle in Including the Real Estate, the Real Estate Project
and the Rights and Benefits with Regard to the Real Estate in the Real Estate Investment Trusts
Portfolio within the Scope of the Capital Market Legislation .............................................................. 48
8 OUTCOME ........................................................................................................................................ 49
8.1 The Concluding Sentence of the Appraiser .............................................................................. 49
8.2 Final Appraisal .......................................................................................................................... 49
As the date of 31.12.2015 ........................................................................................................................ 49
9 APPENDIX ......................................................................................................................................... 50
4 Report No: 2015-020-GYO-004
1 REPORT INFORMATION
1.1 The Date, Number and Type of the Appraisal Report
Date of Report : 08.01.2016
Report Number : 2015-020-GYO-004
Type of Report : Appraisal report relative to the “Concrete Hotel with Appurtenances and
Land” with a surface area of 13.450,71 m2, located in the city of Trabzon, district of Yomra,
Neighborhood of Kaşüstü/Cumhuriyet, Locality of Yalı, Section No: G43b02c1c2ad2, Block No: 209,
Plot No: 12, for the purpose of determining the current market value of its construction right and the
current lease value in Turkish Lira currency.
1.2 Information Regarding the Responsible Appraiser that has prepared the Appraisal Report
Report Issued By : Certified Appraiser Serkan TANRIÖVER
Report Controlled By : Certified Appraiser Önder ÖZCAN
Responsible Appraiser : Responsible Appraiser Neşecan ÇEKİCİ
Capital Market Board Coverage : Yes
* The appraisal has been hereby prepared in accordance with the scope of the Capital Market
Legislations.
1.3 Date of Appraisal
On the date of 01.10.2015, the necessary procedures have been initiated for this appraisal report.
Subsequently, the report has been concluded on the date of 08.01.2016.
1.4 Reference Agreement
This Appraisal Report has been prepared pursuant to the provisions of the Reference Agreement
executed between our company and Akfen Real Estate Investment Trust Inc. on the date of
19.08.2015.
1.5 Statement Whether the Report Has Been Prepared Within the Scope of the Board
Arrangements for the Purpose of the Appraisal
The current Report has been prepared within the scope of the Capital Market Board arrangements.

5 Report No: 2015-020-GYO-004
2 INTRODUCTORY INFORMATION CONCERNING THE COMPANY AND THE CLIENT
2.1 Introductory Information Concerning the Appraisal Company
Company Title : EPOS Real Estate Consultancy and Appraisal Inc.
Company Address : Kore Şehitleri Cad. Yüzbaşı Kaya Aldoğan Sok. Engin İş Merkezi No: 20 Kat:2
Zincirlikuyu / İstanbul
2.2 Introductory Information Concerning the Client
Client Title : Akfen Real Estate Investment Trust Inc.
Client Address : Büyükdere Caddesi, No:201, C Blok, Kat:8, Levent/İstanbul
2.3 The Scope of the Client’s Demand and the Applied Limitations, If Any
The Appraisal report relative to the “Concrete Hotel with Appurtenances and Land” quality real
estate, with a surface area of 13.450,71 m2, located in the city of Trabzon, district of Yomra,
Neighborhood of Kaşüstü/Cumhuriyet, Locality of Yalı, Section No: G43b02c1c2ad2, Block No: 209,
Plot No: 12, has been hereby prepared for the purpose of determining its sale and lease value.
With reference to the 19.08.2015 dated request of Akfen Real Estate Investment Trust, the property
subject to this appraisal report belongs to Trabzon World Trade Center Inc. with a Construction Right
agreement dated 27.02.2008, to be operated for the remaining time of its 49 years duration, on
behalf of Akfen Real Estate Investment Trust. The potential revenue in relation to its use or leasing
has been evaluated. There are no restrictive constraints in force exercised by the client. During the
appraisal studies, the market research, the onsite surveys and the existing lease agreement between
Akfen Real Estate Investment Trust Inc. and Trabzon World Trade Center Inc. have all been taken into
account.
6 Report No: 2015-020-GYO-004
3 VALUE DEFINITIONS, DESCRIPTION OF APPRAISAL METHODS
There are three different appraisal methods available in our country: “Exemplary Comparison
Approach (Market Approach)”, “Cost Approach” and “Revenue Discount Approach”.
3.1 Exemplary Comparison Approach (Market Value Approach)
With regard to the real estate that will be appraised; this method follows particular procedures, such
as the comparison of the real estate with other real estates that have similar characteristics in the
market and those that have been recently sold, the application of appropriate comparison processes
and making various modifications in the comparable sale values.
The appraisal analysis are carried out by means of comparing the examples found within specific
criteria such as location, visibility, functional use, size, zoning status and its comparable. The market
value approach is the most preferred method when there are widespread and comparable examples
present.
The most trustworthy and realistic approach in real estate appraisal is the market value approach. In
this appraisal method, comparable examples that share common characteristics with the real estate
that has been submitted for the appraisal in the area are evaluated.
The Market Value Approach depends on the assumptions below.
The existence of an available market, in relation to the type of the real estate in analysis, is
acknowledged beforehand.
It has been verified that the buyers and sellers in this market possess excellent knowledge on the
subject of real estate and that, for this reason, time is not a critical factor.
It has been established that the real estate has stayed on the market for an appropriate amount of
time and for a reasonable price.
It has been determined that the chosen comparable examples possess common characteristics with
the real estate in question.
It has been noted that the changes made in the prices given for the chosen comparable examples are
subject to today’s socioeconomic conditions.
3.2 Cost Approach
In this method, the appraisal of the real estate is based on the cost of the reconstruction of the real
estate, in accordance with today’s socio-economic conditions.
Pursuant to this approach, it has been established that the value of the real estate consists of two
different facts, namely land and buildings; in addition, it is acknowledged that the real estate has a
significant remaining economic life span. Therefore, for this reason, it is taken into account that the
7 Report No: 2015-020-GYO-004
value of the real estate will decrease in time due to physical wear and become out of date in terms of
functionality and economic status. In other words, this method concedes that the current value of a
real estate can never be more than the cost of its reconstruction.
The appraisal process is calculated by the addition of the interest or gain that the current building
possesses, if any, to the present reconstruction or reinstallation cost of the real estate in question,
followed by the subtraction of the wear and tear ratio from the total cost and, finally, the addition of
the land value. In this sense, the basic principle of the Cost Approach can be explained through the
usage value, whereas the usage value is described as “Even though nobody desires or knows about
its value, the goods have their real value”.
3.3 Revenue Discount Approach
In the revenue discount approach, the net revenue that the real estate will bring, the idle time,
collection losses and business expenses are analyzed for the business period.
The appraisers will calculate the present value of the real estate by capitalizing the prospective
future benefits and the revenue that it brings.
There are two different methods in revenue capitalization; Direct Capitalization is calculated through
the division of the annual revenue by the revenue ratio or through the multiplication of the annual
revenue with the revenue coefficient. On the other hand, in the Reduced Cash Flow, the value of the
real estate is calculated by applying the lump sum value and reflecting it on the revenue model;
afterwards, the revenues are brought to the present day value by an acceptable discount rate.
Some real estates, due to their characteristics, may need to be appraied by taking into account that
they will be improved. In this case, the net revenues that the real estate will generate for its
development will be set off from the expenses that will be made for its development; the net result
will be taken into consideration to determine the present value of the real estate by taking into
account the entrepreneur profit and an acceptable discount rate.
The studies and analysis that constitute the basis of the appraisal remain with the appraiser.

8 Report No: 2015-020-GYO-004
4 ECONOMIC STATUS, REAL ESTATE SECTOR DATA AND ANALYSIS OF THE REGION WHERE THE
REAL ESTATE IS LOCATED
4.1 General and Socio-economic Data
According to the result of the Address Based Population Registration System (ADNKS) for the year of
2014, from the date of 31.12.2014, the population of Turkey is established to be 77.695.904. 50,17%
of this number (corresponding approximately to 38.984.302) represents men and 49,83%
(corresponding approximately to 38.711.602) represents women.
One of the most significant characteristics of the Turkish population is the fact that it is comprised of
a young population, with the 0-14 year group constituting approximately 24.3% of the population.
However, this number has been in continuous decline since the year of 1965 and the population of
Turkey is gradually getting older. While the 0-14 age group constituted 41,9% of the population in
the year of 1965, it represented 24,3% in the year of 2014.
The annual population growth rate in Turkey is 13,4th of a thousand. 91,8% of the population resides
in cities and districts. The average age in Turkey is 30,7. According to the data obtained, 96,1% of the
Turkish population is literate. The 15-64 age group, which corresponds to the working age group,
makes up 67,7% of the population (corresponding approximately to 52.640.512 people). When the
ramifications of the employment into industries is observed, it is concluded that 51% represents
services, 21,1% agriculture, 20,5% industry and 7,4% construction.
The analysis of the Turkish population information has been provided below in terms of Turkey in
general, cities and country. The data with regard to the years 2013 and 2014 has been compared.
TURKEY CITY COUNTRY
2013 2014 2013 2014 2013 2014
Non institutional Population (000) 74.033 74.947 50.675 51.129 23.358 23.818
Population of and above 15 years of age (000)
55.169 56.084 37.916 38.372 17.253 17.712
Labor force (000) 27.323 28.036 18.418 19.056 8.905 8.980
Employment (000) 24.433 25.194 16.196 16.849 8.237 8.346
Unemployment (000) 2.890 2.841 2.223 2.207 668 634
Not Included in the Labor Force (000) 27.846 28.048 19.498 19.316 8.348 8.733
Participation in the Labor Force Rate (%) 49,5 50,0 48,6 49,7 51,6 50,7
Employment Rate (%) 44,3 44,9 42,7 43,9 47,7 47,1
Unemployment Rate (%) 10,6 10,1 12,1 11,6 7,5 7,1
Indescribable Unemployment Rate (%) 12,9 12,3 12,3 11,9 15,5 14,1
Unemployment Rate in Young Population (15-24 age group) (%)
20,7 19,0 22,3 21,2 17,0 14,0
Population Data for the years of 2013 and 2014 (Source: Turkish Statistical Institute – TUIK)
9 Report No: 2015-020-GYO-004
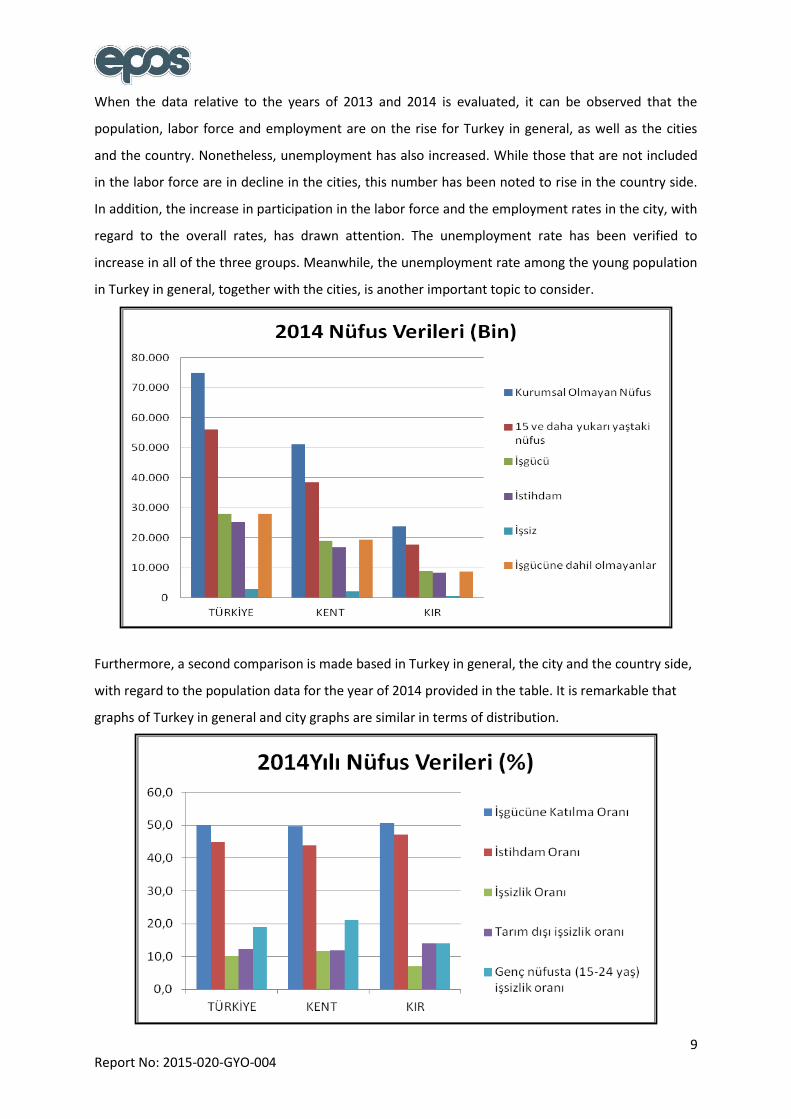
When the data relative to the years of 2013 and 2014 is evaluated, it can be observed that the
population, labor force and employment are on the rise for Turkey in general, as well as the cities
and the country. Nonetheless, unemployment has also increased. While those that are not included
in the labor force are in decline in the cities, this number has been noted to rise in the country side.
In addition, the increase in participation in the labor force and the employment rates in the city, with
regard to the overall rates, has drawn attention. The unemployment rate has been verified to
increase in all of the three groups. Meanwhile, the unemployment rate among the young population
in Turkey in general, together with the cities, is another important topic to consider.
Furthermore, a second comparison is made based in Turkey in general, the city and the country side,
with regard to the population data for the year of 2014 provided in the table. It is remarkable that
graphs of Turkey in general and city graphs are similar in terms of distribution.

10 Report No: 2015-020-GYO-004
In light of this data, the information regarding general economic overview and real estate industry
will be conveyed.
4.1.1 Global Economic Overview
Following all developments became necessary as a result of globalism and increasing economic links
of countries.
Primary problem in global economic crisis is deflationist (decrease of general price level) process and
correspondingly recession (stability-negative growth). For developing countries, on the other hand,
there are inflationist (general increase in prices) problems and low growth. Related situations have
different characteristics and reasons for every country; therefore, there is no standard prescription
for solution.
After global crisis, most important implementers of economy politics were central banks. Decisions
taken by big and efficient central banks in the world were crucial for not only their own country but
also became a guide for international fund mobility. Developing countries were influenced most by
its both positive and negative effects.
Right after the crisis, USA central bank Fed immediately started to use tools of ‘expansionary l
monetary policy’. For this purpose, many methods were implemented like interest discount, bond
intake, property intake and funding of financial system, and activating credit mechanisms. Through
this kind of monetary policy, financial stabilization, and by stimulating consumption and investment,
growth was aimed as a final goal to get rid of crisis.
Policies followed by Fed to get rid of crisis were extraordinary and with its differences in
implementation it revealed necessary pathway for other world banks. Fed, who immediately
responded to crisis and performed decision-making mechanisms, was followed by ECB (European
Central Bank) even if it was late. In the Far East, Japan central bank followed similar policies to get rid
of deflation and recession, which are primary problems of its economy. In parallel with relative
recovering of USA economy, Fed decreased bond retrieval amount on the date of December 2013 in
order to withdraw monetary expansion policy. Process initiated ahead of time expected in
developing countries (like Turkey, Brazil, Argentina, Indonesia, India) and this caused decrease in
local currencies and then partly outgoing of funds, which are short-term investment oriented. On
October 2014, USA central bank finished ‘cash flow by taking bonds’. However, transition to
increasing ‘interest’ phase, which will end actual monetary expansion, expected by the end of 2015.
In Fed meeting on September 2015, it was stated that (except for one member) concerns regarding
China and other developing countries increased value of dollar and decreased value commodities,
and by taking into consideration economic outlook, labour force market, inflation and risks about
11 Report No: 2015-020-GYO-004
them, there is no need to interest rate hike, although USA economy is strengthening and unutilized
capacity in labour force is decreasing.
Following inferences were deduced according to “World Economic Outlook” issue of October 2015
report, which is prepared by IMF twice a year:
Global growth rate in 2015 was expected as 3,10 %. This rate fell 0,30 % of year 2014. It is
also 0,20 % under of rate 3,30 %, which was stated in World Economic Outlook (WEO) report
January 2015. Ecpectancy of decrease was revised compare to previous report.
Ecpectancies of main countres and regions stayed indeterminate and unbalanced. Recovering
of delevoped countries compare to recent years, and for developing economics and markets
recession is foreseen again like previous 5 years. Some increasing market economies and
growth of countries exported petrol represent weak hopes.
Decrasing commodity price, reduced share capital increase negative risks of developing
economies, pressure on market and financial market instability, and therefore Fed tightens
financial conditions regarding developing countries condsidering expected increasing interest
and worsening global economic outlook.
Developed and developing countries have an important role as middle or long term
alliences one of which has decrease in growth rate and one of which has modest recovering.
Crisis leaved high rate of private and public deficit, financial sector weakness, low rate of
investments for some developed countries having low growth rate. For developing countries,
on the other hand, demographic transitions, investment explosions, revised growth in China,
decrease in commodity price and reregulation of the market is required.
Volatility was related with Greece dept meetings of Chinese authorities on June-July, sharp
drop of Chinese stock market and policy incentives.
Increasing policy interests of USA and worsening global outlook tightened more financial
situation of developing countries since last spring. Dollar, bond and long-term local currency
bond interests increased nearly 50-60 basis point and stock prices decreased, exchange rate
devalorized or pressured.
As a result of nuclear agreement with Iran and low global demand, petrol prices decreased.
Falling production activity in China, investment explosion in mining sector decreased metal
prices.
Countries implemented flexible exchange regime and exported commodities lost large
amount of money.
Developing economies experienced more sharp loss. Major developed economy currencies
experienced modest mobility.

12 Report No: 2015-020-GYO-004
This global factors and country specific developments indicate relatively weaker revival
compare to predicted amounts for 2015 and 2016 modest increase in growth expected for
developed economies increase chance of loss for the next year. Developments of this year
reflect a modest recovering of euro and returning of Japan to a positive growth, and
additionally falling in petrol prices and devaluation of money for some conditions.
Developments in developed economies, exporters –especially Norway and Canada- and in
Asia excluding Japan (especially Korea and Taiwan region of China) unemployment decreases
related to degrowth. However, growth in productivity is still weak even in USA where
recovering is stronger.
In 2016, some level of growth is expected in especially North America, however;
expectations are still low considering falling investments, negative demography and weak
productivity growth. Recently, decrease in petrol and other commodity prices must support
demand of developed economies, which are exporters of net commodities. On the other
hand, slowness in rising markets will indicate weaker importations.
Revised fall in commodity prices will pressure inflation in developed economies in next
months, and while revival is happening, expected development in core inflation will delay.
Although core inflation stayed more stable, it is still under targeted amount of central
bank. It is seen that inflation will be low towards falling unemployment and medium term
weak growth.
Growth expectancies are very different depending on regions and countries but outlook
became weak generally considering consecutive 5 years that decrease was foreseen. This
reflects a combination of factors.
For the most developing market economies external conditions became harder. While
money devaluation helps net exportation, depending on weak recoverings and medium level
expectancies for medium level growth, it is expected that future drawal of developed
economies will be more modest than prospected.
Capital flows slowed down in rising markets in last quarters and rising USA currency politics
from zero lower limit related with tightness of external financial conditions.
Decelaration of growth in China is parallel to expectancies until now, however reflections
in cross border are bigger than prospected. This reflected as lower imports to China and
lower prices of commodities (especially metal). Devaluation of Greece by China, volatilities
related to weakness in currencies of developing economies and increasing global risks
caused sharp decreases in property prices throughout world.
Rebound is expected for growth of rising markets and developing economies 2016.

13 Report No: 2015-020-GYO-004
This reflects lower recession and relative normalization in 2015 for countries having
economic trouble (Brazil, Russia, some countries in Latin America and in Middle East), and
spill-over effect depending on stronger recovering in economic activities of developed
economies and facilitating of sanctions for Islamic Republic of Iran.
Decreasing growth is expected for China even if it is gradually. Weakness in commodity
prices, slower global growth than expected and possibility of tighter global financial
conditions become a burden to low-income countries. While Chinese authorities implement
reforms towards decreasing financial infirmity strengthening role of market powers in
economy, they confront tradeoffs in their projection of transition to growth depending on
consumption without deceleration of activity.
Some countries, especially the ones with rich sources, have wide current account deficit
due to foreign direct investment. Correspondingly they are more vulnerable towards foreign
financial shock.
Risk balance is still downward. Low level of petrol and other commodities can constitute an
upward demand for commodity importers in some level. However, this complicates the
demand for commodity importers so some of them already confront with nervous initiation
conditions.
Vulnerability of rising markets in terms of continuing fall in commodity prices and sharp
rise in American Dollar is still proceeding and this may force balance sheet of companies in
some countries further.
4.1.2 Turkey Economic Outlook
Discipline constructed after 2001 crisis in Turkey economy succeed in issues like public dept, banking
rates, budget balance and until 2008 growth rate continuously increased. Economies developed in
between 2008-2012 influenced by global crisis at least. In this process, increase in yearly growth rate
relieved world economy. Countries like Turkey had brilliant performance after crisis. Recovering
abilities of developing countries are more rapid than developed economies. However, the main
problem of these economies is that they cannot keep gaining and stability. Turkey has problems like
lack of savings, unemployment, problems regarding general level of prices, added values of import
and export items, balance of exchange, middle-income trick, current deficit, demand failure,
technology deficiency, political and geographical risks. Average growth rate of Turkey is 4,8% for 92
years period. Briefly, potential growth rate in full employment level is 6-7%.

14 Report No: 2015-020-GYO-004
TURKEY GROWTH RATES (%)
2001 -5,70
2002 6,70
2003 5,30
2004 9,40
2005 8,40
2006 6,90
2007 4,70
2008 0,70
2009 -4,80
2010 9,20
2011 8,50
2012 2,10
2013 4,10
2014 2,90
Expectation 2015 3,00
Expectation 2016 2,90
Source:TCBM and IMF REPORT
IMF argued that political uncertainty will decrease domestic demand and revised growth
expectancies downwardly in its evaluation regarding Turkey economy in World Economic Outlook
Report.
According to this, growth expectancy is 3% for this year and 2,9% for the next year for Turkey. These
rates were stated as 3.1% and 3.6% in previous report.
Inflation expectation of IMF for Turkey increased from 6,6% to 7.40% for 2015 and 6,50% to 7.00%
for 2016.
Current deficit balance (current deficit/gross national product) expectations of IMF is -4-5% for 2015
and -4,7% for 2016. These rates were -4,2% and -4,8% in previous report.
IMF projected unemployment rate as 10,8% for this year and 11,6% for next year, which was 9,9% for
last year.
TL decreased in value towards especially USA dollar and Euro significantly as a result of global
instability and political, economic and other risks in Turkey. Since exchanges increased significantly,
fixed exchange rate approach was seen in especially real estate sales. Exchange rates for 01.10.2015
dated and 20.11.2015 dated appraisal reports were investigated. Exchange rate was instable in this
period and this instability continued after political elections of 2015. In this period average dollar
exchange was 2.91 TL, and average euro exchange was 3.22 TL. Fixed exchange rate is preferred in
GDP GROWTH RATE (TABLE) THROUGH YEARS IN
TURKEY
15 Report No: 2015-020-GYO-004
especially real estate sector because of above-mentioned reasons. Preferred exchange rate is below
the value in period of 01.10.2015 and 20.11.2015. For this reason, in the appraisal report, exchange
rate on the date of 02.11.2015 in accordance with central bank data since it is nearest value to the
current exchange value in the market.
Foreign market value is determined through selling rate of exchange was used, and for determining
TL value buying rate of exchange was used.
On the date of 02.11.2015, buying rate of exchange was 1 USD=2,8035 TL, and 1 EURO=3,0898 TL.
On the date of 02.11.2015, selling rate of exchange was 1 USD=2,8085 TL, and 1 EURO=3,0954 TL.
4.2 General Status of the Real Estate Industry
Real estate sector became a growing sector contrary to service, industry and rural sector recently.
Although insufficient capital source makes hard to invest to rural and industry sector, small scale
capital stock may be sufficient to invest in real estate sector. For this reason, real estate sector of
Turkey depends relatively on national capital. It is defined as leading sector since it mobilizes other
sectors and as sponge sector since it may absorb unqualified workers. Almost all production of real
estate sector counts as investment good. Real estate sector in Turkey develops through these
investments.
Construction sector, which was initiated with public investments, large scaled infrastructure projects
in early republic period, has influences of private sector through liberal economy effects in 1950s
especially in public expenditures. After the year of 1950, construction sector developed through
barrage, hydroelectric power stations, highways and housing investments. After 1980 in neo-liberal
period, on the other hand, housing investments became prominent as a result of increasing
migration. In liberal period after 2002, shopping mall, residence and housing investments gained
importance through influence of TOKİ.
In sectoral distribution of long term external debt in period of 2002-2014, construction-real estate
sector has impressive intensity.
Recently, it is seen that legal regulations concentrated in real estate sector. Moreover, sales of the
lands legally actualized in 2012 within the scope of the law “sale of the agricultural estate belonging
to Treasury, support for development of forest villagers and assessment of outside of the forest
borders on behalf of Treasury”, which is known in public opinion as “2B law”. However, these sales
became less than expected and did not influence building sector sufficiently. Advantages of urban
renewal law increased growth of real estate sector in 2013.
16 Report No: 2015-020-GYO-004
Decision directed to removal of restrictions over possessing real estate of foreigners through the law
“Law Organizing Property Sale to Foreigners” provided rising attractions of investors in especially
Russia, Middle East, and Asia. Purchasing real estate of foreigners started to increase gradually.
Additionally, following reasons have influence on development of real estate sector:
• Attraction of investors from different countries for Istanbul as a brand city, and laying the
foundations of Istanbul to be a financial center,
• Infrastructure projects that attract attentions (3rd bosphorus bridge, all tunnel projects in
bosphorus, 3rd airport, metro projects in metropolitans etc.)
• Increasing transportation opportunities, widening metropolitan borders and growing living
spaces,
• Urban renewal and related regulations,
• Continuing rural to urban migration,
• Effect of natural demand as a result of having young population,
• Changing nuclear family concept,
• Precautions for housing purchase and saving incentives to keep sector alive,
Tendency of procrastination of demand for housing and automotive, which is generally seen before
elections, was not influenced this year, on the contrary, these two sectors was quite alive. This may
be thought as a kind of protection method of customers related to expectation of increasing
demand.
It is evaluated that stabile development of real estate sector in Turkey in 2016 depends on political
and economic stability, interest of foreign investor and growth rate of economy. It is expected that
residence sale to foreigners will be stable because of stagnancy in other developing countries.
4.3 Information Regarding the Tourism Industry
The Tourism industry in Turkey has closed the year of 2013 with 34.910.098 tourists, on the other
hand, this number increased to 36.837.900 at the end of 2014 with 5,5% rate of increase.
Antalya became the first city in regards to foreign tourists visiting touristic centers, with a number of
11.9 million tourists. On the other hand, Istanbul has achieved a growth rate of 13% roughly. In
Muğla, the number recorded is approximately of 2,8%. For Izmir, on the other hand, there is 5%
decrease in numbers.

17 Report No: 2015-020-GYO-004
Number of Visitors in Touristic Centers
2012 2013 2014 Değişim
Antalya 10.299.366 11.535.762 11 941 954 3,5
İstanbul 9.381.670 10.474.867 11.842.983 13,1
Muğla 3.009.342 3.222.315 3.302.688 2,5
İzmir 1.368.929 1.943.253 1.847.567 - 4,9
Total of 4 Cities
24.061.319 25.232.944 28.935.192 10,9
Turkey 31.782.832 34.910.098 36.837.900 5,5
Source: Turkish Hoteliers Federation (TUROFED) Tourism Report 2014-Report 9
The revenue obtained in the Tourism industry, from the domestic and foreign tourists in the year of
2014, has increased 6.2%, thus reaching 34,3 billion dollars.
The revenue obtained from foreign tourists is 81,5% and from Turkish citizens living abroad and
visiting the country is 18,5%. Futhermore, revenues of 2014 includes 2.950.000 dollars for personal
expenditures and 8.302.954.000 dollars for tour package expenditures (Source: Turkish Hoteliers
Federation (TUROFED) Tourism Report 2014-Report 9).
While Turkey has managed to be one of the 20 biggest economies in the world (G20), it is ranked at
number 6 among the 10 touristic destinations with 37,8 million tourists according to data of UNWTO
(World Tourism Organization).
According to the real estate report for the year of 2014, which Deloitte has prepared for Turkey, one
interesting topic is the Tourism Strategy of the Ministry of Culture and Tourism for the year of 2023.
The target visitor number is set for 63 million and the total planned revenue (from foreign visitors) is
86 billion dollars. The aim is to enter the top 5.

18 Report No: 2015-020-GYO-004
4.4 Analysis of the Region Where the Real Estate is Situated
4.4.1 The City of Trabzon
The city of Trabzon has a surface area of 4,664 km2. Trabzon is surrounded by the city of Rize to the
east, the city of Giresun to the west, the cities of Gümüşhane and Bayburt to the south and the Black
Sea to the north. 67% of its lands consist of mountains, with 33% of these being covered with
plateaus; the mountains located to the south of the city reach all the way to the coast, in the forms
of valleys between ridges, intermittently covering areas amounting to 2.000 m2. Rich in underground
natural resources, the city of Trabzon possesses mines that have been operating since the 17th
century and are still being operated by local and foreign companies, in the present day.
Provincial Map of Trabzon and its location in Turkey
In accordance with the Address Based Population Registration results, the population of Trabzon is of
766.782. The economy of the city is mostly based on livestock and agriculture; whereas 65% of the
population earns their living from these activities, the remaining 35% is employed in areas such as
commerce, industry, handcraft, transportation, construction and other service industries.
Even though the city of Trabzon is a culturally and socially developed city, it could not yet achieve a
desired economic progression. Simultaneously, the city has a significant role in air transportation, on
account of being the only city with an airport in the Eastern Black Sea region.
Tea and hazelnuts are important livelihoods of the region. Moreover, the livestock production has
more of a focus on dairy and dairy products. Despite the fact that fishing constitutes another major
source of income for the city of Trabzon, fish production has suffered a perceivable decline as a
result of the continuous pollution of the Black Sea.
19 Report No: 2015-020-GYO-004
As an alternative to maritime fishing, there are 85 Trout Facilities operating in the inland water
sources today.
Predominant goods, which are being produced in the city and can be considered as an industry,
consist of flour and bran, dairy products, fish oil, ready wear and outfits, shoes, wood, concrete
poles, tires and rubber products, PVC tubes, copper, zinc, lead, aluminum, lead products, tubes,
galvanized sheet, brick, metal, automotive supply industry and surgical stitches.
There are more than 350 industrial enterprises, small and big. The number of employees in these
industries is of approximately 22.000 people, based on the city population.
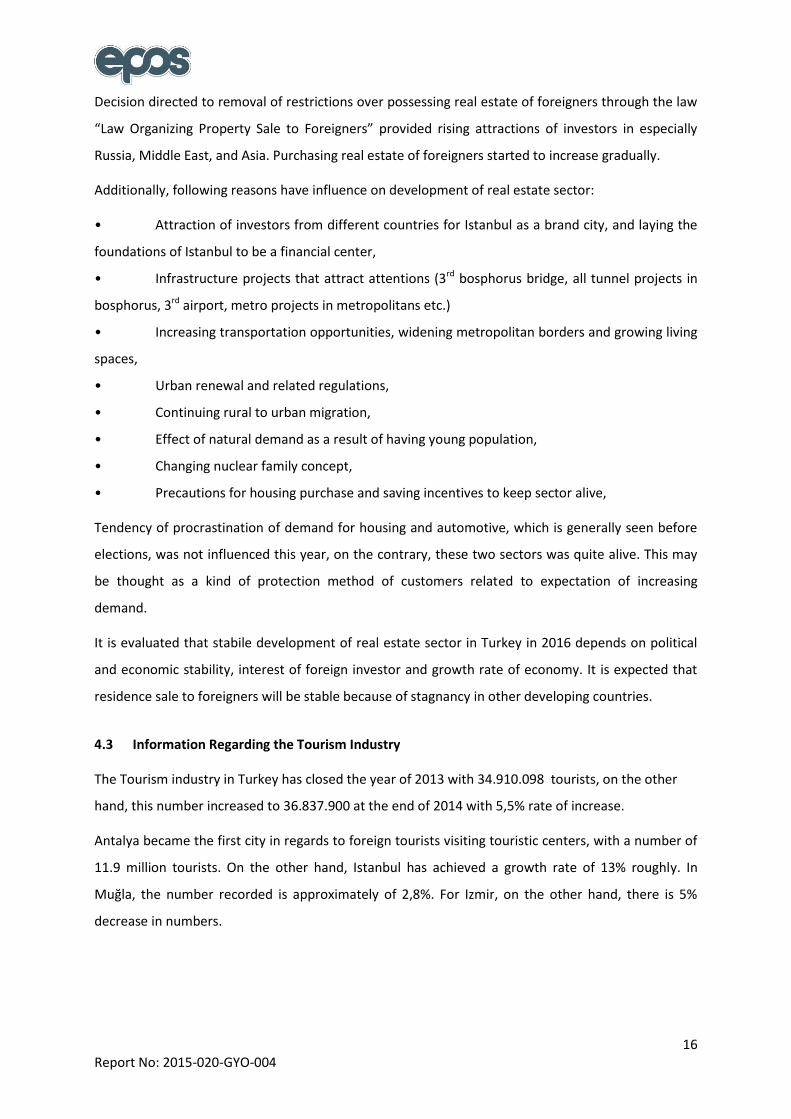
4.4.2 The District of Yomra
The district of Yomra is situated at 15 km north of Trabzon and has an area of 207km2. To the north
of the district is the Black Sea and the Yalıncak Ridges to the west, while to the east it reaches 250 m
eastwards along the Harmanlı River, in a way that covers the lower part of the Zil stream.

20 Report No: 2015-020-GYO-004
The Location of the District of Yomra
At the southern end is the district of Arsin and the Kilise (Church) Hills at an altitude of 2213 m; the
district of Maçka is located at its southern borders, as well. The district displays the typical Eastern
Black Sea climate. The fact that the land inclination is regular from the coast to the interior results in
the maritime climate affecting the interior region. However, due to the elevation, different climatic
characteristics can be observed at the coast, interior and heights.
The temperature drops 0,5 degrees every 100 meters. Accordingly, if the center of Yomra reaches 10
degrees during winter, the Sırhanlı Highlands are below zero. The fact that the land and mountains
are open to the northwest winds is interpreted as being the primary factor to change the humid air
of the Black Sea into rain. The average annual temperature is of 14.6 degrees. Moderate climate is
dominant in the area.
The district of Yomra is comprised of 4 municipalities and has a total of 18 neighborhoods and 17
villages, 4 in the Central Municipality, 6 in the Özdil Municipality, 3 in the Kaşüstü Municipality and 5
in the Oymalıtepe Municipality.
According to the population data obtained from the Turkish Statistical Institution 2014, the
population of the district is 32.394. This number constitutes 4.2% of the population of Trabzon.
Yomra is at a distance of 10 km from the center of Trabzon and 7 km to the Airport and the Black Sea
Technical University. With the construction of the coastal road that transverses the city to the north,
traffic density has been relieved in the center; thus, a low traffic density can be observed in the
district.
21 Report No: 2015-020-GYO-004
Within the borders of the district are the Novotel, the Saylamlar Hotel, the Sandal Hotel, the Palace
of Justice of Trabzon, the Dünya Ticaret Merkezi (World Trade Center), sales and services for a
number of car brands, furniture dealers, fish farms, the Cevahir Outlet Shopping Mall, the Deepomar
Shopping Mall, Petrol Office, Shell, BP and Opet gas stations, as well as the Petrol Ofisi Fuel Storage
Center for the Eastern Black Sea and Eastern Anatolia region.
Furthermore, the Eurasia University campus, which is the first Foundation University of Trabzon, is
located within the district, along with the Student Dorms of the Credit and Dormitories Institution
with a capacity for 4.000 students.
4.4.3 Information Regarding the Tourism Industry in Trabzon and the Hotel Market
Trabzon is a city that goes beyond the traditional tourism based solely on the “sea, beach and sun”
trio, possessing “alternative tourism” options. The first aspect to consider should be “nature
tourism”. The tourism potential of the city relies heavily on nature and culture, containing various
other tourism opportunities, as well. A variety of works in the city center and its surrounding areas,
which include cultural spaces, tourism centers, special nature protection areas, in addition to the
applicability of eco-tourism, can serve as an example of the diversity. Moreover, with the qualified
facilities coming along, the progresses in the congress tourism area in recent years, as well as the
health institutions, have helped to boost the tourism in the city.
The tourism industry in the city of Trabzon primarily depends on domestic tourism. However, in
recent years, foreign tourists have shown considerable interest in the region, especially from Middle
Eastern and the Arab countries. Existing demand contributed tourism economy of the region
significantly, therefore, investors focuses on tourism sector. There are hotels in the region that are
planned and will be constructed in 2016.
In accordance with the data obtained from the Provincial Directorate of Culture and Tourism, the
area currently has 34 accommodation facilities with an operating permit and 17 accommodation
facilities with a municipality permit. Among the facilities with an operating permit, there are two 5
Star Hotel, five 4 Star Hotels, seven 3 Star Hotels, eight 2 Star Hotels and one mountain lodge
accommodation facility. Besides 5 Star Ramada Hotel and Hilton Garden Inn serve for both Trabzon
and nearby districts. When the room prices are verified, it has been noted that the prices vary with
regard to the room type. Breakfast included prices for analyzed 4 and 5 Star hotels are in between
190 – 290 TL. Tourism data of Trabzon is presented on the table below.

22 Report No: 2015-020-GYO-004
5 INFORMATION IN REGARD TO THE REAL ESTATE SUBJECT TO THE APPRAISAL
5.1 Information in Regard to the Location, Site and Environment of the Real Estate
The real estate is located at the postal address of Cumhuriyet Neighborhood, Devlet Karayolu
Avenue, No: 17, Kaşüstü – Yomra / Trabzon and situated at the Block No: 209 and Plot No: 12. Inside
the plot is the operating 4 Star NOVOTEL.
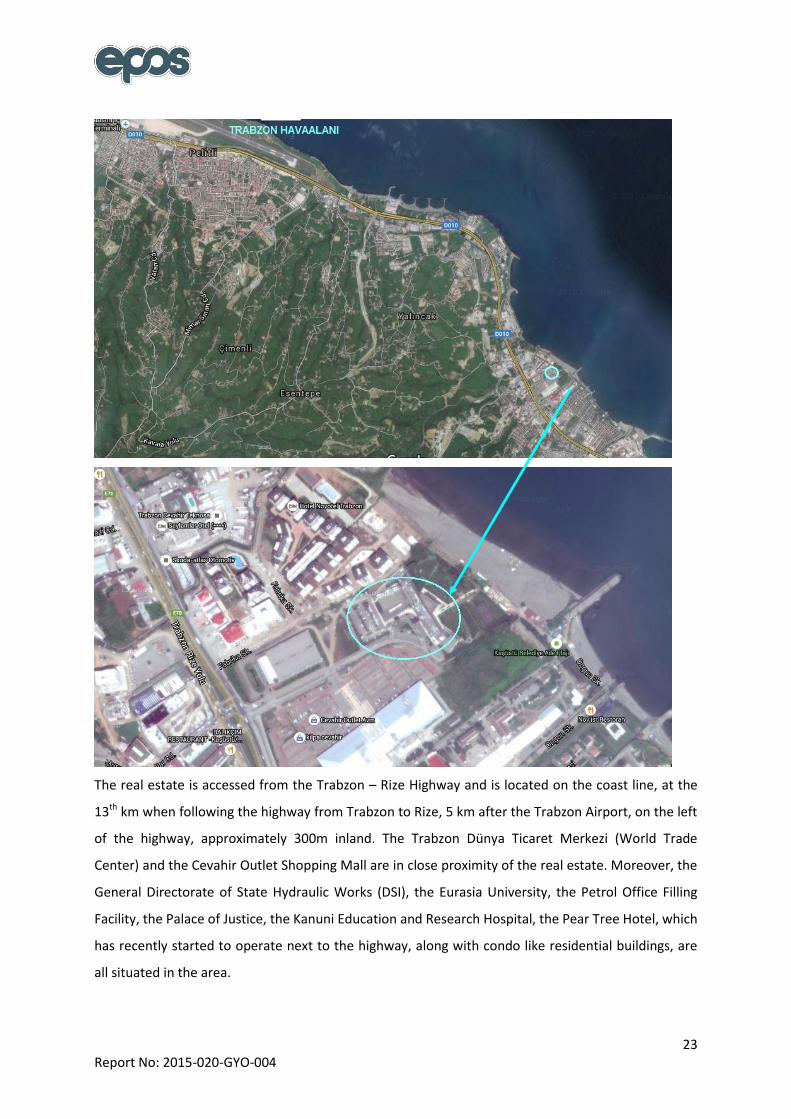
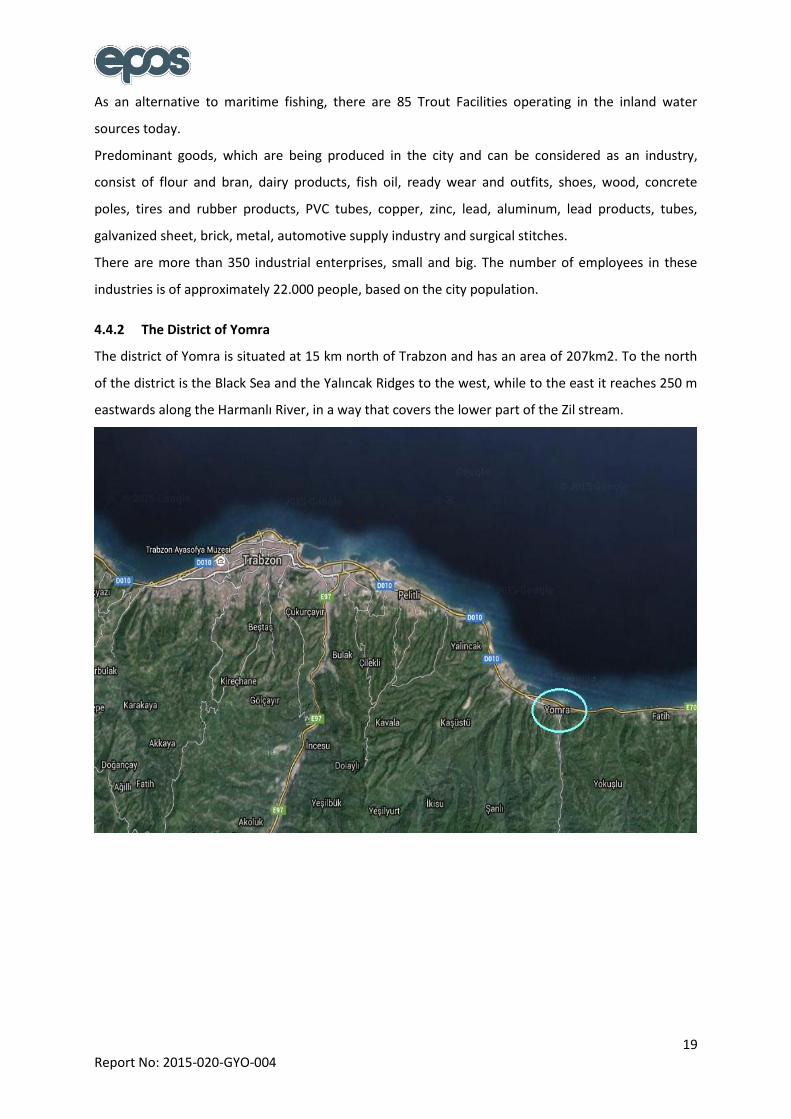
23 Report No: 2015-020-GYO-004
The real estate is accessed from the Trabzon – Rize Highway and is located on the coast line, at the
13th km when following the highway from Trabzon to Rize, 5 km after the Trabzon Airport, on the left
of the highway, approximately 300m inland. The Trabzon Dünya Ticaret Merkezi (World Trade
Center) and the Cevahir Outlet Shopping Mall are in close proximity of the real estate. Moreover, the
General Directorate of State Hydraulic Works (DSI), the Eurasia University, the Petrol Office Filling
Facility, the Palace of Justice, the Kanuni Education and Research Hospital, the Pear Tree Hotel, which
has recently started to operate next to the highway, along with condo like residential buildings, are
all situated in the area.

24 Report No: 2015-020-GYO-004
The town of Kaşüstü has become an area of interest, as a consequence of the development of
investments such as the World Trade Center, the Novotel, the Trabzon Forum Shopping Mall and the
Kanuni Education and Research Hospital with a capacity for 400 beds. One significant advantage of
the town is the fact that the land is flat and ample, making it suitable for construction and,
subsequently, creating the possibility for the city to develop towards Kaşüstü. Besides the low-rise
villa type buildings present in the area, residential buildings with 8-9 stories have started to appear,
in recent years. The real estate is easily accessed by private vehicle, as well as by public
transportation.
5.2 Information with Regard to the Land Registry of the Real Estate
City : Trabzon Trabzon
District : Yomra Yomra
Neighborhood : Cumhuriyet Cumhuriyet
Section No : G43b02c1c2ad2 G43b02c1c2ad2
Block No : 209 209
Plot No : 12 12
Surface Area : 13.450,31 m2 -
Owner : Trabzon World Trade Center Inc. Akfen Real Estate Investment Trust Inc.
Type : Concrete Hotel Building, its Appurtenances and Land
Independent and Permanent Construction Right for the Duration of 49 Years, on behalf of Akfen Real Estate Investment Trust Inc.
Title Date : 27.02.2008 27.02.2008
Roll No : 389 389
Volume No : 37 37
City : 3628 3630
The real estate subject to the appraisal is registered at the Land Registry Directorate of Yomra,
Neighborhood of Cumhuriyet, with the volume no: 37, page no: 3628. It consists of a “Concrete
Hotel Building, its Appurtenances and Land” type and the owner is “Trabzon World Trade Center
Inc.”
The real estate in question has been established as an Independent and Permanent “Construction
Right” for the duration of 49 years, on behalf of Akfen Real Estate Investment Trust Inc.; additionally,
it has been registered on the page number 3630 (Neighborhood of Cumhuriyet, volume no: 37) at
the land registry book. Land registry information relative to the real estate found in both pages of the
land registry book has been provided above, while the restrictions are provided below.

25 Report No: 2015-020-GYO-004
5.2.1 Investigation of the Land Registry of the Real Estate
From the survey performed at the Land Registry Directorate of Yomra, on the date of 09.12.2015, at
11:30 local time, the following restrictions, in regards to the real estate subject to this appraisal, have
been provided below, pursuant to the land registries dated 03.12.2014.
Statements Section
Subject to the application of the Article number 22 of the Law number 3402, 2nd clause,
paragraph (a), dated 11.03.2014 and Roll No: 682
Appurtenances Section
Construction Right: Establishment of Independent and Permanent Construction Right for the
duration of 49 years, on behalf of Akfen Real Estate Investment Trust Inc., dated 27.02.2008
and Roll no:389
Annotations Section
Lease Annotation on behalf of Tomaris Tourizm Inc. (Has been leased for the duration of 25
years by the Independent and Permanent Construction Right owner Akfen Real Estate
Investment Trust Inc.) Dated 24.09.2008 and Roll no: 1761.
Pledges Section
A-I: Existence of a 1st degree mortgage, dated 28.01.2015, roll no. 3407 on behalf of Credit
Europe Bank N.V with an amount of 173.052.185,00 EURO, at an interest rate of 7,2%, until
its release is announced.
Considerations:
This mortgage is joint with Osmangazi Tapu Md. Altınova Quarteri 3198 block 67 plot,
Kocasinan Tapu Md. Pervane Quarteri 2420 block 9 plot, Zeytinburnu Tapu Md. Zeytinburnu
Quarter 774 block 55 plot, Şehitkâmil Tapu Md. Yaprak Quarter 5020 block 2 plot, Esenyurt
Tapu Md. Yakuplu Quarter 404 block 39 plot, Akyurt Tapu Md. Balıkhisar-İmar Quarter 1843
block 5 plot, Yomra Tapu Md. Kaşüstü/Cumhuriyet Quarter 209 block 12 plot, Çınarlı Quarter
585 block 2 plot independen unit no 1, Çınarlı Quarter, 585 block 2 plot independen unit no
12.

26 Report No: 2015-020-GYO-004
5.2.2 Changes that Have Occurred in the Land Registry of the Real Estate within the Last Three
Years
There are no buying or selling activities with regard to the real estate, within the last three
years.
It has been noted that there is an annotation of “Subject to the application of Article number
22 of the Law number 3402, 2nd clause, paragraph (a), dated 11.03.2014 and Roll No: 682” in
the statement section of the real estate.
The Article Number 22 of the Land Registry Cadastral Law number 3402 is as follows:
CADASTRAL LAW Law Number: 3402 Date of Acceptance: 21/06/1987 Places where cadastral work has been performed previously: Article 22 – (Change: 22/02/2005 – 5304 / Article 6) Places that have been subject to cadastral work and land registry previously by way of survey, registry or limitation, cannot be subjected to cadastral work for a second time. If these places have been subjected to such cadastral work, this work, together with all its results, is considered invalid and a necessary process is carried out pursuant to the Turkish Civil Law number 1026. If a lawsuit is not filed in due time, the second cadastral work will be cancelled by the land registry directorate. However, the provision described in the 1st clause is not applied in the case of the occurrence of the following; a) With reference to the processes of the land registration, cadastral work or modification; in places where the nature of its application is lost for the purpose of correcting errors caused by limitations, measurements, drawing and calculations, where it becomes insufficient or missing due to technical reasons, or in places where the cadastral maps need to be modified for detecting a noncompliance with the actual ground borders, and in places where land registration and cadastral work have been done for the reason of corrections in the land registry, b) In places where only land registration has been made or where renovations will be made, pursuant to the Registration Law number 2859 and the Law Regarding the Renovation of the Cadastral Section Plan, as well as in places that are subject to the Process that Will Be Applied to the Structures Against the Zoning and Slums Regulations number 2981 and to the provision of the Law Regarding the Amendment of an Article of the Zoning Law number 6785, The areas where the (a) paragraph of the 2nd clause will be applied are determined by the General Directorate of Land Office; besides, at least 15 days before the start of the works, it is announced through the usual channels in the center of the region, as well as the center of the city it is related to; moreover, if there are any local newspapers, an announcement is also made. Provisions of the Articles number 2, 4, 14, 17, 19 and 21, together with the paragraph (B) of the Article number 13 and the paragraphs (B), (C) and (D) of the Article 20, are not applied. The public agencies and institutions that have been excluded in the course of the registration and cadastral works are recorded. With regard to the forest areas that have been registered in the land registry, the ones containing maps that are in compliance with the technical maps are transferred directly to the land registry book, whereas the others are first made suitable with the technical regulations and then transferred to the land registry book.
27 Report No: 2015-020-GYO-004
Related statement takes place in land register but does not exist in TAKBIS register. Reason is
renewal as required by law numbered 3402, article 22/A, registered as 17.11.2015-3410. Effective
date: 09.10.2015. Surface area of real estate changed from 13.450,71 m² to 13.450,31 m² with
implementation of 22/A.
5.2.3 Opinion Whether There Is an Obstacle In Including the Investment Trust Portfolio in Terms
of Land Title Records to the Real Estate Within the Scope of the Capital Market Legislation
There is a 1st degree joint mortgage on the “Construction Right” of the Akfen Real Estate Investment
Trust Inc. for an amount of 173.052.185,00 Euro, on behalf of Credit Bank Europe N.V., as well as a
lease annotation for the duration of 25 years.
With regard to the mortgages mentioned in the pledges section of the real estate, referring to the
construction right of the real estate; in accordance with the letter of the mortgage owner Credit Bank
Europe on the date of 07.12.2015, in accordance with the agreement between Akfen Real Estate
Investment Trust Inc. and Accor SA., the project constituted as warrant of financing syndicated loan
provided in 2015, on the purpose of investment financing regarding 1 hotel under construction with
brand of “IBIS”, and 8 hotels, which have been operating with brands of “IBIS” and “NOVOTEL”.
The related letter from the Credit Bank Europe has been enclosed herewith.
Pursuant to the 1st clause of the Article number 30 of the Communiqué Regarding the Real Estate
Investment Trusts Principles, published in the 28.05.2013 dated official gazette of the Capital Market
Board, can only institute mortgage, hypothecate or other limited rights on the assets in the portfolio
throughout the purchase of real estates, real estate projects and rights with regard to a real estate,
for the purpose of referring to the financing of these actions or of providing credit for investments.
Pursuant to the related article of the Communiqué in question, the mortgages on the real estate do
not constitute an obstacle for the real estate to be included in the Real Estate Investment Trust
portfolio, within the scope of the Capital Market regulations.
5.3 Inspection of the Zoning Information of the Real Estate
From the analysis performed on the date of 09.12.2015, at the Zoning Directorate of the Municipality
of Kaşüstü of the city of Trabzon, information regarding the current zoning status with document no
50407666-10.99-2976 has been provided below:
The real estate subject to the appraisal study is found under the legend of Central Work Space “MIA”
within the scope of the “Finalized Development Plan of Kaşüstü (Yomra) Trabzon” with a scale of
1/1000, by an approved Resolution with the date of 20.11.2012 and number 33. Structuring Terms,
Example: 2,00-Hmax (max. height): 35m. Setback distance: in accordance with the legislation.
28 Report No: 2015-020-GYO-004
The 09.12.2015 dated zoning status document with no 50407666-10.99-2976, which has been
obtained from the Zoning Directorate of the Yomra Municipality, has been enclosed herewith.
5.3.1 Plan, License, Diagram and Similar Documents with Regard to the Real Estate
As a result of the inspection of the files regarding the real estate subject to the appraisal at the
Zoning Directorate Archives of the Kaşüstü Municipality;
It has been noted that the following are present:
17.11.2006 dated approved architectural project
17.11.2006 dated Construction Permit with the number 1-11
27.08.2008 dated Occupancy Permit with the number 08-13
The Construction Permit and the Occupancy Permit have been enclosed herein. In accordance with
the onsite surveys, there is no difference between the current and the legal statuses. The present
approved architectural project is compatible with the construction permit and the 27.08.2008 dated
“Occupancy Permit” with the number 08-13.
5.3.2 Building Inspection Institution and Maintenance
The real estate subject to the appraisal study is not liable to the 29.06.2001 dated Law Regarding the
Structure Inspection Number 4708. Pursuant to the Article number 11, the city of Trabzon is not
among the pilot cities in which the Law is enforced.
The Article Number 11 states that “The pilot cities in which this Law will be enforced are Adana,
Ankara, Antalya, Aydın, Balıkesir, Bolu, Bursa, Çanakkale, Denizli, Düzce, Eskişehir, Gaziantep, Hatay,
Istanbul, İzmir, Kocaeli, Sakarya, Tekirdağ and Yalova.”
Informational Note: It has been established, from the construction permit, that the engineering
record of the real estate in question, in relation to the structure inspection, has been done by “Rıza
Nuri NALBANTOĞLU” with the address of Kahramanmaraş Caddesi, Yıldırımlar İşhanı , Kat: 2 No: 223
Trabzon; the static project has been done by “Kemal ÇAM” with the address of G. Paşa Mahallesi,
Kasımoğlu Çıkmazı, Aygün Apartmanı, Kat: 3, No: 19 Trabzon; the electrical project has been done by
“Mustafa Yılmaz ODABAŞ” with the address of Uzun Sokak, Tabakhane Yolu, No: 105/F Trabzon; and,
lastly, the mechanical inspection project has been done by “Şaban BÜLBÜL” with the address of Uzun
Sokak, Çinili Çarşı, Kat: 2, No: 411 Trabzon.
5.3.3 Changes that Have Occurred in the Legal Status (Changes in the Zoning Plan,
Nationalization, etc.) of the Real Estate within the Last Three Years
With regard to the real estate subject to the appraisal study, in the finalized development plan with
the approval date of 01.02.2006 and a scale of 1/1000, for the area of Yomra – Kaşüstü, when the

29 Report No: 2015-020-GYO-004
zoning legend was “Congress Area, Expo and Fair Area, Central Work Area, Tourism Accommodation
Area, Fuel Station, Sports Facility Area, Public Building Area”, it has been determined that its legend
has been altered within the scope of the “Kaşüstü (Yomra) Trabzon Revision Finalized Development
Plan” with the 20.11.2012 dated Resolution and number 33, along with a scale of 1/1000, into
Central Work Area “MIA”; however, it has additionally been noted that the structuring terms did not
suffer any changes. (Example: 2,00 – Hmax (max height): 35m, Setback Distance: In accordance with
the legislation)
5.3.4 Opinion Whether the Necessary Permit and Documents Pursuant to the Legislation are
Accurate and Complete
All of the necessary permits and licenses, such as the Zoning Status Document, the Approved
Architectural Project, the Construction Permit and Occupancy Permit required by the Turkish Law,
have been obtained in full and their types have been classified, with regard to the hotel real estate
subject to the appraisal. The real estate in question is registered in the land registry book as
“CONCRETE HOTEL BUILDING, ITS APPURTANENCES AND LAND”.
5.3.5 Opinion Whether There Is an Obstacle in Including the Investment Trust Portfolio in Terms
of Zoning Information to the Real Estate within the Scope of the Capital Market Legislation
With regard to the real estate subject to the appraisal study, in the finalized development plan with
the approval date of 01.02.2006 and a scale of 1/1000, for the area of Yomra – Kaşüstü, when the
zoning legend was “Congress Area, Expo and Fair Area, Central Work Area, Tourism Accommodation
Area, Fuel Station, Sports Facility Area, Public Building Area”, it has been determined that its legend
has been altered within the scope of the “Kaşüstü (Yomra) Trabzon Revision Finalized Development
Plan” with the 20.11.2012 dated Resolution and number 33, along with a scale of 1/1000, into
Central Work Area “MIA”; however, it has additionally been noted that the structuring terms did not
suffer any changes.
The approved architectural project, the construction permits and the occupancy permits, concerning
the current building on the plot, are readily available; furthermore, it has been determined that there
are no obstacles that prevent the real estate from being included in the Real Estate Investment
Trusts portfolio, within the scope of the Capital Market Board Regulations.
5.3.6 Statement that the Detailed Information, along with the Value in Question Regarding the
Project, are Completely in Connection with the Project and that, in the case of Executing a
Different Project, the Resulting Value Might Vary
The appraisal study in question is not carried out within the scope of the “project evaluation”.

30 Report No: 2015-020-GYO-004
5.4 Physical Characteristics of the Real Estate
5.4.1 Structural Construction Characteristics of the Real Estate
The real estate subject to this appraisal study consists of a “Concrete Hotel Building, its
Appurtenances and Land” type of real estate, with an area of 13.450,71 m2, located in the city of
Trabzon, district of Yomra, at the address of Neighborhood of Kaşaüstü/Cumhuriyet, Block No: 209,
Plot No: 12. There currently is a concrete building in the plot being operated under the name of
NOVOTEL, constructed in an attached manner, as a mono block, with a basement floor + ground floor
+ 5 regular floors.
The total gross construction area specified in the architectural project, as well as in the construction
permit and the occupancy permit belonging to the real estate subject to the appraisal study, is of
15.232,00 m2. Since the real estate has been constructed in accordance with the approved
architectural project, this area has been based on the appraisal report.
31 Report No: 2015-020-GYO-004
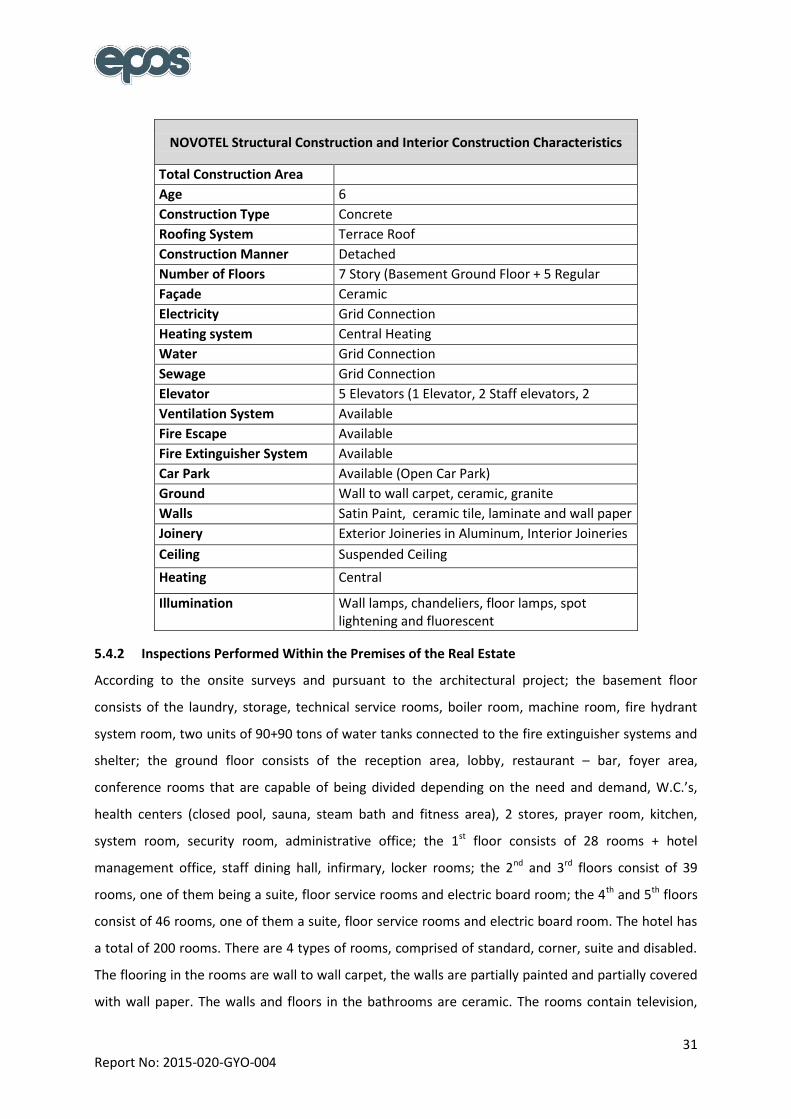
NOVOTEL Structural Construction and Interior Construction Characteristics
Total Construction Area
Age 6
Construction Type Concrete
Roofing System Terrace Roof
Construction Manner Detached
Number of Floors 7 Story (Basement Ground Floor + 5 Regular Floors +terrace) Façade Ceramic
Electricity Grid Connection
Heating system Central Heating
Water Grid Connection
Sewage Grid Connection
Elevator 5 Elevators (1 Elevator, 2 Staff elevators, 2 customer elevators) Ventilation System Available
Fire Escape Available
Fire Extinguisher System Available
Car Park Available (Open Car Park)
Ground Wall to wall carpet, ceramic, granite
Walls Satin Paint, ceramic tile, laminate and wall paper
Joinery Exterior Joineries in Aluminum, Interior Joineries in Wood Ceiling Suspended Ceiling
Heating Central
Illumination Wall lamps, chandeliers, floor lamps, spot lightening and fluorescent
5.4.2 Inspections Performed Within the Premises of the Real Estate
According to the onsite surveys and pursuant to the architectural project; the basement floor
consists of the laundry, storage, technical service rooms, boiler room, machine room, fire hydrant
system room, two units of 90+90 tons of water tanks connected to the fire extinguisher systems and
shelter; the ground floor consists of the reception area, lobby, restaurant – bar, foyer area,
conference rooms that are capable of being divided depending on the need and demand, W.C.’s,
health centers (closed pool, sauna, steam bath and fitness area), 2 stores, prayer room, kitchen,
system room, security room, administrative office; the 1st floor consists of 28 rooms + hotel
management office, staff dining hall, infirmary, locker rooms; the 2nd and 3rd floors consist of 39
rooms, one of them being a suite, floor service rooms and electric board room; the 4th and 5th floors
consist of 46 rooms, one of them a suite, floor service rooms and electric board room. The hotel has
a total of 200 rooms. There are 4 types of rooms, comprised of standard, corner, suite and disabled.
The flooring in the rooms are wall to wall carpet, the walls are partially painted and partially covered
with wall paper. The walls and floors in the bathrooms are ceramic. The rooms contain television,
32 Report No: 2015-020-GYO-004
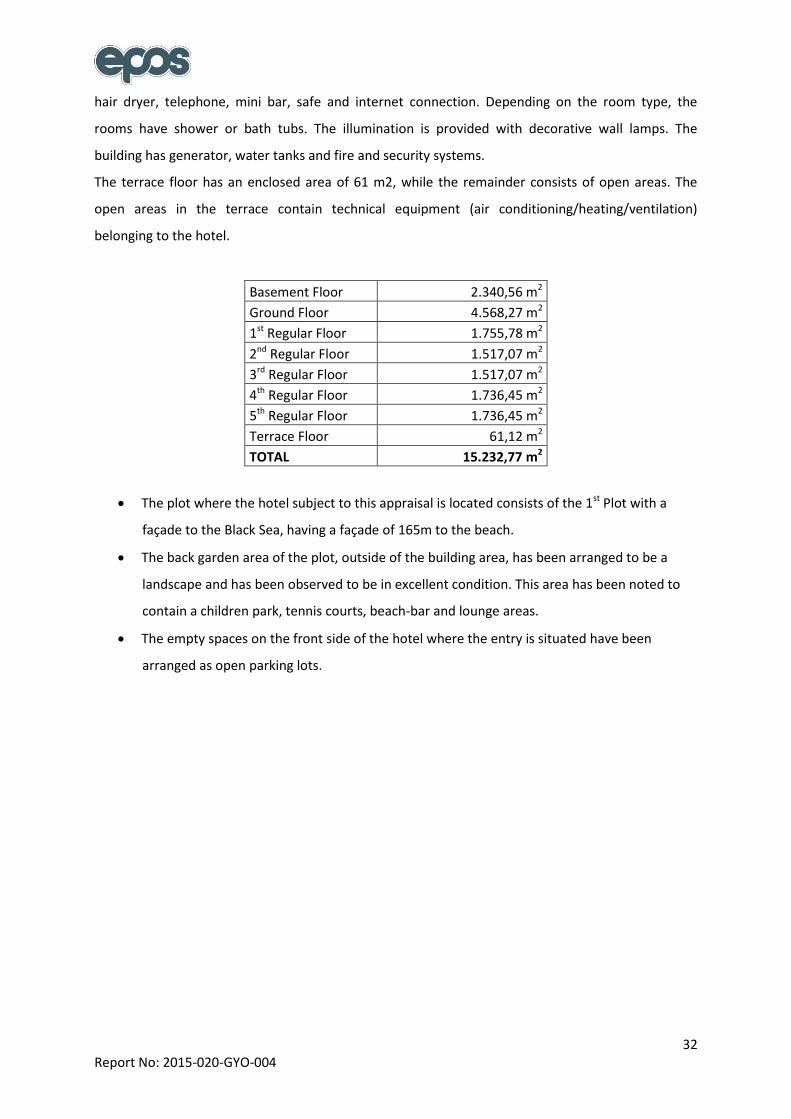
hair dryer, telephone, mini bar, safe and internet connection. Depending on the room type, the
rooms have shower or bath tubs. The illumination is provided with decorative wall lamps. The
building has generator, water tanks and fire and security systems.
The terrace floor has an enclosed area of 61 m2, while the remainder consists of open areas. The
open areas in the terrace contain technical equipment (air conditioning/heating/ventilation)
belonging to the hotel.
Basement Floor 2.340,56 m2
Ground Floor 4.568,27 m2
1st Regular Floor 1.755,78 m2
2nd Regular Floor 1.517,07 m2
3rd Regular Floor 1.517,07 m2
4th Regular Floor 1.736,45 m2
5th Regular Floor 1.736,45 m2
Terrace Floor 61,12 m2
TOTAL 15.232,77 m2
The plot where the hotel subject to this appraisal is located consists of the 1st Plot with a
façade to the Black Sea, having a façade of 165m to the beach.
The back garden area of the plot, outside of the building area, has been arranged to be a
landscape and has been observed to be in excellent condition. This area has been noted to
contain a children park, tennis courts, beach-bar and lounge areas.
The empty spaces on the front side of the hotel where the entry is situated have been
arranged as open parking lots.

33 Report No: 2015-020-GYO-004
6 FACTORS AFFECTING AND DETERMINING THE VALUE OF THE REAL ESTATE
6.1 Factors that Limit or Negatively Affect the Appraisal Process
There are no limiting or negatively affecting factors hindering the appraisal studies in question.
6.2 Swot Analysis
Strengths
The owner of the property is Trabzon World Trade Center Inc. and the real estate has a
“Construction Right” for the duration of 49 years, on behalf of Akfen Real Estate Investment
Trust Inc.
An Independent and Permanent “Construction Right”, valid until the year of 2057, has been
registered on a separate page of the land registry book.
All of the required permits and documents (construction permit and occupancy permit) have
been obtained and duly classified.
The Hotel has a façade towards the Black Sea, with a view to the sea and to the landscape.
The Hotel is situated on the Black Sea coastal road, close to the Trabzon Airport and to the
city center; in addition, it is easily accessible.
The city of Trabzon is developing towards the Yomra – Kaşüstü region. Public agencies and
institutions, such as the Palace of Justice, the Trabzon World Trade Center, the Kanuni
Education and Research Hospital, the Eurasia University and the General Directorate of State
Hydraulic Works are all located in the vicinity of the real estate. Furthermore, new residential
estates projects are being developed in the area.
The real estate does not have any infrastructural problems. It benefits from all urban
services.
The lessee is a brand belonging to the international hotel operating company, Accor Group,
operating as a 4 Star Hotel under the brand name of NOVOTEL. The lease agreement, which
has been signed with this company for the duration of 25 years, has been annotated in the
land registry book.
The Hotel located in the city of Trabzon, which is more prominent in the nature tourism
industry, is also at an advantage for the more traditional summer tourism due to its location.
The region has witnessed an increase in demand and interest in recent years, especially from
the Middle East and Arab countries. The number of foreign visitors in the region has
increased.

34 Report No: 2015-020-GYO-004
Weaknesses
The real estate is located at 300 m inland of the Trabzon – Rize coastal road; thus, it has
low perceptibility.
The hotel does not have a closed car park. Currently, there is only an open car park
available.
Opportunities
The region of Yomra – Kaşüstü, where the real estate is situated, is a developing area of the
city of Trabzon and is determined to be in demand. At a distance of approximately 500 m
from the real estate, the 5 Star Pear Tree Hotel has started to provide services next to the
Black Sea coastal road.
There is an increasing interest in the area, especially from the Middle East and the Arab
countries. This situation helps to increase the occupancy rates during the months of APRIL –
OCTOBER.
Threats
Fund transfers are expected to be increased by USA Central Bank after ending monetary
easing. This situation generally may influence real estate market negatively.
There are 5 Star hotel investments in the region, which are planned or already invested for
next years.
It was found out that 5 Star hotel will be constructed over parcel placed on southwest front.
6.3 Exemplary Share Rate in the Projects that Will Be Performed According to the Revenue
Sharing and Flat for Land Methods
Revenue Sharing and Flat for Land Methods have not been employed throughout this appraisal
study.
6.4 Methods and Eligibility Motives Employed in the Appraisal of the Real Estate
Since the real estate subject to this appraisal study is an operating Hotel generating revenue, the
Revenue Approach and Cost Approach Methods have been employed. In the Cost Approach
Management, the “Land value” has been determined according to the Exemplary Approach.
6.4.1 Exemplary Approach
As a result of the surveys performed in the vicinity of the real estate, no other recently sold
exemplary hotels with a similar location, nature and structuring conditions to those of the real estate
subject to the appraisal have been found. However, information relative to land examples with
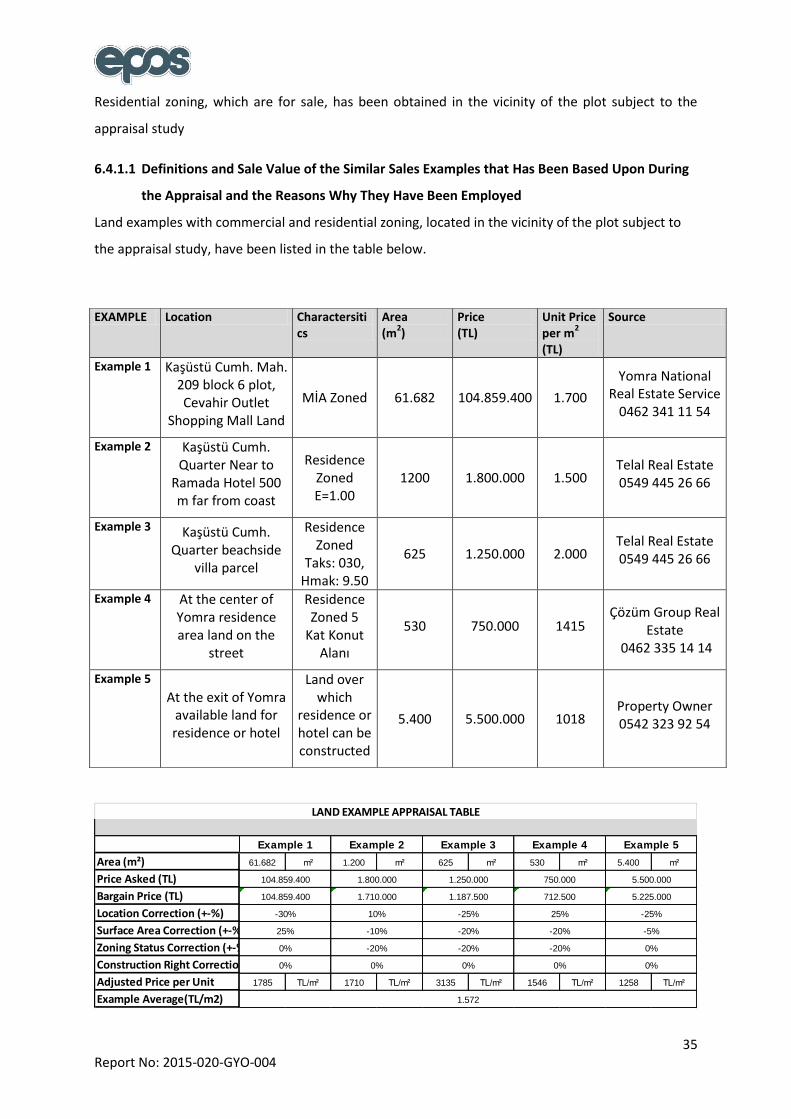
35 Report No: 2015-020-GYO-004
Residential zoning, which are for sale, has been obtained in the vicinity of the plot subject to the
appraisal study
6.4.1.1 Definitions and Sale Value of the Similar Sales Examples that Has Been Based Upon During
the Appraisal and the Reasons Why They Have Been Employed
Land examples with commercial and residential zoning, located in the vicinity of the plot subject to
the appraisal study, have been listed in the table below.
Area (m²) 61.682 m² 1.200 m² 625 m² 530 m² 5.400 m²
Price Asked (TL)
Bargain Price (TL)
Location Correction (+-%)
Surface Area Correction (+-%)
Zoning Status Correction (+-%)
Construction Right Correction (+-%)
Adjusted Price per Unit 1785 TL/m² 1710 TL/m² 3135 TL/m² 1546 TL/m² 1258 TL/m²
Example Average(TL/m2)
0%
1.572
0% 0% 0% 0%
0% -20% -20% -20% 0%
25% -10% -20% -20% -5%
-30% 10% -25% 25% -25%
104.859.400 1.710.000 1.187.500 712.500 5.225.000
104.859.400 1.800.000 1.250.000 750.000 5.500.000
LAND EXAMPLE APPRAISAL TABLE
Example 1 Example 2 Example 3 Example 4 Example 5
EXAMPLE Location Charactersitics
Area (m
2)
Price (TL)
Unit Price per m
2
(TL)
Source
Example 1
Kaşüstü Cumh. Mah.
209 block 6 plot, Cevahir Outlet
Shopping Mall Land
MİA Zoned 61.682 104.859.400 1.700
Yomra National Real Estate Service
0462 341 11 54
Example 2 Kaşüstü Cumh. Quarter Near to
Ramada Hotel 500 m far from coast
Residence Zoned E=1.00
1200 1.800.000 1.500 Telal Real Estate 0549 445 26 66
Example 3 Kaşüstü Cumh. Quarter beachside
villa parcel
Residence Zoned
Taks: 030, Hmak: 9.50
625 1.250.000 2.000 Telal Real Estate 0549 445 26 66
Example 4 At the center of Yomra residence area land on the
street
Residence Zoned 5
Kat Konut Alanı
530 750.000 1415 Çözüm Group Real
Estate 0462 335 14 14
Example 5
At the exit of Yomra available land for residence or hotel
Land over which
residence or hotel can be constructed
5.400 5.500.000 1018 Property Owner 0542 323 92 54

36 Report No: 2015-020-GYO-004
- Example 1 is a land, which is MİA zoned and have Cevahir Outlet AVM building. Authorities in
National Real Estate stated that land value of real estate was determined again in 2015 and
related report stated that unit m² value is 1700TL./m².
- Possible room for negatiation, selling-buying costs and commision of real estate agent were
taken into consideration.
- It was seen that prices change according to location and position of residence zoned lands and
there is not particular price range considering investigations and examples above.
- Even though this data limitation, according to the onsite surveys and in light of the fact that
the location, position and surface area of the real estate affect, in a positive manner, where
the facility used as a hotel is situated, the price per unit of the land has been estimated to
be around 1.572 TL =~ 1.600 TL / m2.
- 1/3 of the price unit per m2 of the land has been acknowledged as the bare ownership value
and 2/3 have been acknowledged as the construction right value.
- The total lease right for the duration of 49 years has been calculated by comparing the remaining
lease duration, on the date that this report has been prepared, to the total duration time, and
determining the unit price per m2 of the right of construction.

37 Report No: 2015-020-GYO-004
Price per Unit Land Value of the Remaining Time for the Right of Construction* (TL)
874
Size of the Land 13.450,31
Total Land Value (TL) 11.755.954
Total Land Value (Euro) 3.804.762
Unit Land Value 1.600
Right of Construction Value Rate 2/3
Remaining Time for Right of Construction (YEARS) 40,15
Price per Unit Land Value of the Remaining Time for the Right of Construction * (TL)
874
* When the remaining time value resulting from the right of construction of the land is calculated, for the right of construction value of the land, it has been employed as 2/3 at the first
step. Afterwards, the remaining time from the right of construction is calculated in order to determine the current unit value of the land for the right of construction.
Unit Land Value of the Remaining Time for the Right of Construction
=(Unit Land Value x The coefficient of the right of construction for 49 years x The remaining time from the right of construction
Unit Land Value of the Remaining Time for the Right of Construction
=(1.600 TL x 2/3 x 40,15 /49)
Professional opinion of Appraiser:
As a result of the surveys performed, it has been observed that there is no land stock with “Tourism
Facility Zoning” in the area of the real estate subject to the appraisal; for this reason, a concrete land
example with similar characteristics could not be provided. In view of the onsite research and
interviews, it has been noted that, in consideration of the above provided examples, the prices asked
for the land examples with residential zoning vary according to their location and position; moreover,
there is no specific price range available.
Even though this data limitation, in accordance with the onsite surveys and in light of the location,
position, plot surface area, “MIA” zoning status, formation of its surroundings, having a revenue
generating hotel on the plot, having obtained all of the required permits and licenses and having
done their classifications with regard to the real estate subject to the appraisal, it has been
established, considering its legal status and the prices of the surrounding lands with residential
zoning, that the land unit price per m2 is 1.600 TL / m2. Land unit price per m2 for the remaining
construction right duration has been calculated as 874 TL.
6.4.2 Cost Approach
The building cost values in this analysis, with the cost generation approach, the technical
specifications of the buildings, the material and labor quality that has been employed during the

38 Report No: 2015-020-GYO-004
construction of the buildings, the construction values of the buildings that have similar
characteristics in the market, the industry experience relative to similar hotel costs and the
construction costs in relation to the real estate subject to the appraisal submitted by Akfen Real
Estate Investment Trust Inc. have been taken into consideration.
COST TABLE (LAND+BUILDING)
NOVOTEL FLOOR AREAS (m2)
UNIT COSTS (€) TOTAL COST (€)
AMORTIZED TOTAL COST (€)
Basement Floor 2.341 500 1.170.280 1.123.469 Ground Floor 4.568 1.200 5.481.924 5.262.647 1
st Regular Floor 1.755 1.200 2.106.216 2.021.967
2nd
Regular Floor 1.517 1.200 1.820.484 1.747.665 3
rd Regular Floor 1.517 1.200 1.820.484 1.747.665
4th
Regular Floor 1.736 1.200 2.083.740 2.000.390 5
th Regular Floor 1.736 1.200 2.083.740 2.000.390
Terrace Floor 61 500 30.560 29.338 TOTAL CONSTRUCTION COST 15.232
16.597.428 15.933.531
External Miscellaneous Works (***) (€)
500.000
TOTAL STRUCTURE VALUE (€)
16.433.531
LAND VALUE (€)
3.804.762
TOTAL VALUE (€)
20.238.293
(*) The total construction cost value has been calculated by scrutinizing the verified construction cost information taken from Akfen Real Estate Investment Trust Inc. together with our industry experience in relation to the similar hotel costs. (**) The date of completion of the construction of the real estate subject to the appraisal is 27.08.2008. The appraisal has been conducted by taking into consideration the age and physical status of the real estate. (***) An approximate cost has been established for costs such as field concrete, barbed wire encompassing the plot, arrangement of the open car park, etc.
6.4.3 Cost Discount / Development Approach
Considering that the real estate subject to this appraisal study is a property that brings in revenue,
the revenue approach method has not been employed. The revenue projections of NOVOTEL have
been provided below.
NOVOTEL PROJECTION:
The hotel subject to the appraisal has a capacity for 140 rooms.
It has been estimated that the occupancy rate of the hotel in the year of 2016 will be of 77%
and that this rate will increase until the year of 2018, which will then reach 80%, thus
continuing in this manner, in the following years.

39 Report No: 2015-020-GYO-004
It has been assumed that the hotel will be operating for 365 days a year.
The hotel prices have been calculated based on the room-breakfast system. Taking into
account the performance of the hotel in the previous year, along with the surveys performed
in regards to the tourism industry in the area, it has been estimated that the average price
for a room will be 85 EUR, in the year of 2016. Moreover, it has been anticipated that this
price will increase annually based on the inflation rate in the Euro Zone (2,5%).
Considering the performance of the facility, it has been assumed that the room revenues will
constitute 68% of the total revenue, whereas the total department revenues will be around
32%.
It has been acknowledged that the Gross Operating Profit (GOP) of the Hotel for the year of
2015 will be of 46%, that it will increase to 48% from the year of 2021 and that it will increase
to 50% in the year of 2026, remaining stable in the following years.
It has been noted that the Real estate tax cost is of 38.983 Euro. The Real estate tax value
increases 3% annually.
According to the information obtained from Akfen Real Estate Investment Trust Inc, it has
been acknowledged that the insurance value for the year of 2016 will be of 12.864 Euro and
that it will remain so, on account of the estimation made that there will not be any increases
in the insurance premium by Akfen Real Estate Investment Trust Inc. in the following years.
Furniture Fixture Renovation Reserve has been obtained by reason of the agreements
executed with ACCOR; as a result, it has been determined that the rate will consist of 3,5% of
the annual gross revenue.
With regard to the 30.10.2008 dated agreement signed between Trabzon World Trade
Center Inc. and Akfen Real Estate Investment Trust Inc.; in relation to the Construction Right
value, no payment will be made in the first five years; moreover, the value has been
calculated to be of 50.000 USD between the 6th and 10th years, of 75.000 USD between the
11th and 15th years, of 100.000 USD in the 16th year and, from the 17th year until the end of
the 49th year, the value will continue to be of 100.000 USD with an additional annual 1.000
USD.
In the case that no agreements are signed until the end of the 49 years duration period,
Akfen Real Estate Investment Trust Inc. has agreed to empty and transfer the real estate.
In the appraisal study, the 10 year Eurobond interest rate of 4,80% has been employed as the
“Risk Free Revenue Rate”. (In this appraisal study, the most-ready 10 year EURO base
Eurobond revenue rate has been employed as the risk free revenue rate.)
Uncertainty in investments is related with the concept of risk. Height of risk is explained as
possibility of law gained revenue than expected. There are two types of risks: systematic risk

40 Report No: 2015-020-GYO-004
and unsystematic risk. Systematic risks are classified as interest rate, purchase power risk
(inflation), market risk, political risk, exchange risk. Unsystematic risks are classified as
business and sector risk, liquidity risk, management risk, risk of cannot fulfill responsibilities,
taxation and revenue differences risk. Additional warrant to meet mentioned risk is risk prim.
It can be calculated as difference in expected revenues of a risked property and less risked
property. In 2006, rebound of economic growth is expected for rising markets and
developing economies. Risks balance is still downwards.
Invested money for immovable is founder element of capital rate. It is defined also as
expected average revenue rate or interest rate. Average expected rate from immovable
investments must not be less than revenue of safe lending. Accordingly, reduction ratio is
determined as 9,5% for “operating model cash flow”.
In the course of the studies, the exchange rate for 1 EUR has been acknowledged at 2,8035
TL, in accordance with the 02.11.2015 dated buying rate exchange of the Central Bank of
Turkey.
It has been assumed that all payments are made in cash.
Throughout the course of the studies, the Euro Zone inflation rate of 2,5% has been
employed as the inflation rate.
In net present value calculations, mid-year factor (0,5) was considered to present more
realist value.
Within the scope of the International Valuation Standards (IVSC), taxes and VAT have not
been included in the studies.

41 Report No: 2015-020-GYO-004
Yıl 0 1 2 3 4 5 6 7 8 9 10 11 12 13 14 15 16 17 18 19 20 21
Tarih 31.12.2015 31.12.2016 31.12.2017 31.12.2018 31.12.2019 31.12.2020 31.12.2021 31.12.2022 31.12.2023 31.12.2024 31.12.2025 31.12.2026 31.12.2027 31.12.2028 31.12.2029 31.12.2030 31.12.2031 31.12.2032 31.12.2033 31.12.2034 31.12.2035 31.12.2036
Sözleşme Süresi 7 8 9 10 11 12 13 14 15 16 17 18 19 20 21 22 23 24 25 26 27 28
REVENUES
ROOM REVENUES
Annual Average Occupancy Rate, % 77% 79% 80% 80% 80% 80% 80% 80% 80% 80% 80% 80% 80% 80% 80% 80% 80% 80% 80% 80% 80%
Average Room Price, EUR 85 87 89 92 94 96 99 101 104 106 109 112 114 117 120 123 126 129 133 136 139
Total Room Revenues 4.777.850 4.995.242 5.222.526 5.353.089 5.486.916 5.624.089 5.764.691 5.908.808 6.056.529 6.207.942 6.363.140 6.522.219 6.685.274 6.852.406 7.023.716 7.199.309 7.379.292 7.563.774 7.752.869 7.946.690 8.145.358
DEPARMENT REEVENUES
Total Department Revenues 2.258.748 2.361.521 2.468.970 2.530.694 2.593.962 2.658.811 2.725.281 2.793.413 2.863.248 2.934.830 3.008.200 3.083.405 3.160.491 3.239.503 3.320.490 3.403.503 3.488.590 3.575.805 3.665.200 3.756.830 3.850.751
TOTAL REVENUES 7.036.598 7.356.763 7.691.496 7.883.783 8.080.878 8.282.900 8.489.972 8.702.222 8.919.777 9.142.772 9.371.341 9.605.624 9.845.765 10.091.909 10.344.207 10.602.812 10.867.882 11.139.579 11.418.069 11.703.521 11.996.109
EXPENSES
DEPARTMENT EXPENSES
Total Department Expenses 2.766.438 2.892.311 3.023.912 3.099.509 3.176.997 3.143.940 3.222.539 3.303.102 3.385.680 3.470.322 3.366.186 3.450.340 3.536.599 3.625.014 3.715.639 3.808.530 3.903.743 4.001.337 4.101.370 4.203.905 4.309.002
Net Department Expenses 4.270.159 4.464.452 4.667.584 4.784.274 4.903.881 5.138.960 5.267.434 5.399.119 5.534.097 5.672.450 6.005.155 6.155.284 6.309.166 6.466.895 6.628.568 6.794.282 6.964.139 7.138.242 7.316.699 7.499.616 7.687.106
OPERATING EXPENSES
General Management Expenses 492.562 514.973 538.405 551.865 565.661 579.803 594.298 609.156 624.384 639.994 655.994 672.394 689.204 706.434 724.094 742.197 760.752 779.771 799.265 819.246 839.728
Marketing 105.549 110.351 115.372 118.257 121.213 124.243 127.350 130.533 133.797 137.142 140.570 144.084 147.686 151.379 155.163 159.042 163.018 167.094 171.271 175.553 179.942
Energy 422.196 441.406 461.490 473.027 484.853 496.974 509.398 522.133 535.187 548.566 562.280 576.337 590.746 605.515 620.652 636.169 652.073 668.375 685.084 702.211 719.767
Total Operating Expenses 1.020.307 1.066.731 1.115.267 1.143.149 1.171.727 1.201.020 1.231.046 1.261.822 1.293.368 1.325.702 1.358.844 1.392.816 1.427.636 1.463.327 1.499.910 1.537.408 1.575.843 1.615.239 1.655.620 1.697.010 1.739.436
GROSS OPERATING PROFIT 3.249.853 3.397.721 3.552.317 3.641.125 3.732.153 3.937.939 4.036.388 4.137.297 4.240.730 4.346.748 4.646.311 4.762.469 4.881.530 5.003.569 5.128.658 5.256.874 5.388.296 5.523.003 5.661.079 5.802.605 5.947.671
FIXED EXPENSES
Real Estate Tax 38.983 40.153 41.357 42.598 43.876 45.192 46.548 47.944 49.383 50.864 52.390 53.962 55.581 57.248 58.965 60.734 62.556 64.433 66.366 68.357 70.408
Insurance 12.864 12.864 12.864 12.864 12.864 12.864 12.864 12.864 12.864 12.864 12.864 12.864 12.864 12.864 12.864 12.864 12.864 12.864 12.864 12.864 12.864
Furniture Fixture and Renıvation Reserve 246.281 257.487 269.202 275.932 282.831 289.901 297.149 304.578 312.192 319.997 327.997 336.197 344.602 353.217 362.047 371.098 380.376 389.885 399.632 409.623 419.864
Annual Construction Right Value (Land) 45.367 45.367 45.367 68.051 68.051 68.051 68.051 68.051 68.051 68.051 68.958 69.865 70.773 71.680 72.587 73.495 74.402 75.309 76.217 77.124 78.031
Total Fixed Expenses 343.495 355.870 368.790 399.444 407.621 416.008 424.611 433.436 442.489 451.775 462.208 472.887 483.818 495.008 506.463 518.191 530.198 542.491 555.079 567.968 581.166
TOTAL EXPENSES 4.130.240 4.314.912 4.507.969 4.642.102 4.756.345 4.760.968 4.878.196 4.998.361 5.121.536 5.247.799 5.187.238 5.316.043 5.448.053 5.583.349 5.722.013 5.864.129 6.009.784 6.159.067 6.312.069 6.468.883 6.629.604
NET OPERATING REVENUE 2.906.358 3.041.851 3.183.527 3.241.681 3.324.533 3.521.931 3.611.777 3.703.861 3.798.241 3.894.973 4.184.102 4.289.581 4.397.712 4.508.560 4.622.194 4.738.683 4.858.098 4.980.512 5.106.000 5.234.638 5.366.504
NET CASH FLOW 2.906.358 3.041.851 3.183.527 3.241.681 3.324.533 3.521.931 3.611.777 3.703.861 3.798.241 3.894.973 4.184.102 4.289.581 4.397.712 4.508.560 4.622.194 4.738.683 4.858.098 4.980.512 5.106.000 5.234.638 5.366.504

42 Report No: 2015-020-GYO-004
Yee 22 23 24 25 26 27 28 29 30 31 32 33 34 35 36 37 38 39 40 41 42
Date 31.12.2037 31.12.2038 31.12.2039 31.12.2040 31.12.2041 31.12.2042 31.12.2043 31.12.2044 31.12.2045 31.12.2046 31.12.2047 31.12.2048 31.12.2049 31.12.2050 31.12.2051 31.12.2052 31.12.2053 31.12.2054 31.12.2055 31.12.2056 27.02.2057
Duration of Agreement 29 30 31 32 33 34 35 36 37 38 39 40 41 42 43 44 45 46 47 48 49
REVENUES
ROOM REVENUES
Annual Average Occupancy Rate, % 80% 80% 80% 80% 80% 80% 80% 80% 80% 80% 80% 80% 80% 80% 80% 80% 80% 80% 80% 80% 80%
Average Room Price, EUR 143 146 150 154 158 162 166 170 174 178 183 187 192 197 202 207 212 217 223 228 234
Total Room Revenues 8.348.992 8.557.716 8.771.659 8.990.951 9.215.725 9.446.118 9.682.271 9.924.327 10.172.436 10.426.747 10.687.415 10.954.601 11.228.466 11.509.177 11.796.907 12.091.829 12.394.125 12.703.978 13.021.578 13.347.117 2.280.133
DEPARMENT REEVENUES
Total Department Revenues 3.947.020 4.045.695 4.146.837 4.250.508 4.356.771 4.465.690 4.577.333 4.691.766 4.809.060 4.929.287 5.052.519 5.178.832 5.308.303 5.441.010 5.577.035 5.716.461 5.859.373 6.005.857 6.156.004 6.309.904 1.077.942
TOTAL REVENUES 12.296.011 12.603.412 12.918.497 13.241.459 13.572.496 13.911.808 14.259.603 14.616.093 14.981.496 15.356.033 15.739.934 16.133.432 16.536.768 16.950.187 17.373.942 17.808.291 18.253.498 18.709.835 19.177.581 19.657.021 3.358.074
EXPENSES
DEPARTMENT EXPENSES
Total Department Expenses 4.416.727 4.527.145 4.640.324 4.756.332 4.875.240 4.997.121 5.122.050 5.250.101 5.381.353 5.515.887 5.653.784 5.795.129 5.940.007 6.088.507 6.240.720 6.396.738 6.556.656 6.720.573 6.888.587 7.060.802 1.206.220
Net Department Expenses 7.879.284 8.076.266 8.278.173 8.485.127 8.697.255 8.914.687 9.137.554 9.365.993 9.600.143 9.840.146 10.086.150 10.338.303 10.596.761 10.861.680 11.133.222 11.411.553 11.696.841 11.989.262 12.288.994 12.596.219 2.151.854
OPERATING EXPENSES
General Management Expenses 860.721 882.239 904.295 926.902 950.075 973.827 998.172 1.023.127 1.048.705 1.074.922 1.101.795 1.129.340 1.157.574 1.186.513 1.216.176 1.246.580 1.277.745 1.309.688 1.342.431 1.375.991 235.065
Marketing 184.440 189.051 193.777 198.622 203.587 208.677 213.894 219.241 224.722 230.340 236.099 242.001 248.052 254.253 260.609 267.124 273.802 280.648 287.664 294.855 50.371
Energy 737.761 756.205 775.110 794.488 814.350 834.708 855.576 876.966 898.890 921.362 944.396 968.006 992.206 1.017.011 1.042.437 1.068.497 1.095.210 1.122.590 1.150.655 1.179.421 201.484
Total Operating Expenses 1.782.922 1.827.495 1.873.182 1.920.012 1.968.012 2.017.212 2.067.642 2.119.334 2.172.317 2.226.625 2.282.290 2.339.348 2.397.831 2.457.777 2.519.222 2.582.202 2.646.757 2.712.926 2.780.749 2.850.268 486.921
GROSS OPERATING PROFIT 6.096.362 6.248.771 6.404.991 6.565.116 6.729.243 6.897.474 7.069.911 7.246.659 7.427.826 7.613.521 7.803.859 7.998.956 8.198.930 8.403.903 8.614.000 8.829.350 9.050.084 9.276.336 9.508.245 9.745.951 1.664.933
FIXED EXPENSES
Real Estate Tax 72.520 74.696 76.936 79.245 81.622 84.071 86.593 89.190 91.866 94.622 97.461 100.385 103.396 106.498 109.693 112.984 116.373 119.864 123.460 127.164 130.979
Insurance 12.864 12.864 12.864 12.864 12.864 12.864 12.864 12.864 12.864 12.864 12.864 12.864 12.864 12.864 12.864 12.864 12.864 12.864 12.864 12.864 12.864
Furniture Fixture and Renıvation Reserve 430.360 441.119 452.147 463.451 475.037 486.913 499.086 511.563 524.352 537.461 550.898 564.670 578.787 593.257 608.088 623.290 638.872 654.844 671.215 687.996 117.533
Annual Construction Right Value (Land) 78.939 79.846 80.753 81.661 82.568 83.475 84.383 85.290 86.197 87.105 88.012 88.919 89.827 90.734 91.641 92.549 93.456 94.363 95.271 96.178 97.085
Total Fixed Expenses 594.683 608.525 622.701 637.220 652.091 667.323 682.925 698.907 715.279 732.052 749.234 766.838 784.873 803.352 822.286 841.686 861.565 881.936 902.810 924.202 358.461
TOTAL EXPENSES 6.794.331 6.963.165 7.136.207 7.313.564 7.495.343 7.681.656 7.872.617 8.068.342 8.268.950 8.474.563 8.685.309 8.901.314 9.122.712 9.349.637 9.582.228 9.820.626 10.064.979 10.315.435 10.572.147 10.835.271 2.051.602
NET OPERATING REVENUE 5.501.680 5.640.247 5.782.290 5.927.896 6.077.153 6.230.152 6.386.986 6.547.752 6.712.546 6.881.470 7.054.625 7.232.118 7.414.056 7.600.551 7.791.715 7.987.664 8.188.519 8.394.401 8.605.435 8.821.749 1.306.473
NET CASH FLOW 5.501.680 5.640.247 5.782.290 5.927.896 6.077.153 6.230.152 6.386.986 6.547.752 6.712.546 6.881.470 7.054.625 7.232.118 7.414.056 7.600.551 7.791.715 7.987.664 8.188.519 8.394.401 8.605.435 8.821.749 1.306.473
CUMULATIVE CASH FLOW 92.016.998 97.657.245 103.439.535 109.367.431 115.444.584 121.674.735 128.061.722 134.609.474 141.322.020 148.203.489 155.258.115 162.490.233 169.904.289 177.504.840 185.296.554 193.284.218 201.472.737 209.867.138 218.472.573 227.294.322 228.600.794
Risk Free Revenue Rate 4,80% 4,80% 4,80%
Risk Premium 4,20% 4,70% 5,20%
Discount Rate 9,00% 9,50% 10,00%
NET CURRENT VALUE (Euro) 46.667.550 44.009.899 41.602.660
NET APPROXIMATE CURRENT VALUE (Euro) 46.670.000 44.010.000 41.600.000
NET APPROXIMATE CURRENT VALUE (TL) 144.201.000 135.982.000 128.536.000

43 Report No: 2015-020-GYO-004
6.4.4 Value of the Real Estate with Regard to the Lease Revenue
According to the Lease conditions documents submitted to our company by Akfen Real Estate
Investment Trust Inc.;
For the hotel subject to this appraisal study, for which Akfen Real Estate Investment Trust
Inc. has a “Construction Right”, it has been established that, for the annual lease amount, the
international hotel operating company Accor Group will pay 22% (twenty-two) of its gross
profit for Novotel Hotel, 25% (twenty five) of its gross profit for the Ibis Hotel or the amount
higher than 70% of its adjusted gross profit (AGOP) for the year of 2015. Pursuant to the
agreement terms, from the year of 2016 onwards, the share ratio of the adjusted gross profit
(AGOP) has been established at 72,5%.
The Adjusted Gross Operating Profit (AGOP) has been calculated by subtracting a ratio of 4%
operator share, which will be paid to ACCOR, from the gross operating profit (GOP) and a
ratio of 4% Furniture Fixture and Renovation Reserve from the gross revenue.
Adjusted Gross Operating Profit = Gross Operating Profit – Accor Fee + Furniture and Fixture
Renovation Reserve
The “Construction Right” of the hotel subject to this appraisal study belongs to Akfen Real
Estate Investment Trust Inc. and the hotel is being operated by the international hotel
operating company Accor Group. It has been assumed that the hotel will be operated
according to the current concept, throughout the duration of the “Construction Right.
Euro has been the currency used in the study, with an exchange rate of 1 EURO = 3,0898 TL.
Throughout the course of the studies, the Euro Zone inflation rate of 2,5% has been
employed as the inflation rate. It has been assumed that the facility will be operating for 365
days a year. The renovation expenses, which will be met by the investor for the lease of the
hotel, have been based on the ratio of 5% of the renovation expenses calculated in the lease
alternative. It was assumed that renewal studies will be conducted by tenant.
According to the information obtained from Akfen Real Estate Investment Trust Inc., it has
been acknowledged that the insurance value for the year of 2016 will be of 12.864Euro and
that it will remain so, on account of the estimation made that there will not be any increases
in the insurance premium by Akfen Real Estate Investment Trust Inc. in the following years.
The lease revenue generated in relation to the hotel leased out to the Accor Group has been
guaranteed with a lease agreement for the duration of 49 years. It has been assumed that
the risk premiums in obtaining the lease revenue will be low for Akfen Real Estate
Investment Trust Inc. and, therefore, it has been calculated accordingly. The discount rate
has been estimated at 7,50% by adding a 2,70% “Risk Premium” to the 4,80% to the Risk Free
Revenue.
44 Report No: 2015-020-GYO-004
In net present value calculations, mid-year factor (0,5) was considered to present more
realist value.
Within the scope of the International Valuation Standards (IVSC), taxes and VAT have not
been included in the studies.

45 Report No: 2015-020-GYO-004
Date 31.12.2015 31.12.2016 31.12.2017 31.12.2018 31.12.2019 31.12.2020 31.12.2021 31.12.2022 31.12.2023 31.12.2024 31.12.2025 31.12.2026 31.12.2027 31.12.2028 31.12.2029 31.12.2030 31.12.2031 31.12.2032 31.12.2033 31.12.2034 31.12.2035 31.12.2036
Duration Of Agreement 7 8 9 10 11 12 13 14 15 16 17 18 19 20 21 22 23 24 25 26 27 28
AKFEN OBTAINED LEASE
LEASE FROM NOVOTEL REVENUE 1.548.052 1.618.488 1.692.129 1.734.432 1.777.793 1.822.238 1.867.794 1.914.489 1.962.351 2.011.410 2.061.695 2.113.237 2.166.068 2.220.220 2.275.726 2.332.619 2.390.934 2.450.707 2.511.975 2.574.775 2.639.144
Operator Share 281.464 294.271 307.660 315.351 323.235 331.316 339.599 348.089 356.791 365.711 374.854 384.225 393.831 403.676 413.768 424.112 434.715 445.583 456.723 468.141 479.844
Furniture Fixture and Renıvation Reserve 281.464 294.271 307.660 315.351 323.235 331.316 339.599 348.089 356.791 365.711 374.854 384.225 393.831 403.676 413.768 424.112 434.715 445.583 456.723 468.141 479.844
NOVOTEL HOTEL AGOP 1.948.021 2.036.656 2.129.323 2.182.556 2.237.120 2.374.598 2.433.963 2.494.812 2.557.182 2.621.111 2.825.038 2.895.663 2.968.055 3.042.256 3.118.313 3.196.271 3.276.177 3.358.082 3.442.034 3.528.085 3.616.287
USED NOVOTEL LEASE REVENUE 1.948.021 2.036.656 2.129.323 2.182.556 2.237.120 2.374.598 2.433.963 2.494.812 2.557.182 2.621.111 2.825.038 2.895.663 2.968.055 3.042.256 3.118.313 3.196.271 3.276.177 3.358.082 3.442.034 3.528.085 3.616.287
Real Estate Tax 38.983 40.153 41.357 42.598 43.876 45.192 46.548 47.944 49.383 50.864 52.390 53.962 55.581 57.248 58.965 60.734 62.556 64.433 66.366 68.357 70.408
Insurance 12.864 12.864 12.864 12.864 12.864 12.864 12.864 12.864 12.864 12.864 12.864 12.864 12.864 12.864 12.864 12.864 12.864 12.864 12.864 12.864 12.864
Furniture Fixture and Renıvation Reserve 5% 14.073 14.714 15.383 15.768 16.162 16.566 16.980 17.404 17.840 18.286 18.743 19.211 19.692 20.184 20.688 21.206 21.736 22.279 22.836 23.407 23.992
Annual Construction Right (Land) 45.367 45.367 45.367 68.051 68.051 68.051 68.051 68.051 68.051 68.051 68.958 69.865 70.773 71.680 72.587 73.495 74.402 75.309 76.217 77.124 78.031
CASH FLOW 1.836.734 1.923.559 2.014.353 2.043.277 2.096.169 2.231.926 2.289.521 2.348.549 2.409.046 2.471.048 2.672.083 2.739.762 2.809.147 2.880.281 2.953.208 3.027.973 3.104.620 3.183.197 3.263.752 3.346.333 3.430.992
Date 31.12.2037 31.12.2038 31.12.2039 31.12.2040 31.12.2041 31.12.2042 31.12.2043 31.12.2044 31.12.2045 31.12.2046 31.12.2047 31.12.2048 31.12.2049 31.12.2050 31.12.2051 31.12.2052 31.12.2053 31.12.2054 31.12.2055 31.12.2056 27.02.2057
Sözleşme Süresi 29 30 31 32 33 34 35 36 37 38 39 40 41 42 43 44 45 46 47 48 49
AKFEN OBTAINED LEASE
LEASE FROM NOVOTEL REVENUE 2.705.122 2.772.751 2.842.069 2.913.121 2.985.949 3.060.598 3.137.113 3.215.541 3.295.929 3.378.327 3.462.785 3.549.355 3.638.089 3.729.041 3.822.267 3.917.824 4.015.770 4.116.164 4.219.068 4.324.545 738.776
Operator Share 4% 491.840 504.136 516.740 529.658 542.900 556.472 570.384 584.644 599.260 614.241 629.597 645.337 661.471 678.007 694.958 712.332 730.140 748.393 767.103 786.281 134.323
Furniture Fixture and Renıvation Reserve 4% 491.840 504.136 516.740 529.658 542.900 556.472 570.384 584.644 599.260 614.241 629.597 645.337 661.471 678.007 694.958 712.332 730.140 748.393 767.103 786.281 134.323
NOVOTEL HOTEL AGOP 3.706.694 3.799.361 3.894.345 3.991.704 4.091.497 4.193.784 4.298.629 4.406.094 4.516.247 4.629.153 4.744.882 4.863.504 4.985.091 5.109.719 5.237.462 5.368.398 5.502.608 5.640.173 5.781.178 5.925.707 1.012.308
USED NOVOTEL LEASE REVENUE 3.706.694 3.799.361 3.894.345 3.991.704 4.091.497 4.193.784 4.298.629 4.406.094 4.516.247 4.629.153 4.744.882 4.863.504 4.985.091 5.109.719 5.237.462 5.368.398 5.502.608 5.640.173 5.781.178 5.925.707 1.012.308
Real Estate Tax 72.520 74.696 76.936 79.245 81.622 84.071 86.593 89.190 91.866 94.622 97.461 100.385 103.396 106.498 109.693 112.984 116.373 119.864 123.460 127.164 130.979
Insurance 12.864 12.864 12.864 12.864 12.864 12.864 12.864 12.864 12.864 12.864 12.864 12.864 12.864 12.864 12.864 12.864 12.864 12.864 12.864 12.864 12.864
Furniture Fixture and Renıvation Reserve 5% 24.592 25.207 25.837 26.483 27.145 27.824 28.519 29.232 29.963 30.712 31.480 32.267 33.074 33.900 34.748 35.617 36.507 37.420 38.355 39.314 6.716
Annual Construction Right (Land) 78.939 79.846 80.753 81.661 82.568 83.475 84.383 85.290 86.197 87.105 88.012 88.919 89.827 90.734 91.641 92.549 93.456 94.363 95.271 96.178 97.085
CASH FLOW 3.517.780 3.606.749 3.697.955 3.791.452 3.887.298 3.985.551 4.086.271 4.189.518 4.295.357 4.403.851 4.515.066 4.629.069 4.745.931 4.865.723 4.988.516 5.114.386 5.243.408 5.375.662 5.511.228 5.650.187 764.664
Risk Free Revenue Rate 4,80% 4,80% 4,80%
Risk Premium 2,20% 2,70% 3,20%
Discount Rate 7,00% 7,50% 8,00%
NET CURRENT VALUE (Euro) 38.561.520 35.969.809 33.648.414
NET APPROXIMATE CURRENT VALUE (Euro) 38.560.000 35.970.000 33.650.000
NET APPROXIMATE CURRENT VALUE (TL) 119.143.000 111.140.000 103.972.000

46 Report No: 2015-020-GYO-004
6.4.5 Lease Value Analysis and Taxes Employed
The lease value of the construction right subject to the appraisal has been calculated taking into
consideration the revenue discount method and the average cash flow value. The annual lease value of
the real estate has been calculated by reducing the 1st year cash flow average to the appraisal day.
According to this calculation, the annual lease value of the hotel is 2.666.000.- EUR (7.001.000- Turkish
Liras). The discount rate has been determined to be of 9,50%.
Date 31.12.2015 31.12.2016
Annual Lease Revenue 0 2.371.546
Net Current Value of the Annual Lease Value
(EURO) 2.266.000 Net Current Value of the Annual Lease Value (TL) 7.001.000
6.4.6 Empty Land and Project Values of the Terrain Where the Project is Being Developed
The appraisal study in question does not enter the scope of “project evaluation”.
6.4.7 Most Effective and Most Productive Use Analysis
It has been appraised that the current use of the real estate in question (as a hotel), in accordance
with the zoning status and structuring conditions, consists of the most effectively appropriate and
productive use for the property.
6.4.8 Appraisal Analysis of Common or Divided Parts
There are no common spaces on the plot.

47 Report No: 2015-020-GYO-004
7 7. APPRAISAL OF ANALYSIS RESULTS
7.1 Alignment of Different Appraisal Methods and Analysis Results, together with the Explanation
of the Method and the Reasons Used for this Purpose
On the grounds that the real estate subject to this appraisal study consists of a property operating as a
revenue bringing hotel, the Revenue Approach and Cost Approach Methods have been employed. In
the Cost Approach Method, the “Land Value” has been determined according to the Example
Comparison Method.
The total value in the cost method has been calculated at 20.238.293 EURO (62.532.278 TL)
As a result of the reduction of the potential revenue of the structure on the plot that will be generated
during the remainder of the 49 years of the lease agreement, in accordance with the revenue discount
approach, the net current value of the HOTEL has been calculated to be 44.010.000 EURO
(135.982.000 TL). The amount determined to be paid to the Akfen Real Estate Investment Trust Inc. by
the Accor Group, with the use of the lease revenue discount method, is 35.970.000 EURO
(111.140.000.- TL). The final value of the hotel has been calculated to be 39.990.000. EURO
(123.560.000.- TL), based on the approximate arithmetic average of the value calculated by both of
the methods.
The lease value of the real estate, since the date of 31.12.2015, has been calculated by taking into
consideration the average cash flow of the first year, in accordance with the revenue discount
approach and the lease revenue. The annual lease value of the real estate has been calculated by
reducing the annual average net cash flow to the day when the appraisal study is performed. Pursuant
to this calculation, the annual lease value has been determined to be 2.266.000.- EURO (7.001.000-
TL).
Throughout the course of the appraisal study, the revenue discount approach and the cost approach
have both been applied, in terms of revenue capitalization and lease revenues. The real estate subject
to the appraisal constitutes a revenue generating property and, therefore, the values calculated with
the use of the revenue approach and lease value analysis result in more accurate values, concerning
this sort of properties. In addition, the value calculated through the use of the cost method has been
ruled out in the final appraisal value.
In the cost discount method, from the total revenue that the real estate will generate, the gross
operating revenue and net operating revenues have been calculated, respectively.
In the discount model pursuant to the lease revenue, the lease revenues have been evaluated and the
calculations have been made in accordance with the value obtained. Different discount rates have

48 Report No: 2015-020-GYO-004
been employed in both models. Since there is a guaranteed lease revenue in the lease revenue
analysis, the risk premium is lower.
While the value of the real estate according to the revenue discount approach was being determined,
in the 1st model the revenue obtained by operating the real estate without a brand name has been
calculated and in the 2nd model the revenue obtained by operating by leasing it out to a brand (Accor)
has been calculated. Both models are methods that are exercised in the market and, thusly, the final
appraisal has been determined by calculating the average of their outcome.
7.2 Explanation of the Motives Pursuant to the Minimum Information for Not Including Certain
Aspects in the Report
There is no information that has not been included in the minimum information.
7.3 Information Concerning the Last Three Appraisal of the Real Estate Carried Out by the
Company
There have not been any other appraisal studies performed by our company, with regard to the real
estate subject to this appraisal analysis.
7.4 Opinion Whether There is Any Obstacle in Including the Real Estate, the Real Estate Project
and the Rights and Benefits with Regard to the Real Estate in the Real Estate Investment
Trusts Portfolio within the Scope of the Capital Market Legislation
The real estate subject to the appraisal with the “Concrete Hotel Building, Its Appurtenances and
Land” nature, situated in the city of Trabzon, district of Yomra, at the address of Kaşüstü/Cumhuriyet
Neighborhood, Locality of Yalı, Section Pan No: G43b02c1c2ad2, Block No: 209, Plot No: 12, with an
area of 13.450,71 m2, has been constructed as a “Construction Right” facility that has a nature of
independent and permanent on behalf of Akfen Real Estate Investment Trust Inc. for the duration of 49
years, starting from the date of 27.02.2008; furthermore, no obstacles were found that prevent the
inclusion of the “Construction Right + Hotels” in the Real Estate Investment Trusts portfolio, within the
scope of the Capital Market Board regulations.

49 Report No: 2015-020-GYO-004
8 OUTCOME
8.1 The Concluding Sentence of the Appraiser
I hereby agree with the effective and productive use analysis of the appraiser, together with all of the
aspects mentioned in the report.
8.2 Final Appraisal
The totality of the characteristics that can affect the value of the real estate, such as the location, the
style of formation of its surroundings, the infrastructure and means of transportation, façades looking
over to the avenue and street, the area and its position, the construction form of the structure, its
system, the materials used in its construction and the craftsmanship quality, fixture status, ventilation
– illumination – landscape status, have all been carefully taken into account and a detailed market
research has been conducted in the area. Correspondingly, the value of the real estate subject to this
appraisal report has been presented in the following chart.
As the date of 31.12.2015
Market Value of the Remaining
Construction Right of the Real Estate EURO)
Market Value of the Remaining Construction Right of the Real Estate
(TL)
VAT Excluded 39.990.000 123.561.000
VAT Included 47.188.200 145.801.980
Annual Lease Value of the Real Estate
(EURO) Annual Lease Value of the Real Estate
(TL)
VAT Excluded 2.266.000 7.001.000
VAT Included 2.674.000 8.261.000
1-) The appraised value is the current value regarding the cash sale price. 2- ) The VAT ratio has been established at 18%. 3-) The currency rates dated 02.11.2015 have been established at 1,-USD = 2,8035 TL, 1 EURO= 3,0898 TL. 4-) This report has been prepared within the scope of the related Capital Market Legislation. We respectfully submit our expert report representing the situation and our appraisal.
Serkan TANRIÖVER Önder ÖZCAN Neşecan Çekici
Certified Appraiser
SPK License No:401162
Certified Appraiser
SPK License No:402145
Responsible Appraiser
SPK License No:400177

50 Report No: 2015-020-GYO-004
9 APPENDIX
1. Title Deed Photocopies
2. Approved Restrictions Document
3. Zoning Status Document
4. Plan Sample
5. Construction Licenses/Permits
6. Occupancy Permit
7. Architectural Project Cover Page, Floor Plans
8. Construction and Operating Agreement
9. Accotel Operating Agreement
10. Mortgage Letter
11. Business Starting and Operating License/Permit
12. Tourism Operating Document
13. Tourism Investment Document
14. Additional Hotel Agreement with the date of 29.06.2010
15. Backgrounds
16. SPK Certificate Samples