akebia saponin d decreases hepatic steatosis through...
TRANSCRIPT
1
JPET #236562
Akebia saponin D decreases hepatic steatosis through autophagy
modulation
Li-li Gong, Guang-run Li, Wen Zhang, He Liu, Ya-li Lv, Fei-fei Han, Zi-Rui Wan,
Ming-Biao Shi, Li-hong Liu*
Beijing Chao-Yang Hospital, Capital Medical University, Beijing, China
This article has not been copyedited and formatted. The final version may differ from this version.JPET Fast Forward. Published on September 26, 2016 as DOI: 10.1124/jpet.116.236562
at ASPE
T Journals on July 15, 2018
jpet.aspetjournals.orgD
ownloaded from
2
JPET #236562
Running Title: Akebia saponin D decreases hepatic steatosis
*Corresponding authors: Li-hong Liu, Li-li Gong. Beijing Chaoyang Hospital, Capital
Medical University, 8 Gongren Tiyuchang Nanlu, Beijing 100020, China, Tel: 86-10-
85231464; E-mail address: [email protected], [email protected].
The number of text pages: 29
The number of tables: 1
The number of figures: 8
The number of references: 26
The number of words in the Abstract: 190
The number of words in the Introduction: 484
The number of words in the Discussion: 865
Abbreviations:
NAFLD, Nonalcoholic fatty liver disease; HFD, high fat diet; DAW, Dipsacus asper
Wall; ASD, Akebia saponin D; FBS, Fetal bovine serum; DMEM, Dulbecco's
Modified Eagle Medium; OA, Oleic acid; CQ, Chloroquine; BSA, bovine serum
albumin; AST, Aspartate transaminase; ALT, alanine transaminase; TG, Triglyceride;
TC, Total cholesterol; FFA, Free Fatty Acids; HOMA-IR, Homeostasis model
assessment of insulin resistance; SOD, superoxide dismutase; GSH-PX, glutathione
peroxidase; MDA, malondialdehyde; SM, Silibinin meglumine.
Recommended section assignment: Drug Discovery and Translational Medicine
This article has not been copyedited and formatted. The final version may differ from this version.JPET Fast Forward. Published on September 26, 2016 as DOI: 10.1124/jpet.116.236562
at ASPE
T Journals on July 15, 2018
jpet.aspetjournals.orgD
ownloaded from
3
JPET #236562
Abstract
Nonalcoholic fatty liver disease (NAFLD) is considered to be a hepatic
manifestation of metabolic syndrome, and its incidence is rapidly
increasing. However, there is a lack of appropriate drugs for the therapy of NAFLD.
In the present article, we aimed to elucidate the protective effects and mechanisms of
Akebia saponin D (ASD) against NAFLD on ob/ob mice and BRL cells. ASD
significantly decreased hepatic steatosis and heptocyte apoptosis in ob/ob mice.
Furthermore, ASD significantly activated the autophagic flux assessed by decreased
the expression of LC3-II, p62 accumulation of autophagosomes. In BRL cells, ASD
prevented Oleic acid (OA) induced lipid droplets and increase the autophagic flux
acting as increase the number of autolysosomes than autophagosomes in mTagRFP-
mWasabi-LC3. ASD treatment also prevented OA induced LC3-II, p62, Beclin and
phospho-mTOR expression. These effects were similar to the effects cotreatment with
rapamycin. ASD treatment could not prevent the OA increased autophagy related
protein expression after treated with Chloroquine (CQ) or siRNA-mediated
knockdown of Atg7. These results suggest that Akebia saponin D alleviates hepatic
steatosis targeted at the fusion of autophagosomes to lysosomes, autophagy
modulation via ASD may offer a new strategy for treating NAFLD.
This article has not been copyedited and formatted. The final version may differ from this version.JPET Fast Forward. Published on September 26, 2016 as DOI: 10.1124/jpet.116.236562
at ASPE
T Journals on July 15, 2018
jpet.aspetjournals.orgD
ownloaded from
4
JPET #236562
Introduction
Nonalcoholic fatty liver disease (NAFLD) represents a spectrum of liver disease
ranging from pure fatty liver through nonalcoholic steatohepatitis (NASH) to fibrosis
and irreversible cirrhosis that occurs in patients who do not consume significant
amounts of alcohol (Matteoni et al., 1999). NAFLD is strongly associated with
components of the metabolic syndrome including obesity, hypertension, dyslipidemia
and insulin resistance and, in fact, is now recognized to represent the hepatic
manifestation of the metabolic syndrome (Smith and Adams, 2011). NAFLD occurs
in developed and developing countries making NAFLD the most common liver
condition in the world. Although a large number of studies have been conducted, the
pathophysiology of NAFLD is complicatedand not completely elucidated.
NAFLD has been linked to lipid accumulation and lipid metabolism dysfunction.
Recent studies have shown that autophagy is involved in lipid metabolism. Hepatic
autophage degrades lipid droplets to provide FFA for ATP production when increase
lipid availability. In contrast, hepatic autophagic turnover was inhibited if lipids were
provided sustained by a long-lasting high fat diet (HFD). Singh et al. reported that
lipid metabolism was regulated by autophagy through eliminating triglycerides and
preventing development of steatosis (Singh et al., 2009). Decreased autophagic
function may promote the initial development of hepatic steatosis (Czaja, 2010). It has
been demonstrated that genetic leptin-deficient ob/ob mice, which show obesity
andinsulin resistance developed NAFLD similar to that observed in human patients
have been commonly used as an animal model of NAFLD. Many of the investigations
pertaining to NAFLD are carried out in ob⁄ob mice. Studies in ob/ob mice have
indicated that defective autophagy were observed (Yang et al., 2010). Autophagy
This article has not been copyedited and formatted. The final version may differ from this version.JPET Fast Forward. Published on September 26, 2016 as DOI: 10.1124/jpet.116.236562
at ASPE
T Journals on July 15, 2018
jpet.aspetjournals.orgD
ownloaded from
5
JPET #236562
markers, as indicated by LC3-II accumulation and p62 degradation, were impaired in
the liver of ob/ob mice. Consistently, autophagy-associated proteins such as Atg7,
Beclin-1, and Atg5-Atg12 conjugation were downregulated. Therefore, activation of
autophagy in hepatocytes could constitute a therapeutic approach against hepatic
complications.
Akebia Saponin D (ASD, also named Asperosaponin VI) (Supplemental Figure 1)
is a typical bioactive triterpenoid saponin isolated from the rhizome of Dipsacus asper
Wall (DAW) which has long been used as an anti-osteoporosis drug (Yu et al., 2012).
ASD has been demonstrated to have some therapeutic effects on some disease models
such as cancer (Jeong et al., 2008), Alzheimer's disease (Jeong et al., 2008; Zhou et al.,
2009; Yu et al., 2012), cardiovascular disease (Li et al., 2010a; Li et al., 2010b; Li et
al., 2012) and bone fractures (Peng et al., 2010; Niu et al., 2011). Our previous studies
have shown that ASD exerts the hepatoprotective effects on the acute liver injury
induced by CCl4 in mice (Li Chao et al., 2012) and against rotenone-induced toxicity
in liver BRL cells (Gong et al., 2014). These findings suggest ASD has the
hepatoprotective effect. However, the beneficial effects of ASD on NAFLD have not
been fully investigated. Therefore, in this study, the protective effect of ASD against
NAFLD was investigated in leptin-deficient ob/ob mice and BRL cells.
2. Materials and methods
2.1 Drugs, reagents and plasmids
ASD was extracted by Beijing Chao-Yang Hospital affiliated with Beijing Capital
Medical University and its structure was confirmed by the basis of physical-chemical
properties and spectral evidence (Yuan-yuan Lan et al., 2011). ASD standard (purity:
92.5%, Batch No. 11685-200802) was purchased from National institutes for Food
This article has not been copyedited and formatted. The final version may differ from this version.JPET Fast Forward. Published on September 26, 2016 as DOI: 10.1124/jpet.116.236562
at ASPE
T Journals on July 15, 2018
jpet.aspetjournals.orgD
ownloaded from
6
JPET #236562
and Drug Control (Beijing, China). The purity of ASD was calculated based on
external standard method. Briefly, the purity (%) =
������������������
������������
������ 100%,
(C, concentration; A, peak area; M, sample weight). The purity of ASD was more
than 98% tested by HPLC method (Supplemental Figure 2).
Silibinin meglumine (SM) was a generous gift from shanghai seebio biotech. Fetal
bovine serum (FBS), Dulbecco's Modified Eagle Medium (DMEM) were obtained
from Hyclone (Logan, Utah, USA). Oleic acid (OA), rapamycin, Chloroquine (CQ)
and bovine serum albumin (BSA) were from Sigma-Aldrich (St. Louis, MO, USA).
Immobilon PVDF membrane was purchased from Millipore (Billerica, MA, USA).
Aspartate transaminase (AST) and alanine transaminase (ALT) diagnostic
biochemical assay kits were obtained from Biosino Biotechnology Company Ltd.
(Beijing, China). Triglyceride (TG), Total cholesterol (TC), Free Fatty Acids (FFA),
Fasting glucose, Fasting insulin, superoxide dismutase (SOD), glutathione peroxidase
(GSH-PX) and malondialdehyde (MDA) diagnostic agents were obtained from
Nanjing Jiancheng Bioengineering Institute (Nanjing, China).
Plasmids EGFP-LC3, mTagRFP-mWasabi-LC3 and mTagRFP-mWasabi-LC3�G
were a generous gift from Prof. Jian Lin (Peking University). Microtubule associated
protein light chain 3 (LC3) is a ubiquitin-like protein that binds to autophagosomes
and subsequently EGFP tagged LC3 was used to track and follow the fate of
autophagosomes in the cell. The plasmid mTagRFP-mWasabi-LC3 consists of a red
fluorescent protein mTagRFP, a green fluorescent protein mWasabi and an amino
terminal of the autophagy labeled protein LC3 which was used to monitoring
autophagic flux. In green/red merged images, yellow puncta (i.e., RFP+, Wasabi+)
indicate autophagosomes, while red puncta (i.e., RFP+, Wasabi-) indicate
This article has not been copyedited and formatted. The final version may differ from this version.JPET Fast Forward. Published on September 26, 2016 as DOI: 10.1124/jpet.116.236562
at ASPE
T Journals on July 15, 2018
jpet.aspetjournals.orgD
ownloaded from
7
autolysosomes. mTagRFP-mWasabi-LC3�G was constructed as the negative control.
JPET #236562
2.2 Studies in ob/ob mice
2.2.1 Animals
Six-week-old male C57BL/6 and leptin-deficient ob/ob mice were purchased from
the Experimental Animal Center of the Fourth Military Medical University ( License:
SCXK (JUN) 2007-007). The mice were housed individually under temperature (24 ±
5°C), humidity (55 ± 5%), and light (12 h light/dark cycle) controlled conditions.
After acclimating for 1 week, nine C57BL/6 male mice were fed a standard purified
rodent diet served as controls. The ob/ob mice were fed on high-fat diet (HFD) and
randomly divided into five groups. The mice were administered vehicle (saline), ASD
(30, 60 and 120 mg/kg/d) or Silibinin meglumine (SM, 20 mg/kg/d) through
intraperitoneal injection for 4 weeks. All experiments were carried out in accordance
with China Animal Welfare Legislation and were approved by Beijing Chao-Yang
Hospital Committee on Ethics in the Care and Use of Laboratory Animals.
At the end of the experiment, the mice were anesthetized with urethane (1 g/kg,
i.p.), the body weights, liver weights and fat pad weights were measured,
blood samples were collected from inner canthus, and liver were removed
immediately and washed in pre-chilled physiological saline. Levels of AST, ALT,
fasting glucose and fasting insulin in blood, activity of SOD, MDA and GSH-PX and
TG, TC, FFA levels in liver tissues were measured according to the manufacturer's
instructionwith a SpectraMax M5 microplate reader (Molecular Devices, Sunnyvale,
CA, USA). The homeostasis model assessment of insulin resistance (HOMA-IR) was
estimated by dividing the product of fasting glucose (mmol/L) and insulin levels
(mIU/L) by 22.5.
This article has not been copyedited and formatted. The final version may differ from this version.JPET Fast Forward. Published on September 26, 2016 as DOI: 10.1124/jpet.116.236562
at ASPE
T Journals on July 15, 2018
jpet.aspetjournals.orgD
ownloaded from
8
JPET #236562
2.2.2 H&E stain
The livers were washed immediately with saline and then fixed in 4% buffered
paraformaldehyde solution. Paraffin-embedded liver biopsy sections (5 μm) were
stained with hematoxylin and eosin (H&E) for histological analysis. These sections
were examined under light microscope for histoarchitectural changes, and then
photomicrographs were taken. The image-pro plus 6.0 software was used to evaluate
the degree of hepatocellular ballooning and lobular inflammation (grade of activity).
2.2.3 Terminal deoxynucleotidyl transferase mediated dUTP nick end labeling
(TUNEL) assay
TUNEL assay was performed by using In Situ Cell Death Detection kit according
to the manufacturer’s instructions (POD, Roche Diagnostics Corporation, USA). For
each liver, the total number of TUNEL-positive heptocyte nuclei was counted in ten
sections. Individual nuclei were visualized at a magnification of 200, and the
percentage of apoptotic nuclei (apoptotic nuclei/total nuclei) was calculated in 6
randomly chosen fields per slide and averaged for statistical analysis.
2.2.4 Electron Microscopy Ultrastructural examination
Small pieces of liver were taken and rinsed in 0.1 M phosphate buffer solution
(PBS, pH 7.2). Approximately, 1 mm3 liver pieces were trimmed and immediately
fixed in ice-cold glutaraldehyde (3%) plus p-formaldehyde (4%) in 0.1 M phosphate
buffer, and kept at 4 °C for 2 h. Samples were postfixed in 1% osmium tetroxide for
60 min at 25°C. After dehydration in a graded series of ethanol, liver pieces were
embedded in spur resin. Thin sections (60 nm) were cut on an Ultramicrotome. The
sectioned grids were stained with saturated solutions of uranyl acetate and lead citrate.
The sections were examined by electron microscope (H-7650, Hitachi).
This article has not been copyedited and formatted. The final version may differ from this version.JPET Fast Forward. Published on September 26, 2016 as DOI: 10.1124/jpet.116.236562
at ASPE
T Journals on July 15, 2018
jpet.aspetjournals.orgD
ownloaded from
9
JPET #236562
2.2.5 Immunohistochemistry
The slides were stained with primary anti-LC3 antibody (Cell Signaling
Technology, USA). Anti-rabbit HRP/DAB detection system was used to visualize the
expression according to the protocol. Positive and negative controls were undertaken
to identify any non-specific staining. For negative controls, the primary antibody was
replaced by normal rabbit IgG (Vector Laboratories, Burlingame, CA, USA). All
slides were viewed using an Olympus microscope.
2.2.6 Western blot analysis for autophagy
Liver tissue lysates were subjected to SDS-PAGE and electrophoretically
transferred to a polyvinylidene difluoride (PVDF) membrane. The membranes were
then exposed to primary antibodies (LC3, p62, beclin, Cell Signaling Technology,
USA) overnight at 4°C. After incubation with the IRDye 680LT secondary antibody
(Licor, USA) for 1 h at room temperature, immunoreactive proteins were visualized
by Odyssey Infrared Imaging System (LI-COR Biosciences, Lincoln, NE).
2.3 Studies in BRL cells
2.3.1 Cell culture and treatment
BRL cells, a cell line established from Buffalo rat liver, have been widely used for
liver biological and chemical studies. BRL cells were purchased from the Cell Center
of Shanghai Institutes for Biological Sciences (Shanghai, China). Cells were cultured
in Dulbecco's Modified Eagle Medium (DMEM) supplemented with 10% (v/v) FBS
at 37 °C with 5% CO2. OA (20 mM) in 0.01 N NaOH was incubated at 70°C for 30
min, and then mixed with 10% BSA in PBS at a 1:9 molar ratio of OA to BSA. The
OA-BSA conjugate was administered to the cultured cells. BSA was used as a vehicle
control. BRL cells were pretreated with various concentrations of ASD (1, 10 and 100
This article has not been copyedited and formatted. The final version may differ from this version.JPET Fast Forward. Published on September 26, 2016 as DOI: 10.1124/jpet.116.236562
at ASPE
T Journals on July 15, 2018
jpet.aspetjournals.orgD
ownloaded from
10
JPET #236562
μM) for 1 h, followed by incubation with 200 μM OA or vehicle control for 24 h.
Rapamycin (25 ng/mL), chloroquine (CQ) (50 nM) were used as negative and
positive control of autophagosome accumulation.
2.3.2 Lipid droplet staining
BRL Cells were fixed in 4% paraformaldehyde in PBS for 30 minutes, washed
thoroughly with PBS and incubated with specific neutral lipid probe Bodipy 493/503
(10 μg/mL; Invitrogen) at room temperature for 1 h in darkness. The cells were
visualized under the fluorescence microscopy.
2.3.3 Cell culture and transfection
BRL cells were cultured in Dulbecco’s modified Eagle’s medium (DMEM)
(Hyclone) supplement with 10% FBS at 37°C in an atmosphere of 5% CO2. About
1×10⁶ cells were plated into confocal dish 24 h before transfection. EGFP-LC3
plasmids was usually used to detect autophagy. mTagRFP-mWasabi-LC3 reporter is
sensitive and accurate in detecting the accumulation of autophagosomes and
autolysosomes and used for monitoring autophagic flux. Meanwhile, mTagRFP-
mWasabi-LC3�G was used as the negative control. Plasmids (EGFP-LC3,
mTagRFP-mWasabi-LC3 and mTagRFP-mWasabi-LC3�G, 800 ng/well)
transfections were performed with Lipofectamine 2000 (Invitrogen) according to the
manufacturer’s protocol (Zhou et al., 2012). The cells were ob served with confocal
microscopy without fixation.
2.3.4 RNA interference
BRL cells were transfected with siRNAs targeting Atg7 (GenePharma, Suzhou,
China), or a control siRNA (GenePharma, Suzhou, China) using Lipofectamine 2000
(Invitrogen, Carlsbad, CA, USA) by following the manufacturer’s instructions. Cells
This article has not been copyedited and formatted. The final version may differ from this version.JPET Fast Forward. Published on September 26, 2016 as DOI: 10.1124/jpet.116.236562
at ASPE
T Journals on July 15, 2018
jpet.aspetjournals.orgD
ownloaded from
11
JPET #236562
were incubated for 16 h with a transfection mixture containing a final siRNA
concentration of 100 pM, and then supplemented with fresh medium. RNA was
extracted from cell culture lysates using TRIzol reagent (Invitrogen) according to
standard protocol.
2.3.5 Real-time PCR analysis
Real-time PCR analysis was used to quantify differences in gene expression. Target
gene expression was normalized to that of an internal reference (GAPDH). Real-time
PCR was performed with primers (Table II) and SYBR Premix Ex Taq (Takara,
Japan) in Cobasz 480 real-time PCR machine (Roche). Target sequences were
amplified by using the following thermal conditions: 2 min at 95°C, and 45 cycles of
10 s at 95°C and 30 s at 68°C. All reactions were performed in triplicate. The
expression levels of the genes of interest were presented as the relative levels to the
mRNA level of the control gene.
2.3.6 Western blot analysis
Cells were harvested and lysed in protein lysis buffer (Applygen, Beijing, China).
Proteins were separated in SDS-PAGE and transferred onto PVDF membranes.
Membranes were incubated overnight at 4°C with the primary antibodies (Atg7, LC3
Cell Signaling Technology, USA). The membranes were washed and then incubated
IRDye 680LT secondary antibody (Licor, USA) for 1 h at RT on an orbital shaker.
After washing, bands were detected using Odyssey Infrared Imaging System (LI-COR
Biosciences, Lincoln, NE).
2.4 Statistical analysis
The results were expressed as means ± S.E.M in each group. To analyze the
differences between groups, initial analyses were conducted with one-way ANOVA
This article has not been copyedited and formatted. The final version may differ from this version.JPET Fast Forward. Published on September 26, 2016 as DOI: 10.1124/jpet.116.236562
at ASPE
T Journals on July 15, 2018
jpet.aspetjournals.orgD
ownloaded from
12
JPET #236562
tests followed by Dunnett's test. If the data did not fit the constraints of parametric
test, data were analyzed with ChiSquare Test, Kruskal-Wallis ANOVA or the Mann-
Whitney test. A value P < 0.05 was considered statistically significant.
3. Results
3.1 ASD treatment decreased plasma lipids and hepatic steatosis in ob/ob mice
Body weights, liver weights and fat pad weights were calculated at the end of the
experiments. We found that HFD ob/ob mice showed higher body weights, liver
weights and fat pad weights compared with C57BL/6J mice. ASD treatment
significantly inhibited the HFD-induced indices of adiposity and Liver/body weight in
ob/ob mice.
The effects of ASD on glycemic control and insulin resistance are shown in
Supplemental Table 1. Serum glucose levels were significantly lower in the ASD
group than in the ob/ob mice group (P < 0.05). The serum insulin levels were
significantly increased in the ob/ob group compared to the control group. ASD
treatment significantly reduced the levels of these parameters (p<0.05). ASD
significantly reduced the HOMA-IR value in comparison with the ob/ob mice group
(P < 0.01).
The liver of ob/ob mice showed a marked accumulation of fat droplets, ballooning
degeneration were also seen in the liver of ob/ob mice (Fig. 1B). ASD-treated obese
mice displayed decreased hepatic steatosis (Fig. 1D-F). Livers of SM showed mild to
moderate fat droplets (Fig. 1C). Likewise, hepatic triglyceride concentration
decreased from 71.2 ± 3.5 mg/g in untreated obese mice to 38.6±1.8, 22.7±4.6, 14.3 ±
5.6 mg/g liver separately in ASD-treated animals ( P < 0.001 versus ob/ob mice) (Fig.
1G). In these mice, however, hepatic triglyceride content was significantly higher than
This article has not been copyedited and formatted. The final version may differ from this version.JPET Fast Forward. Published on September 26, 2016 as DOI: 10.1124/jpet.116.236562
at ASPE
T Journals on July 15, 2018
jpet.aspetjournals.orgD
ownloaded from
13
JPET #236562
in wild-type mice (7.97 ± 5.2 mg/g wet liver; P < 0.001). The hepatic total
cholesterol and FFA in ASD group were reduced compared with the ob/ob group (P <
0.05; Fig. H-I).
3.2 ASD treatment protected NAFLD-induced liver damage
To test whether ASD could protect against NAFLD liver apoptosis, we performed
TUNEL assays, ultrastructural examinaltion and hepatic AST, ALT, SOD, GSH-PX,
MDA. The frequency of TUNEL-positive cells expressed as a percentage of the total
nuclei was significantly increased in ob/ob mice (82.35 ± 2.14%), liver tissues
demonstrated a marked appearance of dark brown apoptotic cells (Fig. 2Ab). In
contrast, almost no apoptotic cells were observed in normal control C57BL/6J mice
(Fig. 2Aa). Treatment with ASD (30, 60 and 120 mg/kg), the number of TUNEL
positive cells was significantly decreased (40.28± 1.37%, 33.25 ± 1.20%, 22.39 ±
2.16%) (Fig. 2Cf).
The transmission electron micrograph studies of the hepatocyte nuclear of the
experimental group were presented in Fig. 2B. In contrast to normal liver tissue (Fig.
2Ba), we found the hepatocyte shrinked and nucleolus broken (Fig. 2Bb). The
electron micrograph of the nuclear of ASD (30, 60 and 120 mg/kg) treated mice
showed less apoptosis in a dose-dependent manner. And the nuclear of liver tissue of
ASD 120 mg/kg displayed near normal architecture.
Compared with the C57BL/6, the activities of serum hepatic injury marker enzymes
aspartate transaminase (248.26±12.55) and alanine transaminase (346.18±20.35) were
significant increase in ob/ob mice. Treatment with ASD (30, 60 and 120 mg/kg,
respectively) almost restored all the alterations of aspartate transaminase
(162.46±11.59, 145.69±12.70, 121.40±18.21), alanine transaminase (212.08±20.62,
This article has not been copyedited and formatted. The final version may differ from this version.JPET Fast Forward. Published on September 26, 2016 as DOI: 10.1124/jpet.116.236562
at ASPE
T Journals on July 15, 2018
jpet.aspetjournals.orgD
ownloaded from
14
JPET #236562
176.24±19.97, 126.52±16.89) to near normal levels.
A significant rise in the content of malondialdehyde, as well as significant declines
in the activity of superoxide dismutase and glutathione peroxidase was observed in
the liver tissues of ob/ob mice. Administration of ASD (30, 60 and 120 mg/kg,
respectively) markedly attenuated the alterations in antioxidant enzymes and
maintained the mice at near normal status (Fig. 2Ca-e).
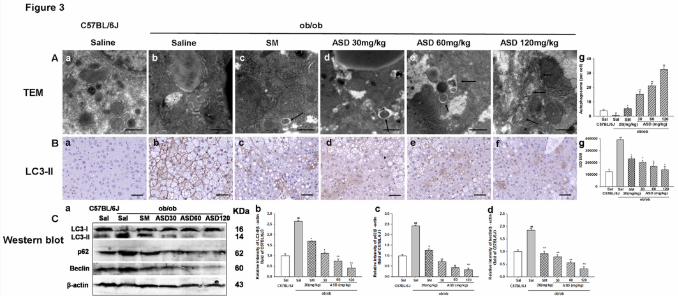
3.3 ASD treatment activated autophagy in liver tissue
We performed electron microscopy to analyze autophagosome formation. The level
of autophagosomes significant increased in the ASD (30, 60 and 120 mg/kg )
treated mice liver (Fig. 3A). Liver samples were also determine the
immunohistological staining for LC3-II. Liver tissues taken from normal control
C57BL/6J mice demonstrated little stain for LC3-II (Fig. 3Ba), ob/ob mice increased
the degree of positive staining for LC3-II (Fig. 3Bb) whereas in ASD (30, 60 and 120
mg/kg) treated ob/ob mice LC3-II staining was significantly reduced (Fig. 3Bd-g). In
addition, we also measured the levels of proteins that are specifically involved in
autophagy. LC3-II, p62 and beclin levels were significantly increased in the ob/ob
mice liver (Fig. 3C). On the contrary, ASD (30, 60 and 120 mg/kg) treatment
decreased LC3-II, p62 and beclin expression.
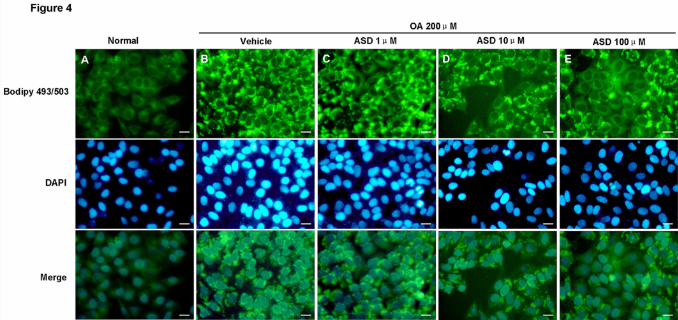
3.4 ASD reduced hepatocyte lipid accumulation in BRL cells
To further confirm the reduction hepatocyte lipid accumulation roles of ASD, we
performed studies on BRL cells. As shown in Figure 4, BRL cells were fixed and
stained with Bodipy 493/503, a fluorescent dye that specifically stains intracellular
lipid droplets (LDs). OA treatment significantly increased the number of LDs in BRL
cells. In contrast, LDs are barely detectable in BSA-treated control and very limited
This article has not been copyedited and formatted. The final version may differ from this version.JPET Fast Forward. Published on September 26, 2016 as DOI: 10.1124/jpet.116.236562
at ASPE
T Journals on July 15, 2018
jpet.aspetjournals.orgD
ownloaded from
15
JPET #236562
lipid staining in the BRL cells was observed when treated with ASD (1, 10 and 100
μM).
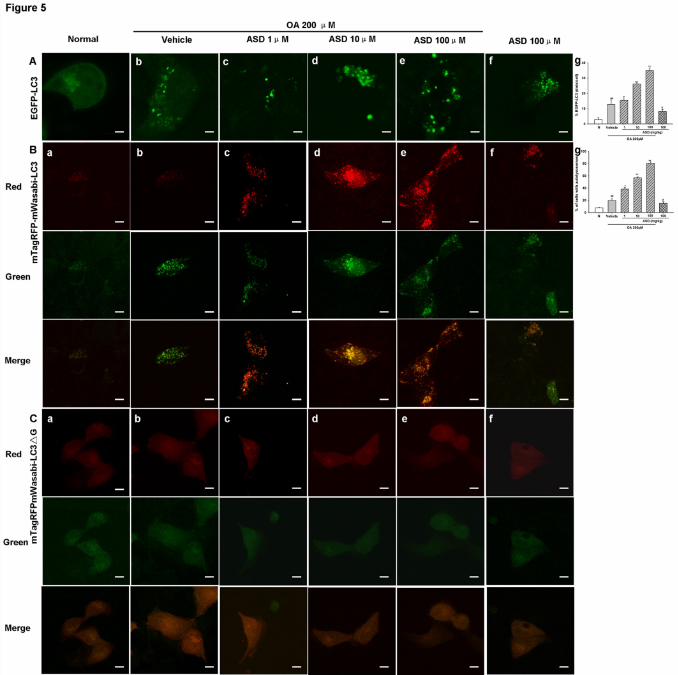
3.5 ASD increased the autophagic flux
We then determined the effects of ASD on OA-induced EGFP-LC3 puncta. We found
that OA induced EGFP-LC3 puncta formation was significantly enhanced by ASD (1,
10 and 100 μM) (Fig. 5A). In addition to monitoring autophagosomes, assays for
monitoring autophagic flux are also developed and mTagRFP-mWasabi-LC3 plasmid
was used. In green/red merged images, yellow puncta indicate autophagosomes,
while red puncta indicate autolysosomes. In BRL cells treated with ASD (1, 10 and
100 μM), ASD increased more autolysosomes than autophagosomes, indicating
autophagic flux in cells (Fig. 5B).
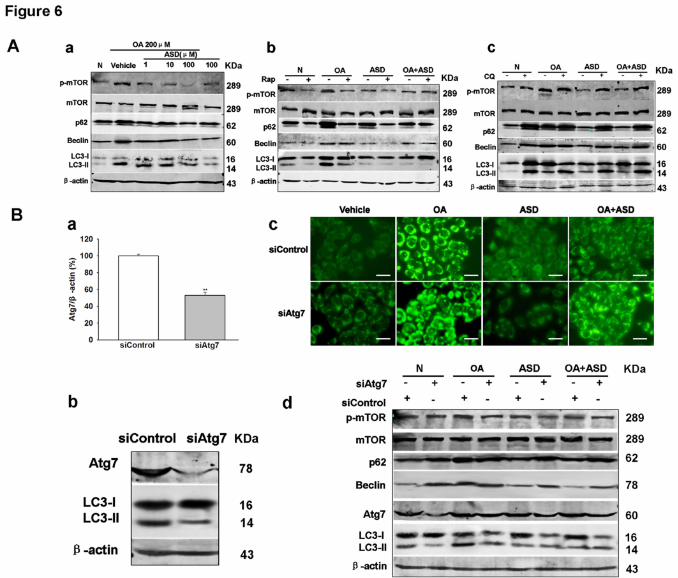
3.6 Molecular evidence for autophagy induction by ASD
We next measured the expression of autophagy-related proteins LC3-II, p62, Beclin
and mTOR in BRL cells.
OA treatment of BRL cells resulted in an increase in LC3-II (Fig. 6Aa). We also
found that accumulation of p62 was paralleled to an increase in the LC3-II, reflecting
a loss of the autophagic flux (Fig. 6Aa). In addition, the levels of Beclin expression
and the phosphorylation levels of mTOR were also increased following the OA
treatment. ASD (100 μM) treatment prevented the OA induced LC3-II, p62, Beclin
and phospho-mTOR expression. Under the same experimental conditions, rapamycin
decreased p62 and LC3-II/LC3-I ratio in OA-treated cells as compared with cells
treated with OA alone, indicating a recovery of the autophagic flux (Fig. 6Ab). ASD
(100 μM) treatment exhibited almost the same effect of rapamycin (Fig. 6Ab). ASD
(100 μM) treatment could not attenuate the autophagic flux blocked by CQ (Fig.
This article has not been copyedited and formatted. The final version may differ from this version.JPET Fast Forward. Published on September 26, 2016 as DOI: 10.1124/jpet.116.236562
at ASPE
T Journals on July 15, 2018
jpet.aspetjournals.orgD
ownloaded from
16
6Ac).
JPET #236562
BRL cells were infected with siRNAs targeting autophagy gene Atg7 or with a
control siRNA. Levels of Atg7 were markedly decreased on immunoblots in siAtg7
cells in parallel with reduced levels of LC3-II, compatible with a decrease of
autophagic function (Fig. 6B). The effect of ASD on cell lipid droplets was measured
in the presence of siAtg7. Knockdown of Atg7 abolished the protective effect of
ASD. LDs significantly increased in the presence of siAtg7 also when treated with
OA and ASD (Fig. 6Bc). LC3-II levels decreased markedly in siAtg7 cells but not
siControl cells and cells treated with OA and ASD. The levels of LC3-II decreased
because
interference of autophagy gene Atg7 inhibited the formation of autophagosomes.
Chloroquine (CQ) increased the levels of LC3-II as it targeted at inhibited the fusion
of autophagosomes to lysosomes. ASD treatment could not prevent the OA induced
p62, Beclin and phospho-mTOR expression.
4. Discussion
The pathogenesis of NAFLD has not yet been fully understood, but studies on
ob/ob mice and oleic acid induced BRL cells lipid accumulation provide a good
insight into this pathology. In the present study, we found that Akebia saponin D
exerted a strong hepatoprotective effect against NAFLD. Autophagy may contribute
to its hepatoprotective effect. During the past recent years, it has been reported that
autophgy plays an important role in hepatic steatosis (Amir and Czaja, 2011; Gracia-
Sancho et al., 2014; Kwanten et al., 2014; Lavallard and Gual, 2014). Enhancing
autophagy by overexpressing an autophagy gene Atg7, could improve hepatic
steatosis in ob/ob mice and in high fat diet-fed mice (Yang et al., 2010). The similar
This article has not been copyedited and formatted. The final version may differ from this version.JPET Fast Forward. Published on September 26, 2016 as DOI: 10.1124/jpet.116.236562
at ASPE
T Journals on July 15, 2018
jpet.aspetjournals.orgD
ownloaded from

17
results were also observed in high fat diet-induced non-alcoholic fatty liver condition
when treated with mTOR inhibitor rapamycin (Lin et al., 2013).
JPET #236562
In the present study, we found that Akebia saponin D treatment could signifiantly
reduce liver weight, hepatic steatosis, hepatic triglyceride levels, total cholesterol and
FFA levels. ASD treatment showed reduced hepatocyte nucleolus broken and
shrinked. We also demonstrated that treatment with ASD attenuated the degree of
apoptosis, increase the level of AST, ALD and the activity of SOD, GSH-PX and
decrease MDA. These results suggest that ASD exerted a protective effect against
NAFLD. ASD treated mice showed decreased body weight, Fat pad weight and
HOMA-IR values. NAFLD is the hepatic manifestation of metabolic syndrome. As
such, it is possible that ASD may have positive impacts on systemic components of
the disease.
High-fat diet ob/ob mice showed impairment in the hepatic autophagic function.
The protein amount of p62 was accumulated within the liver of ob/ob mice in parallel
with an increase in the LC3-II indicated that function of autophagy was diminished in
ob/ob mice liver. ASD treatment decreased LC3-II and p62 expression. The level of
autophagosomes also significantly increased in the ASD treated mice liver. It has
been shown that an accumulation of p62 reflects a decrease in the autophagic flux and
contrarily activation of the autophagic flux leads to a decline in p62 expression
(Bjorkoy et al., 2005; Klionsky et al., 2012). The accumulation of LC3-II and
autophagosomes may be interpreted as induction of autophagy or a consequence of a
blockade of the autophagic flux (Gonzalez-Rodriguez et al., 2014). Therefore, it is
conceivable that the decreased of LC3-II and p62 expression which was observed
when treated with ASD could be reflecting an activation of autophagic flux.
This article has not been copyedited and formatted. The final version may differ from this version.JPET Fast Forward. Published on September 26, 2016 as DOI: 10.1124/jpet.116.236562
at ASPE
T Journals on July 15, 2018
jpet.aspetjournals.orgD
ownloaded from
18
To further confirm the reduction hepatic steatosis and activation of autophagic flux
roles of ASD, we performed studies on BRL cells. Oleic acid induced lipotoxicity has
JPET #236562
a critical role in the pathogenesis of NAFLD. With the administration of ASD
a decrease of lipid droplets was observed. EGFP-LC3 fluorescence studies are
convenient methods to detect autophagy. ASD significantly enhanced EGFP-LC3
puncta indicating that ASD increased cell autophagy. mTagRFP-mWasabi-LC3
reporter is then used to detect the accumulation of autophagosomes and
autolysosomes and used for monitoring autophagic flux. Autophagic flux is increased
when both yellow and red puncta are increased in cells while autophagic flux is
blocked when only yellow puncta are increased without an accompanying increase of
red puncta in cells [17]. In the present study, we found that treated with ASD, more
autolysosomes was increased than autophagosomes, indicating autophagic flux was
increased.
OA treatment of BRL cells resulted in an accumulation of p62 paralleled with an
increase in the LC3-II, reflecting a loss of the autophagic flux. ASD prevented OA
induced LC3-II, p62, Beclin and phospho-mTOR expression. The activation of the
autophagy machinery of ASD was demonstrated on several levels, including
examining LC3-II, p62, Beclin and phospho-mTOR expression in the absence or
presence of rapamycin or CQ. In the present study, we found that ASD can attenuate
the autophagic flux blocked by OA reflected by reduced phosphorylation of mTOR,
decreased p62, LC3-II and similar to the effect of rapamycin. Regarding autophagy-
induced clearance of hepatic lipid droplets, ASD was no longer able to alleviate lipid
accumulation in the presence of siRNA-mediated knockdown of Atg7. Moreover,
depletion of Atg7 or treated with CQ abolished the protective effect of ASD act as
This article has not been copyedited and formatted. The final version may differ from this version.JPET Fast Forward. Published on September 26, 2016 as DOI: 10.1124/jpet.116.236562
at ASPE
T Journals on July 15, 2018
jpet.aspetjournals.orgD
ownloaded from
19
could not decrease LC-II and p62 levels. These data, point to a critical requirement of
autophagic flux in the decreased of lipid droplets actions of ASD.
JPET #236562
How do ASD increase autophagic flux? Several mechanisms may lead to increased
autophagic flux, which include: (1) promotion of the upstream induction of autophagy
and autophagosome biogenesis; or (2) increasing of autophagosomal-lysosomal fusion
(Manley et al., 2014). We found that ASD-treatment decreased LC3-II and p62 levels;
therefore, it is less likely that ASD promote upstream autophagosome biogenesis.
Therefore it is likely that ASD might improve autophagic flux by increasing
autophagosomal-lysosomal fusion. Indeed, we found that ASD not only increased
EGFP-LC3 puncta but also increased the yellow and red puncta in tandem mTagRFP-
mWasabi-LC3 assay which could eventually lead to increased
autophagosomallysosomal fusion.
In conclusion, our results indicate that Akebia saponin D mediated alleviation of
increased hepatic steatosis targeted at the fusion of autophagosomes to lysosomes.
Activation of autophagy in hepatocytes could constitute a therapeutic approach
against hepatic steatosis. These results strongly suggest that autophagy modulation via
ASD may offer a new strategy for treating NAFLD.
Conflict of interest statement
We declare that we have no conflict of interest.
Acknowledgements
We would like to thank professor Jian Lin for providing plasmids of EGFP-LC3,
mTagRFP-mWasabi-LC3 and mTagRFP-mWasabi-LC3�G.
Authorship Contributions
This article has not been copyedited and formatted. The final version may differ from this version.JPET Fast Forward. Published on September 26, 2016 as DOI: 10.1124/jpet.116.236562
at ASPE
T Journals on July 15, 2018
jpet.aspetjournals.orgD
ownloaded from
20
Participated in research design: Gong LL and Liu LH.
Conducted experiments: Gong LL, Li GR and Zhang W.
JPET #236562
Contributed reagents or analytic tools: Liu H and Shi MB.
Performed data analysis: Lv YL, Han FF, Wan ZR.
Wrote or contributed to the writing of the manuscript: Gong LL and Li GR.
This article has not been copyedited and formatted. The final version may differ from this version.JPET Fast Forward. Published on September 26, 2016 as DOI: 10.1124/jpet.116.236562
at ASPE
T Journals on July 15, 2018
jpet.aspetjournals.orgD
ownloaded from

21
JPET #236562
References
Amir M and Czaja MJ (2011) Autophagy in nonalcoholic steatohepatitis. Expert
review of gastroenterology & hepatology 5:159-166.
Bjorkoy G, Lamark T, Brech A, Outzen H, Perander M, Overvatn A, Stenmark H and
Johansen T (2005) p62/SQSTM1 forms protein aggregates degraded by
autophagy and has a protective effect on huntingtin-induced cell death. The
Journal of cell biology 171:603-614.
Czaja MJ (2010) Autophagy in health and disease. 2. Regulation of lipid metabolism
and storage by autophagy: pathophysiological implications. American journal
of physiology 298:C973-978.
Gong LL, Wang ZH, Li GR and Liu LH (2014) Protective effects of akebia saponin d
against rotenone-induced hepatic mitochondria dysfunction. Journal of
pharmacological sciences 126:243-252.
Gonzalez-Rodriguez A, Mayoral R, Agra N, Valdecantos MP, Pardo V, Miquilena-
Colina ME, Vargas-Castrillon J, Lo Iacono O, Corazzari M, Fimia GM,
Piacentini M, Muntane J, Bosca L, Garcia-Monzon C, Martin-Sanz P and
Valverde AM (2014) Impaired autophagic flux is associated with increased
endoplasmic reticulum stress during the development of NAFLD. Cell death
& disease 5:e1179.
Gracia-Sancho J, Guixe-Muntet S, Hide D and Bosch J (2014) Modulation of
autophagy for the treatment of liver diseases. Expert opinion on
investigational drugs 23:965-977.
Jeong SI, Zhou B, Bae JB, Kim NS, Kim SG, Kwon J, Kim DK, Shin TY, Jeon H,
Lim JP, Kim H, Kim HK and Oh CH (2008) Apoptosis-inducing effect of
This article has not been copyedited and formatted. The final version may differ from this version.JPET Fast Forward. Published on September 26, 2016 as DOI: 10.1124/jpet.116.236562
at ASPE
T Journals on July 15, 2018
jpet.aspetjournals.orgD
ownloaded from
22
JPET #236562
akebia saponin D from the roots of Dipsacus asper Wall in U937 cells. Archives of
pharmacal research 31:1399-1404.
Klionsky DJ, Abdalla FC, Abeliovich H, Abraham RT, Acevedo-Arozena A, Adeli K,
Agholme L, Agnello M, Agostinis P, Aguirre-Ghiso JA, Ahn HJ, Ait-
Mohamed O, Ait-Si-Ali S, Akematsu T, Akira S, Al-Younes HM, Al-Zeer
MA, Albert ML, Albin RL, Alegre-Abarrategui J, Aleo MF, Alirezaei M,
Almasan A, Almonte-Becerril M, Amano A, Amaravadi R, Amarnath S, Amer
AO, Andrieu-Abadie N, Anantharam V, Ann DK, Anoopkumar-Dukie S, Aoki
H, Apostolova N, Arancia G, Aris JP, Asanuma K, Asare NY, Ashida H,
Askanas V, Askew DS, Auberger P, Baba M, Backues SK, Baehrecke EH,
Bahr BA, Bai XY, Bailly Y, Baiocchi R, Baldini G, Balduini W, Ballabio A,
Bamber BA, Bampton ET, Banhegyi G, Bartholomew CR, Bassham DC, Bast
RC, Jr., Batoko H, Bay BH, Beau I, Bechet DM, Begley TJ, Behl C, Behrends
C, Bekri S, Bellaire B, Bendall LJ, Benetti L, Berliocchi L, Bernardi H,
Bernassola F, Besteiro S, Bhatia-Kissova I, Bi X, Biard-Piechaczyk M, Blum
JS, Boise LH, Bonaldo P, Boone DL, Bornhauser BC, Bortoluci KR, Bossis I,
Bost F, Bourquin JP, Boya P, Boyer-Guittaut M, Bozhkov PV, Brady NR,
Brancolini C, Brech A, Brenman JE, Brennand A, Bresnick EH, Brest P,
Bridges D, Bristol ML, Brookes PS, Brown EJ, Brumell JH, et al. (2012)
Guidelines for the use and interpretation of assays for monitoring autophagy.
Autophagy 8:445-544.
Kwanten WJ, Martinet W, Michielsen PP and Francque SM (2014) Role of autophagy
in the pathophysiology of nonalcoholic fatty liver disease: a controversial
issue. World J Gastroenterol 20:7325-7338.
This article has not been copyedited and formatted. The final version may differ from this version.JPET Fast Forward. Published on September 26, 2016 as DOI: 10.1124/jpet.116.236562
at ASPE
T Journals on July 15, 2018
jpet.aspetjournals.orgD
ownloaded from
23
JPET #236562
Lavallard VJ and Gual P (2014) Autophagy and non-alcoholic fatty liver disease.
BioMed research international 2014:120179.
Li C, Gao Y, Tian J, Xing Y, Zhu H and Shen J (2012) Long-term oral Asperosaponin
VI attenuates cardiac dysfunction, myocardial fibrosis in a rat model of
chronic myocardial infarction. Food Chem Toxicol 50:1432-1438.
Li C, Liu Z, Tian J, Li G, Jiang W, Zhang G, Chen F, Lin P and Ye Z (2010a)
Protective roles of Asperosaponin VI, a triterpene saponin isolated from
Dipsacus asper Wall on acute myocardial infarction in rats. European journal
of pharmacology 627:235-241.
Li C, Tian J, Li G, Jiang W, Xing Y, Hou J, Zhu H, Xu H, Zhang G, Liu Z and Ye Z
(2010b) Asperosaponin VI protects cardiac myocytes from hypoxia-induced
apoptosis via activation of the PI3K/Akt and CREB pathways. European
journal of pharmacology 649:100-107.
Li Chao, Zhang Xiao-Fei, Lv Ya-Li, Lan Yuan-Yuan, Lei Ning and Li-Hong L (2012)
Hepatoprotective effect of akebia saponin D on the acute liver injury induced
by CCl4 in mice. West China Journal of Pharmaceutical Sciences 27:257-259.
Lin CW, Zhang H, Li M, Xiong X, Chen X, Chen X, Dong XC and Yin XM (2013)
Pharmacological promotion of autophagy alleviates steatosis and injury in
alcoholic and non-alcoholic fatty liver conditions in mice. Journal of
hepatology 58:993-999.
Manley S, Ni HM, Kong B, Apte U, Guo G and Ding WX (2014) Suppression of
autophagic flux by bile acids in hepatocytes. Toxicological sciences : an
official journal of the Society of Toxicology 137:478-490.
This article has not been copyedited and formatted. The final version may differ from this version.JPET Fast Forward. Published on September 26, 2016 as DOI: 10.1124/jpet.116.236562
at ASPE
T Journals on July 15, 2018
jpet.aspetjournals.orgD
ownloaded from
24
JPET #236562
Matteoni CA, Younossi ZM, Gramlich T, Boparai N, Liu YC and McCullough AJ
(1999) Nonalcoholic fatty liver disease: a spectrum of clinical and
pathological severity. Gastroenterology 116:1413-1419.
Niu Y, Li Y, Huang H, Kong X, Zhang R, Liu L, Sun Y, Wang T and Mei Q (2011)
Asperosaponin VI, a saponin component from Dipsacus asper wall, induces
osteoblast differentiation through bone morphogenetic protein-2/p38 and
extracellular signal-regulated kinase 1/2 pathway. Phytother Res 25:1700-
1706.
Peng LH, Ko CH, Siu SW, Koon CM, Yue GL, Cheng WH, Lau TW, Han QB, Ng
KM, Fung KP, Lau CB and Leung PC (2010) In vitro & in vivo assessment of
a herbal formula used topically for bone fracture treatment. Journal of
ethnopharmacology 131:282-289.
Singh R, Kaushik S, Wang Y, Xiang Y, Novak I, Komatsu M, Tanaka K, Cuervo AM
and Czaja MJ (2009) Autophagy regulates lipid metabolism. Nature 458:1131-
1135.
Smith BW and Adams LA (2011) Non-alcoholic fatty liver disease. Critical reviews
in clinical laboratory sciences 48:97-113.
Yang L, Li P, Fu S, Calay ES and Hotamisligil GS (2010) Defective hepatic
autophagy in obesity promotes ER stress and causes insulin resistance. Cell
metabolism 11:467-478.
Yu X, Wang LN, Ma L, You R, Cui R, Ji D, Wu Y, Zhang CF, Yang ZL and Ji H
(2012) Akebia saponin D attenuates ibotenic acid-induced cognitive deficits
and pro-apoptotic response in rats: involvement of MAPK signal pathway.
Pharmacology, biochemistry, and behavior 101:479-486.
This article has not been copyedited and formatted. The final version may differ from this version.JPET Fast Forward. Published on September 26, 2016 as DOI: 10.1124/jpet.116.236562
at ASPE
T Journals on July 15, 2018
jpet.aspetjournals.orgD
ownloaded from
25
JPET #236562
Yuan-yuan Lan, Ning Lei, Xiao-Fei Zhang, Run-tao Yang, Chao Li and L-H. L
(2011) Hypolipidemic function with liver protection of extracts from Dipsacus
asper on nonalcoholic fatty liver diseas e in mice and its activie fractions.
Chinese Traditional and Herbal Drugs 42:2497-2501.
Zhou C, Zhong W, Zhou J, Sheng F, Fang Z, Wei Y, Chen Y, Deng X, Xia B and Lin
J (2012) Monitoring autophagic flux by an improved tandem fluorescent-
tagged LC3 (mTagRFP-mWasabi-LC3) reveals that high-dose rapamycin
impairs autophagic flux in cancer cells. Autophagy 8:1215-1226.
Zhou YQ, Yang ZL, Xu L, Li P and Hu YZ (2009) Akebia saponin D, a saponin
component from Dipsacus asper Wall, protects PC 12 cells against amyloid-
beta induced cytotoxicity. Cell biology international 33:1102-1110.
This article has not been copyedited and formatted. The final version may differ from this version.JPET Fast Forward. Published on September 26, 2016 as DOI: 10.1124/jpet.116.236562
at ASPE
T Journals on July 15, 2018
jpet.aspetjournals.orgD
ownloaded from
26
JPET #236562
Footnotes
This study was supported by the National Natural Science Foundation of China
(No.81302822). Beijing Municipal Administration of Hospitals’ Youth Programme
(No. QML20150302). The capital of Chinese medicine research subject (No.
15ZY02).
This article has not been copyedited and formatted. The final version may differ from this version.JPET Fast Forward. Published on September 26, 2016 as DOI: 10.1124/jpet.116.236562
at ASPE
T Journals on July 15, 2018
jpet.aspetjournals.orgD
ownloaded from

27
JPET #236562
Figure legend
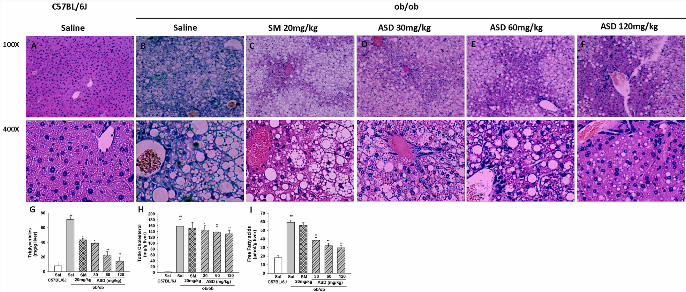
Fig.1. Effects of ASD on liver morphology in ob/ob mice. (A) C57BL/6 mice
showed normal hepatocytes with distinctive membrane, abundant cytoplasm and
regular oval nuclei. (B) ob/ob mice treated with saline i.p. for 4 wk showed a marked
accumulation of fat droplets; (C) ob/ob mice treated with Silibinin meglumine (SM,
20 mg/kg/d) for 4 wk showed mild to moderate the fat droplets; (D–F) ob/ob mice
treated with ASD (30, 60 and 120 mg/kg/d) i.p. for the same period of time. ASD-
treated obese mice displayed decreased hepatic steatosis. H&E stain 100× (Scale bar:
400 μm.) and 400× (Scale bar: 200 μm.). (G-I) Liver triglyceride, total cholesterol,
free fatty acids concentration, ASD-treated significantly decreased hepatic TG, TC,
FFA level. Results are presented as means ± S.E.M., n = 6, Compared with normal
control: ##P < 0.01; compared with ob/ob mice: **P < 0.01.
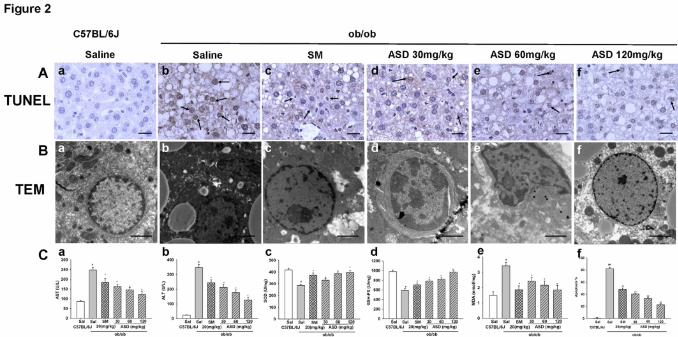
Fig. 2. Effect of ASD on heptocyte apoptosis in ob/ob mice. (Aa and Ba) Normal
group no apoptotic cells. (Ab and Bb) ob/ob mice treated with saline i.p. for 4 wk
showed significantly more TUNEL positive apoptotic cells, TEM showed hepatocyte
shrinked and nucleolus broken (b) and the increase in apoptotic cells is significantly
attenuated by ASD (30, 60 and 120 mg/kg/d, respectively) treatment (d-f). (Ac and
Bc) SM 20 mg/kg/d also decreased the apoptotic cells. Effect of ASD on serum
marker enzymes aspartate transaminase (AST) and alanine transaminase (ALT) in
ob/ob mice (Ca-b). Effect of ASD on liver levels of superoxide dismutase (SOD),
malondialdehyde (MDA), and glutathione peroxidase (GSH-PX) in ob/ob mice (Cc-
e). Effects of ASD on the number of TUNEL positive cells (Cf). TUNEL scale bar:
100 μm, TEM scale bar: 50 μm. Results are presented as means ± S.E.M., n = 6,
This article has not been copyedited and formatted. The final version may differ from this version.JPET Fast Forward. Published on September 26, 2016 as DOI: 10.1124/jpet.116.236562
at ASPE
T Journals on July 15, 2018
jpet.aspetjournals.orgD
ownloaded from
28
JPET #236562
Compared with normal control: ##P < 0.01; compared with ob/ob mice: **P < 0.01.
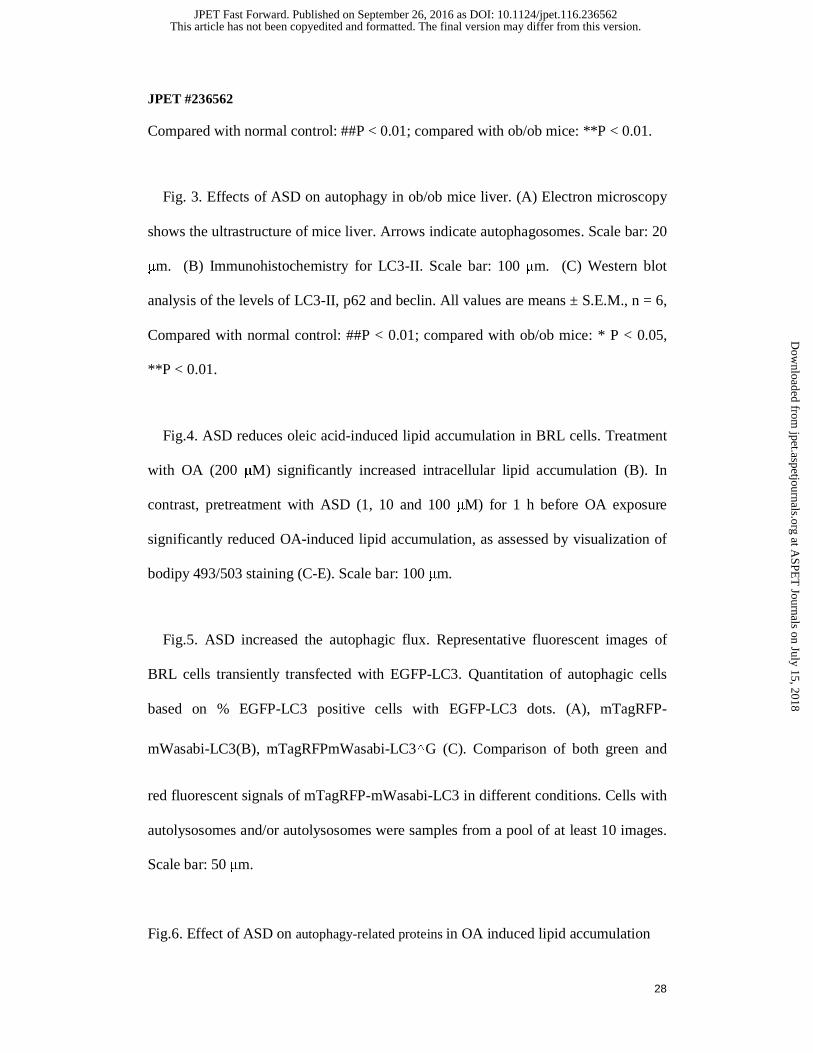
Fig. 3. Effects of ASD on autophagy in ob/ob mice liver. (A) Electron microscopy
shows the ultrastructure of mice liver. Arrows indicate autophagosomes. Scale bar: 20
μm. (B) Immunohistochemistry for LC3-II. Scale bar: 100 μm. (C) Western blot
analysis of the levels of LC3-II, p62 and beclin. All values are means ± S.E.M., n = 6,
Compared with normal control: ##P < 0.01; compared with ob/ob mice: * P < 0.05,
**P < 0.01.
Fig.4. ASD reduces oleic acid-induced lipid accumulation in BRL cells. Treatment
with OA (200 μM) significantly increased intracellular lipid accumulation (B). In
contrast, pretreatment with ASD (1, 10 and 100 μM) for 1 h before OA exposure
significantly reduced OA-induced lipid accumulation, as assessed by visualization of
bodipy 493/503 staining (C-E). Scale bar: 100 μm.
Fig.5. ASD increased the autophagic flux. Representative fluorescent images of
BRL cells transiently transfected with EGFP-LC3. Quantitation of autophagic cells
based on % EGFP-LC3 positive cells with EGFP-LC3 dots. (A), mTagRFP-
mWasabi-LC3(B), mTagRFPmWasabi-LC3△G (C). Comparison of both green and
red fluorescent signals of mTagRFP-mWasabi-LC3 in different conditions. Cells with
autolysosomes and/or autolysosomes were samples from a pool of at least 10 images.
Scale bar: 50 μm.
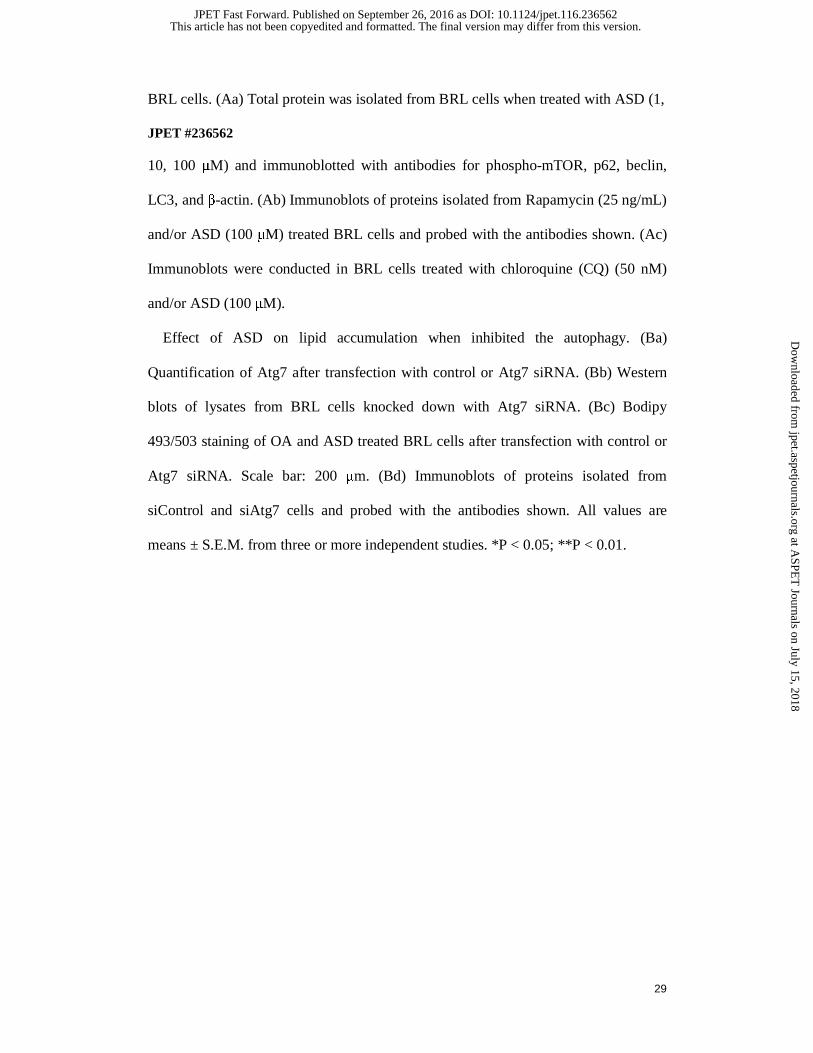
Fig.6. Effect of ASD on autophagy-related proteins in OA induced lipid accumulation
This article has not been copyedited and formatted. The final version may differ from this version.JPET Fast Forward. Published on September 26, 2016 as DOI: 10.1124/jpet.116.236562
at ASPE
T Journals on July 15, 2018
jpet.aspetjournals.orgD
ownloaded from
29
BRL cells. (Aa) Total protein was isolated from BRL cells when treated with ASD (1,
JPET #236562
10, 100 μM) and immunoblotted with antibodies for phospho-mTOR, p62, beclin,
LC3, and β-actin. (Ab) Immunoblots of proteins isolated from Rapamycin (25 ng/mL)
and/or ASD (100 μM) treated BRL cells and probed with the antibodies shown. (Ac)
Immunoblots were conducted in BRL cells treated with chloroquine (CQ) (50 nM)
and/or ASD (100 μM).
Effect of ASD on lipid accumulation when inhibited the autophagy. (Ba)
Quantification of Atg7 after transfection with control or Atg7 siRNA. (Bb) Western
blots of lysates from BRL cells knocked down with Atg7 siRNA. (Bc) Bodipy
493/503 staining of OA and ASD treated BRL cells after transfection with control or
Atg7 siRNA. Scale bar: 200 μm. (Bd) Immunoblots of proteins isolated from
siControl and siAtg7 cells and probed with the antibodies shown. All values are
means ± S.E.M. from three or more independent studies. *P < 0.05; **P < 0.01.
This article has not been copyedited and formatted. The final version may differ from this version.JPET Fast Forward. Published on September 26, 2016 as DOI: 10.1124/jpet.116.236562
at ASPE
T Journals on July 15, 2018
jpet.aspetjournals.orgD
ownloaded from
This article has not been copyedited and formatted. The final version may differ from this version.JPET Fast Forward. Published on September 26, 2016 as DOI: 10.1124/jpet.116.236562
at ASPE
T Journals on July 15, 2018
jpet.aspetjournals.orgD
ownloaded from
This article has not been copyedited and formatted. The final version may differ from this version.JPET Fast Forward. Published on September 26, 2016 as DOI: 10.1124/jpet.116.236562
at ASPE
T Journals on July 15, 2018
jpet.aspetjournals.orgD
ownloaded from
This article has not been copyedited and formatted. The final version may differ from this version.JPET Fast Forward. Published on September 26, 2016 as DOI: 10.1124/jpet.116.236562
at ASPE
T Journals on July 15, 2018
jpet.aspetjournals.orgD
ownloaded from
This article has not been copyedited and formatted. The final version may differ from this version.JPET Fast Forward. Published on September 26, 2016 as DOI: 10.1124/jpet.116.236562
at ASPE
T Journals on July 15, 2018
jpet.aspetjournals.orgD
ownloaded from
This article has not been copyedited and formatted. The final version may differ from this version.JPET Fast Forward. Published on September 26, 2016 as DOI: 10.1124/jpet.116.236562
at ASPE
T Journals on July 15, 2018
jpet.aspetjournals.orgD
ownloaded from
This article has not been copyedited and formatted. The final version may differ from this version.JPET Fast Forward. Published on September 26, 2016 as DOI: 10.1124/jpet.116.236562
at ASPE
T Journals on July 15, 2018
jpet.aspetjournals.orgD
ownloaded from