airport security: examining the current state of acceptance of
TRANSCRIPT

AIRPORT SECURITY: EXAMINING THE CURRENT STATE OF ACCEPTANCE OF BIOMETRICS AND THE PROPENSITY OF ADOPTING BIOMETRIC TECHNOLOGY FOR
AIRPORT ACCESS CONTROL
by
KRISTINE M. SUMNER B.S. University of Central Florida, 1999 M.S. University of Central Florida, 2000
A dissertation submitted in partial fulfillment of the requirements for the degree of Doctor of Philosophy in Public Affairs
in the College of Health and Public Affairs at the University of Central Florida
Orlando, Florida
Summer Term 2007
Major Professor: Aaron Liberman

© 2007 Kristine Sumner
ii
ABSTRACT The terrorist attacks of September 11, 2001 propelled the issue of aviation security to the
forefront of the U.S. domestic agenda. Although hundreds of individual airports exist in the U.S.,
the travel activities at each of these airports combine to holistically comprise an aviation system
that represents a significant portion of the U.S. social and economic infrastructure. Disruption at
one airport resulting from a criminal act, such as terrorism, could exert detrimental effects upon
the aviation system and U.S national security (9/11 Commission, 2004).
Each U.S. airport is individually responsible for various aspects of security including the
control of physical access to sensitive and secure areas and facilities (9/11 Commission, 2004).
Biometric technology has been examined as one method of enhancing airport access control to
mitigate the possibility of criminal acts against airports. However, successful implementation of
biometric technology depends largely on how individual security directors at each airport
perceive, understand, and accept that technology. Backgrounds, attitudes, and personal
characteristics influence individual decisions about technology implementation (Rogers, 1995;
Tornatzky and Fleischer, 1990).
This study examines the problem of airport access control, as well as, the current trends
in biometric technology. Utilizing a survey of airport security directors and security managers,
this study draws upon innovation diffusion theory and organizational theories to determine what
personal, organizational, and technical variables contribute to the propensity of airport security
directors and managers to adopt biometric technology for airport access control.
iii

This dissertation is dedicated first and foremost to my amazing parents, Scott and Kathy, for
their never-ending love, support, and guidance. Also, to Joel, Jenny and Michelle for the love
and understanding that only siblings can provide. Finally, as a special thank you to Megan
Burley, Ashley Reynolds, Kelly Roberts and Jenny Stanley for their friendship, support and
encouragement.
iv

ACKNOWLEDGMENTS There have been so many people who have been instrumental in helping me to complete
this dissertation. I am truly thankful for the help, support and direction given to me by my
committee members, Dr. Eileen Abel, Dr. Kenneth Adams and Dr. Stephanie Myers. I would
like to extend my gratitude to my committee chair, Dr. Aaron Liberman, for committing to this
project. He became my greatest advocate, and his direction and expertise were immeasurable to
the completion of this dissertation. Appreciation is also extended to Dr. Tom Wan and Margaret
Mlachak for all of their help and effort during my tenure as a student in the PhD program.
I would like to extend special appreciation to Brigitte Goersch, Director of Security for
the Orlando International Airport. Her assistance, support and advice during this process were
invaluable, and I am thankful for the guidance and friendship that she has shown to me.
I would like to formally thank Airports Council International – North America, and
especially Charles Chambers, Jr., for helping to facilitate the distribution of my survey to airport
security directors from across the country. Additionally, I would like to thank all of the airport
security directors, coordinators and manager who participated in this study. Thank you for taking
the time to actively respond so that I could complete my dissertation process
Finally, I want to say a special thank you to my twin sister, Jenny, for being my personal
proof-reader, my biggest critic and my greatest supporter. I could not have done this without you.
v

TABLE OF CONTENTS
LIST OF FIGURES viii LIST OF TABLES ix 1. INTRODUCTION 1
2. LITERATURE REVIEW 5
2.1. Aviation Security 5 2.1.1. Terrorist Motivations 6 2.1.2. Airport Susceptibility 7
2.2. Airport Access Control 8 2.2.1. History 9 2.2.2. Current Problems in Airport Access Control 12
2.3. Biometrics 13 2.4. Chapter Summary 16
3. THEORETICAL FOUNDATIONS 17 3.1. Total Quality Management Theory 19 3.2. Diffusion of Innovation Theory 20 3.3. Theory of Individual Innovativeness 22 3.4. Theory of Perceived Attributes 23 3.5. Chapter Summary 25
4. RESEARCH FRAMEWORK 26 4.1. Framework 26
4.1.1. Characteristics of Biometric Technologies 27 4.1.2. Characteristics of Airport Security Directors 29 4.1.3. Characteristics of Airports 32 4.1.4. Characteristics of the Environment 33
4.2. Research Questions 34 4.3. Hypotheses 37
5. RESEARCH METHODOLOGY 41 5.1. Research Justification 41 5.2. Research Methodology 42 5.3. Sampling Frame 42 5.4. Unit of Analysis and Respondents 43 5.5. Survey Construction and Administration 44
6. DATA ANALYSIS – FREQUENCIES 47
6.1. Frequencies 48
vi
6.1.1. Demographics of Respondents 49 6.1.2. Demographics of Airports 51 6.1.3. Knowledge of Biometrics 53 6.1.4. Implementation of Biometric Technology 61 6.1.5. Overall Attitudes on Biometric Technology 69
6.2. Chapter Summary 73 7. DATA ANALYSIS – BIVARATE RELATIONSHIPS 76
7.1. Hypothesis 1 and Hypothesis 2 79 7.2. Hypothesis 3 82 7.3. Hypothesis 4 86 7.4. Hypothesis 5 87 7.5. Hypothesis 6 90 7.6. Hypothesis 7 92 7.7. Path Analysis 93
7.7.1. Overall Model Results 96 7.8. Discussion of Correlation and Path Analysis 101
7.8.1. Hypothesis 1 101 7.8.2. Hypothesis 2 104 7.8.3 Hypothesis 3 105 7.8.4 Hypothesis 4 106 7.8.5 Hypothesis 5 108 7.8.6 Hypothesis 6 109 7.8.7 Hypothesis 7 110
7.9 Chapter Summary 111 8. DISCUSSION AND CONCLUSION 114
8.1. Contributions 114 8.2. Limitations 116 8.3. Future Research 117 8.4. Conclusion 118
APPENDIX: RESPONSES TO OPEN-ENDED QUESTIONS 120 REFERENCES 128
vii

LIST OF FIGURES
Figure 1: Airport access control diagram 9
Figure 2: Factors of behavioral intent to use 31
Figure 3: Propensity to adopt an innovation 35
Figure 4: Level of familiarity with biometrics by type 57
Figure 5: Overall level of familiarity with biometrics 59
Figure 6: Independent variable related to dependant variable 94
Figure 7: Path analysis of propensity to adopt 94
Figure 8: Full conceptual model 96
Figure 9: AMOS testable model 97
Figure 10: Adjusted conceptual model 100
Figure 11: Knowledge model 102
viii

LIST OF TABLES
Table 3.1: Adopter categories 23
Table 4.1: Potential factors that could influence adoption 27
Table 6.1: Gender of airport security directors 49
Table 6.2: Age of airport security directors 50
Table 6.3: Education level of airport security directors 50
Table 6.4: Years as a security director 51
Table 6.5: Airports by classification 52
Table 6.6: Operating authority of airports 53
Table 6.7: Knowledge of biometric technology 54
Table 6.8: Familiarity with fingerprint scanning 55
Table 6.9: Familiarity with hand geometry 55
Table 6.10: Familiarity with voice recognition 55
Table 6.11: Familiarity with facial recognition 56
Table 6.12: Familiarity with iris scanning 56
Table 6.13: Familiarity with retinal scanning 57
Table 6.14: Overall understanding of biometric technology 60
Table 6.15: Overall understanding by airport classification 60
Table 6.16: Availability of information about biometrics 61
Table 6.17: Number of years until used as a primary method of access control 62
Table 6.18: Number of years until used as a primary method of access
control by airport classification 63
ix

Table 6.19: Newness of biometric technology as an issue 64
Table 6.20: Newness of biometric technology as an issue by airport classification 64
Table 6.21: Compatibility of biometrics with airport operations 65
Table 6.22: Compatibility of biometrics with airport security goals 66
Table 6.23: Compatibility with security goals by airport classification 66
Table 6.24: Guidance by TSA 67
Table 6.25: Level of TSA guidance 68
Table 6.26: Expected by TSA to use biometric technology 69
Table 6.27: Most beneficial biometric technology for airport access control 70
Table 6.28: Least beneficial biometric technology for airport access control 70
Table 6.29: Level of priority given to using biometrics for airport access control 71
Table 6.30: Level of priority by airport classification 72
Table 6.31: Overall attitude towards biometric technology 72
Table 6.32: Overall attitude towards biometric technology by airport classification 73
Table 7.1: Study variables 77
Table 7.2: Study hypotheses 78
Table 7.3: Correlations based on individual demographics 80
Table 7.4: Propensity to adopt biometrics by gender 81
Table 7.5: Correlations based on organizational demographics 82
Table 7.6: Significant correlations based on compatibility 83
Table 7.7: Non-significant correlations based on compatibility 85
Table 7.8: Correlations based on voluntariness 87
x

Table 7.9: Correlations based on relative advantage 89
Table 7.10: Correlations based on ease of use 91
Table 7.11: Correlations based on image 92
Table 7.12: Summary of study hypotheses 112
xi
1. INTRODUCTION
The United States, along with the rest of the world, was shocked and stunned as
the terrorist attacks of September 11, 2001 unfolded. Following the attacks, debates
relating to terrorist activities within the United States and the need to enhance many
aspects of security began to emerge. At the forefront of these debates was aviation
security. The security of the aviation system is considered important because of its role as
part of the critical infrastructure of the U.S. “Virtually every community in America is
connected to the global transportation network…that moves people and goods into,
within, and out of the nation. We, therefore, must promote the efficient and reliable flow
of people, goods, and services, while preventing terrorists from using transportation
conveyances or systems to deliver implements of destruction” (Office of Homeland
Security 2002, p. 21).
Aviation is a vital part of America’s critical infrastructure. A substantial
disruption of the air transportation systems could have an enormous impact on the social
and economic functions of the United States (9/11 Commission, 2004). As such, airports
must have the design and security structure to mitigate possible criminal acts, like
terrorism, that could cause such disruptions. Historically, airport security has taken a
backseat in an aviation system designed to expedite passenger movement and increase
financial gains for the airline industry (Hoge and Rose, 2001). The aviation industry is a
“commercial enterprise that will always make poor public policy decisions when they
affect profits and losses” (Hoge and Rose 2001, p.165). This notion has left U.S. airports
vulnerable to numerous security threats. A breach at an airport’s physical access control
point is one such threat.
1

Section 1542.207 of the Transportation Security Administration (TSA) rules
dictates that airports are responsible for controlling access to secure areas and facilities at
their respective airports. Each airport has a security director who is responsible for
applying the rules of the TSA and who is in charge of promoting security measures at
their respective airports. While all airports have some method of access control, a lack of
accurate and rigorous identification of employees who are cleared to access secure areas
has been seen as a serious threat. Government studies, highlighting the pervasiveness of
unsecured access points, reveal that airport access control is a critical security problem
and it is an area that needs to be strengthened (Bernard, 2003).
Biometric personal identification systems represent a possible solution to security
threats caused by non-identification methods of access control (Perry, 2004). Non-
identification methods such as card swiping systems, keys, PIN numbers, or other
credentials are inherently un-secure because they allow anyone who possesses them to
gain entry, even if that person is not the authorized holder. These methods cannot be
controlled because they can easily be lost, stolen, borrowed, copied, or otherwise
compromised (Perry, 2004). Biometric systems, however, utilize a person’s unique
physical characteristics to verify that person’s identity. Although biometric technology
has been utilized successfully for access control in many areas of government and the
private sector, such technology has been slow to gain acceptability in the airport
environment.
Since 9/11 there has been an effort to increase airport security, but a majority of
research and funding has gone to such areas as passenger and baggage screening (9/11
Commission, 2004). Access control measures, while mentioned as important
2

vulnerabilities to consider, have not yet been assigned any form of standardization or
enhancement strategies (U.S. General Accounting Office 2001, p. 5). Airport security
directors face the problem of having to consider access control options and changes with
little or no guidance from TSA on which is the best method to implement (ACI, 2005;
TSA, 2005). Besides TSA guidance, differences in individual attitudes, characteristic,
and background of the airport security directors may influence who is likely to adopt
biometric technology for airport access control. Additionally, organizational and
technological factors may also influence the propensity to adopt biometric technology
(Rogers, 2005). Since airport security directors, as representatives of their respective
airports, will ultimately be the “end-users” of any technology that will be used to enhance
access control, it is important to examine those personal and organizational
characteristics that influence the likelihood of adoption of an innovative technology such
as biometrics. The understanding of such characteristics can assist airport managers,
TSA, and industry experts in deciding if biometric implementation would be met with
acceptance or resistance among airport security directors (Rogers, 2005).
The purpose of this study, therefore, was to 1) examine the current trends in
biometric acceptance, 2) measure the propensity of airport security directors to adopt
biometric technology for airport access control, and 3) examining those factors that may
be related to that propensity of airport security directors to adopt biometric technology
for airport access control. Because “human elements” of individuals play a major role in
organizational operations, it is important to examine those factors that may have an
impact on the propensity to adopt and deployment new technologies (Chan, 2002). This
study drew upon Roger’s (1995) diffusion theory, as well as, organizational theories to
3

examine the relationship between social, organizational, and technical factors and the
propensity of airport security directors adopting biometric technology (as an innovation)
to enhance airport access control. Drawing from the available literature, the following
research questions were developed for this study: 1) to what extent is airport security
directors propensity to adopt biometric technology for access control influenced by social
demographics, organizational factors, and attitudinal factors, and 2) to what extent is
airport security director propensity to adopt biometric systems for access control
influenced by characteristics of the innovation and technical readiness of the airport
itself.
In order to examine the propensity of airport security directors to adopt biometric
technology for airport access control, a survey instrument, similar to the design used by
Moore and Benbasat (1991), was designed and administered to airport security directors
at 380 U.S. airports. The frequencies of the responses were analyzed and summarized,
and the relationships between 7 independent variables and the propensity to adopt
biometric technology (the dependant variable) were analyzed using correlation.
4

2. LITERATURE REVIEW
2.1. Aviation Security
After the events of September 11, 2001, questions were raised regarding the
reliability and security of American commercial air travel and the safety of U.S. airports
from which commercial planes depart and land. More than any other component of the
U.S. transportation system, air security has garnered the most attention because
historically, in large measure, the adoption of counterterrorism policies and programs are
in direct response to specific events (Waugh, 2004). Airplanes were used to carry out the
events of September 11th, therefore the aviation sector has received a large amount of
counterterrorism attention. Since 9/11 and the creation of the Department of Homeland
Security and the Transportation Security Administration, several measures have been
implemented to enhance aviation security. These include:
- Deployment of federal passenger screeners at the nation’s airports
- Institution of 100% checked baggage screening; utilization of explosive
detection systems or explosive trace detection equipment to screen checked
baggage
- Background checks on all airport personnel
- Suspension of the Transit without Visa program (TWOV) and the
International-to-International transit program (ITI), eliminating terrorists’
ability to exploit such programs to gain access to U.S.-bound aircraft or the
United States
- Expansion of the Federal Air Marshal program so that thousands of protective
air marshals are now flying on commercial aircraft
5
- Commercial passenger aircraft now have hardened cockpit doors to help
prevent a hostile takeover (The White House, 2003; Dillingham, 2003).
Even with these measures, however, security at airports themselves is still plagued with
vulnerabilities and threats that could be exploited by criminals, including terrorists. One
such vulnerability is weak physical access control to secure airport areas (Brown, 2006).
2.1.1. Terrorist motivations
Before examining airport access control it is important to highlight why,
especially following 9/11, these vulnerabilities have received so much attention. In a
word, the answer is terrorism. While terrorism will be discussed generally to lend
relevance to this study, a full discourse on terrorism is not the focus of this research. In
today’s society there are many different definitions of terrorism and terrorists, though
unanimity on a standard definition of either term is non-existent. Terrorism is defined by
the FBI as “the unlawful use of force or violence against persons or property to intimidate
or coerce a government, the civilian population, or any segment thereof, in furtherance of
political or social objectives.” The U.S. Department of Defense defines terrorism as “the
calculated use of violence or threat of violence to instill fear, intended to coerce or try to
intimidate governments or societies in the pursuit of goals that are generally political,
religious, or ideological” (Segar 2003, p. 257).
Different terrorists and terrorist groups are motivated by different agendas.
However, there are common goals that are generally shared by terrorists. These goals
provide evidence as to why terrorists could be considered motivated perpetrators of a
terrorist act against airports and airlines: 1) no rules: terrorists do not hold to normal
conventions that are found in arenas such as warfare; 2) no innocents: because terrorists
6

are fighting an established system thought to be “unjust” any member of that system is a
justified target; 3) economy: terrorists attempt to frighten thousands, or millions, with a
single act; 4) publicity: a public act of terrorism magnifies the event and heightens the
associated fear; additionally, publicity advertises the terrorists’ cause; 5) individual
reward: terrorists commit acts of terror for the purpose of individual advancement,
whether in this life or in the “after life”; and 6) varied objective: either political, religious,
or ideological (Vito & Holmes, 1994).
2.1.2. Airport Susceptibility
After examining the varied goals that drive terrorists, it is important to understand
why the aviation industry and airports are vulnerable to terrorist acts. The Committee for
Science and Technology for Countering Terrorism identifies five characteristics that
make airports susceptible targets for acts of terrorism. These characteristics are: 1)
openness and accessibility: airports were designed well before security and terrorism
were issues of concern in the United States. By design, airports allow a high degree of
user access to accommodate a large volume of people. 2) Extent and ubiquity: there are
over 500 commercial service airports and over 14,000 general aviation airports across the
U.S. Many of the infrastructure facilities such as terminals, navigation aides, and
operational control centers are extremely difficult to safeguard, monitor, and control. 3)
Emphasis on efficiency and competitiveness. Because airports operate as for profit
entities, security measures that are viewed as costly and/or that impede operations are
usually rejected. 4) Diversity of owners, operators, and overseers: although the federal
government establishes guidelines and regulations for airports, its ownership of
commercial airports is minimal. Most airports are controlled by state and local
7

governments, which makes standardization of security measures complex. 5)
Entwinement in society and the global economy. Airports and airlines are essential
entities that connect areas around the country, and the world. Any disruption in the air
transportation system would have far reaching consequences (Committee on Science and
Technology for Counter Terrorism, 2002).
2.2. Airport Access Control Following 9/11, several airport vulnerabilities have been examined and, as highlighted by government studies, a terrorist could utilize weaknesses in airport access control methods to approach an aircraft (Eisenburg, 2001). The concept of
airport access control is to designate who has access to various facilities, services, and
sensitive airport areas (Bernard, 2003). Airports, by their nature, employ hundreds of
individuals with varying jobs requiring a diverse range of access privileges. Pilots, flight
attendants, baggage handlers, mechanics, fuel truck drivers, ticket agents, gate agents,
airport operations staff, air traffic controllers, airport security, and airport maintenance
personnel are all examples of various employees needing privileges to multiple access
points located within the airport (Lazarick, 1998). Figure 1 shows a basic diagram
example of how access privileges at airports can be different depending upon the job
required. Each colored block on the diagram represents an access door/point in the
airport.
8

Control
Tower Airport security Fuel personnel Gate agent Airside Traffic controller Ticket agent Baggage handler Flight attendant Pilot Airport maintenance
Terminal
Figure 1: Example of airport access (Source: CoreStreet Ltd., 2005)
In theory, only those employees that are granted access privileges to their
respective “work zones” can access the security mechanisms (i.e. doors, gates, etc.) to
enter that zone. For example, baggage handlers (represented by purple on Figure 1) can
only enter areas required to move baggage from the terminal to the aircraft. They would
not be permitted to enter other areas not associated with baggage handling, such as the
control tower. However, as the following literature review indicates, the current methods
of airport access control make limiting access to only authorized individuals an arduous
task.
2.2.1. History of Airport Access Control
In 1973, the Federal Aviation Administration (FAA) mandated that airports must
have an Airport Security Plan (ASP), which includes an outline of the procedures that
airports would utilize to control access to secured airport areas and facilities. It became
the responsibility of each airport to regulate and control the movement of those persons
who, after a background check, were granted access to secured airport areas (Radio
9

Technical Commission for Aeronautics, 2002). Measures, such as doors, were installed to
restrict access to secure areas such as baggage handling, flight crew areas, and aircraft
operations areas. The purpose of airport access control became to authenticate, or identify
with a high degree of certainty, that an employee is who he or she claims to be in order to
gain access to secure airport areas (Mulligan, 2002),
Federal regulations regarding access control were tightened somewhat in 1987
after the crash of Pacific Southwest Airlines Flight 1711, which was overtaken by a
recently fired and disgruntled employee. The employee was able to use his employee ID,
which was not collected after his dismissal, to circumvent security and board the plane
with a loaded 44 Magnum pistol. After take off, the employee shot the pilots,
consequently crashing the plane and killing all 44 passengers on board (U.S. Congress
Office of Technology Assessment, 1992).
By 1989, Federal Aviation Regulation (FAR) 107.14 was written into law. This
regulation stipulated that any airport with regular passenger aircraft service (one flight
per day) utilizing aircraft of 60 seats or more must strictly control access to airport
operations areas and deny access to those who are unauthorized or whose authorization
status changes (Mulligan, 2002). Despite the regulations, airport security was lax as a
result of an industry goal of maximizing passengers while minimizing costs. Security
became an afterthought due to its expense. “…[Aviation] is a commercial enterprise that
will always make poor public policy decisions when they affect profit and losses” (Hoge
and Rose 2001, p. 164).
Due to the lack of strict access control at airports, government inspectors found that it
was quite easy to exploit access control vulnerabilities and smuggle weapons onto planes
10
or to enter aircraft operations areas without identification. Studies highlighted the
possibility of a person gaining unauthorized access to secure airport areas. For example,
from December 1998 through April 1999, the Transportation Department, while
conducting a test of airport security, found that investigators managed to breach airport
access control 117 out of 173 times. This represents a 68% success rate. The investigators
were able to “piggyback employees through doors, ride unguarded elevators, and walk
through concourse doors, gates, and jet bridges unchallenged” (Eisenburg 2001, p. 85).
Even more critical was the discovery that the “successful penetration of secure areas
almost always resulted in our boarding an aircraft,” according to Alexis Stefani, a
Transportation Department official (Hoge and Rose 2001, pg.170).
The areas that the investigators were able to penetrate are referred to as the Security
Identification Display Area (SIDA), and each airport defines its SIDA in its Airport
Security Plan. The SIDA includes those areas that are sensitive in nature; for example,
the area surrounding parked aircraft would fall under this category. In order to access the
SIDA, and at all times while in the SIDA, each employee is required to display his/her
airport issued ID badge. However, the problem that exists is that the practices to enforce
this requirement vary drastically among airports (Lazarick, 1998).
The events of 9/11 further impacted airport access control standards. In February of
2002, the FAA transferred airport security rules related to access control to the newly
formed Transportation Security Administration (TSA). According to section 1542.207 of
TSA’s Access Control Requirements, airports must:
- Ensure that only those individuals authorized to have unescorted
access to the secured areas are able to gain entry.
11

- Ensure that an individual is immediately denied entry to a secure area
when that person’s access authority for that area is withdrawn.
- Provide a means to differentiate between individuals authorized to
have access to an entire secured area and individuals authorized to
access to only a particular portion of a secured area (Bernard, 2003).
Despite post 9/11 standards and regulations attempting to tighten airport access
control, incidences of unauthorized access to secured areas are still being reported. For
example, on April 5, 2002 (at an undisclosed airport) an airline worker “escorted his
girlfriend and three relatives through a lower-level door near the ramp…entering a secure
area of the jetway…” without screening (Morrison 2002, pg. 2). In another such
occurrence, in May of 2003, a man was able to sneak through a secure airline door at
Pittsburgh International Airport, drive a United Airlines Truck around the airfield, and
walk onto a U.S. Airway plane were he was found asleep the next day (Goo, 2003). As
recently as May of 2005, a man who did not work at the Salt Lake City International
Airport used an access badge belonging to his twin brother, a legitimate airport
employee, to gain access to sterile, or secure, facilities at the airport (Desertnews.com,
2005).
2.2.2. Current Problems in Airport Access Control
Examples of such unauthorized admission to secured areas of airports highlight an
inherent weakness in most traditional methods of access control such as lock and key or
card only mechanisms: there is no control over who or how many individuals actually
enter a secured area when an access media is presented. “Card access systems, PIN
12

numbers, keys or other credentials allow anyone who possesses them to gain entry. They
cannot be controlled because they are so easily lost, stolen, borrowed, copied or
otherwise compromised” (Perry 2003, p.1). These inherent problems could possibly be
exploited by a criminal, including a terrorist, wishing to gain access to secure airport
facilities and functions.
“[Employee entrances] are a weakness in the system that’s exploitable by a
terrorist group or someone who wants to make use of it,” states former Federal Aviation
Administration security director Billie Vincent (Salant 2002, p. 2). “We need better
systems that provide protection for our secured areas,” said House Transportation
Aviation Subcommittee Chairman John Mica R-Fl. “There is no question we’re
vulnerable” (Salant 2002, p. 2). While the type of access control can be the major factor
contributing to its vulnerability, a lack of innovativeness by airport security directors to
embrace a new technology such as biometrics could hinder the use of secure and positive
identification systems for access control enhancements.
2.3. Biometrics
In order to overcome the inherent problems with traditional airport access control
methods and to securely strengthen access control doors that lead to secure airport areas,
proactive technological innovations are being examined as to their applicability to airport
security. One such technological advancement, biometric identification, is being
considered as an alternative to traditional access control methods. TSA Administrator,
Admiral James M. Loy, advocates such technological advances. “To stay ahead of
terrorists who would do us harm, it is vitally important that TSA always develop, select,
and deploy cutting edge technology” (DHS 2003, Oct. 16).
13
Within the realm of security, there are three ways to authenticate that a person is
who that person claims to be: 1) by something one knows (a password, a PIN); 2) by
something one has (a key, an ID card, a token); and 3) by something that one is (a
biometric, such as a fingerprint). As previously mentioned, such items as keys and PINs
can be compromised. However, a biometric represents the most secure and convenient
authentication tool because it cannot be borrowed, stolen, or forgotten (Liu & Silverman,
2001).
Biometrics is defined as a technology that “analyzes and measures unique
physiological or biological characteristics that can be stored and retrieved for positive
identification” (Etzioni 1999, p. 2). A biometric system serves the purpose of either
identification or authentication. For example, identification occurs when a law
enforcement agency has the fingerprints of a suspect. The agency checks that set of
fingerprints against a database of fingerprints in order to ascertain the identity of the
suspect. By comparison, authentication occurs when a person uses an ATM card. A
Personal Identification Number, or PIN, must be entered to verify authenticity before
access is granted.
Before the ability to access authentication systems is granted to a person, that
person’s data must be prerecorded, or “enrolled” into the database. Users “enroll” by
having their biometric information (fingerprint, iris pattern or face) scanned by the
system. Key features are then extracted and converted into unique templates, which are
then encrypted and stored into the database or onto an ID card. When the user attempts to
gain access, the information he or she presents is compared to that pre-stored template
(Anthes, 2002).
14

Simply stated, identification systems answer the question “Who are you?” while
systems used for authentication answer the question “Are you who you claim to be?” The
operational difference between identification and authentication systems lies in the
number of comparisons that the system makes. “For identification, the computer may
have to compare many thousands of fingerprints; authentication requires only one
comparison between the card (template) and the person presenting it” (Colman, 2000,
pg.9). Identification systems, therefore, make “one to many” comparisons (1:N), while
authentication systems have “one to one” comparisons (1:1).
While any human physiological or behavioral trait can be used as a biometric
characteristic, there are, according to Prabhakar et al, 2003, several requirements that
must be met in order for the biometric characteristic to be functional in an access control
system. These requirements are: 1) universality: each person should have the
characteristic; 2) distinctiveness: each person should be different in terms of the
characteristic; 3) permanence: the characteristic should remain constant over a period of
time; 4) collectability: the characteristic should be quantitatively measurable (Prabhakar
et al, 2003).
Biometric identification systems are being examined as one proactive measure
that can be taken to secure employee access control points. The U.S. Congress has even
recognized that biometric technologies “are a sound method of restricting access to
secured airport areas” (TSA 2005, p. 1). However, biometrics technologies used for
access control in airports have been applied slowly (ACI, 2005). Due to the fact that
biometric technology has been promoted as being an affective form of access control, yet
it has been slowly implemented in airport access control systems, the question becomes
15

“what factors influence an airport security directors’ propensity of adopting biometric
technology for airport access control?”
2.4. Chapter Summary
The United States aviation industry is a vital part of America’s critical
infrastructure. As such, a disruption within the aviation system would have an enormous
social and economic impact on the United States. Therefore, any area of airport security
that could be susceptible to criminal acts, including terrorism, should be closely
scrutinized. Airport access control is designed to ensure that only legitimate authorized
employees are able to access secure airport areas. However, studies have shown that
despite post 9/11 standards and regulation lack of strict access control has allowed
unauthorized individuals to successful penetrate secure airport areas.
It is apparent that traditional methods of access control need to be enhanced in
order to mitigate unauthorized access. One such method of enhancement could be the
utilization of biometric technology which measures unique and distinctive individual
characters, however, implementation of biometric technology into airport access control
systems has been slow. The remaining chapters will examine the theoretical foundations
of innovation adoption and will identify factors that could influence the propensity to
adopt an innovation. Further, the results of the survey instrument administered to airport
security directors and managers will aid in the discussion on what factors influence the
propensity of airport security directors to adopt biometric technology for airport access
control.
16
3. THEORETICAL FOUNDATIONS
Although biometric identification systems have been advocated as a technological
innovation that could be beneficial to airport access control, large scale adoption of
biometric technology within the airport community has yet to occur. Several theories
examining the personal and organizational factors that may influence airport security
directors’ propensity for adopting biometric technology for airport access control will be
highlighted below. Additionally, these theories were used to guide the survey creation,
administration, and analysis used in this study.
Airports today are typical of many organizations established throughout the
business realm. As such, airport operations can be analyzed using organizational type
theories. “Many theories have been developed over the past 100 years for the design and
running of organizations” (Burnes 1996, p.11). Theories abound regarding every element
of organizational development and management ranging from strategies, decision
making, cultural change, communication, leadership, and a myriad of other
organizational factors. For the premise of this research, the focus will be on those theories
involving organizational and personal technological acceptance. The reasoning here is to
show that organizational change, especially when discussing the propensity of adopting
new technologies, requires both an organizational, as well as a managerial, investigation.
For airport security, this means that the acceptance of biometric technologies must come
from the both the culture of airport operations and the airport security directors
themselves.
Organizational change first involves the (1) transformation of an organization
between two points in time and (2) the process by which that transformation occurs
17
(Barnett & Carroll, 1995). Organizational change is a response to “major shifts in the
environment and as a result of internal planned efforts to achieve greater profitability,
quality, and effectiveness” (Whelan-Berry et al 2003, p.187). The motivations for this
responsive change can be driven by a host of factors including internal, external, political,
technological, environmental, or a combination of any one of these (Barnett & Carroll,
1995). Another of the primary driving forces for organizational change is the manger of
the organization. As Whelan-Berry et al (2003) states, organizational change involves the
adoption of change initiatives at both the organizational and at the management level.
However, while both the motivations for change and the role of the manager as a
change agent are capable of affecting change in an organization, the resistance to change
on both levels must first be overcome.
Every change agent has experienced resistance…Individuals are said to resist
change because of habit and inertia, fear of the unknown, absence of the skills
they will need after the change, and fear of losing power. Organizations are said
to resist change because of inertia, sunk costs, scare resources, threats to the
power base of the old dominant coalition, values and beliefs, conformity to
norms, and inability to perceive alternatives (Agoes 1997, p. 917-918).
Bovey and Hede (2001) further state that resistance to change is a natural progression
from the known to the unknown and that organizations and individuals differ in their
willingness and in their ability to adapt to change. Organizational change, via new
technologies, can also be considered a catch-22; organizations that persistently ignore
technologies risk a slide into uncompetitiveness, yet being on the leading edge brings its
own perils. Consequently, the process of diffusion rarely occurs in a predictable fashion
18

(Fichman, 1999). The theories listed below address, from a theoretical standpoint, the
perceptions and intent to adopt a new technology from both an organizational as well as
an individual level.
3.1. Total Quality Management
Total Quality Management is a theory directly related to organizational change.
Total Quality Management (TQM), is an overall organizational strategy committed to
improving the satisfaction of the customer or consumer (Dahlgaard et al, 1994; Dean &
Evans, 1994; Gatiss, 1996). According to Gatiss (1996), TQM deals with two distinctive
areas: (1) the organization or the process and (2) the individual person or attitude. Gatiss
further states that individuals and organizations must continuously reassess their roles in
order to improve their business functions. As an organizational process, Dean and Evans
(1994), states that TQM “conveys a total, company wide effort that includes all
employees, suppliers, and customers, and seeks continuously to improve the quality of
products and processes to meet the needs and expectations of customers. TQM has
become the basic business strategy for firms that aspire to meet the needs of the
customers” (p. 12).
The primary researchers in this area, Deming (1982, 1986), Drucker (1974, 1989),
Handy (1976, 1986), and Peters (1988), all suggest that organizational commitment to
change and solution development to business problems are necessary for business
survival (Dahlgaard et al, 1994; Dean & Evans, 1994; Gatiss, 1996). TQM, therefore,
promotes the idea of continued adoptions of new technologies in order to enhance
performance. For airport security, this means that biometric technology adoption would
19
be a useful consideration to enhance not only airport business operations but also safety
considerations of the customers; which for airports are the passengers.
The basis, or driving force behind TQM in an organization is the manager,
someone who will lead the organization in its continuously growing and changing
environment. Management should set the goals, make the plans, and put into practice the
principles of quality for the entire organization (Dean & Evans, 1994). While TQM
suggests a group-oriented rather than a hierarchical-oriented management structure, TQM
nonetheless places importance on the role of the manager regardless of the organizational
structure. The manager should be one who has the leadership ability to make the
necessary changes to ensure quality for the organization and the customers. According to
TQM, the manager must: establish the vision, live the values, and lead the improvements
(Dean & Evans, 1994). According to the theory of TQM, therefore, the airport security
director can be seen as an important motivator behind adopting, guiding, and developing
the use of biometric technologies in an airport setting.
3.2. Diffusion of Innovation Theory
Everett M. Rogers (1995), the most cited scholar in the area of diffusion research,
states that an innovation is an idea or behavior that is new to the individual or
organization adopting it (Swanson 1994, p. 1070; Rogers, 1995). Diffusion, therefore, is
the process by which an innovation is communicated through certain channels over a
period of time among the members of a social system (Rogers, 1995). The “degree to
which an individual is relatively earlier in adopting new ideas than the other members of
his social system” is referred to as innovativeness (Roger 1962, p. 20).
20
Rogers (1995) suggests that diffusion is not one single theory. Rather, it is
actually a number of theories, derived from many disciplines that relate to the overall
concept of diffusion. Sociologists, communication researchers, economists,
organizational researchers, IT researchers, and many others contribute to the multi-
disciplinary history of innovation diffusion research. According to Fichman (1999),
although diversity dominates the area of innovation diffusion research unification is
achieved through three common research questions:
1. What determines the rate, pattern, and extent of diffusion of an innovation
across a population of potential adopters?
2. What determines the general propensity of an organization to adopt and
assimilate innovations over time?
3. What determines the propensity of an organization to adopt and assimilate a
particular innovation? (Fichman 1999, p. 2).
Rogers argues that among the main theories that deal with the diffusion of
innovations are the individual innovativeness theory and the theory of perceived
attributes (Yates, 2001). Both the individual innovativeness theory and the theory of
perceived attributes are concerned with the decision-making process of whether or not to
accept or reject an innovation. Individual innovativeness theory focuses on the
characteristics of the decision-maker, while the theory of perceived attributes focuses on
perceived attributes that the innovation has to the decision-maker (Spence, 1994). Within
this study, the innovation that will be examined is biometric technology, while the
decision-makers will be airport security directors at U.S. airports.
21

Fichman (1999) argues that there are two general styles of research used to
examine the three research questions listed above. These styles, which incorporate
Roger’s individual innovativeness theory and theories of perceived attributes are: adapter
studies and diffusion modeling studies. “Adapter studies are primarily interested in
understanding the differences in adapter ‘innovativeness.’ Diffusion modeling studies are
primarily concerned with the first research question...and represent only a tiny fraction of
innovation research” (Fichman 1999, p. 5).
3.3. Individual Innovativeness Theory
When examining the propensity of adopting an innovation, one thing is certain:
whatever the nature of the innovation not all people will accept it and, of those who do,
not all will adopt it at the same time (Spence, 1994). Diffusion theory, through the
individual innovativeness theory, is concerned with who adopts the innovation and when.
Generally, personal and social factors that may influence an individual to adopt or reject
an innovation are examined. The relevance of individual innovativeness theory to this
study is to determine the percentage of airport security directors that are more likely to
adopt biometric technology. “In any given setting in which innovation-related activities
occur, the personal attributes of participants may be equally or more important than group
or organizational factors” (Tornatzky and Fleisher 1990, p. 35).
Rogers (1995) argues that certain people are predisposed to being innovative, and
that those individuals will adopt an innovation earlier than those who are not innovative.
Rogers places individuals into five “adopter categories” based on their likelihood of
adopting an innovation. The five adopter categories are: 1) innovators; 2) early adopters;
3) early majority; 4) late majority; and 5) laggards. Rogers also highlights some general
22

personal and social characteristics that could influence innovativeness. Table 3.1
summarizes Rogers’ characteristics of adopter categories.
Table 3.1: Characteristics of adopter categories
Adopter Category Values Personal
Characteristics Communication Behavior Innovators "Venturesome"; willing
to accept risks Youngest age; highest social status; wealthy; highest education
Closest contact with scientific information sources; interaction with other innovators; greatest use of impersonal sources; researches innovations
Early adopters "Respect"; regarded by many in the social system as a role-model
High social status; large and specialized operations
Greatest contact with local change agents
Early majority "Deliberate"; willing to consider innovations only after peers have adopted them
Above average social status; average-sized operation
Considerable contact with change agents and early adaptors
Late majority "Skeptical"; over-whelming pressure from peers needed before adoption occurs
Below average social status; small operation; little specialization; small income
Secure ideas from peers who are mainly late majority or early majority; less use of mass media
Laggards "Tradition"; oriented to the past
Little specialization; lowest social status; smallest operations; lowest income; oldest
Neighbors, friends, and relatives with similar values are main information source
(Source: Rogers 1962, p. 185)
Based on adopter categories, it is evident that characteristics of innovators vary from
those of other adopters.
3.4. Theory of Perceived Attributes
While the individual innovativeness theory focuses on the characteristics of the
decision-maker, the theory of perceived attributes, again a focus within diffusion theory,
is based on the idea that individuals will adopt an innovation based on its attributes and
advantages. The theory of perceived attributes is based on the idea that individuals will
adopt an innovation if it has the following attributes. First, the innovation must be
23
perceived as having a relative advantage over the current status quo or existing
innovation. Second, the innovation must be perceived as being compatible with existing
values, practices, and needs. Third, the innovation cannot be too complex. Fourth, the
innovation must have trialability, which means that the innovation can be tested for a
limited time without adoption. Fifth, the innovation must offer observable results
(Rogers, 1995). Generally speaking, the purpose of examining the five innovation
attributes is to determine if the innovation is viewed by the adopting individual or
organization as being able to achieve the purpose for which it was intended (Tornatzky
and Fleisher, 1990).
According to Rogers (1995) the perceived attributes of an innovation are
extremely influential in leading to a decision to adopt a technology, and explains between
49 and 87 percent of the variance in the rate of adoption. These perceived attributes are
important because they constitute the individual’s subjective perceptions or beliefs about
an innovate technology (Vishwanath and Goldhaber, 2003). Additionally, Ostlund
(1974) argues that the more positive the individual’s perceptions about an innovation are,
the greater the probability of its adoption. Hence, the structure of a person’s perceptions
about an innovative technology impacts its acceptance (behavior) and thereby the overall
rate of adoption (Vishwanath and Goldhaber, 2003). The relevance of the theory of
perceived attributes to this study, therefore, is to understand how airport security directors
perceive biometric technology.
Through diffusion theory, with its underlying theories of innovativeness and
perceived attributes, this study will examine, among other things, the attitudes that airport
24

security have toward biometric technology, their general knowledge of biometric
technology, and the perceived relative advantage that airport security directors have
towards biometric technology in an airport environment. The following section will
address the research methodology that was used in this study. By utilizing the survey
instrument developed by Moore and Benbasat (1991), this study will measure the
relationships between issues related to biometric technology and the propensity of airport
security directors to adopt biometric technology for airport access control.
3.5. Chapter Summary
Within the literature there are numerous theories related to why individuals adopt
an innovation. Individual and organizational factors have been examined for their affect
on the propensity to adopt an innovation. Likewise, characteristics of the innovation itself
have also been examined as factors affecting innovation adoption. Rogers (1995) argues
that while individual innovations vary so too do the attributes of the innovation that
individual’s value as important. Due to this variance, not all individuals will have the
same propensity to adopt an innovation. The following chapters will discuss the research
framework for this study and its utilization of Roger’s (1995) theories to examine those
factors that are related to the propensity of airport security directors to adopt biometric
technology for airport access control.
25
4. RESEARCH FRAMEWORK
4.1. Framework
The purpose of this study is to investigate the propensity that security director’s
have in adopting biometric technology for access control purposes. According to
Fichman (1999), well established and generalizable factors affecting diffusion can be
grouped into three categories: 1) those factors pertaining to the technologies and their
diffusion context; 2) those factors pertaining to organizations and their adoption context;
3) those factors pertaining to the combination of technology and organization.
“These three categories map to the three basic research questions identified earlier as
follows. The first category (technologies and their diffusion contexts) have the most
direct impact on the rate and pattern of diffusion of a technology (research question 1).
The second category (organizations and their adoption environments) relate to the
question of what determines the organizational propensity to adopt multiple innovations
over time (research question 2) and to adopt particular innovations (research questions 3).
The final category (factors describing the intersection of organization and innovation)
only pertains to research question 3” (Fichman 1999, p. 8).
Therefore factors that could influence the propensity to adopt an innovation come
from several areas such as an individual’s characteristics, technology characteristics,
organizational characteristics, and environmental characteristics. Based on the literature,
Table 4.1 summarizes potential factors that could influence the adoption of biometric
technology by airport security directors (Rogers, 1995; Tornatzky and Fleischer, 1990;
Akbulut, 2003; Premkumar et. al, 1994; Moore and Benbasat, 1991). Each of these
26

characteristics was utilized in the survey instrument and became variables within the
study. The characteristics and the relevance to this study are operationalized below.
Table 4.1: Potential Factors
Individual Characteristics Technology Characteristics Age Compatibility Education Complexity Knowledge of the innovation Relative advantage Years in the current position Trialability Benefits Cost Risk Ease of use Organizational Characteristics Environmental Characteristics Size External influence
Location External pressure Organizational readiness Environmental instability Top management support Vendor marketing efforts Technical capability Persuasion
4.1.1. Characteristics of Biometric Technology (the innovation)
Characteristics of biometric technology refers to the attributes of biometrics
technology and how these attributes influence propensity to adopt that technology.
Different adopters, in this study airport security directors, can perceive the characteristics
of biometric technology differently, and those perceptions affect the adoption process.
Following the arguments made by Rogers (1995) and Glover (1993) and the framework
set forth by Akbulut (2003), the characteristics of biometric technology that will be used
in this study are: 1) complexity of biometric systems; 2) costs of biometric systems;
3) relative advantage of biometric systems; and 4) compatibility of biometric systems
with the current security goals.
27

Complexity refers to the degree to which airport security directors perceive
biometric technology as relatively difficult to use and understand. Complexity issues
related to biometric technology generally revolve around implementation of biometric
system and the ease of use of that system. Complexity of an innovation is generally
viewed as an inhibitor to adoption and can therefore affect perception of adoption;
complex technologies require more skill and effort and are therefore usually negatively
related to adoption (Premkumar et al., 1994).
Costs refer to the perceived potential costs of adopting biometric technology for
airport access control. Costs can include such things as cost of hardware acquisition, cost
of implementing the system, cost of training, and cost of maintaining the system. Costs
can negatively affect adoption; the higher the cost of a biometric system, the less likely
that it will be adopted (Premkumar et al, 1994).
Relative advantage of biometric technology refers to biometric technology being
perceived as better than using the current method of access control (Moore and Benbasat,
1991). Relative advantage is a significant factor in adopting an innovation and is usually
viewed as positive in relation to adoption (Premkumar et al, 1994). In other words, as the
perceived relative advantage increases so does the likelihood that biometric technology
will be adopted.
Risks refer to the perceived risks of adopting biometric technology for airport
access control (Akbulut, 2003). There are certain risks that must be considered before
adopting biometric technology such as the lack of standardization, the “newness” of the
technology in an airport environment, and perceived privacy issues. Risks are usually
28
viewed as negative in relation to adoption of an innovation; as risks increase the less
likely that biometric technology will be adopted.
Compatibility refers to the degree to which airport security directors perceive
biometric technology as being consistent with existing security policies, values, tasks,
needs, and objectives of airport access control. The ability of an innovation to fit the
needs and objectives of an organization is important to its adoption (Premkumar et al,
1994; Rogers, 1995; Akbulut, 2003). The relationship between perceived compatibility
and adoption is generally viewed as positive; as perceived compatibility of a technology
increases, the likelihood of adoption increases.
Moore and Benbasat (1991) developed an instrument to measure characteristics of
information technology including: relative advantage, compatibility, image, ease of use,
result demonstrability, voluntariness, visibility, and trialability. Their study, which was
utilized for this study and will be discussed in detail later, resulted in a parsimonious
instrument comprising of eight scales which provides a useful tool for the study of the
initial adoption and diffusion of innovations (Moore and Benbasat, 1991).
4.1.2. Characteristics of Airport Security Directors (the adopter)
Characteristics of airport security directors refers to the personal attributes of
individual security directors and how those attributes influence adoption of biometric
technology. Personal attributes of an individual are important to consider; “…if rigid and
timid people are employed in jobs that are key to fostering an innovation process, it will
likely fail” (Tornatzky and Fleischer 1990, p. 35). As Rogers (1995) argues, innovators
are generally younger, more educated, and have a better understanding of the innovation
than those that are likely to reject the innovation. The characteristics of airport security
29
directors that will be examined in this study are: 1) age; 2) education level; 3) years in the
current position; 4) knowledge of biometric technology. With the exception of age, the
characteristics of airport security directors are generally viewed as positive in relation to
biometric adoption. According to Rogers (1995), those that are older are more likely to
reject an innovation. The remaining characteristics are generally viewed as having a
positive relationship to innovation adoption; as these characteristics increase so does the
likelihood of adoption.
According to Rogers (1995) and Tornatzky and Klein (1982), how potential
adopters perceive an innovation is a key determinate of adoption. “When the focus is the
formal organizational decision to adopt, it is the perceptions of leaders and key decision
makers that matter. Most innovations studies have concentrated on this level, and have
studied the generic innovation characteristics from Rogers’ classical model…The bulk of
this work has focused on two constructs originally identified by Davis (1998) as part of
his Technology Acceptance Model (TAM), namely perceived usefulness and perceived
ease of use” (Fichman 1999, p. 18).
Postulated by Davis et al (1989), TAM attempts to provide a basis for examining
the impact of external factors on internal beliefs, attitudes, and intentions to adopt a
technology. The goal of TAM is to predict technology acceptance before users have any
significant experience with a technology. To achieve this goal, TAM focuses on two
theoretical concepts: perceived usefulness and perceived ease of use (Davis, 1989). Davis
(1989) further states that perceived usefulness and perceived ease of use influence the
attitude towards using a technology which directly relates to the perception to adopt
technology (Figure 2). In other words, individuals form intentions to use a technology
30

which they perceive as positive and useful. Davis (1989) developed scales to measure
perceived usefulness and perceived ease of use, and because the scales were validated in
previous research they will be adapted for use in this study to avoid the time and cost
efforts required to develop a new measurement instrument. “In general, perceived
usefulness and perceived ease of use have recurred as highly salient predictors of key
acceptance outcomes in prior empirical examinations of technology acceptance” (Lewis
2003, p. 659).
According to Davis (1989) behavioral intent is one’s intention to perform a
specific behavior. Behavioral intent, according to Davis (1989) and the TAM, is
determined by the person’s attitude toward using a technology and perceived usefulness
of that technology. According to Davis (1989), perceived usefulness is defined as “the
degree to which a person believes that using a particular system or technology would
enhance his or her job performance”. Perceived usefulness is therefore the prospective
user’s subjective probability that using a specific technology will be beneficial to job
performance. A technology high in perceived usefulness, therefore, is “one for which a
Perceived usefulness
Attitude toward technology
Perceived easy of use
Behavioral intent to use
Figure 2: Influence on behavioral intent to use (Source: Davis, 1989)
31

user believes in the existence of a positive use-performance relationship” (Davis, 1989,
pg 320). Perceived usefulness closely parallels the “relative advantage” aspect in the
diffusion of innovation theory. Additionally, Davis (1989) defines perceived ease of use
as “the degree to which a person believes that using a particular system or technology
would be free of effort” (Davis 1989, p. 320). A technology that is perceived to be easier
to use than another is more likely to be accepted by users (Davis, 1989). Perceived ease
of use, therefore, parallels the “complexity” aspect of the diffusion of innovation theory.
As previously stated, Davis (1989) developed and validated scales for the two specific
variables of perceived usefulness and perceived ease of use, which he hypothesized to be
“fundamental determinants of user acceptance” of a technology (Davis 1989, p. 319).
4.1.3. Characteristic of the Airports (the organization)
The characteristics of the airport refer to the internal characteristics of the airport
that could influence the perceptions of adopting biometric technology for access control.
Tornatzky and Fleischer (1990) noted that there are agency factors that are important to
examine when determining the propensity to adopt an innovation. The characteristics of
the airports that will be examined in this study are: 1) size; 2) location; and 3) technical
capability. The size of the airport refers to the number of passengers that an airport
accommodates annually. U.S. airports are categorized based on passenger volume, with
Category X airports being the largest. Research indicates that larger organizations are
more likely to adopt an innovation due to greater need, resources, and technical ability
(Akbulut, 2003). Also, based on the literature review related to terrorist activity, larger
airports could represent a higher priority target to terrorists due to increased passenger
32

and aviation activity. Therefore, the security needs are greater at larger airports and their
associated facilities.
Similar to size, airport location could also influence the adoption of biometric
technology. U.S. airports in an urban setting could see a greater need for biometric
technology for access control than those airports in a rural location. Again, based on
literature review for this analysis, it has been demonstrated that airports in urban areas
have a high probably of becoming a target to terrorists because of their proximity to
higher populated areas and due to higher passenger traffic and aviation activity.
Technical capability refers to the availability of technological resources and
expertise that enable the implementation of biometric systems. Technical infrastructure
and equipment can affect an airport’s ability to implement biometric technology; the
greater the technological infrastructure, the greater the likelihood of adopting biometric
technology. (Akbulut, 2003).
4.1.4. Characteristics of the Environment
Characteristics of the environment refer to those external influences that could be
a factor in the decision to adopt biometric technology for airport access control.
Influences such as governmental guidance and incentives can encourage or discourage
the adoption of biometric technology (Akbulut, 2003). The characteristics of the
environment that will be examined in this study are: 1) T.S.A. guidance and
2) governmental incentives. Each of these characteristics will be examined as being
positively related to the adoption of biometric technology; as they increase, so does the
likelihood of adopting biometric technology for access control.
33

According the Akbulut (2003), governmental influence is a significant factor in
the adoption of an innovation. Grants, assistance, and guidance contribute to the adoption
of an innovation. T.S.A. is the agency responsible for providing guidelines and technical
recommendations and standards for airport access control methods. The perceived
guidance from T.S.A. to airport security directors would have a positive influence on the
adoption of biometric technology; as perceived guidance increases so does the likelihood
of biometric adoption. Similarly, governmental incentives, such as grants, could provide
motivation, as well as financial assistance that could encourage the adoption of biometric
technology (Bingham, 1976).
4.2. Research Questions
Based on the literature review and the theoretical foundations previously
discussed, the research questions for this study are: 1) to what extent is airport security
director propensity to adopt biometric technology for access control influenced by social
demographics, organizational factors, and attitudinal factors; and 2) to what extent is
airport security director propensity to adopt biometric technology for access control
influenced by characteristics of the innovation (biometric technology) and technical
readiness of the airport itself. In order to examine these research questions, the potential
factors that could influence propensity to adopt biometric technology will be organized
into four categories, or constructs that, according to Roger’s (1995), Davis (1989) and
Horan et al. (2004), are highly predictive of propensity to adopt a technology: A) social-
demographics, B) organizational demographics (each airport), C) environmental
influence, and D) attitude towards the technology (Figure 3).
34
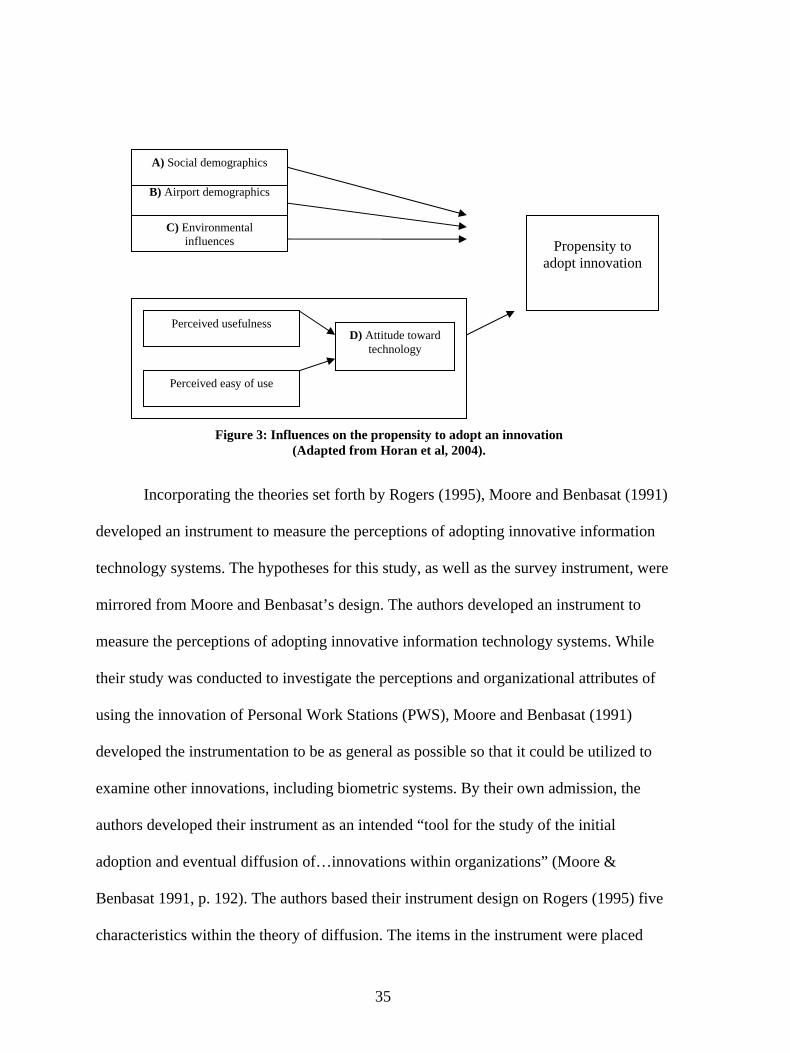
Incorporating the theories set forth by Rogers (1995), Moore and Benbasat (1991)
developed an instrument to measure the perceptions of adopting innovative information
technology systems. The hypotheses for this study, as well as the survey instrument, were
mirrored from Moore and Benbasat’s design. The authors developed an instrument to
measure the perceptions of adopting innovative information technology systems. While
their study was conducted to investigate the perceptions and organizational attributes of
using the innovation of Personal Work Stations (PWS), Moore and Benbasat (1991)
developed the instrumentation to be as general as possible so that it could be utilized to
examine other innovations, including biometric systems. By their own admission, the
authors developed their instrument as an intended “tool for the study of the initial
adoption and eventual diffusion of…innovations within organizations” (Moore &
Benbasat 1991, p. 192). The authors based their instrument design on Rogers (1995) five
characteristics within the theory of diffusion. The items in the instrument were placed
Figure 3: Influences on the propensity to adopt an innovation
(Adapted from Horan et al, 2004).
Perceived usefulness D) Attitude toward
technology
Propensity to
adopt innovation
B) Airport demographics
A) Social demographics
C) Environmental influences
Perceived easy of use
35

through a rigorous round of testing to help validate the instrument and its use as a general
measure for innovation adoption. Additionally, the instrument was tested for inter-rater
reliabilities, and pilot tested in a field study of over 800 respondents in seven companies
from a variety of industries (Moore & Benbasat, 1991). The final survey instrument that
was developed included the following items that were “designed to measure the various
perceptions that an individual many have of adopting a…technology innovation” (Moore
& Benbasat 1999, p.192): relative advantage, compatibility, image, ease of use, and
voluntariness. By the admission of Moore and Benbasat (1991), “while the various items
were developed to be as general as possible, they were worded and tested with respect to
a particular innovation, the Personal Work Station, in a particular context, organizational
work. Nevertheless, it is believed that they could be easily reworded by substituting the
names of different…innovations, though additional checks for validity and reliability
would be prudent after rewording” (Moore and Benbasat 1991, p.211).
In addition to Moore and Benbasat’s (1991) study, Jeyaraj et al (2006) reviewed
48 empirical studies, conducted between 1992 and 2003, on individual adoption and
diffusion of innovation. The researchers found that among the independent variables most
frequently used to predict individual innovation adoption were: ease of use, attitudes,
relative advantage, compatibility, voluntariness, support, age, gender, trialability, system
quality, visibility, and image (Jeyaraj et al, 2006).
Moore and Benbasat (1991) concluded “it is believed that the final instrument,
which was developed based on a model of general factors that have predicted the
adoption of innovations quite successfully, offers a useful tool for the study of the initial
adoption and diffusion of innovations” (p.211). Based on the initial research of Moore
36

and Benbasat (1991), the instrument items for this study were reworded and created to
apply to biometric technology. Therefore, drawing from the literature and utilizing the
instrument constructed by Moore and Benbasat (1991), the instrument for this study was
reworded by inserting “biometric technology” as the innovation. Additionally, the
independent variables list by Moore and Benbasat (1991) and Jeyaraj et al (2006) led to
the construction of the hypothesis for this study. The survey instrument was then
administered to airport security directors in order to measure the relationship between the
independent variables and propensity of adopting biometric technology for access
control.
4.3 Hypothesis
Drawing from literature, as well as the theories postulated by Rogers (1995) and
the survey instrument developed by Moore and Benbasat (1991), the following
hypotheses were constructed for this study.
H1: There is a relationship between social demographics and the propensity
to adopt biometric technology for airport access control.
The social demographics examined in this study were the age, the educational level, and
the number of years the security director has held the current position. Based on the
literature, the expectation for this first hypothesis was that the social demographics of
education level and number of years in the current position positively and strongly related
to the propensity to adopt biometric technology for airport access control. The social
demographics associated with age, however, were expected to be negatively related to the
propensity to adopt biometric technology for airport access control.
37

H2: There is a relationship between organizational demographics and the
propensity to adopt biometric technology for airport access control.
The organizational demographics that were examined in this study were size (category),
location, and technical capability of the airport itself. Similar to the social demographics
of the individual security director, the organizational demographics may also be related to
the propensity to adopt biometric technology for airport access control. The expectation
therefore is that the organizational demographics will be strongly and positively related to
the propensity to adopt biometric technology for airport access control.
H3: There is a relationship between perceived compatibility of biometric
technology with airport security goals and the propensity to adopt biometric
technology for airport access control.
Again, compatibility refers to the degree to which airport security directors perceive
biometric technology as being consistent with existing security policies, values, tasks,
needs, and objectives of airport access control. The expectation for the third hypothesis
was that the compatibility of biometric technology would be strongly and positively
related the propensity of airport security directors to adopt biometric technology for
airport access control.
H4: There is a relationship between the perceived voluntariness of using
biometric technology for airport access control and the propensity to adopt
biometric technology for airport access control.
Voluntariness is defined as the “degree to which use of the innovation is perceived as
being voluntary, or of free will” (Moore & Benbast 1991 p, 195). Those individuals who
feel pressured to adopt an innovation could influence the propensity to adopt that
38
technology. While the authority to adopt biometric technology for airport access control
lies with the airport itself, those who feel an expectation from regulatory agencies such as
TSA may have a greater propensity to adopt biometric technology for access control
purposes. For the fourth hypothesis in the study, the expectation therefore is that the
voluntariness will be strongly and positively related to the propensity to adopt biometric
technology for airport access control.
H5: There is a relationship between perceived relative advantage of
biometric technology for airport access control and the propensity to adopt
biometric technology for airport access control.
For this study, relative advantage of biometric technology refers to biometric technology
being perceived as better than using the current method of access control (Moore and
Benbasat, 1991). The expectation therefore is that relative advantage will be positively
and strongly related to the propensity to adopt biometric technology for airport access
control.
H6: There is a relationship between the perceived ease of use of biometric
technology and the propensity to adopt biometric technology for airport
access control.
According to Moore and Benbasat (1991) and Rogers (1995), perceived ease of use is the
degree to which an individual believes that using a particular innovation will be free from
physical and mental effort. For example, if airport security directors perceive that
biometric technology is easy to use and to implement they may be more likely to adopt
the technology for airport access control. The expectation for this hypothesis, therefore, is
39
that there will be a strong and positive relationship between the perceived ease of use and
the propensity to adopt biometric technology for airport access control.
H7: There is a relationship between the perceived image of using biometric
technology for airport access control and the propensity to adopt biometric
technology for airport access control.
Moore and Benbasat (1991) and Rogers (1995) indicate that an important motivation to
adopt an innovation is image, which is the degree to which the use of an innovation is
perceived to enhance one’s status in a social structure. The propensity to adopt biometric
technology therefore may be increased if it is believed that adoption would increase the
image of security. It is expected therefore that the relationship between perceived image
and the propensity to adopt biometric technology for airport access control will be strong
and positive.
For this study, survey items, based on Moore and Benbasat’s (1991) instrument,
were constructed to examine the relationship between the independent variables and the
propensity of airport security directors to adopt biometric technology for airport access
control. The subsequent chapters will address the study’s methodology, survey
administration, data analysis, and a discussion of the findings.
40

5. RESEARCH METHODOLOGY
This chapter contains a detailed description of the survey instrument, its
distribution, the data collection method, and the method of analysis. This study was a
national survey assessing attitudes toward, and the propensity of airport security directors
and security managers to adopt, biometric technology for airport access control. The
study was conducted between March 6, 2006 and August 30, 2006. The survey also
examined overall familiarity that airport security directors have about biometric
technology, as well as issues affecting adoption of biometric technology for airport
access control.
5.1. Research justification
Airports have the right “to determine which biometric technology is appropriate
for deployment in their staff access control system and infrastructure” (ACI, 2005, 12).
The primary goal for any airport to implement biometric technology for airport access
control is to insure that “only bona fide personnel have access to sensitive areas of their
airport” (ACI, 2005, 5). However, to date, there is a paucity of research detailing the
current use or the future projected adoption of biometric technology for airport access
control. Additionally, research detailing the attitudes that security directors and managers
hold toward biometric technology for access control is also limited.
The importance of this study is in its timeliness. Also, there is a critical need in
the aviation industry for research of this kind due to the threat of terrorism in general and
airport security specifically. Further, the dissemination of the survey on a national scale
casts a wide net and this allows the responses to be generalized, which makes its
contribution to the literature much richer. Additionally, this study can be used to guide
41

future studies on both diffusion of innovation theory, as well as, the propensity to adopt
biometric technology in an airport environment.
5.2. Research Methodology
Survey research can be described as the systematic gathering of information from
respondents in order to understand and/or project some aspect of the behavior of the
population of interest (Tull, 1986; Akbultut, 2003). It is a detailed approach that involves
the collection and organization of data and a statistical analysis of the results (Tull, 1986;
Akbultut, 2003). According to Shama (1983), survey research is one of the most effective
techniques available for the study of attributes, values, beliefs, and motives. A survey
was used for this study because it is an easy instrument to administer on a large scale; it
allows for an efficient description of a large population, and it facilitates a systematic
collection of information from that population.
5.3. Sampling frame
The universe for this study consisted of airports across the United States; a total of
380 airports comprised the sample population. Aiports Council International – North
America is an organization that “represents local, regional, state, and national governing
bodies that own and operate commercial airports in the United States and Canada. ACI-
NA member airports enplane virtually all of the domestic and international airline
passenger and cargo traffic in North America” (ACI –NA 2006, p.1). Because of its
association with airports, the researcher contacted ACI in an attempt to add legitimacy to
the study. According to Garson (2005), having legitimate sponsorship for a survey,
especially sponsors who are highly regarded in the population being surveyed, is one
42

method of increasing the response rate of the survey. ACI-NA was instrumental in
providing support for this survey and for providing names of airport security directors
and managers, along with a mailing list (including email addresses), for 100 U.S. airports.
The researcher was able to locate the addresses of an additional 280 U.S. airports for a
total of 380 that were contacted and invited to respond to the survey.
5.4. Unit of analysis and respondents
The unit of analysis – or the unit about which statements are being made – for this
study was individual airports. The survey was distributed to airport security directors or
airport security managers of those airports. The job title of those who make decisions
about their airports access control systems varies between airports. Therefore both the
term “security director” and “security manager” was used in this study to denote those in
the airport who are responsible for making decisions about their airport’s access control
system and method. The security director or manager of each of the airports contacted
were asked to complete the survey and not delegate it to a member of their staff.
According to Sindler (1974), individuals in an organization who are the most
knowledgeable about that organization can answer questions about generalized patterns
of behavior within the organization. Airport security directors or managers represent key
decision makers about airport security and are the most knowledgeable individuals about
their airport’s security. Therefore, they were identified as the most appropriate
respondents for this study.
43
5.5. Survey construction and administration
Collecting the data for this study consisted of creating the survey instrument,
surveying airport security directors and managers, and analyzing the responses. The first
phase involved creating the survey instrument. The survey was based on Moore and
Benbasat’s (1991) study described in the previous chapter. While the principle
investigator contacted subject matter experts to review the instrument for clarity, no
further pre-testing of the instrument was deemed appropriate since the total number of
airports designated for contact was relatively small.
The 12 page survey contained 27 questions. Several of the questions had multiple
items embedded; in total there were 67 comprising the survey. All of the responses, save
two, were categorical and required Likert scale responses. Two of the questions were
open ended and allowed the respondent to utilize free writing in order to respond. The
items comprising the survey were primarily derived from previously tested survey
instruments. Therefore most of the constructs for this study were operationalized by
modifying these previously validated scales.
The instrument design was self-reporting and confidential. With the utilization of
the instrument items created by Moore and Benbasat (1991) and Horan et al (2004), the
time and cost efforts required to develop a new measurement instrument was avoided and
reliability and validity of the instrument was accepted. Before survey administration was
conducted, the researcher secured the approval of the University of Central Florida’s
Institutional Review Board (IRB). The researcher was able to secure an expedited review
of the survey instrument due to the fact that it was confidential, and it posed minimal
risks to the human subjects among whom the survey was administered. Additionally, the
44
researcher was able to demonstrate to the IRB that data from the survey responses would
be secured solely by the researcher, and at no time would any individual airport be
identified in this study.
The survey was administered using a bimodal design, which included a traditional
hardcopy mailing that also allowed for a web-based option response. A “survey packet”
was mailed to all possible respondents. The survey packet included a cover letter, a copy
of the survey, and a return envelope. Additionally, along with the survey, an explanation
of the purpose of the study, a statement of voluntary cooperation, an assurance of
confidentiality, instructions for completion of the paper-based survey, and instructions for
completion of the web-based survey option were included. The respondents were
instructed to answer the survey questions by using either the web-based method or the
paper-based method. The utilization of both types of survey administration, according to
Dillman (2002), increases the likelihood of responses by giving respondents two opinions
for participation. There were also several advantages to including web-designed surveys.
According to Dillman (2002), web-based surveys have advantages for the respondent as
well as the researcher. Dillman (2002) states that response rates for well constructed web-
based surveys are comparable to those of traditional mailing surveys. Further, web-based
surveys are more accessible, are easier to fill out, and are less time consuming for the
respondent. The researcher can benefit from faster response rates and easier data
collection and analysis due to automatic coding (Dillman, 2002). Another method of
increasing response rates, according to Dillman (2002) is to send thank you/follow-up
letters. One week after the initial mailings of the survey packet, a thank you and reminder
letter was sent to the participants. The purpose of the follow-up mailing was to thank
45
those who already had completed the survey and to remind those who had not completed
the survey to please do so.
As previously mentioned, the respondents had two methods of responding to the
survey. The survey responses could have been returned via the web-based option or the
traditional mailing option. The web-page option used to host the web-based survey was
independently designed using the database program of “Form Manager 2.” The survey
that was hosted on the web-site was identical to the hard-copy survey that each
participant received. The responses that were obtained via the web-based survey were
automatically and directly entered into an internal data-base. The responses that were
received via the paper-based survey were manually entered into the same database.
Once the data from the respondents had been entered (either manually by the
researcher or directly via the web) that data was analyzed using statistical tests.
Descriptive statistics in the form of frequency tables were initially used so that overall
generalizations could be made about the respondents and about the airports. Secondly,
correlations were calculated to determine the relationships between 7 independent
variables and the propensity to adopt biometric technology for airport access control (the
dependant variable). The following chapters will summarize the statistical analysis of the
data, the findings and the relevance of the findings to the literature.
46

6. DATA ANALYSIS
While results of the data analysis in the following chapters will be
cumulative and total in nature, the data that will be presented is actually a conglomeration
of data from two different survey administrations conducted by the researcher. The initial
administration of the surveys was directed towards the larger Category X and Category I
airports in the U.S. because those airports are larger in size, they employee more
individuals, and they have the highest number of passengers annually. Due to a lower
than expected response rate in the initial survey administration, it was decided that
additional, smaller airports should be included in this study to 1) provide a higher
response rate for this study, and 2) to allow for a comparison of those larger airports that
responded in the first administration of the survey to those smaller airports that were
surveyed in the second round. Both administrations of the survey to airport security
directors were identical. The “survey packet” was mailed to all possible respondents in
each group, and the respondents were instructed to answer the survey questions by using
either the web-based method or the paper-based method. Additionally, one week after the
initial mailings of the survey packet, a thank you and reminder letter was sent to the
participants
The survey was first administered to 150 U.S. airport security directors at
primarily Category X and Category I airports. The initial administration yielded a
response rate of 43%, as 65 of the surveyed 150 airport security directors responded. Due
to the fact that three of the surveyed airport security directors contacted the researcher to
state that they would not participate in the study because they felt it would compromise
security information, it is believed that one reason for the lower that expected response
47

rate was a result of airport security directors feeling uncomfortable with answering the
survey items. The lower that expected response rate from the initial administration led the
researcher to conduct a second administration of the surveys to another segment of the
airport population. Those airports that are smaller in size and annual passenger
movement, namely Category II, III, IV, and general aviation airports were surveyed in
the second administration to increase response rate and to allow the researcher to include,
within the results, a compare and contrast analysis to the larger airports surveyed in the
initial administration. In the second survey administration, 230 airports were surveyed
and 66 responded; a response rate of 29%.
Although two separate survey administrations were conducted by the researcher,
the data from both was combined and analyzed concurrently. The total quantitative data
collected via the survey administrations was analyzed by performing the following
statistical tests: 1) descriptive statistics were calculated to describe the characteristics of
the responding airport security directors and managers and the airports that they
represent; 2) bivariate analyses were used to test for the relationships between the
independent variables and the propensity to adopt biometric technology for airport access
control; and 3) a path analysis was utilized to examine the strength and magnitude of the
relationships that were revealed through the bivariate analyses.
6.1. Frequencies
After the data was collected via the surveys, the first statistical tests that were
performed were descriptive in nature. A descriptive analysis of the data provided an
interesting profile of the respondents and their knowledge about and propensity to use
biometric technology for airport access control. Additionally, the frequencies derived
48
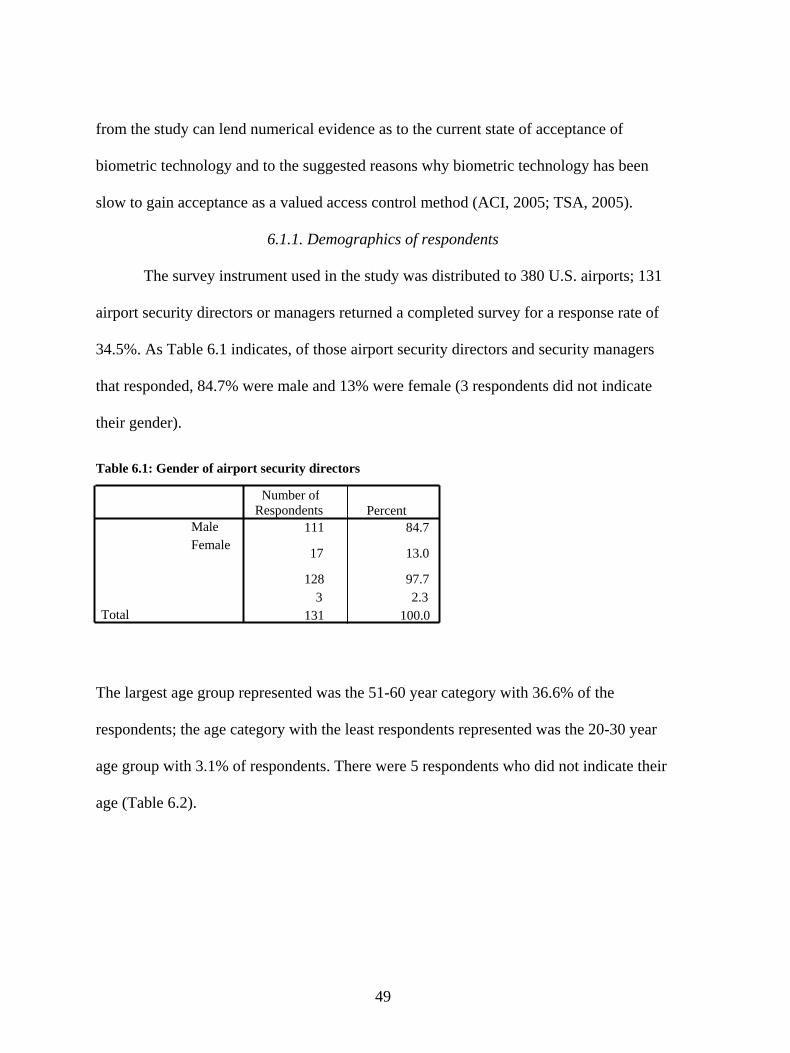
from the study can lend numerical evidence as to the current state of acceptance of
biometric technology and to the suggested reasons why biometric technology has been
slow to gain acceptance as a valued access control method (ACI, 2005; TSA, 2005).
6.1.1. Demographics of respondents
The survey instrument used in the study was distributed to 380 U.S. airports; 131
airport security directors or managers returned a completed survey for a response rate of
34.5%. As Table 6.1 indicates, of those airport security directors and security managers
that responded, 84.7% were male and 13% were female (3 respondents did not indicate
their gender).
Table 6.1: Gender of airport security directors
The largest age group represented was the 51-60 year category with 36.6% of the
respondents; the age category with the least respondents represented was the 20-30 year
age group with 3.1% of respondents. There were 5 respondents who did not indicate their
age (Table 6.2).
3Total
Not indicated
111 84.7
Number ofRespondents
Male Female 17 13.0
128 97.72.3
Total 131 100.0
Percent
49
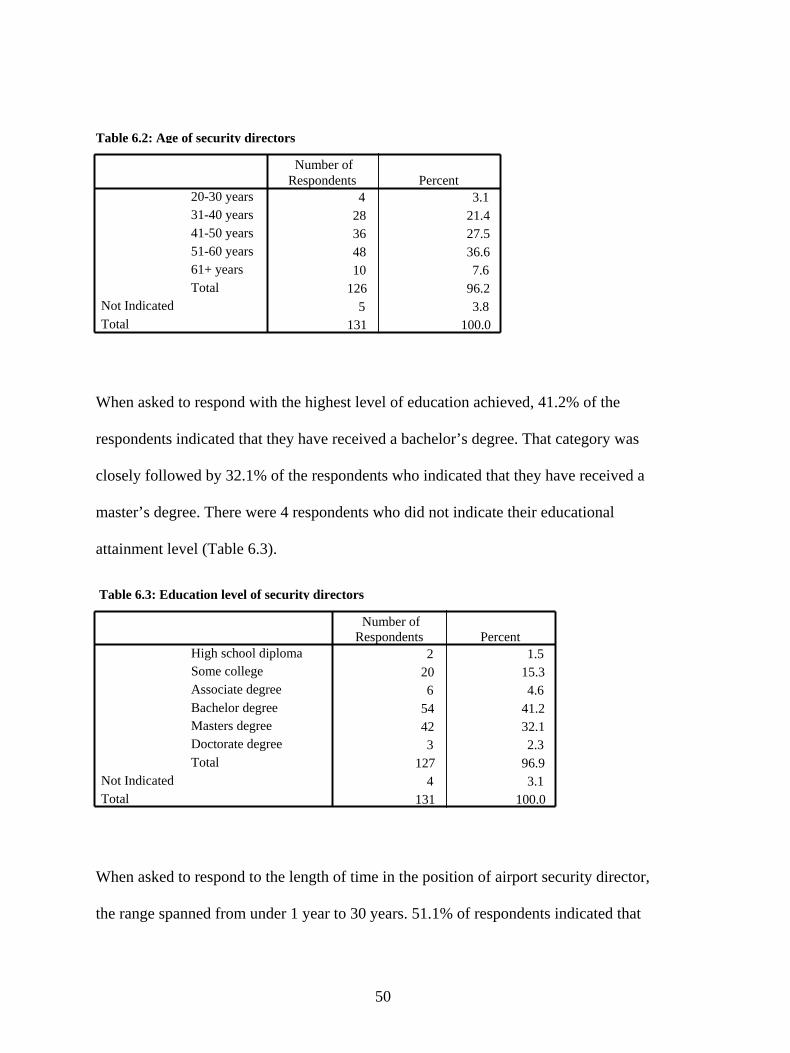
Table 6.2: Age of security directors
When asked to respond with the highest level of education achieved, 41.2% of the
respondents indicated that they have received a bachelor’s degree. That category was
closely followed by 32.1% of the respondents who indicated that they have received a
master’s degree. There were 4 respondents who did not indicate their educational
attainment level (Table 6.3).
When asked to respond to the length of time in the position of airport security director,
the range spanned from under 1 year to 30 years. 51.1% of respondents indicated that
4 3.128 21.436 27.548 36.610 7.6
126 96.25 3.8
131 100.0
20-30 years31-40 years41-50 years51-60 years61+ yearsTotal
Number of PercentRespondents
Not Indicated Total
Table 6.3: Education level of security directors
2 1.520 15.36 4.6
54 41.242 32.13 2.3
127 96.94 3.1
131 100.0
High school diploma Some college Associate degree Bachelor degree Masters degree Doctorate degree Total
Number ofRespondents
Not IndicatedTotal
Percent
50

they have been the security director of their airports for 5 or fewer years. This is an
interesting frequency to note because it indicates that over half of the responding security
directors gained their position after the events of September 11, 2001. 22.1% of
respondents indicated that they have held the position between 6 to 10 years, 11.5% had
held the position between 11 and 15 years, while 13% of respondents had held the
position for over 15 years. Three of the respondents did not indicate the length of time in
their current position as airport security director (Table 6.4).
Table 6.4: Number of years as security director
6.1.2. Demographics of airports
Besides focusing on personal demographic questions, the survey for this study
also focused on the airports at which the airport security directors work. Airports in the
Unites States are classified into a specific “category”. According to the GAO, Category X
airports “represent the nation’s largest and busiest airports as measured by the volume of
passenger traffic and are potentially attractive targets for criminal and terrorist activity.
Category I airports are somewhat smaller with an annual volume of at least 2 million
passengers. There are also other categories of airports with less passenger traffic” (GAO,
1988). The remaining airport categories are Category II, III, and IV and they are ranked
67 51.129 22.115 11.517 13.0
128 97.73 2.3
131 100.0
0-5 years6 -10 years11-15 years16 + yearsTotal
Number ofRespondents
Not Indicated Total
Percent
51

based on size and number of passengers per year. Of the security directors who
responded, 14.5% represented Category X airports; 21.4% represented Category I
airports; 22.1% represented Category II airports; 20.6% represented Category III airports;
16% represented Category IV airports (Table 6.5).
Table 6.5: Airport classification
As described in the literature review, airports can fall under different jurisdictions of
authority. When asked as part of this study, 38.9% of respondents indicated that their
airport operates under the jurisdiction of an airport authority; 37.4% indicated that they
operate under city authority; 13% stated they fall under county authority; 6.1% indicated
that they come under state authority; while 4.6% indicated that their airports fall under
some other authority (Table 6.6).
28 21.429 22.127 20.621 16.019 14.51 .8
125 95.46 4.6
131 100.0
Category ICategory IICategory IIICategory IV Category XOther Total
Number ofRespondents
Not IndicatedTotal
Percent
52
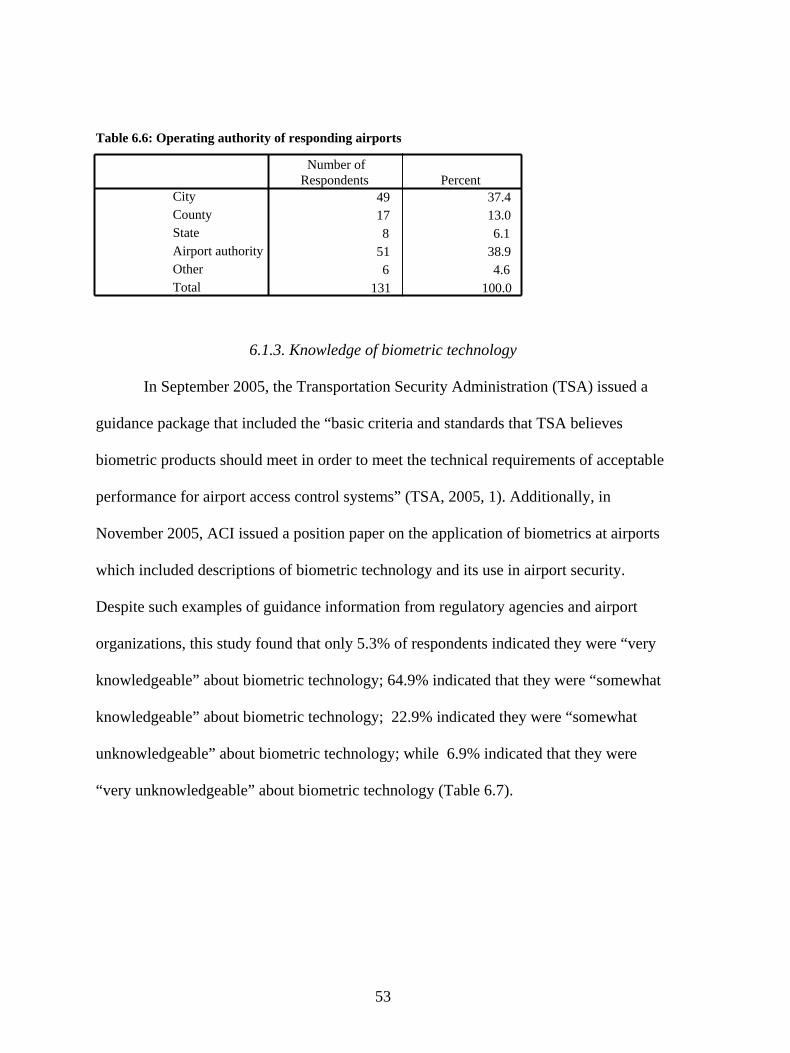
Table 6.6: Operating authority of responding airports
6.1.3. Knowledge of biometric technology
In September 2005, the Transportation Security Administration (TSA) issued a
guidance package that included the “basic criteria and standards that TSA believes
biometric products should meet in order to meet the technical requirements of acceptable
performance for airport access control systems” (TSA, 2005, 1). Additionally, in
November 2005, ACI issued a position paper on the application of biometrics at airports
which included descriptions of biometric technology and its use in airport security.
Despite such examples of guidance information from regulatory agencies and airport
organizations, this study found that only 5.3% of respondents indicated they were “very
knowledgeable” about biometric technology; 64.9% indicated that they were “somewhat
knowledgeable” about biometric technology; 22.9% indicated they were “somewhat
unknowledgeable” about biometric technology; while 6.9% indicated that they were
“very unknowledgeable” about biometric technology (Table 6.7).
49 37.417 13.08 6.1
51 38.96 4.6
131 100.0
City CountyState Airport authority OtherTotal
Number of Respondents Percent
53
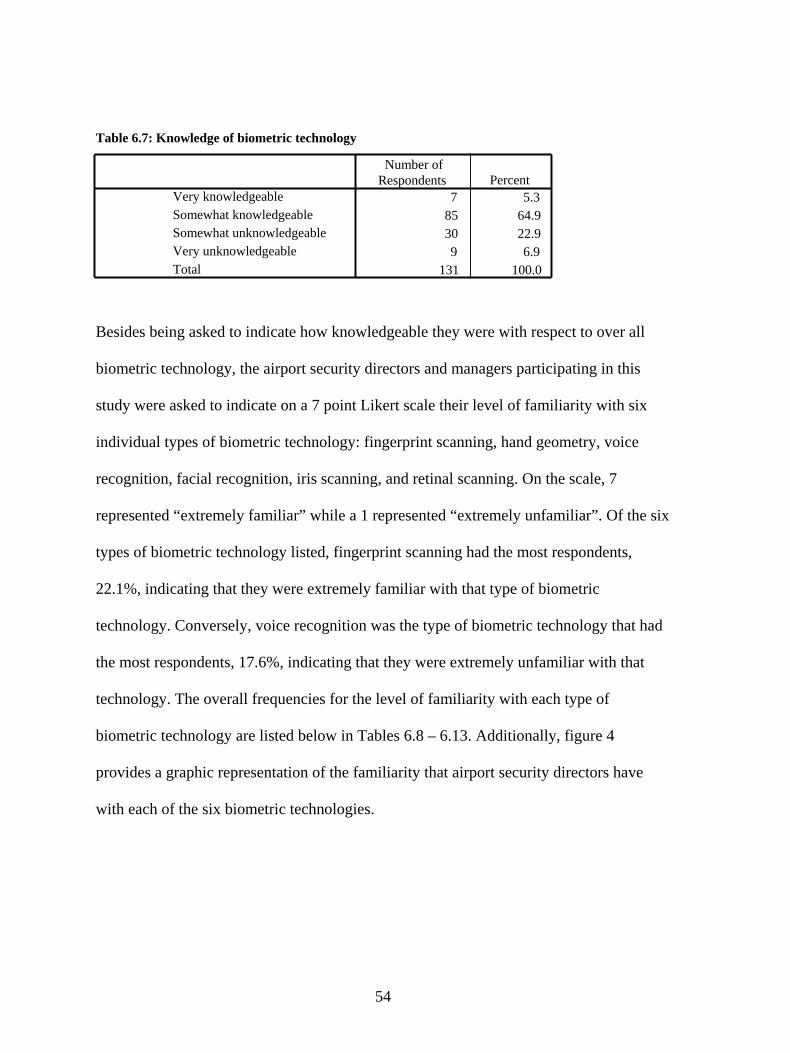
Table 6.7: Knowledge of biometric technology
Besides being asked to indicate how knowledgeable they were with respect to over all
biometric technology, the airport security directors and managers participating in this
study were asked to indicate on a 7 point Likert scale their level of familiarity with six
individual types of biometric technology: fingerprint scanning, hand geometry, voice
recognition, facial recognition, iris scanning, and retinal scanning. On the scale, 7
represented “extremely familiar” while a 1 represented “extremely unfamiliar”. Of the six
types of biometric technology listed, fingerprint scanning had the most respondents,
22.1%, indicating that they were extremely familiar with that type of biometric
technology. Conversely, voice recognition was the type of biometric technology that had
the most respondents, 17.6%, indicating that they were extremely unfamiliar with that
technology. The overall frequencies for the level of familiarity with each type of
biometric technology are listed below in Tables 6.8 – 6.13. Additionally, figure 4
provides a graphic representation of the familiarity that airport security directors have
with each of the six biometric technologies.
7 5.385 64.930 22.99 6.9
131 100.0
Very knowledgeableSomewhat knowledgeableSomewhat unknowledgeableVery unknowledgeableTotal
Number of Respondents Percent
54
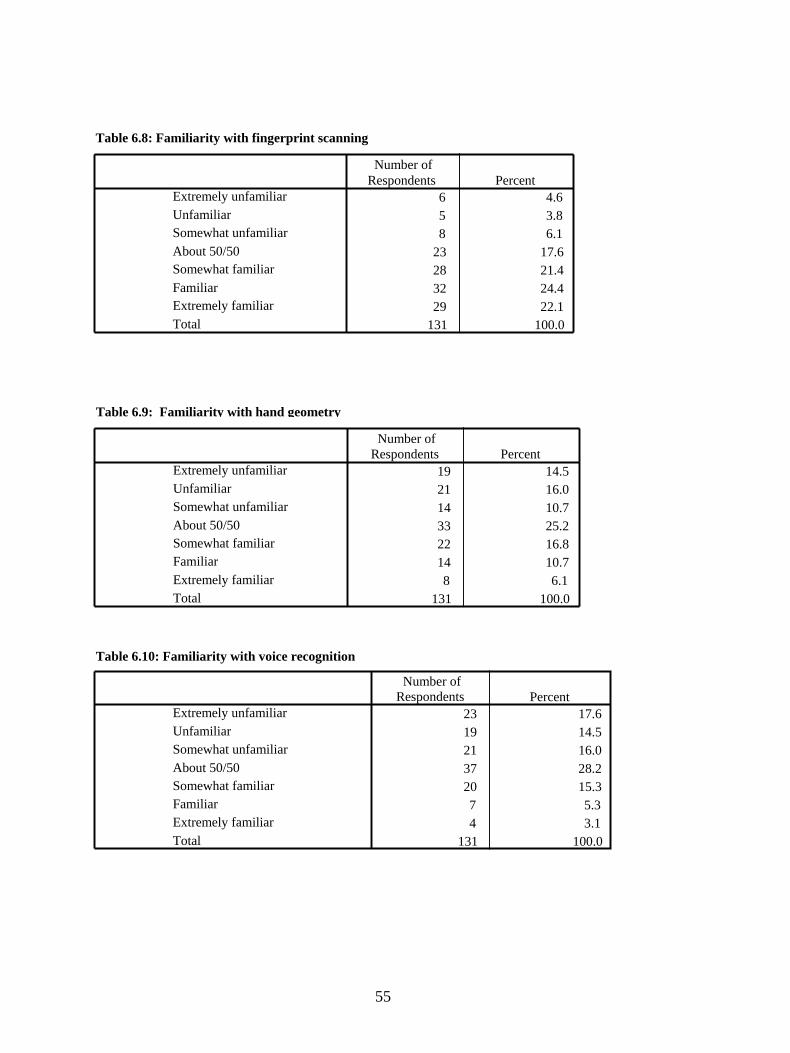
Table 6.8: Familiarity with fingerprint scanning
Table 6.10: Familiarity with voice recognition
23 17.619 14.521 16.037 28.220 15.37 5.34 3.1
131 100.0
Extremely unfamiliar Unfamiliar Somewhat unfamiliar About 50/50Somewhat familiar Familiar Extremely familiar Total
Number ofRespondents Percent
6 4.6 5 3.8 8 6.1
23 17.628 21.432 24.429 22.1
131 100.0
Extremely unfamiliar Unfamiliar Somewhat unfamiliar About 50/50Somewhat familiar Familiar Extremely familiar Total
Number of PercentRespondents
Table 6.9: Familiarity with hand geometry
19 14.521 16.014 10.733 25.222 16.814 10.78 6.1
131 100.0
Extremely unfamiliar Unfamiliar Somewhat unfamiliar About 50/50Somewhat familiar Familiar Extremely familiar Total
Number of Respondents Percent
55
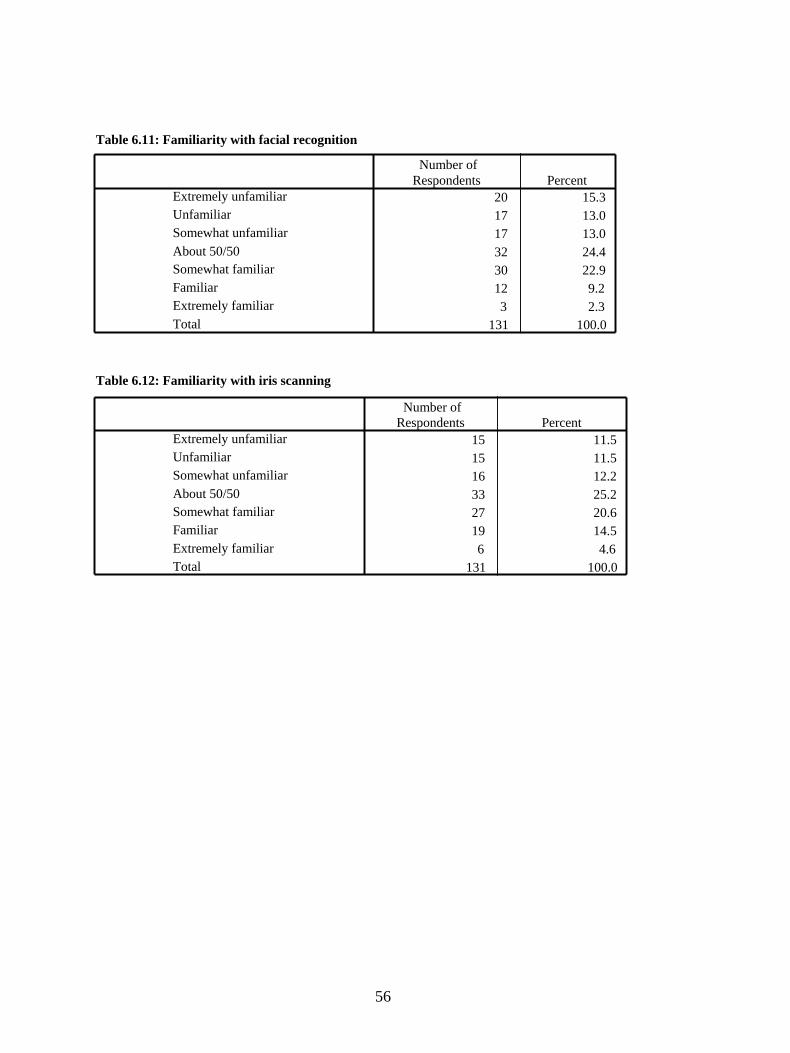
Table 6.11: Familiarity with facial recognition
20 15.317 13.017 13.032 24.430 22.912 9.23 2.3
131 100.0
Extremely unfamiliar Unfamiliar Somewhat unfamiliar About 50/50Somewhat familiar Familiar Extremely familiar Total
Number of PercentRespondents
Table 6.12: Familiarity with iris scanning
15 11.515 11.516 12.233 25.227 20.619 14.56 4.6
131 100.0
Extremely unfamiliar Unfamiliar Somewhat unfamiliar About 50/50Somewhat familiar Familiar Extremely familiar Total
Number ofRespondents Percent
56
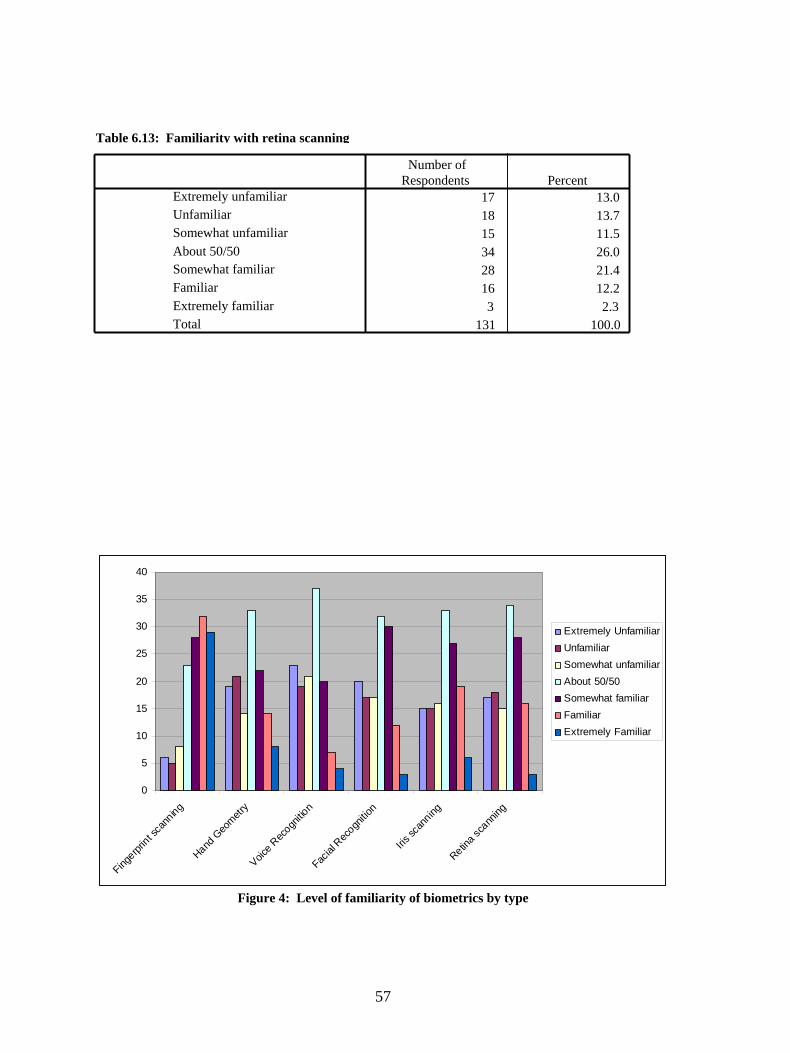
Table 6.13: Familiarity with retina scanning
0
5
10
15
20
25
30
35
40
Fingerpr
int sca
nning
Hand G
eometr
y
Voice R
ecogn
ition
Facial
Rec
ognitio
n
Iris sc
anning
Retina sc
anning
Extremely UnfamiliarUnfamiliarSomewhat unfamiliarAbout 50/50Somewhat familiarFamiliarExtremely Familiar
Figure 4: Level of familiarity of biometrics by type
17 13.018 13.715 11.534 26.028 21.416 12.23 2.3
131 100.0
Extremely unfamiliar Unfamiliar Somewhat unfamiliar About 50/50Somewhat familiar Familiar Extremely familiar Total
Number of Respondents Percent
57
After examining how familiar airport security directors were with each of the six
biometric technologies listed, the researcher wanted to gauge the overall level of
familiarity with biometrics in general. In order to develop an overall generalization about
the level of familiarity that airport security directors have about biometric technology, the
responses that each respondent gave on the six individual, 7 point scales for each
biometric type were added and a new variable titled “level of familiarity” was computed.
A score of 6 was the minimum score and indicated extreme unfamiliarity with biometric
technology, while a score of 42 was the maximum score possible and indicated extreme
familiarity with biometric technology. A score of 24 represented the midrange of “about
50/50” for overall familiarity with biometric technology. Figure 5 displays a graphic
representation of the overall familiarity the airport security directors have with biometric
technology. The level of familiarity score with the highest number of respondents, 13, fell
exactly at the midrange of 24.
58

Level of familiarity with biometrics
42.0040.00
37.0036.00
35.0034.00
33.0032.00
31.0030.00
29.0028.00
27.0026.00
25.0024.00
23.0022.00
21.0020.00
19.0018.00
17.0016.00
15.0013.00
12.0011.00
10.009.00
7.006.00
Num
ber o
f sec
urity
dire
ctor
s14
12
10
8
6
4
2
0
Figure 5: Overall level of familiarity of biometrics
When the participants were asked to indicate how important their overall
understanding of biometric technology is when considering biometric technology for
airport access control, 16.8% of respondents indicated that it is “highly important”;
66.9% ranked it at or above the 50/50 level. Only 15.3% of respondents indicated that the
importance of their knowledge of biometric technology is below the “about 50/50” level
(Table 6.14).
59

Table 6.14: Overall understanding biometric technology
After examining the level importance that airport security directors’ place on their overall
understanding of biometric technology, a cross-tabulation was developed to determine
which category of airport placed the highest level of importance on the issue of overall
understanding. It was determined that Category I airports had the highest number of
respondents that placed some level of importance on their overall understanding of
biometric technology (Table 6.15).
Table 6.15: Overall understanding of biometric technology by airport classification
1 1 11 1 4 1 2
2 3 3 3 8 4 8 6
13 5 5 1 37 6 5 6 43 7 6 1 3
28 29 27 21 19
Highly unimportant Unimportant Somewhat unimportantAbout 50/50Somewhat importantImportantHighly important
Overallunderstandingof biometric technology
Total
CategoryI
Category II
CategoryIII
CategoryIV
CategoryX
Airport classification by Category
3 2.3 9 6.9 8 6.1
31 23.729 22.129 22.122 16.8
131 100.0
Highly unimportantUnimportant Somewhat unimportantAbout 50/50Somewhat important ImportantHighly important Total
Number of Respondents Percent
60
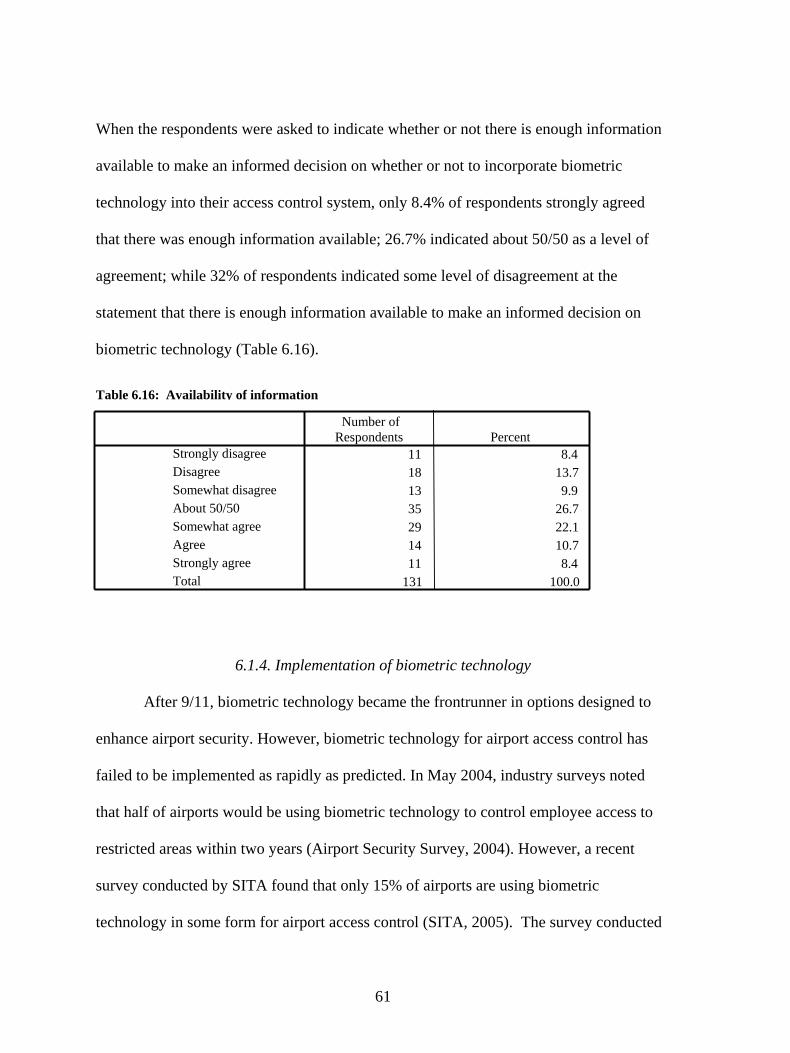
When the respondents were asked to indicate whether or not there is enough information
available to make an informed decision on whether or not to incorporate biometric
technology into their access control system, only 8.4% of respondents strongly agreed
that there was enough information available; 26.7% indicated about 50/50 as a level of
agreement; while 32% of respondents indicated some level of disagreement at the
statement that there is enough information available to make an informed decision on
biometric technology (Table 6.16).
Table 6.16: Availability of information
6.1.4. Implementation of biometric technology
After 9/11, biometric technology became the frontrunner in options designed to
enhance airport security. However, biometric technology for airport access control has
failed to be implemented as rapidly as predicted. In May 2004, industry surveys noted
that half of airports would be using biometric technology to control employee access to
restricted areas within two years (Airport Security Survey, 2004). However, a recent
survey conducted by SITA found that only 15% of airports are using biometric
technology in some form for airport access control (SITA, 2005). The survey conducted
11 8.4 18 13.713 9.9 35 26.729 22.114 10.711 8.4
131 100.0
Strongly disagree DisagreeSomewhat disagreeAbout 50/50Somewhat agree AgreeStrongly agreeTotal
Number of Respondents Percent
61
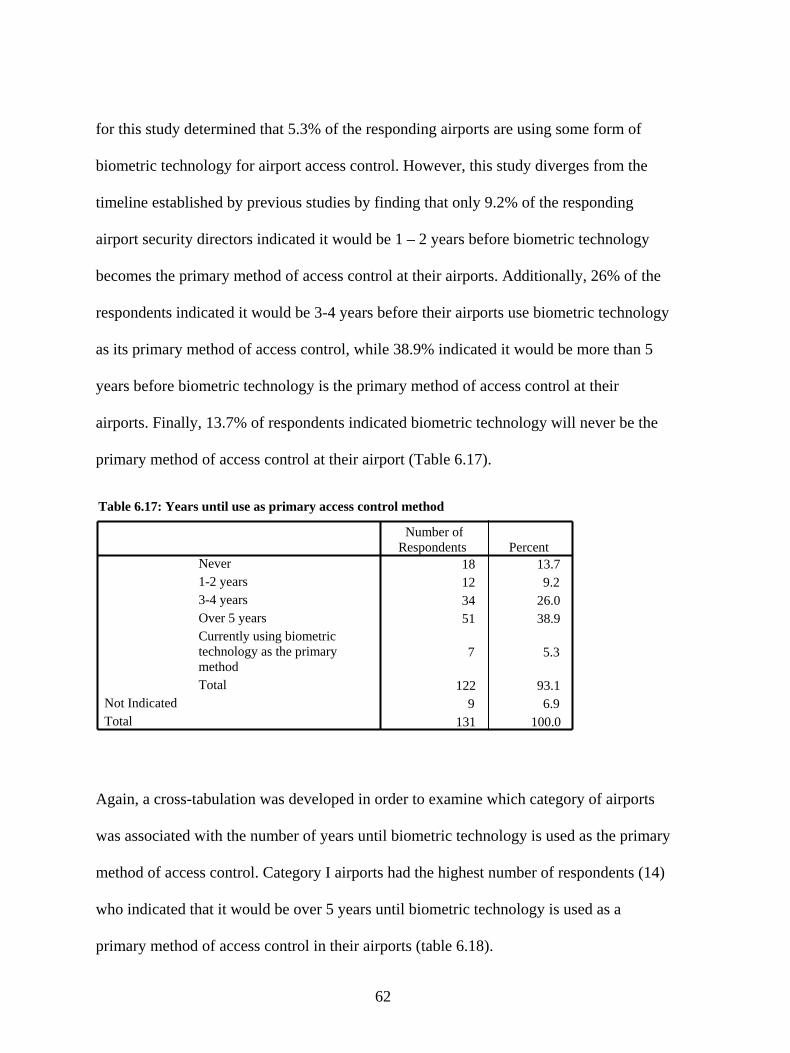
for this study determined that 5.3% of the responding airports are using some form of
biometric technology for airport access control. However, this study diverges from the
timeline established by previous studies by finding that only 9.2% of the responding
airport security directors indicated it would be 1 – 2 years before biometric technology
becomes the primary method of access control at their airports. Additionally, 26% of the
respondents indicated it would be 3-4 years before their airports use biometric technology
as its primary method of access control, while 38.9% indicated it would be more than 5
years before biometric technology is the primary method of access control at their
airports. Finally, 13.7% of respondents indicated biometric technology will never be the
primary method of access control at their airport (Table 6.17).
Table 6.17: Years until use as primary access control method
Again, a cross-tabulation was developed in order to examine which category of airports
was associated with the number of years until biometric technology is used as the primary
method of access control. Category I airports had the highest number of respondents (14)
who indicated that it would be over 5 years until biometric technology is used as a
primary method of access control in their airports (table 6.18).
18 13.712 9.234 26.051 38.9
7 5.3
122 93.19 6.9
131 100.0
Never1-2 years3-4 yearsOver 5 yearsCurrently using biometrictechnology as the primarymethodTotal
Number ofRespondents
Not IndicatedTotal
Percent
62

Table: 6.18: Years until biometrics are a primary access control method by airport category
ACI noted that the integration of biometric technology for airport access control
has been slow for several reasons. The first is the “over promise” and the “under
delivery” by biometric vendors who maximize the benefits, but who may also underscore
the weaknesses of biometric technology. As noted earlier, only 8.4% of respondents in
this study strongly agreed that they had enough information available to make an
informed decision on whether or not to incorporate biometric technology into their access
control system. Secondly, ACI noted that the fast pace at which biometric capabilities are
progressing introduces an element of risk to any selection of biometric technology for
access control (ACI, 2005). Indeed, this study found that 85.5% of respodents ranked the
newness of biometric technology as a “50/50” to “highly important” issue when
considering biometric technology for airport access control (Table 6.19).
1 4 4 4 1 13 4 1 4
CategoryCategory Category Category CategoryI XII III IV Other
7 9 4 6 814 9 13 10 3
2 2 1 2
27 28 23 20 18 1
Never1-2 years3-4 yearsOver 5 years
Years until use asprimary accesscontrol
Currently usingmethodbiometric technologyas the primary method
Total
Airport classification by category
63

Table 6.19: Newness of biometric technology as an issue by airport category
When the issues of newness of biometric technology is analyzed by responding airport
category, the cross tabulation reveals that more security directors from Category I
airports ranked the issue at or above the 50/50 level of importance (table 6.20).
In its report, ACI also proposed that a current lack of interoperability standards
and the desire by airports to utilize different pieces of biometric hardware within their
existing access control system is another reason why biometric implementation has been
slow in airport access control (ACI, 2005). This study lends evidence to that statement by
Table 6.20: Newness of biometric technology as an issue by airport category
1 2 1 1 1 2
2 5 3 9 7 4 7 68 7 5 3 49 8 4 3 32 4 6 2 4
28 29 27 20 19
Highly unimportantUnimportant Somewhat unimportantAbout 50/50Somewhat important ImportantHighly important
Newness ofbiometric technology
Total
CategoryI
CategoryII
CategoryIII
CategoryIV
CategoryX
Airport classification
4 3.1 4 3.1
10 7.6 35 26.730 22.928 21.419 14.5
130 99.21 .8
131 100.0
Highly unimportantUnimportant Somewhat unimportantAbout 50/50Somewhat important ImportantHighly important Total
Number ofRespondents
Not IndicatedTotal
Percent
64
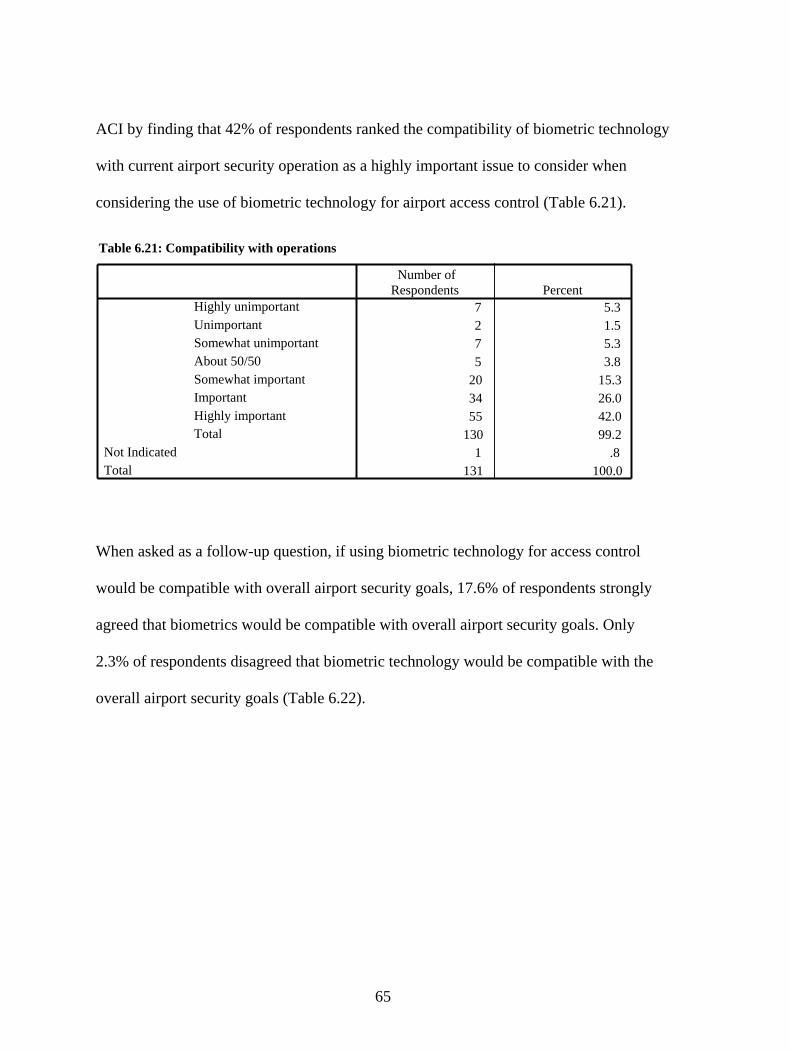
ACI by finding that 42% of respondents ranked the compatibility of biometric technology
with current airport security operation as a highly important issue to consider when
considering the use of biometric technology for airport access control (Table 6.21).
Table 6.21: Compatibility with operations
When asked as a follow-up question, if using biometric technology for access control
would be compatible with overall airport security goals, 17.6% of respondents strongly
agreed that biometrics would be compatible with overall airport security goals. Only
2.3% of respondents disagreed that biometric technology would be compatible with the
overall airport security goals (Table 6.22).
7 5.3 2 1.5 7 5.3 5 3.8
20 15.334 26.055 42.0
130 99.21 .8
131 100.0
Highly unimportantUnimportant Somewhat unimportantAbout 50/50Somewhat importantImportantHighly importantTotal
Number of Respondents
Not IndicatedTotal
Percent
65
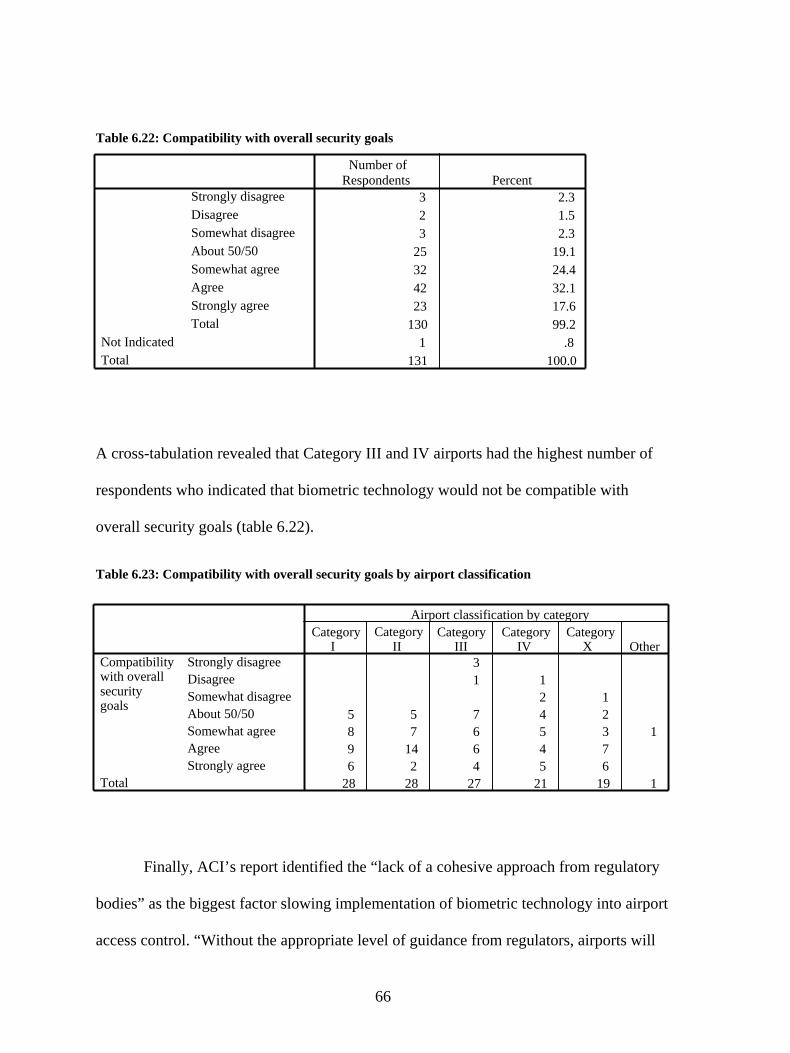
Table 6.22: Compatibility with overall security goals
A cross-tabulation revealed that Category III and IV airports had the highest number of
respondents who indicated that biometric technology would not be compatible with
overall security goals (table 6.22).
Finally, ACI’s report identified the “lack of a cohesive approach from regulatory
bodies” as the biggest factor slowing implementation of biometric technology into airport
access control. “Without the appropriate level of guidance from regulators, airports will
Table 6.23: Compatibility with overall security goals by airport classification
31 1
2 15 5 7 4 28 7 6 5 3 19 14 6 4 76 2 4 5 6
28 28 27 21 19 1
Strongly disagree DisagreeSomewhat disagreeAbout 50/50Somewhat agree AgreeStrongly agree
Compatibility with overallsecurity goals
Total
CategoryI
CategoryII
CategoryIII
CategoryIV
CategoryX Other
Airport classification by category
3 2.32 1.53 2.3
25 19.132 24.442 32.123 17.6
130 99.21 .8
131 100.0
Strongly disagree DisagreeSomewhat disagreeAbout 50/50Somewhat agree AgreeStrongly agreeTotal
Number ofRespondents
Not IndicatedTotal
Percent
66

remain intransigent on the decision of adopting biometric technology” (ACI 2005, p. 13).
Additionally, in its Guidance Package: Biometrics for Airport Access Control, TSA
concedes that it “is aware that some airport operators may be unwilling to implement
biometrics to secured areas because TSA has not yet identified technologies that it
believes perform acceptably” (TSA 2005, p. 1). When airport security directors and
managers were asked in this study to rank the importance of guidance by TSA on which
biometric standards to adopt, 28.2% of respondents ranked TSA guidance as highly
important; 57.2% ranked TSA guidance at or above 50/50 on the level of importance on
the 7 point scale (Table 6.24).
Table 6.24: Guidance by TSA
As a follow-up question, the participants were asked to rank how helpful TSA guidance
has been in regards to using biometric technology for airport access control. Only 26.7%
of respondents ranked TSA guidance as moderately helpful; 57.3% ranked TSA between
moderately helpful to not helpful at all when it comes to guidance on biometric
technology. Finally, just 12.2% ranked TSA guidance between moderately helpful and
8 6.14 3.16 4.6
24 18.327 20.624 18.337 28.2
130 99.21 .8
131 100.0
Highly unimportant Unimportant Somewhat unimportantAbout 50/50Somewhat important ImportantHighly important Total
Number ofRespondent
Not IndicatedTotal
Percent
67

extremely helpful, with only 1.5% of those respondents ranking TSA guidance at the
“extremely helpful” level (Table 6.24).
Table 6.25: Level of TSA guidance on biometric technology
A final question relating to the TSA was also included on the survey instrument
and this question was designed to examine the perceived level of voluntariness that
airport security directors feel when faced with the decision of whether or not to adopt
biometric technology for airport access control. While the TSA is a national regulatory
agency in terms of airport security, it is ultimately the airport operators and managers that
determine technology implementation. Therefore, a question designed to measure the
level of perceived voluntariness was important in this study. When asked to indicate how
strongly they agreed with the statement that they are expected by TSA to use some form
of biometric technology for airport access control, it was an interesting finding that
18.3% indicated they felt “about 50/50” with the statement that they are expected by the
TSA to use some form of biometric technology for airport access control. 8.4% of
respondents indicated that they agreed above the “about 50/50” level. However, 41.2% of
28 21.425 19.122 16.835 26.79 6.9 5 3.8 2 1.5
126 96.25 3.8
131 100.0
Not helpful at all Unhelpful Somewhat unhelpful Moderately helpful Somewhat helpfulHelpfulExtremely helpfulTotal
Number of Respondents
Not IndicatedTotal
Percent
68
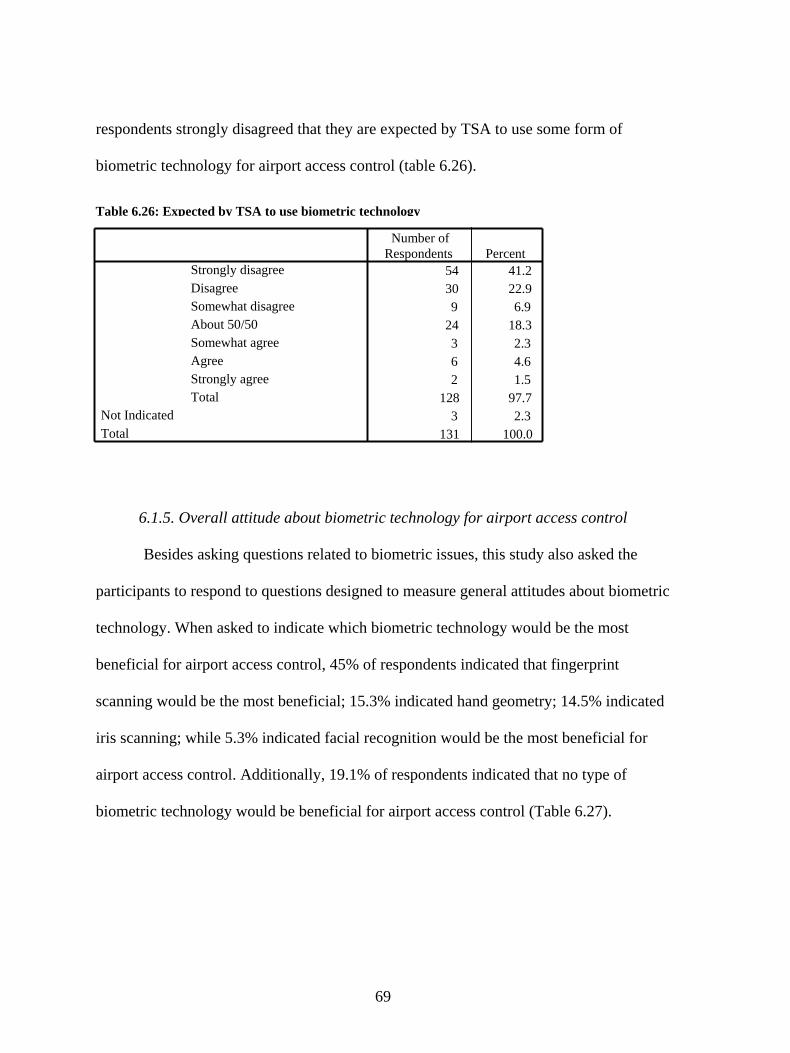
respondents strongly disagreed that they are expected by TSA to use some form of
biometric technology for airport access control (table 6.26).
Table 6.26: Expected by TSA to use biometric technology
6.1.5. Overall attitude about biometric technology for airport access control
Besides asking questions related to biometric issues, this study also asked the
participants to respond to questions designed to measure general attitudes about biometric
technology. When asked to indicate which biometric technology would be the most
beneficial for airport access control, 45% of respondents indicated that fingerprint
scanning would be the most beneficial; 15.3% indicated hand geometry; 14.5% indicated
iris scanning; while 5.3% indicated facial recognition would be the most beneficial for
airport access control. Additionally, 19.1% of respondents indicated that no type of
biometric technology would be beneficial for airport access control (Table 6.27).
54 41.230 22.99 6.9
24 18.33 2.36 4.62 1.5
128 97.73 2.3
131 100.0
Strongly disagree DisagreeSomewhat disagreeAbout 50/50Somewhat agree AgreeStrongly agreeTotal
Number ofRespondents
Not Indicated Total
Percent
69

Table 6.27: Most beneficial for access control
When asked to indicate which biometric technology would be the least beneficial
for airport access control, 45.8% of respondents indicated that voice recognition would be
the least beneficial; 17.6% indicated iris scanning; 12.2% indicated facial recognition;
4.6% indicated hand geometry; while 3.1% of respondents indicated fingerprint scanning
would be the least beneficial for airport access control (Table 6.27).
Additionally, the participants in this study were asked to think about their security
plan and then indicate how much priority they place on using biometric technology for
59 45.020 15.37 5.3
19 14.5
25 19.1
130 99.21 .8
131 100.0
Fingerprint scanning Hand geometry Facial recognition Iris scanningBiometrics would not bebeneficial Total
Number of Respondents Percent
Not IndicatedTotal
Table 6.28: Least beneficial for access control
4 3.1 6 4.6
60 45.816 12.223 17.6
20 15.3
129 98.52 1.5
131 100.0
Fingerprint scanning Hand geometry Voice recognition Facial recognition Iris scanningBiometrics would not bebeneficial Total
Number ofRespondents
Not IndicatedTotal
Percent
70

employee access control. Of the respondents, 20.6% indicated that using biometric
technology for access control is moderately important in their list of priorities; 30.5%
ranked the level of priority as higher than moderately important, with 7.6% of those
respondents ranking it as extremely important as a priority. 17.6% of respondents rank
biometric technology as extremely unimportant in terms of an airport priority (Table
6.29).
Table 6.29: Level of priority given to using biometrics for access control
A cross-tabulation revealed that Category X airports (the largest airports) had the most
respondents (5) indicate that biometric technology is given extremely important priority
in their security plan. Conversely, Category III airport had the highest number of
respondents (10) indicate that biometrics technology is extremely unimportant within
their security plan (table 6.30).
23 17.617 13.023 17.627 20.625 19.15 3.8
10 7.6130 99.2
1 .8131 100.0
Extremely unimportantUnimportant Somewhat unimportant Moderately importantSomewhat important ImportantExtremely important Total
Number of Respondents
Not IndicatedTotal
Percent
71

Table 6.30: Level of priority of using biometrics for access control by airport classification
When asked to rank their overall attitude toward the use of biometric technology
for airport access control, 32.1% of respondents indicated that their favorability towards
biometric technology was at the 50/50 level on a 7 point scale; 13% indicated they are
extremely favorable towards biometric technology for airport access control; while only
9.2% indicated that they are below the 50/50 level when it comes to their overall attitude
towards biometric technology for airport access control (Table 6.31). Additionally, table
6.32 reveals a cross-tabulation of overall attitude towards biometrics based on the airport
category that the respondents represent.
2 5 10 43 3 6 4 8 3 4 3 3 4 8 7 5 3 8 7 4 2 3 12 1 1 1 1 2 1 1 5
28 29 27 21 19 1
Extremely unimportant Unimportant Somewhat unimportant Moderately important Somewhat important ImportantExtremely important
Level ofpriority ofusingbiometrics for accesscontrol
Total
CategoryI
CategoryII
CategoryIII
CategoryIV
Category X
Airport classification by category
Other
Table 6.31: Overall attitude towards biometric technology for access control
1 .85 3.86 4.6
42 32.134 26.026 19.817 13.0
131 100.0
Extremely unfavorable UnfavorableSomewhat unfavorable About 50/50Somewhat favorableFavorableExtremely favorableTotal
Number of Respondents Percent
72
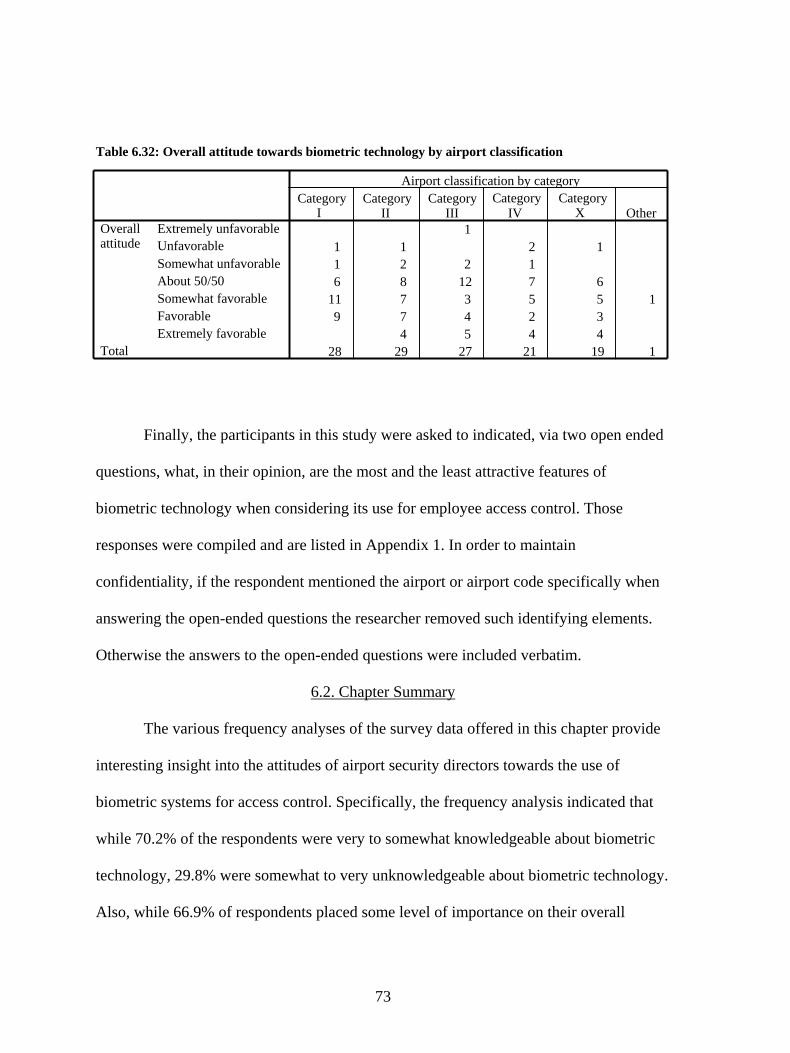
Table 6.32: Overall attitude towards biometric technology by airport classification
Finally, the participants in this study were asked to indicated, via two open ended
e
ically when
questions, what, in their opinion, are the most and the least attractive features of
biometric technology when considering its use for employee access control. Thos
responses were compiled and are listed in Appendix 1. In order to maintain
confidentiality, if the respondent mentioned the airport or airport code specif
answering the open-ended questions the researcher removed such identifying elements.
Otherwise the answers to the open-ended questions were included verbatim.
6.2. Chapter Summary
The various frequency an offered in this chapter provide
terest
that
.
alyses of the survey data
in ing insight into the attitudes of airport security directors towards the use of
biometric systems for access control. Specifically, the frequency analysis indicated
while 70.2% of the respondents were very to somewhat knowledgeable about biometric
technology, 29.8% were somewhat to very unknowledgeable about biometric technology
Also, while 66.9% of respondents placed some level of importance on their overall
11 1 2 11 2 2 16 8 12 7 6
11 7 3 5 5 19 7 4 2 3
4 5 4 428 29 27 21 19 1
Extremely unfavorableUnfavorable Somewhat unfavorable About 50/50Somewhat favorableFavorableExtremely favorable
Overall attitude
Total
CategoryI
CategoryII
Category Category Category XIII IV Other
Airport classification by category
73
knowledge of biometric technology when considering biometric technology for airp
access control, 32% disagreed that there is enough information about biometric
technology to make an informed decision on its capabilities for airport access co
an issue, the compatibility of biometric technology to airport security goals was indicated
as important by 83% of respondents, and 74.1% of respondents agreed on some level that
biometric technology would be compatible with their airport’s security goals and policies.
As far as government involvement, 67.1% of respondents indicated that guidance from
TSA is important on some level before the decision to use biometric technology for
airport access control can be reached. However, 57.3% of respondents indicated on s
level that TSA was unhelpful when providing guidance on the use of biometric
technology for airport access control. Finally, while 77% of the respondents in th
indicated, on some level, a favorable attitude towards biometric technology, 40% of
respondents indicated that it will be over 5 years before biometric technology is the
primary method of access control at their respective airports.
Generally, the frequency analyses illustrates the variou
ort
ntrol. As
ome
is study
s levels of familiarity and
ic
at
for
overall understanding that airport security directors have with regards to particular
biometric systems, the highly perceived compatibility and applicability that biometr
systems can offer to the overall security goals, and the rather lower confidence levels th
security directors have that biometrics systems will be utilized in the near future in their
airports. Similarly, the frequency analyses offers guidance as to the most beneficial
(fingerprint scanning) and least beneficial (voice recognition) biometric applications
airports according to the security directors’ assessment. Finally, the frequency analyses
74

highlights the highly perceived need for TSA direction coupled with the lower levels of
satisfaction that security directors are currently feeling towards present TSA guidance.
While frequency analyses offers a substantial amount of information regarding the
overall attitudes of airport security directors towards various factors surrounding
biometric systems and use, the following chapter will provide even greater statistical
analyses in order to test the study hypotheses involving the propensity by security
directors to adopt biometric technology for airport access control.
75

7. DATA ANALYSIS – BIVARIATE RELATIONSHIPS
The remaining portion of the data analysis will empirically assess the hypotheses
regarding the propensity to adopt biometric technology for airport access control. The
analysis will include a restatement of the hypotheses regarding adoption of biometric
technology. This will be followed by an analysis of the particular relationships as they
apply to biometric technology for airport access control. Each of the independent
variables and its bivariate relationship to propensity to adopt biometric technology for
airport access control (the dependant variable) is examined in this chapter. Using SPSS
11.0, the bivariate relationships between the independent and dependant variables were
assessed using a coefficient of correlation. Additionally, the standardized regression
coefficients of each relationship will be diagramed using a path analysis model. The
model, which was constructed using the AMOS program, will highlight the significance
of each hypothesized relationship in this study.
A correlation is a statistical calculation designed to help a researcher determine if
two variables are related in a systematic way; and it is designed to quantify and describe a
relationship between those two variables. A correlation coefficient, a number ranging
from -1.00 to 1.00 is used to describe the strength and direction of the relationship
between two variables. While a correlation can describe a relationship between two
variables, it does not mean that the variables are related in a causal manner. In other
words, correlations can not determine that one variable causes another variable to occur.
Within this study, correlations were used to determine the relationships between the
independent and dependant variable. However, this study does not attempt to predict
76
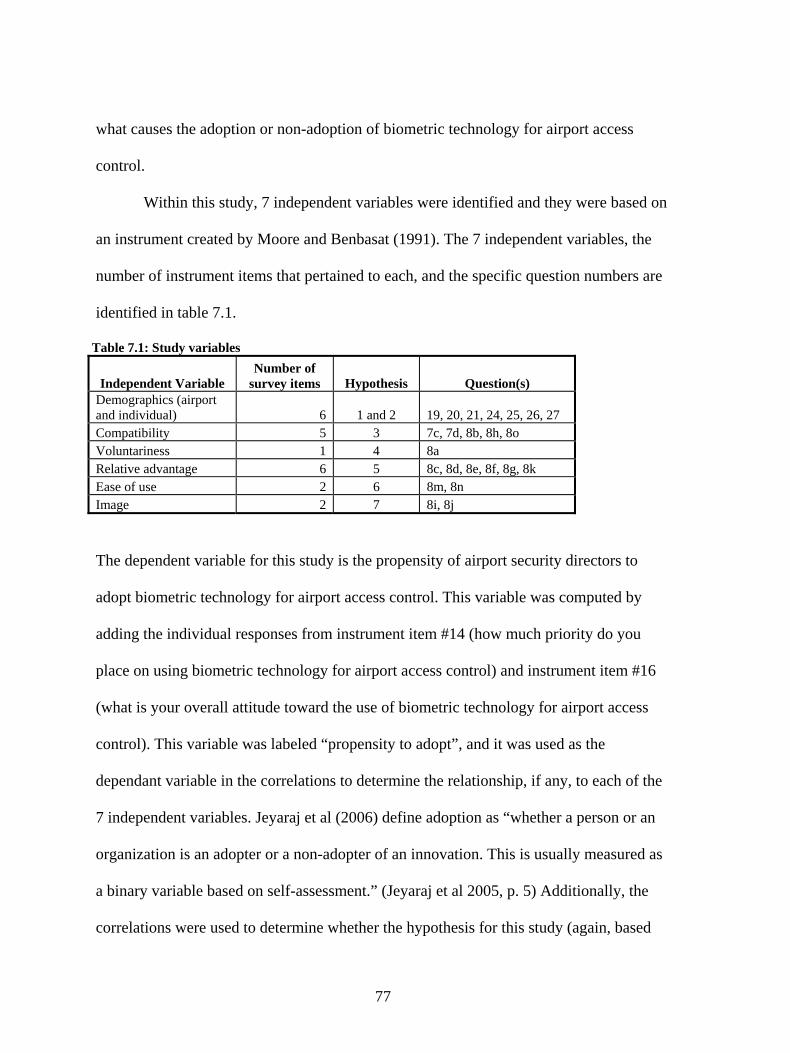
what causes the adoption or non-adoption of biometric technology for airport access
control.
Within this study, 7 independent variables were identified and they were based on
an instrument created by Moore and Benbasat (1991). The 7 independent variables, the
number of instrument items that pertained to each, and the specific question numbers are
identified in table 7.1.
Table 7.1: Study variables
Independent Variable Number of
survey items Hypothesis Question(s) Demographics (airport and individual) 6 1 and 2 19, 20, 21, 24, 25, 26, 27 Compatibility 5 3 7c, 7d, 8b, 8h, 8o Voluntariness 1 4 8a Relative advantage 6 5 8c, 8d, 8e, 8f, 8g, 8k Ease of use 2 6 8m, 8n Image 2 7 8i, 8j
The dependent variable for this study is the propensity of airport security directors to
adopt biometric technology for airport access control. This variable was computed by
adding the individual responses from instrument item #14 (how much priority do you
place on using biometric technology for airport access control) and instrument item #16
(what is your overall attitude toward the use of biometric technology for airport access
control). This variable was labeled “propensity to adopt”, and it was used as the
dependant variable in the correlations to determine the relationship, if any, to each of the
7 independent variables. Jeyaraj et al (2006) define adoption as “whether a person or an
organization is an adopter or a non-adopter of an innovation. This is usually measured as
a binary variable based on self-assessment.” (Jeyaraj et al 2005, p. 5) Additionally, the
correlations were used to determine whether the hypothesis for this study (again, based
77
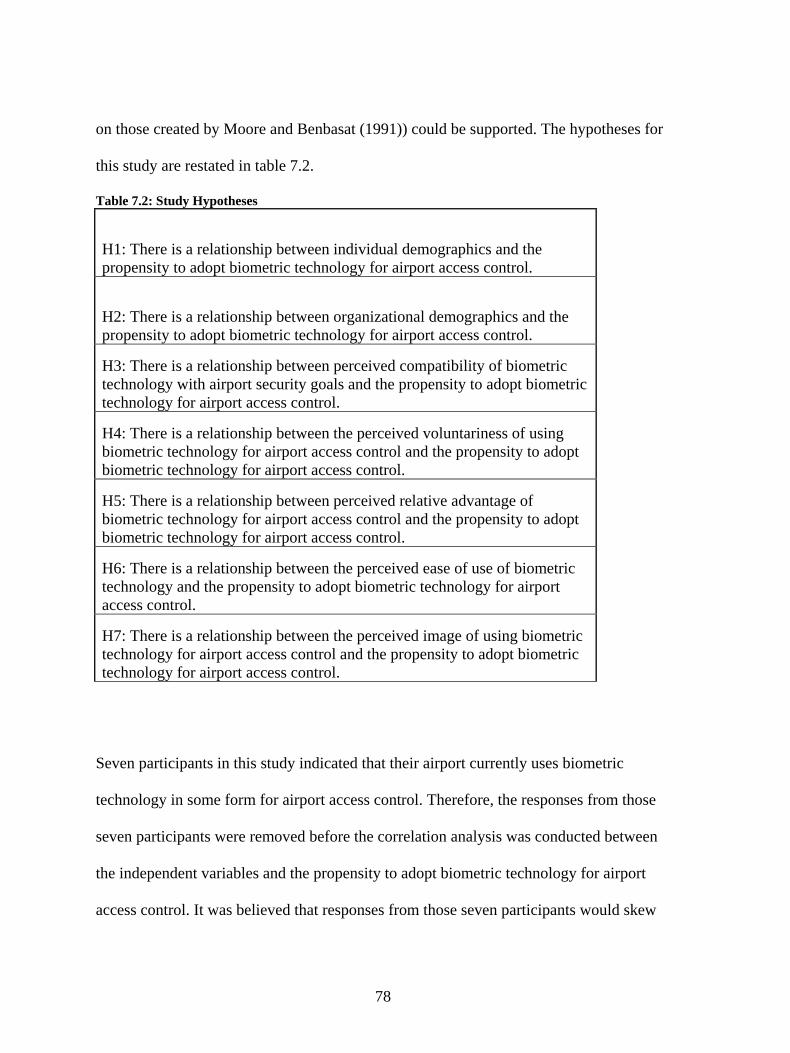
on those created by Moore and Benbasat (1991)) could be supported. The hypotheses for
this study are restated in table 7.2.
Table 7.2: Study Hypotheses
H1: There is a relationship between individual demographics and the propensity to adopt biometric technology for airport access control.
H2: There is a relationship between organizational demographics and the propensity to adopt biometric technology for airport access control.
H3: There is a relationship between perceived compatibility of biometric technology with airport security goals and the propensity to adopt biometric technology for airport access control.
H4: There is a relationship between the perceived voluntariness of using biometric technology for airport access control and the propensity to adopt biometric technology for airport access control.
H5: There is a relationship between perceived relative advantage of biometric technology for airport access control and the propensity to adopt biometric technology for airport access control.
H6: There is a relationship between the perceived ease of use of biometric technology and the propensity to adopt biometric technology for airport access control.
H7: There is a relationship between the perceived image of using biometric technology for airport access control and the propensity to adopt biometric technology for airport access control.
Seven participants in this study indicated that their airport currently uses biometric
technology in some form for airport access control. Therefore, the responses from those
seven participants were removed before the correlation analysis was conducted between
the independent variables and the propensity to adopt biometric technology for airport
access control. It was believed that responses from those seven participants would skew
78

the results of the correlation due to the fact that their airports had already adopted
biometric technology in some form.
7.1. Hypothesis 1 and Hypothesis 2: Demographics
The first two hypothesis examined in this study were: 1) there is a relationship
between social demographics and the propensity to adopt biometric technology for
airport access control, and 2) there is a relationship between organizational demographics
and the propensity to adopt biometric technology for airport access control. Within their
study examining the predictors of innovation adoption, Jeyaraj et al (2006) listed age,
gender, and experience as being frequently employed, and serving as significant
predictors of innovation adoption by individuals. Experience was also listed, however, its
relationship was not as significant as the others. Although, education was not listed as a
predictor, it was used in this study to determine if it was correlated to the propensity to
use biometrics for airport access control. The individual demographics that were
examined in this study were: tenure (in years) as the airport’s security director, education
level, age, and gender. It was hypothesized, based on Jeyaraj et al’s (2006) study, that
each of these individual demographics would have a strong, positive relationship to the
propensity to adopt biometric technology. After examining the correlation matrix
constructed using SPSS 11.0, it was determined that of the individual demographics
examined, gender was the only individual demographic to be related to the propensity of
airport security directors to adopt biometric technology for airport access control (table
7.3). The Person correlation coefficient for gender was -208. This relationship is likely
caused due to the fact that females are underrepresented in the population of airport
security directors. As indicated earlier, only 17 of the 131 participating respondents in the
79
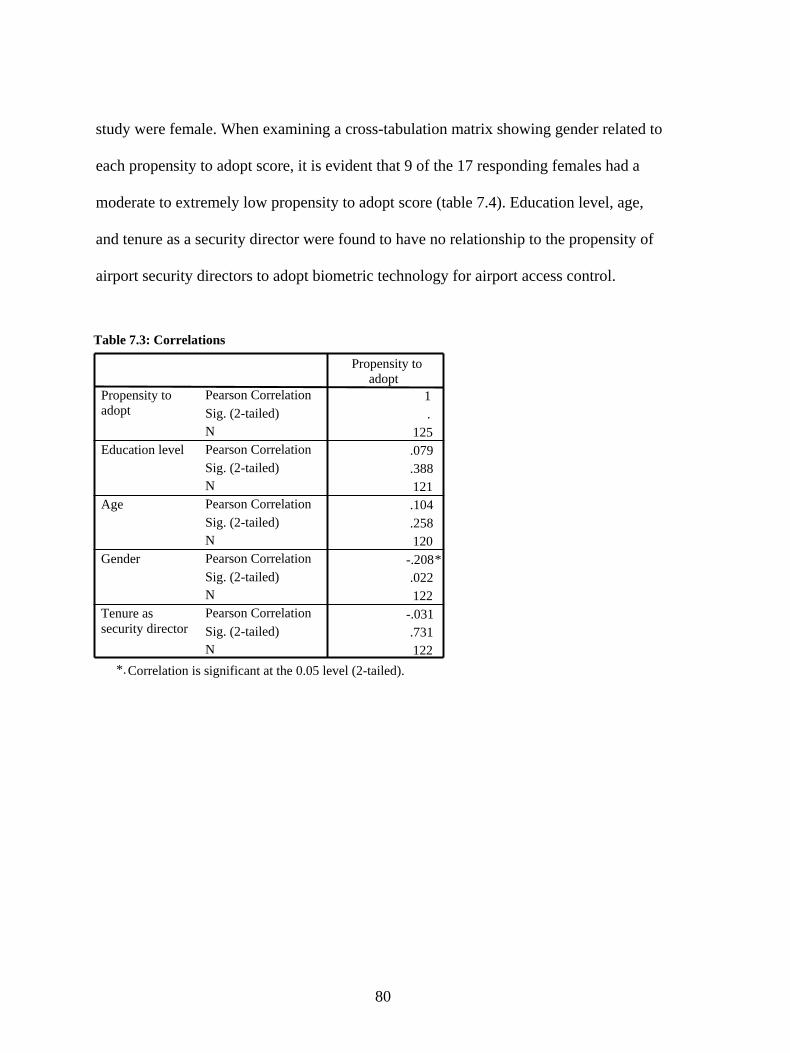
study were female. When examining a cross-tabulation matrix showing gender related to
each propensity to adopt score, it is evident that 9 of the 17 responding females had a
moderate to extremely low propensity to adopt score (table 7.4). Education level, age,
and tenure as a security director were found to have no relationship to the propensity of
airport security directors to adopt biometric technology for airport access control.
Table 7.3: Correlations
1.
125.079.388121.104.258120
-.208*.022122
-.031.731122
Pearson Correlation Sig. (2-tailed)N
Propensity toadopt
Propensity toadopt
Pearson Correlation Sig. (2-tailed)N
Education level
Pearson Correlation Sig. (2-tailed)N
Age
Pearson Correlation Sig. (2-tailed)N
Gender
Pearson Correlation Sig. (2-tailed)
Tenure assecurity director
NC*. orrelation is significant at the 0.05 level (2-tailed).
80
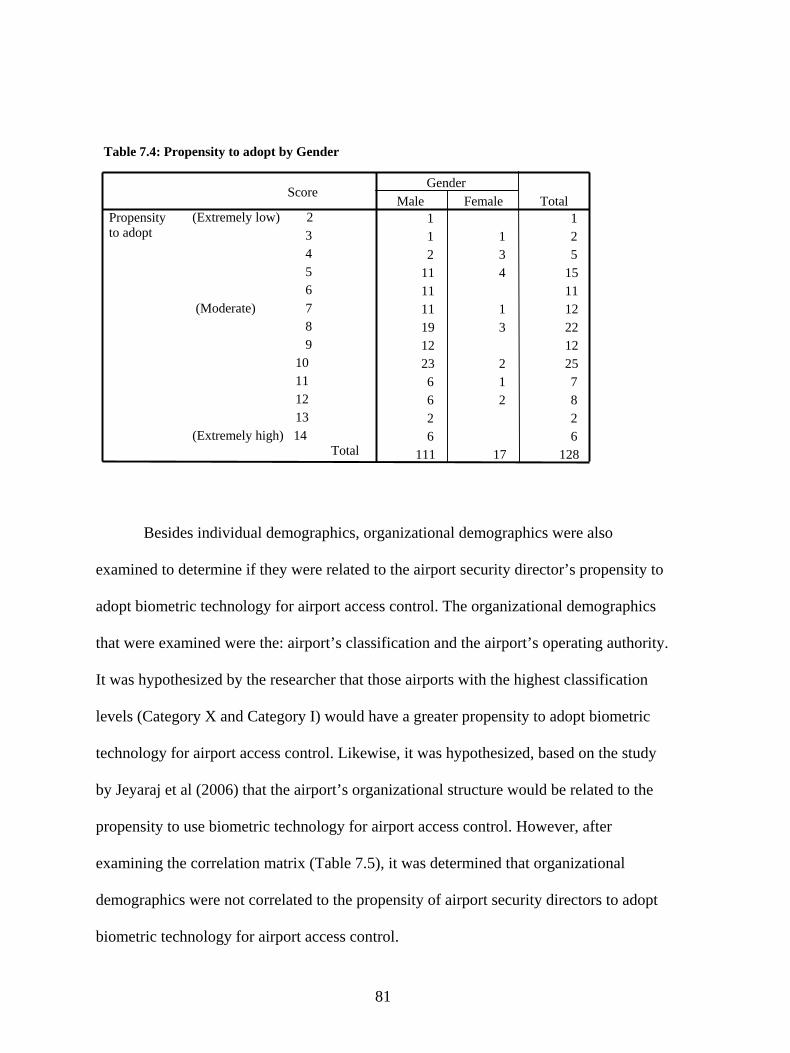
Table 7.4: Propensity to adopt by Gender
Besides individual demographics, organizational demographics were also
examined to determine if they were related to the airport security director’s propensity to
adopt biometric technology for airport access control. The organizational demographics
that were examined were the: airport’s classification and the airport’s operating authority.
It was hypothesized by the researcher that those airports with the highest classification
levels (Category X and Category I) would have a greater propensity to adopt biometric
technology for airport access control. Likewise, it was hypothesized, based on the study
by Jeyaraj et al (2006) that the airport’s organizational structure would be related to the
propensity to use biometric technology for airport access control. However, after
examining the correlation matrix (Table 7.5), it was determined that organizational
demographics were not correlated to the propensity of airport security directors to adopt
biometric technology for airport access control.
1 1 1 1 2 2 3 5
11 4 1511 1111 1 1219 3 2212 1223 2 256 1 7 6 2 8 2 2 6 6
111 17 128
Score
(Extremely low) 2 3 4 5 6 (Moderate) 7 8 9 10 11 12 13(Extremely high) 14
Propensity to adopt
Male FemaleGender
Total
Total
81

Table 7.5: Correlations
Based on the examination of both individual and organizational demographics, it can be
stated that there is no relationship between demographics and the propensity of airport
security directors to adopt biometric technology for airport access control. Although the
individual demographic of gender showed a slight correlation to the propensity to adopt,
it is believed that this is due to the under representation of females in this study.
Therefore, hypothesis 1 and hypothesis 2 were not supported by this study.
7.2. Hypothesis 3: Compatibility
Rogers (1995) and Moore and Benbasat (1991) both indicated that compatibility
of an innovation consistently influences adoption of that innovation. Additionally, Jeyaraj
et al (2006) list compatibility as an independent variable that is frequently used to predict
innovation adoption. Compatibility is the degree to which an innovation is perceived as
being consistent with the existing values and needs of the potential adopter (Rogers,
1995; Moore and Benbasat, 1991). Within this study, 5 survey items, reworded from
Moore and Benbasat’s (1991) instrument, were used to determine if the compatibility of
1.
125.024.790125.017.854119
Pearson CorrelationSig. (2-tailed)N
Propensity
Propensity to adopt
Pearson CorrelationSig. (2-tailed)N
Operation authority
Pearson CorrelationSig. (2-tailed)
Airport classification
N
to adopt
82

biometric technology is related to the propensity to adopt biometric technology for airport
access control. To determine the compatibility of biometric technology, the participants
in this study were asked to indicate on a 7 point scale how important it is that 1)
biometric technology is compatible with security operations, and 2) how important are
the number of access points within the airport. Additionally, the participants were asked
to indicate, on a 7 point scale, how strongly they agreed that 1) biometric technology is
not critical for airport security, 2) biometric technology would be compatible with overall
security goals, and 3) biometric technology would be ineffective at their airport. After
examining the correlation matrix (Table 7.6), it was determined that 3 of the 5 survey
items regarding compatibility were significantly related to the propensity to adopt
biometric technology for airport access control.
Table 7.6: Correlations
1.
125-.460**.000124.573**.000
124
-.340**.000125
Pearson CorrelationSig. (2-tailed)N
Propensity toadopt
Propensity to adopt
Pearson CorrelationSig. (2-tailed)N
Critical for use
Pearson CorrelationSig. (2-tailed)N
Compatibility withoverall security goals
Pearson CorrelationSig. (2-tailed)
Effective for airport use
NC**. orrelation is significant at the 0.01 level (2-tailed).
83
Of those items of compatibility that were related to the propensity to adopt
biometric technology for airport access control, the level of perceived compatibility with
overall security goals had the highest relationship, as evidenced by the Pearson
correlation coefficient of .573. In other words, as the level of perceived compatibility
with overall security goals increases, so does the propensity to adopt biometric
technology for airport access control. The other two items of compatibility that were
significantly related to the propensity to adopt biometric technology for airport access
control were both negatively worded questions. Therefore the relationship to the
propensity to adopt were indicated in a negative direction although these same
relationships were not inverse. Participants were asked how strongly they agreed that
biometric technology is not critical for airport security, and how strongly they agreed that
biometric technology would be ineffective for their airport. The Pearson correlation
coefficients generated during data analysis were -.460 and -.430 respectively for the two
survey items. In the first relationship, as the level of disagreement with the statement that
biometric technology is not critical for airport security increased so did the propensity to
adopt biometric technology. The more participants agreed that biometric technology is
not critical for airport security, the less the propensity to adopt biometric technology.
Likewise, as the level of disagreement increased with respect to the statement that
biometric technology would be ineffective for their airports, so to does the propensity to
adopt biometric technology for airport access control.
While 3 of the 5 items regarding compatibility were related to the propensity to
adopt biometric technology for airport access control, there were 2 items that were not
related to this propensity. They are listed as follows: the compatibility with airport
84
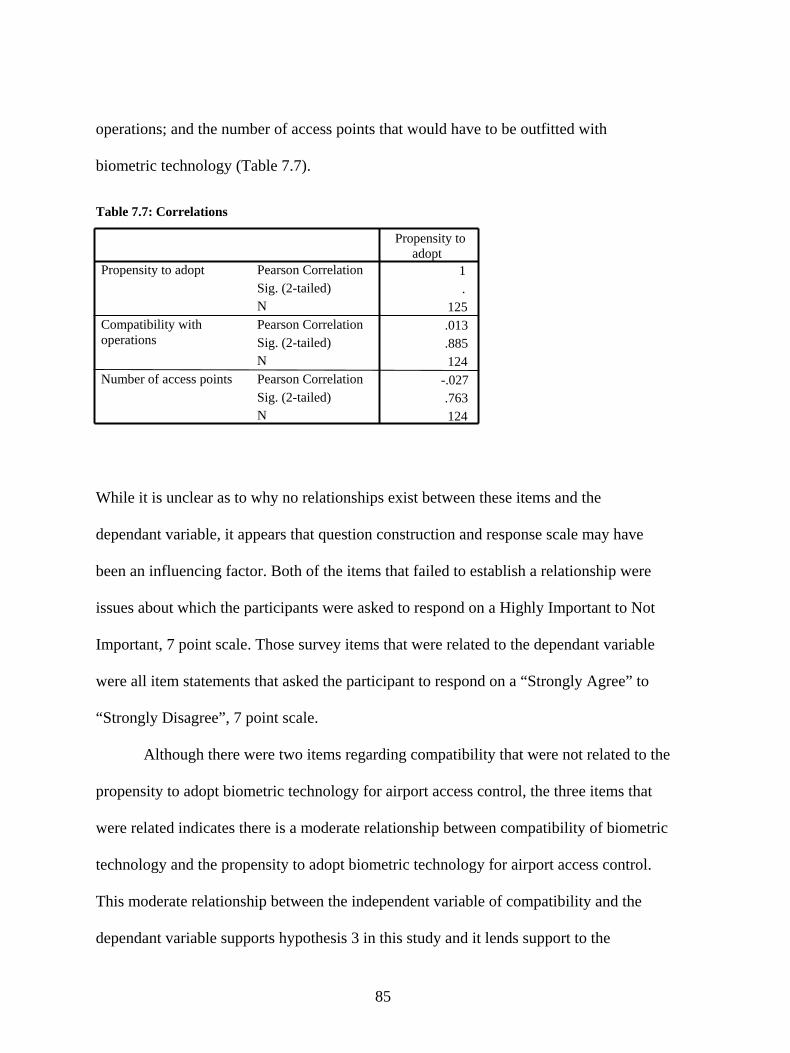
operations; and the number of access points that would have to be outfitted with
biometric technology (Table 7.7).
Table 7.7: Correlations
While it is unclear as to why no relationships exist between these items and the
dependant variable, it appears that question construction and response scale may have
been an influencing factor. Both of the items that failed to establish a relationship were
issues about which the participants were asked to respond on a Highly Important to Not
Important, 7 point scale. Those survey items that were related to the dependant variable
were all item statements that asked the participant to respond on a “Strongly Agree” to
“Strongly Disagree”, 7 point scale.
Although there were two items regarding compatibility that were not related to the
propensity to adopt biometric technology for airport access control, the three items that
were related indicates there is a moderate relationship between compatibility of biometric
technology and the propensity to adopt biometric technology for airport access control.
This moderate relationship between the independent variable of compatibility and the
dependant variable supports hypothesis 3 in this study and it lends support to the
1.
125.013.885124
-.027.763124
Pearson CorrelationSig. (2-tailed)N
Propensity to
Propensity to adopt
Pearson CorrelationSig. (2-tailed)N
Compatibility withoperations
Pearson CorrelationSig. (2-tailed)
Number of access points
N
adopt
85
literature produced by Rogers (1995), Moore and Benbasat (1991), and Jeyaraj et al
(2006).
7.3. Hypothesis 4: Voluntariness
Voluntariness is the “degree to which the use of the innovation is perceived as
being voluntary or of free will” (Moore and Benbasat, 1991), and it is listed by Jeyaraj et
al (2006) as being a predictor of innovation adoption although not a very strong predictor.
Airports have the authority to decide whether or not to implement biometric technology
for airport access control. Moore and Benbasat (1991) point out that the perception of
voluntariness is an important consideration in examining innovation adoption because if
adopters feel pressured to adopt an innovation then they will do so because of that
pressure. The influence of this variable would therefore be negative; propensity to adopt
the innovation would increase with low voluntariness. In other words, if the innovation
was to be mandated through organization policy or by an authoritative body it would
follow that the propensity to adopt the innovation would increase. While Jeyaraj et al
(2006) indicate that voluntariness is a predictor of innovation adoption, it does not have
the significance as some the other predictors of adoption. Within this study, there was 1
survey item that was used to examine if a relationship exist between voluntariness and the
propensity to adopt biometric technology for airport access control. Using a 7 point scale,
the participants were asked to indicate their level of agreement with the statement that
they are expected by TSA to use some form of biometric technology for access control.
By utilizing a correlation matrix, it was determined that there is a relationship between
the perceived voluntariness of using biometric technology and the propensity to adopt
biometric technology for airport access control (Table 7.8).
86
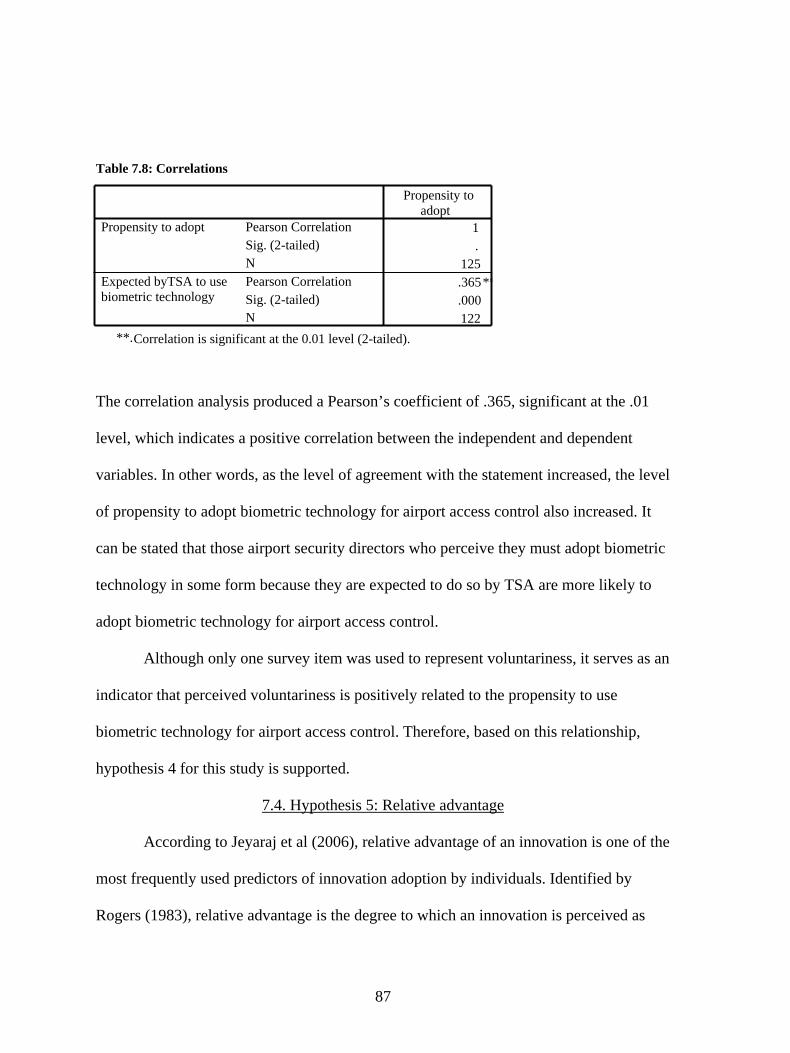
Table 7.8: Correlations
The correlation analysis produced a Pearson’s coefficient of .365, significant at the .01
level, which indicates a positive correlation between the independent and dependent
variables. In other words, as the level of agreement with the statement increased, the level
of propensity to adopt biometric technology for airport access control also increased. It
can be stated that those airport security directors who perceive they must adopt biometric
technology in some form because they are expected to do so by TSA are more likely to
adopt biometric technology for airport access control.
Although only one survey item was used to represent voluntariness, it serves as an
indicator that perceived voluntariness is positively related to the propensity to use
biometric technology for airport access control. Therefore, based on this relationship,
hypothesis 4 for this study is supported.
7.4. Hypothesis 5: Relative advantage
According to Jeyaraj et al (2006), relative advantage of an innovation is one of the
most frequently used predictors of innovation adoption by individuals. Identified by
Rogers (1983), relative advantage is the degree to which an innovation is perceived as
1.
125.365**.000122
Pearson CorrelationSig. (2-tailed)N
Propensity toadopt
Propensity to adopt
Pearson CorrelationSig. (2-tailed)
Expected byTSA to usebiometric technology
NC**. orrelation is significant at the 0.01 level (2-tailed).
87

being better than its predecessor. Moore and Benbasat (1991) also indicate that the
overall appeal of relative advantage is due to its being a generalizable concept. Because
of the literature related to relative advantage as being a predictor of innovation adoption,
it was utilized in this study to determine if it was related to the propensity to adopt
biometric technology for airport access control.
Participants in this study were asked to indicate on a 7 point scale their level of
agreement with the statements that: 1) biometric technology for access control will enable
airports to become more secure; 2) using biometric technology for access control would
improve the overall quality of airport security; 3) using biometric technology for access
control would make airport security easier to accomplish; 4) using biometric technology
for access control would improve the effectiveness of employees job performance; 5)
using biometric technology would improve my level of control over access to secure
areas, and 6) using biometric technology would eliminate piggybacking through access
control points.
The responses to each of those items were then analyzed to determine if they were
related to the propensity to adopt biometric technology for airport access control. Of the 6
survey items in this study used to determine relative advantage, all 6 were related to the
propensity to use biometric technology for airport access control (Table 7.9).
88
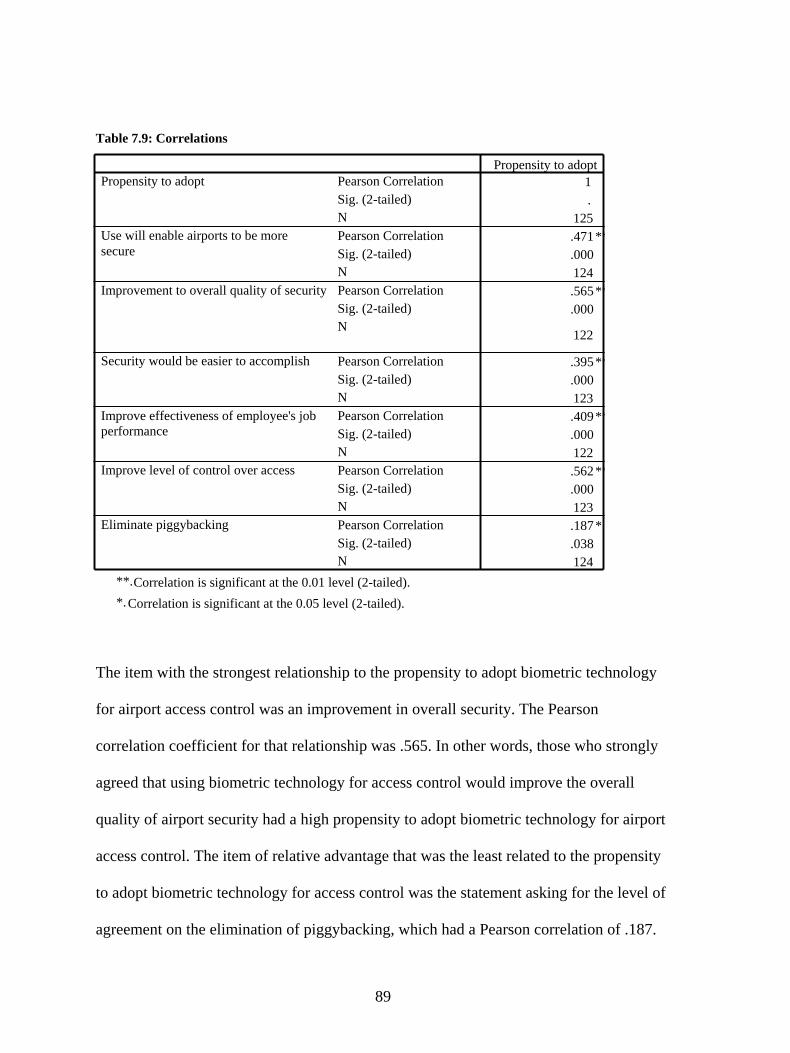
Table 7.9: Correlations
The item with the strongest relationship to the propensity to adopt biometric technology
for airport access control was an improvement in overall security. The Pearson
correlation coefficient for that relationship was .565. In other words, those who strongly
agreed that using biometric technology for access control would improve the overall
quality of airport security had a high propensity to adopt biometric technology for airport
access control. The item of relative advantage that was the least related to the propensity
to adopt biometric technology for access control was the statement asking for the level of
agreement on the elimination of piggybacking, which had a Pearson correlation of .187.
1 .
125.471**.000124.565**.000
122
.395**
.000123.409**.000122.562**.000123.187* .038124
Pearson CorrelationSig. (2-tailed)N
Propensity to adoptPropensity to adopt
Pearson CorrelationSig. (2-tailed)N
Use will enable airports to be more secure
Pearson CorrelationSig. (2-tailed)N
Improvement to overall quality of security
Pearson CorrelationSig. (2-tailed)N
Security would be easier to accomplish
Pearson CorrelationSig. (2-tailed)N
Improve effectiveness of employee's jobperformance
Pearson CorrelationSig. (2-tailed)N
Improve level of control over access
Pearson CorrelationSig. (2-tailed)
Eliminate piggybacking
NC**. orrelation is significant at the 0.01 level (2-tailed).
C*. orrelation is significant at the 0.05 level (2-tailed).
89

Due to the fact that of that all six of the survey items related to relative advantage
of biometric technology indicated a strong relationship to the propensity to adopt
biometric technology for airport access control, it can be stated that hypothesis 5 of this
study is strongly supported. Additionally, the established relationships also support the
literature indicating that relative advantage of innovation is a strong predictor of
innovation adoption.
7.5. Hypothesis 6: Ease of Use
Ease of use is the perception that adopting or using an innovation will be free
from physical and mental effort (Roger, 1983; Moore and Benbasat, 1991). According to
Jeyaraj et al (2006), ease of use is an independent variable that serves as a predictor of
innovation adoption, although its strength is debatable. Within this study, there were two
survey items that were used to examine the independent variable: ease of use. The first
item asked the respondents to indicate, on a 7 point scale, their level of agreement with
the statement that biometric technology is cumbersome for airport access control. The
second item asked the respondents to indicate their level of agreement with the statement
that it would be easy for their airport to install biometric technology for access control. It
was determined that a significant relationship was established between each of the two
items and the dependant variable (Table 7.10).
90
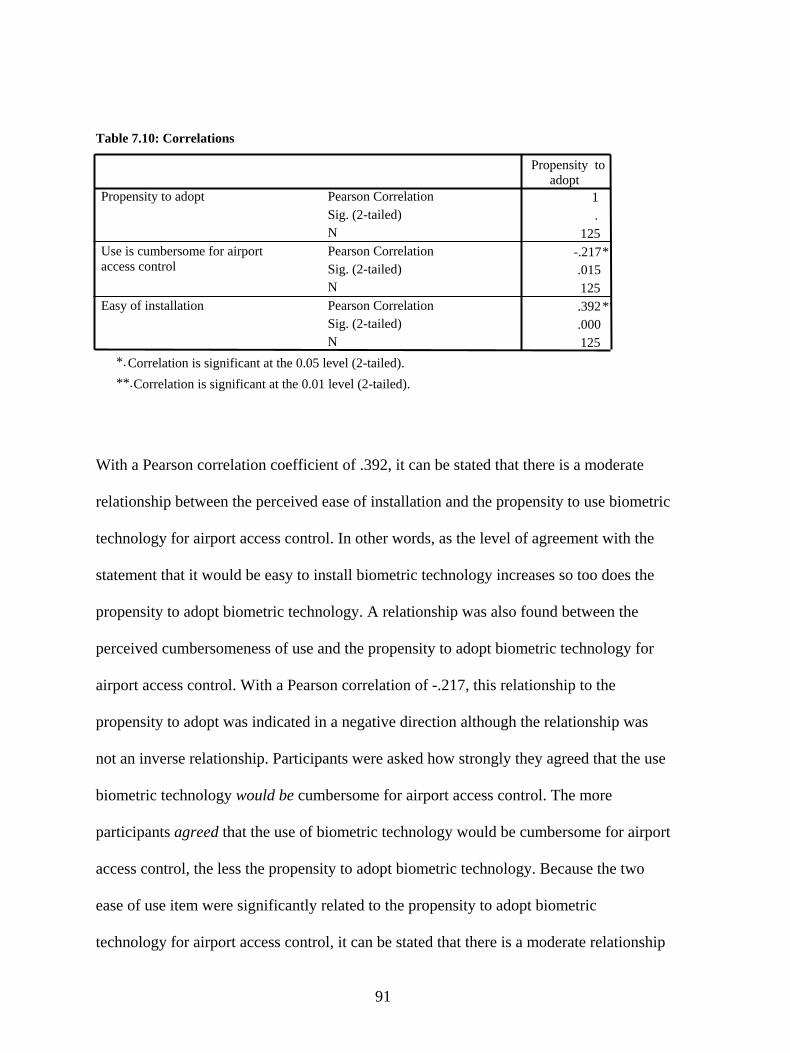
Table 7.10: Correlations
With a Pearson correlation coefficient of .392, it can be stated that there is a moderate
relationship between the perceived ease of installation and the propensity to use biometric
technology for airport access control. In other words, as the level of agreement with the
statement that it would be easy to install biometric technology increases so too does the
propensity to adopt biometric technology. A relationship was also found between the
perceived cumbersomeness of use and the propensity to adopt biometric technology for
airport access control. With a Pearson correlation of -.217, this relationship to the
propensity to adopt was indicated in a negative direction although the relationship was
not an inverse relationship. Participants were asked how strongly they agreed that the use
biometric technology would be cumbersome for airport access control. The more
participants agreed that the use of biometric technology would be cumbersome for airport
access control, the less the propensity to adopt biometric technology. Because the two
ease of use item were significantly related to the propensity to adopt biometric
technology for airport access control, it can be stated that there is a moderate relationship
1.
125-.217* .015125.392**.000125
Pearson CorrelationSig. (2-tailed)N
Propensity toadopt
Propensity to adopt
Pearson CorrelationSig. (2-tailed)N
Use is cumbersome for airport access control
Pearson CorrelationSig. (2-tailed)
Easy of installation
NC*. orrelation is significant at the 0.05 level (2-tailed).C**. orrelation is significant at the 0.01 level (2-tailed).
91
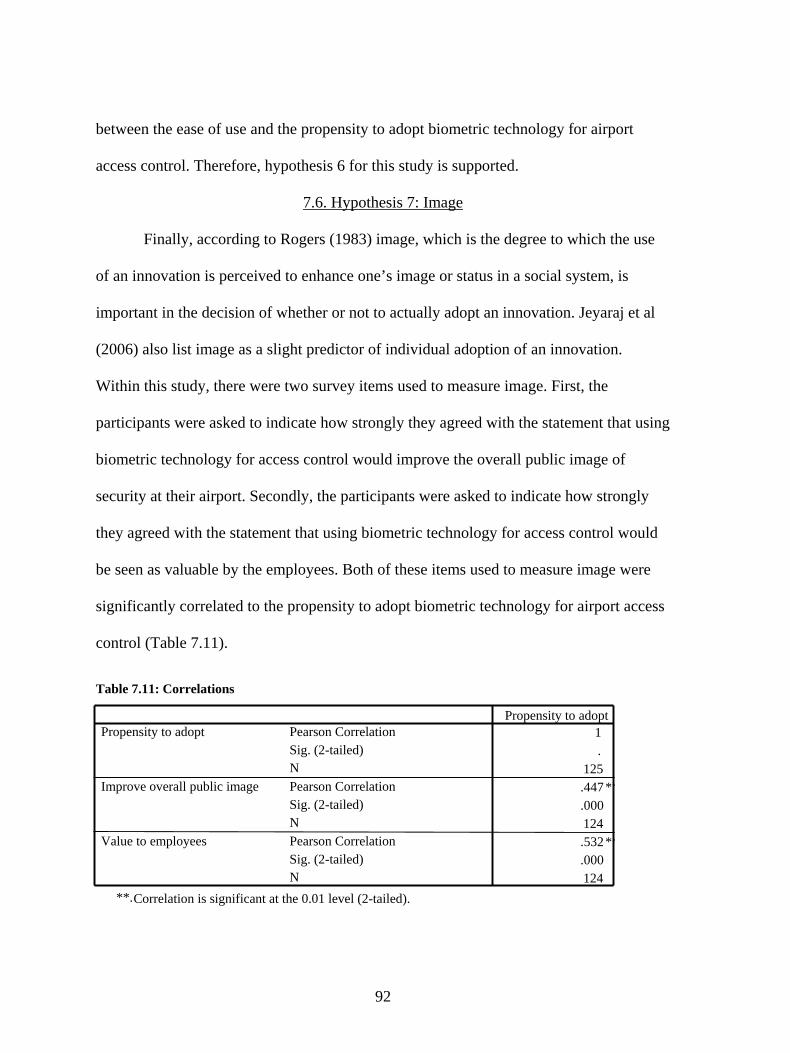
between the ease of use and the propensity to adopt biometric technology for airport
access control. Therefore, hypothesis 6 for this study is supported.
7.6. Hypothesis 7: Image
Finally, according to Rogers (1983) image, which is the degree to which the use
of an innovation is perceived to enhance one’s image or status in a social system, is
important in the decision of whether or not to actually adopt an innovation. Jeyaraj et al
(2006) also list image as a slight predictor of individual adoption of an innovation.
Within this study, there were two survey items used to measure image. First, the
participants were asked to indicate how strongly they agreed with the statement that using
biometric technology for access control would improve the overall public image of
security at their airport. Secondly, the participants were asked to indicate how strongly
they agreed with the statement that using biometric technology for access control would
be seen as valuable by the employees. Both of these items used to measure image were
significantly correlated to the propensity to adopt biometric technology for airport access
control (Table 7.11).
Table 7.11: Correlations
1 .
125.447**.000124.532**.000124
Pearson CorrelationSig. (2-tailed)N
Propensity to adoptPropensity to adopt
Pearson CorrelationSig. (2-tailed)N
Improve overall public image
Pearson CorrelationSig. (2-tailed)
Value to employees
NC**. orrelation is significant at the 0.01 level (2-tailed).
92

With a Pearson’s coefficient correlation of .447 and .532 respectively, both overall public
image and value to the employees indicate a strong relationship to propensity to adopt
biometric technology for airport access control. Due to the fact that both items are related
to the dependent variable, it can be stated that hypothesis 7 for this study is supported.
7.7. Path analysis The previous sections in this chapter provided a detailed examination of the
hypothesized relationships between the dependant and each of the independent variables
of this study. The general purpose of the bivariate analysis was to determine if
relationships did, in fact, exist between the independent and dependant variables. After
the existence of relationships was established, a path analysis was constructed to provide
further evidence of those relationships and to provide an estimate of the magnitude and
significance of those relationships.
A path analysis is a tool which is used to examine the significance of the
relationships between independent variables and the dependant variables. Figure 6
illustrates a diagram of those independent variables that were found to be related to the
dependant variable in this study.
93
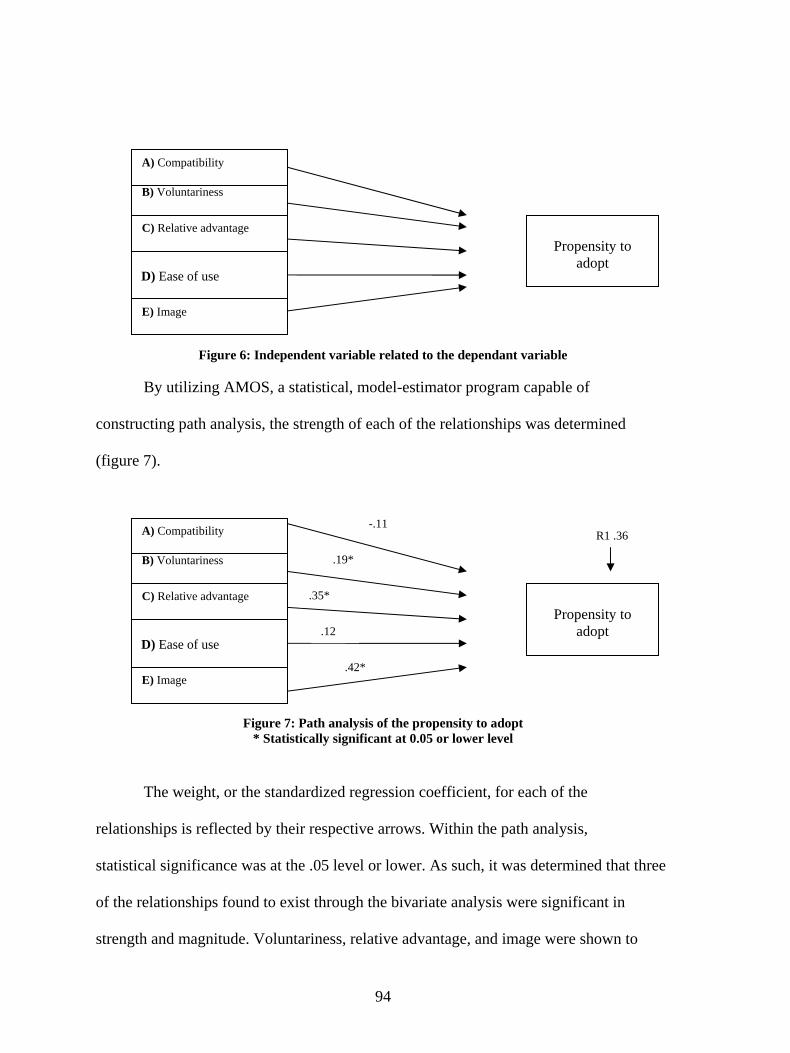
Figure 6: Independent variable related to the dependant variable
By utilizing AMOS, a statistical, model-estimator program capable of constructing path analysis, the strength of each of the relationships was determined (figure 7).
Figure 7: Path analysis of the propensity to adopt
* Statistically significant at 0.05 or lower level The weight, or the standardized regression coefficient, for each of the
relationships is reflected by their respective arrows. Within the path analysis,
statistical significance was at the .05 level or lower. As such, it was determined that three
of the relationships found to exist through the bivariate analysis were significant in
strength and magnitude. Voluntariness, relative advantage, and image were shown to
Propensity to
adopt
B) Voluntariness
C) Relative advantage
A) Compatibility
E) Image .42*
.12
.35*
.19*
-.11 R1 .36
D) Ease of use
Propensity to
adopt
B) Voluntariness
A) Compatibility
C) Relative advantage
D) Ease of use
E) Image
94
have the strongest significant relationships, out of the five that exist, to the propensity to
adopt biometric technology for airport access control.
In order to further test the research variables another, overall conceptual research
model was developed and analyzed in order to determine if there were any significant
relationships between secondary variables and the five primary research variables.
The secondary variables that were analyzed were: age, gender, tenure, airport category,
operating authority, education, and level of knowledge regarding biometrics. The overall
conceptual model is seen in figure 8. Again using the statistical software of AMOS, a
structural equation modeling (SEM) based model was developed and tested. SEM offers
a strong technique of multivariate analyses that allows for statistical testing of multiple
variables within a model. SEM can be classified as an extension of the general linear
model (GLM) and allows the researcher to perform several tests of regression
simultaneously (Gonzalez-de la Parra, 2006). Again, the purpose of developing this
model was to determine if any of the secondary research variables had any significant
relationship with the five primary research variables.
95
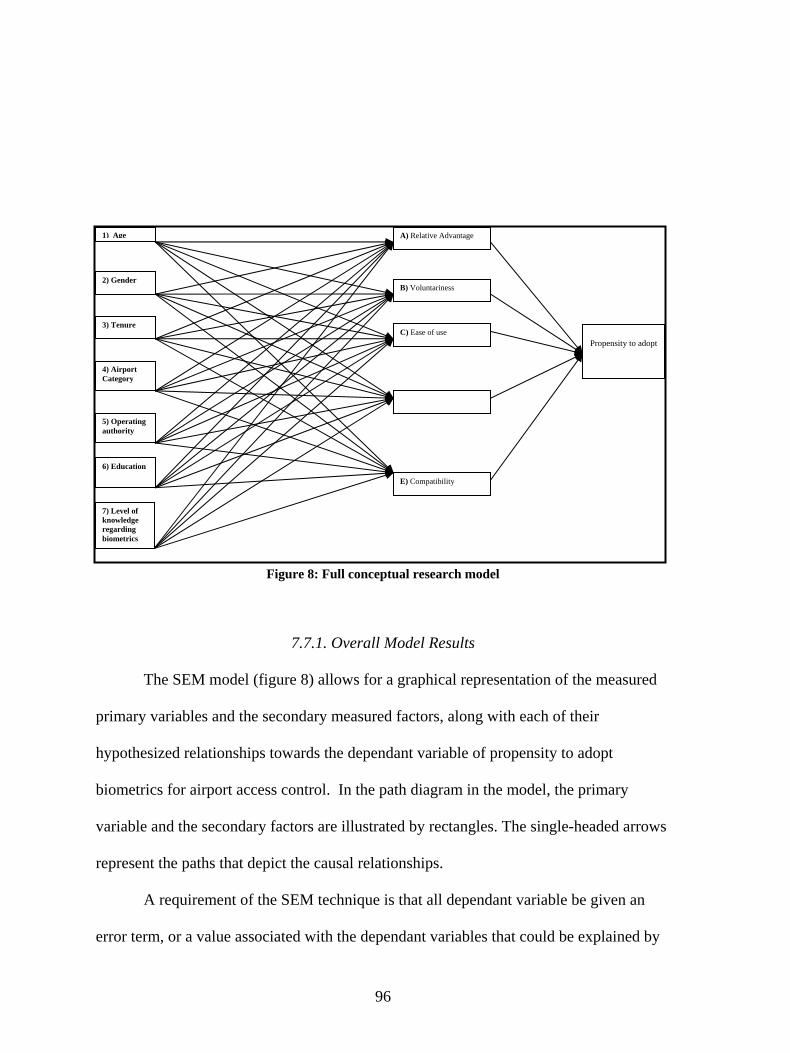
D) Image
1) Age A) Relative Advantage
Propensity to adopt
B) Voluntariness
C) Ease of use
E) Compatibility
4) Airport Category
3) Tenure
2) Gender
5) Operating authority
6) Education
7) Level of knowledge regarding biometrics
Figure 8: Full conceptual research model
7.7.1. Overall Model Results
The SEM model (figure 8) allows for a graphical representation of the measured
primary variables and the secondary measured factors, along with each of their
hypothesized relationships towards the dependant variable of propensity to adopt
biometrics for airport access control. In the path diagram in the model, the primary
variable and the secondary factors are illustrated by rectangles. The single-headed arrows
represent the paths that depict the causal relationships.
A requirement of the SEM technique is that all dependant variable be given an
error term, or a value associated with the dependant variables that could be explained by
96

factors outside of the research model. Therefore, because the variables of relative
advantage, voluntariness, ease of use, image, and compatibility were tested as dependant
variables associated with age, gender, tenure, education, airport category, operating
authority, and level of knowledge, each were given error measurements in the model to
control for unexamined/unexplainable factors. Further, the dependant variable of
propensity to adopt was also given an error measurement because it is the overall
dependant variable being tested against the other research variables. Figure 9 illustrates
the conceptual research model in testable form using the AMOS program. The error
measurements are represented as elliptical circles next to the dependant variables.
AGERADVAN
VOLUNT
IMAGE
EaseOfUse
COMPAT
PROP
e11
e21
e31
e41
e51
e61
GENDER
TENURE
AIRTYP
OPAUTH
EDUCAT
BIOKNO
.05
.11
.36 .04
.05
.07
Figure 9: AMOS testable model based on the conceptual model
Once the model was analyzed, the goodness of fit measures established to
determine how well the model would fit, or adequately describe, the data. Gonzalez-de la
97

Parra (2006) suggests that the indices of goodness of fit (GFI), comparative fit index
(CFI), and the root mean square of approximation (RMSEA) be used to address the
model and its fit of the data set. The GFI measure (Joreskog and Sorbom, 1984) is used to
indicate the “proportion of the observed covariance explained by the model-implied
covariance” (cf. Gonzalez-de la Parra, 2006, p. 229). A range of 0 (poor fit) to 1 (perfect
fit) is used to assess the GFI measure. The results of the conceptual model indicated a
.862 GFI, meaning that, according to this measure, the conceptual model is adequate in
describing the data.
The CFI measure (Bentler, 1990) is used to describe the correlation between
variables within the model and measures the assumption that all variables are
uncorrelated (Gonzalez-de la Parra, 2006). A range of 0 (poor fit) and 1 (perfect fit) is
used to assess the CFI measure with values over 0.90 indicating an adequate fit. The
results of the conceptual model used in this study indicated a .485 CFI, meaning that,
within the model, there are variable that may be associated with each other, but these are
unexplained using the current research variables. Further analysis revealed that the
Modification Index (MI) indicated that the variables of relative advantage and image
appeared to be highly correlated with each other. This correlation makes an interesting
question for future research regarding the association of relative advantage and image
toward the diffusion of an innovation.
Finally, the RMSEA measure (Browne and Cudeck, 1993) is used to assess how
well the research model approximates a true model (Gonzalez-de la Parra, 2006). A
RMSEA measure should be small with a value less than .05 illustrating an adequate fit.
The result of the conceptual model was a .144 RMSEA, indicating, again, that the model
98
is not an adequate representation based on this index. However, this value may be
indicative of the small sample size of this study (n=131), where larger sample sizes are
suggested for SEM. This RMSEA indicator could also possibly be explained by the large
number of variables within the model. However, based on the GFI=.862, the CFI = .485,
and the RMSEA = .144, it would appear that the conceptual model does not highly fit
with the suggested measures of fit.
Because of the weak goodness of fit indices of the full model, it was decided to
remove those paths that had no levels of significance at the .05 level and to run the model
again. The results of the full model indicated that only three paths or relationships were
significant in the model. Again, those relationships were: relative advantage,
voluntariness, and image. The seven secondary variables, when analyzed against the three
primary variables, were seen as being weak indicators. Only age and operating authority
were significantly related to any of the primary variables: both were significantly related
to voluntariness. Figure 10 shows the adjusted model and illustrates only those
associations that were proven to be significant at the .05 level.
99

Relative Advantage R1 .36
.35.24Age
R1 .10 .19
Propensity to adopt
Voluntariness .20
.42Operating Authority Image
Figure 10: Adjust conceptual model showing only relationship of significance
As in the earlier model, the measures of fit were evaluated to determine how well
the model [Figure 10] adequately described the data. The results indicated a GFI of .856, a
CFI of .615, and a RMSEA of .209. Again, it would appear that the model is not
indicative of the data. However, Chin (1998) states that, in SEM, other measures besides
goodness of fit measures, should be examined and actually carry more weight then the
goodness of fit indices, arguing that the predictiveness of the model should be taken into
account. Chin (1998) suggests using the strengths of the structural paths in the model by
examining the R-square indices. By using the R-square indicators in this adjusted model,
it would appear that the model is representative for the data; with propensity to adopt
having a value R-square value of .35. This suggests that approximately 35% of
propensity to adopt can be explained by relative advantage, voluntariness, and image.
Additionally, the R-square values also suggested that 10% of voluntariness can be
explained by age and operation authority. This indicator offers valuable insight into the
100

relationship of those two factors on voluntariness and allows for future exploration into
the causalities of voluntariness.
This model [Figure 10] is interesting because the relationships do indicate that
relative advantage, voluntariness, and image all affect the propensity to adopt biometric
technology for airport access control, and that these relationships follow the theories
utilized earlier in this study. The variable with the highest signification relationship to the
propensity to adopt was image. Therefore, it can be concluded that the more an airport
security director feels that biometric technology could enhance the public image of his or
her respective airport, the higher the propensity to adopt biometric technology for airport
access control. Additionally, the propensity to adopt biometric technology for airport
access control increases if airport security directors believe that there is a relative
advantage to using biometric technology over current methods of access control.
Voluntariness is also a variable that has a significant relationship to the propensity to
adopt biometric technology for airport access control. As reported earlier in this study,
voluntariness has an inverse relationship to the propensity to adopt biometric
technology for airport access control. Therefore, the more airport security directors feel
pressured to adopt biometric technology for access control, the higher the propensity to
adopt biometric for airport access control. The variable of voluntariness is affected by the
secondary variables of age and airport authority which is an interesting finding to note.
One conclusion that can be drawn from the relationship presented in figure 10, therefore,
is that the propensity to adopt biometric technology for airport access control can
increase if it can be demonstrated that biometric technology offers a relative advantage to
101
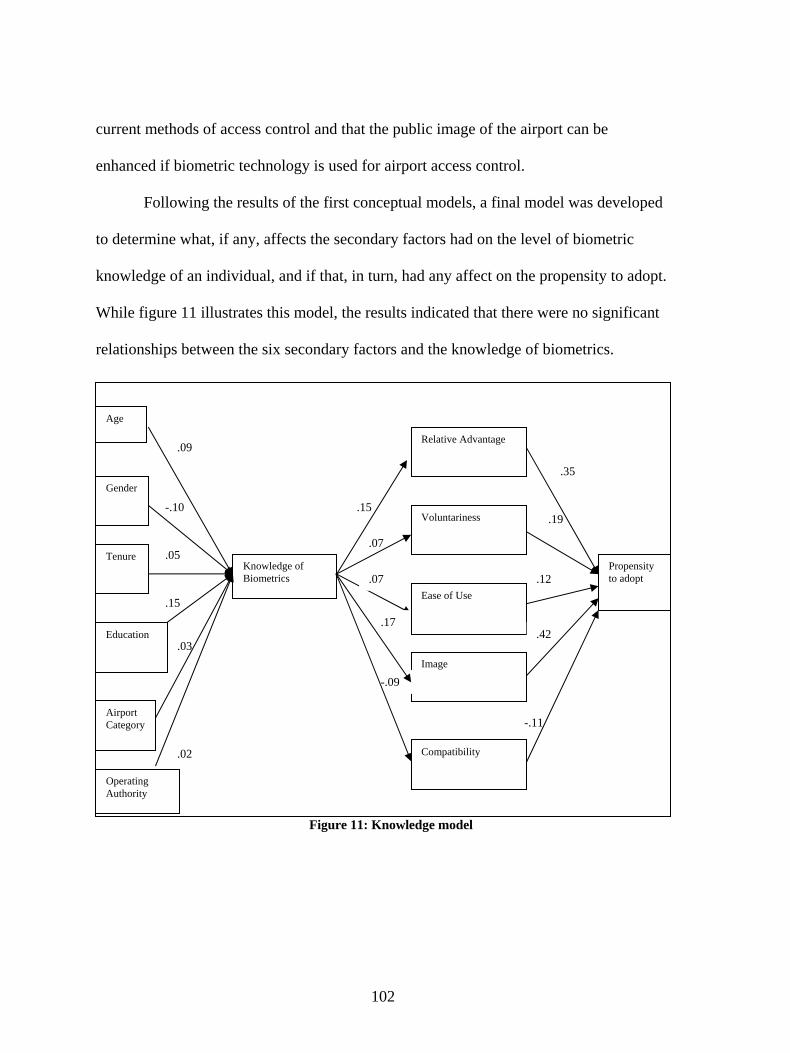
current methods of access control and that the public image of the airport can be
enhanced if biometric technology is used for airport access control.
Following the results of the first conceptual models, a final model was developed
to determine what, if any, affects the secondary factors had on the level of biometric
knowledge of an individual, and if that, in turn, had any affect on the propensity to adopt.
While figure 11 illustrates this model, the results indicated that there were no significant
relationships between the six secondary factors and the knowledge of biometrics.
Figure 11: Knowledge model
Age
Relative Advantage .09
Knowledge of Biometrics
Operating Authority
Gender
Tenure
Airport Category
Compatibility
Image
Voluntariness
Propensity to adopt
-.10
.05
.15
.03
.02
Education
.15
.07
.07
.35
.19
.12 Ease of Use
.17 .42
-.09
-.11
102

7.8. Discussion of correlation and path analysis results
The remaining portion of this chapter will discuss the analysis results that were
summarized above. In addition to discussing the correlations and path analysis results, an
examination of their importance in relation to this study will also be provided.
7.8.1. Hypothesis 1
H1: There is a relationship between individual demographics and the propensity to
adopt biometric technology for airport access control.
The first two hypotheses for this study were related to individual as well as
organizational demographics. After analyzing the correlations between individual and
organizational demographics and the propensity to adopt biometric technology for airport
access control, it was determined that only one relationship (gender) exists between any
of the individual demographics and the propensity to adopt biometric technology for
airport access control. Although Roger (1995) and Jeyaraj et al (2006) both list individual
and organizational characteristics as being predictors of innovation adoption, the findings
of this study failed to find any strong relationships to support the predictive powers of an
individual’s demographic characteristics. Through the path analysis, the only
demographic that resulted in a relationship was age, and that relationship existed to
voluntariness.
The lack of significant relationships between demographics and the propensity to
adopt biometric technology for access control is important because it indicates that other
factors besides demographics influence the propensity to adopt biometric technology for
airport access control. The findings that neither age, education level, or experience are
103
related to the propensity to use biometric technology is interesting because it is an
indication that, regardless of age, education level or the number of years as an airport
security director, the members of this population are equally likely to adopt biometric
technology for access control. This does not follow the work by Rogers (1995) which
proposed that those who are younger and who possess higher levels of education and
experience are more likely to adopt an innovation. Based on these findings therefore, the
target market of biometric adopters in an airport environment is not limited by age or
other individual demographics.
7.8.2. Hypothesis 2
H2: There is a relationship between organizational demographics and the propensity
to adopt biometric technology for airport access control.
Following individual demographics, the organizational characteristics of airports
examined in this study produced no relationships to the propensity to adopt biometric
technology for airport access control. Therefore, it was determined that neither the size of
the represented airports, nor the authoritative governing bodies were found to have any
relationship on the propensity of airport security directors to adopt biometric technology
for airport access control. Although Kimberly & Evanisko (1981) and Mascarenhas
(1991) found positive relationships between organization size and innovation adoption,
no such relationship was found in this study. As such, it would be expected that airport
security directors representing smaller airports would have a lower propensity to adopt
biometric technology for airport access control. However, the lack of an existing
relationship in this study indicates that airport security directors from varying airport
104

sizes and varying operating authorities have equal levels of propensity to adopt biometric
technology for access control. Again, based on these findings, the target market of
biometric adopters in an airport environment is not limited by size or operating authority
of the airport.
7.8.3. Hypothesis 3
H3: There is a relationship between perceived compatibility of biometric technology
with airport security goals and the propensity to adopt biometric technology for airport
access control.
The third hypothesis in this study was based on the perceived compatibility of biometric
technology for airport access control. Rogers (1995) lists compatibility as one of the
attributes that is integral to the Innovation of Diffusion theory. Based on Rogers (1995)
work, compatibility, a variable that consistently correlates with adoption behavior
(Tornatzky and Klein, 1982), was expected to have a positive relationship to the
propensity to adopt biometric technology for airport access control. In their study
however, Jeyaraj et al (2006) determined that the compatibility of a technology is only a
moderate predictor of adoption, with compatibility being a significant predictor 5 out of
the 10 times it was examined in research. The bivariate analysis of this study indicates
that compatibility is moderately correlated with the propensity to adopt biometric
technology for airport access control. The overall standardized regression coefficient of
-.11 that was generated by the path analysis also indicates a moderate, rather than a
strong relationship between compatibility and the propensity to adopt biometric
105

technology. The findings, therefore, follow more closely with Jeyaraj et al (2006) than
with the findings of Tornatzky and Klein (1982). While holistically the relationship
between compatibility and the propensity is moderate, the bivariate analysis revealed that
three out of the five questions in this study that related to compatibility were significantly
correlated with the propensity to adopt biometric technology. This is an important finding
because it indicates that those airport security directors that feel that biometric technology
is compatible with overall security goals have a higher propensity to adopt biometric
technology for airport access control. Those airport security directors that disagree with
the compatibility of biometric technology in their airports have a lower propensity to
adopt biometric technology. Although not all of the survey items related compatibility
were significantly correlated with the propensity to adopt, the fact that 3 out of 5 were
significantly related indicates that the compatibility of biometric technology with airport
security goals in an important factor to consider when examining the likelihood of it
being adopting by airport security directors. Therefore, government agencies such as
TSA, as well as biometric vendors, must be aware that the compatibility of biometric
technology with airport security goals must be demonstrated in order to increase the
likelihood of adoption by airport security directors.
7.8.4. Hypothesis 4
H4: There is a relationship between the perceived voluntariness of using biometric
technology for airport access control and the propensity to adopt biometric technology
for airport access control.
106

Voluntariness is the degree to which the adoption of an innovation is done
voluntarily or under free will, and numerous innovation acceptance studies have found a
relationship between voluntariness and the propensity to adopt an innovation (Rogers,
1995). Researchers have found that when an individual feels pressured by a recognized
authority to adopt an innovation, then the propensity to adopt that innovation increases.
This study follows the work of Rogers (1995) and Jeyaraj et al (2006) by finding that
there is a relationship between the level of perceived voluntariness and the propensity of
airport security directors to adopt biometric technology for airport access control. The
overall strength of that relationship, indicated by a standardized regression coefficient of
.19, was determined to be significant though the path analysis. In other words, those that
perceived that they were expected by TSA to use biometric technology for airport access
control had a higher propensity to adopt biometric technology for airport access control.
This finding is interesting because while national regulators and authorities such as TSA
determine airport security objectives, it is the airport operators themselves that decided
whether or not to implement technologies, such as biometric technology, to meet those
objectives. However, increased perception of authority expectations to implement
biometric technology is coupled with an increase in the propensity of airport security
directors to adopt biometric technology for airport access control. While TSA supports
the use of biometric technology to increase the security of airport access control, such use
by airports in not required (TSA, 2005). Airport operators and managers will always have
the authority to determine what technologies to implement at their airports. However,
based on the results of this study, it can be argued that if governing agencies, such as the
TSA, were to in effect lower the perception of volunatriness through indirect actions such
107
as offering rewards or incentives then the propensity to adopt biometric technology for
airport access control would increase.
7.8.5. Hypothesis 5
H5: There is a relationship between perceived relative advantage of biometric
technology for airport access control and the propensity to adopt biometric technology
for airport access control.
Rogers (1995), defines relative advantage as the degree to which an innovation is
perceived as being better that its precursor, and it is one of the integral attributes in the
Innovation Diffusion theory. Indeed, Jeyaraj et al (2006) listed relative advantage as one
of the best predictors of intention to use an innovation by individuals. The findings for
this study indicate that there is a strong relationship between perceived relative advantage
of biometric technology and the propensity to adopt biometric technology for airport
access control. This study, therefore, lends evidence to the statements by Rogers (1995)
and Jeyaraj et al (2006) that relative advantage of an innovation is important to consider
when examining innovation adoption. All 6 of the survey items designed to measure
relative advantage were significantly correlated with the propensity to adopt biometric
technology for airport access control. Additionally, the overall standardized regression
coefficient of .35 provided by the path analysis lends further evidence to a strong
relationships between relative advantage and the propensity to adopt biometric
technology. Not only do the findings of this study further validate the work of Rogers
(1995), they are also important because they show that airport security directors have a
108

higher propensity to adopt biometric technology for airport access control if they feel that
its use would be an improvement from the systems currently in place. Therefore, in order
to increase the propensity of airport security directors adopting biometric technology,
national regulatory agencies, such as TSA, and biometric vendors should demonstrate
that biometric technology has a relative advantage over those systems that are currently
being use for airport access control.
7.8.6. Hypothesis 6
H6: There is a relationship between the perceived ease of use of biometric technology
and the propensity to adopt biometric technology for airport access control.
In his technology acceptance model (TAM) Davis (1986) defines perceived ease
of use as the degree to which an individual feels that using an innovation would be free
from physical or mental effort. While empirical studies draw conclusions that there is a
relationship between ease of use and innovation acceptance (Davis, 1986; Rogers, 1995),
there is disagreement over the significance of ease of use as a predictor of innovation
adoption (Jeyaraj et al, 2006). For example, Jeyaraj el al (2006) found that ease of use
more directly affects perceived usefulness of an innovation rather that intention to use an
innovation by an individual. However, Jeyaraj et al (2006) also found that out of the 27
times the ease of use was used as an independent variable to examine the adoption of
innovation by an individual, 14 times the ease of use was significant in innovation
adoption.
109
The findings of this study indicate that there is a moderate relationship between
ease of use, especially in the realm of system installation, and the propensity to adopt
biometric technology for airport access control. The overall standardized coefficient of
.12 which was generated through path analysis further indicates a moderate, rather than
strong relationship. Therefore, in order to increase the propensity of adoption of
biometric technology, it must be demonstrated that the system is easy to install and
maintain. Further evidence that ease of installation and maintenance must be
demonstrated in order to increase the propensity to adopt can be seen in appendix 1 as
several airport security directors’ list installation and maintainability as current negative
features of biometric technology (appendix 1).
7.8.7. Hypothesis 7
H7: There is a relationship between the perceived image of using biometric
technology for airport access control and the propensity to adopt biometric technology
for airport access control.
Rogers (1995) defines image as the degree to which use of an innovation is
perceived to enhance one’s image or social status. Although some researchers categorize
image to fall under relative advantage (Moore & Benbasat, 1991), Rogers (1995)
maintains that image is one of the most important motivations for almost any individual
adoption of an innovation because it is driven by a desire to gain social status. As listed
by several airport security directors as an attractive feature of biometric technology
(appendix 1), the public perception that airports are secure is an important consideration
110

when examining access control systems. Especially since 9/11, public perception and
scrutiny about airport security is at a high. It is not surprising, therefore, that this study
found that as the perception that overall public image would improve with the use of
biometric technology, so to did the propensity to adopt biometric technology for airport
access control increase. Indeed, the overall standardize regression coefficient of .42,
which was generated through the path analysis, gave the indication that image was one of
the strongest relationships of this study. This finding follows Rogers’ (1995) that image is
related to innovation adoption. It is also interesting to note the finding that as the
perception by security directors that employees’ value of biometric technology increase,
so to does the propensity to adopt biometric technology for access control. This
relationship indicates that airport security directors’ level of propensity to adopt
biometric technology increases as the level of perceived value to their employees’
increases. Both of these relationships are important because if biometric technology can
be perceived as a technology that would increase overall airport image in the eyes of the
public and of the employees then the propensity of adopting biometric technology would
also increase.
7.9. Chapter Summary
To summarize this chapter and its findings, the hypotheses for this study, along
with the correlations and path analysis results are listed in table 7.12.
111

Table 7. 12: Study Hypotheses and Correlation and Path Analysis Results
Hypothesis Correlation
Standardized Regression Coefficient
H1: There is a relationship between individual demographics and the propensity to adopt biometric technology for airport access control. No relationship N/A
H2: There is a relationship between organizational demographics and the propensity to adopt biometric technology for airport access control. No relationship N/A
H3: There is a relationship between perceived compatibility of biometric technology with airport security goals and the propensity to adopt biometric technology for airport access control.
Moderate relationship -0.11
H4: There is a relationship between the perceived voluntariness of using biometric technology for airport access control and the propensity to adopt biometric technology for airport access control. Strong relationship 0.19*
H5: There is a relationship between perceived relative advantage of biometric technology for airport access control and the propensity to adopt biometric technology for airport access control. Strong relationship 0.35*
H6: There is a relationship between the perceived ease of use of biometric technology and the propensity to adopt biometric technology for airport access control.
Moderate relationship 0.12
H7: There is a relationship between the perceived image of using biometric technology for airport access control and the propensity to adopt biometric technology for airport access control. Strong relationship 0.42*
Correlation analysis was utilized in this study because it allowed for a detailed
examination of the influencing factors that had a relationship to the propensity of airport
security directors to adopt biometric technology for airport access control. A path
analysis was then constructed in order to determine the strength and magnitude of those
112
existing relationships. From a theoretical standpoint, the relationships that were shown to
exist between the various independent variables and the propensity of airport security
directors to adopt biometric technology for airport access control further validate
previous studies regarding technology and innovation adoption by suggesting that
compatibility, voluntariness, relative advantage, perceived ease of use, and image are all
important factors to consider with examining the propensity of airport security directors
to adopt biometric technology for airport access control.
113
8. DISCUSSION AND CONCLUSION
This chapter discusses the contributions of the study, the limitations of this study
and suggestions for further research in this area. First, a detailed discussion of the study’s
contributions, both theoretical and practical, will be provided. Then, the limitations of the
dissertation are addressed, followed by suggestions that this study may provide for future
research.
8.1. Contributions
This study contributes to the growing literature regarding airport security and the
role that biometric systems are deemed to have in heightening that security. After
September 11th, 2001, the area of airport security came under extreme scrutiny. The
literature surrounding the need for increased airport security and the appropriate
mechanisms for success, while growing, has been based primarily on tentative arguments
and less on empirical data. This study’s primarily contribution is to offer the only
nationwide study to empirically question airport security directors on their perceptions
regarding biometric systems and to statistically test hypotheses regarding the likelihood
of adoption of biometric systems by security directors for airport access control.
Theoretically, this study adds credence to previous studies regarding technology
adoption conducted by Rogers (1995), Moore and Benbasat (1991), and Jeyaraj et al
(2006) by suggesting that compatibility, voluntariness, relative advantage, perceived ease
of use, and image are important factors regarding the acceptance of biometric technology.
This study also suggests, irrespective of Jeyaraj et al (2006), that demographic and
organizational factors, along with perceived cumbersomeness, are not associated with
biometric systems adoption for airport access control. Further, this study empirically
114

strengthens the theories of Total Quality Management (TQM) and Diffusion of
Innovation, with its added theories of Individual Innovativeness and Perceived Attributes,
by suggesting that airport security directors are essential in the adoption of biometric
systems and that variables associated with these theories such as compatibility,
voluntariness, relative advantage, perceived ease of use, and image are relevant for
technology adoption. Additionally, this study highlights that the survey instrument
designed by Moore and Benbasat (1991) was generalizable to include biometric
technology as an innovation that could examined and perceptions about adopting
biometric technology measured. Therefore, the same survey instrument could be utilized
to examine the use of biometric technology in other areas outside the realm of airport
security.
This study also has practical contributions. A strength of this study lies in the fact
that it can provide a practical guideline for the adoption and implementation of biometric
systems for increased security at airport access points. By utilizing the results of this
study, national regulators, such as TSA, can tangibly assess the perceptions that airport
security directors have towards biometric applications and can, therefore, develop
practical working solutions for guidance and support. Further, by utilizing the results of
this study, vendors who deal in the business of biometric applications can determine the
most beneficial and least beneficial systems deemed essential for airport security by the
security directors themselves.
Further practical contributions of this study can be found in the fact that it
provides a starting point as to the factors that influence adoption; what airport security
directors value and what they perceive as important. The knowledge of these factors is
115

important because it highlights those factors of biometric technology that should be
promoted and those factors about which more guidance and information should be
provided to increase the propensity of adoption of biometric technology for access
control.
8.2. Limitations
Like all studies, this study had several limitations. One of the limitations of this
study could be found in the fact that a response rate of fewer than 50% was achieved. The
response rate of this study was 34.5%. The low response rate for this study could be
attributed to several factors. First, this study dealt with the important and ever changing
issue of airport security. The survey included questions that could be considered
“sensitive” in nature. During the duration of this study, the researcher was contacted by
four airport security directors who stated that they would not participate in this study
because they considered the survey responses to be “secure information”. Although the
researcher informed all potential respondents that the survey results would be anonymous
and reported only in aggregate form, it is believed that several potential respondents
simply felt that answering a survey based on questions related to airport security would
violate their security procedures.
A second factor that could be attributed to the low response rate was the terrorist
bombing plot that occurred in London on August 9, 2006. The terrorist plot, although
foiled in Lonon, affected U.S. airport security polices and procedures. For example,
liquids were banned from passing through airport security checkpoints in the U.S.
because the terrorists in the London plot planned to use liquid explosives to carry out
their acts of terrorism. U.S. airport security was tightened and information regarding
116
airport security became more secure and sensitive in nature. The terrorist plot could have
affected the response rate for those in the second round of surveying due to the fact that
airport security directors became more reluctant to share any information regarding
security policies and procedures. While the response rate for this study could be
considered low, due to the fact that this study was conducted on a national scale
generalizability is not considered a major limitation in this study.
Another minor limitation of this study could be seen in the fact that Airport
Council International – North America assisted in providing mailing address and email
addresses for a portion of the airport security directors asked to participate in this study.
While this sample could be viewed as non-random in its selection, it is not considered to
have effect on the generalizability of this study due to the fact that the respondents that
participated represented airports from across the county and from across airport
categories and sizes.
8.3. Future Research
As in all studies, this study highlights that there are many additional areas of
research and consideration that can be explored with regard to biometric technology for
airport access control. The first is that this study could be conducted on a global scale
rather than limited to only United States airports. The use of email distribution and that
ability of participants to respond via a web-based survey would allow for a quick, easy,
confidential, and inexpensive method to survey airport security directors world-wide on
their propensity to adopt biometric technology for airport access control. The responses
from a global survey could be compared and/or contrasted to the response generated by
117

this study which would make the responses generalizable on a world-wide scale rather
than to just those airports in the United States.
An additional avenue of research could be a pre-implementation study. Within
this study, nearly 10% of respondents estimated that biometric technology would be the
primary method of access control in their airports within 1-2 years. This study could
serve as a pre-implementation benchmark providing information on attitudes before the
implementation on biometric technology for airport access control occurs. Surveying
those airports after the implementation of biometric technology would further enrich the
literature regarding the use of biometric technology for airport access control.
Finally, as previously mentioned, this study highlights that the survey instrument
designed by Moore and Benbasat (1991) is generalizable and can be used to measure the
perceptions of adopting biometric technology. Therefore, the survey instrument used in
this study could be used to measure the perceptions and the propensity to adopt biometric
technology by those outside the realm of airports. For example, decision makers any area
in which biometric technology could be implemented into an access control system could
be surveyed via the instrument used in this study. Hospitals, ports, government buildings,
and nuclear plants are all examples of facilities that could potentially use biometric
technology for access control purposes. Decision makers at each of these locations
represent a population whose propensity to adopt biometric technology could be
measured and examined.
8.4. Conclusion
The events of 9/11 placed airport security in the United States at the forefront of
the domestic agenda. Although hundreds of airports exist in the United States, a
118

disruption at one airport resulting for a criminal act, including terrorism, would have an
enormous impact on social and economic functions of the United States. While there are
numerous methods for controlling access to secure airport areas, those currently in use
are limited due to the fact that they cannot positively identify that the person actually
accessing the secure area is authorized to be there. While biometric technology offers the
capability of positively identifying and verifying the identity of airport employees, its use
in the airport environment is limited. Due to the fact that there is a paucity of empirical
literature regarding the use of biometric technology for airport access control, this study
is timely and augments the current literature in this area. Additionally, this study provides
both a frequency analysis, which illustrates the various levels of familiarity and overall
understanding that airport security directors have biometric technology, and correlation
analysis, which suggests that compatibility, voluntariness, relative advantage, perceived
ease of use, and image are all important factors to consider with examining the propensity
of security directors to adopt biometric technology for airport access control.
Due to the vast amount of information that this study provides, the study can be
utilized by decision makers such as the TSA, airport security directors and managers,
biometric companies, and other biometric researchers when examining the
implementation of biometric systems and the factors that influence that implementation.
119

APPENDIX: RESPONSES TO OPEN-ENDED QUESTIONS
120
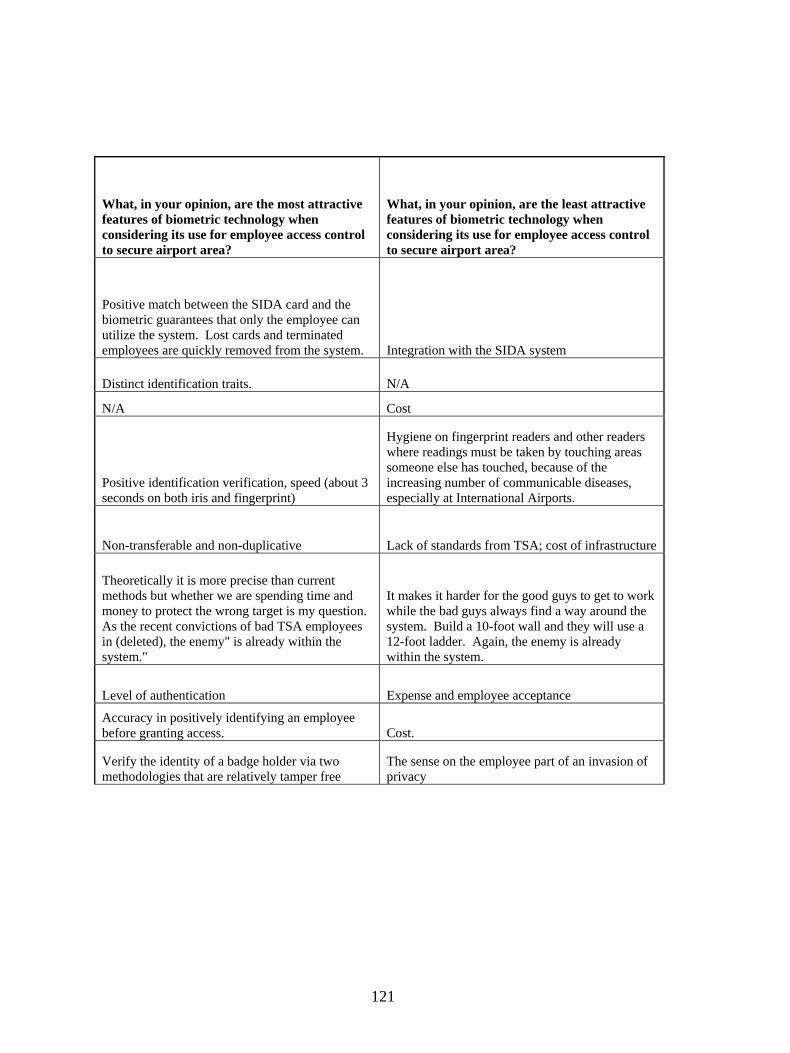
What, in your opinion, are the most attractive features of biometric technology when considering its use for employee access control to secure airport area?
What, in your opinion, are the least attractive features of biometric technology when considering its use for employee access control to secure airport area?
Positive match between the SIDA card and the biometric guarantees that only the employee can utilize the system. Lost cards and terminated employees are quickly removed from the system. Integration with the SIDA system
Distinct identification traits. N/A
N/A Cost
Positive identification verification, speed (about 3 seconds on both iris and fingerprint)
Hygiene on fingerprint readers and other readers where readings must be taken by touching areas someone else has touched, because of the increasing number of communicable diseases, especially at International Airports.
Non-transferable and non-duplicative Lack of standards from TSA; cost of infrastructure
Theoretically it is more precise than current methods but whether we are spending time and money to protect the wrong target is my question. As the recent convictions of bad TSA employees in (deleted), the enemy" is already within the system."
It makes it harder for the good guys to get to work while the bad guys always find a way around the system. Build a 10-foot wall and they will use a 12-foot ladder. Again, the enemy is already within the system.
Level of authentication Expense and employee acceptance
Accuracy in positively identifying an employee before granting access. Cost.
Verify the identity of a badge holder via two methodologies that are relatively tamper free
The sense on the employee part of an invasion of privacy
121
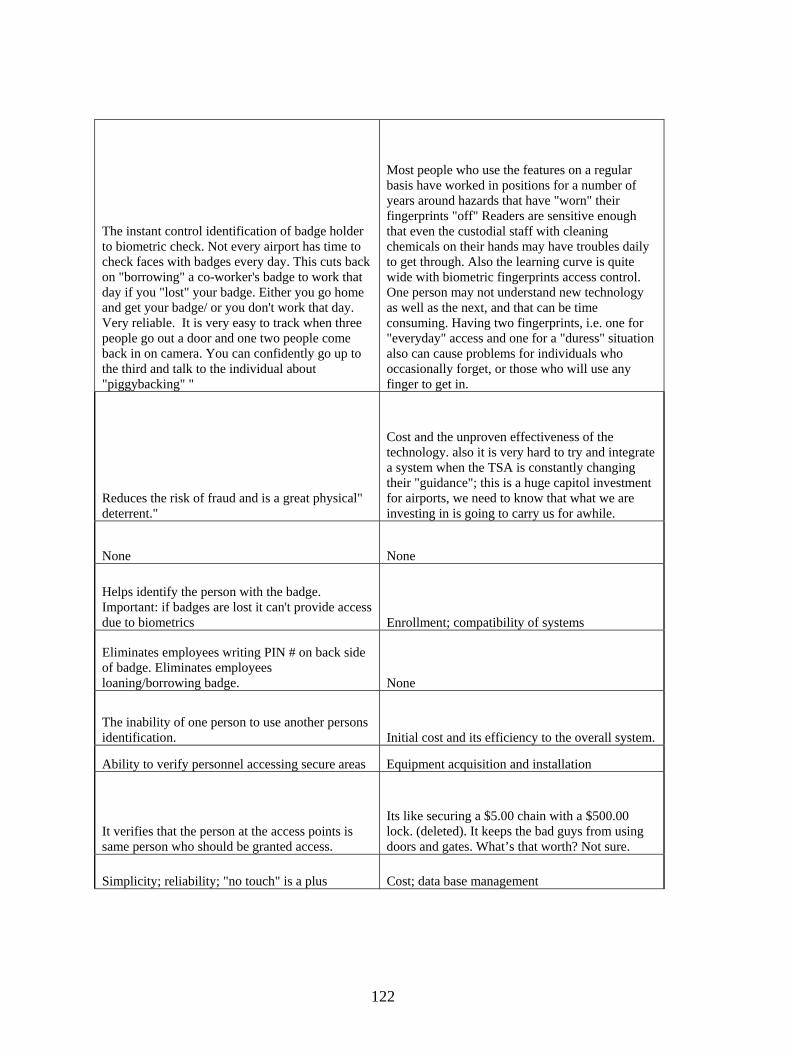
The instant control identification of badge holder to biometric check. Not every airport has time to check faces with badges every day. This cuts back on "borrowing" a co-worker's badge to work that day if you "lost" your badge. Either you go home and get your badge/ or you don't work that day. Very reliable. It is very easy to track when three people go out a door and one two people come back in on camera. You can confidently go up to the third and talk to the individual about "piggybacking" "
Most people who use the features on a regular basis have worked in positions for a number of years around hazards that have "worn" their fingerprints "off" Readers are sensitive enough that even the custodial staff with cleaning chemicals on their hands may have troubles daily to get through. Also the learning curve is quite wide with biometric fingerprints access control. One person may not understand new technology as well as the next, and that can be time consuming. Having two fingerprints, i.e. one for "everyday" access and one for a "duress" situation also can cause problems for individuals who occasionally forget, or those who will use any finger to get in.
Reduces the risk of fraud and is a great physical" deterrent."
Cost and the unproven effectiveness of the technology. also it is very hard to try and integrate a system when the TSA is constantly changing their "guidance"; this is a huge capitol investment for airports, we need to know that what we are investing in is going to carry us for awhile.
None None
Helps identify the person with the badge. Important: if badges are lost it can't provide access due to biometrics Enrollment; compatibility of systems
Eliminates employees writing PIN # on back side of badge. Eliminates employees loaning/borrowing badge. None
The inability of one person to use another persons identification. Initial cost and its efficiency to the overall system.
Ability to verify personnel accessing secure areas Equipment acquisition and installation
It verifies that the person at the access points is same person who should be granted access.
Its like securing a $5.00 chain with a $500.00 lock. (deleted). It keeps the bad guys from using doors and gates. What’s that worth? Not sure.
Simplicity; reliability; "no touch" is a plus Cost; data base management
122

It would start the upgrade of technology into the State systems and allow for other technological upgrades outside of access controls to better the airport operations and controls as a whole. Using modern technology improves users commitments and belief that seriousness or threat is real and that we are serious and have the means and ability to control and catch violators.
Infrastructure support and maintenance required for most government public facilities which rely on legislative funding or approvals to obtain and maintain systems and support. The most powerful persons in government are engineers and consultants who dictate systems to obtain and utilize.
I haven't been able to determine attractive features at this point.
When we ran tests at (deleted) we had outside weather problems with biometric readers.
Positive control None Access to secure areas. Maintenance Verification Enrollment and speed of access Positive identification; potential decrease cost for manpower requirements Cost; maintainability
Better chance of catching piggybackers. ID cards can be stolen and used, but biometrics cannot
Still a lot to learn; price; time it takes to implement; assurance of security of records. So many still fear biometrics, therefore, are hesitant to jump in early
Positive control of employee population; decrease in piggyback violations; public acceptance and increased credibility on the part of stakeholders in the use of cutting edge technology; the ability to automate manned portals through the use of biometrics reduces staffing by leveraging technology.
With the exception of facial recognition, biometrics relies exclusively on the use of technology to accomplish increased security. It may be too fragile. Redundancy needed, back-up systems needed, etc.
Positive identification of individuals Finding the funding
Provides an additional layer of security to ensure the individual granted unescorted access authority is that individual Training and integration with the current system
Public perception. Higher level of security
Cost, both up front and long term operation and maintenance. Employee reluctance to accept the program.
High level of fraud protection False positives (i.e. reliability)
It raises the reliability that the employee entering the secure area is actually the employee
For my airport, it would be the large number of access points used by employees
Secure verification of identity; public perception; ease of use
Cost of initial implementation; training of employees
123

Depending on the technology used, it provides a reliable secondary identifier Up keep and maintenance
Adds a measure of certainty regarding control over access. Removes the need for an obsolete swipe card system
$1-2 million in cost and increased training and maintenance requirements.
Matching access authorization to the holder of the access media Cost
Positive ID Undecided if the cost involved will match the benefit
Positive ID, accountability, T & A Cost, infrastructure costs, maintenance, durability, perimeter security
Grants access to an individual not merely a card
Difficulty in dealing with rejected, non-readable biometrics as well as various environmental conditions
More secure Money and time To my knowledge the inability to steal or utilize other persons access media Unreliable technology (or unproven at this point)
Enhanced security Cost to implement
Verify identity Cumbersome; how to handle groups of individuals in a vehicle
Cannot gain access with someone else's card; perception by public that airport is more secure
Getting employees enrolled/accepting new technology; determining best solution to use; cost
You know who is where and when To expensive and complicated for smaller airports
Helps identify the person with the badge. Important: if badges are lost it can't provide access due to biometrics enrollment; compatibility of systems
N/A Technology
Assures that the individual that has been fingerprinted and trained is the individual that is actually using the ID
Inability to positively "match" employee instantly to biometric identifiers and failing to open the door
Will assure interdiction of anyone who obtains unauthorized access into a secure area Cost; training; monitoring of such technology
Improved accountability for insuring that only the authorized badge holder is using it for access Firmware and software reliability of new systems
It would eliminate proximity cards and access cards. Hopefully biometrics would be better type of security access control then the present system
Because we are a small airport, cost would be the controlling issue.
124
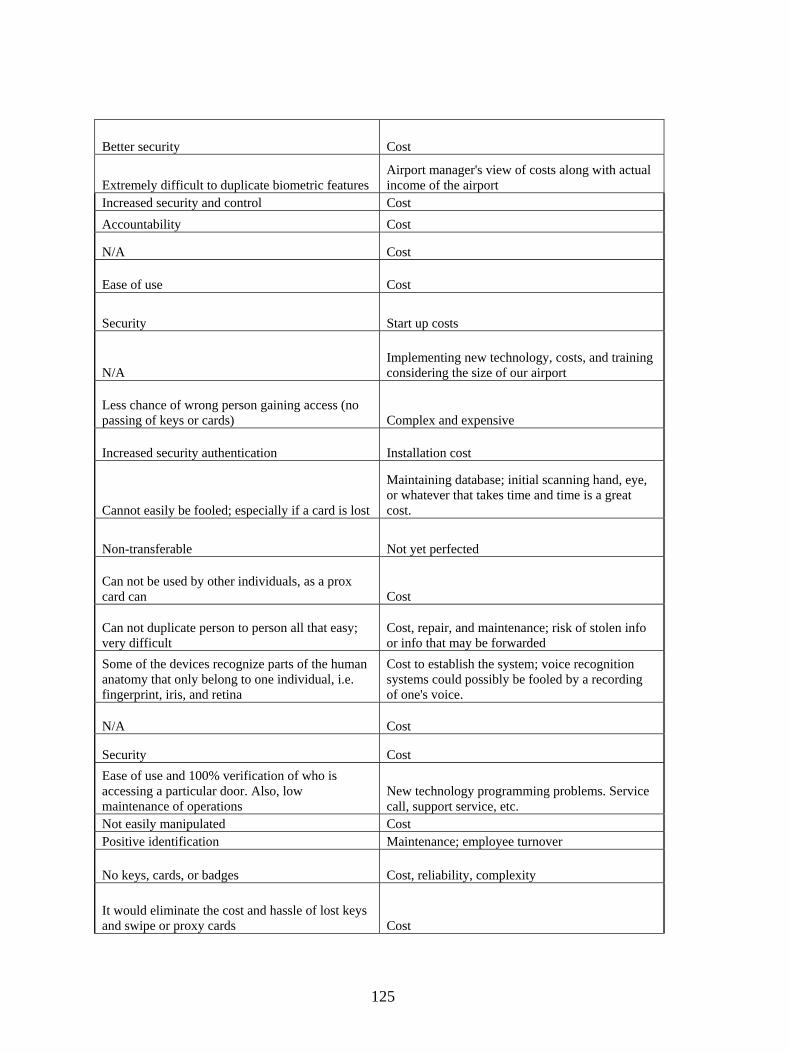
Better security Cost
Extremely difficult to duplicate biometric features Airport manager's view of costs along with actual income of the airport
Increased security and control Cost Accountability Cost
N/A Cost
Ease of use Cost
Security Start up costs
N/A Implementing new technology, costs, and training considering the size of our airport
Less chance of wrong person gaining access (no passing of keys or cards) Complex and expensive
Increased security authentication Installation cost
Cannot easily be fooled; especially if a card is lost
Maintaining database; initial scanning hand, eye, or whatever that takes time and time is a great cost.
Non-transferable Not yet perfected
Can not be used by other individuals, as a prox card can Cost
Can not duplicate person to person all that easy; very difficult
Cost, repair, and maintenance; risk of stolen info or info that may be forwarded
Some of the devices recognize parts of the human anatomy that only belong to one individual, i.e. fingerprint, iris, and retina
Cost to establish the system; voice recognition systems could possibly be fooled by a recording of one's voice.
N/A Cost
Security Cost Ease of use and 100% verification of who is accessing a particular door. Also, low maintenance of operations
New technology programming problems. Service call, support service, etc.
Not easily manipulated Cost Positive identification Maintenance; employee turnover
No keys, cards, or badges Cost, reliability, complexity
It would eliminate the cost and hassle of lost keys and swipe or proxy cards Cost
125
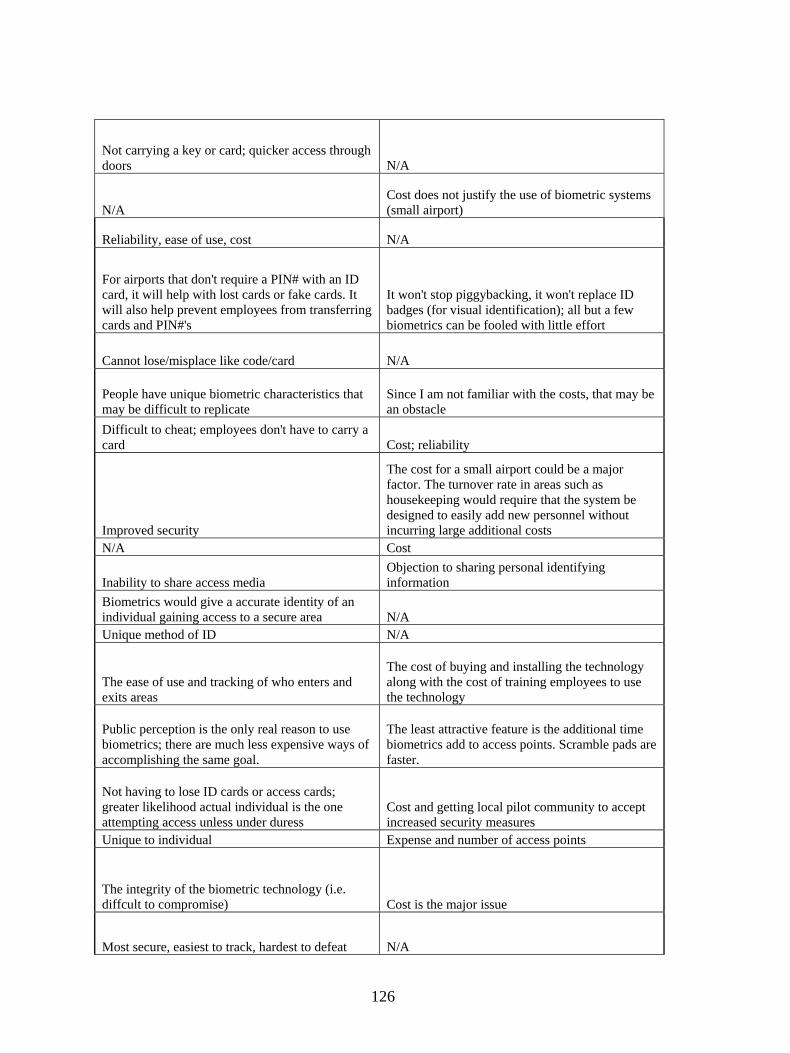
Not carrying a key or card; quicker access through doors N/A
N/A Cost does not justify the use of biometric systems (small airport)
Reliability, ease of use, cost N/A
For airports that don't require a PIN# with an ID card, it will help with lost cards or fake cards. It will also help prevent employees from transferring cards and PIN#'s
It won't stop piggybacking, it won't replace ID badges (for visual identification); all but a few biometrics can be fooled with little effort
Cannot lose/misplace like code/card N/A
People have unique biometric characteristics that may be difficult to replicate
Since I am not familiar with the costs, that may be an obstacle
Difficult to cheat; employees don't have to carry a card Cost; reliability
Improved security
The cost for a small airport could be a major factor. The turnover rate in areas such as housekeeping would require that the system be designed to easily add new personnel without incurring large additional costs
N/A Cost
Inability to share access media Objection to sharing personal identifying information
Biometrics would give a accurate identity of an individual gaining access to a secure area N/A Unique method of ID N/A
The ease of use and tracking of who enters and exits areas
The cost of buying and installing the technology along with the cost of training employees to use the technology
Public perception is the only real reason to use biometrics; there are much less expensive ways of accomplishing the same goal.
The least attractive feature is the additional time biometrics add to access points. Scramble pads are faster.
Not having to lose ID cards or access cards; greater likelihood actual individual is the one attempting access unless under duress
Cost and getting local pilot community to accept increased security measures
Unique to individual Expense and number of access points
The integrity of the biometric technology (i.e. diffcult to compromise) Cost is the major issue
Most secure, easiest to track, hardest to defeat N/A
126
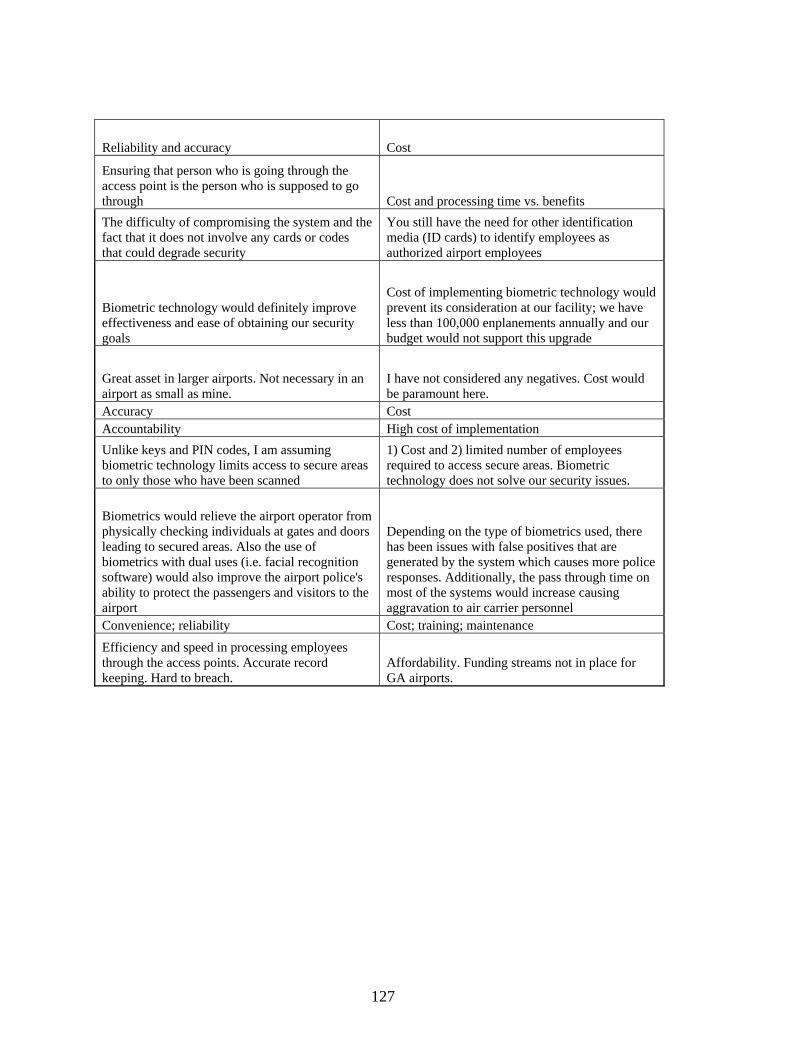
Reliability and accuracy Cost
Ensuring that person who is going through the access point is the person who is supposed to go through Cost and processing time vs. benefits The difficulty of compromising the system and the fact that it does not involve any cards or codes that could degrade security
You still have the need for other identification media (ID cards) to identify employees as authorized airport employees
Biometric technology would definitely improve effectiveness and ease of obtaining our security goals
Cost of implementing biometric technology would prevent its consideration at our facility; we have less than 100,000 enplanements annually and our budget would not support this upgrade
Great asset in larger airports. Not necessary in an airport as small as mine.
I have not considered any negatives. Cost would be paramount here.
Accuracy Cost Accountability High cost of implementation Unlike keys and PIN codes, I am assuming biometric technology limits access to secure areas to only those who have been scanned
1) Cost and 2) limited number of employees required to access secure areas. Biometric technology does not solve our security issues.
Biometrics would relieve the airport operator from physically checking individuals at gates and doors leading to secured areas. Also the use of biometrics with dual uses (i.e. facial recognition software) would also improve the airport police's ability to protect the passengers and visitors to the airport
Depending on the type of biometrics used, there has been issues with false positives that are generated by the system which causes more police responses. Additionally, the pass through time on most of the systems would increase causing aggravation to air carrier personnel
Convenience; reliability Cost; training; maintenance
Efficiency and speed in processing employees through the access points. Accurate record keeping. Hard to breach.
Affordability. Funding streams not in place for GA airports.
127
REFERENCES:
ACI. (2005). The application of biometrics at airports. Position paper. Geneva: ACI
World Headquarters. [Online]. Available: http://www.airports.org/aci/aci/file/
Free%20docs/ACI%20Biometric%20Position%20FINAL.pdf
Agoes, C. (1997). Institutional Resistance to Organizational Change: Denial, Inaction,
and Repression. Journal of Business Ethics, vol 16, pp. 917-931.
Akbulut, A. (2003). “An Investigation of the Factors that Influence Electronic
Information Sharing Between States and Local Agencies.” Dissertation Louisiana
State University.
Allman, G. and Bates, J. (2003). Biometrics on Trial. Airport World. 7(1), 41-44.
Anderson, T. (2002). Flying In The Face of Danger. Security Management
Online [Online]. Available: http://www.securitymanagement.com/library/
001245.html. {last accessed: July, 2004}.
Anthes, G. H. (1998). Promising Technology Has Yet To Gain Wide Acceptance.
Computer World: Quick Study. [Online]. Available:
http://www.computerworld.com/news/1998/story/ 0,11280,32949,00.html. {last
accessed: July, 2004}.
Barnett, W.P. & Carroll, G.R. (1995). Modeling Internal Organizational Change. Annual
Review of Sociology, vol 21, pp. 217-236.
128

Bernard, R. (2003). Access Control and Security Systems. Transportation
Security [Online].Available: http://transportationsec.com/ar/security_destination
_controlled_access. {last accessed: July, 2004}.
Bovey, W. H. & Hede, A. (2001). Resistance to Organizational Change: The Role of
Cognitive and Affective Processes. Leadership and Organizational Development
Journal, vol 22(8), pp 372-382.
Brown, A.S. (2006). Airport security: still fighting the last war. Homeland Response,
electronic journal. [Online]. Available: www.homelandresponse.org. Accessed:
May 22, 2006.
Burns, B. (1996). No Such Thing As…”A One Best Way” to Manage Organizational
Change. Management Decision, vol 34(10), pp. 11-18.
Chan, S.L. (2002). Information Technology in Business Processes. Business Process
Management Journal, vol. 6 (3), pp. 224-237.
Chin, W.W. (1998). Issues and Opinion on Structural Equation Modeling. Management
Information Systems Quarterlyy, Vol.22(1), pp. 1-12.
Coleman, S. (2000). Biometrics. The FBI Law Enforcement Bulletin, 69(6), 9-20.
Committee on Science and Technology for Countering Terrorism: National
Research Council of the National Academies. (2002). Making the Nation Safer:
The Role of Science and Technology in Countering Terrorism. Washington,
D.C.: The National Academies Press.
CoreStreet Ltd. (2005). Manageable Secure Physical Access. [Online].
Available: http://www.corestreet.com/whitepapers/w03-03v4-manageable_
secure_phys_access.pdf. {last accessed: Jan, 2005}.
129

Coughlin, C.C.; Cohen, J.P.; and Khan, Sarosh, R. (2002). Aviation
Security and Terrorism: A Review of The Economic Issues. St. Louis: The
Federal Reserve Bank.
Dahlgaard, J.J., Kristensen, K., & Kanji, G.K. (1994). Advances in Total Quality
Management: The Quality Journey, A Journey Without an End. Oxfordshire:
Carfax Publishing Company.
Davis, F.D, Bagozzi, R.P., & Warshaw, P.R. (1989). User Acceptance of
Computer Technology: A Comparison of Two Theoretical Models. Management Science, vol 35(8), pp. 982-1003.
Dean, J. W. & Evans, J.R. (1994). Total Quality: Management, Organization, and
Strategy. St. Paul: West Publishing Company.
Deming, W. E. (1982). Quality, Productivity, and Competitive Position. Massachusettes:
MIT Centre For Advanced Engineering.
Deming, W. E. (1986). Out of Crisis. Cambridge: Cambridge University Press.
Department of Homeland Security (2004). Travel and Transportation.
[Online]. Available: www.dhs.gov/dhspublic/theme_home3.jsp.
Desertnews.com (2005). Twins Charged in Airport Breach. [Online].
Available: http://deseretnews.com/dn/view/0,1249,600133314,00.html.
Dillingham, G.L. (2003). Aviation Security: Progress Since September 11,
2001, and the Challenges Ahead. In J. Zellan (Ed.), Aviation Security: Current
Issues and Development (pp. 1-21). New York: Nova Science, Inc.
130
Drucker, P.F. (1974). Management: Tasks, Responsibilities, and Practice.
London: Heinemann Publishing.
Drucker, P. F. (1989). Managing for Results. London: Heinemann Publishing.
Eisenburg, D. (2001). How Safe Can We Get? Time. 158(13), 85-91.
European Aeronautics Science Network (2004). Airports. [Online].
Available: www.easn.net/easn/Aeronautical%20R&T/08_airports.html#4.
Etzioni, A. (1999). Identification Cards In America. Society. 36(1), 70-77.
Fichman, R.G.(1999). The Diffusion and Assimilation of Information Technology
Innovations. In R.W. Zmud (Ed), Framing the Domains of IT Management:
Projecting the Future Through the Past. Ohio: Pinnaflex Educational Resources,
Inc.
Findbiometrics. (2004). Biometric leader, Recognition Systems Inc.,
Receives Two Frost and Sullivan Awards for Leadership in the Global Markets.
[Online]. Available:http://findbiomerics.com/viewnews.php?id=1176. {last
accessed: Nov, 2004}
Gatiss, G. F. (1996). Total Quality Management: A Total Quality Approach. New
York: Cassell Publishing.
Gonzalez-de la Parra, M. & Rodriguez-Loaiza, P. (2006). Using Structural Equation
Modeling (SEM) for the Study of Impurity Profiles of Drug Substances. Quality
Engineering, Vol.18, pp. 225-235.
Goo, S. (2003). Airport Security Remains Porous, Screens Depart, Officials Alarmed.
Washingtonpost.com.[Online]. Available:
http://voicesofsept11.org/security/062203.php. {last accessed: Jan, 2003}.
131

Grover, V. (1993). An Empirically Derived Model for the Adoption of
Customer-Based Interorganizational Systems. Decision Science, 24 (3), pp. 603 –
640.
Handy, C. (1976). Understanding Organizations. London: Penguin Books.
Handy, C. (1986). The Future of Work. Oxford: Basil Blackwell
Hayes, W. (2004). Seeing Around Corners: Crafting the New Department
of Homeland Security. Review of Policy Research, 21(3), 369-391.
Hoge, J.F. and Rose, G. (Eds.). (2001). How Did This Happen? Terrorism
and the New War. New York: Public Affairs.
Horan, T.A., Tulu, B., Hilton, B., & Burton, J. (2004). Use of Online Systems in
Clinical Medical Assessments: An Analysis of Physician Acceptance of Online Disability Evaluation Systems. IEEE. Proceedings of the 37th Hawaii International Conference on System Sciences.
Hurt, T.H., and Hubbard, R. (1987). The Systematic Measurement of the
Perceived Characteristics of Information Technologies: Microcomputers as Innovations. Proceedings at that ICA Annual Conference; Montreal, Quebec.
Immigration and Naturalization Service. (1998). INS Passenger Accelerated Service
System. FactSheet.[Online]. Available:http://www.rapidimmigration.com
/www/News/news_13.html. {last accessed: July, 2004}.
Institute for Security Technology Studies (2003). Investigative Research
for Infrastructure Assurance (IRIA) Group: On the Road to Transportation
Security. [Online]. Available: www.ists.dartmouth.edu/library/analysis/trans.pdf.
{last accessed: Jan, 2005).
132

International Biometrics Group. (2001). After the Terrorists Attacks: What
could biometrics have done? What might they do in the future? [Online].
Available: http://www.biometricsgroup.com. {last accessed: Aug, 2003}.
Jeyaraj, A., Rottman, J.W., Lacity, M.C. (2006). A review of the predictors, linkages, and
biases in IT innovation adoption research. Journal of Information Technology,
22(1), pp. 1-23.
Kimberly, J.R. and Evanisko, M.J. (1981). Organizational innovation: the influence of
individual, organizational, and contextual factors on hospital adoption of technical
and administrative innovations. Academy of Management Journal, 24 (3) pp. 689-
713.
Lazarick, R. (1998, June). Airport Vulnerability Assessment: An Analytical
Approach. Proceedings of the NDIA Security Technology Symposium, pg: 218-
226.
Liu, S. and Silverman, M. (2001). A Practical Guide to Biometric Security
Technology. [Online]. Available: http: //www.computer.org/itpro/homepage
/Jan_Feb/Security3.htm. {last accessed: July, 2004}
Mascarenhas, B. (1991). Adoption, discontinuation, and retention of a capital good
innovation. Journal of Management Studies, 28 (1), pp. 91-101.
Moore, G.C. and Benbasat, I. (1991). Development of an Instrument to Measure the
Perceptions of Adopting an Information Technological Innovation. Information
Systems Research, 2 (3), pp. 192 – 222.
133

Morrison, B. (2003). Exclusive: Workers Breach Airport Security. USA
Today.[Online]. Available:http://www.usa today.com/news
/nation/2002/04/24/Security-lapse.htm. {last accessed: June, 2004}.
Mulligan, T.P. (2002). Impacting Airport Safety and Security. Fire
Engineering, 155(2), 97-106.
National Commission on Terrorist Attacks Upon the United States (2004).
The Aviation Security System and the 9/11 Attacks (Staff Statement No.3).
Washington, D.C. [Online]. Available: www.fas.org/irp/congress/2004_rpt/
staff_statement_3_pdf. {last accessed: Jan, 2005}.
National Safe Skies Alliance. (2001). A Technical Guide to Implementing
Biometrics at Domestic Airports.
Nanavati, S., Thieme, M., and Nanavati, R. (2002).Biometrics: Identity
Verification in a Networked World. New York: John Wiley & Sons, Inc.
Nedovic-Budic, Zorica (1998). The Likelihood of Becoming a GIS User.
URISA Journal, 10 (2).
Nelson, L. (2004). Privacy and Technology: Reconsidering a Crucial
Public Policy Debate in the Post-September 11th Era. Public Administration
Review. 64(3), 259-269.
Nilakanta, S., and Scamell, R.W.(1990). The Effects of Informations Sources and
Communication Channels on the Diffusion of an Innovation in a Data Base
Environment. American Journal of Sociology. 36(1) 24-20.
134

Office of Homeland Security (2002). The National Strategy for Homeland
Security: Office of Homeland Security. [Online]. Available:
www.whitehouse.gov/homeland/book/sect3-1.pdf.
Olmstead v. United States, 277 U.S. 428 (1928).
Peters, T. (1988). Thriving on Chaos. London: Macmillan.
Perry, S.C. (2003). What are your airport access control’s weak links?
LCN. [Online]. Available: http://www.lcnclosers.com/Whats_new_10_10_03.asp.
{last accessed: July, 2004}.
Prabhakar, S., Pankanit, S., and Jain, A. (2003). Biometric Recognition:
Security and Privacy Concerns. IEEE Security and Privacy. [Online].
http://biometrics.cse.Msu.edu/j2033.pdf. {last accessed: Nov, 2004}.
Premkumar, G, Ramamurthy, K, and Nilakanta, S. (1994). Implementation of Electronic
Data Interchange: An Innovation Diffusion Perspective. Journal of Management
Information Systems, 11 (2), pp. 157 – 186.
Price, W. (2004). Reducing the Risk of Terror Events at Seaports. Review
of Policy Research, 21(3), 329-349.
Rabkin, N.J.; Berrick, C.A.; Keisling, C. (2004, June). Aviation Security:
Further Steps Needed to Strengthen the Security of Commercial Airport
Perimeters and AccessControl. Report to Congressional Requesters.
(GAO-04-728). Washington: United States General Accounting
Office. [Online]. Available at: http://www.gao.gov/new.items/ d04728.pdf. {last
accessed: July 2004}
135
Radio Technical Commission for Aeronautics (RAND) (2002). Standards
for Airport Security Access Control Systems. (Paper No.258-02/sc199-027).
Washington, D.C.: RTCA, Inc.
Rogers, E.M. (1962). The Diffusion of Innovation. New York: The Free Press of
Glencoe.
Rogers, E.M. (1983). The Diffusion of Innovation: 3rd Edition. New York: Free
Press.
Rogers, E.M. (1995). The Diffusion of Innovation: 4th Edition. New York: Free Press.
Salant, J.D. (May 18, 2002). Some Airport Workers Bypass Security.
[Online]. Available: http://www.newsday. com/news/nationworld/wire/sns-ap-
airport-security0518may18.story. {last accessed: Jan, 2002}.
Segar, K. (2003). Deterring Terrorists: In A. Silke (Ed.), Terrorists, Victims,
and Society: Psychological Perspectives on Terrorism and its Consequences.
(pp. 257-269). England, U.K.: John Wiley and Sons, Ltd.
Shanks, N.E.L. and Bradley, A. L.W. (2004). Handbook of Checked
Baggage Screening: Advanced Airport Security Operations. London:
Professional Engineering Publishing.
136

Snyderwine, M. and Morray, D. (1999). Report on: O’Hare International
Airport’s Air Cargo Security Access System. In L.D. Sanson (Ed.), IEEE
International Carnahan Conference on Security Technology, Proceedings of the
Institute of Electrical and Electronics Engineers 33rd Annual 1999 International
Carnahan Conference On Security Technology, IEEE Catalog Number,
99CH36303, 210-226.
Spence, W.R. (1994). Innovation: The Communication of Change In
Ideas, Practices, and Products. New York: Chapman and Hall.
Stevens, D.; Schell, T.; Hamilton, T.; Mesic, R.; Brown,M.S.; Chan, E.W.;
Eisman, M.; Larson, E.V.; Schaffer, M.; Newson, B.; Gibson, J.; and Harris, F.
(2004). Near Term Options for Improving Security at Los Angeles International
Airport. Rand Corporation.
Swanson, E.B. (1994). Information Systems Innovation Among
Organizations. Management Science, 40(9), 1069-1092.
Tornatzky, L.G. and Klein, K.J. (1982). Innovation characteristics and innovation
adoption-implementation: a meta-analysis of findings. IEEE Transactions on
Engineering Management, 29 (1), pp. 28-45.
The 9/11 Commission (2004). 9/11 Commission Report: The Final Report
of the National Commission on Terrorist Attacks Upon the United States. Chaired
by T.H. Kean. ISBN 0-393-22671-3. New York: W.W. Norton and Company.
The White House (2003, September). Progress Report on the Global War
on Terrorism. Washington, D.C. [Online]. Available: http://www.whitehouse.gov
/homeland/progress/. {last accessed: Jan, 2005}.
137

Thom v. New York Stock Exchange, 306 F. Supp. at 1010 (1969).
Tornatzky, L.G. and Fleisher, M. (1990). The Process of Technological
Innovation. Lexington Books.
TSA (Transportation Security Administration). (2005). Guidance package: biometrics for
airport access control. Washington. U.S. Department of Homeland Security;
Transportation Security Administration, Release date: September 30, 2005.
Available: http://www.tsa.gov/interweb/assetlibrary/Biometrics_Guidance.pdf
U.S. Congress, Office of Technology Assessment. (January, 1992).
Technology Against Terrorism: Structuring Security. (NTIS No: PB92-152529).
Washington, D.C.: U.S. Government Printing Office.
U.S. Department of Homeland Security (DHS) Press Office. (October 16,
2003). TSA Awards Contracts to Unisys for Pilot Technologies to Strengthen
Access Control at 20 or More Airports. [Online]. Available: http://www.tsa.gov.
U.S. General Accounting Office (GAO). (2003). Technology Assessment:
Using Biometrics for Border Security. (Report No. GAO-03-174). [Online].
Available:http://www.gao.gov/new.items/d03174.pdf.
United States v. Edwards, 498 F. 2d 496 (1974).
Vishwanath, A., & Goldhaber, G.M. (2003). An Examination of the Factors
Contributing to Adoption Decisions Among Late-Diffused Technology Products. New Media & Society, vol 5(4), pp. 547-572.
Vito, G.F., and Holmes, R.M. (1994). Criminology: Theory, Research and
Policy. California: Wadsworth, Inc.
138

Waugh, W.L. Jr. (2004). Securing Mass Transit: A Challenge For
Homeland Security. Review of Policy Research, 21(3), 307-316.
Walen v. Roe, 429 U.S. 589 (1997).
Whelan-Berry, K.S., Gordon, J.R., & Hinings, C.R. (2003). Strengthening Organizational
Change Process: Recommendations and Implications From a Multilevel Analysis.
Journal of Applied Behavior Science, vol.39(2), pp. 186-207.
Wilson, J.R. (2002). Airport Security designs revolve around biometrics.
Military and Aerospace Electronics. [Online]. Available:
http://mae.pennnet.com/Articles/Articles_Display.cfm?Section=Archives&Subsec
tion=Display&ARTICLE_ID=153718. {Lasted accessed: Nov, 2004}.
Woodard, J.D. Jr., Orlans, N.M., and Higgins, P.T. (2003). Biometrics:
Identity Assurance in the Information Age. New York: McGraw-Hill/Osborne.
Yates, B.L. (2001). Applying Diffusion Theory: Adoption of Media Literacy
Programs in School. Paper presented at the International Communication
Association Conference, May 24-28, 2001. Washington, D.C.
139