airfield pavement management - florida-aviation … pavement condition analysis and evaluation ......
TRANSCRIPT
S T A T E W I D E
AirfieldPavementManagementP R O G R A M
A T E W I D E
F L O R I D A D E PA R T M E N T O F T R A N S P O R T A T I O NA V I A T I O N A N D S P A C E P O R T O F F I C E
DISTRICT 3 REPORTJUNE 2015

Pavement Evaluation Report –District 3Statewide Airfield Pavement Management Program
Table of Contents | 1
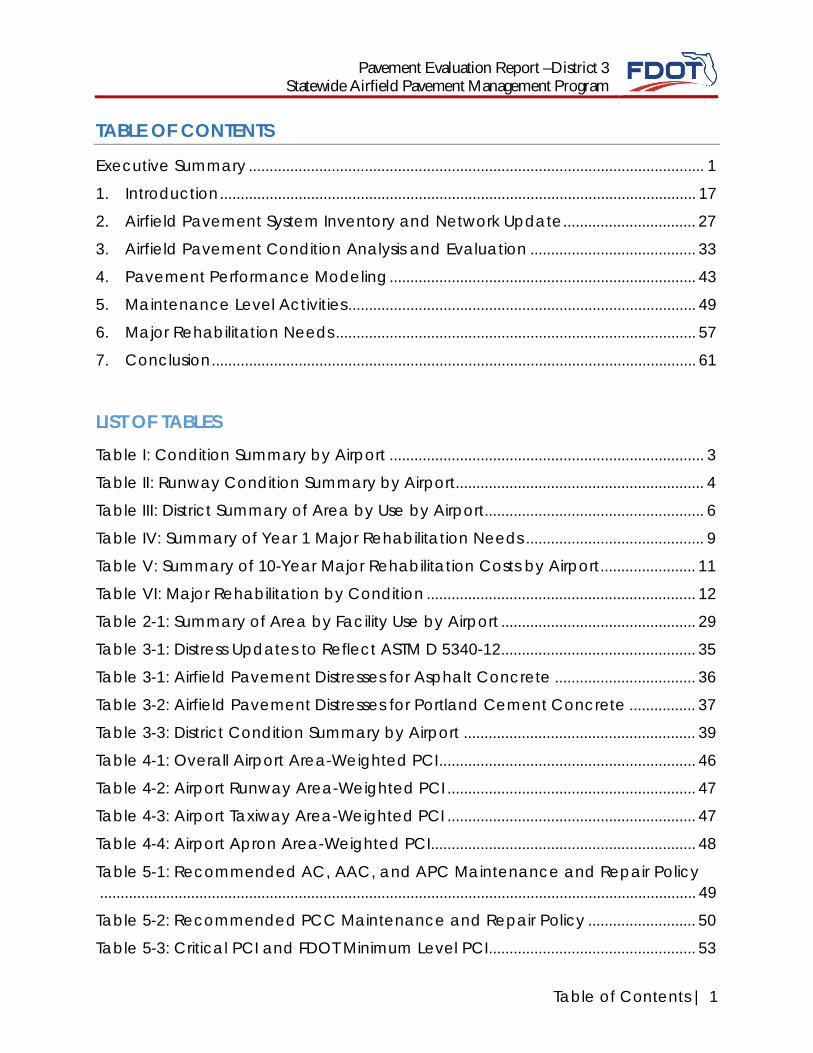
TABLE OF CONTENTS
Executive Summary .............................................................................................................. 1
1. Introduction ................................................................................................................... 17
2. Airfield Pavement System Inventory and Network Update ................................ 27
3. Airfield Pavement Condition Analysis and Evaluation ........................................ 33
4. Pavement Performance Modeling .......................................................................... 43
5. Maintenance Level Activities .................................................................................... 49
6. Major Rehabilitation Needs ....................................................................................... 57
7. Conclusion ..................................................................................................................... 61
LIST OF TABLESTable I: Condition Summary by Airport ............................................................................ 3
Table II: Runway Condition Summary by Airport............................................................ 4
Table III: District Summary of Area by Use by Airport..................................................... 6
Table IV: Summary of Year 1 Major Rehabilitation Needs ........................................... 9
Table V: Summary of 10-Year Major Rehabilitation Costs by Airport ....................... 11
Table VI: Major Rehabilitation by Condition ................................................................. 12
Table 2-1: Summary of Area by Facility Use by Airport ............................................... 29
Table 3-1: Distress Updates to Reflect ASTM D 5340-12 ............................................... 35
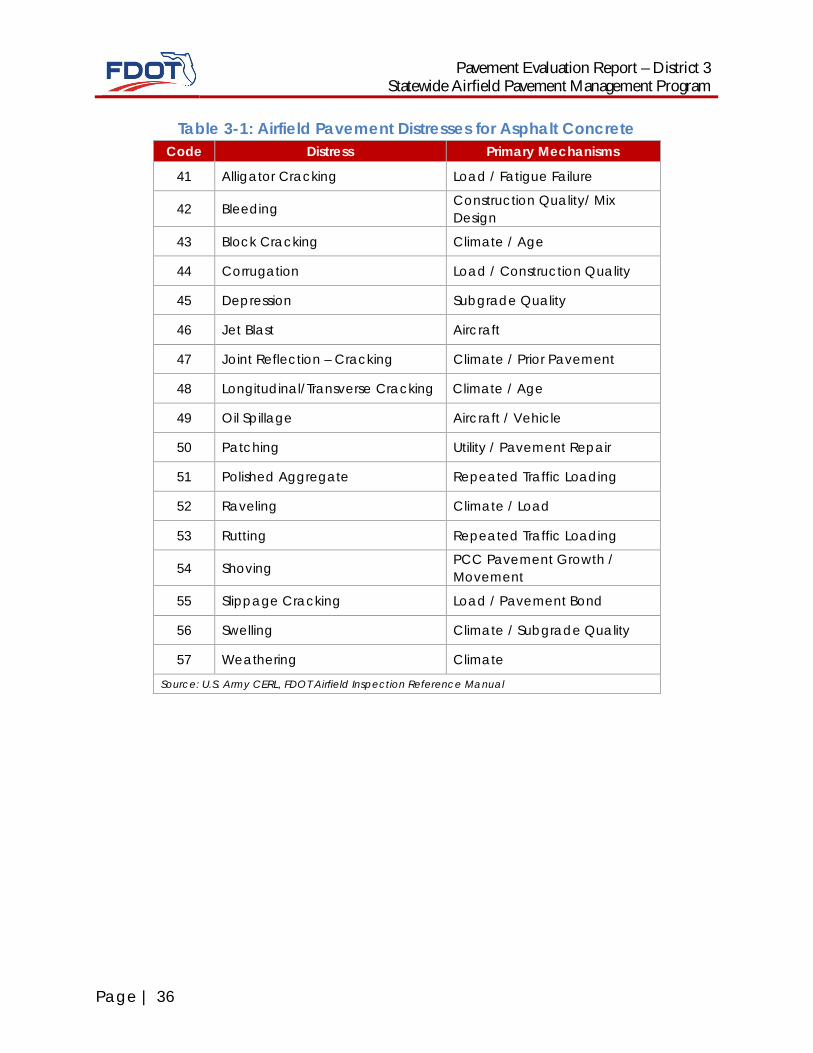
Table 3-1: Airfield Pavement Distresses for Asphalt Concrete .................................. 36
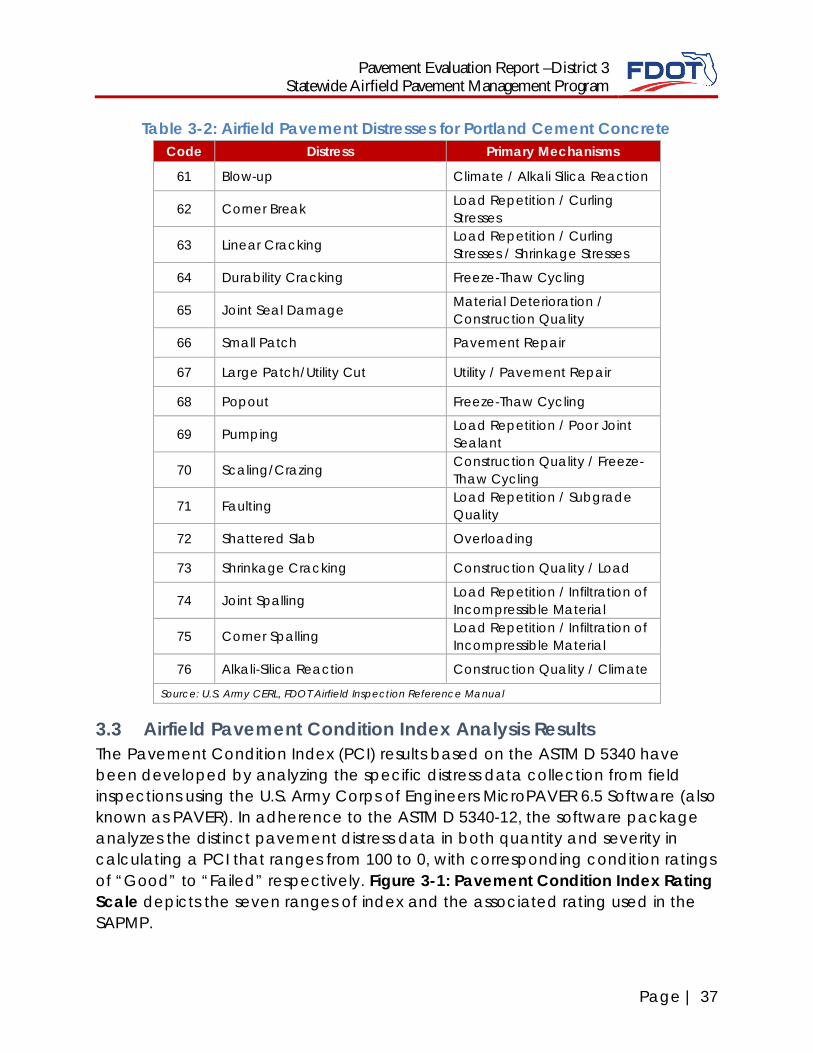
Table 3-2: Airfield Pavement Distresses for Portland Cement Concrete ................ 37
Table 3-3: District Condition Summary by Airport ........................................................ 39
Table 4-1: Overall Airport Area-Weighted PCI .............................................................. 46
Table 4-2: Airport Runway Area-Weighted PCI ............................................................ 47
Table 4-3: Airport Taxiway Area-Weighted PCI ............................................................ 47
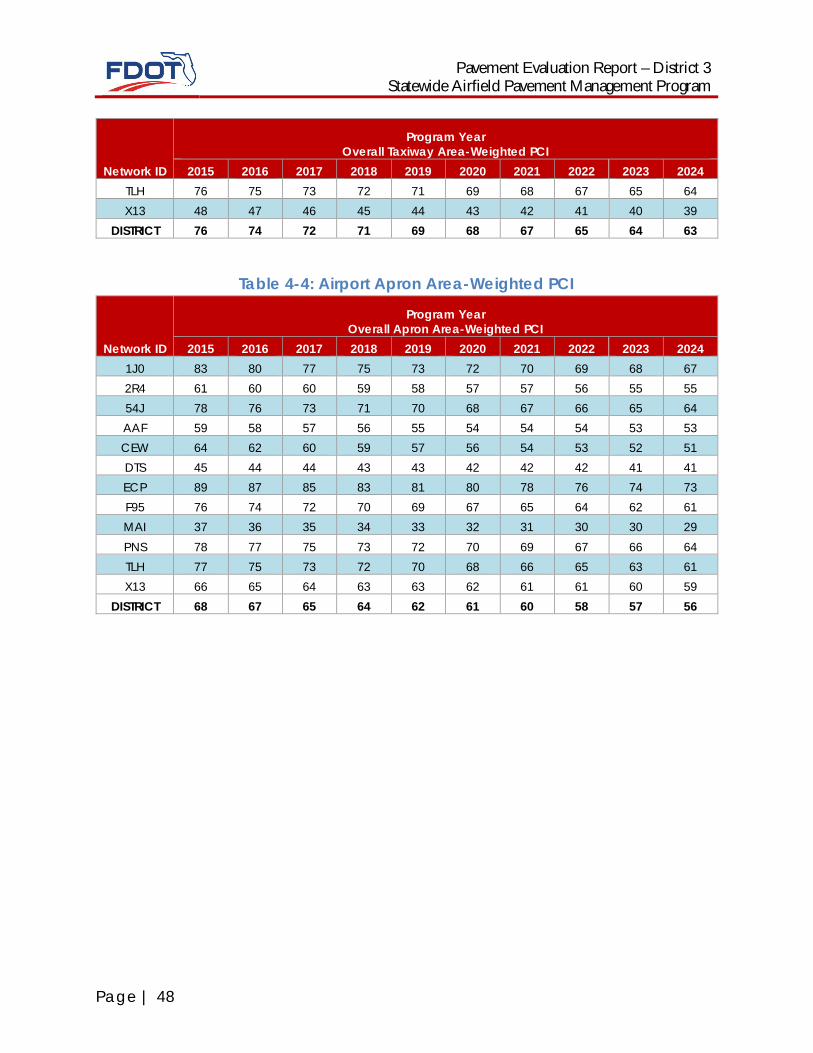
Table 4-4: Airport Apron Area-Weighted PCI................................................................ 48
Table 5-1: Recommended AC, AAC, and APC Maintenance and Repair Policy ................................................................................................................................................ 49
Table 5-2: Recommended PCC Maintenance and Repair Policy .......................... 50
Table 5-3: Critical PCI and FDOT Minimum Level PCI .................................................. 53
Pavement Evaluation Report – District 3Statewide Airfield Pavement Management Program
Table of Contents | 2
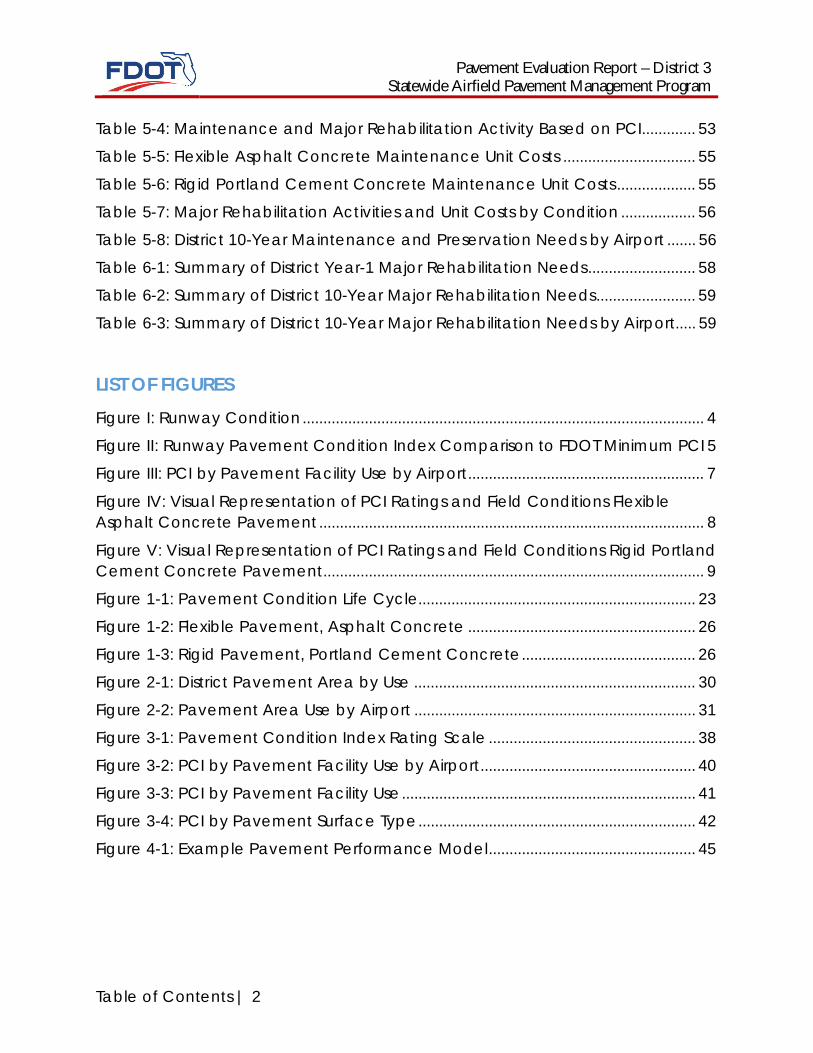
Table 5-4: Maintenance and Major Rehabilitation Activity Based on PCI ............. 53
Table 5-5: Flexible Asphalt Concrete Maintenance Unit Costs ................................ 55
Table 5-6: Rigid Portland Cement Concrete Maintenance Unit Costs ................... 55
Table 5-7: Major Rehabilitation Activities and Unit Costs by Condition .................. 56
Table 5-8: District 10-Year Maintenance and Preservation Needs by Airport ....... 56
Table 6-1: Summary of District Year-1 Major Rehabilitation Needs .......................... 58
Table 6-2: Summary of District 10-Year Major Rehabilitation Needs ........................ 59
Table 6-3: Summary of District 10-Year Major Rehabilitation Needs by Airport..... 59
LIST OF FIGURESFigure I: Runway Condition ................................................................................................. 4
Figure II: Runway Pavement Condition Index Comparison to FDOT Minimum PCI 5
Figure III: PCI by Pavement Facility Use by Airport ......................................................... 7
Figure IV: Visual Representation of PCI Ratings and Field Conditions FlexibleAsphalt Concrete Pavement ............................................................................................. 8
Figure V: Visual Representation of PCI Ratings and Field Conditions Rigid PortlandCement Concrete Pavement ............................................................................................ 9
Figure 1-1: Pavement Condition Life Cycle................................................................... 23
Figure 1-2: Flexible Pavement, Asphalt Concrete ....................................................... 26
Figure 1-3: Rigid Pavement, Portland Cement Concrete .......................................... 26
Figure 2-1: District Pavement Area by Use .................................................................... 30
Figure 2-2: Pavement Area Use by Airport .................................................................... 31
Figure 3-1: Pavement Condition Index Rating Scale .................................................. 38
Figure 3-2: PCI by Pavement Facility Use by Airport .................................................... 40
Figure 3-3: PCI by Pavement Facility Use ....................................................................... 41
Figure 3-4: PCI by Pavement Surface Type ................................................................... 42
Figure 4-1: Example Pavement Performance Model .................................................. 45
Pavement Evaluation Report –District 3Statewide Airfield Pavement Management Program
Table of Contents | 3
APPENDICESAppendix A Glossary of TermsAppendix B District Branch Condition Report
District Section Condition ReportAppendix C District Airfield Pavement Condition Index Rating ExhibitsAppendix D District 10-Year Major Rehabilitation NeedsAppendix E District Airfield Pavement 10-Year Major Rehabilitation
Exhibits

Pavement Evaluation Report –District 3Statewide Airfield Pavement Management Program
Executive Summary | 1
EXECUTIVE SUMMARY
Airport airfield pavement infrastructure facilities represent a large capitalinvestment in the Florida Airport System. Timely and appropriate maintenanceand strategic rehabilitation are essential as repair costs increase significantly inproportion to deterioration. Airport pavement distresses can also contribute tothe development of loose debris and decreased ride quality, which can be asafety concern for aircraft operations.
In 2012, the Florida Department of Transportation Aviation and Spaceport Officeselected a Consultant team consisting of Kimley-Horn and Associates, Inc. andtheir Subconsultants Penuel Consulting, LLC. And Roy D. McQueen andAssociates, LTD. To provide services in support to FDOT in the continuingevaluation and updating of the existing Statewide Airfield PavementManagement Program (SAPMP) to be completed over fiscal year 2013 through2015. Pavement Condition Index surveys were performed for airfield pavementfacilities for the following airports located in District 3.
§ 1J0, Tri-County Airport§ 2J9, Quincy Municipal Airport§ 2R4, Peter Prince Field§ 54J, Defuniak Springs Airport§ AAF, Apalachicola Regional Airport§ CEW, Bob Sikes Airport§ DTS, Destin-Fort Walton Beach Airport§ ECP, Northwest Florida International Beaches Airport§ F95, Calhoun County Airport§ MAI, Marianna Municipal Airport§ PNS, Pensacola International Airport§ TLH, Tallahassee Regional Airport§ X13, Carrabelle-Thompson Airport
Destin – Fort Walton Beach Airport, formerly Northwest Florida Regional Airportand also concurrently Eglin Air Force Base (VPS), which is managed by theUnited States Airforce, declined to participate in the FDOT update and thereforewas not included in the inspection efforts as part of this program update.Wakulla County (2J0), which is managed by Wakulla County, though a countyowned and public use facility, did not have pavement facilities to warrantparticipation in this program update.
Pavement Evaluation Report – District 3Statewide Airfield Pavement Management Program
Executive Summary | 2
Since the previous update performed in 2012, significant updates to the ASTM D5340 Standard Test Method for Airport Pavement Condition Index Surveys haveaffected the analysis of the program. These include the separation of Weatheringand Raveling into two distinct flexible pavement distresses, and the addition ofthe Alkali-Silica Reaction distress for rigid pavement distresses. Additionally, thedeterioration associated with the rigid pavement distress Scaling/Map Crackinghas been modified. The change in distress classification, as described in ASTM D5340-12, may result in small variances in the PCI values from the previousinspection analysis. The update included changes in distress deduction valuesthat may be less than the previous analysis.
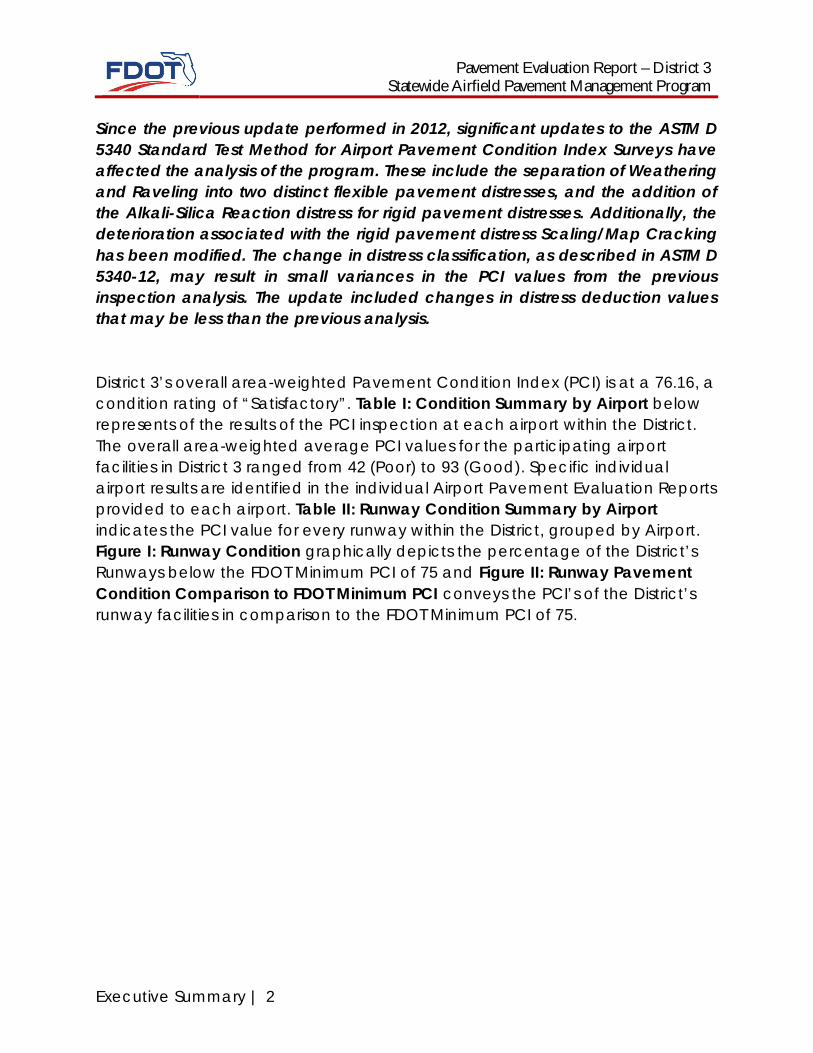
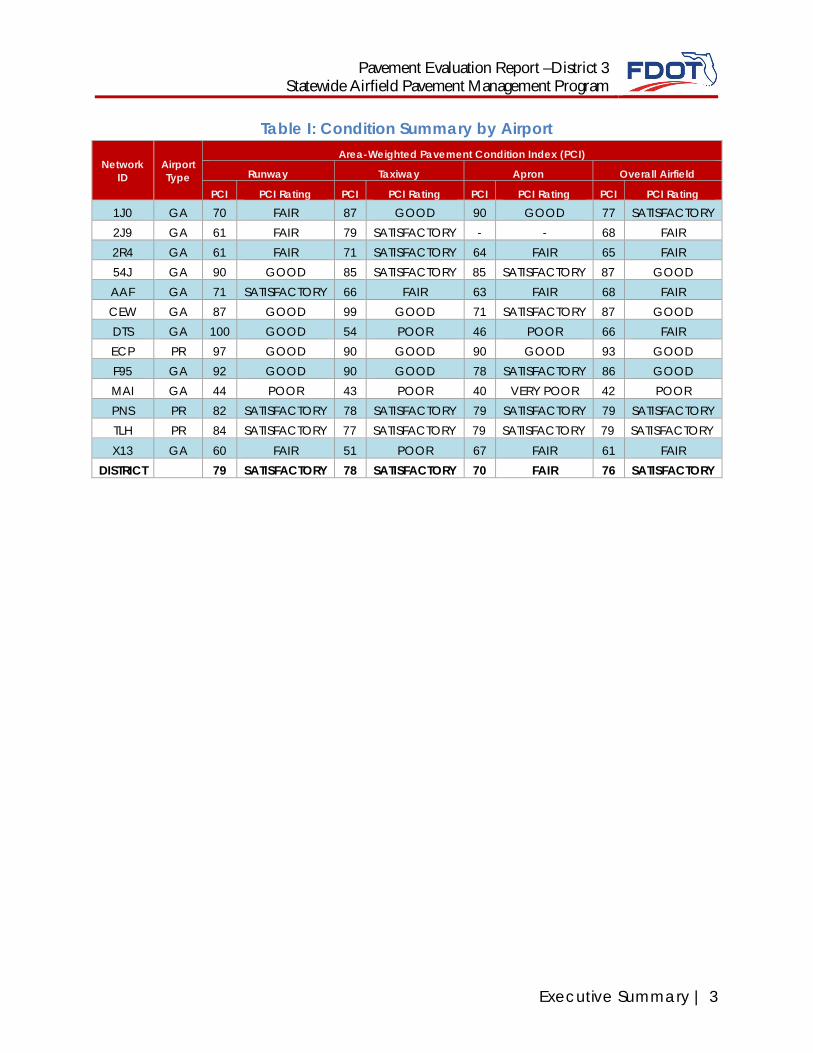
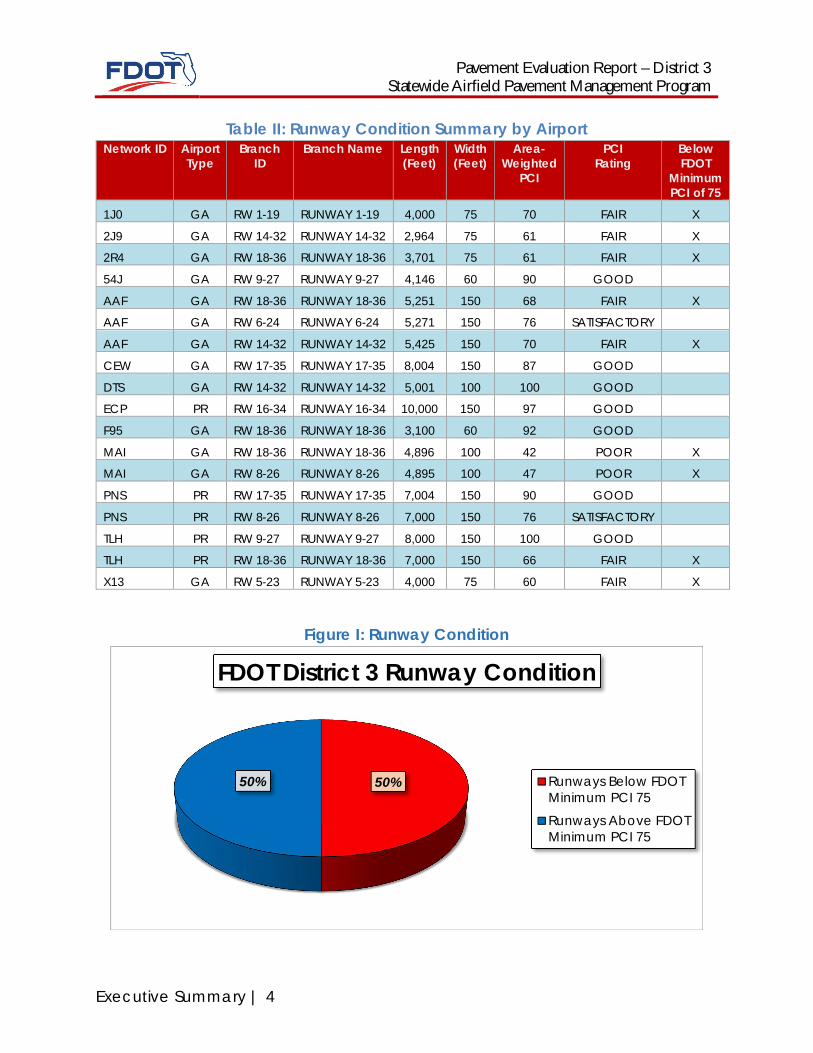
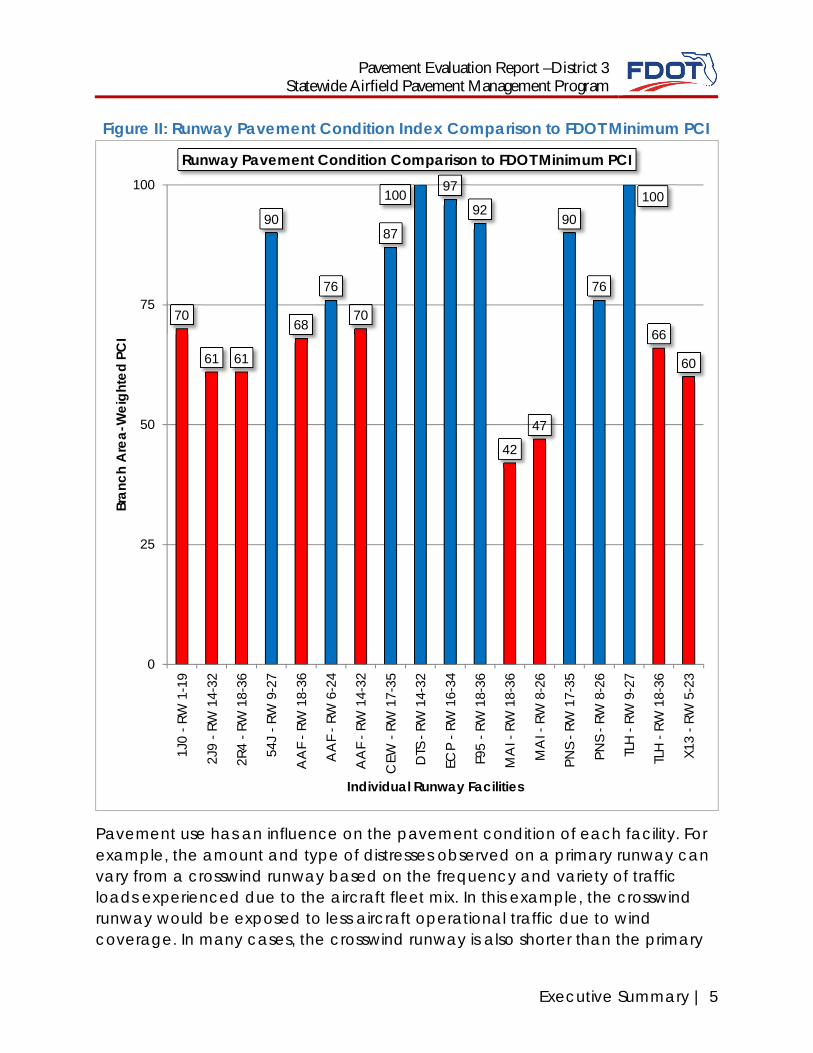
District 3’s overall area-weighted Pavement Condition Index (PCI) is at a 76.16, acondition rating of “Satisfactory”. Table I: Condition Summary by Airport belowrepresents of the results of the PCI inspection at each airport within the District.The overall area-weighted average PCI values for the participating airportfacilities in District 3 ranged from 42 (Poor) to 93 (Good). Specific individualairport results are identified in the individual Airport Pavement Evaluation Reportsprovided to each airport. Table II: Runway Condition Summary by Airportindicates the PCI value for every runway within the District, grouped by Airport.Figure I: Runway Condition graphically depicts the percentage of the District’sRunways below the FDOT Minimum PCI of 75 and Figure II: Runway PavementCondition Comparison to FDOT Minimum PCI conveys the PCI’s of the District’srunway facilities in comparison to the FDOT Minimum PCI of 75.
Pavement Evaluation Report –District 3Statewide Airfield Pavement Management Program
Executive Summary | 3
Table I: Condition Summary by Airport
NetworkID
AirportType
Area-Weighted Pavement Condition Index (PCI)
Runway Taxiway Apron Overall Airfield
PCI PCI Rating PCI PCI Rating PCI PCI Rating PCI PCI Rating
1J0 GA 70 FAIR 87 GOOD 90 GOOD 77 SATISFACTORY2J9 GA 61 FAIR 79 SATISFACTORY - - 68 FAIR2R4 GA 61 FAIR 71 SATISFACTORY 64 FAIR 65 FAIR54J GA 90 GOOD 85 SATISFACTORY 85 SATISFACTORY 87 GOODAAF GA 71 SATISFACTORY 66 FAIR 63 FAIR 68 FAIRCEW GA 87 GOOD 99 GOOD 71 SATISFACTORY 87 GOODDTS GA 100 GOOD 54 POOR 46 POOR 66 FAIRECP PR 97 GOOD 90 GOOD 90 GOOD 93 GOODF95 GA 92 GOOD 90 GOOD 78 SATISFACTORY 86 GOODMAI GA 44 POOR 43 POOR 40 VERY POOR 42 POORPNS PR 82 SATISFACTORY 78 SATISFACTORY 79 SATISFACTORY 79 SATISFACTORYTLH PR 84 SATISFACTORY 77 SATISFACTORY 79 SATISFACTORY 79 SATISFACTORYX13 GA 60 FAIR 51 POOR 67 FAIR 61 FAIR
DISTRICT 79 SATISFACTORY 78 SATISFACTORY 70 FAIR 76 SATISFACTORY
Pavement Evaluation Report – District 3Statewide Airfield Pavement Management Program
Executive Summary | 4
Table II: Runway Condition Summary by AirportNetwork ID Airport
TypeBranch
IDBranch Name Length
(Feet)Width(Feet)
Area-Weighted
PCI
PCIRating
BelowFDOT
MinimumPCI of 75
1J0 GA RW 1-19 RUNWAY 1-19 4,000 75 70 FAIR X
2J9 GA RW 14-32 RUNWAY 14-32 2,964 75 61 FAIR X
2R4 GA RW 18-36 RUNWAY 18-36 3,701 75 61 FAIR X
54J GA RW 9-27 RUNWAY 9-27 4,146 60 90 GOOD
AAF GA RW 18-36 RUNWAY 18-36 5,251 150 68 FAIR X
AAF GA RW 6-24 RUNWAY 6-24 5,271 150 76 SATISFACTORY
AAF GA RW 14-32 RUNWAY 14-32 5,425 150 70 FAIR X
CEW GA RW 17-35 RUNWAY 17-35 8,004 150 87 GOOD
DTS GA RW 14-32 RUNWAY 14-32 5,001 100 100 GOOD
ECP PR RW 16-34 RUNWAY 16-34 10,000 150 97 GOOD
F95 GA RW 18-36 RUNWAY 18-36 3,100 60 92 GOOD
MAI GA RW 18-36 RUNWAY 18-36 4,896 100 42 POOR X
MAI GA RW 8-26 RUNWAY 8-26 4,895 100 47 POOR X
PNS PR RW 17-35 RUNWAY 17-35 7,004 150 90 GOOD
PNS PR RW 8-26 RUNWAY 8-26 7,000 150 76 SATISFACTORY
TLH PR RW 9-27 RUNWAY 9-27 8,000 150 100 GOOD
TLH PR RW 18-36 RUNWAY 18-36 7,000 150 66 FAIR X
X13 GA RW 5-23 RUNWAY 5-23 4,000 75 60 FAIR X
Figure I: Runway Condition
50%50%
FDOT District 3 Runway Condition
Runways Below FDOTMinimum PCI 75
Runways Above FDOTMinimum PCI 75
Pavement Evaluation Report –District 3Statewide Airfield Pavement Management Program
Executive Summary | 5
Figure II: Runway Pavement Condition Index Comparison to FDOT Minimum PCI
Pavement use has an influence on the pavement condition of each facility. Forexample, the amount and type of distresses observed on a primary runway canvary from a crosswind runway based on the frequency and variety of trafficloads experienced due to the aircraft fleet mix. In this example, the crosswindrunway would be exposed to less aircraft operational traffic due to windcoverage. In many cases, the crosswind runway is also shorter than the primary
70
61 61
90
68
76
70
87
10097
92
42
47
90
76
100
66
60
0
25
50
75
1001J
0-R
W1-
19
2J9
-RW
14-3
2
2R4
-RW
18-3
6
54J
-RW
9-27
AA
F-R
W18
-36
AA
F-R
W6-
24
AA
F-R
W14
-32
CEW
-RW
17-3
5
DTS
-RW
14-3
2
ECP
-RW
16-3
4
F95
-RW
18-3
6
MA
I-RW
18-3
6
MA
I-RW
8-26
PNS
-RW
17-3
5
PNS
-RW
8-26
TLH
-RW
9-27
TLH
-RW
18-3
6
X13
-RW
5-23
Bran
chA
rea-
Wei
ghte
dPC
I
Individual Runway Facilities
Runway Pavement Condition Comparison to FDOT Minimum PCI
Pavement Evaluation Report – District 3Statewide Airfield Pavement Management Program
Executive Summary | 6
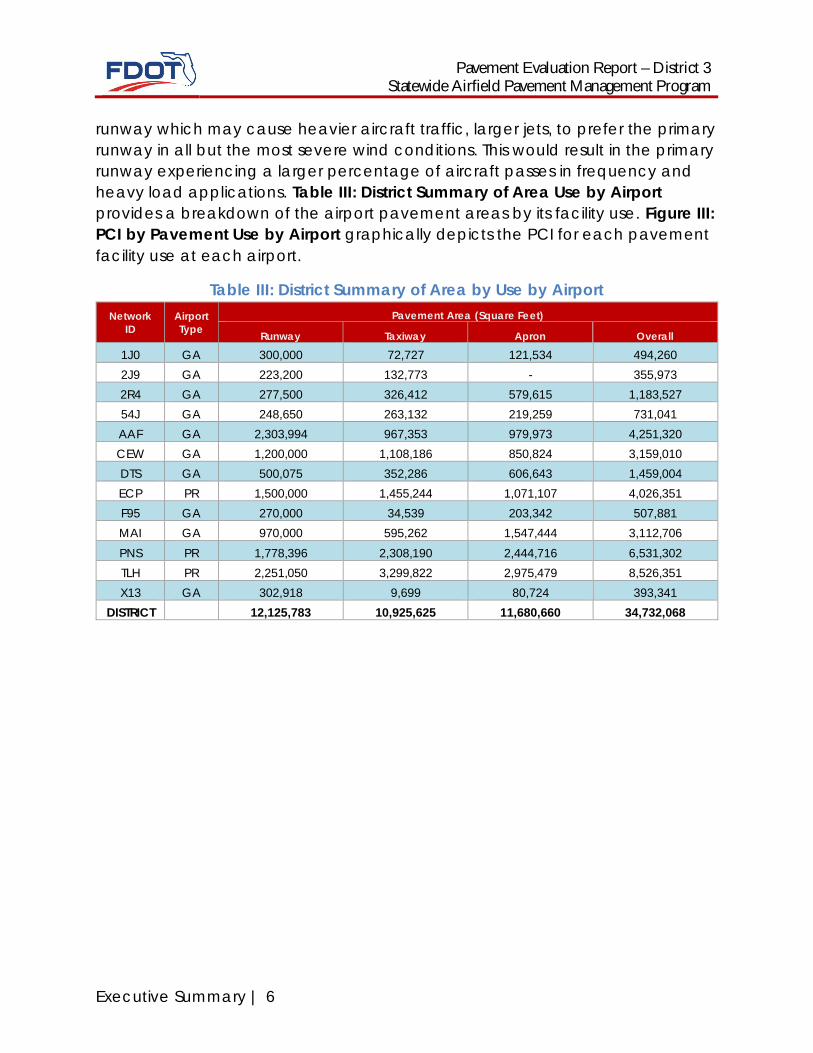
runway which may cause heavier aircraft traffic, larger jets, to prefer the primaryrunway in all but the most severe wind conditions. This would result in the primaryrunway experiencing a larger percentage of aircraft passes in frequency andheavy load applications. Table III: District Summary of Area Use by Airportprovides a breakdown of the airport pavement areas by its facility use. Figure III:PCI by Pavement Use by Airport graphically depicts the PCI for each pavementfacility use at each airport.
Table III: District Summary of Area by Use by AirportNetwork
IDAirportType
Pavement Area (Square Feet)
Runway Taxiway Apron Overall
1J0 GA 300,000 72,727 121,534 494,2602J9 GA 223,200 132,773 - 355,9732R4 GA 277,500 326,412 579,615 1,183,52754J GA 248,650 263,132 219,259 731,041AAF GA 2,303,994 967,353 979,973 4,251,320CEW GA 1,200,000 1,108,186 850,824 3,159,010DTS GA 500,075 352,286 606,643 1,459,004ECP PR 1,500,000 1,455,244 1,071,107 4,026,351F95 GA 270,000 34,539 203,342 507,881MAI GA 970,000 595,262 1,547,444 3,112,706PNS PR 1,778,396 2,308,190 2,444,716 6,531,302TLH PR 2,251,050 3,299,822 2,975,479 8,526,351X13 GA 302,918 9,699 80,724 393,341
DISTRICT 12,125,783 10,925,625 11,680,660 34,732,068
Pavement Evaluation Report –District 3Statewide Airfield Pavement Management Program
Executive Summary | 7
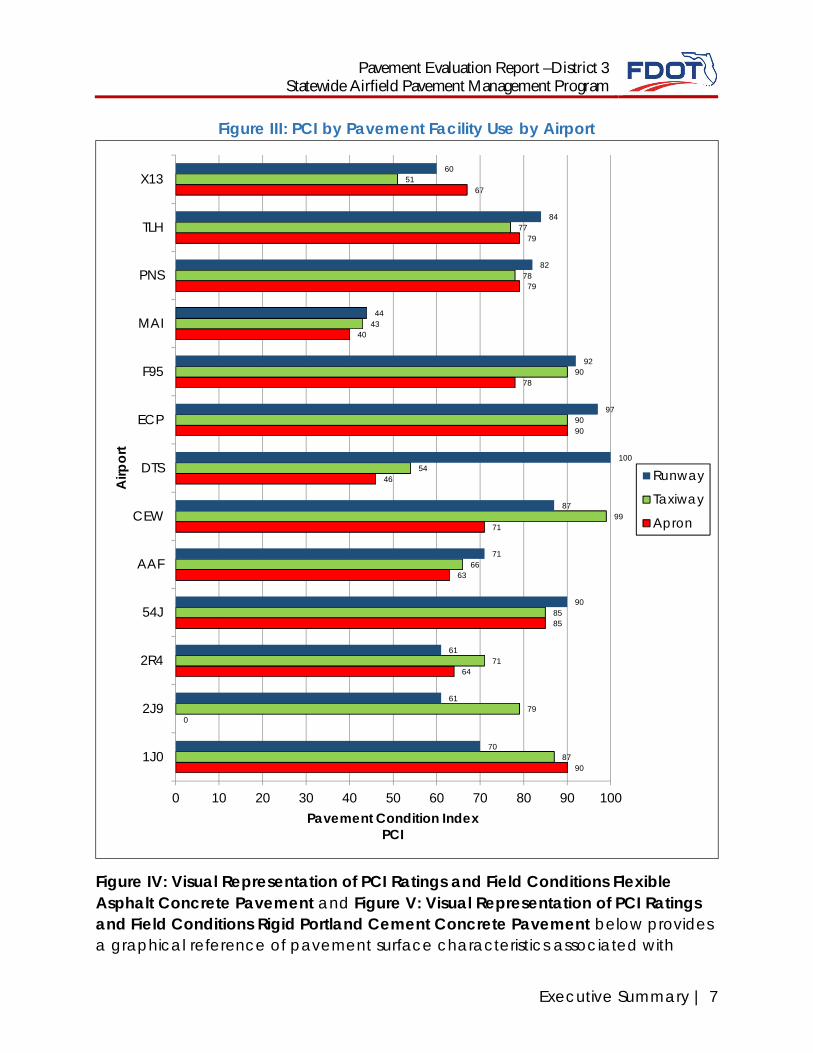
Figure III: PCI by Pavement Facility Use by Airport
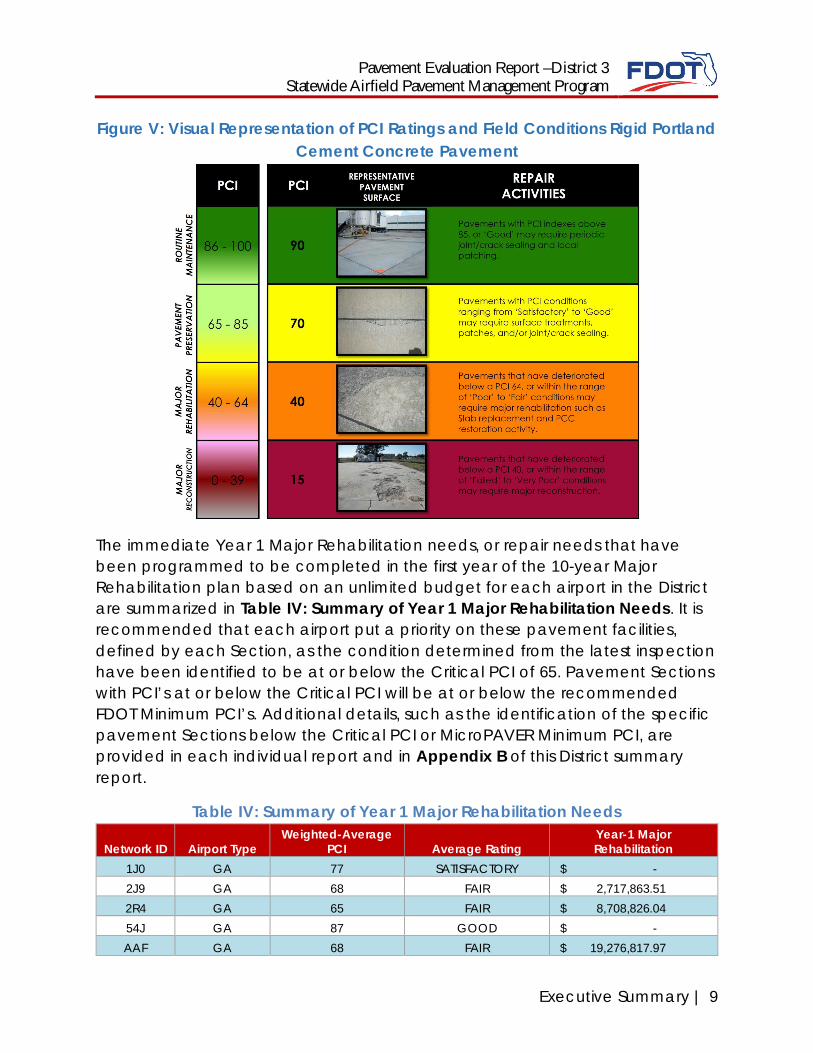
Figure IV: Visual Representation of PCI Ratings and Field Conditions FlexibleAsphalt Concrete Pavement and Figure V: Visual Representation of PCI Ratingsand Field Conditions Rigid Portland Cement Concrete Pavement below providesa graphical reference of pavement surface characteristics associated with
90
0
64
85
63
71
46
90
78
40
79
79
67
87
79
71
85
66
99
54
90
90
43
78
77
51
70
61
61
90
71
87
100
97
92
44
82
84
60
0 10 20 30 40 50 60 70 80 90 100
1J0
2J9
2R4
54J
AAF
CEW
DTS
ECP
F95
MAI
PNS
TLH
X13
Pavement Condition IndexPCI
Airp
ort
Runway
Taxiway
Apron
Pavement Evaluation Report – District 3Statewide Airfield Pavement Management Program
Executive Summary | 8
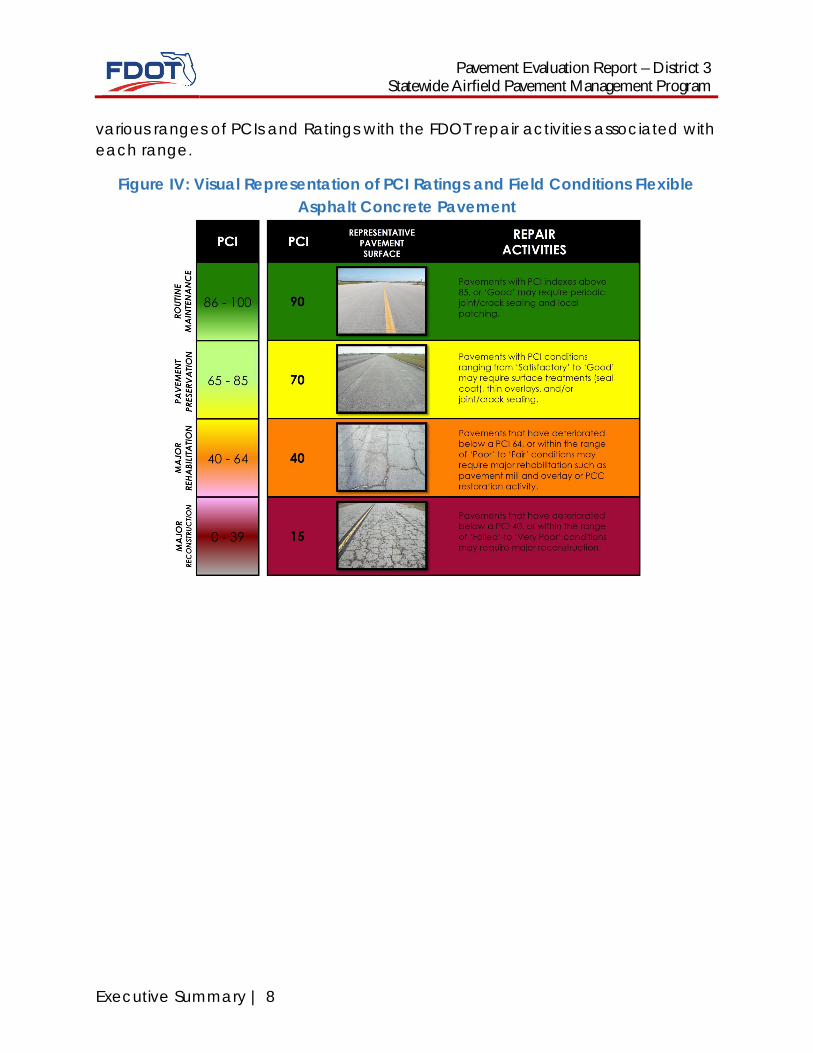
various ranges of PCIs and Ratings with the FDOT repair activities associated witheach range.
Figure IV: Visual Representation of PCI Ratings and Field Conditions FlexibleAsphalt Concrete Pavement
Pavement Evaluation Report –District 3Statewide Airfield Pavement Management Program
Executive Summary | 9
Figure V: Visual Representation of PCI Ratings and Field Conditions Rigid PortlandCement Concrete Pavement
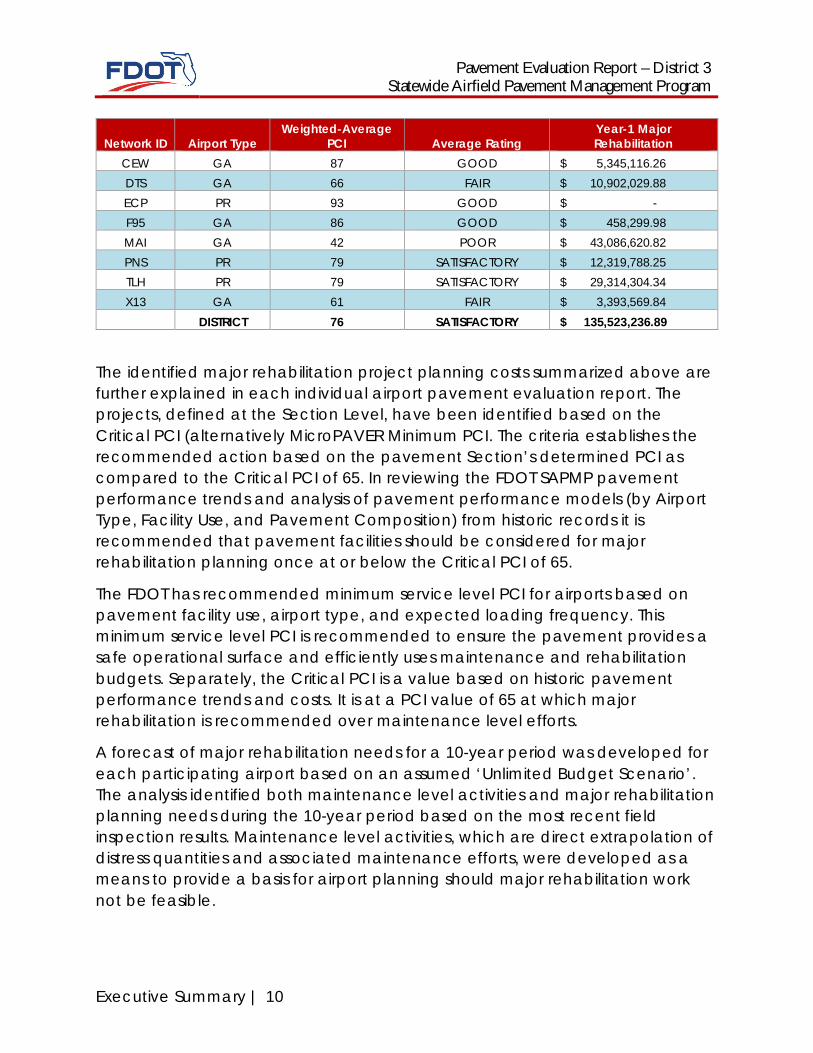
The immediate Year 1 Major Rehabilitation needs, or repair needs that havebeen programmed to be completed in the first year of the 10-year MajorRehabilitation plan based on an unlimited budget for each airport in the Districtare summarized in Table IV: Summary of Year 1 Major Rehabilitation Needs. It isrecommended that each airport put a priority on these pavement facilities,defined by each Section, as the condition determined from the latest inspectionhave been identified to be at or below the Critical PCI of 65. Pavement Sectionswith PCI’s at or below the Critical PCI will be at or below the recommendedFDOT Minimum PCI’s. Additional details, such as the identification of the specificpavement Sections below the Critical PCI or MicroPAVER Minimum PCI, areprovided in each individual report and in Appendix B of this District summaryreport.
Table IV: Summary of Year 1 Major Rehabilitation Needs
Network ID Airport TypeWeighted-Average
PCI Average RatingYear-1 MajorRehabilitation
1J0 GA 77 SATISFACTORY $ -2J9 GA 68 FAIR $ 2,717,863.512R4 GA 65 FAIR $ 8,708,826.0454J GA 87 GOOD $ -AAF GA 68 FAIR $ 19,276,817.97
Pavement Evaluation Report – District 3Statewide Airfield Pavement Management Program
Executive Summary | 10
Network ID Airport TypeWeighted-Average
PCI Average RatingYear-1 MajorRehabilitation
CEW GA 87 GOOD $ 5,345,116.26DTS GA 66 FAIR $ 10,902,029.88ECP PR 93 GOOD $ -F95 GA 86 GOOD $ 458,299.98MAI GA 42 POOR $ 43,086,620.82PNS PR 79 SATISFACTORY $ 12,319,788.25TLH PR 79 SATISFACTORY $ 29,314,304.34X13 GA 61 FAIR $ 3,393,569.84
DISTRICT 76 SATISFACTORY $ 135,523,236.89
The identified major rehabilitation project planning costs summarized above arefurther explained in each individual airport pavement evaluation report. Theprojects, defined at the Section Level, have been identified based on theCritical PCI (alternatively MicroPAVER Minimum PCI. The criteria establishes therecommended action based on the pavement Section’s determined PCI ascompared to the Critical PCI of 65. In reviewing the FDOT SAPMP pavementperformance trends and analysis of pavement performance models (by AirportType, Facility Use, and Pavement Composition) from historic records it isrecommended that pavement facilities should be considered for majorrehabilitation planning once at or below the Critical PCI of 65.
The FDOT has recommended minimum service level PCI for airports based onpavement facility use, airport type, and expected loading frequency. Thisminimum service level PCI is recommended to ensure the pavement provides asafe operational surface and efficiently uses maintenance and rehabilitationbudgets. Separately, the Critical PCI is a value based on historic pavementperformance trends and costs. It is at a PCI value of 65 at which majorrehabilitation is recommended over maintenance level efforts.
A forecast of major rehabilitation needs for a 10-year period was developed foreach participating airport based on an assumed ‘Unlimited Budget Scenario’.The analysis identified both maintenance level activities and major rehabilitationplanning needs during the 10-year period based on the most recent fieldinspection results. Maintenance level activities, which are direct extrapolation ofdistress quantities and associated maintenance efforts, were developed as ameans to provide a basis for airport planning should major rehabilitation worknot be feasible.
Pavement Evaluation Report –District 3Statewide Airfield Pavement Management Program
Executive Summary | 11
Maintenance level activities refers to the repair and preservation-type activitiesthat are applied locally to specific distress types on the pavement. Theseactivities for the SAPMP are considered preventative and corrective in natureand are highly recommended to help improve pavement performance andextend pavement life. The SAPMP maintenance policies are based on the FAAAdvisory Circular 150/5380-6C and guidance provided in the FDOT AirfieldPavement Repair Manual.
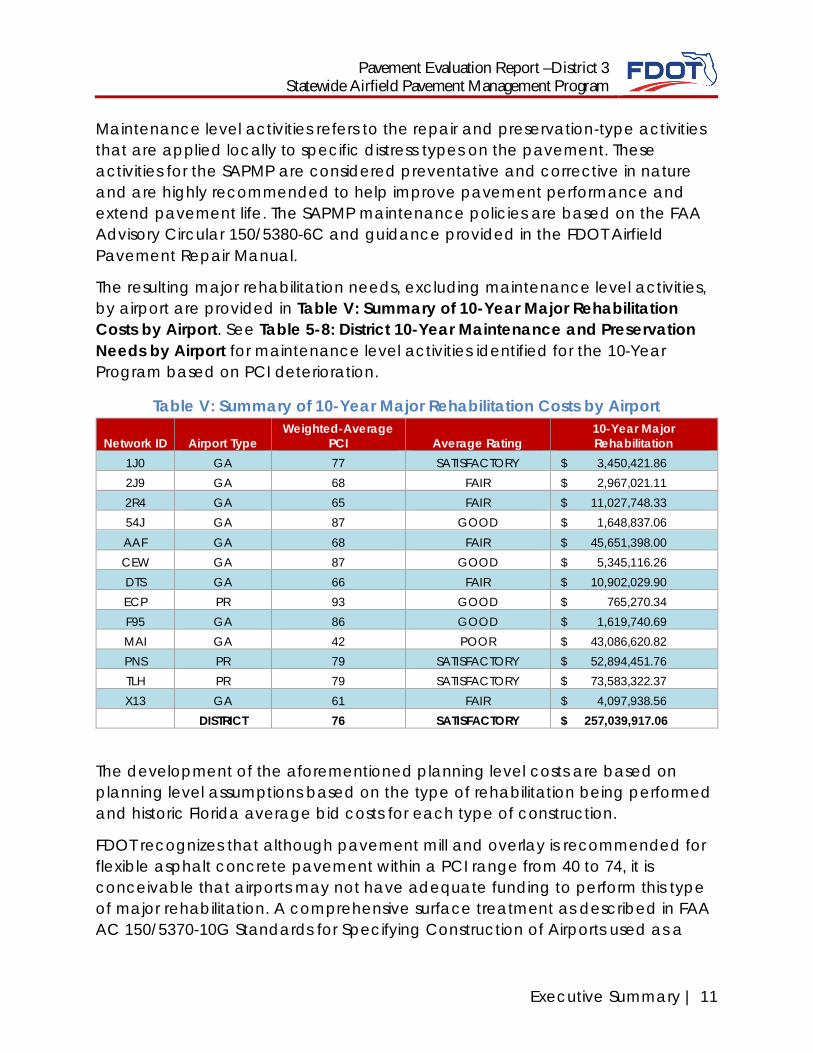
The resulting major rehabilitation needs, excluding maintenance level activities,by airport are provided in Table V: Summary of 10-Year Major RehabilitationCosts by Airport. See Table 5-8: District 10-Year Maintenance and PreservationNeeds by Airport for maintenance level activities identified for the 10-YearProgram based on PCI deterioration.
Table V: Summary of 10-Year Major Rehabilitation Costs by Airport
Network ID Airport TypeWeighted-Average
PCI Average Rating10-Year MajorRehabilitation
1J0 GA 77 SATISFACTORY $ 3,450,421.862J9 GA 68 FAIR $ 2,967,021.112R4 GA 65 FAIR $ 11,027,748.3354J GA 87 GOOD $ 1,648,837.06AAF GA 68 FAIR $ 45,651,398.00CEW GA 87 GOOD $ 5,345,116.26DTS GA 66 FAIR $ 10,902,029.90ECP PR 93 GOOD $ 765,270.34F95 GA 86 GOOD $ 1,619,740.69MAI GA 42 POOR $ 43,086,620.82PNS PR 79 SATISFACTORY $ 52,894,451.76TLH PR 79 SATISFACTORY $ 73,583,322.37X13 GA 61 FAIR $ 4,097,938.56
DISTRICT 76 SATISFACTORY $ 257,039,917.06
The development of the aforementioned planning level costs are based onplanning level assumptions based on the type of rehabilitation being performedand historic Florida average bid costs for each type of construction.
FDOT recognizes that although pavement mill and overlay is recommended forflexible asphalt concrete pavement within a PCI range from 40 to 74, it isconceivable that airports may not have adequate funding to perform this typeof major rehabilitation. A comprehensive surface treatment as described in FAAAC 150/5370-10G Standards for Specifying Construction of Airports used as a
Pavement Evaluation Report – District 3Statewide Airfield Pavement Management Program
Executive Summary | 12
maintenance rehabilitation activity can be used in lieu of asphalt concretepavement mill and overlay. However, it should be understood that thesemeasures provide only a short term extension of pavement life. While the cost ofsurface treatments are significantly lower than that of pavement mill andoverlay, it is not intended or implied to be a full rehabilitative measure providingthe same long term life as a major rehabilitation.
The objective of the major pavement rehabilitation needs analysis is to provideplanning level projects within an airport’s airfield pavement network. Majorrehabilitation activities are recommended when a pavement section hasdeteriorated below the Critical PCI value from a functionality perspective. Inaddition, major rehabilitation is also recommended when the Section PCI isabove the Critical PCI but the Section has load-related PCI distresses. This is thepoint when maintenance and repair level activities are not considered to becost effective.
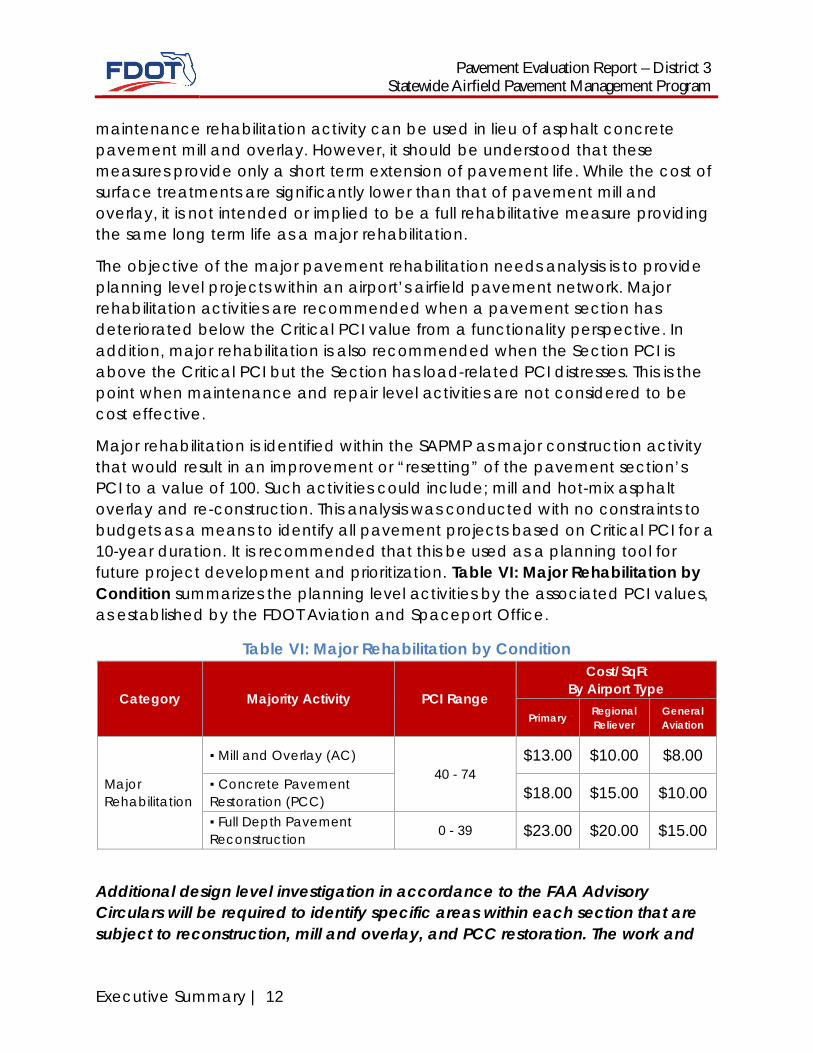
Major rehabilitation is identified within the SAPMP as major construction activitythat would result in an improvement or “resetting” of the pavement section’sPCI to a value of 100. Such activities could include; mill and hot-mix asphaltoverlay and re-construction. This analysis was conducted with no constraints tobudgets as a means to identify all pavement projects based on Critical PCI for a10-year duration. It is recommended that this be used as a planning tool forfuture project development and prioritization. Table VI: Major Rehabilitation byCondition summarizes the planning level activities by the associated PCI values,as established by the FDOT Aviation and Spaceport Office.
Table VI: Major Rehabilitation by Condition
Category Majority Activity PCI Range
Cost/SqFtBy Airport Type
Primary RegionalReliever
GeneralAviation
MajorRehabilitation
▪ Mill and Overlay (AC)40 - 74
$13.00 $10.00 $8.00
▪ Concrete PavementRestoration (PCC) $18.00 $15.00 $10.00
▪ Full Depth PavementReconstruction 0 - 39 $23.00 $20.00 $15.00
Additional design level investigation in accordance to the FAA AdvisoryCirculars will be required to identify specific areas within each section that aresubject to reconstruction, mill and overlay, and PCC restoration. The work and
Pavement Evaluation Report –District 3Statewide Airfield Pavement Management Program
Executive Summary | 13
budgets identified are intended for the planning level not the design level.Areas identified as mill and overlay may in fact require select areas ofreconstruction should load-based distresses observed warrant it. It is importantto state that the project specific design level efforts are necessary in determiningthe final rehabilitative construction activity and project limits. In certain cases,adjacent or nearby Sections may not have deteriorated to a PCI level thatwould warrant “major rehabilitation” but are deteriorated enough to beconsidered for inclusion as a combined project.
Runway projects, based on pavement conditions below the FDOTrecommended minimum service level PCI of 75 and have reached or are belowthe Critical PCI of 65, which the District should consider as immediate needs arelisted as follows. These are not all the needs at each participating airport withinthe District and may not be the individual airport’s priority, but should beconsidered in development of funding programs based on functional PCI.
Tri-County Airport (1J0)
J No Immediate Runway Major Rehabilitation
Quincy Municipal Airport (2J9)
J Runway 14-32 (6105, 6110)
o Major Rehabilitation
o $2,231,999.90
Peter Prince Field (2R4)
J Runway 18-36 (6105)
o Major Rehabilitation
o $2,774,999.87
Defuniak Springs Airport (54J)
J No Immediate Runway Major Rehabilitation
Apalachicola Regional Airport (AAF)
J Runway 18-36 (6310)
o Major Rehabilitation
o $2,626,249.88
Pavement Evaluation Report – District 3Statewide Airfield Pavement Management Program
Executive Summary | 14
J Runway 14-32 (6110)
o Major Rehabilitation
o $2,561,029.88
Bob Sikes Airport (CEW)
J No Immediate Runway Major Rehabilitation
Destin-Fort Walton Beach Airport (DTS)
J No Immediate Runway Major Rehabilitation
Northwest Florida International Airport (ECP)
J No Immediate Runway Major Rehabilitation
Calhoun County Airport (F95)
J No Immediate Runway Major Rehabilitation
Marianna Municipal Airport (MAI)
J Runway 18-36 (6205)
o Major Rehabilitation
o $6,911,999.78
J Runway 8-26 (6105)
o Major Rehabilitation
o $5,733,002.08
Pensacola International Airport (PNS)
J No Immediate Runway Major Rehabilitation
Tallahassee Regional Airport (TLH)
J Runway 18-36 (6105)
o Major Rehabilitation
o $10,242,000.00

Pavement Evaluation Report –District 3Statewide Airfield Pavement Management Program
Executive Summary | 15
Carrabelle-Thompson Airport (X13)
J Runway 5-23 (6105)
o Major Rehabilitation
o $3,029,179.86

Pavement Evaluation Report –District 3Statewide Airfield Pavement Management Program
Page | 17
1. INTRODUCTION
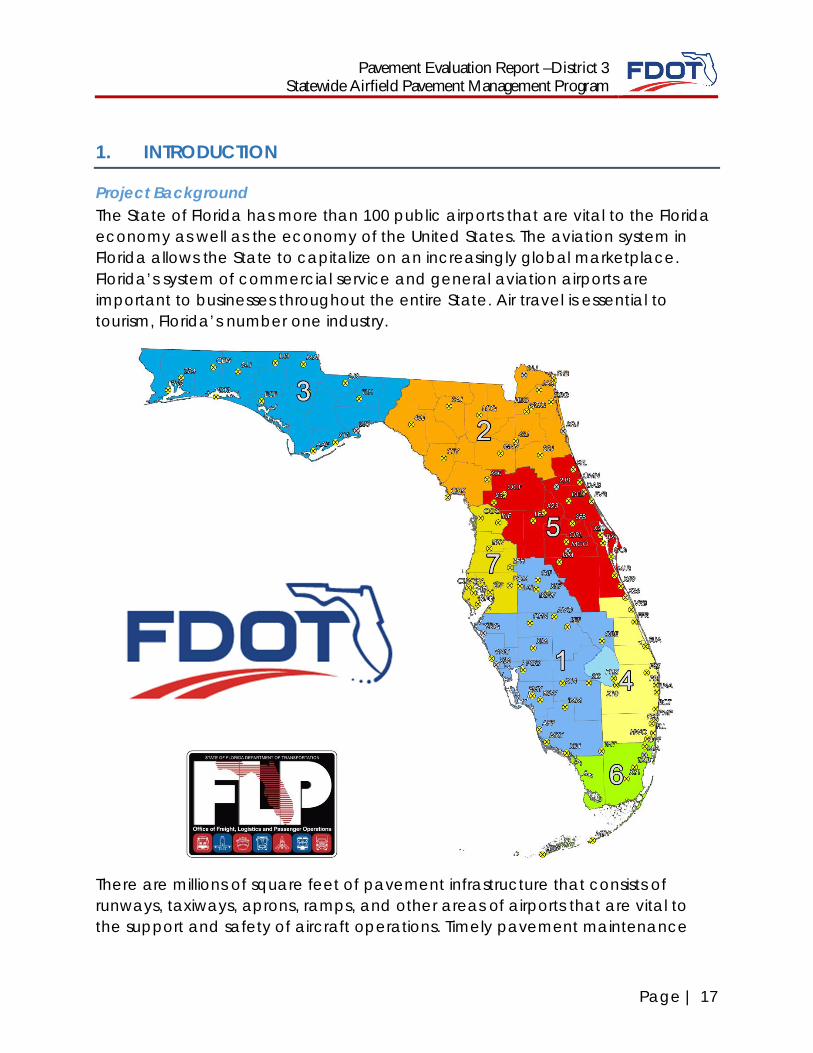
Project BackgroundThe State of Florida has more than 100 public airports that are vital to the Floridaeconomy as well as the economy of the United States. The aviation system inFlorida allows the State to capitalize on an increasingly global marketplace.Florida’s system of commercial service and general aviation airports areimportant to businesses throughout the entire State. Air travel is essential totourism, Florida’s number one industry.
There are millions of square feet of pavement infrastructure that consists ofrunways, taxiways, aprons, ramps, and other areas of airports that are vital tothe support and safety of aircraft operations. Timely pavement maintenance
Pavement Evaluation Report – District 3Statewide Airfield Pavement Management Program
Page | 18
repair and major rehabilitation of these pavements will support the airport inoperating safely, efficiently, economically and without excessive down time.
Pavement Condition Index surveys were performed for airfield pavementfacilities for the following participating airports located in District 3.
§ 1J0, Tri-County Airport§ 2J9, Quincy Municipal Airport§ 2R4, Peter Prince Field§ 54J, Defuniak Springs Airport§ AAF, Apalachicola Regional Airport§ CEW, Bob Sikes Airport§ DTS, Destin-Fort Walton Beach Airport§ ECP, Northwest Florida International Beaches Airport§ F95, Calhoun County Airport§ MAI, Marianna Municipal Airport§ PNS, Pensacola International Airport§ TLH, Tallahassee Regional Airport§ X13, Carrabelle-Thompson Airport
Wakulla County (2J0), which is managed by Wakulla County, though a countyowned and public use facility, did not have pavement facilities to warrantparticipation in this program update.
1.1 Purpose of District Pavement Evaluation ReportThe primary goal of the FDOT Statewide Airfield Pavement ManagementProgram (SAPMP) Update is to assist the Florida Airport System airports to be incompliance with Public Law 103-305 Section 107 with the implementation of aneffective airport pavement maintenance-management program as defined bythe Federal Aviation Administration Advisory Circular 150/5380-7B AirportPavement Management Program and provide maintenance recommendationsbased on Advisory Circular 150/5380-6C Guidelines and Procedures forMaintenance of Airport Pavements. The FDOT SAPMP provides individual airportswith pavement condition ratings as well as recommendations for maintenancelevel activities and major rehabilitation planning. The overall goal is to minimizecosts by performing timely pavement projects prior to deteriorating to a level atwhich costs increase significantly.
This document is intended to serve as a summary of the District’s participatingairports airfield pavement facility condition and long-term major rehabilitationneeds. Furthermore, the purpose of this District Summary document is to provide:
Pavement Evaluation Report –District 3Statewide Airfield Pavement Management Program
Page | 19
§ Information on the pavement management principles, objectives, andmethods used to update the existing program;
§ Provide the average results of the PCI survey and analysis at eachDistrict’s participating airport.
§ Provide the results of the maintenance level activities and majorrehabilitation analysis identified for the immediate Year-1 needs and long-term 10-Year project needs on an airport and District-wide basis.
1.2 FDOT Statewide Airfield Pavement Management ProgramIn 1992, the FDOT implemented the SAPMP to improve the knowledge ofpavement conditions at public airports in the Florida Airports System, identifymaintenance and rehabilitation needs at each airport, automate pavementinfrastructure information management, and establish standards to addressfuture needs. The 1992 SAPMP implementation provided the FDOT and theparticipating airports valuable information for establishing and performing timelyand appropriate pavement rehabilitation.
During the 1992-1993 implementation and again during the 1998-1999 updates;the SAPMP performed the development with proprietary software for pavementmanagement system analysis. This development allowed for the creation ofpavement management database file system populated with airport attributesand condition data. The pavement management database was used toestablish maintenance, repair, and rehabilitation (M&R) policies, M&R budgetcosts, and the development of recommendations for performing routinepavement preservation maintenance. This system, known as AIRPAV, was initiallydeveloped during the 1992-1993 SAPMP implementation for the analysis ofdistress data. The AIRPAV system was used again in the 1998-1999 SAPMPupdate.
In 2004, the SAPMP update included the review of the AIRPAV softwarecompared to other industry available non-proprietary software packages. As aresult of this review, MicroPAVER was selected for implementation of the systemupdate. MicroPAVER was developed by the U.S. Army Corps of EngineersConstruction Engineering Research Laboratory for the purpose of pavementmanagement. Data from the 1998-1999 FDOT SAPMP update, which built uponthe initial 1992-1993 implementation of AIRPAV, was reviewed and converted tobe compatible with the MicroPAVER system. This data conversion included alldocumented pavement facility, classification, type, history, geometry, PCIcondition data and pertinent attributes gathered from airport feedback at thetime. This information was used to develop the inventory of each participating
Pavement Evaluation Report – District 3Statewide Airfield Pavement Management Program
Page | 20
airport’s pavement facilities in a consistent format. This was the development ofAirfield Pavement Network Definition Exhibits. These inventory exhibits visuallydepicted the branch, section, and sample units that were based upon thepavement construction history and composition information provided by eachairport.
In 2006-2008, the SAPMP was updated again with continued use of theMicroPAVER system. Based on the distress data collected, a maintenance repairand major rehabilitation planning program was developed for each airport. Aspart of this SAPMP update, the procedures for the inspection and the collectionof the pavement distress data were documented, and an interactive website(http://www.dot.state.fl.us/aviation/pavement.shtm) was established for input ofdata.
In 2010-2012, the SAPMP was updated using new GPS integrated technology todigitally collect pavement distress data. Interactive GIS map files weredeveloped from updated Airfield Pavement Network Definition Maps to aidpavement condition inspectors in the collection of sample distress data. Thedata collected was utilized to develop pavement performance models topredict future pavement PCI values and make recommendations for majorrehabilitation.
Currently, airports participating in the Airport Improvement Program (AIP) GrantProgram are required by the Federal Aviation Administration (FAA) to developand implement a pavement maintenance program to be eligible for funding(FAA Advisory Circular 150/5380-6C Guidelines and Procedures for Maintenanceof Airport Pavements). This program requires detailed inspection of airfieldpavement conditions by trained personnel. The inspections are required to beperformed at least once a year or every three years, if the pavement isinspected in accordance to the PCI survey procedure (such as ASTMInternational D 5340 Standard Test Method for Airport Pavement Condition IndexSurveys). The previous 2010-2012 SAPMP update utilized the ASTM D 5340-04released in 2004, in lieu of the 2010/2011 edition, in order to maintain consistentdatabase integrity and benefit of pavement performance models from previousinspections.
1.3 Organization
FDOT Central Aviation and Spaceport Office Program ManagerThe FDOT Central Office Airport Engineering Manager serves as the Aviation andSpaceport Office Program Manager (ASO-PM) for the SAPMP. The ASO-PM
Pavement Evaluation Report –District 3Statewide Airfield Pavement Management Program
Page | 21
monitors the work performed by the Consultant. The ASO-PM has review andapproval authority for each program task and manages the day-to-day detailsof the SAPMP and the pertinent updates.
The ASO-PM reports updates and milestones to the FDOT State Aviation andSpaceport Manager and Development Administrator.
ConsultantThe Consultant, Kimley-Horn and Associates, Inc. and their team consisting ofPenuel Consulting, LLC and Roy D. McQueen & Associates, LTD, providestechnical and administrative assistance to the ASO-PM during the execution ofthe update to the SAPMP. The efforts include updating the airport pavementinventory data, performing the condition survey inspections, evaluating theairfield pavement conditions and updating the SAPMP based upon proceduresoutlined in the FAA Advisory Circular 150/5380-6C Guidelines and Procedures forMaintenance of Airport Pavements and ASTM D 5340.
Airport RoleThe airports are the ultimate beneficiary for each condition survey inspectionperformed at their respective airfields as part of the SAPMP. The individualairports will be provided final deliverables prepared by the Consultant that havebeen reviewed and approved by the ASO-PM. The airport should have provideda current Airport Layout Plan (ALP) to the Consultant and, if they participated inthe previous SAPMP, indicate any construction activity that was performed sincethe previous inspections.
FDOT District OfficesThe seven FDOT District Offices, specifically the Aviation Representatives, providevital support to the SAPMP update and the ASO-PM. Each District supports theSAPMP’s on-going efforts by providing representative construction trend costsand practices through the Florida Airports System. Each District Office receivescopies of individual Airfield Pavement Evaluation Reports for the airport facilitieslocated within their respective districts, as well as this summary District specificReport.
1.4 Introduction to Pavement Types and Pavement Management
Pavement BasicsA pavement is a prepared surface designed to provide a continuous smoothride at all taxi, takeoff, and landing speeds and to support an estimated amountof traffic loading for a certain number of years. Pavements are composed of a
Pavement Evaluation Report – District 3Statewide Airfield Pavement Management Program
Page | 22
combination of constructed layers of subgrade soils, subbases, base coursematerial, and surface level courses. There are two primary types of pavements:
§ Flexible Pavement, composed of bituminous asphalt concrete (AC)surface, base, and subbase layers.
§ Rigid Pavement, composed of Portland Cement Concrete (PCC) surface,base, and subbase layers.
Both pavement types use a combination of layered materials and thicknesses inorder to support the traffic loads (both magnitude and repeated application)and protect the underlying subgrade soil. Flexible pavements dissipate appliedloads from layer to layer until the load magnitude is small enough to besupported by the subgrade soil. In rigid pavements, the PCC layer supports themajority of the structural load applied, and the base or subbase layer isconstructed to provide a smooth, level, and continuous platform that providesuniform support for PCC slabs.
A small percentage of airfield pavements within the Florida Airports System arecomposed of hybrid ‘composite pavement’ sections that may include both ACpavement and PCC pavement. The two known composite pavements are ACsurface over PCC (APC) and PCC over AC (White Topping).
Due to the different nature of the pavement types, construction, and theirmaterials; flexible and rigid pavements have different modes of failure andfatigue. This results in varying deterioration and distress development.Understanding the mechanics and modes of failure of the pavement typesassists the engineers in making timely, adequate and consistent observations,and in recommending economical maintenance repairs and majorrehabilitation to the pavement structures at each airfield.
The Concept of an Airfield Pavement Management SystemThe SAPMP is a program that provides the Florida Airports System an opportunityto implement and/or maintain a proactive Airfield Pavement ManagementSystem (APMS) in a consistent manner at a regular schedule. The SAPMP AirfieldPavement Management System consists of pavement inventory, pavementconstruction and history, condition survey inspections, pavement performancemodeling, maintenance recommendations, and major rehabilitation planning.The various elements of the APMS are used by experienced engineers to identifycritical pavements, make pavement preservation or rehabilitationrecommendations, and approximate pavement performance. The APMS as awhole is used by an airport’s stakeholders, managing agencies, engineers, and
Pavement Evaluation Report –District 3Statewide Airfield Pavement Management Program
Page | 23
planners as a tool in decision making for future project planning, budgeting, andscheduling of activities for its airfield pavement infrastructure.
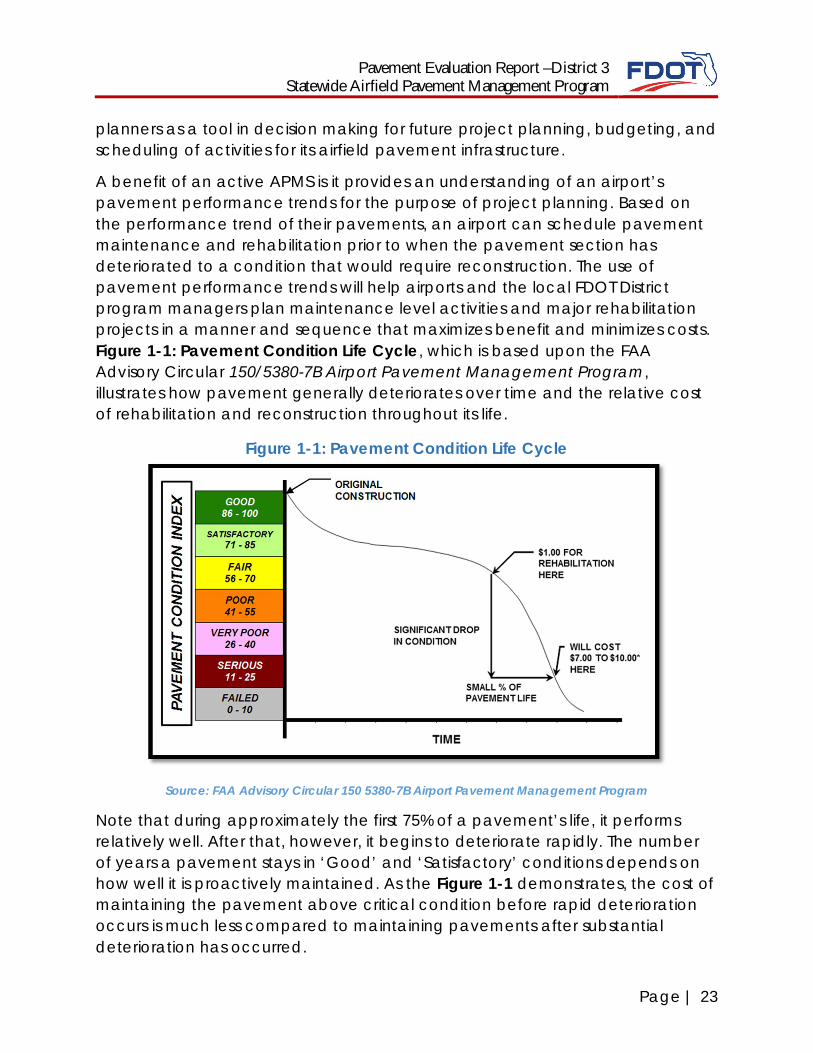
A benefit of an active APMS is it provides an understanding of an airport’spavement performance trends for the purpose of project planning. Based onthe performance trend of their pavements, an airport can schedule pavementmaintenance and rehabilitation prior to when the pavement section hasdeteriorated to a condition that would require reconstruction. The use ofpavement performance trends will help airports and the local FDOT Districtprogram managers plan maintenance level activities and major rehabilitationprojects in a manner and sequence that maximizes benefit and minimizes costs.Figure 1-1: Pavement Condition Life Cycle, which is based upon the FAAAdvisory Circular 150/5380-7B Airport Pavement Management Program,illustrates how pavement generally deteriorates over time and the relative costof rehabilitation and reconstruction throughout its life.
Figure 1-1: Pavement Condition Life Cycle
Source: FAA Advisory Circular 150 5380-7B Airport Pavement Management Program
Note that during approximately the first 75% of a pavement’s life, it performsrelatively well. After that, however, it begins to deteriorate rapidly. The numberof years a pavement stays in ‘Good’ and ‘Satisfactory’ conditions depends onhow well it is proactively maintained. As the Figure 1-1 demonstrates, the cost ofmaintaining the pavement above critical condition before rapid deteriorationoccurs is much less compared to maintaining pavements after substantialdeterioration has occurred.
Pavement Evaluation Report – District 3Statewide Airfield Pavement Management Program
Page | 24
Pavements tend to deteriorate at an accelerated rate when actual trafficloading exceeds the original design assumptions and when limited resources areavailable for maintenance and repair (M&R) efforts. Planned maintenance andrehabilitation, essentially preserving pavements and delaying conditiondeterioration, help airport managers, agencies, and engineers maximize the useof their budgets and prolong the life of their pavements. An APMS provides atool to schedule planned maintenance and major rehabilitation efforts basedon a consistent methodology of condition assessment. This consistentmethodology of pavement condition assessment allows for the development ofpavement performance models to help forecast future pavement conditions.
Part of the implementation of the APMS is the clear identification andinventorying of pavement infrastructure that needs to be managed specificallywithin the airport owner, manager, and agency responsibility. Another aspect ofthe APMS is development of maintenance, repair, and major rehabilitationpolicies that align with the expectations of pavement performance and arebased on ability to fund the types of work identified. Once there is anunderstanding of the cause and extent of pavement distresses, appropriatemaintenance and rehabilitation can be planned. By using representativeconstruction costs based on historic bid trends; planning level budget costs canbe developed on a multiyear duration.
Airfield Pavement Inspection Methodology for the SAPMPPavement condition assessment requires the application of professionaljudgments regarding the condition of the pavement. The SAPMP airfieldpavement condition survey inspections assess pavement, comparing it to a setof standards in ASTM D 5340-12 Standard Test Method for Airport PavementCondition Index Surveys.
The pavement condition surveys assess the functional condition of thepavement surface based on surface distresses as defined by the ASTM D 5340-12. Typically, deficiencies within a pavement structure will eventually reflect tothe pavement surface as distresses described within ASTM D 5340-12. The SAPMPis specifically a visual evaluation and analysis based on the ASTM D 5340-12. Thestructural condition and relative support of the pavement layers can be directlyquantified using non-destructive deflection testing (NDT) as well as other in-depth engineering evaluation or sampling and testing methods.
For the SAPMP update, only visual surveys were performed. Further structural andgeotechnical testing should be conducted to determine design level
Pavement Evaluation Report –District 3Statewide Airfield Pavement Management Program
Page | 25
rehabilitation and/or reconstruction needs should the airport proceed to thedesign process.
In preparation for the PCI survey inspections, the airfield pavements for eachairport are divided into branches, sections, and sample units as established byFAA Advisory Circular 150/5380-7B and ASTM D 5340. An Airfield PavementNetwork Definition Exhibit has been prepared for each participating airport thatdepicts the inventory system reflected in the SAPMP database system. Eachnetwork definition depicts the latest branch, section, and sample unit definitionused for the PCI surveys.
The sample units to be inspected were determined through a systematicrandom sampling technique to provide an unbiased representation of sampleunits for each pavement facility. The sample unit locations had beendetermined in such a way that they are distributed evenly throughout eachdefined pavement section area. In certain cases when no representativedistresses are observed in the field, additional sample units were added.
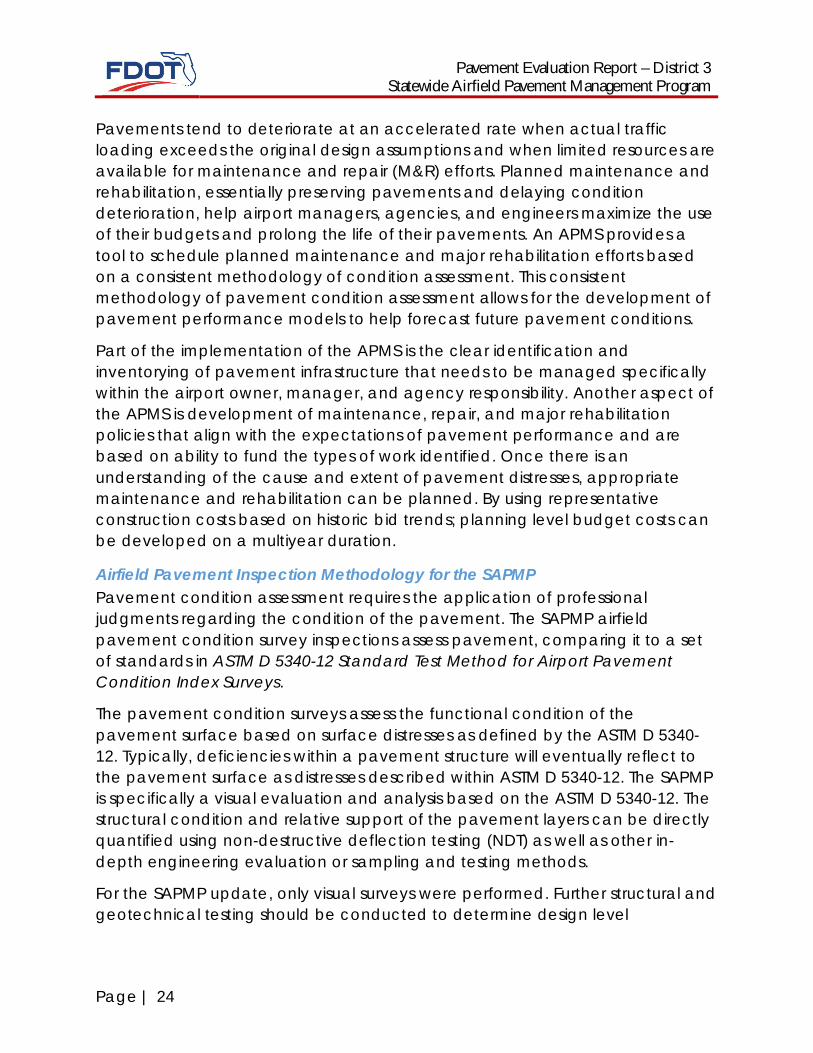
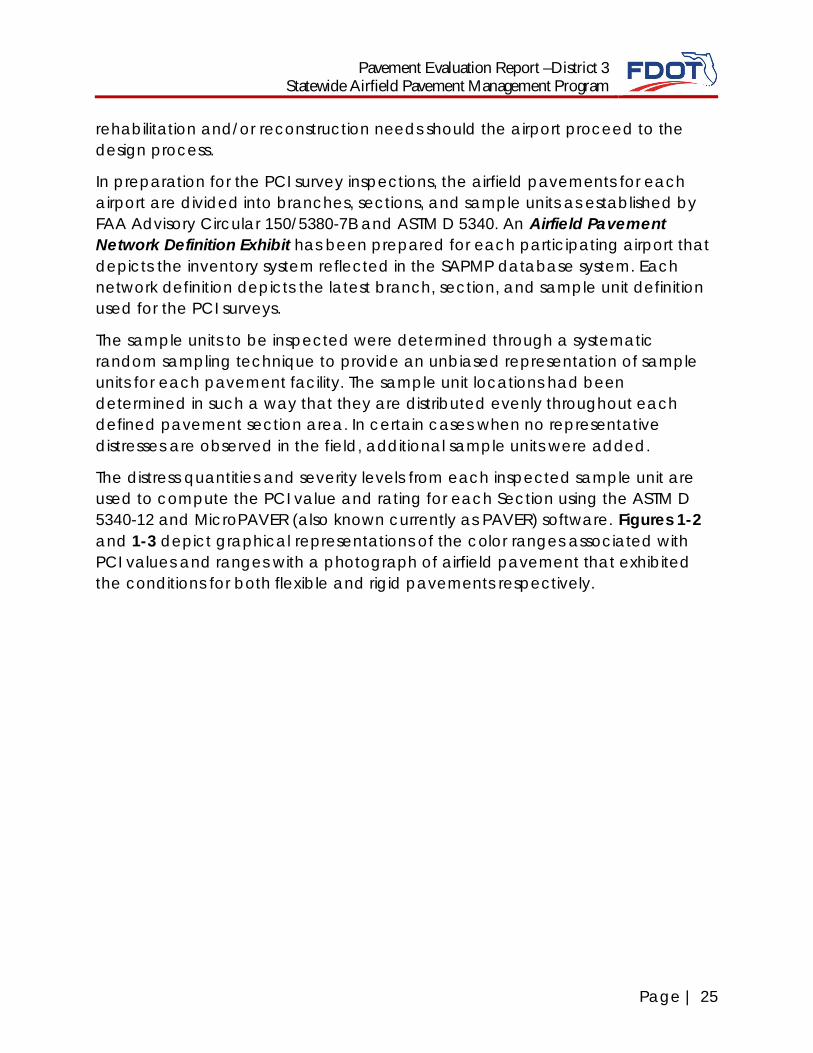
The distress quantities and severity levels from each inspected sample unit areused to compute the PCI value and rating for each Section using the ASTM D5340-12 and MicroPAVER (also known currently as PAVER) software. Figures 1-2and 1-3 depict graphical representations of the color ranges associated withPCI values and ranges with a photograph of airfield pavement that exhibitedthe conditions for both flexible and rigid pavements respectively.
Pavement Evaluation Report – District 3Statewide Airfield Pavement Management Program
Page | 26
Figure 1-2: Flexible Pavement, Asphalt Concrete
Figure 1-3: Rigid Pavement, Portland Cement Concrete
Pavement Evaluation Report –District 3Statewide Airfield Pavement Management Program
Page | 27
2. AIRFIELD PAVEMENT SYSTEM INVENTORY AND NETWORK UPDATE
2.1 System Inventory UpdateA significant element to the development and update of the SAPMP has beento identify recent and anticipated construction activity that affects thepavement composition and performance. With cooperation from the airportpersonnel, the project team was able to gather airport specific information thatincluded changes in pavement geometry, new or reconstructed pavementssince the last inspection and anticipated pavement rehabilitation that wouldnegate the findings of a visual inspection done in the short term. At thebeginning of each phase for this update, FDOT SAPMP participants respondedto the Aviation and Spaceport Office with project specific information on therecent and anticipated work. In addition to the construction activity, updates topavement facility designators (i.e. re-designation, magnetic declination, and/ordecommissioning) were reported. Lastly, the project team leaders performingfield inspections confirm with airport staff on site previous, recent, andanticipated construction projects that may affect the airfield pavementfacilities.
This information was considered in conjunction with aerial imagery provided byFDOT during the updating of pavement section areas on each airport’s AirfieldPavement Network Definition Exhibit. The previous, recent, and anticipatedconstruction activity information provided by airport staff has been graphicallydepicted relative to the branch, section, and sample unit definition on theAirfield Pavement System Inventory Exhibit for each participating airport. Thisinformation was also included in the MicroPAVER database updates for theSAPMP.
2.2 Network Definition Update
Branch and Section IdentificationEach airport’s airfield pavement network is generally subdivided into separateBranches (runways, taxiways, aprons/ramps, or others) that have distinctlydifferent functional identifications and uses. Each Branch is further subdividedinto Sections as defined by pavement location, composition, and constructionhistory. A Section is typically understood to be a project level subdivision within aBranch feature. Sections are manageable units to organize data collection andare treated individually during the maintenance and major rehabilitationplanning process. A pavement rank (primary, secondary, or tertiary) is assigned
Pavement Evaluation Report – District 3Statewide Airfield Pavement Management Program
Page | 28
to each Section based on its importance and type of use to airport operations.The pavement rankings designated for each section at the participating airportswere defined by the previous SAPMP, unless changes were communicated bythe airport. These Sections are further subdivided into condition survey sampleunits based on the methodology described in ASTM D 5340.
The Airfield Pavement System Inventory and Airfield Pavement NetworkDefinition Exhibits are developed individually for each participating airport.Based on information requested of and provided by the airport, the airfieldpavements are evaluated on designation updates, and recent or anticipatedpavement construction activity. As mentioned previously, a Section is definedpartially by its construction history of which is factored in the performance andcondition of the pavement section.
Construction activities identified include maintenance and repair activity, majorrehabilitation, and new airfield pavement construction. Maintenance and repairactivity may include; surface treatments, crack sealing, patching, slabreplacement, and others. Both maintenance and rehabilitation activities areidentified at the pavement section level. This type of work may result in anincrease in overall Section PCI since the last inspection. Major rehabilitationefforts may include; asphalt milling and overlay, and full depth pavementreconstruction. This type of effort will result in a resetting of the pavement sectionPCI value to 100 due to the nature of the work. Lastly, new airfield pavementconstruction are accounted for as new inventory and assigned a section PCI of100. Typically the new pavement sections are not inspected due to its condition;however these pavements are incorporated into the SAPMP pavementdatabase.
Due to recent and anticipated construction efforts; pavement area sectionsmay have been consolidated or created which will affect the total number ofsample units to be inspected based upon the methods described in ASTM D5340 and from the sampling rate schedule.
Airfield Pavement Network Definition & Geographic Information System (GIS)As part of this SAPMP update, geographic information system (GIS), globalpositioning system (GPS), and digital data collection were integrated into thePavement Inspection Methodology at each airport. Using AutoCAD Civil 3D,ArcMap, ArcPad, and FDOT Survey and Mapping Office Aerial Photography;digital navigation maps have been developed for each airport to represent theSAPMP pavement inventory attributes. These navigation maps were used withfield data tablets to assist survey teams as they performed condition inspections
Pavement Evaluation Report –District 3Statewide Airfield Pavement Management Program
Page | 29
by navigating pavement infrastructure and collecting distress data. Additionally,this information was utilized to develop updates to geometry characteristics foreach of the identified pavement facilities.
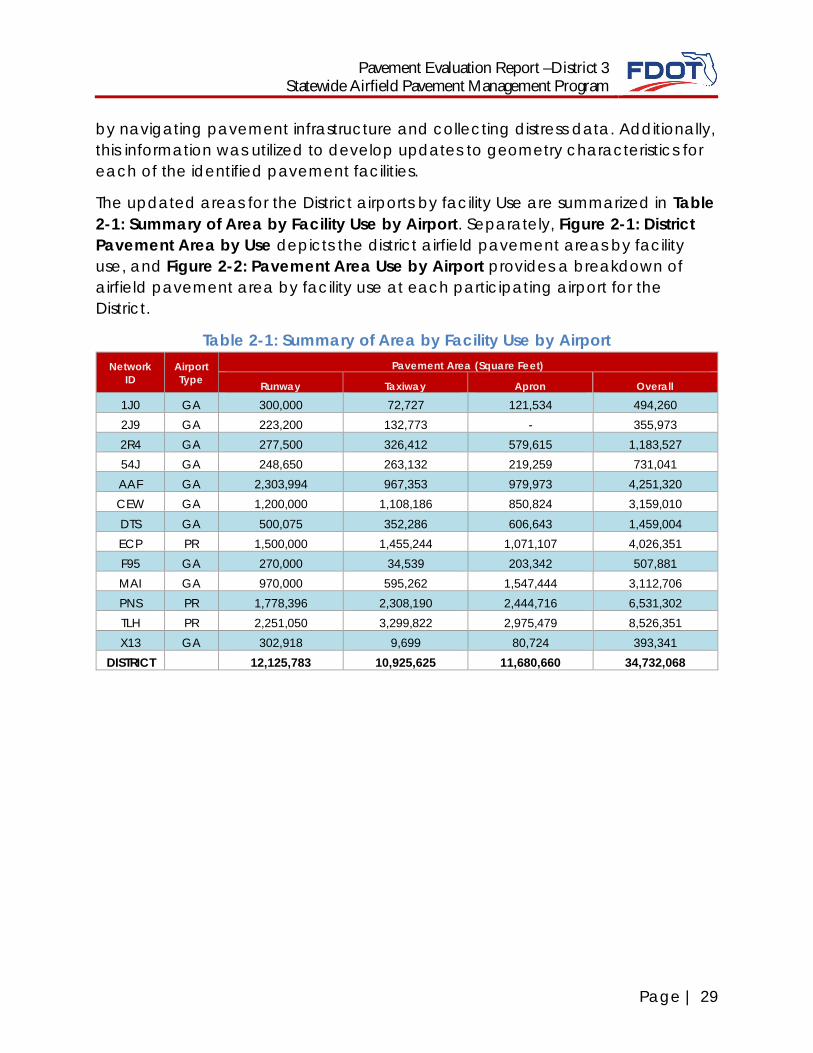
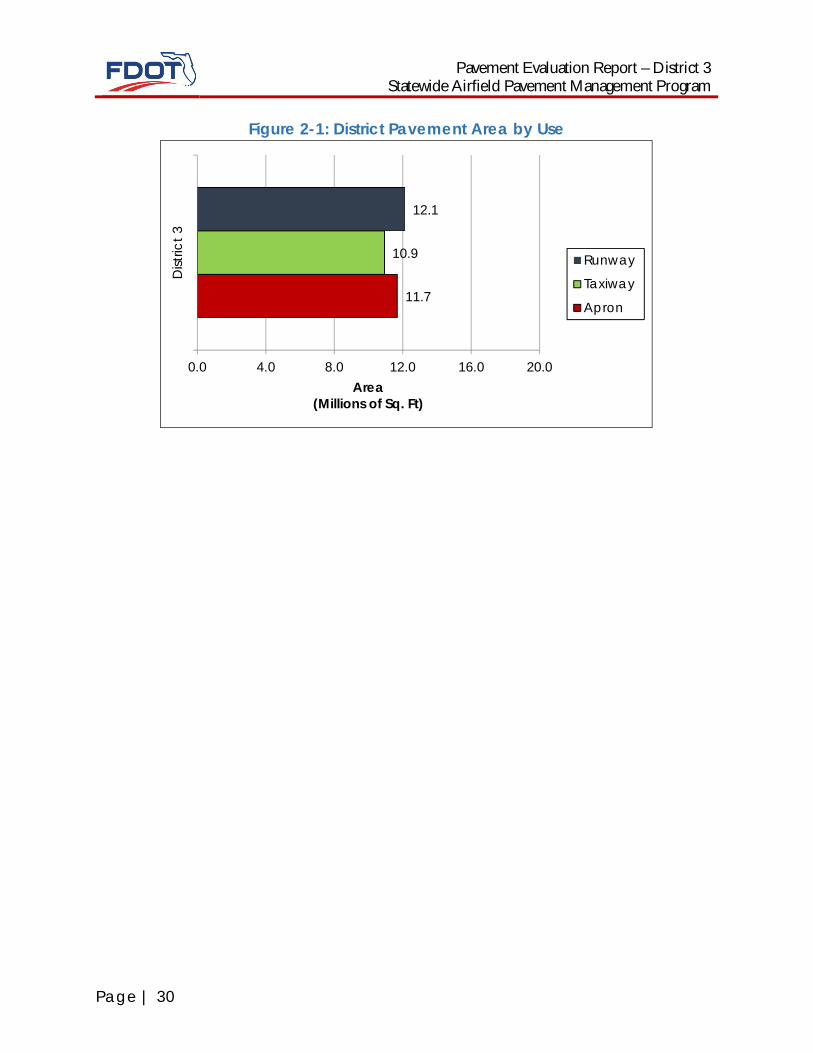
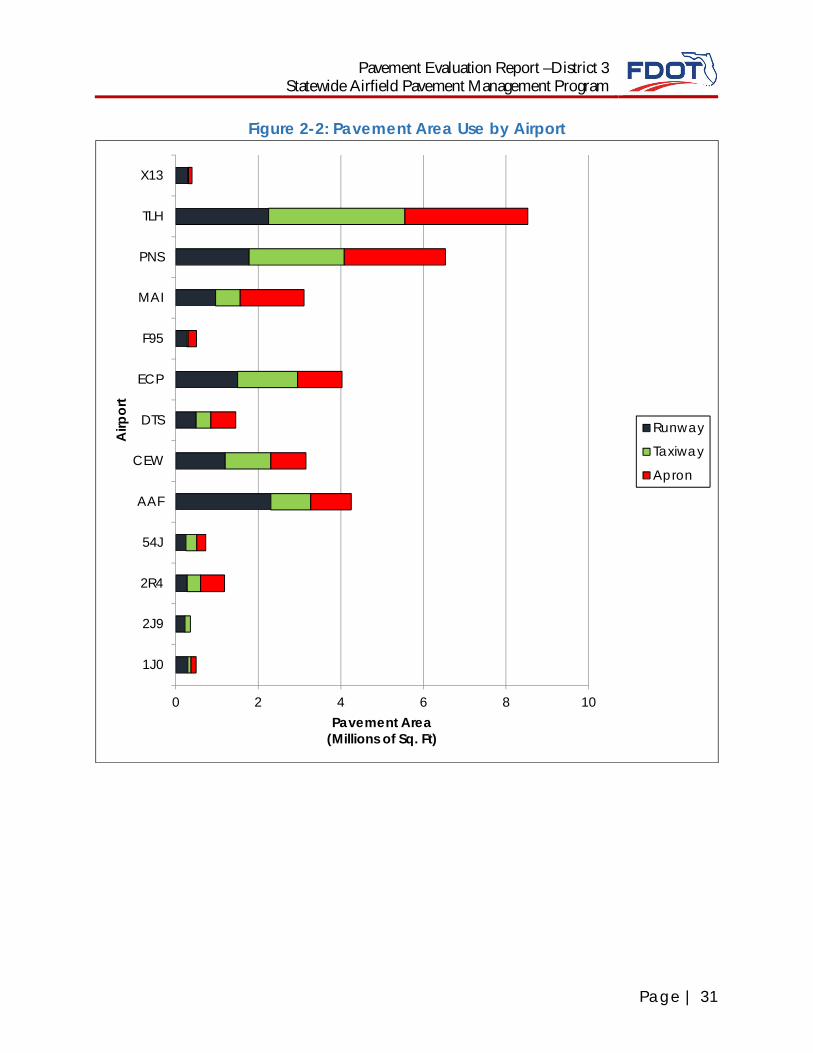
The updated areas for the District airports by facility Use are summarized in Table2-1: Summary of Area by Facility Use by Airport. Separately, Figure 2-1: DistrictPavement Area by Use depicts the district airfield pavement areas by facilityuse, and Figure 2-2: Pavement Area Use by Airport provides a breakdown ofairfield pavement area by facility use at each participating airport for theDistrict.
Table 2-1: Summary of Area by Facility Use by AirportNetwork
IDAirportType
Pavement Area (Square Feet)
Runway Taxiway Apron Overall
1J0 GA 300,000 72,727 121,534 494,2602J9 GA 223,200 132,773 - 355,9732R4 GA 277,500 326,412 579,615 1,183,52754J GA 248,650 263,132 219,259 731,041AAF GA 2,303,994 967,353 979,973 4,251,320CEW GA 1,200,000 1,108,186 850,824 3,159,010DTS GA 500,075 352,286 606,643 1,459,004ECP PR 1,500,000 1,455,244 1,071,107 4,026,351F95 GA 270,000 34,539 203,342 507,881MAI GA 970,000 595,262 1,547,444 3,112,706PNS PR 1,778,396 2,308,190 2,444,716 6,531,302TLH PR 2,251,050 3,299,822 2,975,479 8,526,351X13 GA 302,918 9,699 80,724 393,341
DISTRICT 12,125,783 10,925,625 11,680,660 34,732,068
Pavement Evaluation Report – District 3Statewide Airfield Pavement Management Program
Page | 30
Figure 2-1: District Pavement Area by Use
11.7
10.9
12.1
0.0 4.0 8.0 12.0 16.0 20.0
Dist
rict3
Area(Millions of Sq. Ft)
Runway
Taxiway
Apron
Pavement Evaluation Report –District 3Statewide Airfield Pavement Management Program
Page | 31
Figure 2-2: Pavement Area Use by Airport
0 2 4 6 8 10
1J0
2J9
2R4
54J
AAF
CEW
DTS
ECP
F95
MAI
PNS
TLH
X13
Pavement Area(Millions of Sq. Ft)
Airp
ort
Runway
Taxiway
Apron

Pavement Evaluation Report –District 3Statewide Airfield Pavement Management Program
Page | 33
3. AIRFIELD PAVEMENT CONDITION ANALYSIS AND EVALUATION
Airfield pavement distresses and condition were surveyed in accordance withthe methods outlined in FAA Advisory Circular 150/5380-6C and ASTM D 5340-12.These procedures define distress type, severity, and quantity for sampling areaswithin each defined pavement section area to analyze and determine the PCIvalue and condition rating.
3.1 Updates to the ASTM D 5340As part of this program update, the SAPMP has adopted the changes made inupdates to ASTM D 5340-12 as the previous program had used the ASTM D 5340-04. These include the separation of Weathering and Raveling into two distinctflexible pavement distresses, and the addition of the Alkali-Silica Reactiondistress for rigid pavement distresses. Additionally, the deterioration associatedwith the rigid pavement distress Scaling/Map Cracking has been modifiedwhich results in moving Map Cracking from Scaling to ASR. In the newest versionof ASTM D 5340-12, there are two kinds of Shrinkage Cracking, Drying Shrinkageand Plastic Shrinkage. The difference between these two is that the depth of firstone may extend through the entire depth of the slab while the thickness of thelatter one normally does not extend very deep into the pavement’s surface.Furthermore, the Plastic Shrinkage consists of two subcategories: Plasticshrinkage (caused by atmosphere) and Plastic shrinkage (caused byconstruction). Another kind of Map Cracking is listed under Plastic shrinkage thatis caused by construction, as well as Crazing. This additional type of Shrinkagechange in distress classification, as described in ASTM D 5340-12, may result insmall variances in the PCI values from the previous inspection analysis. Increasesin PCI values in pavement Sections comparison to the previous programupdate, that have not been subject to repairs since the last inspection, may bea result from the updates to the analysis methodology.
Below is a brief description of the changes to the distresses presented in theASTM D 5340 methodology and a table summarizing the deduction affected.
a) Flexible Asphalt Concrete Pavement distresses for airfield pavements: Theprevious methodology which featured “(52) Weathering and Raveling”distress has been separated into two distresses “(52) Raveling” and “(57)Weathering”. Previously, areas that were recorded as “Weathering andRaveling” were considered as one distress with a high deduction. Basedon the updated methodology, in certain situations where “Weathering”only exists and does not meet the definition of “Raveling”, the PCI
Pavement Evaluation Report – District 3Statewide Airfield Pavement Management Program
Page | 34
deduction is not as high as the former “Weathering and Raveling”.Therefore, areas identified only as “(57) Weathering” based on currentASTM standards, which were previously identified as “(52) Weathering andRaveling”, may be subject to an improvement in PCI. In instances wherepavement PCI has increased due to this update, it is not due to animprovement in actual condition, however indicative of the adjusteddistress deterioration effects.
b) Rigid Portland Cement Concrete Pavement distresses for airfieldpavements: The previous methodology defined “(70) Scaling” as adistress that consisted of surface deterioration caused by constructiondefects, material defects, and environmental factors. The distress includedAlkali-Silica Reaction, also known as ASR. The current methodology hasseparated Alkali-Silica Reaction as a distress identified as “(76) Alkali-SilicaReaction / ASR”. As a result the previous “(70) Scaling” numericaldeduction contribution to the PCI has been reduced. Previous inspectionsthat recorded “(70) Scaling”, and currently do not exhibit “(76) Alkali-SilicaReactivity / ASR” may potentially see an increase in PCI. Additionally, (73)Shrinkage Cracks has been redefined as (73) Shrinkage Cracking.Shrinkage Cracking is characterized in two forms; drying shrinkage andplastic shrinkage. Drying shrinkage occurs over time as moisture leaves thepavement, it develops when hardened pavement continues to shrink asexcess water not needed for cement hydration evaporates. It forms whensubsurface resistance to the shrinkage is present and may extend throughthe entire depth of the slab. Plastic shrinkage develops when there is rapidloss of water in the surface of recently placed pavement or can form fromover finishing/overworking of the pavement during construction. Theseshrinkage cracks appear as a series of inter-connected hairline cracks, orpattern cracking, and are often observed throughout the majority of theslab surface. This condition is also referred to as map cracking or crazing.
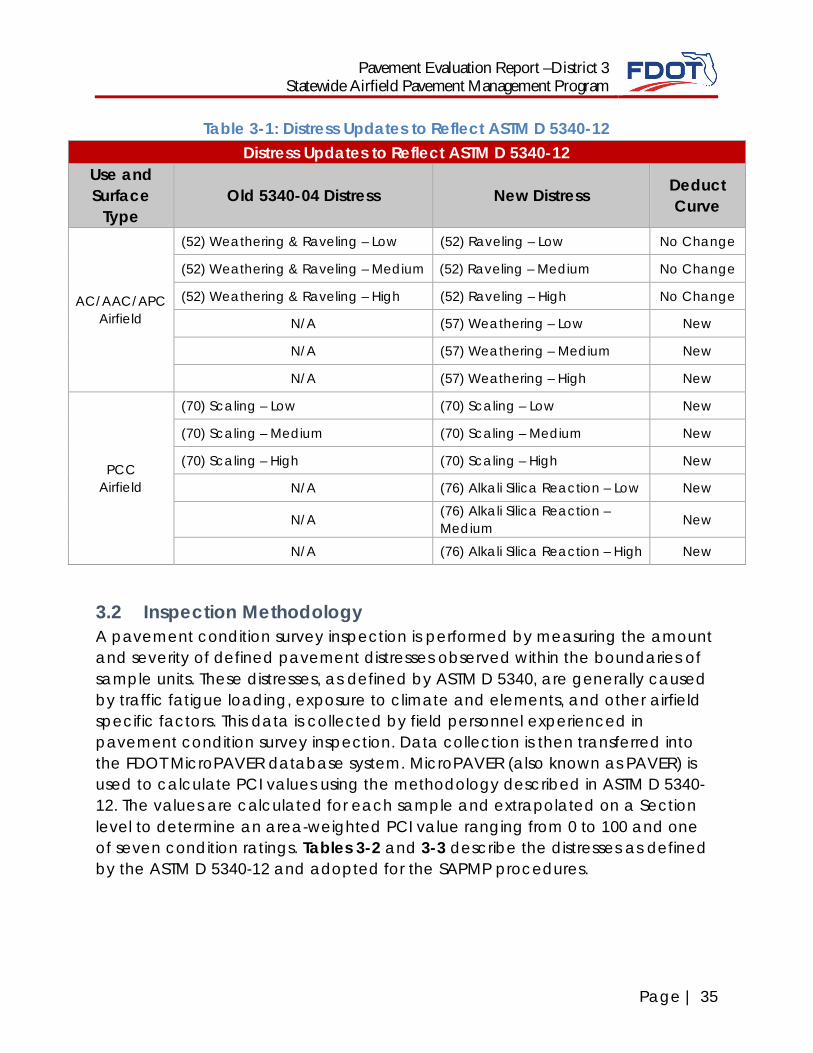
Table 3-1: Distress Updates to Reflect ASTM D 5340-12 provides a summary of thechanges due to the update.
Pavement Evaluation Report –District 3Statewide Airfield Pavement Management Program
Page | 35
Table 3-1: Distress Updates to Reflect ASTM D 5340-12Distress Updates to Reflect ASTM D 5340-12
Use andSurface
TypeOld 5340-04 Distress New Distress Deduct
Curve
AC/AAC/APCAirfield
(52) Weathering & Raveling – Low (52) Raveling – Low No Change
(52) Weathering & Raveling – Medium (52) Raveling – Medium No Change
(52) Weathering & Raveling – High (52) Raveling – High No Change
N/A (57) Weathering – Low New
N/A (57) Weathering – Medium New
N/A (57) Weathering – High New
PCCAirfield
(70) Scaling – Low (70) Scaling – Low New
(70) Scaling – Medium (70) Scaling – Medium New
(70) Scaling – High (70) Scaling – High New
N/A (76) Alkali Silica Reaction – Low New
N/A (76) Alkali Silica Reaction –Medium New
N/A (76) Alkali Silica Reaction – High New
3.2 Inspection MethodologyA pavement condition survey inspection is performed by measuring the amountand severity of defined pavement distresses observed within the boundaries ofsample units. These distresses, as defined by ASTM D 5340, are generally causedby traffic fatigue loading, exposure to climate and elements, and other airfieldspecific factors. This data is collected by field personnel experienced inpavement condition survey inspection. Data collection is then transferred intothe FDOT MicroPAVER database system. MicroPAVER (also known as PAVER) isused to calculate PCI values using the methodology described in ASTM D 5340-12. The values are calculated for each sample and extrapolated on a Sectionlevel to determine an area-weighted PCI value ranging from 0 to 100 and oneof seven condition ratings. Tables 3-2 and 3-3 describe the distresses as definedby the ASTM D 5340-12 and adopted for the SAPMP procedures.
Pavement Evaluation Report – District 3Statewide Airfield Pavement Management Program
Page | 36
Table 3-1: Airfield Pavement Distresses for Asphalt ConcreteCode Distress Primary Mechanisms
41 Alligator Cracking Load / Fatigue Failure
42 Bleeding Construction Quality/ MixDesign
43 Block Cracking Climate / Age
44 Corrugation Load / Construction Quality
45 Depression Subgrade Quality
46 Jet Blast Aircraft
47 Joint Reflection – Cracking Climate / Prior Pavement
48 Longitudinal/Transverse Cracking Climate / Age
49 Oil Spillage Aircraft / Vehicle
50 Patching Utility / Pavement Repair
51 Polished Aggregate Repeated Traffic Loading
52 Raveling Climate / Load
53 Rutting Repeated Traffic Loading
54 Shoving PCC Pavement Growth /Movement
55 Slippage Cracking Load / Pavement Bond
56 Swelling Climate / Subgrade Quality
57 Weathering Climate
Source: U.S. Army CERL, FDOT Airfield Inspection Reference Manual
Pavement Evaluation Report –District 3Statewide Airfield Pavement Management Program
Page | 37
Table 3-2: Airfield Pavement Distresses for Portland Cement ConcreteCode Distress Primary Mechanisms
61 Blow-up Climate / Alkali Silica Reaction
62 Corner Break Load Repetition / CurlingStresses
63 Linear Cracking Load Repetition / CurlingStresses / Shrinkage Stresses
64 Durability Cracking Freeze-Thaw Cycling
65 Joint Seal Damage Material Deterioration /Construction Quality
66 Small Patch Pavement Repair
67 Large Patch/Utility Cut Utility / Pavement Repair
68 Popout Freeze-Thaw Cycling
69 Pumping Load Repetition / Poor JointSealant
70 Scaling/Crazing Construction Quality / Freeze-Thaw Cycling
71 Faulting Load Repetition / SubgradeQuality
72 Shattered Slab Overloading
73 Shrinkage Cracking Construction Quality / Load
74 Joint Spalling Load Repetition / Infiltration ofIncompressible Material
75 Corner Spalling Load Repetition / Infiltration ofIncompressible Material
76 Alkali-Silica Reaction Construction Quality / Climate
Source: U.S. Army CERL, FDOT Airfield Inspection Reference Manual
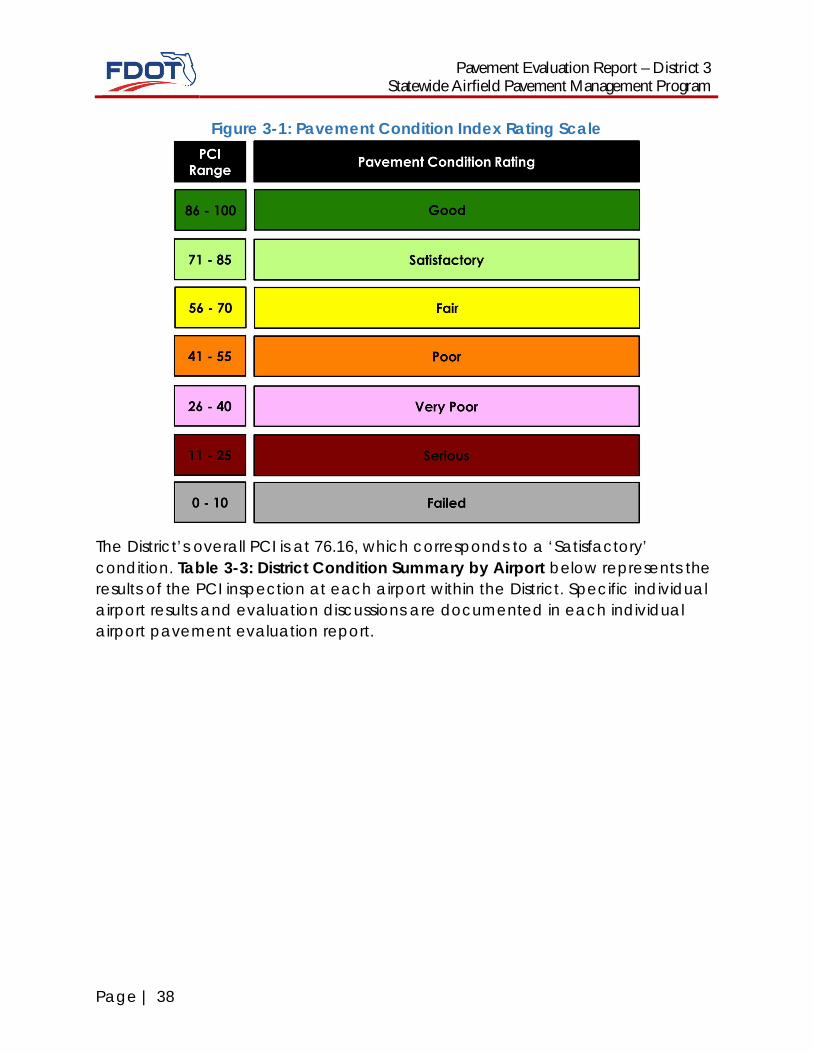
3.3 Airfield Pavement Condition Index Analysis ResultsThe Pavement Condition Index (PCI) results based on the ASTM D 5340 havebeen developed by analyzing the specific distress data collection from fieldinspections using the U.S. Army Corps of Engineers MicroPAVER 6.5 Software (alsoknown as PAVER). In adherence to the ASTM D 5340-12, the software packageanalyzes the distinct pavement distress data in both quantity and severity incalculating a PCI that ranges from 100 to 0, with corresponding condition ratingsof “Good” to “Failed” respectively. Figure 3-1: Pavement Condition Index RatingScale depicts the seven ranges of index and the associated rating used in theSAPMP.
Pavement Evaluation Report – District 3Statewide Airfield Pavement Management Program
Page | 38
Figure 3-1: Pavement Condition Index Rating Scale
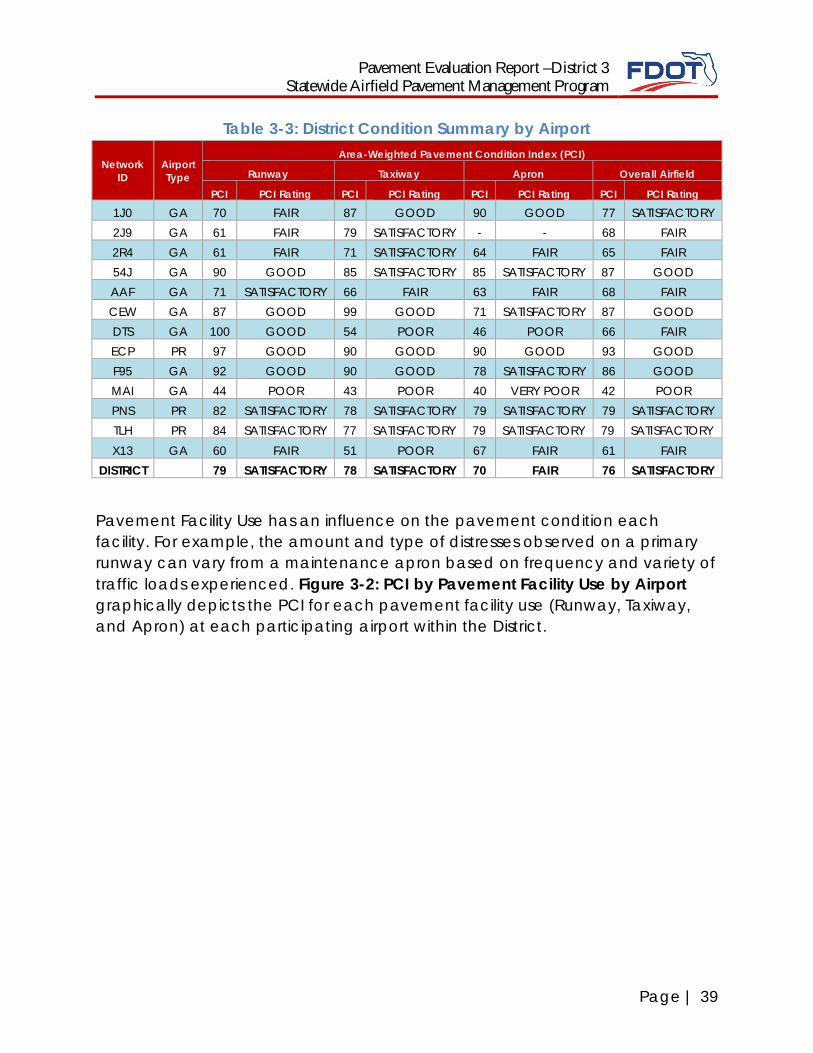
The District’s overall PCI is at 76.16, which corresponds to a ‘Satisfactory’condition. Table 3-3: District Condition Summary by Airport below represents theresults of the PCI inspection at each airport within the District. Specific individualairport results and evaluation discussions are documented in each individualairport pavement evaluation report.
Pavement Evaluation Report –District 3Statewide Airfield Pavement Management Program
Page | 39
Table 3-3: District Condition Summary by Airport
NetworkID
AirportType
Area-Weighted Pavement Condition Index (PCI)
Runway Taxiway Apron Overall Airfield
PCI PCI Rating PCI PCI Rating PCI PCI Rating PCI PCI Rating
1J0 GA 70 FAIR 87 GOOD 90 GOOD 77 SATISFACTORY2J9 GA 61 FAIR 79 SATISFACTORY - - 68 FAIR2R4 GA 61 FAIR 71 SATISFACTORY 64 FAIR 65 FAIR54J GA 90 GOOD 85 SATISFACTORY 85 SATISFACTORY 87 GOODAAF GA 71 SATISFACTORY 66 FAIR 63 FAIR 68 FAIRCEW GA 87 GOOD 99 GOOD 71 SATISFACTORY 87 GOODDTS GA 100 GOOD 54 POOR 46 POOR 66 FAIRECP PR 97 GOOD 90 GOOD 90 GOOD 93 GOODF95 GA 92 GOOD 90 GOOD 78 SATISFACTORY 86 GOODMAI GA 44 POOR 43 POOR 40 VERY POOR 42 POORPNS PR 82 SATISFACTORY 78 SATISFACTORY 79 SATISFACTORY 79 SATISFACTORYTLH PR 84 SATISFACTORY 77 SATISFACTORY 79 SATISFACTORY 79 SATISFACTORYX13 GA 60 FAIR 51 POOR 67 FAIR 61 FAIR
DISTRICT 79 SATISFACTORY 78 SATISFACTORY 70 FAIR 76 SATISFACTORY
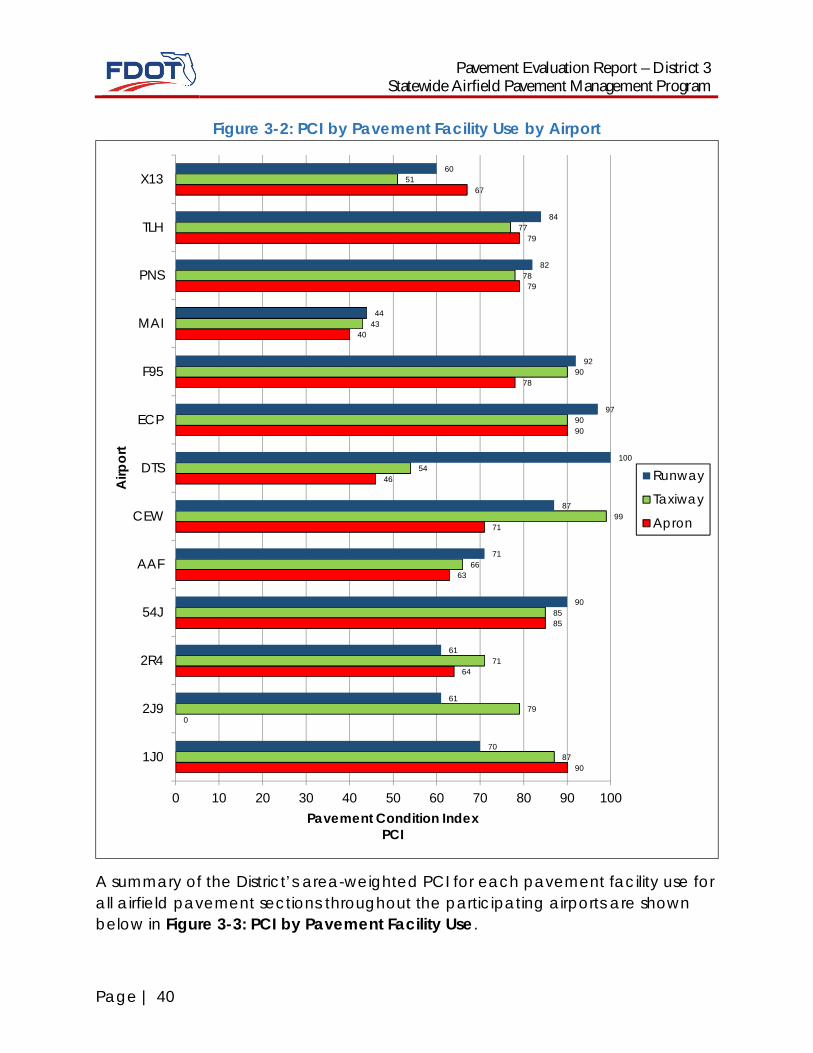
Pavement Facility Use has an influence on the pavement condition eachfacility. For example, the amount and type of distresses observed on a primaryrunway can vary from a maintenance apron based on frequency and variety oftraffic loads experienced. Figure 3-2: PCI by Pavement Facility Use by Airportgraphically depicts the PCI for each pavement facility use (Runway, Taxiway,and Apron) at each participating airport within the District.
Pavement Evaluation Report – District 3Statewide Airfield Pavement Management Program
Page | 40
Figure 3-2: PCI by Pavement Facility Use by Airport
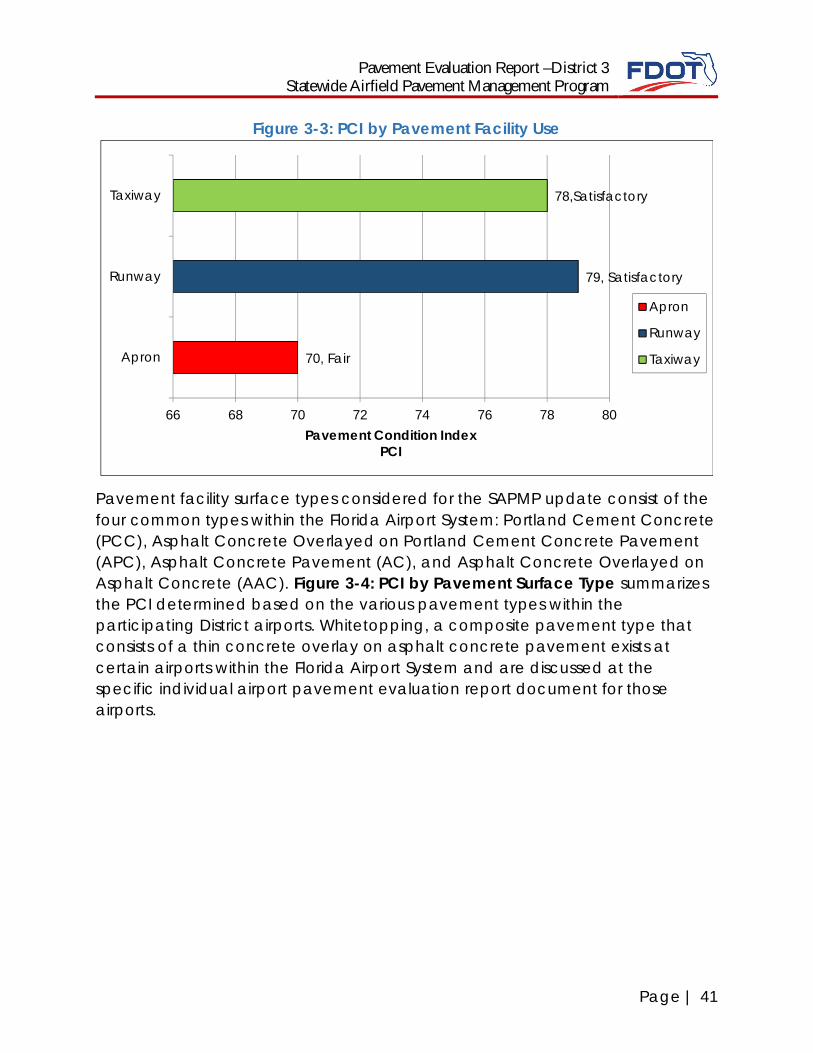
A summary of the District’s area-weighted PCI for each pavement facility use forall airfield pavement sections throughout the participating airports are shownbelow in Figure 3-3: PCI by Pavement Facility Use.
90
0
64
85
63
71
46
90
78
40
79
79
67
87
79
71
85
66
99
54
90
90
43
78
77
51
70
61
61
90
71
87
100
97
92
44
82
84
60
0 10 20 30 40 50 60 70 80 90 100
1J0
2J9
2R4
54J
AAF
CEW
DTS
ECP
F95
MAI
PNS
TLH
X13
Pavement Condition IndexPCI
Airp
ort
Runway
Taxiway
Apron
Pavement Evaluation Report –District 3Statewide Airfield Pavement Management Program
Page | 41
Figure 3-3: PCI by Pavement Facility Use
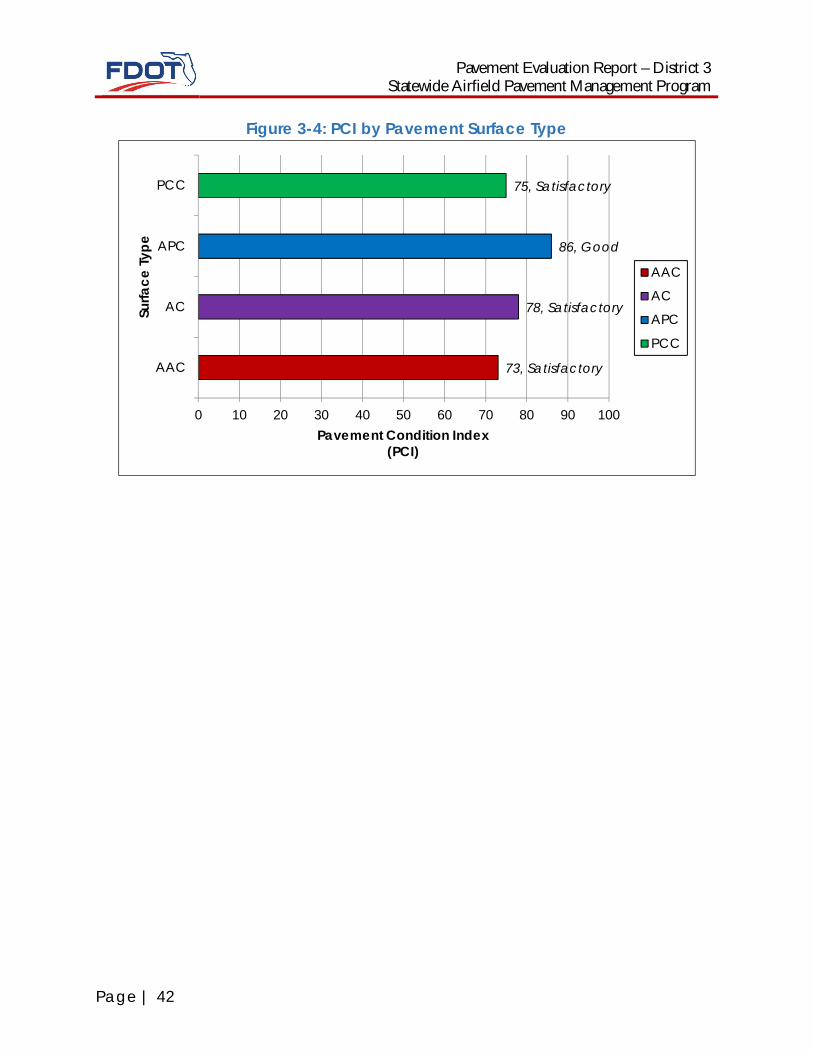
Pavement facility surface types considered for the SAPMP update consist of thefour common types within the Florida Airport System: Portland Cement Concrete(PCC), Asphalt Concrete Overlayed on Portland Cement Concrete Pavement(APC), Asphalt Concrete Pavement (AC), and Asphalt Concrete Overlayed onAsphalt Concrete (AAC). Figure 3-4: PCI by Pavement Surface Type summarizesthe PCI determined based on the various pavement types within theparticipating District airports. Whitetopping, a composite pavement type thatconsists of a thin concrete overlay on asphalt concrete pavement exists atcertain airports within the Florida Airport System and are discussed at thespecific individual airport pavement evaluation report document for thoseairports.
70, Fair
79, Satisfactory
78,Satisfactory
66 68 70 72 74 76 78 80
Apron
Runway
Taxiway
Pavement Condition IndexPCI
Apron
Runway
Taxiway
Pavement Evaluation Report – District 3Statewide Airfield Pavement Management Program
Page | 42
Figure 3-4: PCI by Pavement Surface Type
73, Satisfactory
78, Satisfactory
86, Good
75, Satisfactory
0 10 20 30 40 50 60 70 80 90 100
AAC
AC
APC
PCC
Pavement Condition Index(PCI)
Surfa
ceTy
pe
AAC
AC
APC
PCC
Pavement Evaluation Report –District 3Statewide Airfield Pavement Management Program
Page | 43
4. PAVEMENT PERFORMANCE MODELING
4.1 Pavement Performance Model ConceptAs part of the FDOT SAPMP update, pavement performance models aredeveloped from the distress data collected at each participating airport facilitywithin the Florida Airports System. This data is consolidated in a database andorganized by inspection date, pavement type, age, pavement use, and airportcategory.
The consolidation of the Florida Airports System’s pavement infrastructure withinthe FDOT SAPMP is based on data that has been collected in a consistentmethod of measurement. The historic pavement condition, or performancetrend, has been compiled throughout the system with data from the inceptionof the SAPMP. This data is processed into models that have been analyzed anddeveloped into prediction curves based upon pavement characteristics. Thesecharacteristics include; climate, construction material, and operations. Eachmodel has been developed based on the following criteria:
AIRPORT TYPE (Primary, Regional Reliever, or General Aviation)
>FACILITY USE (Runway, Taxiway, or Apron)
>>FACILITY SURFACE TYPE (AC, AAC, APC, or PCC)
The historic trends of pavement performance at Florida airport facilities for allperformance models are consolidated within the program database. Thisinformation is utilized in the prediction of pavement performance based on thecurrent PCI determined from the inspections that took place between 2013 and2015. Major rehabilitation is planned based on the predicted PCI. The intent ofthis is for both the individual airport and the FDOT District personnel to be awareof anticipated major rehabilitation work based on condition.
Each airport’s airfield pavement section condition, for a given inspection year, isone data point that was used as the basis of each performance trend using aperformance model based on pavements of similar background.
4.2 Performance Model UpdateThe performance models are developed from the current update data at theaforementioned facilities combined with the historic FDOT SAPMP Florida AirportsSystem Database. This data is consolidated in a database system usingMicroPAVER (also known as PAVER) and organized by specific attributes defined
Pavement Evaluation Report – District 3Statewide Airfield Pavement Management Program
Page | 44
by the pavement system inventory. The pavement system inventory includesinspection data, pavement type, age, pavement use, airport category, FDOTDistrict and pavement ranking. The pavement performance models are used todevelop broad prediction models, also known as pavement conditiondeterioration curves or “Prediction Curves”.
The consolidation of the Florida Airports System’s pavement infrastructure withinthe FDOT SAPMP is based on data that has been systematically collected in amanner consistent with the ASTM D5340 Standard Test Method for AirportPavement Condition Surveys. It should be noted that since the inception of theprogram, the ASTM D5340 has undergone updates that have modified themethod of inspection based on research.
Example: Taxiways constructed from Asphalt Concrete at a Primary AirportAIRPORT TYPE (Primary, Regional Reliever, or General Aviation)
>FACILITY USE (Runway, Taxiway, or Apron)>>FACILITY SURFACE TYPE (AC, AAC, APC, or PCC)
FDOT-SAPMP-PR-TW-AC
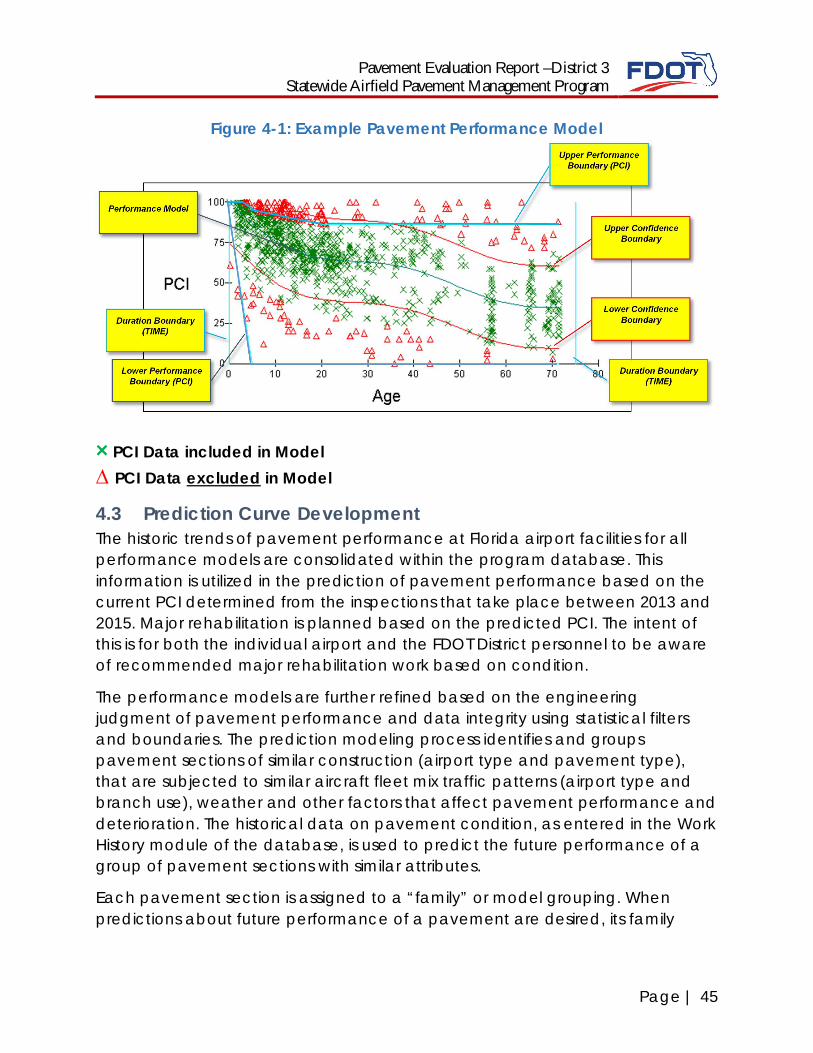
A most recent change was observed in ASTM D5340-10 which updated themethods of identifying and rating the following distresses” Weathering (AC),Raveling (AC), and Scaling (PCC). The historic pavement condition, orperformance trend, has been compiled based on condition data collectedfrom the inception of the SAPMP. This data is processed into performancemodels that have been analyzed and developed into prediction curves basedupon pavement characteristics. Figure 4-1: Example Pavement PerformanceModel depicts an example of a performance model and data points comprisedof historic construction milestones provided by the airports and inspection datain accordance with the ASTM D 5340.
Pavement Evaluation Report –District 3Statewide Airfield Pavement Management Program
Page | 45
Figure 4-1: Example Pavement Performance Model
× PCI Data included in Model∆ PCI Data excluded in Model
4.3 Prediction Curve DevelopmentThe historic trends of pavement performance at Florida airport facilities for allperformance models are consolidated within the program database. Thisinformation is utilized in the prediction of pavement performance based on thecurrent PCI determined from the inspections that take place between 2013 and2015. Major rehabilitation is planned based on the predicted PCI. The intent ofthis is for both the individual airport and the FDOT District personnel to be awareof recommended major rehabilitation work based on condition.
The performance models are further refined based on the engineeringjudgment of pavement performance and data integrity using statistical filtersand boundaries. The prediction modeling process identifies and groupspavement sections of similar construction (airport type and pavement type),that are subjected to similar aircraft fleet mix traffic patterns (airport type andbranch use), weather and other factors that affect pavement performance anddeterioration. The historical data on pavement condition, as entered in the WorkHistory module of the database, is used to predict the future performance of agroup of pavement sections with similar attributes.
Each pavement section is assigned to a “family” or model grouping. Whenpredictions about future performance of a pavement are desired, its family
Pavement Evaluation Report – District 3Statewide Airfield Pavement Management Program
Page | 46
model is used to predict future condition. The input of current age of pavementis applied on the performance model family equation.
The following factors influence the life of a pavement within the performancemodel; original construction type/date, maintenance, weather, and traffic. Theperformance model and prediction curve process is designed to allow users toblend unique knowledge about their pavements and measured local conditioninformation to plan for project development.
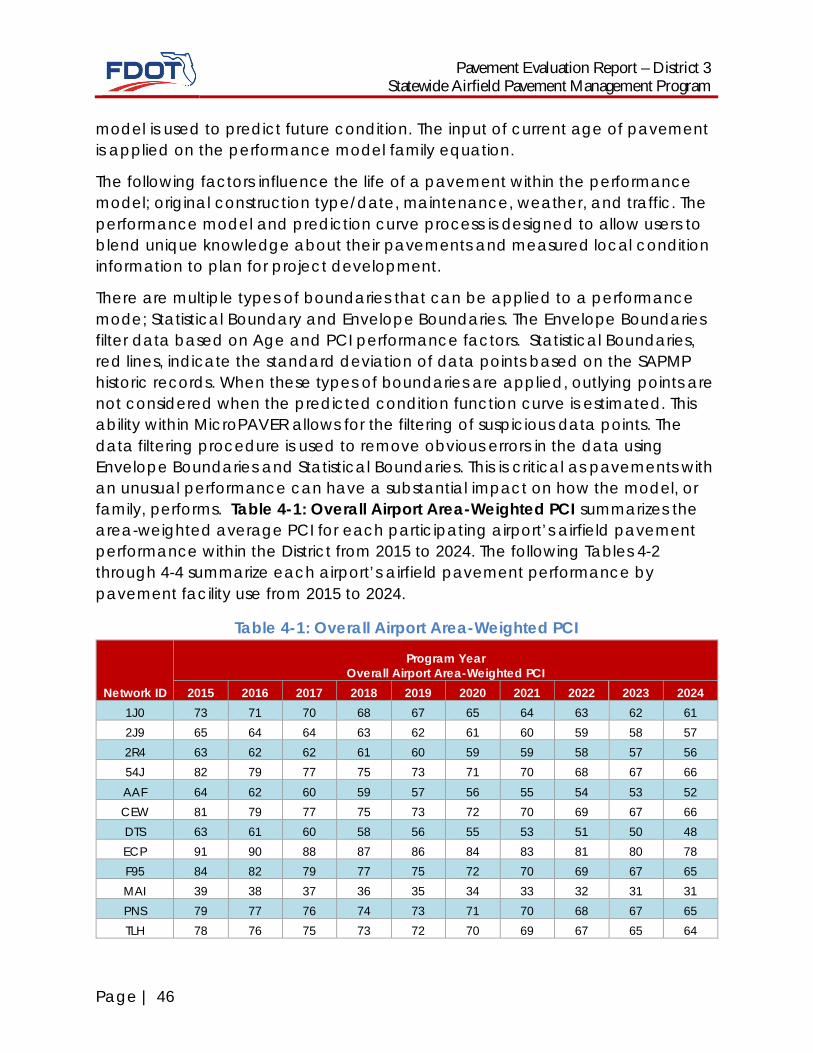
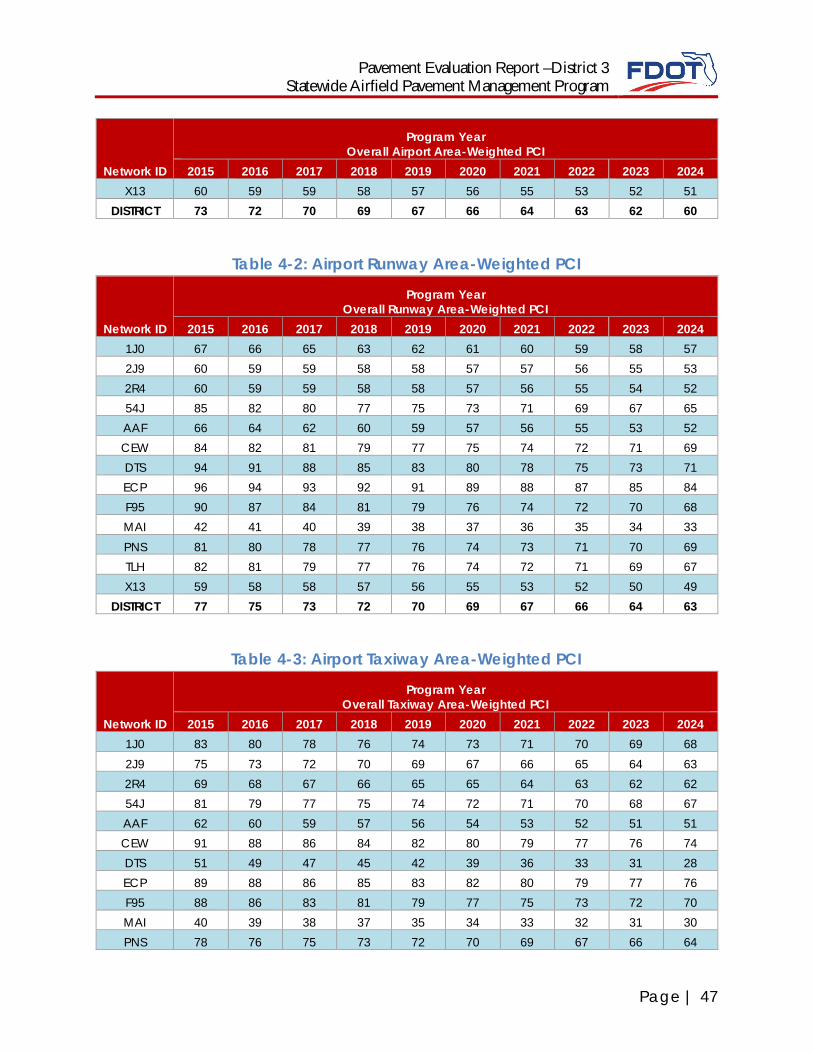
There are multiple types of boundaries that can be applied to a performancemode; Statistical Boundary and Envelope Boundaries. The Envelope Boundariesfilter data based on Age and PCI performance factors. Statistical Boundaries,red lines, indicate the standard deviation of data points based on the SAPMPhistoric records. When these types of boundaries are applied, outlying points arenot considered when the predicted condition function curve is estimated. Thisability within MicroPAVER allows for the filtering of suspicious data points. Thedata filtering procedure is used to remove obvious errors in the data usingEnvelope Boundaries and Statistical Boundaries. This is critical as pavements withan unusual performance can have a substantial impact on how the model, orfamily, performs. Table 4-1: Overall Airport Area-Weighted PCI summarizes thearea-weighted average PCI for each participating airport’s airfield pavementperformance within the District from 2015 to 2024. The following Tables 4-2through 4-4 summarize each airport’s airfield pavement performance bypavement facility use from 2015 to 2024.
Table 4-1: Overall Airport Area-Weighted PCI
Network ID
Program YearOverall Airport Area-Weighted PCI
2015 2016 2017 2018 2019 2020 2021 2022 2023 20241J0 73 71 70 68 67 65 64 63 62 612J9 65 64 64 63 62 61 60 59 58 572R4 63 62 62 61 60 59 59 58 57 5654J 82 79 77 75 73 71 70 68 67 66AAF 64 62 60 59 57 56 55 54 53 52CEW 81 79 77 75 73 72 70 69 67 66DTS 63 61 60 58 56 55 53 51 50 48ECP 91 90 88 87 86 84 83 81 80 78F95 84 82 79 77 75 72 70 69 67 65MAI 39 38 37 36 35 34 33 32 31 31PNS 79 77 76 74 73 71 70 68 67 65TLH 78 76 75 73 72 70 69 67 65 64
Pavement Evaluation Report –District 3Statewide Airfield Pavement Management Program
Page | 47
Network ID
Program YearOverall Airport Area-Weighted PCI
2015 2016 2017 2018 2019 2020 2021 2022 2023 2024X13 60 59 59 58 57 56 55 53 52 51
DISTRICT 73 72 70 69 67 66 64 63 62 60
Table 4-2: Airport Runway Area-Weighted PCI
Network ID
Program YearOverall Runway Area-Weighted PCI
2015 2016 2017 2018 2019 2020 2021 2022 2023 20241J0 67 66 65 63 62 61 60 59 58 572J9 60 59 59 58 58 57 57 56 55 532R4 60 59 59 58 58 57 56 55 54 5254J 85 82 80 77 75 73 71 69 67 65AAF 66 64 62 60 59 57 56 55 53 52CEW 84 82 81 79 77 75 74 72 71 69DTS 94 91 88 85 83 80 78 75 73 71ECP 96 94 93 92 91 89 88 87 85 84F95 90 87 84 81 79 76 74 72 70 68MAI 42 41 40 39 38 37 36 35 34 33PNS 81 80 78 77 76 74 73 71 70 69TLH 82 81 79 77 76 74 72 71 69 67X13 59 58 58 57 56 55 53 52 50 49
DISTRICT 77 75 73 72 70 69 67 66 64 63
Table 4-3: Airport Taxiway Area-Weighted PCI
Network ID
Program YearOverall Taxiway Area-Weighted PCI
2015 2016 2017 2018 2019 2020 2021 2022 2023 20241J0 83 80 78 76 74 73 71 70 69 682J9 75 73 72 70 69 67 66 65 64 632R4 69 68 67 66 65 65 64 63 62 6254J 81 79 77 75 74 72 71 70 68 67AAF 62 60 59 57 56 54 53 52 51 51CEW 91 88 86 84 82 80 79 77 76 74DTS 51 49 47 45 42 39 36 33 31 28ECP 89 88 86 85 83 82 80 79 77 76F95 88 86 83 81 79 77 75 73 72 70MAI 40 39 38 37 35 34 33 32 31 30PNS 78 76 75 73 72 70 69 67 66 64
Pavement Evaluation Report – District 3Statewide Airfield Pavement Management Program
Page | 48
Network ID
Program YearOverall Taxiway Area-Weighted PCI
2015 2016 2017 2018 2019 2020 2021 2022 2023 2024TLH 76 75 73 72 71 69 68 67 65 64X13 48 47 46 45 44 43 42 41 40 39
DISTRICT 76 74 72 71 69 68 67 65 64 63
Table 4-4: Airport Apron Area-Weighted PCI
Network ID
Program YearOverall Apron Area-Weighted PCI
2015 2016 2017 2018 2019 2020 2021 2022 2023 20241J0 83 80 77 75 73 72 70 69 68 672R4 61 60 60 59 58 57 57 56 55 5554J 78 76 73 71 70 68 67 66 65 64AAF 59 58 57 56 55 54 54 54 53 53CEW 64 62 60 59 57 56 54 53 52 51DTS 45 44 44 43 43 42 42 42 41 41ECP 89 87 85 83 81 80 78 76 74 73F95 76 74 72 70 69 67 65 64 62 61MAI 37 36 35 34 33 32 31 30 30 29PNS 78 77 75 73 72 70 69 67 66 64TLH 77 75 73 72 70 68 66 65 63 61X13 66 65 64 63 63 62 61 61 60 59
DISTRICT 68 67 65 64 62 61 60 58 57 56
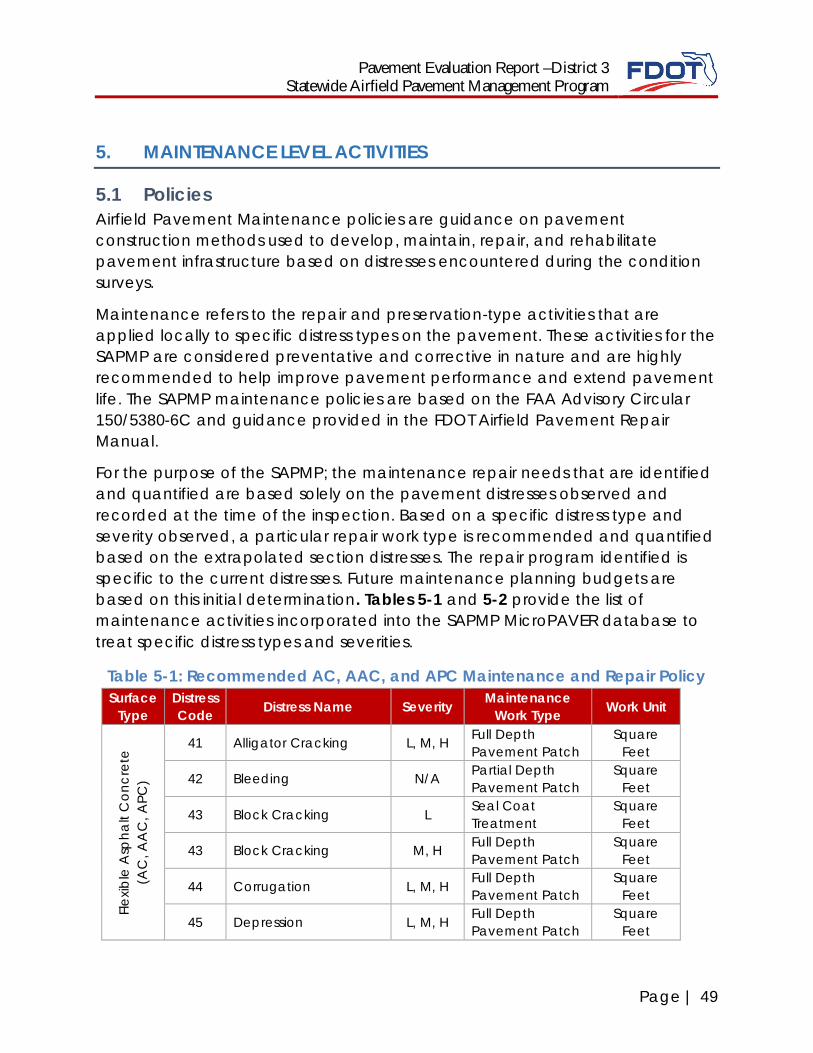
Pavement Evaluation Report –District 3Statewide Airfield Pavement Management Program
Page | 49
5. MAINTENANCE LEVEL ACTIVITIES
5.1 PoliciesAirfield Pavement Maintenance policies are guidance on pavementconstruction methods used to develop, maintain, repair, and rehabilitatepavement infrastructure based on distresses encountered during the conditionsurveys.
Maintenance refers to the repair and preservation-type activities that areapplied locally to specific distress types on the pavement. These activities for theSAPMP are considered preventative and corrective in nature and are highlyrecommended to help improve pavement performance and extend pavementlife. The SAPMP maintenance policies are based on the FAA Advisory Circular150/5380-6C and guidance provided in the FDOT Airfield Pavement RepairManual.
For the purpose of the SAPMP; the maintenance repair needs that are identifiedand quantified are based solely on the pavement distresses observed andrecorded at the time of the inspection. Based on a specific distress type andseverity observed, a particular repair work type is recommended and quantifiedbased on the extrapolated section distresses. The repair program identified isspecific to the current distresses. Future maintenance planning budgets arebased on this initial determination. Tables 5-1 and 5-2 provide the list ofmaintenance activities incorporated into the SAPMP MicroPAVER database totreat specific distress types and severities.
Table 5-1: Recommended AC, AAC, and APC Maintenance and Repair PolicySurface
TypeDistressCode Distress Name Severity Maintenance
Work Type Work Unit
Flexib
leA
spha
ltC
oncr
ete
(AC
,AA
C,A
PC)
41 Alligator Cracking L, M, H Full DepthPavement Patch
SquareFeet
42 Bleeding N/A Partial DepthPavement Patch
SquareFeet
43 Block Cracking L Seal CoatTreatment
SquareFeet
43 Block Cracking M, H Full DepthPavement Patch
SquareFeet
44 Corrugation L, M, H Full DepthPavement Patch
SquareFeet
45 Depression L, M, H Full DepthPavement Patch
SquareFeet
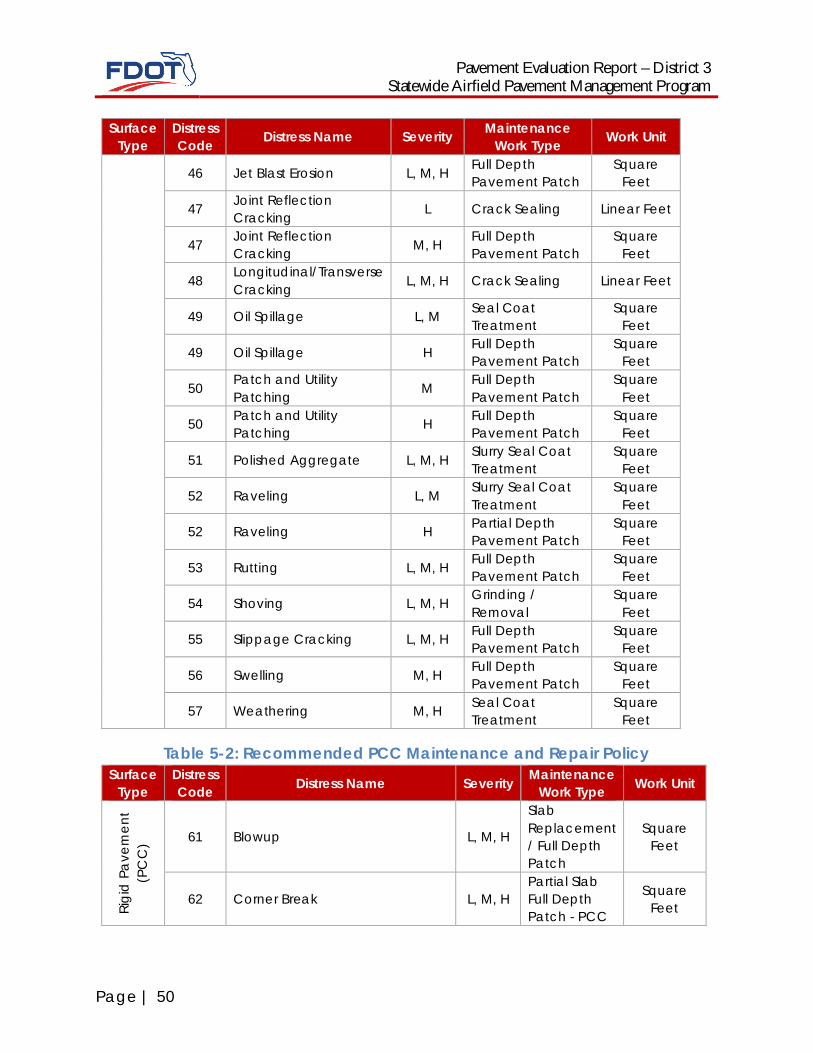
Pavement Evaluation Report – District 3Statewide Airfield Pavement Management Program
Page | 50
SurfaceType
DistressCode Distress Name Severity Maintenance
Work Type Work Unit
46 Jet Blast Erosion L, M, H Full DepthPavement Patch
SquareFeet
47 Joint ReflectionCracking L Crack Sealing Linear Feet
47 Joint ReflectionCracking M, H Full Depth
Pavement PatchSquare
Feet
48 Longitudinal/TransverseCracking L, M, H Crack Sealing Linear Feet
49 Oil Spillage L, M Seal CoatTreatment
SquareFeet
49 Oil Spillage H Full DepthPavement Patch
SquareFeet
50 Patch and UtilityPatching M Full Depth
Pavement PatchSquare
Feet
50 Patch and UtilityPatching H Full Depth
Pavement PatchSquare
Feet
51 Polished Aggregate L, M, H Slurry Seal CoatTreatment
SquareFeet
52 Raveling L, M Slurry Seal CoatTreatment
SquareFeet
52 Raveling H Partial DepthPavement Patch
SquareFeet
53 Rutting L, M, H Full DepthPavement Patch
SquareFeet
54 Shoving L, M, H Grinding /Removal
SquareFeet
55 Slippage Cracking L, M, H Full DepthPavement Patch
SquareFeet
56 Swelling M, H Full DepthPavement Patch
SquareFeet
57 Weathering M, H Seal CoatTreatment
SquareFeet
Table 5-2: Recommended PCC Maintenance and Repair PolicySurface
TypeDistressCode Distress Name Severity Maintenance
Work Type Work Unit
Rigi
dPa
vem
ent
(PC
C) 61 Blowup L, M, H
SlabReplacement/ Full DepthPatch
SquareFeet
62 Corner Break L, M, HPartial SlabFull DepthPatch - PCC
SquareFeet
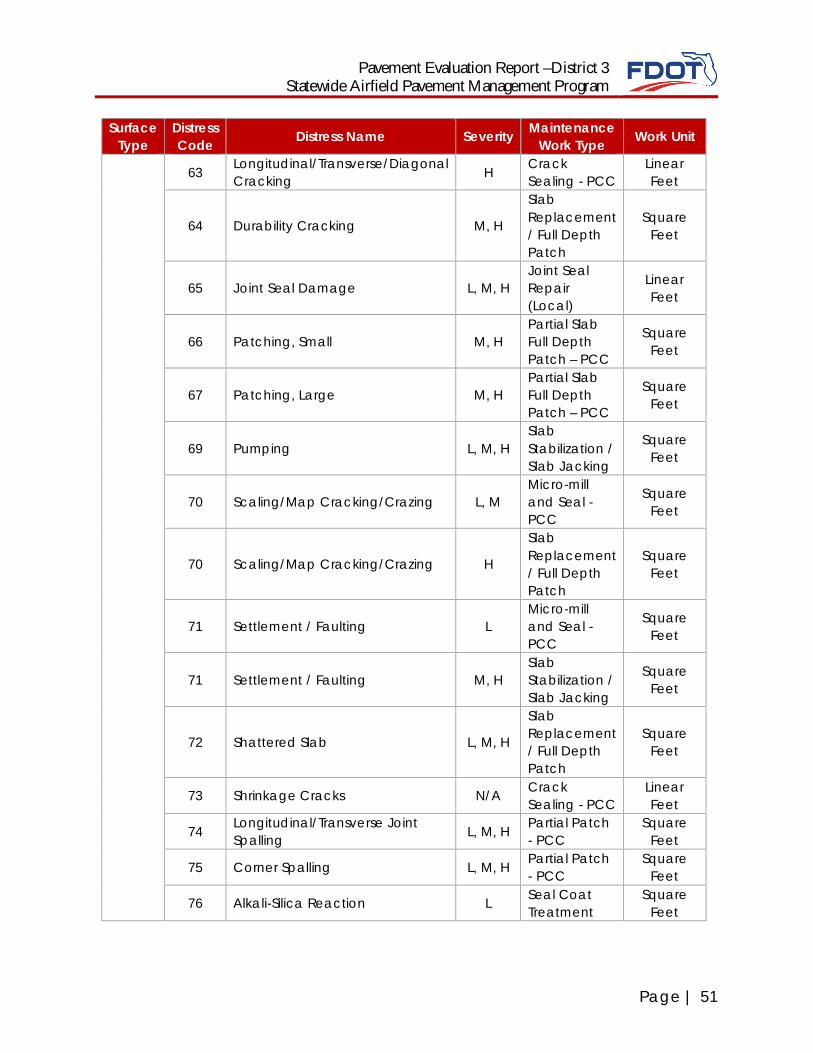
Pavement Evaluation Report –District 3Statewide Airfield Pavement Management Program
Page | 51
SurfaceType
DistressCode Distress Name Severity Maintenance
Work Type Work Unit
63 Longitudinal/Transverse/DiagonalCracking H Crack
Sealing - PCCLinearFeet
64 Durability Cracking M, H
SlabReplacement/ Full DepthPatch
SquareFeet
65 Joint Seal Damage L, M, HJoint SealRepair(Local)
LinearFeet
66 Patching, Small M, HPartial SlabFull DepthPatch – PCC
SquareFeet
67 Patching, Large M, HPartial SlabFull DepthPatch – PCC
SquareFeet
69 Pumping L, M, HSlabStabilization /Slab Jacking
SquareFeet
70 Scaling/Map Cracking/Crazing L, MMicro-milland Seal -PCC
SquareFeet
70 Scaling/Map Cracking/Crazing H
SlabReplacement/ Full DepthPatch
SquareFeet
71 Settlement / Faulting LMicro-milland Seal -PCC
SquareFeet
71 Settlement / Faulting M, HSlabStabilization /Slab Jacking
SquareFeet
72 Shattered Slab L, M, H
SlabReplacement/ Full DepthPatch
SquareFeet
73 Shrinkage Cracks N/A CrackSealing - PCC
LinearFeet
74 Longitudinal/Transverse JointSpalling L, M, H Partial Patch
- PCCSquare
Feet
75 Corner Spalling L, M, H Partial Patch- PCC
SquareFeet
76 Alkali-Silica Reaction L Seal CoatTreatment
SquareFeet
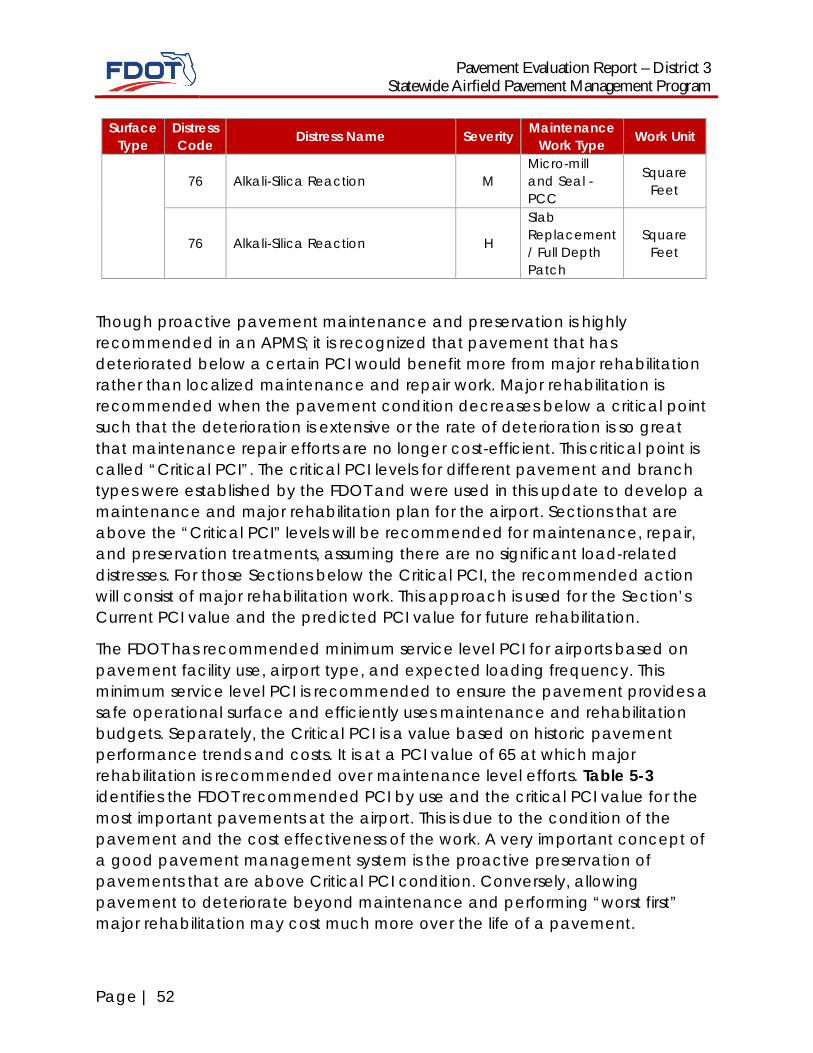
Pavement Evaluation Report – District 3Statewide Airfield Pavement Management Program
Page | 52
SurfaceType
DistressCode Distress Name Severity Maintenance
Work Type Work Unit
76 Alkali-Silica Reaction MMicro-milland Seal -PCC
SquareFeet
76 Alkali-Silica Reaction H
SlabReplacement/ Full DepthPatch
SquareFeet
Though proactive pavement maintenance and preservation is highlyrecommended in an APMS; it is recognized that pavement that hasdeteriorated below a certain PCI would benefit more from major rehabilitationrather than localized maintenance and repair work. Major rehabilitation isrecommended when the pavement condition decreases below a critical pointsuch that the deterioration is extensive or the rate of deterioration is so greatthat maintenance repair efforts are no longer cost-efficient. This critical point iscalled “Critical PCI”. The critical PCI levels for different pavement and branchtypes were established by the FDOT and were used in this update to develop amaintenance and major rehabilitation plan for the airport. Sections that areabove the “Critical PCI” levels will be recommended for maintenance, repair,and preservation treatments, assuming there are no significant load-relateddistresses. For those Sections below the Critical PCI, the recommended actionwill consist of major rehabilitation work. This approach is used for the Section’sCurrent PCI value and the predicted PCI value for future rehabilitation.
The FDOT has recommended minimum service level PCI for airports based onpavement facility use, airport type, and expected loading frequency. Thisminimum service level PCI is recommended to ensure the pavement provides asafe operational surface and efficiently uses maintenance and rehabilitationbudgets. Separately, the Critical PCI is a value based on historic pavementperformance trends and costs. It is at a PCI value of 65 at which majorrehabilitation is recommended over maintenance level efforts. Table 5-3identifies the FDOT recommended PCI by use and the critical PCI value for themost important pavements at the airport. This is due to the condition of thepavement and the cost effectiveness of the work. A very important concept ofa good pavement management system is the proactive preservation ofpavements that are above Critical PCI condition. Conversely, allowingpavement to deteriorate beyond maintenance and performing “worst first”major rehabilitation may cost much more over the life of a pavement.
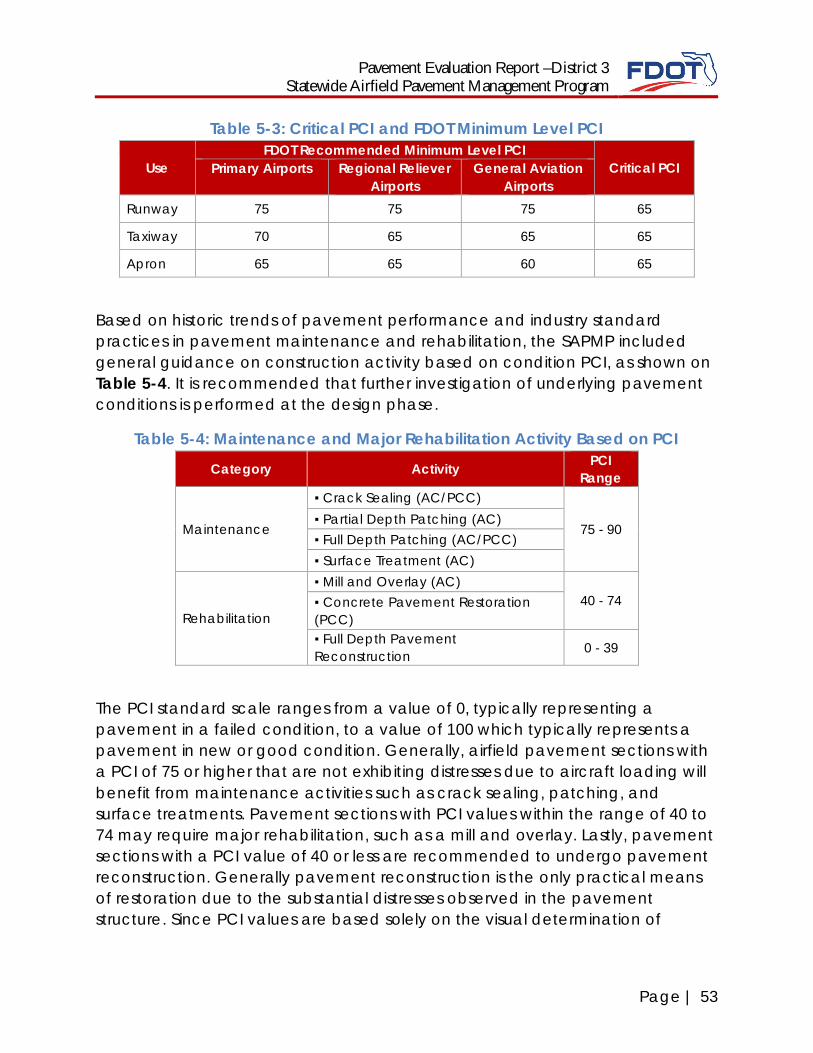
Pavement Evaluation Report –District 3Statewide Airfield Pavement Management Program
Page | 53
Table 5-3: Critical PCI and FDOT Minimum Level PCI
UseFDOT Recommended Minimum Level PCI
Critical PCIPrimary Airports Regional RelieverAirports
General AviationAirports
Runway 75 75 75 65
Taxiway 70 65 65 65
Apron 65 65 60 65
Based on historic trends of pavement performance and industry standardpractices in pavement maintenance and rehabilitation, the SAPMP includedgeneral guidance on construction activity based on condition PCI, as shown onTable 5-4. It is recommended that further investigation of underlying pavementconditions is performed at the design phase.
Table 5-4: Maintenance and Major Rehabilitation Activity Based on PCI
Category Activity PCIRange
Maintenance
▪ Crack Sealing (AC/PCC)
75 - 90▪ Partial Depth Patching (AC)▪ Full Depth Patching (AC/PCC)▪ Surface Treatment (AC)
Rehabilitation
▪ Mill and Overlay (AC)40 - 74▪ Concrete Pavement Restoration
(PCC)▪ Full Depth PavementReconstruction 0 - 39
The PCI standard scale ranges from a value of 0, typically representing apavement in a failed condition, to a value of 100 which typically represents apavement in new or good condition. Generally, airfield pavement sections witha PCI of 75 or higher that are not exhibiting distresses due to aircraft loading willbenefit from maintenance activities such as crack sealing, patching, andsurface treatments. Pavement sections with PCI values within the range of 40 to74 may require major rehabilitation, such as a mill and overlay. Lastly, pavementsections with a PCI value of 40 or less are recommended to undergo pavementreconstruction. Generally pavement reconstruction is the only practical meansof restoration due to the substantial distresses observed in the pavementstructure. Since PCI values are based solely on the visual determination of
Pavement Evaluation Report – District 3Statewide Airfield Pavement Management Program
Page | 54
pavement distresses and deterioration, this method does not provide a directmeasure of structural integrity.
5.2 Planning Level Unit CostsThe FDOT SAPMP developed and updated the maintenance and majorrehabilitation costs based on public cost databases for airport and highwaypavement construction. Additionally, cost data collected from FDOT and FAAsponsored projects in the Florida Airports System were utilized to identifyconstruction cost trends across the state.
The maintenance, repair, and preservation activity costs have been updatedand developed using readily available construction cost data at the time of thisupdate. The costs depicted in this report for both maintenance and majorrehabilitation are intended for planning purposes.
FDOT has no control over the cost of labor, materials, equipment, or over theContractor’s methods of determining prices or over competitive bidding ormarket conditions. Opinions of probable costs provided herein are based on theinformation known to FDOT at this time and represent only the standardjudgment as a design professional familiar with the construction industry. FDOTcannot and does not guarantee that proposals, bids, or actual constructioncosts will not vary from its opinions of probable costs.
5.3 Maintenance, Repair, and Major RehabilitationFDOT recognizes that although pavement mill and overlay is recommended forflexible asphalt concrete pavement within a PCI range from 40 to 74, it isconceivable that airports may not have adequate funding to perform this typeof major rehabilitation. A comprehensive surface treatment as described in FAAAC 150/5370-10G Standards for Specifying Construction of Airports used as amaintenance rehabilitation activity can be used in lieu of asphalt concretepavement mill and overlay. However, it should be understood that thesemeasures provide only a short term extension of pavement life. While the cost ofsurface treatments are significantly lower than that of pavement mill andoverlay, it is not intended or implied to be a full rehabilitative measure for longterm benefit. Table 5-5 and Table 5-6 provide budget costs associated with thework types shown in the table.
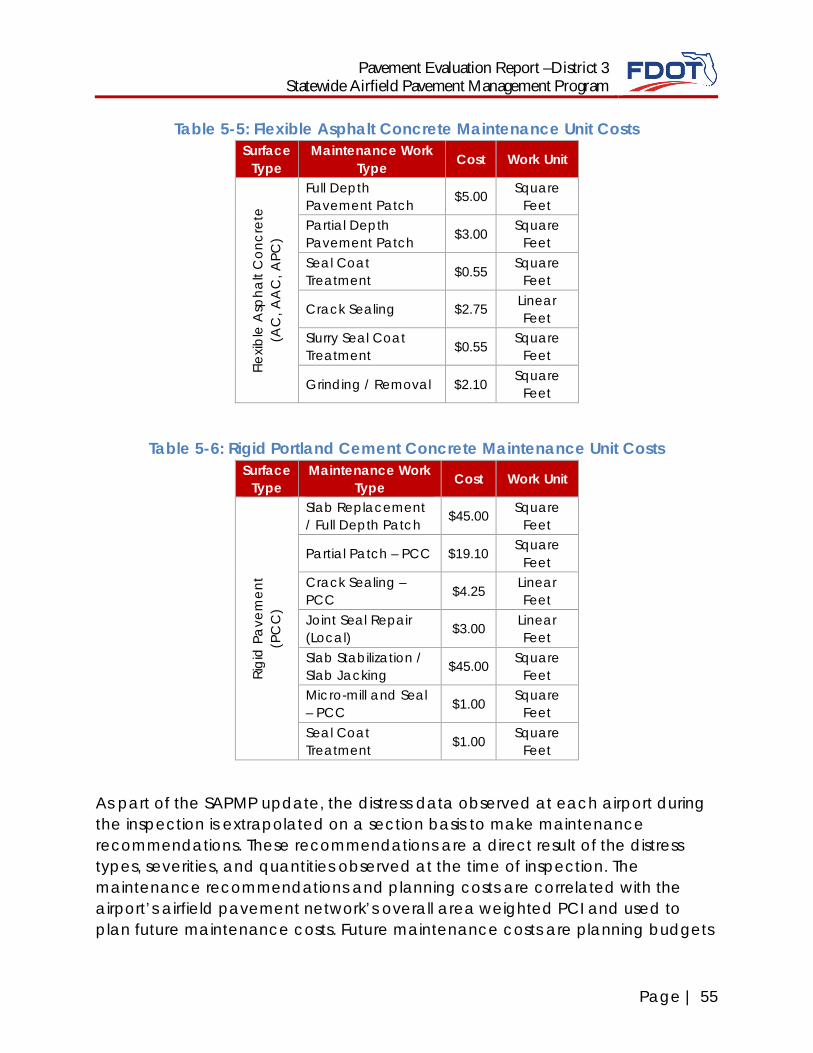
Pavement Evaluation Report –District 3Statewide Airfield Pavement Management Program
Page | 55
Table 5-5: Flexible Asphalt Concrete Maintenance Unit CostsSurface
TypeMaintenance Work
Type Cost Work Unit
Flexib
leA
spha
ltC
oncr
ete
(AC
,AA
C,A
PC)
Full DepthPavement Patch $5.00 Square
FeetPartial DepthPavement Patch $3.00 Square
FeetSeal CoatTreatment $0.55 Square
Feet
Crack Sealing $2.75 LinearFeet
Slurry Seal CoatTreatment $0.55 Square
Feet
Grinding / Removal $2.10 SquareFeet
Table 5-6: Rigid Portland Cement Concrete Maintenance Unit CostsSurface
TypeMaintenance Work
Type Cost Work Unit
Rigi
dPa
vem
ent
(PC
C)
Slab Replacement/ Full Depth Patch $45.00 Square
Feet
Partial Patch – PCC $19.10 SquareFeet
Crack Sealing –PCC $4.25 Linear
FeetJoint Seal Repair(Local) $3.00 Linear
FeetSlab Stabilization /Slab Jacking $45.00 Square
FeetMicro-mill and Seal– PCC $1.00 Square
FeetSeal CoatTreatment $1.00 Square
Feet
As part of the SAPMP update, the distress data observed at each airport duringthe inspection is extrapolated on a section basis to make maintenancerecommendations. These recommendations are a direct result of the distresstypes, severities, and quantities observed at the time of inspection. Themaintenance recommendations and planning costs are correlated with theairport’s airfield pavement network’s overall area weighted PCI and used toplan future maintenance costs. Future maintenance costs are planning budgets
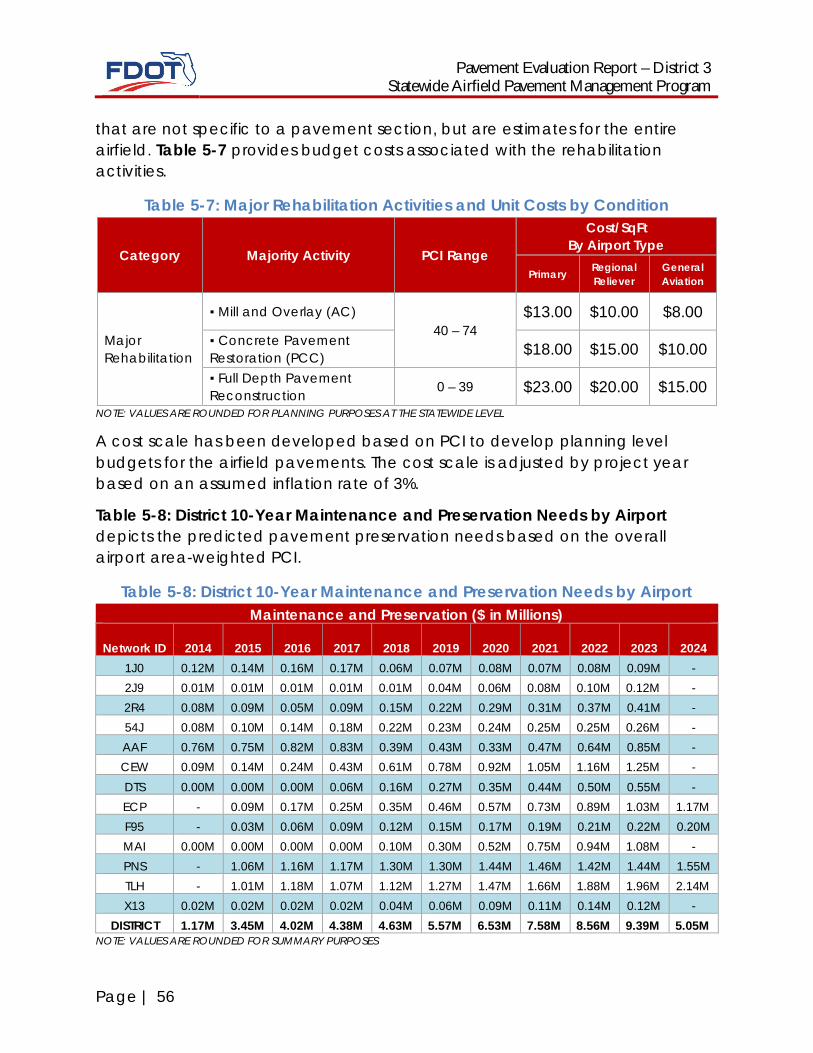
Pavement Evaluation Report – District 3Statewide Airfield Pavement Management Program
Page | 56
that are not specific to a pavement section, but are estimates for the entireairfield. Table 5-7 provides budget costs associated with the rehabilitationactivities.
Table 5-7: Major Rehabilitation Activities and Unit Costs by Condition
Category Majority Activity PCI Range
Cost/SqFtBy Airport Type
Primary RegionalReliever
GeneralAviation
MajorRehabilitation
▪ Mill and Overlay (AC)40 – 74
$13.00 $10.00 $8.00
▪ Concrete PavementRestoration (PCC) $18.00 $15.00 $10.00
▪ Full Depth PavementReconstruction 0 – 39 $23.00 $20.00 $15.00
NOTE: VALUES ARE ROUNDED FOR PLANNING PURPOSES AT THE STATEWIDE LEVEL
A cost scale has been developed based on PCI to develop planning levelbudgets for the airfield pavements. The cost scale is adjusted by project yearbased on an assumed inflation rate of 3%.
Table 5-8: District 10-Year Maintenance and Preservation Needs by Airportdepicts the predicted pavement preservation needs based on the overallairport area-weighted PCI.
Table 5-8: District 10-Year Maintenance and Preservation Needs by AirportMaintenance and Preservation ($ in Millions)
Network ID 2014 2015 2016 2017 2018 2019 2020 2021 2022 2023 20241J0 0.12M 0.14M 0.16M 0.17M 0.06M 0.07M 0.08M 0.07M 0.08M 0.09M -2J9 0.01M 0.01M 0.01M 0.01M 0.01M 0.04M 0.06M 0.08M 0.10M 0.12M -2R4 0.08M 0.09M 0.05M 0.09M 0.15M 0.22M 0.29M 0.31M 0.37M 0.41M -54J 0.08M 0.10M 0.14M 0.18M 0.22M 0.23M 0.24M 0.25M 0.25M 0.26M -AAF 0.76M 0.75M 0.82M 0.83M 0.39M 0.43M 0.33M 0.47M 0.64M 0.85M -CEW 0.09M 0.14M 0.24M 0.43M 0.61M 0.78M 0.92M 1.05M 1.16M 1.25M -DTS 0.00M 0.00M 0.00M 0.06M 0.16M 0.27M 0.35M 0.44M 0.50M 0.55M -ECP - 0.09M 0.17M 0.25M 0.35M 0.46M 0.57M 0.73M 0.89M 1.03M 1.17MF95 - 0.03M 0.06M 0.09M 0.12M 0.15M 0.17M 0.19M 0.21M 0.22M 0.20MMAI 0.00M 0.00M 0.00M 0.00M 0.10M 0.30M 0.52M 0.75M 0.94M 1.08M -PNS - 1.06M 1.16M 1.17M 1.30M 1.30M 1.44M 1.46M 1.42M 1.44M 1.55MTLH - 1.01M 1.18M 1.07M 1.12M 1.27M 1.47M 1.66M 1.88M 1.96M 2.14MX13 0.02M 0.02M 0.02M 0.02M 0.04M 0.06M 0.09M 0.11M 0.14M 0.12M -
DISTRICT 1.17M 3.45M 4.02M 4.38M 4.63M 5.57M 6.53M 7.58M 8.56M 9.39M 5.05MNOTE: VALUES ARE ROUNDED FOR SUMMARY PURPOSES
Pavement Evaluation Report –District 3Statewide Airfield Pavement Management Program
Page | 57
6. MAJOR REHABILITATION NEEDS
6.1 Major Rehabilitation PlanningAs part of the SAPMP, major pavement rehabilitation planning is developedbased on current and predicted PCI in comparison with the Critical PCI. TheCritical PCI has been determined based on the historic trends of pavementcondition relative to the benefit of maintenance and repair activities. Pavementsections determined to have a PCI less than that of the Critical PCI are assumedto have deteriorated to a point at which maintenance and repair level activitywould provide little benefit. Depending on which Phase an airport wasinspected, the program year assumed would be end of FY2013 or end of FY2015for Phase I and Phase II, respectively.
The development of major rehabilitation projects at the planning levelexpressed in this District Summary and in the individual airport pavementevaluation reports were based on an ‘Unlimited Budget’ or unconstrainedbudget scenario. This scenario has been utilized in the SAPMP as a means toidentify project activity based on the condition need. This information isintended to be utilized as a planning tool to support project determination andselection based on airport priority, facility use, traffic demand, budgetconstraints, and other factors.
The objective of the major pavement rehabilitation needs analysis is to provideplanning level projects within an airport’s airfield pavement network. Majorrehabilitation activities are recommended when a pavement section hasdeteriorated below the Critical PCI value from a functionality perspective. Inaddition, major rehabilitation is also recommended when the Section PCI isabove the Critical PCI but the Section has load-related PCI distresses. However,most major rehabilitation work is recommended when the Section PCI is belowthe Critical PCI, which is when maintenance and repair level activities are notconsidered to be cost effective.
Major rehabilitation is identified within the SAPMP as major construction activitythat would result in an improvement or “resetting” of the pavement section’sPCI to a value of 100. Such activities could include; mill and hot-mix asphaltoverlay and re-construction. This analysis was conducted with no constraints tobudgets as a means to identify all pavement projects based on Critical PCI for a10-year duration. It is recommended that the airport use this as a planning toolfor future project development and prioritization.
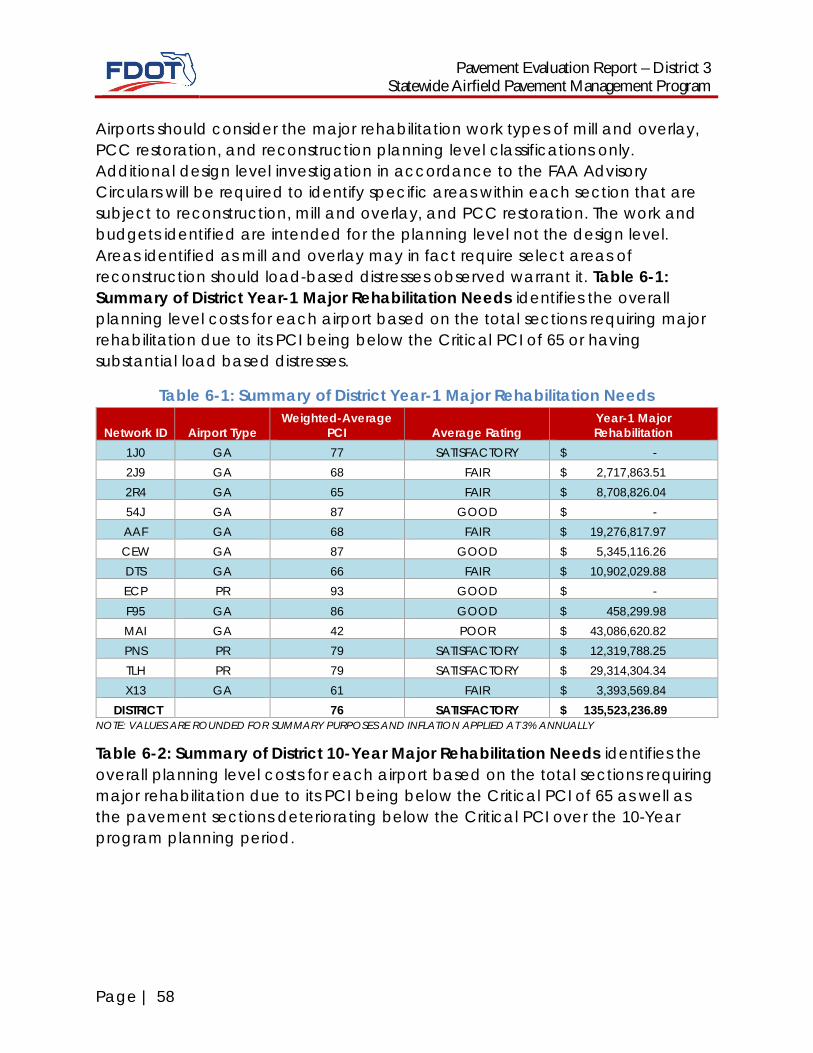
Pavement Evaluation Report – District 3Statewide Airfield Pavement Management Program
Page | 58
Airports should consider the major rehabilitation work types of mill and overlay,PCC restoration, and reconstruction planning level classifications only.Additional design level investigation in accordance to the FAA AdvisoryCirculars will be required to identify specific areas within each section that aresubject to reconstruction, mill and overlay, and PCC restoration. The work andbudgets identified are intended for the planning level not the design level.Areas identified as mill and overlay may in fact require select areas ofreconstruction should load-based distresses observed warrant it. Table 6-1:Summary of District Year-1 Major Rehabilitation Needs identifies the overallplanning level costs for each airport based on the total sections requiring majorrehabilitation due to its PCI being below the Critical PCI of 65 or havingsubstantial load based distresses.
Table 6-1: Summary of District Year-1 Major Rehabilitation Needs
Network ID Airport TypeWeighted-Average
PCI Average RatingYear-1 MajorRehabilitation
1J0 GA 77 SATISFACTORY $ -2J9 GA 68 FAIR $ 2,717,863.512R4 GA 65 FAIR $ 8,708,826.0454J GA 87 GOOD $ -AAF GA 68 FAIR $ 19,276,817.97CEW GA 87 GOOD $ 5,345,116.26DTS GA 66 FAIR $ 10,902,029.88ECP PR 93 GOOD $ -F95 GA 86 GOOD $ 458,299.98MAI GA 42 POOR $ 43,086,620.82PNS PR 79 SATISFACTORY $ 12,319,788.25TLH PR 79 SATISFACTORY $ 29,314,304.34X13 GA 61 FAIR $ 3,393,569.84
DISTRICT 76 SATISFACTORY $ 135,523,236.89NOTE: VALUES ARE ROUNDED FOR SUMMARY PURPOSES AND INFLATION APPLIED AT 3% ANNUALLY
Table 6-2: Summary of District 10-Year Major Rehabilitation Needs identifies theoverall planning level costs for each airport based on the total sections requiringmajor rehabilitation due to its PCI being below the Critical PCI of 65 as well asthe pavement sections deteriorating below the Critical PCI over the 10-Yearprogram planning period.
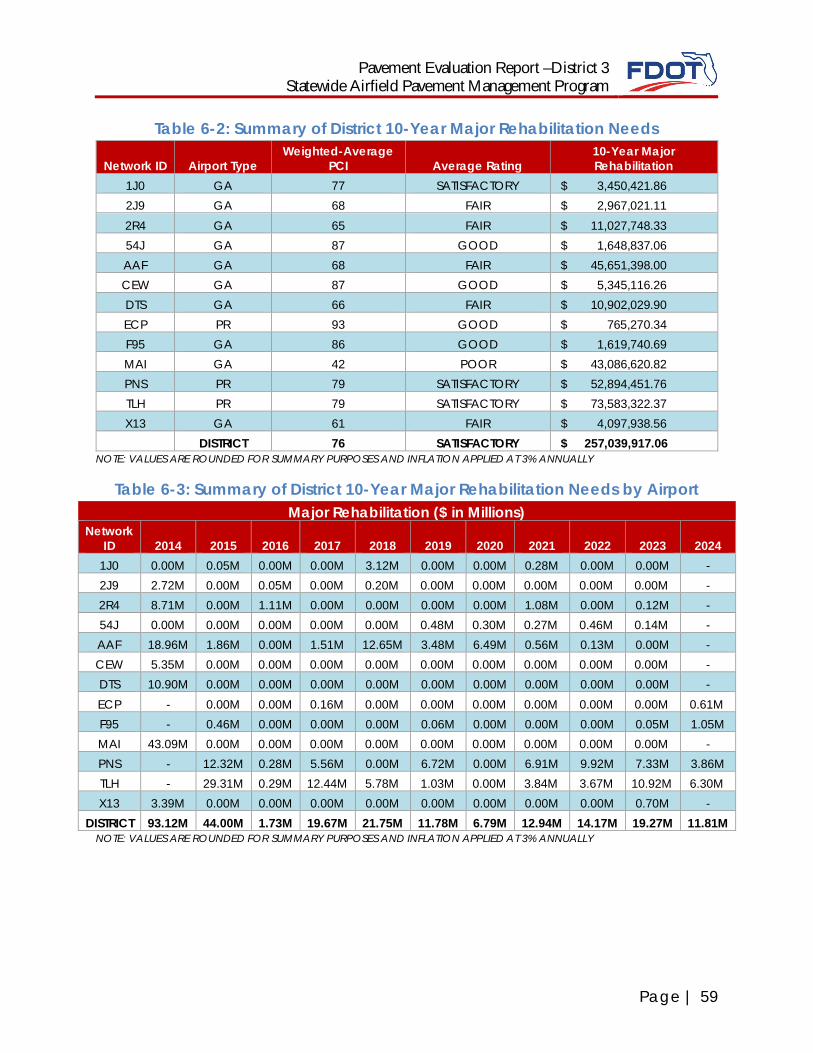
Pavement Evaluation Report –District 3Statewide Airfield Pavement Management Program
Page | 59
Table 6-2: Summary of District 10-Year Major Rehabilitation Needs
Network ID Airport TypeWeighted-Average
PCI Average Rating10-Year MajorRehabilitation
1J0 GA 77 SATISFACTORY $ 3,450,421.862J9 GA 68 FAIR $ 2,967,021.112R4 GA 65 FAIR $ 11,027,748.3354J GA 87 GOOD $ 1,648,837.06AAF GA 68 FAIR $ 45,651,398.00CEW GA 87 GOOD $ 5,345,116.26DTS GA 66 FAIR $ 10,902,029.90ECP PR 93 GOOD $ 765,270.34F95 GA 86 GOOD $ 1,619,740.69MAI GA 42 POOR $ 43,086,620.82PNS PR 79 SATISFACTORY $ 52,894,451.76TLH PR 79 SATISFACTORY $ 73,583,322.37X13 GA 61 FAIR $ 4,097,938.56
DISTRICT 76 SATISFACTORY $ 257,039,917.06NOTE: VALUES ARE ROUNDED FOR SUMMARY PURPOSES AND INFLATION APPLIED AT 3% ANNUALLY
Table 6-3: Summary of District 10-Year Major Rehabilitation Needs by AirportMajor Rehabilitation ($ in Millions)
NetworkID 2014 2015 2016 2017 2018 2019 2020 2021 2022 2023 2024
1J0 0.00M 0.05M 0.00M 0.00M 3.12M 0.00M 0.00M 0.28M 0.00M 0.00M -2J9 2.72M 0.00M 0.05M 0.00M 0.20M 0.00M 0.00M 0.00M 0.00M 0.00M -2R4 8.71M 0.00M 1.11M 0.00M 0.00M 0.00M 0.00M 1.08M 0.00M 0.12M -54J 0.00M 0.00M 0.00M 0.00M 0.00M 0.48M 0.30M 0.27M 0.46M 0.14M -AAF 18.96M 1.86M 0.00M 1.51M 12.65M 3.48M 6.49M 0.56M 0.13M 0.00M -CEW 5.35M 0.00M 0.00M 0.00M 0.00M 0.00M 0.00M 0.00M 0.00M 0.00M -DTS 10.90M 0.00M 0.00M 0.00M 0.00M 0.00M 0.00M 0.00M 0.00M 0.00M -ECP - 0.00M 0.00M 0.16M 0.00M 0.00M 0.00M 0.00M 0.00M 0.00M 0.61MF95 - 0.46M 0.00M 0.00M 0.00M 0.06M 0.00M 0.00M 0.00M 0.05M 1.05MMAI 43.09M 0.00M 0.00M 0.00M 0.00M 0.00M 0.00M 0.00M 0.00M 0.00M -PNS - 12.32M 0.28M 5.56M 0.00M 6.72M 0.00M 6.91M 9.92M 7.33M 3.86MTLH - 29.31M 0.29M 12.44M 5.78M 1.03M 0.00M 3.84M 3.67M 10.92M 6.30MX13 3.39M 0.00M 0.00M 0.00M 0.00M 0.00M 0.00M 0.00M 0.00M 0.70M -
DISTRICT 93.12M 44.00M 1.73M 19.67M 21.75M 11.78M 6.79M 12.94M 14.17M 19.27M 11.81MNOTE: VALUES ARE ROUNDED FOR SUMMARY PURPOSES AND INFLATION APPLIED AT 3% ANNUALLY

Pavement Evaluation Report –District 3Statewide Airfield Pavement Management Program
Page | 61
7. CONCLUSION
The FDOT Aviation and Spaceport Office has updated the Statewide AirfieldPavement Management Program through the pavement condition surveysperformed at each participating airport and preparation of M&R planninginformation using guidance provided by the FAA Advisory Circular 150/5380-6C.MicroPAVER software was utilized to determine pavement conditions inaccordance with ASTM D 5340-12 and develop maintenance and rehabilitationpolicies consistent with the FDOT Aviation and Spaceport Office policies. Thesepolicies were used to identify pavement rehabilitation projects based on thecondition of the pavement over a 10-year period that are detailed in theindividual airport reports and in Appendix D District 10-Year Major RehabilitationNeeds and Appendix E District Airfield Pavement 10-Year Major RehabilitationExhibits.
This study was focused on identifying current pavement condition and using acondition based tool to assist in the evaluation of pavement performance andidentify and prioritize maintenance and rehabilitation needs and costs tomaximize useful pavement life. The methods used to determine pavementcondition for this program update, as with previous updates, have beenperformed in accordance with ASTM D 5340 (current version 5340-12). Theprocess is intended to provide airport sponsors with guidance in planningpavement maintenance and rehabilitation projects and funding agencies withplanning tools for allocation of funds.
A detailed breakdown of pavement condition for each airport is included inAppendix B District Branch and Section Condition Reports and Appendix CDistrict Airfield Pavement Condition Index Rating Exhibits. As can be seen in thisreport and by comparing pavement conditions on an airport by airport basis,there is a wide variation in pavement conditions between airports.Recommended major rehabilitation recommendations for each airport are alsoincluded in Appendix D District 10-Year Major Rehabilitation Needs andAppendix E District Airfield Pavement 10-Year Major Rehabilitation Exhibits.
1.5 Major Rehabilitation for Runways in DistrictRunway projects, based on pavement conditions below the FDOTrecommended minimum service level PCI of 75 and have reached or are belowthe Critical PCI of 65, which the District should consider as immediate needs arelisted below. These are not all the needs at each participating airport within the
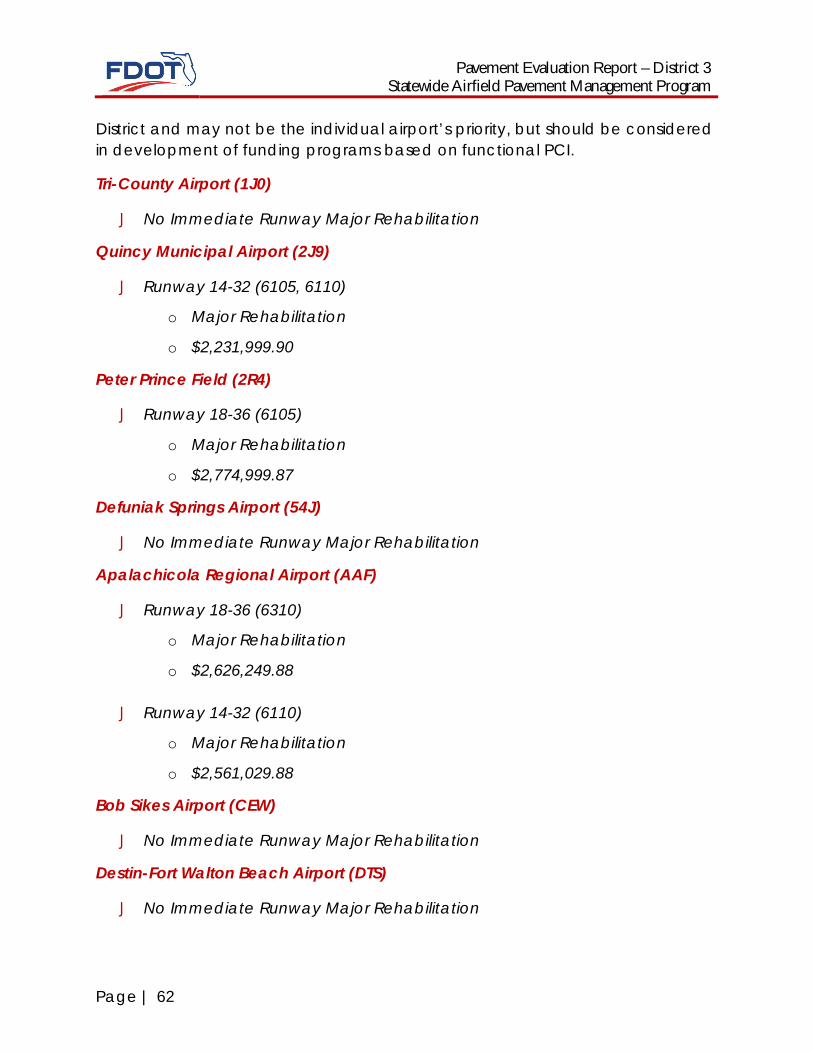
Pavement Evaluation Report – District 3Statewide Airfield Pavement Management Program
Page | 62
District and may not be the individual airport’s priority, but should be consideredin development of funding programs based on functional PCI.
Tri-County Airport (1J0)
J No Immediate Runway Major Rehabilitation
Quincy Municipal Airport (2J9)
J Runway 14-32 (6105, 6110)
o Major Rehabilitation
o $2,231,999.90
Peter Prince Field (2R4)
J Runway 18-36 (6105)
o Major Rehabilitation
o $2,774,999.87
Defuniak Springs Airport (54J)
J No Immediate Runway Major Rehabilitation
Apalachicola Regional Airport (AAF)
J Runway 18-36 (6310)
o Major Rehabilitation
o $2,626,249.88
J Runway 14-32 (6110)
o Major Rehabilitation
o $2,561,029.88
Bob Sikes Airport (CEW)
J No Immediate Runway Major Rehabilitation
Destin-Fort Walton Beach Airport (DTS)
J No Immediate Runway Major Rehabilitation
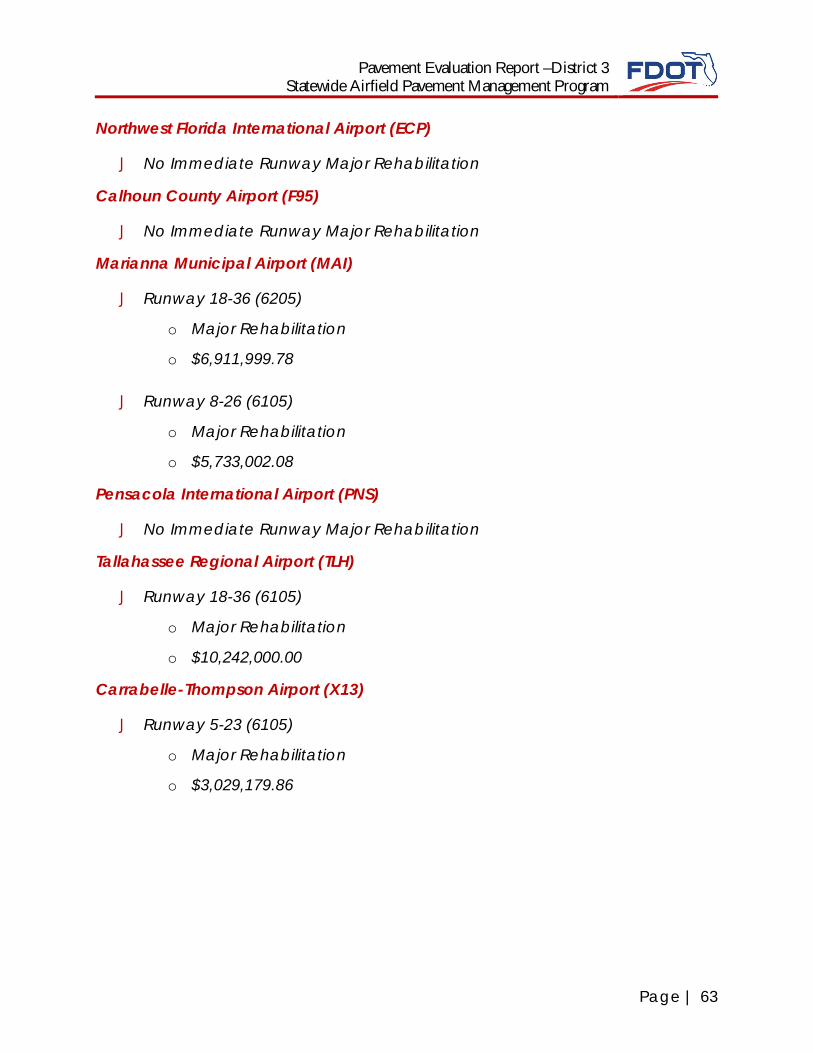
Pavement Evaluation Report –District 3Statewide Airfield Pavement Management Program
Page | 63
Northwest Florida International Airport (ECP)
J No Immediate Runway Major Rehabilitation
Calhoun County Airport (F95)
J No Immediate Runway Major Rehabilitation
Marianna Municipal Airport (MAI)
J Runway 18-36 (6205)
o Major Rehabilitation
o $6,911,999.78
J Runway 8-26 (6105)
o Major Rehabilitation
o $5,733,002.08
Pensacola International Airport (PNS)
J No Immediate Runway Major Rehabilitation
Tallahassee Regional Airport (TLH)
J Runway 18-36 (6105)
o Major Rehabilitation
o $10,242,000.00
Carrabelle-Thompson Airport (X13)
J Runway 5-23 (6105)
o Major Rehabilitation
o $3,029,179.86


APPENDIX A� GLOSSARY OF TERMS

Pavement Evaluation ReportStatewide Airfield Pavement Management Program
Appendix A | 1
GLOSSARY OF TERMS
ASTM D 5340-12The ASTM D 5340-12 Standard Test Method for Airport Pavement Condition IndexSurveys by the ASTM International. This test method covers the determination of airportpavement condition through visual surveys of asphalt-surfaced pavements, includingporous friction course, and plain or reinforced jointed Portland Cement Concretepavements, using the Pavement Condition Index (PCI) method of quantifyingpavement condition. The PCI for airport pavements was developed by the U.S. ArmyCorps of Engineers through the funding provided by the U.S. Air Force. It is furtherverified and adopted by the FAA, and the U.S. Naval Facilities Engineering Command.
Aviation and Spaceport OfficeThe Florida Department of Transportation Aviation and Spaceport Office is chargedwith responsibility for promoting the safe development of aviation to serve the peopleof the State of Florida. The Aviation Office Program Manager (ASO-PM) has review andapproval authority for each program task of the SAPMP.
BranchA Branch (pavement branch) designates pavements that have common usage andfunctionality, such as an entire runway, taxiway, or apron. A pavement branch is anidentifiable part of the pavement network that a single entity and has a distinctfunction.
CategoryThe Category classifies the airport according to the type and volume of aircraft traffic,as follows:
J GA – for general aviation or community airports;
J RL – for regional relievers or small hubs;
J PR – for primary and/or commercial service airports
The airport Category has been the attribute to aid in the refinement and differentiationof airport infrastructure as it relates to aircraft fleet mix (type, frequency, and pavementrequirements).
Critical PCIThe PCI value considered to be the threshold for M&R decisions, it is alternatively knownas MicroPAVER Minimum PCI. PCI above the Critical generate economical activitiesexpected to preserve and prolong acceptable condition. M&R for PCI values less than
Pavement Evaluation ReportStatewide Airfield Pavement Management Program
Appendix A | 2
Critical make sense only for reasons of safety or to maintain a pavement in operablecondition. A pavement section is expected to deteriorate very quickly once it reachesthe Critical PCI and the unit cost of repair increases significantly.
Distress TypeA distress type, alternatively pavement distress, is a defined visible defect in pavementevidenced by cracking, vertical displacement or deterioration of material. Distressesare external indicators of pavement deterioration caused by loading, environmentalfactors, or construction deficiencies, or combination thereof. Typical distresses arecracks, rutting, and weathering of the pavement surface. Specific distress types asdefined by the ASTM D 5340-12 are required to obtain an accurate PCI value.
FAAThe Federal Aviation Administration. The FDOT Statewide Airfield PavementManagement Program is sponsored by the FAA. The program has been established andupdated in accordance with FAA Advisory Circulars 150/5380-7B Airport PavementManagement Program and 150/5380-6C Guidelines and Procedures for Maintenanceof Airport Pavements.
FDOTThe Florida Department of Transportation. Florida Department of Transportation wasrepresented in this project by the Aviation and Space Port Office of the Office ofFreight, Logistics and Passenger Operations.
Localized M&R (Maintenance and Repair)Alternatively, known as Maintenance or Preservation activities, Localized M&R is atemporary activity performed on existing pavement to extend its serviceability and/orto improve rideability. Localized M&R can be applied either as a safety (stop-gap)measure or preventive measure. Common localized maintenance methods includecrack sealing, joint sealing, and patching.
Major M&R or Major Rehabilitation (e.g. Rehabilitation)Activities performed over the entire area of a pavement Section that are intended torestore and/or maintain serviceability. This includes asphalt overlays, milling andreplacing asphalt pavement, reconstruction with asphalt, reconstruction with PortlandCement Concrete (PCC) pavements, and PCC overlays. For the purpose of the FDOTStatewide Airfield Pavement Management Program, Major M&R or Major Rehabilitation,as indicated by Mill and Overlay, PCC Restoration, and/or Reconstruction are planninglevel categories. It is recommended that project level investigation and design inaccordance with the FAA Advisory Circulars be performed.
MicroPAVER (PAVER)Alternatively known as PAVER, a commercially available software subsidized by FAAand agencies in the US Department of Defense developed to support engineered
Pavement Evaluation ReportStatewide Airfield Pavement Management Program
Appendix A | 3
management of pavement assets using a condition based approach. This software hasthe functionality such that, if properly implemented, maintained, and operated, itmeets the pavement management program requirements described by the FAA inAdvisory Circular 150/5380-7B.
Minimum Condition LevelA threshold PCI value established by FDOT to represent the targeted minimumpavement condition that is desirable in the Florida Airport System. These values wereestablished with consideration of pavement function and airport type. For instance,runways have higher minimum condition levels than aprons, and Primary airports havehigher minimum condition levels than General Aviation airports.
Network DefinitionA Network Definition is a Computer-Aided Drafting & Design (CADD) drawing whichshows the airport pavement outline with pavement Branch and pavement Sectionboundaries. This drawing also includes the PCI sample units and is used to identify thosesample units to be surveyed, i.e. the sampling plan. Each Network Definition for theparticipating airports were developed utilizing information provided by the airport staff,field conditions, record drawings, schematics, and aerial imagery provided by the FDOTSurveying and Mapping Office. The Airfield Pavement Network Definition Exhibits arenot intended for construction or design level geometry.
Pavement Condition Index (PCI)The Pavement Condition Index is a number which represents the condition of apavement segment at a specific point in time. It is a numerical rating of the pavementcondition that ranges from 0 to 100, with 0 being the worst possible condition and 100being the best possible condition. It is based on visual identification and measurementof specific distress types commonly found in pavement which has been in service for aperiod of time. The definitions and procedures for determining the PCI are found inASTM D 5340, published by ASTM International.
Pavement Condition Rating (PCR)A verbal description of pavement condition as a function of the PCI value. The SAPMPutilizes the following Pavement Condition Rating.
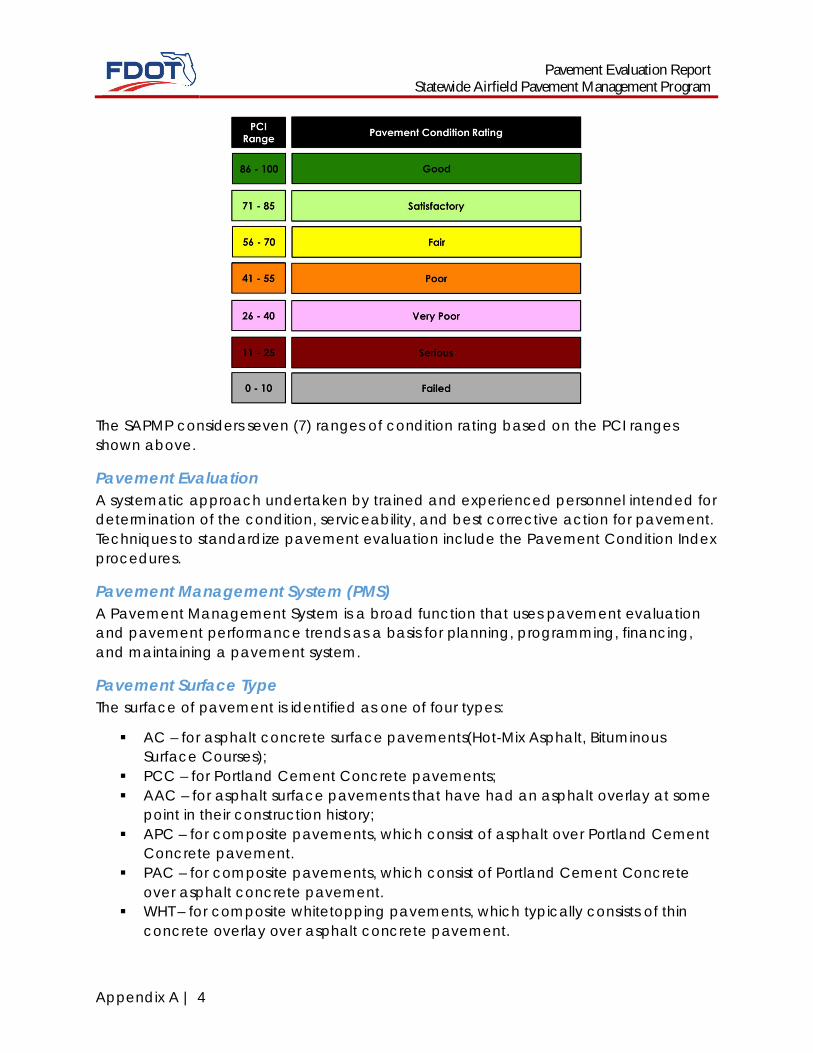
Pavement Evaluation ReportStatewide Airfield Pavement Management Program
Appendix A | 4
The SAPMP considers seven (7) ranges of condition rating based on the PCI rangesshown above.
Pavement EvaluationA systematic approach undertaken by trained and experienced personnel intended fordetermination of the condition, serviceability, and best corrective action for pavement.Techniques to standardize pavement evaluation include the Pavement Condition Indexprocedures.
Pavement Management System (PMS)A Pavement Management System is a broad function that uses pavement evaluationand pavement performance trends as a basis for planning, programming, financing,and maintaining a pavement system.
Pavement Surface TypeThe surface of pavement is identified as one of four types:
§ AC – for asphalt concrete surface pavements(Hot-Mix Asphalt, BituminousSurface Courses);
§ PCC – for Portland Cement Concrete pavements;§ AAC – for asphalt surface pavements that have had an asphalt overlay at some
point in their construction history;§ APC – for composite pavements, which consist of asphalt over Portland Cement
Concrete pavement.§ PAC – for composite pavements, which consist of Portland Cement Concrete
over asphalt concrete pavement.§ WHT – for composite whitetopping pavements, which typically consists of thin
concrete overlay over asphalt concrete pavement.
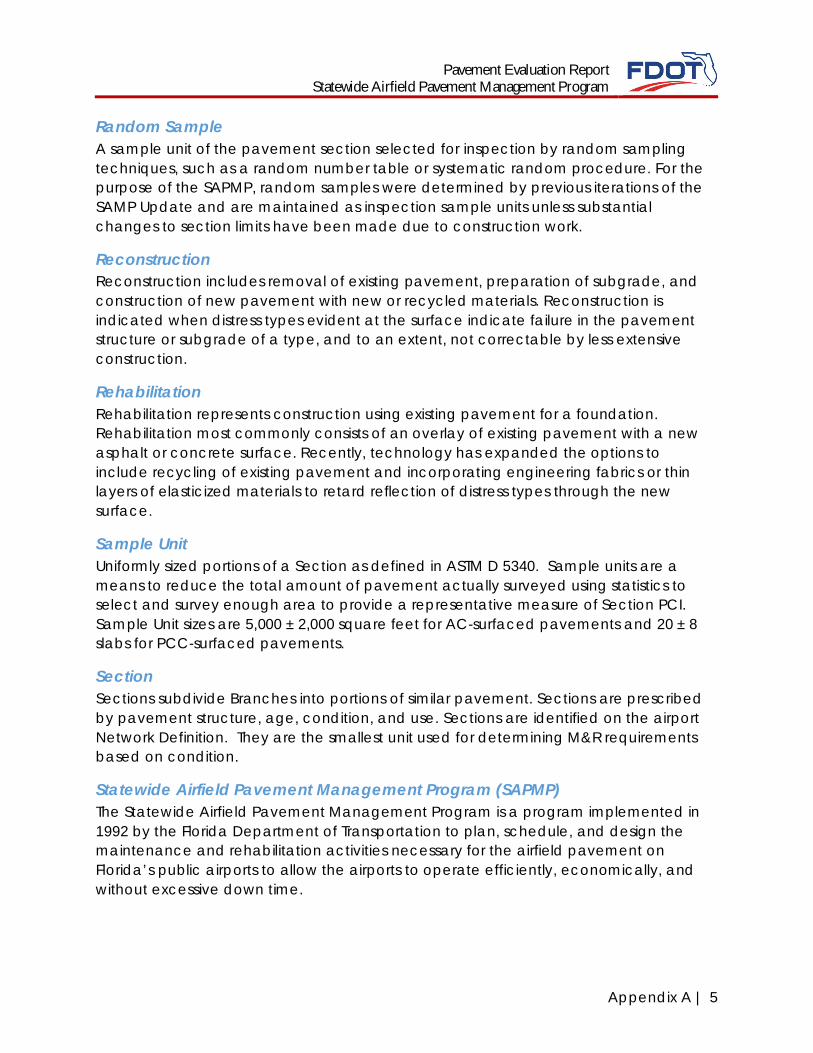
Pavement Evaluation ReportStatewide Airfield Pavement Management Program
Appendix A | 5
Random SampleA sample unit of the pavement section selected for inspection by random samplingtechniques, such as a random number table or systematic random procedure. For thepurpose of the SAPMP, random samples were determined by previous iterations of theSAMP Update and are maintained as inspection sample units unless substantialchanges to section limits have been made due to construction work.
ReconstructionReconstruction includes removal of existing pavement, preparation of subgrade, andconstruction of new pavement with new or recycled materials. Reconstruction isindicated when distress types evident at the surface indicate failure in the pavementstructure or subgrade of a type, and to an extent, not correctable by less extensiveconstruction.
RehabilitationRehabilitation represents construction using existing pavement for a foundation.Rehabilitation most commonly consists of an overlay of existing pavement with a newasphalt or concrete surface. Recently, technology has expanded the options toinclude recycling of existing pavement and incorporating engineering fabrics or thinlayers of elasticized materials to retard reflection of distress types through the newsurface.
Sample UnitUniformly sized portions of a Section as defined in ASTM D 5340. Sample units are ameans to reduce the total amount of pavement actually surveyed using statistics toselect and survey enough area to provide a representative measure of Section PCI.Sample Unit sizes are 5,000 ± 2,000 square feet for AC-surfaced pavements and 20 ± 8slabs for PCC-surfaced pavements.
SectionSections subdivide Branches into portions of similar pavement. Sections are prescribedby pavement structure, age, condition, and use. Sections are identified on the airportNetwork Definition. They are the smallest unit used for determining M&R requirementsbased on condition.
Statewide Airfield Pavement Management Program (SAPMP)The Statewide Airfield Pavement Management Program is a program implemented in1992 by the Florida Department of Transportation to plan, schedule, and design themaintenance and rehabilitation activities necessary for the airfield pavement onFlorida’s public airports to allow the airports to operate efficiently, economically, andwithout excessive down time.
Pavement Evaluation ReportStatewide Airfield Pavement Management Program
Appendix A | 6
System InventoryA System Inventory is a Computer-Aided Drafting & Design (CADD) drawing whichshows the airport pavement outline and identifies airfield construction activities sincethe last inspection.
UseIn MicroPAVER, Use is the term for the function of the pavement area, alternativelyBranch Use, Pavement Use, or Pavement Facility Use. For the SAPMP the facility useconsists of the following: Runway, Taxiway, or Apron for purposes of the SAPMPprogram planning.
APPENDIX B� DISTRICT BRANCH CONDITION REPORT
� DISTRICT SECTION CONDITION REPORT

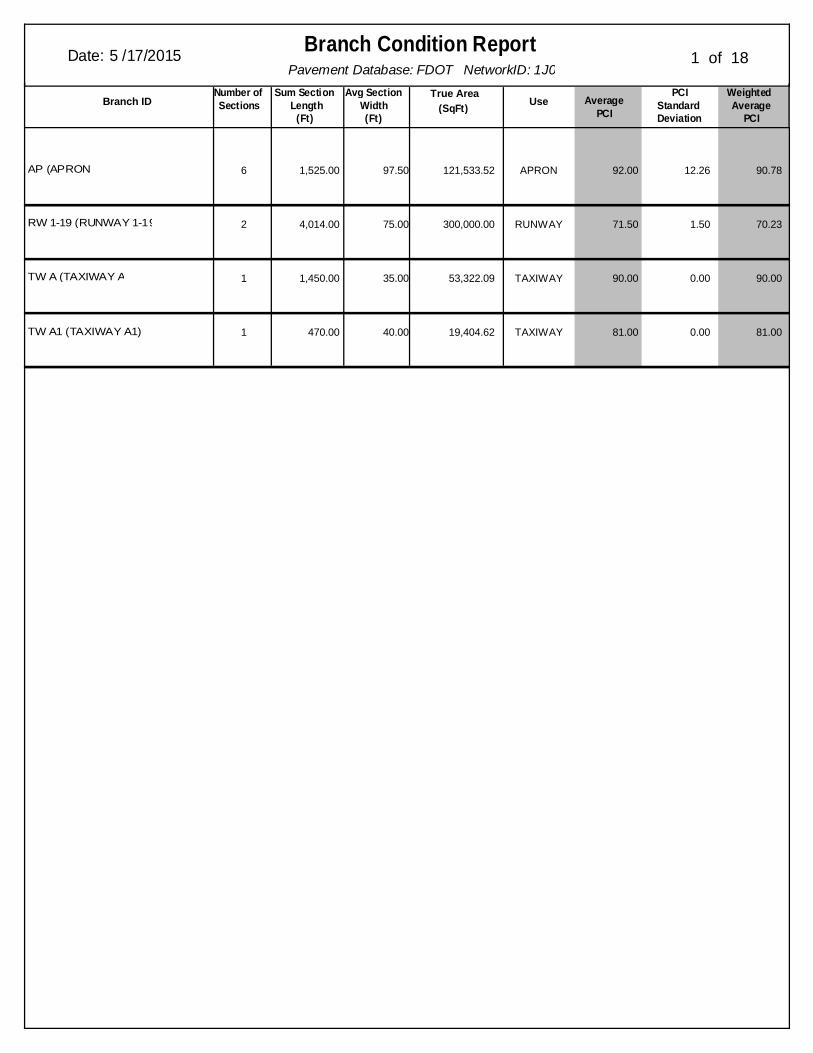
Pavement Database: FDOT NetworkID: 1J0
Branch Condition ReportDate: 5 /17/2015 1 of 18
(SqFt)True Area
UseNumber ofSectionsBranch ID
PCIStandardDeviation
WeightedAverage
PCIAverage
PCI
Sum Section Length
(Ft)
Avg SectionWidth(Ft)
AP (APRON) 6 121,533.52 APRON 92.00 12.26 90.781,525.00 97.50
RW 1-19 (RUNWAY 1-19) 2 300,000.00 RUNWAY 71.50 1.50 70.234,014.00 75.00
TW A (TAXIWAY A) 1 53,322.09 TAXIWAY 90.00 0.00 90.001,450.00 35.00
TW A1 (TAXIWAY A1) 1 19,404.62 TAXIWAY 81.00 0.00 81.00470.00 40.00
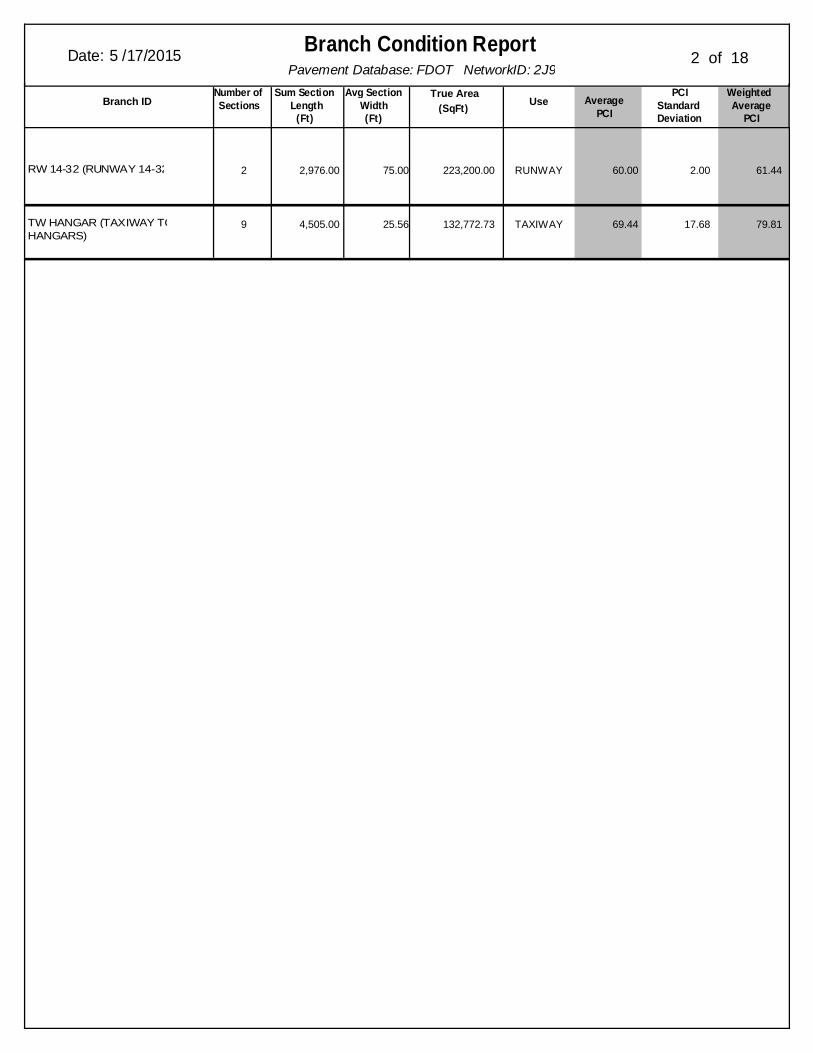
Pavement Database: FDOT NetworkID: 2J9
Branch Condition ReportDate: 5 /17/2015 2 of 18
(SqFt)True Area
UseNumber ofSectionsBranch ID
PCIStandardDeviation
WeightedAverage
PCIAverage
PCI
Sum Section Length
(Ft)
Avg SectionWidth(Ft)
RW 14-32 (RUNWAY 14-32) 2 223,200.00 RUNWAY 60.00 2.00 61.442,976.00 75.00
TW HANGAR (TAXIWAY TOHANGARS)
9 132,772.73 TAXIWAY 69.44 17.68 79.814,505.00 25.56
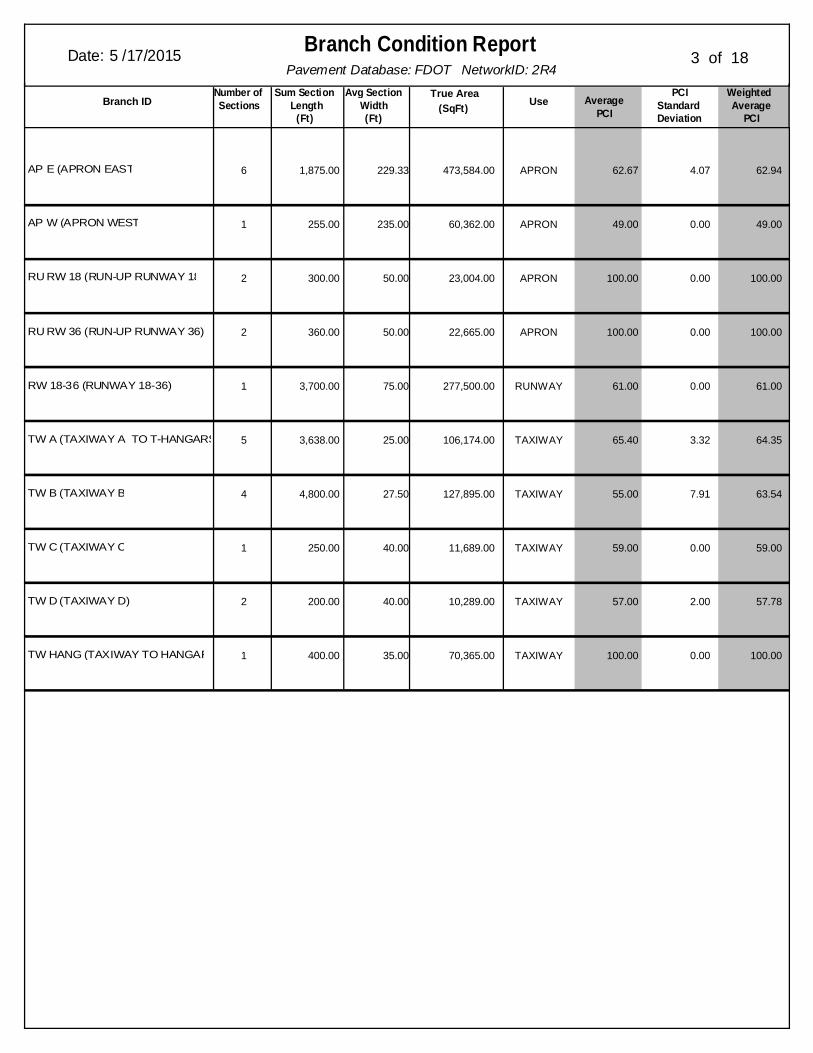
Pavement Database: FDOT NetworkID: 2R4
Branch Condition ReportDate: 5 /17/2015 3 of 18
(SqFt)True Area
UseNumber ofSectionsBranch ID
PCIStandardDeviation
WeightedAverage
PCIAverage
PCI
Sum Section Length
(Ft)
Avg SectionWidth(Ft)
AP E (APRON EAST) 6 473,584.00 APRON 62.67 4.07 62.941,875.00 229.33
AP W (APRON WEST) 1 60,362.00 APRON 49.00 0.00 49.00255.00 235.00
RU RW 18 (RUN-UP RUNWAY 18) 2 23,004.00 APRON 100.00 0.00 100.00300.00 50.00
RU RW 36 (RUN-UP RUNWAY 36) 2 22,665.00 APRON 100.00 0.00 100.00360.00 50.00
RW 18-36 (RUNWAY 18-36) 1 277,500.00 RUNWAY 61.00 0.00 61.003,700.00 75.00
TW A (TAXIWAY A TO T-HANGARS) 5 106,174.00 TAXIWAY 65.40 3.32 64.353,638.00 25.00
TW B (TAXIWAY B) 4 127,895.00 TAXIWAY 55.00 7.91 63.544,800.00 27.50
TW C (TAXIWAY C) 1 11,689.00 TAXIWAY 59.00 0.00 59.00250.00 40.00
TW D (TAXIWAY D) 2 10,289.00 TAXIWAY 57.00 2.00 57.78200.00 40.00
TW HANG (TAXIWAY TO HANGAR) 1 70,365.00 TAXIWAY 100.00 0.00 100.00400.00 35.00
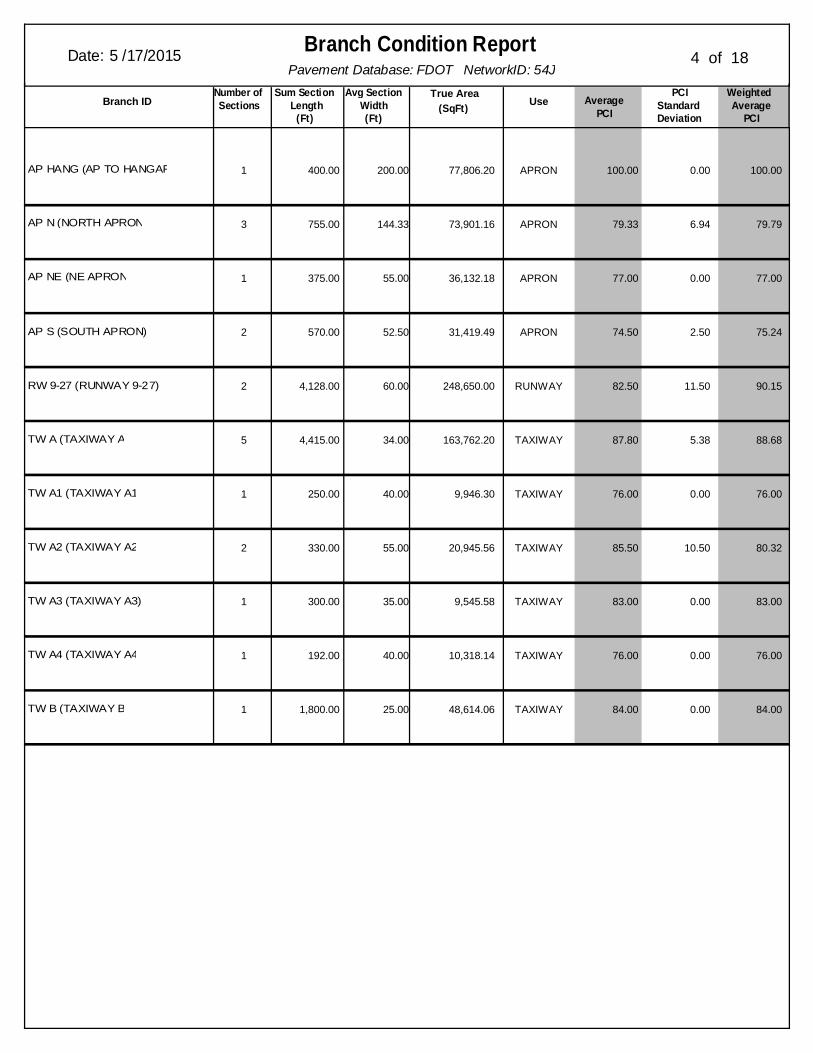
Pavement Database: FDOT NetworkID: 54J
Branch Condition ReportDate: 5 /17/2015 4 of 18
(SqFt)True Area
UseNumber ofSectionsBranch ID
PCIStandardDeviation
WeightedAverage
PCIAverage
PCI
Sum Section Length
(Ft)
Avg SectionWidth(Ft)
AP HANG (AP TO HANGAR) 1 77,806.20 APRON 100.00 0.00 100.00400.00 200.00
AP N (NORTH APRON) 3 73,901.16 APRON 79.33 6.94 79.79755.00 144.33
AP NE (NE APRON) 1 36,132.18 APRON 77.00 0.00 77.00375.00 55.00
AP S (SOUTH APRON) 2 31,419.49 APRON 74.50 2.50 75.24570.00 52.50
RW 9-27 (RUNWAY 9-27) 2 248,650.00 RUNWAY 82.50 11.50 90.154,128.00 60.00
TW A (TAXIWAY A) 5 163,762.20 TAXIWAY 87.80 5.38 88.684,415.00 34.00
TW A1 (TAXIWAY A1) 1 9,946.30 TAXIWAY 76.00 0.00 76.00250.00 40.00
TW A2 (TAXIWAY A2) 2 20,945.56 TAXIWAY 85.50 10.50 80.32330.00 55.00
TW A3 (TAXIWAY A3) 1 9,545.58 TAXIWAY 83.00 0.00 83.00300.00 35.00
TW A4 (TAXIWAY A4) 1 10,318.14 TAXIWAY 76.00 0.00 76.00192.00 40.00
TW B (TAXIWAY B) 1 48,614.06 TAXIWAY 84.00 0.00 84.001,800.00 25.00
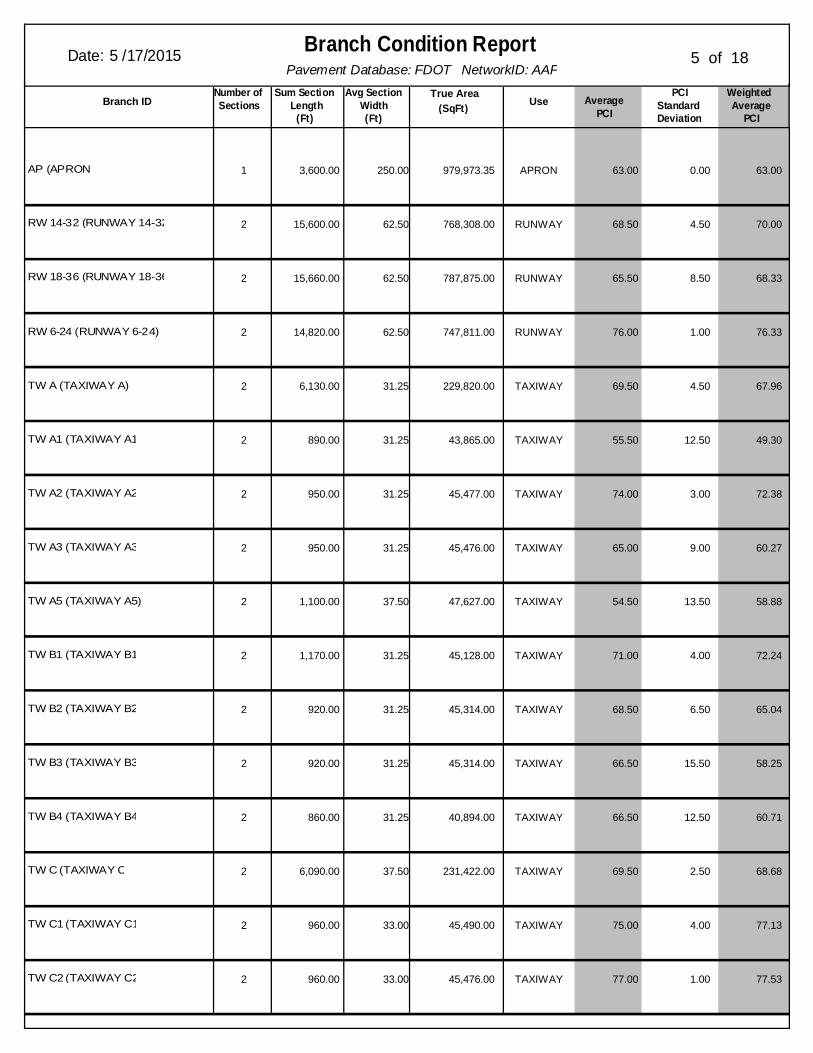
Pavement Database: FDOT NetworkID: AAF
Branch Condition ReportDate: 5 /17/2015 5 of 18
(SqFt)True Area
UseNumber ofSectionsBranch ID
PCIStandardDeviation
WeightedAverage
PCIAverage
PCI
Sum Section Length
(Ft)
Avg SectionWidth(Ft)
AP (APRON) 1 979,973.35 APRON 63.00 0.00 63.003,600.00 250.00
RW 14-32 (RUNWAY 14-32) 2 768,308.00 RUNWAY 68.50 4.50 70.0015,600.00 62.50
RW 18-36 (RUNWAY 18-36) 2 787,875.00 RUNWAY 65.50 8.50 68.3315,660.00 62.50
RW 6-24 (RUNWAY 6-24) 2 747,811.00 RUNWAY 76.00 1.00 76.3314,820.00 62.50
TW A (TAXIWAY A) 2 229,820.00 TAXIWAY 69.50 4.50 67.966,130.00 31.25
TW A1 (TAXIWAY A1) 2 43,865.00 TAXIWAY 55.50 12.50 49.30890.00 31.25
TW A2 (TAXIWAY A2) 2 45,477.00 TAXIWAY 74.00 3.00 72.38950.00 31.25
TW A3 (TAXIWAY A3) 2 45,476.00 TAXIWAY 65.00 9.00 60.27950.00 31.25
TW A5 (TAXIWAY A5) 2 47,627.00 TAXIWAY 54.50 13.50 58.881,100.00 37.50
TW B1 (TAXIWAY B1) 2 45,128.00 TAXIWAY 71.00 4.00 72.241,170.00 31.25
TW B2 (TAXIWAY B2) 2 45,314.00 TAXIWAY 68.50 6.50 65.04920.00 31.25
TW B3 (TAXIWAY B3) 2 45,314.00 TAXIWAY 66.50 15.50 58.25920.00 31.25
TW B4 (TAXIWAY B4) 2 40,894.00 TAXIWAY 66.50 12.50 60.71860.00 31.25
TW C (TAXIWAY C) 2 231,422.00 TAXIWAY 69.50 2.50 68.686,090.00 37.50
TW C1 (TAXIWAY C1) 2 45,490.00 TAXIWAY 75.00 4.00 77.13960.00 33.00
TW C2 (TAXIWAY C2) 2 45,476.00 TAXIWAY 77.00 1.00 77.53960.00 33.00
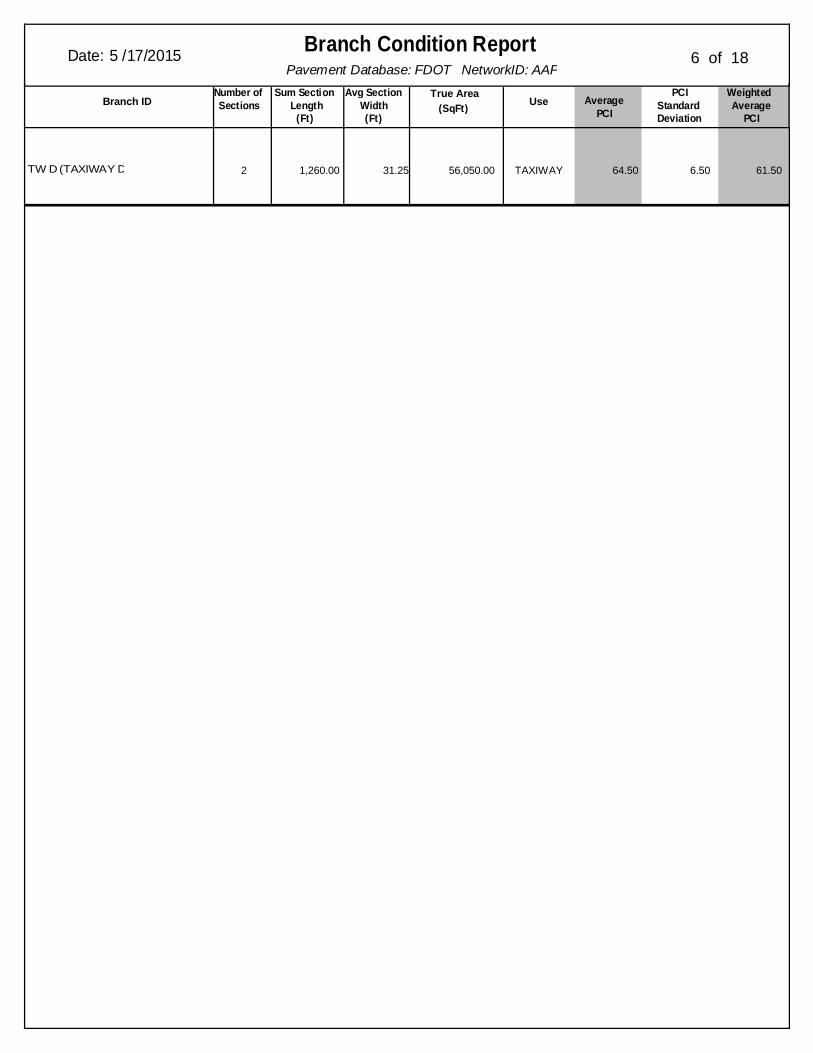
Pavement Database: FDOT NetworkID: AAF
Branch Condition ReportDate: 5 /17/2015 6 of 18
(SqFt)True Area
UseNumber ofSectionsBranch ID
PCIStandardDeviation
WeightedAverage
PCIAverage
PCI
Sum Section Length
(Ft)
Avg SectionWidth(Ft)
TW D (TAXIWAY D) 2 56,050.00 TAXIWAY 64.50 6.50 61.501,260.00 31.25
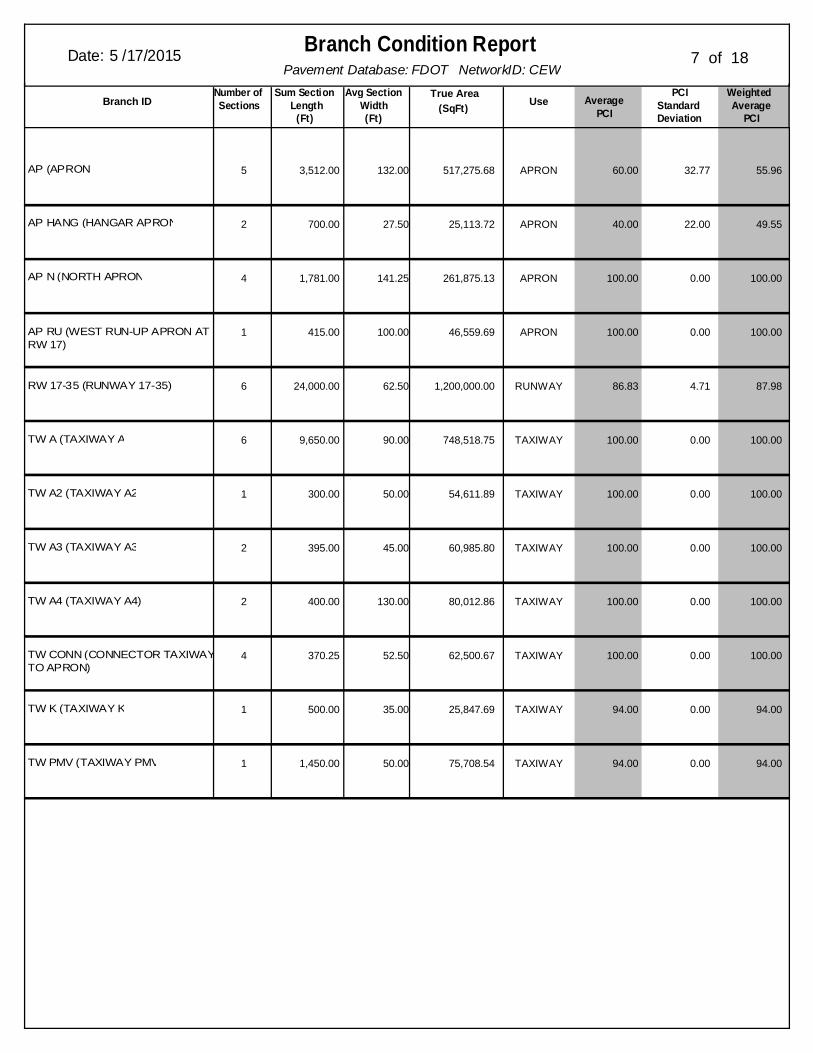
Pavement Database: FDOT NetworkID: CEW
Branch Condition ReportDate: 5 /17/2015 7 of 18
(SqFt)True Area
UseNumber ofSectionsBranch ID
PCIStandardDeviation
WeightedAverage
PCIAverage
PCI
Sum Section Length
(Ft)
Avg SectionWidth(Ft)
AP (APRON) 5 517,275.68 APRON 60.00 32.77 55.963,512.00 132.00
AP HANG (HANGAR APRON) 2 25,113.72 APRON 40.00 22.00 49.55700.00 27.50
AP N (NORTH APRON) 4 261,875.13 APRON 100.00 0.00 100.001,781.00 141.25
AP RU (WEST RUN-UP APRON ATRW 17)
1 46,559.69 APRON 100.00 0.00 100.00415.00 100.00
RW 17-35 (RUNWAY 17-35) 6 1,200,000.00 RUNWAY 86.83 4.71 87.9824,000.00 62.50
TW A (TAXIWAY A) 6 748,518.75 TAXIWAY 100.00 0.00 100.009,650.00 90.00
TW A2 (TAXIWAY A2) 1 54,611.89 TAXIWAY 100.00 0.00 100.00300.00 50.00
TW A3 (TAXIWAY A3) 2 60,985.80 TAXIWAY 100.00 0.00 100.00395.00 45.00
TW A4 (TAXIWAY A4) 2 80,012.86 TAXIWAY 100.00 0.00 100.00400.00 130.00
TW CONN (CONNECTOR TAXIWAYSTO APRON)
4 62,500.67 TAXIWAY 100.00 0.00 100.00370.25 52.50
TW K (TAXIWAY K) 1 25,847.69 TAXIWAY 94.00 0.00 94.00500.00 35.00
TW PMV (TAXIWAY PMV) 1 75,708.54 TAXIWAY 94.00 0.00 94.001,450.00 50.00
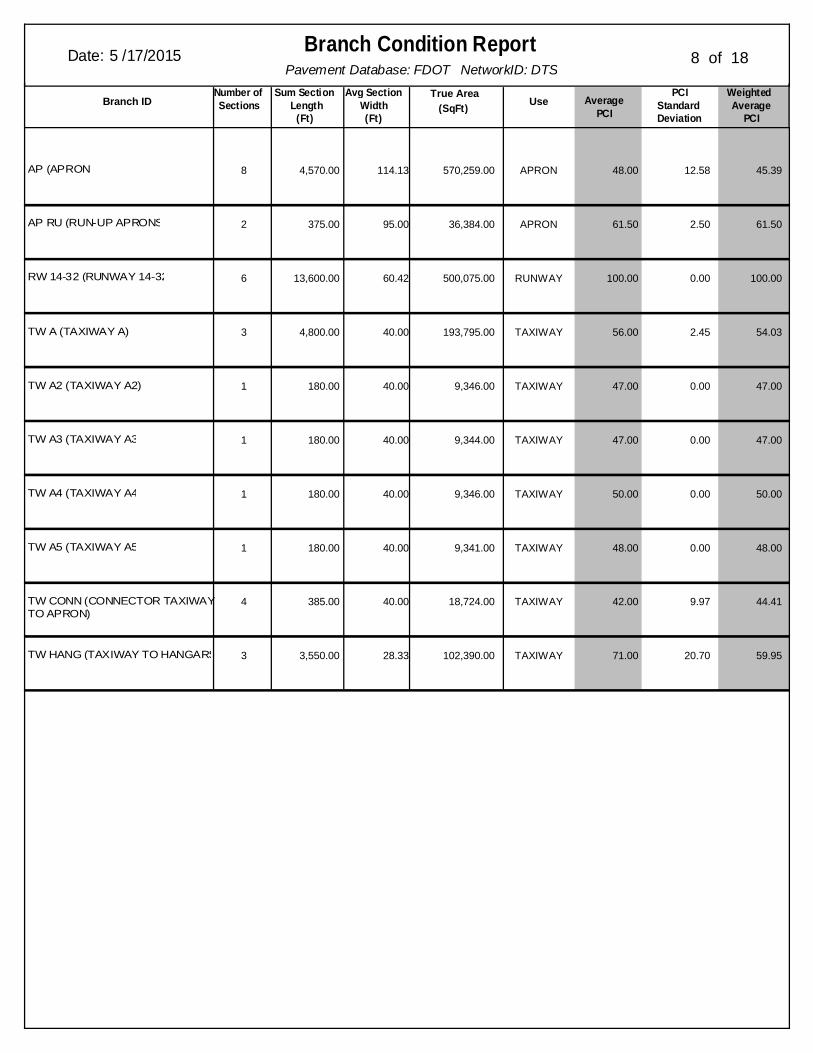
Pavement Database: FDOT NetworkID: DTS
Branch Condition ReportDate: 5 /17/2015 8 of 18
(SqFt)True Area
UseNumber ofSectionsBranch ID
PCIStandardDeviation
WeightedAverage
PCIAverage
PCI
Sum Section Length
(Ft)
Avg SectionWidth(Ft)
AP (APRON) 8 570,259.00 APRON 48.00 12.58 45.394,570.00 114.13
AP RU (RUN-UP APRONS) 2 36,384.00 APRON 61.50 2.50 61.50375.00 95.00
RW 14-32 (RUNWAY 14-32) 6 500,075.00 RUNWAY 100.00 0.00 100.0013,600.00 60.42
TW A (TAXIWAY A) 3 193,795.00 TAXIWAY 56.00 2.45 54.034,800.00 40.00
TW A2 (TAXIWAY A2) 1 9,346.00 TAXIWAY 47.00 0.00 47.00180.00 40.00
TW A3 (TAXIWAY A3) 1 9,344.00 TAXIWAY 47.00 0.00 47.00180.00 40.00
TW A4 (TAXIWAY A4) 1 9,346.00 TAXIWAY 50.00 0.00 50.00180.00 40.00
TW A5 (TAXIWAY A5) 1 9,341.00 TAXIWAY 48.00 0.00 48.00180.00 40.00
TW CONN (CONNECTOR TAXIWAYTO APRON)
4 18,724.00 TAXIWAY 42.00 9.97 44.41385.00 40.00
TW HANG (TAXIWAY TO HANGARS) 3 102,390.00 TAXIWAY 71.00 20.70 59.953,550.00 28.33
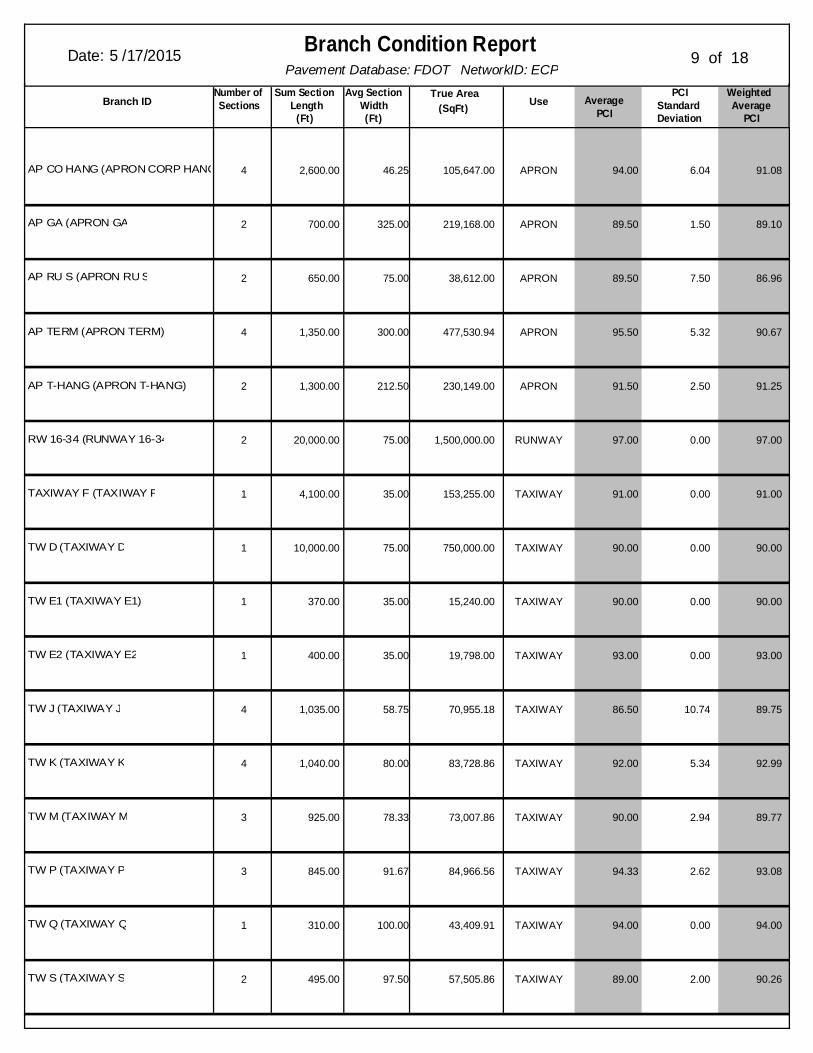
Pavement Database: FDOT NetworkID: ECP
Branch Condition ReportDate: 5 /17/2015 9 of 18
(SqFt)True Area
UseNumber ofSectionsBranch ID
PCIStandardDeviation
WeightedAverage
PCIAverage
PCI
Sum Section Length
(Ft)
Avg SectionWidth(Ft)
AP CO HANG (APRON CORP HANG) 4 105,647.00 APRON 94.00 6.04 91.082,600.00 46.25
AP GA (APRON GA) 2 219,168.00 APRON 89.50 1.50 89.10700.00 325.00
AP RU S (APRON RU S) 2 38,612.00 APRON 89.50 7.50 86.96650.00 75.00
AP TERM (APRON TERM) 4 477,530.94 APRON 95.50 5.32 90.671,350.00 300.00
AP T-HANG (APRON T-HANG) 2 230,149.00 APRON 91.50 2.50 91.251,300.00 212.50
RW 16-34 (RUNWAY 16-34) 2 1,500,000.00 RUNWAY 97.00 0.00 97.0020,000.00 75.00
TAXIWAY F (TAXIWAY F) 1 153,255.00 TAXIWAY 91.00 0.00 91.004,100.00 35.00
TW D (TAXIWAY D) 1 750,000.00 TAXIWAY 90.00 0.00 90.0010,000.00 75.00
TW E1 (TAXIWAY E1) 1 15,240.00 TAXIWAY 90.00 0.00 90.00370.00 35.00
TW E2 (TAXIWAY E2) 1 19,798.00 TAXIWAY 93.00 0.00 93.00400.00 35.00
TW J (TAXIWAY J) 4 70,955.18 TAXIWAY 86.50 10.74 89.751,035.00 58.75
TW K (TAXIWAY K) 4 83,728.86 TAXIWAY 92.00 5.34 92.991,040.00 80.00
TW M (TAXIWAY M) 3 73,007.86 TAXIWAY 90.00 2.94 89.77925.00 78.33
TW P (TAXIWAY P) 3 84,966.56 TAXIWAY 94.33 2.62 93.08845.00 91.67
TW Q (TAXIWAY Q) 1 43,409.91 TAXIWAY 94.00 0.00 94.00310.00 100.00
TW S (TAXIWAY S) 2 57,505.86 TAXIWAY 89.00 2.00 90.26495.00 97.50
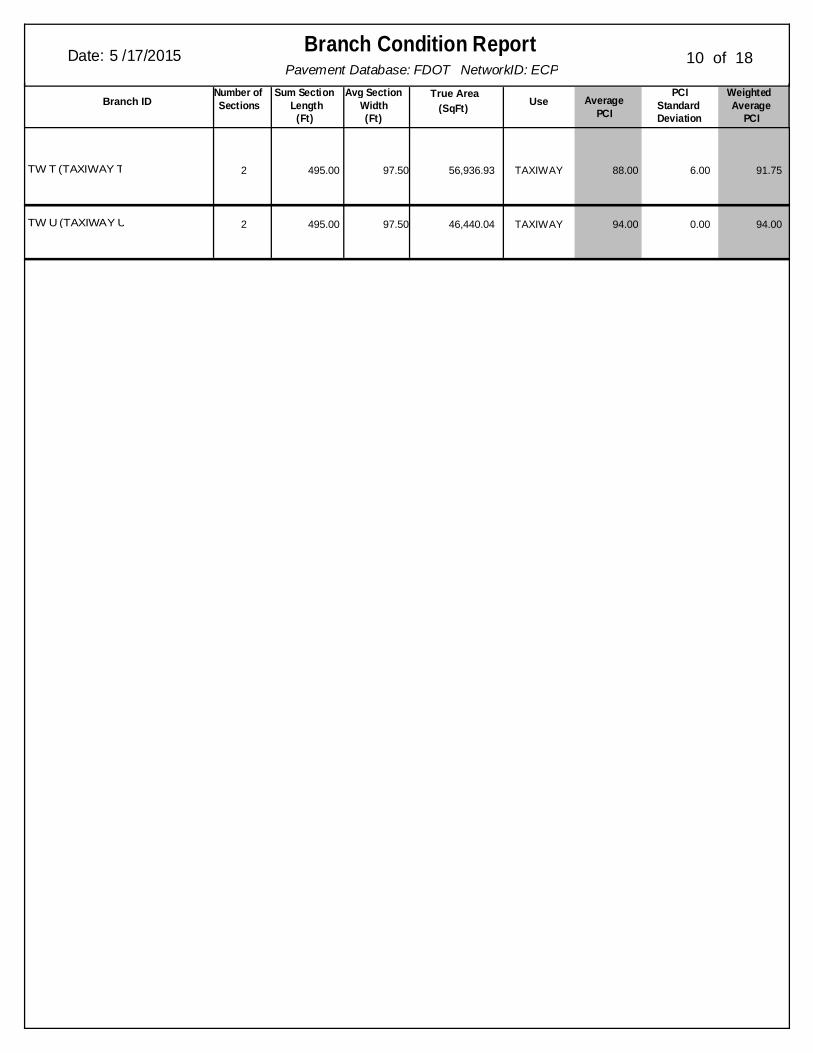
Pavement Database: FDOT NetworkID: ECP
Branch Condition ReportDate: 5 /17/2015 10 of 18
(SqFt)True Area
UseNumber ofSectionsBranch ID
PCIStandardDeviation
WeightedAverage
PCIAverage
PCI
Sum Section Length
(Ft)
Avg SectionWidth(Ft)
TW T (TAXIWAY T) 2 56,936.93 TAXIWAY 88.00 6.00 91.75495.00 97.50
TW U (TAXIWAY U) 2 46,440.04 TAXIWAY 94.00 0.00 94.00495.00 97.50
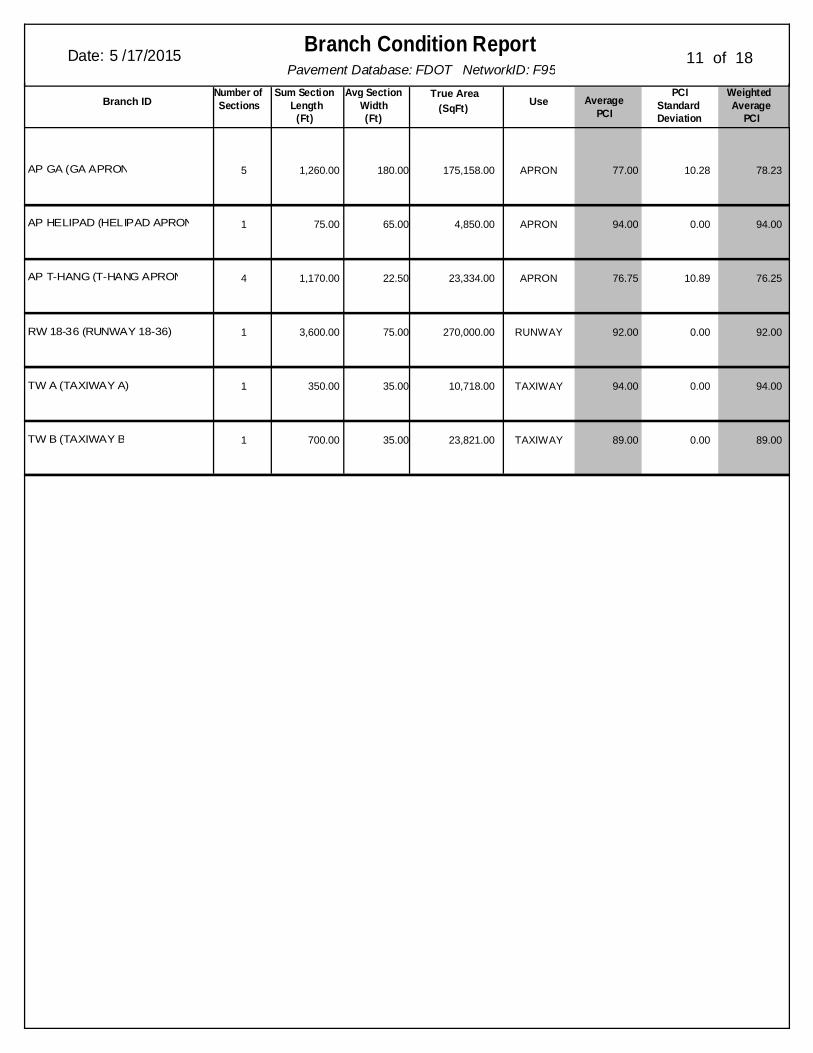
Pavement Database: FDOT NetworkID: F95
Branch Condition ReportDate: 5 /17/2015 11 of 18
(SqFt)True Area
UseNumber ofSectionsBranch ID
PCIStandardDeviation
WeightedAverage
PCIAverage
PCI
Sum Section Length
(Ft)
Avg SectionWidth(Ft)
AP GA (GA APRON) 5 175,158.00 APRON 77.00 10.28 78.231,260.00 180.00
AP HELIPAD (HELIPAD APRON) 1 4,850.00 APRON 94.00 0.00 94.0075.00 65.00
AP T-HANG (T-HANG APRON) 4 23,334.00 APRON 76.75 10.89 76.251,170.00 22.50
RW 18-36 (RUNWAY 18-36) 1 270,000.00 RUNWAY 92.00 0.00 92.003,600.00 75.00
TW A (TAXIWAY A) 1 10,718.00 TAXIWAY 94.00 0.00 94.00350.00 35.00
TW B (TAXIWAY B) 1 23,821.00 TAXIWAY 89.00 0.00 89.00700.00 35.00
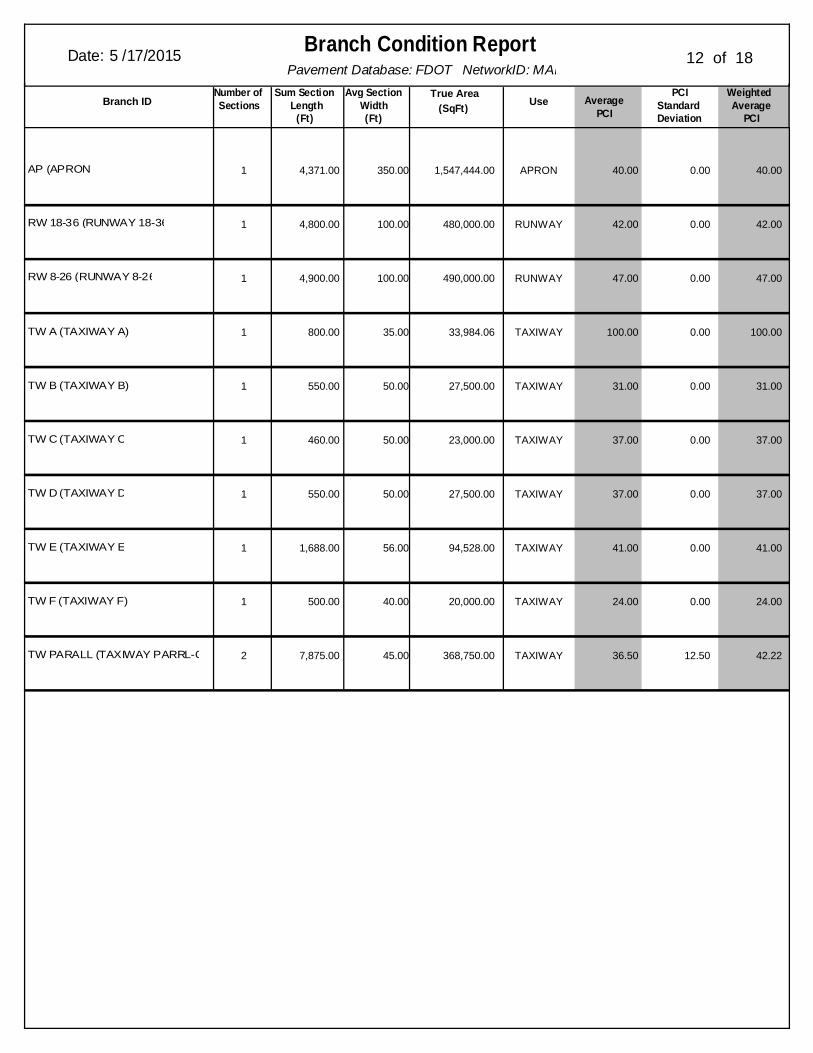
Pavement Database: FDOT NetworkID: MAI
Branch Condition ReportDate: 5 /17/2015 12 of 18
(SqFt)True Area
UseNumber ofSectionsBranch ID
PCIStandardDeviation
WeightedAverage
PCIAverage
PCI
Sum Section Length
(Ft)
Avg SectionWidth(Ft)
AP (APRON) 1 1,547,444.00 APRON 40.00 0.00 40.004,371.00 350.00
RW 18-36 (RUNWAY 18-36) 1 480,000.00 RUNWAY 42.00 0.00 42.004,800.00 100.00
RW 8-26 (RUNWAY 8-26) 1 490,000.00 RUNWAY 47.00 0.00 47.004,900.00 100.00
TW A (TAXIWAY A) 1 33,984.06 TAXIWAY 100.00 0.00 100.00800.00 35.00
TW B (TAXIWAY B) 1 27,500.00 TAXIWAY 31.00 0.00 31.00550.00 50.00
TW C (TAXIWAY C) 1 23,000.00 TAXIWAY 37.00 0.00 37.00460.00 50.00
TW D (TAXIWAY D) 1 27,500.00 TAXIWAY 37.00 0.00 37.00550.00 50.00
TW E (TAXIWAY E) 1 94,528.00 TAXIWAY 41.00 0.00 41.001,688.00 56.00
TW F (TAXIWAY F) 1 20,000.00 TAXIWAY 24.00 0.00 24.00500.00 40.00
TW PARALL (TAXIWAY PARRL-G) 2 368,750.00 TAXIWAY 36.50 12.50 42.227,875.00 45.00
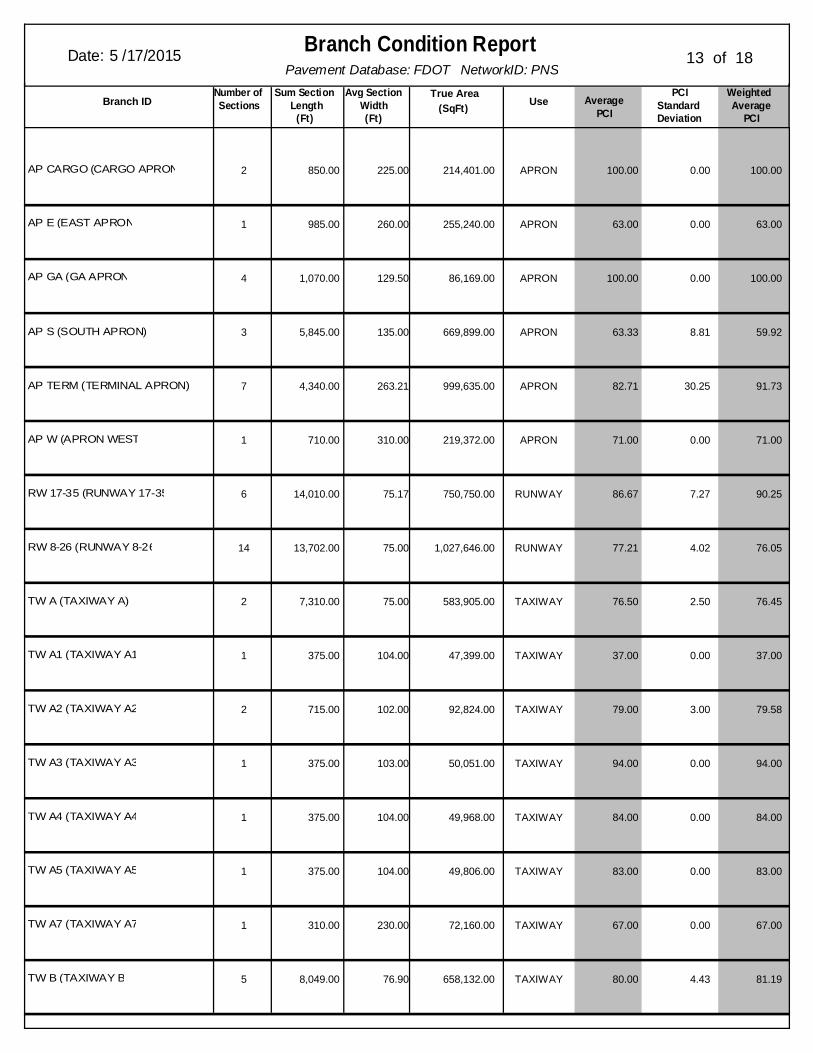
Pavement Database: FDOT NetworkID: PNS
Branch Condition ReportDate: 5 /17/2015 13 of 18
(SqFt)True Area
UseNumber ofSectionsBranch ID
PCIStandardDeviation
WeightedAverage
PCIAverage
PCI
Sum Section Length
(Ft)
Avg SectionWidth(Ft)
AP CARGO (CARGO APRON) 2 214,401.00 APRON 100.00 0.00 100.00850.00 225.00
AP E (EAST APRON) 1 255,240.00 APRON 63.00 0.00 63.00985.00 260.00
AP GA (GA APRON) 4 86,169.00 APRON 100.00 0.00 100.001,070.00 129.50
AP S (SOUTH APRON) 3 669,899.00 APRON 63.33 8.81 59.925,845.00 135.00
AP TERM (TERMINAL APRON) 7 999,635.00 APRON 82.71 30.25 91.734,340.00 263.21
AP W (APRON WEST) 1 219,372.00 APRON 71.00 0.00 71.00710.00 310.00
RW 17-35 (RUNWAY 17-35) 6 750,750.00 RUNWAY 86.67 7.27 90.2514,010.00 75.17
RW 8-26 (RUNWAY 8-26) 14 1,027,646.00 RUNWAY 77.21 4.02 76.0513,702.00 75.00
TW A (TAXIWAY A) 2 583,905.00 TAXIWAY 76.50 2.50 76.457,310.00 75.00
TW A1 (TAXIWAY A1) 1 47,399.00 TAXIWAY 37.00 0.00 37.00375.00 104.00
TW A2 (TAXIWAY A2) 2 92,824.00 TAXIWAY 79.00 3.00 79.58715.00 102.00
TW A3 (TAXIWAY A3) 1 50,051.00 TAXIWAY 94.00 0.00 94.00375.00 103.00
TW A4 (TAXIWAY A4) 1 49,968.00 TAXIWAY 84.00 0.00 84.00375.00 104.00
TW A5 (TAXIWAY A5) 1 49,806.00 TAXIWAY 83.00 0.00 83.00375.00 104.00
TW A7 (TAXIWAY A7) 1 72,160.00 TAXIWAY 67.00 0.00 67.00310.00 230.00
TW B (TAXIWAY B) 5 658,132.00 TAXIWAY 80.00 4.43 81.198,049.00 76.90
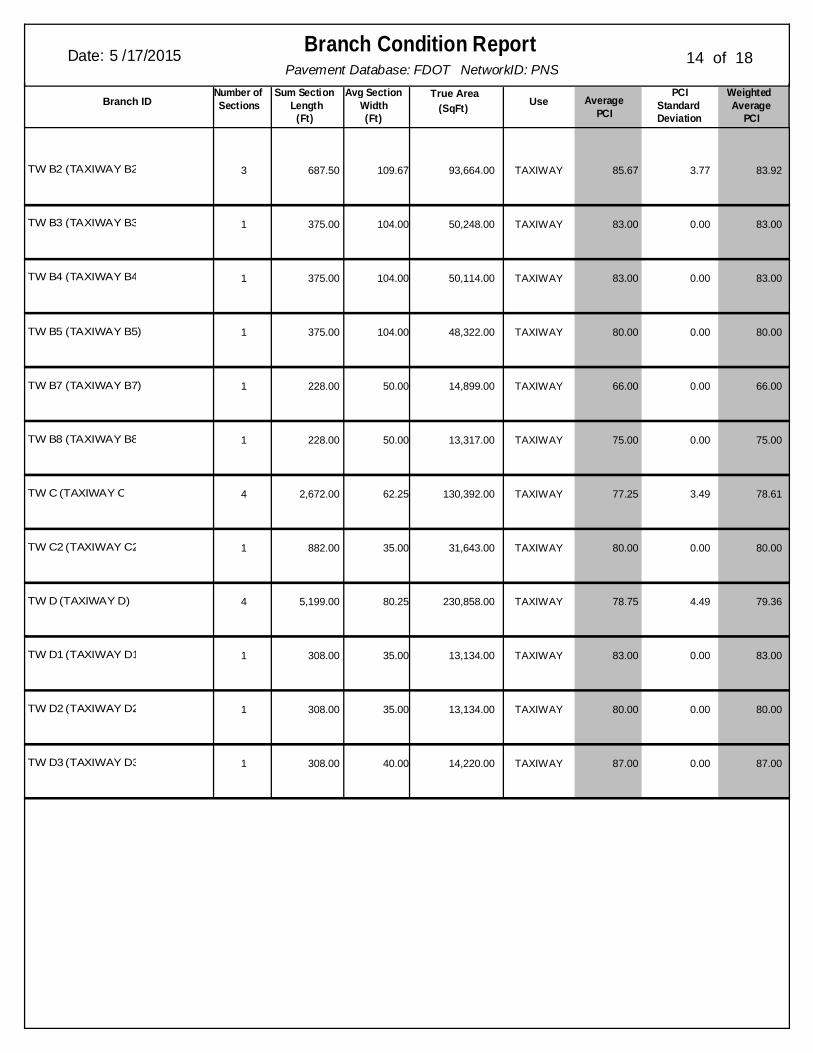
Pavement Database: FDOT NetworkID: PNS
Branch Condition ReportDate: 5 /17/2015 14 of 18
(SqFt)True Area
UseNumber ofSectionsBranch ID
PCIStandardDeviation
WeightedAverage
PCIAverage
PCI
Sum Section Length
(Ft)
Avg SectionWidth(Ft)
TW B2 (TAXIWAY B2) 3 93,664.00 TAXIWAY 85.67 3.77 83.92687.50 109.67
TW B3 (TAXIWAY B3) 1 50,248.00 TAXIWAY 83.00 0.00 83.00375.00 104.00
TW B4 (TAXIWAY B4) 1 50,114.00 TAXIWAY 83.00 0.00 83.00375.00 104.00
TW B5 (TAXIWAY B5) 1 48,322.00 TAXIWAY 80.00 0.00 80.00375.00 104.00
TW B7 (TAXIWAY B7) 1 14,899.00 TAXIWAY 66.00 0.00 66.00228.00 50.00
TW B8 (TAXIWAY B8) 1 13,317.00 TAXIWAY 75.00 0.00 75.00228.00 50.00
TW C (TAXIWAY C) 4 130,392.00 TAXIWAY 77.25 3.49 78.612,672.00 62.25
TW C2 (TAXIWAY C2) 1 31,643.00 TAXIWAY 80.00 0.00 80.00882.00 35.00
TW D (TAXIWAY D) 4 230,858.00 TAXIWAY 78.75 4.49 79.365,199.00 80.25
TW D1 (TAXIWAY D1) 1 13,134.00 TAXIWAY 83.00 0.00 83.00308.00 35.00
TW D2 (TAXIWAY D2) 1 13,134.00 TAXIWAY 80.00 0.00 80.00308.00 35.00
TW D3 (TAXIWAY D3) 1 14,220.00 TAXIWAY 87.00 0.00 87.00308.00 40.00
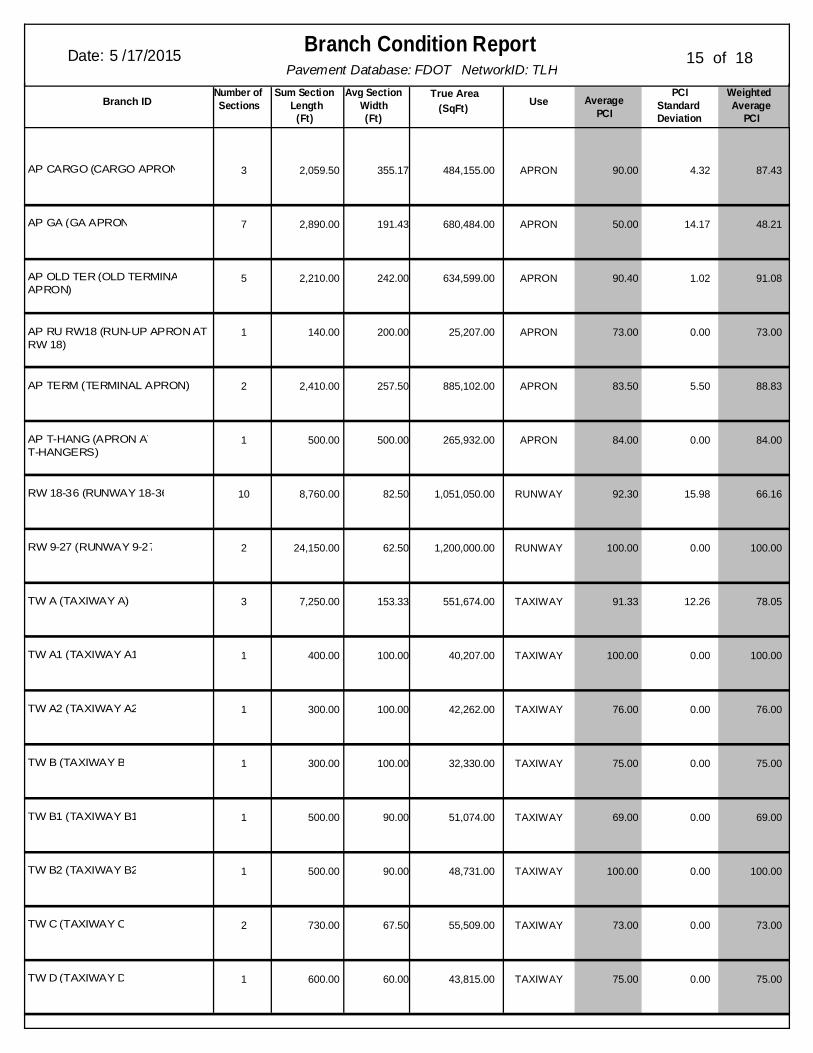
Pavement Database: FDOT NetworkID: TLH
Branch Condition ReportDate: 5 /17/2015 15 of 18
(SqFt)True Area
UseNumber ofSectionsBranch ID
PCIStandardDeviation
WeightedAverage
PCIAverage
PCI
Sum Section Length
(Ft)
Avg SectionWidth(Ft)
AP CARGO (CARGO APRON) 3 484,155.00 APRON 90.00 4.32 87.432,059.50 355.17
AP GA (GA APRON) 7 680,484.00 APRON 50.00 14.17 48.212,890.00 191.43
AP OLD TER (OLD TERMINALAPRON)
5 634,599.00 APRON 90.40 1.02 91.082,210.00 242.00
AP RU RW18 (RUN-UP APRON ATRW 18)
1 25,207.00 APRON 73.00 0.00 73.00140.00 200.00
AP TERM (TERMINAL APRON) 2 885,102.00 APRON 83.50 5.50 88.832,410.00 257.50
AP T-HANG (APRON ATT-HANGERS)
1 265,932.00 APRON 84.00 0.00 84.00500.00 500.00
RW 18-36 (RUNWAY 18-36) 10 1,051,050.00 RUNWAY 92.30 15.98 66.168,760.00 82.50
RW 9-27 (RUNWAY 9-27) 2 1,200,000.00 RUNWAY 100.00 0.00 100.0024,150.00 62.50
TW A (TAXIWAY A) 3 551,674.00 TAXIWAY 91.33 12.26 78.057,250.00 153.33
TW A1 (TAXIWAY A1) 1 40,207.00 TAXIWAY 100.00 0.00 100.00400.00 100.00
TW A2 (TAXIWAY A2) 1 42,262.00 TAXIWAY 76.00 0.00 76.00300.00 100.00
TW B (TAXIWAY B) 1 32,330.00 TAXIWAY 75.00 0.00 75.00300.00 100.00
TW B1 (TAXIWAY B1) 1 51,074.00 TAXIWAY 69.00 0.00 69.00500.00 90.00
TW B2 (TAXIWAY B2) 1 48,731.00 TAXIWAY 100.00 0.00 100.00500.00 90.00
TW C (TAXIWAY C) 2 55,509.00 TAXIWAY 73.00 0.00 73.00730.00 67.50
TW D (TAXIWAY D) 1 43,815.00 TAXIWAY 75.00 0.00 75.00600.00 60.00
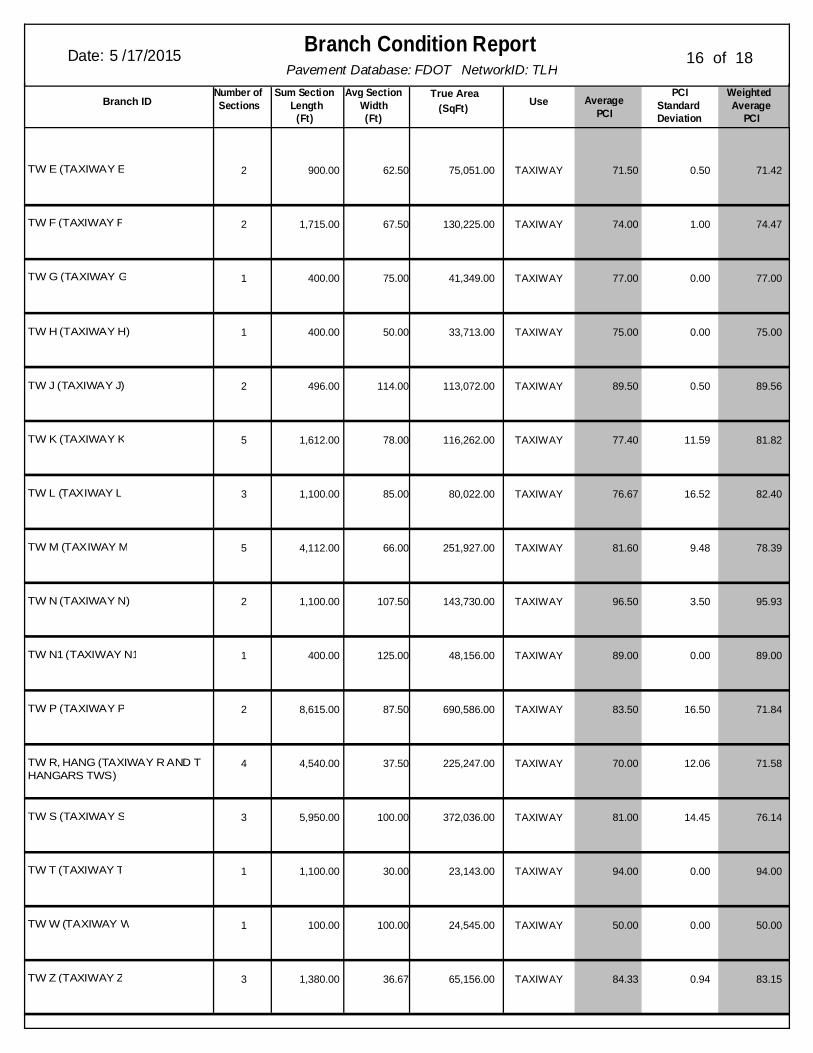
Pavement Database: FDOT NetworkID: TLH
Branch Condition ReportDate: 5 /17/2015 16 of 18
(SqFt)True Area
UseNumber ofSectionsBranch ID
PCIStandardDeviation
WeightedAverage
PCIAverage
PCI
Sum Section Length
(Ft)
Avg SectionWidth(Ft)
TW E (TAXIWAY E) 2 75,051.00 TAXIWAY 71.50 0.50 71.42900.00 62.50
TW F (TAXIWAY F) 2 130,225.00 TAXIWAY 74.00 1.00 74.471,715.00 67.50
TW G (TAXIWAY G) 1 41,349.00 TAXIWAY 77.00 0.00 77.00400.00 75.00
TW H (TAXIWAY H) 1 33,713.00 TAXIWAY 75.00 0.00 75.00400.00 50.00
TW J (TAXIWAY J) 2 113,072.00 TAXIWAY 89.50 0.50 89.56496.00 114.00
TW K (TAXIWAY K) 5 116,262.00 TAXIWAY 77.40 11.59 81.821,612.00 78.00
TW L (TAXIWAY L) 3 80,022.00 TAXIWAY 76.67 16.52 82.401,100.00 85.00
TW M (TAXIWAY M) 5 251,927.00 TAXIWAY 81.60 9.48 78.394,112.00 66.00
TW N (TAXIWAY N) 2 143,730.00 TAXIWAY 96.50 3.50 95.931,100.00 107.50
TW N1 (TAXIWAY N1) 1 48,156.00 TAXIWAY 89.00 0.00 89.00400.00 125.00
TW P (TAXIWAY P) 2 690,586.00 TAXIWAY 83.50 16.50 71.848,615.00 87.50
TW R, HANG (TAXIWAY R AND TOHANGARS TWS)
4 225,247.00 TAXIWAY 70.00 12.06 71.584,540.00 37.50
TW S (TAXIWAY S) 3 372,036.00 TAXIWAY 81.00 14.45 76.145,950.00 100.00
TW T (TAXIWAY T) 1 23,143.00 TAXIWAY 94.00 0.00 94.001,100.00 30.00
TW W (TAXIWAY W) 1 24,545.00 TAXIWAY 50.00 0.00 50.00100.00 100.00
TW Z (TAXIWAY Z) 3 65,156.00 TAXIWAY 84.33 0.94 83.151,380.00 36.67
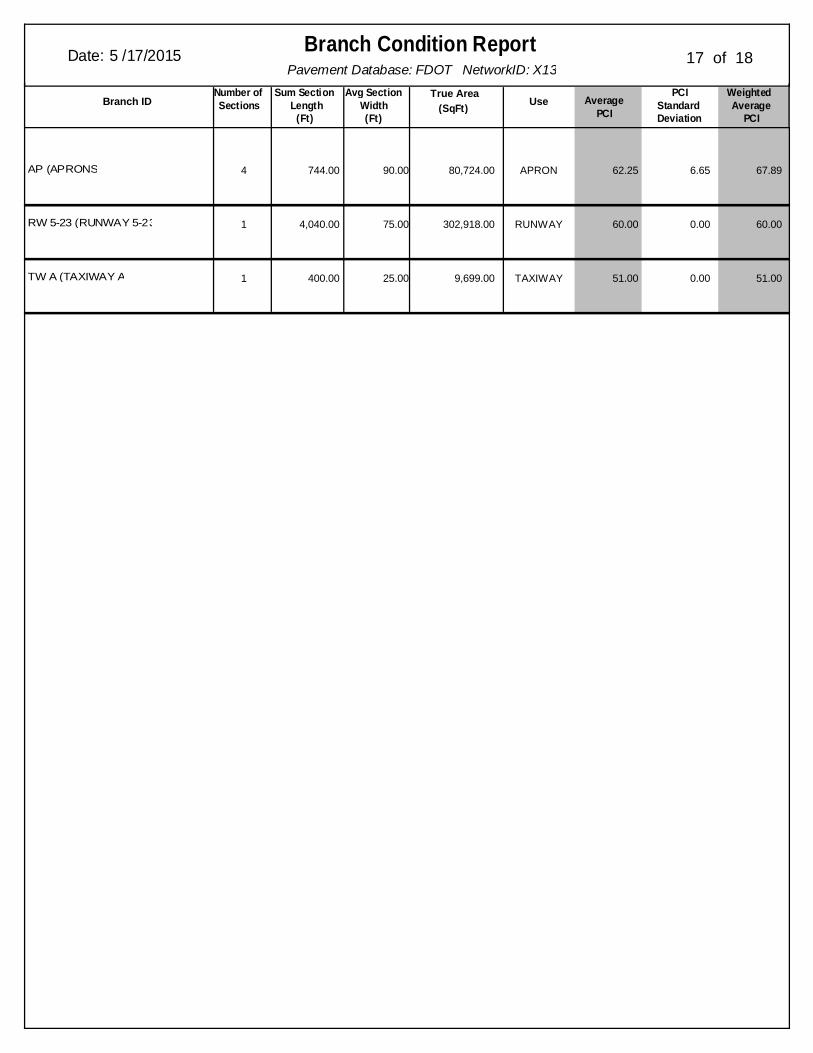
Pavement Database: FDOT NetworkID: X13
Branch Condition ReportDate: 5 /17/2015 17 of 18
(SqFt)True Area
UseNumber ofSectionsBranch ID
PCIStandardDeviation
WeightedAverage
PCIAverage
PCI
Sum Section Length
(Ft)
Avg SectionWidth(Ft)
AP (APRONS) 4 80,724.00 APRON 62.25 6.65 67.89744.00 90.00
RW 5-23 (RUNWAY 5-23) 1 302,918.00 RUNWAY 60.00 0.00 60.004,040.00 75.00
TW A (TAXIWAY A) 1 9,699.00 TAXIWAY 51.00 0.00 51.00400.00 25.00
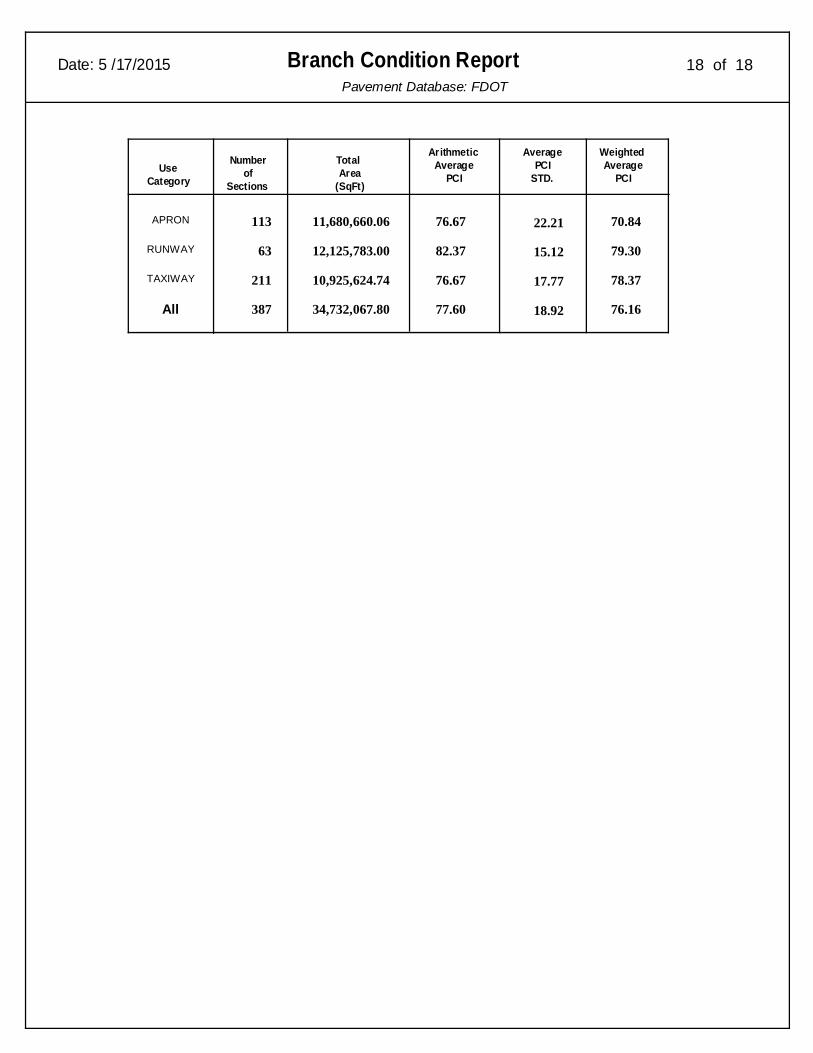
Date: 5 /17/2015 Branch Condition ReportPavement Database: FDOT
18 of 18
76.67
82.37
76.67
77.60
22.21
15.12
17.77
18.92
11,680,660.06
12,125,783.00
10,925,624.74
34,732,067.80
TotalArea
(SqFt)Use
Category
Numberof
Sections
ArithmeticAverage
PCI
AveragePCI
STD.
WeightedAverage
PCI
113
63
211
387All
TAXIWAY
RUNWAY
APRON 70.84
79.30
78.37
76.16
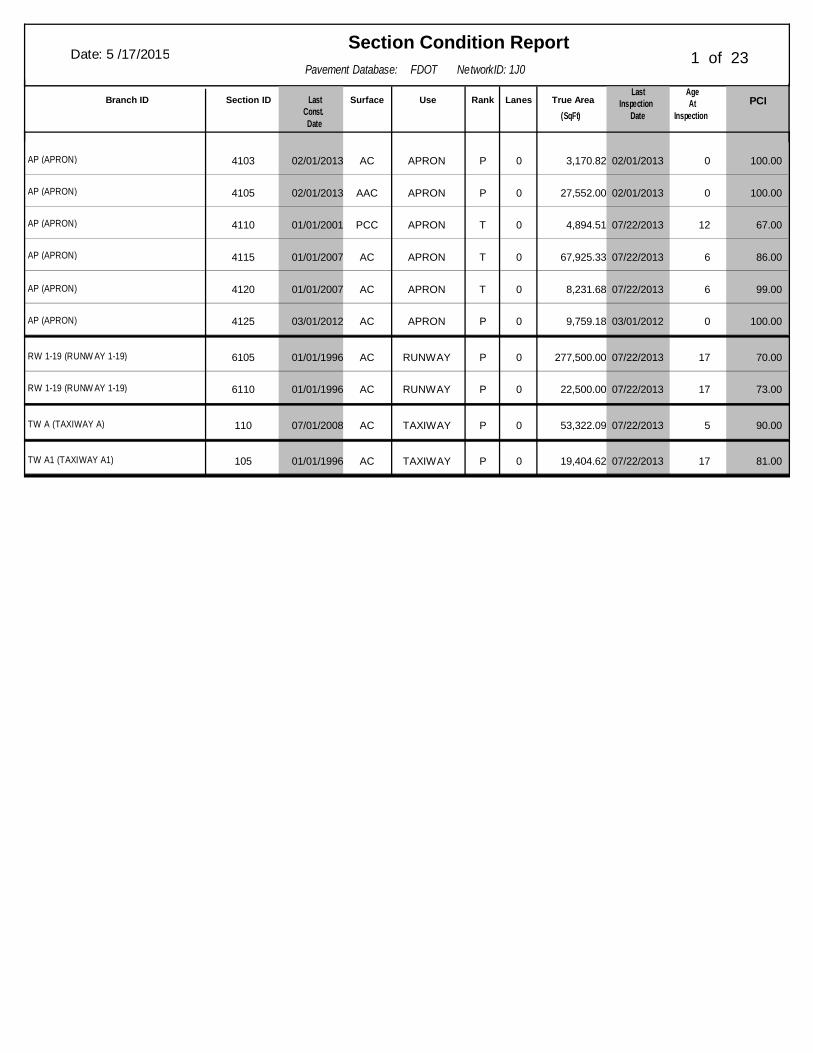
Pavement Database: FDOT NetworkID: 1J0
Section Condition ReportDate: 5 /17/2015 1 of 23
AgeAt
Inspection
LastInspection
Date(SqFt)True AreaLanesRankUseSurfaceLast
Const.Date
Section IDBranch ID PCI
02/01/20134103AP (APRON) 02/01/2013 100.00AC APRON P 0 3,170.82 0
02/01/20134105AP (APRON) 02/01/2013 100.00AAC APRON P 0 27,552.00 0
01/01/20014110AP (APRON) 07/22/2013 67.00PCC APRON T 0 4,894.51 12
01/01/20074115AP (APRON) 07/22/2013 86.00AC APRON T 0 67,925.33 6
01/01/20074120AP (APRON) 07/22/2013 99.00AC APRON T 0 8,231.68 6
03/01/20124125AP (APRON) 03/01/2012 100.00AC APRON P 0 9,759.18 0
01/01/19966105RW 1-19 (RUNW AY 1-19) 07/22/2013 70.00AC RUNWAY P 0 277,500.00 17
01/01/19966110RW 1-19 (RUNW AY 1-19) 07/22/2013 73.00AC RUNWAY P 0 22,500.00 17
07/01/2008110TW A (TAXIWAY A) 07/22/2013 90.00AC TAXIWAY P 0 53,322.09 5
01/01/1996105TW A1 (TAXIWAY A1) 07/22/2013 81.00AC TAXIWAY P 0 19,404.62 17
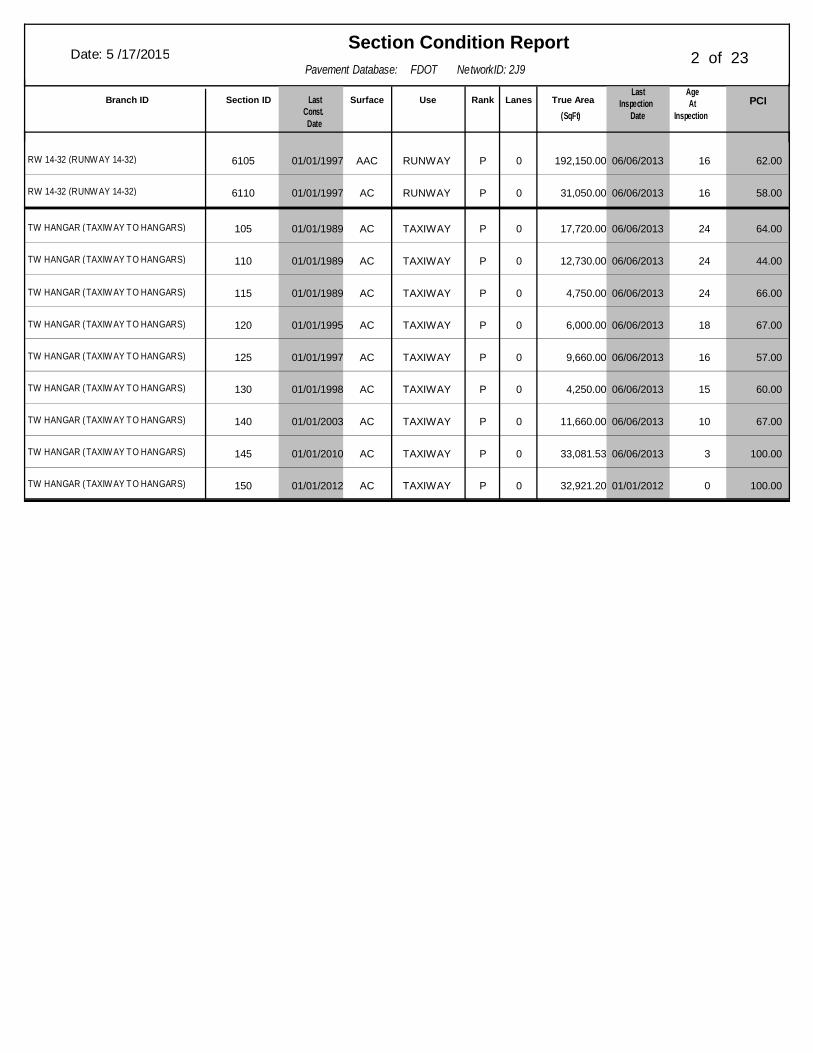
Pavement Database: FDOT NetworkID: 2J9
Section Condition ReportDate: 5 /17/2015 2 of 23
AgeAt
Inspection
LastInspection
Date(SqFt)True AreaLanesRankUseSurfaceLast
Const.Date
Section IDBranch ID PCI
01/01/19976105RW 14-32 (RUNW AY 14-32) 06/06/2013 62.00AAC RUNWAY P 0 192,150.00 16
01/01/19976110RW 14-32 (RUNW AY 14-32) 06/06/2013 58.00AC RUNWAY P 0 31,050.00 16
01/01/1989105TW HANGAR (TAXIW AY TO HANGARS) 06/06/2013 64.00AC TAXIWAY P 0 17,720.00 24
01/01/1989110TW HANGAR (TAXIW AY TO HANGARS) 06/06/2013 44.00AC TAXIWAY P 0 12,730.00 24
01/01/1989115TW HANGAR (TAXIW AY TO HANGARS) 06/06/2013 66.00AC TAXIWAY P 0 4,750.00 24
01/01/1995120TW HANGAR (TAXIW AY TO HANGARS) 06/06/2013 67.00AC TAXIWAY P 0 6,000.00 18
01/01/1997125TW HANGAR (TAXIW AY TO HANGARS) 06/06/2013 57.00AC TAXIWAY P 0 9,660.00 16
01/01/1998130TW HANGAR (TAXIW AY TO HANGARS) 06/06/2013 60.00AC TAXIWAY P 0 4,250.00 15
01/01/2003140TW HANGAR (TAXIW AY TO HANGARS) 06/06/2013 67.00AC TAXIWAY P 0 11,660.00 10
01/01/2010145TW HANGAR (TAXIW AY TO HANGARS) 06/06/2013 100.00AC TAXIWAY P 0 33,081.53 3
01/01/2012150TW HANGAR (TAXIW AY TO HANGARS) 01/01/2012 100.00AC TAXIWAY P 0 32,921.20 0
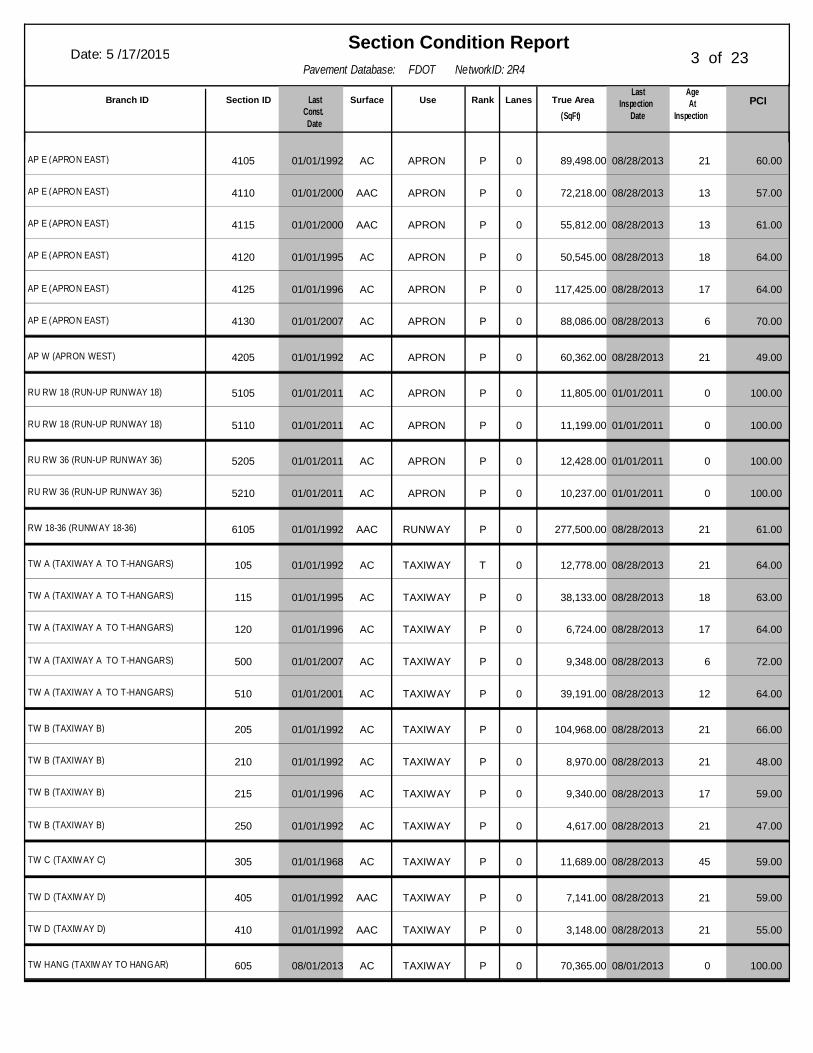
Pavement Database: FDOT NetworkID: 2R4
Section Condition ReportDate: 5 /17/2015 3 of 23
AgeAt
Inspection
LastInspection
Date(SqFt)True AreaLanesRankUseSurfaceLast
Const.Date
Section IDBranch ID PCI
01/01/19924105AP E (APRON EAST) 08/28/2013 60.00AC APRON P 0 89,498.00 21
01/01/20004110AP E (APRON EAST) 08/28/2013 57.00AAC APRON P 0 72,218.00 13
01/01/20004115AP E (APRON EAST) 08/28/2013 61.00AAC APRON P 0 55,812.00 13
01/01/19954120AP E (APRON EAST) 08/28/2013 64.00AC APRON P 0 50,545.00 18
01/01/19964125AP E (APRON EAST) 08/28/2013 64.00AC APRON P 0 117,425.00 17
01/01/20074130AP E (APRON EAST) 08/28/2013 70.00AC APRON P 0 88,086.00 6
01/01/19924205AP W (APRON WEST) 08/28/2013 49.00AC APRON P 0 60,362.00 21
01/01/20115105RU RW 18 (RUN-UP RUNWAY 18) 01/01/2011 100.00AC APRON P 0 11,805.00 0
01/01/20115110RU RW 18 (RUN-UP RUNWAY 18) 01/01/2011 100.00AC APRON P 0 11,199.00 0
01/01/20115205RU RW 36 (RUN-UP RUNWAY 36) 01/01/2011 100.00AC APRON P 0 12,428.00 0
01/01/20115210RU RW 36 (RUN-UP RUNWAY 36) 01/01/2011 100.00AC APRON P 0 10,237.00 0
01/01/19926105RW 18-36 (RUNW AY 18-36) 08/28/2013 61.00AAC RUNWAY P 0 277,500.00 21
01/01/1992105TW A (TAXIWAY A TO T-HANGARS) 08/28/2013 64.00AC TAXIWAY T 0 12,778.00 21
01/01/1995115TW A (TAXIWAY A TO T-HANGARS) 08/28/2013 63.00AC TAXIWAY P 0 38,133.00 18
01/01/1996120TW A (TAXIWAY A TO T-HANGARS) 08/28/2013 64.00AC TAXIWAY P 0 6,724.00 17
01/01/2007500TW A (TAXIWAY A TO T-HANGARS) 08/28/2013 72.00AC TAXIWAY P 0 9,348.00 6
01/01/2001510TW A (TAXIWAY A TO T-HANGARS) 08/28/2013 64.00AC TAXIWAY P 0 39,191.00 12
01/01/1992205TW B (TAXIWAY B) 08/28/2013 66.00AC TAXIWAY P 0 104,968.00 21
01/01/1992210TW B (TAXIWAY B) 08/28/2013 48.00AC TAXIWAY P 0 8,970.00 21
01/01/1996215TW B (TAXIWAY B) 08/28/2013 59.00AC TAXIWAY P 0 9,340.00 17
01/01/1992250TW B (TAXIWAY B) 08/28/2013 47.00AC TAXIWAY P 0 4,617.00 21
01/01/1968305TW C (TAXIW AY C) 08/28/2013 59.00AC TAXIWAY P 0 11,689.00 45
01/01/1992405TW D (TAXIW AY D) 08/28/2013 59.00AAC TAXIWAY P 0 7,141.00 21
01/01/1992410TW D (TAXIW AY D) 08/28/2013 55.00AAC TAXIWAY P 0 3,148.00 21
08/01/2013605TW HANG (TAXIW AY TO HANGAR) 08/01/2013 100.00AC TAXIWAY P 0 70,365.00 0
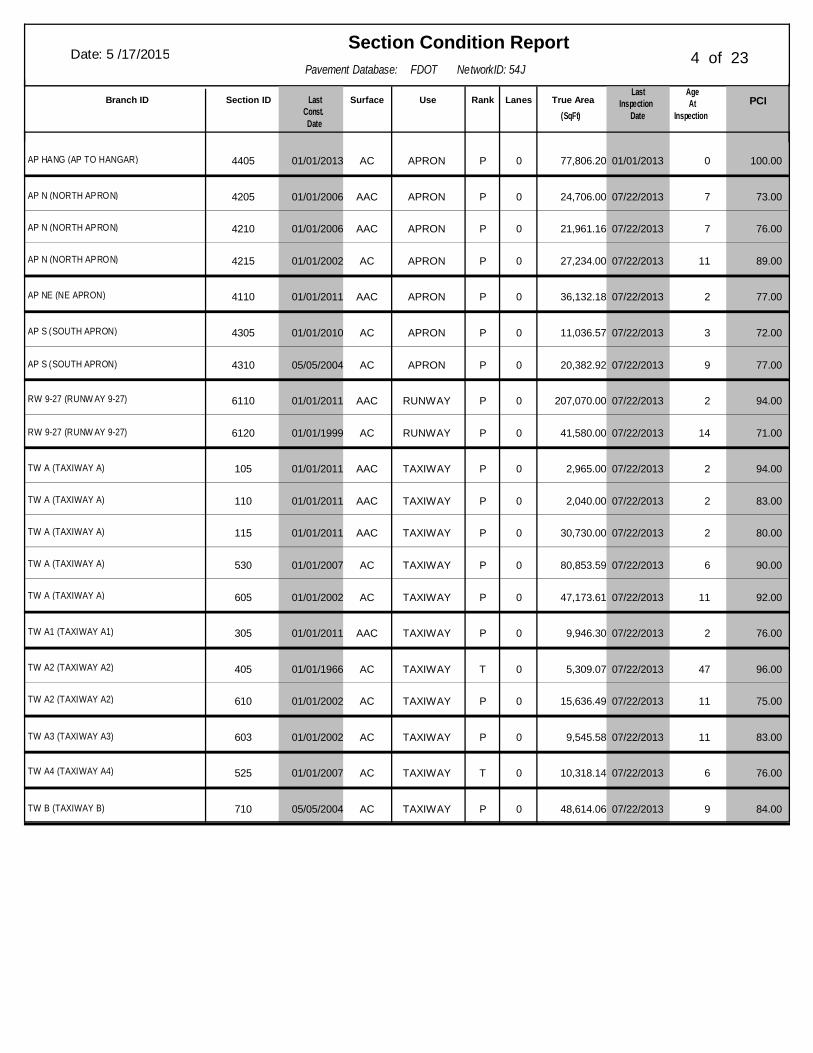
Pavement Database: FDOT NetworkID: 54J
Section Condition ReportDate: 5 /17/2015 4 of 23
AgeAt
Inspection
LastInspection
Date(SqFt)True AreaLanesRankUseSurfaceLast
Const.Date
Section IDBranch ID PCI
01/01/20134405AP HANG (AP TO HANGAR) 01/01/2013 100.00AC APRON P 0 77,806.20 0
01/01/20064205AP N (NORTH APRON) 07/22/2013 73.00AAC APRON P 0 24,706.00 7
01/01/20064210AP N (NORTH APRON) 07/22/2013 76.00AAC APRON P 0 21,961.16 7
01/01/20024215AP N (NORTH APRON) 07/22/2013 89.00AC APRON P 0 27,234.00 11
01/01/20114110AP NE (NE APRON) 07/22/2013 77.00AAC APRON P 0 36,132.18 2
01/01/20104305AP S (SOUTH APRON) 07/22/2013 72.00AC APRON P 0 11,036.57 3
05/05/20044310AP S (SOUTH APRON) 07/22/2013 77.00AC APRON P 0 20,382.92 9
01/01/20116110RW 9-27 (RUNW AY 9-27) 07/22/2013 94.00AAC RUNWAY P 0 207,070.00 2
01/01/19996120RW 9-27 (RUNW AY 9-27) 07/22/2013 71.00AC RUNWAY P 0 41,580.00 14
01/01/2011105TW A (TAXIWAY A) 07/22/2013 94.00AAC TAXIWAY P 0 2,965.00 2
01/01/2011110TW A (TAXIWAY A) 07/22/2013 83.00AAC TAXIWAY P 0 2,040.00 2
01/01/2011115TW A (TAXIWAY A) 07/22/2013 80.00AAC TAXIWAY P 0 30,730.00 2
01/01/2007530TW A (TAXIWAY A) 07/22/2013 90.00AC TAXIWAY P 0 80,853.59 6
01/01/2002605TW A (TAXIWAY A) 07/22/2013 92.00AC TAXIWAY P 0 47,173.61 11
01/01/2011305TW A1 (TAXIWAY A1) 07/22/2013 76.00AAC TAXIWAY P 0 9,946.30 2
01/01/1966405TW A2 (TAXIWAY A2) 07/22/2013 96.00AC TAXIWAY T 0 5,309.07 47
01/01/2002610TW A2 (TAXIWAY A2) 07/22/2013 75.00AC TAXIWAY P 0 15,636.49 11
01/01/2002603TW A3 (TAXIWAY A3) 07/22/2013 83.00AC TAXIWAY P 0 9,545.58 11
01/01/2007525TW A4 (TAXIWAY A4) 07/22/2013 76.00AC TAXIWAY T 0 10,318.14 6
05/05/2004710TW B (TAXIWAY B) 07/22/2013 84.00AC TAXIWAY P 0 48,614.06 9
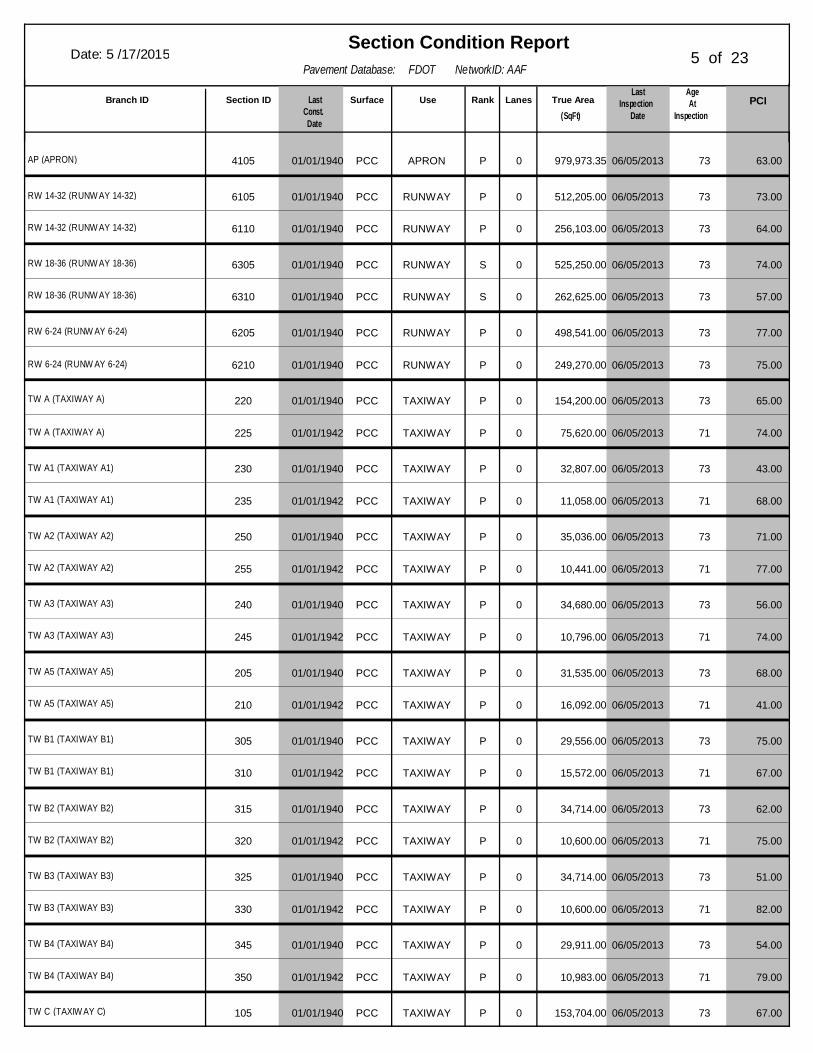
Pavement Database: FDOT NetworkID: AAF
Section Condition ReportDate: 5 /17/2015 5 of 23
AgeAt
Inspection
LastInspection
Date(SqFt)True AreaLanesRankUseSurfaceLast
Const.Date
Section IDBranch ID PCI
01/01/19404105AP (APRON) 06/05/2013 63.00PCC APRON P 0 979,973.35 73
01/01/19406105RW 14-32 (RUNW AY 14-32) 06/05/2013 73.00PCC RUNWAY P 0 512,205.00 73
01/01/19406110RW 14-32 (RUNW AY 14-32) 06/05/2013 64.00PCC RUNWAY P 0 256,103.00 73
01/01/19406305RW 18-36 (RUNW AY 18-36) 06/05/2013 74.00PCC RUNWAY S 0 525,250.00 73
01/01/19406310RW 18-36 (RUNW AY 18-36) 06/05/2013 57.00PCC RUNWAY S 0 262,625.00 73
01/01/19406205RW 6-24 (RUNW AY 6-24) 06/05/2013 77.00PCC RUNWAY P 0 498,541.00 73
01/01/19406210RW 6-24 (RUNW AY 6-24) 06/05/2013 75.00PCC RUNWAY P 0 249,270.00 73
01/01/1940220TW A (TAXIWAY A) 06/05/2013 65.00PCC TAXIWAY P 0 154,200.00 73
01/01/1942225TW A (TAXIWAY A) 06/05/2013 74.00PCC TAXIWAY P 0 75,620.00 71
01/01/1940230TW A1 (TAXIWAY A1) 06/05/2013 43.00PCC TAXIWAY P 0 32,807.00 73
01/01/1942235TW A1 (TAXIWAY A1) 06/05/2013 68.00PCC TAXIWAY P 0 11,058.00 71
01/01/1940250TW A2 (TAXIWAY A2) 06/05/2013 71.00PCC TAXIWAY P 0 35,036.00 73
01/01/1942255TW A2 (TAXIWAY A2) 06/05/2013 77.00PCC TAXIWAY P 0 10,441.00 71
01/01/1940240TW A3 (TAXIWAY A3) 06/05/2013 56.00PCC TAXIWAY P 0 34,680.00 73
01/01/1942245TW A3 (TAXIWAY A3) 06/05/2013 74.00PCC TAXIWAY P 0 10,796.00 71
01/01/1940205TW A5 (TAXIWAY A5) 06/05/2013 68.00PCC TAXIWAY P 0 31,535.00 73
01/01/1942210TW A5 (TAXIWAY A5) 06/05/2013 41.00PCC TAXIWAY P 0 16,092.00 71
01/01/1940305TW B1 (TAXIWAY B1) 06/05/2013 75.00PCC TAXIWAY P 0 29,556.00 73
01/01/1942310TW B1 (TAXIWAY B1) 06/05/2013 67.00PCC TAXIWAY P 0 15,572.00 71
01/01/1940315TW B2 (TAXIWAY B2) 06/05/2013 62.00PCC TAXIWAY P 0 34,714.00 73
01/01/1942320TW B2 (TAXIWAY B2) 06/05/2013 75.00PCC TAXIWAY P 0 10,600.00 71
01/01/1940325TW B3 (TAXIWAY B3) 06/05/2013 51.00PCC TAXIWAY P 0 34,714.00 73
01/01/1942330TW B3 (TAXIWAY B3) 06/05/2013 82.00PCC TAXIWAY P 0 10,600.00 71
01/01/1940345TW B4 (TAXIWAY B4) 06/05/2013 54.00PCC TAXIWAY P 0 29,911.00 73
01/01/1942350TW B4 (TAXIWAY B4) 06/05/2013 79.00PCC TAXIWAY P 0 10,983.00 71
01/01/1940105TW C (TAXIW AY C) 06/05/2013 67.00PCC TAXIWAY P 0 153,704.00 73

Pavement Database: FDOT NetworkID: AAF
Section Condition ReportDate: 5 /17/2015 6 of 23
AgeAt
Inspection
LastInspection
Date(SqFt)True AreaLanesRankUseSurfaceLast
Const.Date
Section IDBranch ID PCI
01/01/1942110TW C (TAXIW AY C) 06/05/2013 72.00PCC TAXIWAY P 0 77,718.00 71
01/01/1942155TW C1 (TAXIW AY C1) 06/05/2013 71.00PCC TAXIWAY P 0 10,613.00 71
01/01/1940160TW C1 (TAXIW AY C1) 06/05/2013 79.00PCC TAXIWAY P 0 34,877.00 73
01/01/1942145TW C2 (TAXIW AY C2) 06/05/2013 76.00PCC TAXIWAY P 0 10,646.00 71
01/01/1940150TW C2 (TAXIW AY C2) 06/05/2013 78.00PCC TAXIWAY P 0 34,830.00 73
01/01/1940335TW D (TAXIW AY D) 06/05/2013 58.00PCC TAXIWAY P 0 40,968.00 73
01/01/1942340TW D (TAXIW AY D) 06/05/2013 71.00PCC TAXIWAY P 0 15,082.00 71
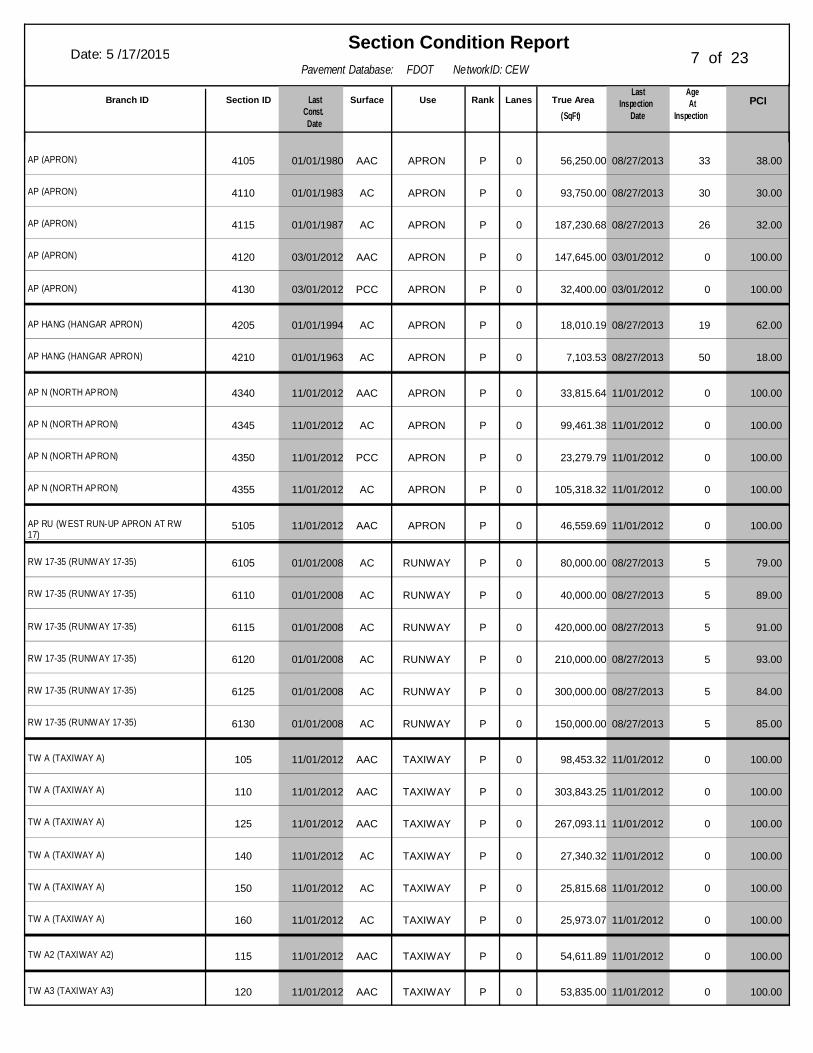
Pavement Database: FDOT NetworkID: CEW
Section Condition ReportDate: 5 /17/2015 7 of 23
AgeAt
Inspection
LastInspection
Date(SqFt)True AreaLanesRankUseSurfaceLast
Const.Date
Section IDBranch ID PCI
01/01/19804105AP (APRON) 08/27/2013 38.00AAC APRON P 0 56,250.00 33
01/01/19834110AP (APRON) 08/27/2013 30.00AC APRON P 0 93,750.00 30
01/01/19874115AP (APRON) 08/27/2013 32.00AC APRON P 0 187,230.68 26
03/01/20124120AP (APRON) 03/01/2012 100.00AAC APRON P 0 147,645.00 0
03/01/20124130AP (APRON) 03/01/2012 100.00PCC APRON P 0 32,400.00 0
01/01/19944205AP HANG (HANGAR APRON) 08/27/2013 62.00AC APRON P 0 18,010.19 19
01/01/19634210AP HANG (HANGAR APRON) 08/27/2013 18.00AC APRON P 0 7,103.53 50
11/01/20124340AP N (NORTH APRON) 11/01/2012 100.00AAC APRON P 0 33,815.64 0
11/01/20124345AP N (NORTH APRON) 11/01/2012 100.00AC APRON P 0 99,461.38 0
11/01/20124350AP N (NORTH APRON) 11/01/2012 100.00PCC APRON P 0 23,279.79 0
11/01/20124355AP N (NORTH APRON) 11/01/2012 100.00AC APRON P 0 105,318.32 0
11/01/20125105AP RU (W EST RUN-UP APRON AT RW17)
11/01/2012 100.00AAC APRON P 0 46,559.69 0
01/01/20086105RW 17-35 (RUNW AY 17-35) 08/27/2013 79.00AC RUNWAY P 0 80,000.00 5
01/01/20086110RW 17-35 (RUNW AY 17-35) 08/27/2013 89.00AC RUNWAY P 0 40,000.00 5
01/01/20086115RW 17-35 (RUNW AY 17-35) 08/27/2013 91.00AC RUNWAY P 0 420,000.00 5
01/01/20086120RW 17-35 (RUNW AY 17-35) 08/27/2013 93.00AC RUNWAY P 0 210,000.00 5
01/01/20086125RW 17-35 (RUNW AY 17-35) 08/27/2013 84.00AC RUNWAY P 0 300,000.00 5
01/01/20086130RW 17-35 (RUNW AY 17-35) 08/27/2013 85.00AC RUNWAY P 0 150,000.00 5
11/01/2012105TW A (TAXIWAY A) 11/01/2012 100.00AAC TAXIWAY P 0 98,453.32 0
11/01/2012110TW A (TAXIWAY A) 11/01/2012 100.00AAC TAXIWAY P 0 303,843.25 0
11/01/2012125TW A (TAXIWAY A) 11/01/2012 100.00AAC TAXIWAY P 0 267,093.11 0
11/01/2012140TW A (TAXIWAY A) 11/01/2012 100.00AC TAXIWAY P 0 27,340.32 0
11/01/2012150TW A (TAXIWAY A) 11/01/2012 100.00AC TAXIWAY P 0 25,815.68 0
11/01/2012160TW A (TAXIWAY A) 11/01/2012 100.00AC TAXIWAY P 0 25,973.07 0
11/01/2012115TW A2 (TAXIWAY A2) 11/01/2012 100.00AAC TAXIWAY P 0 54,611.89 0
11/01/2012120TW A3 (TAXIWAY A3) 11/01/2012 100.00AAC TAXIWAY P 0 53,835.00 0
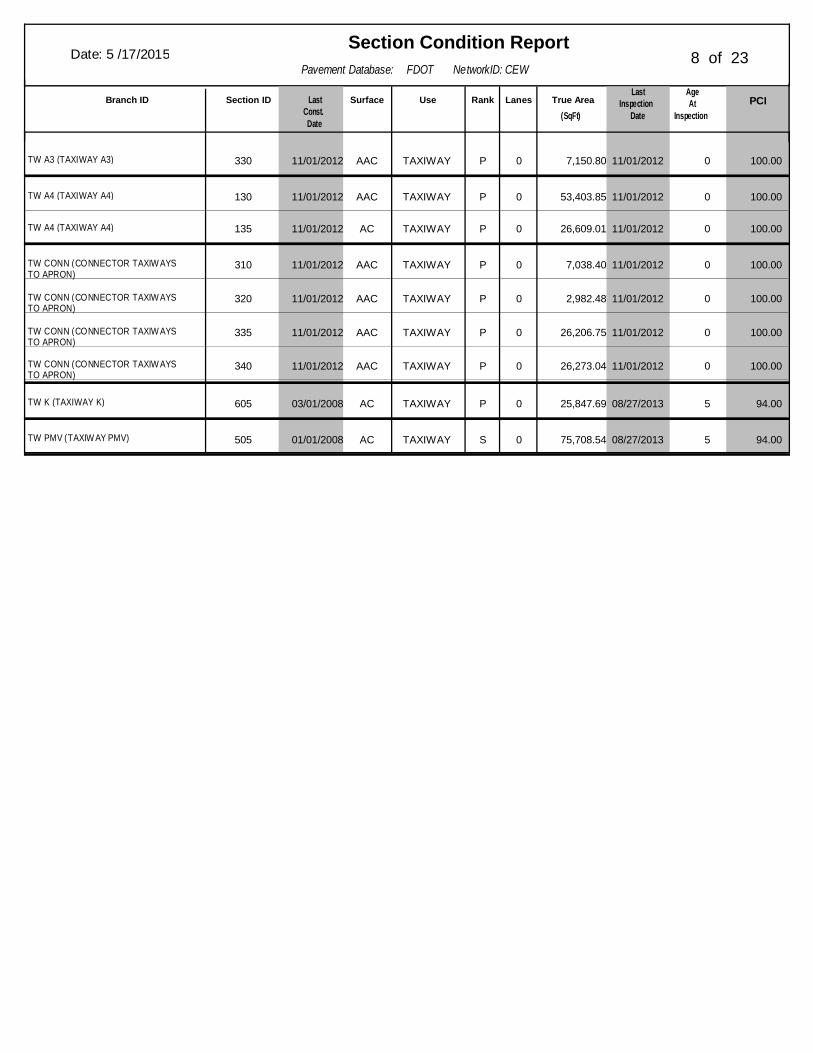
Pavement Database: FDOT NetworkID: CEW
Section Condition ReportDate: 5 /17/2015 8 of 23
AgeAt
Inspection
LastInspection
Date(SqFt)True AreaLanesRankUseSurfaceLast
Const.Date
Section IDBranch ID PCI
11/01/2012330TW A3 (TAXIWAY A3) 11/01/2012 100.00AAC TAXIWAY P 0 7,150.80 0
11/01/2012130TW A4 (TAXIWAY A4) 11/01/2012 100.00AAC TAXIWAY P 0 53,403.85 0
11/01/2012135TW A4 (TAXIWAY A4) 11/01/2012 100.00AC TAXIWAY P 0 26,609.01 0
11/01/2012310TW CONN (CONNECTOR TAXIW AYSTO APRON)
11/01/2012 100.00AAC TAXIWAY P 0 7,038.40 0
11/01/2012320TW CONN (CONNECTOR TAXIW AYSTO APRON)
11/01/2012 100.00AAC TAXIWAY P 0 2,982.48 0
11/01/2012335TW CONN (CONNECTOR TAXIW AYSTO APRON)
11/01/2012 100.00AAC TAXIWAY P 0 26,206.75 0
11/01/2012340TW CONN (CONNECTOR TAXIW AYSTO APRON)
11/01/2012 100.00AAC TAXIWAY P 0 26,273.04 0
03/01/2008605TW K (TAXIWAY K) 08/27/2013 94.00AC TAXIWAY P 0 25,847.69 5
01/01/2008505TW PMV (TAXIW AY PMV) 08/27/2013 94.00AC TAXIWAY S 0 75,708.54 5
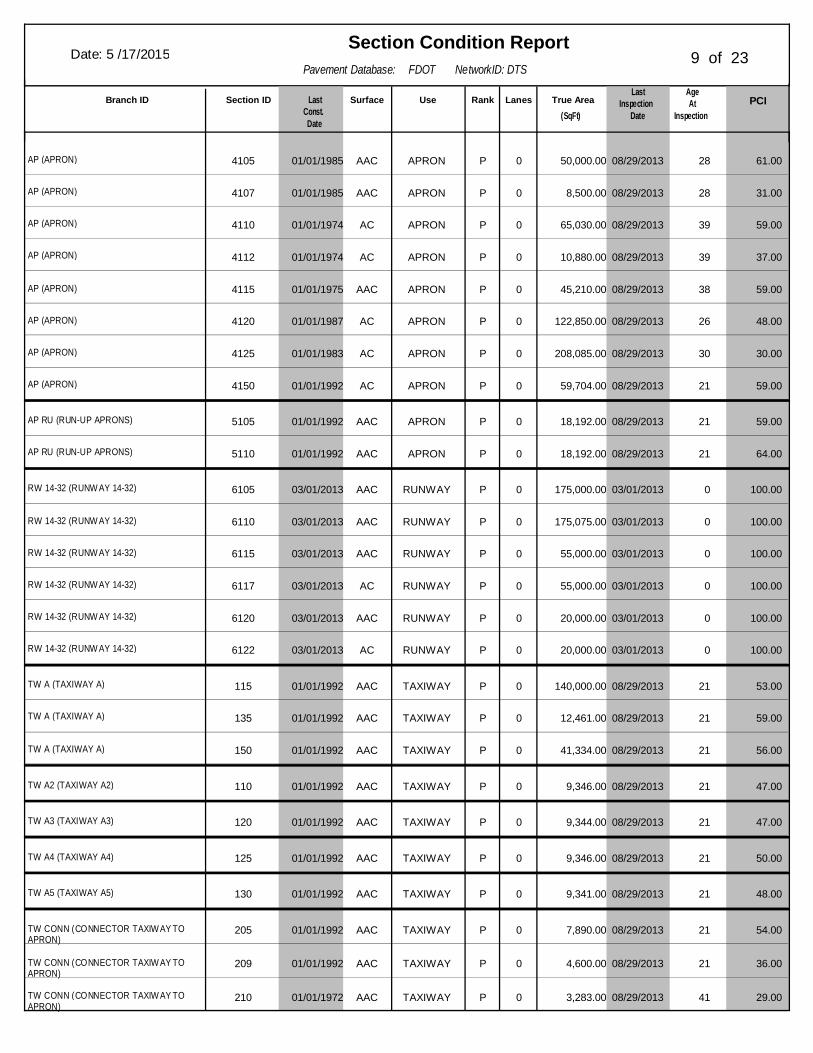
Pavement Database: FDOT NetworkID: DTS
Section Condition ReportDate: 5 /17/2015 9 of 23
AgeAt
Inspection
LastInspection
Date(SqFt)True AreaLanesRankUseSurfaceLast
Const.Date
Section IDBranch ID PCI
01/01/19854105AP (APRON) 08/29/2013 61.00AAC APRON P 0 50,000.00 28
01/01/19854107AP (APRON) 08/29/2013 31.00AAC APRON P 0 8,500.00 28
01/01/19744110AP (APRON) 08/29/2013 59.00AC APRON P 0 65,030.00 39
01/01/19744112AP (APRON) 08/29/2013 37.00AC APRON P 0 10,880.00 39
01/01/19754115AP (APRON) 08/29/2013 59.00AAC APRON P 0 45,210.00 38
01/01/19874120AP (APRON) 08/29/2013 48.00AC APRON P 0 122,850.00 26
01/01/19834125AP (APRON) 08/29/2013 30.00AC APRON P 0 208,085.00 30
01/01/19924150AP (APRON) 08/29/2013 59.00AC APRON P 0 59,704.00 21
01/01/19925105AP RU (RUN-UP APRONS) 08/29/2013 59.00AAC APRON P 0 18,192.00 21
01/01/19925110AP RU (RUN-UP APRONS) 08/29/2013 64.00AAC APRON P 0 18,192.00 21
03/01/20136105RW 14-32 (RUNW AY 14-32) 03/01/2013 100.00AAC RUNWAY P 0 175,000.00 0
03/01/20136110RW 14-32 (RUNW AY 14-32) 03/01/2013 100.00AAC RUNWAY P 0 175,075.00 0
03/01/20136115RW 14-32 (RUNW AY 14-32) 03/01/2013 100.00AAC RUNWAY P 0 55,000.00 0
03/01/20136117RW 14-32 (RUNW AY 14-32) 03/01/2013 100.00AC RUNWAY P 0 55,000.00 0
03/01/20136120RW 14-32 (RUNW AY 14-32) 03/01/2013 100.00AAC RUNWAY P 0 20,000.00 0
03/01/20136122RW 14-32 (RUNW AY 14-32) 03/01/2013 100.00AC RUNWAY P 0 20,000.00 0
01/01/1992115TW A (TAXIWAY A) 08/29/2013 53.00AAC TAXIWAY P 0 140,000.00 21
01/01/1992135TW A (TAXIWAY A) 08/29/2013 59.00AAC TAXIWAY P 0 12,461.00 21
01/01/1992150TW A (TAXIWAY A) 08/29/2013 56.00AAC TAXIWAY P 0 41,334.00 21
01/01/1992110TW A2 (TAXIWAY A2) 08/29/2013 47.00AAC TAXIWAY P 0 9,346.00 21
01/01/1992120TW A3 (TAXIWAY A3) 08/29/2013 47.00AAC TAXIWAY P 0 9,344.00 21
01/01/1992125TW A4 (TAXIWAY A4) 08/29/2013 50.00AAC TAXIWAY P 0 9,346.00 21
01/01/1992130TW A5 (TAXIWAY A5) 08/29/2013 48.00AAC TAXIWAY P 0 9,341.00 21
01/01/1992205TW CONN (CONNECTOR TAXIW AY TOAPRON)
08/29/2013 54.00AAC TAXIWAY P 0 7,890.00 21
01/01/1992209TW CONN (CONNECTOR TAXIW AY TOAPRON)
08/29/2013 36.00AAC TAXIWAY P 0 4,600.00 21
01/01/1972210TW CONN (CONNECTOR TAXIW AY TOAPRON)
08/29/2013 29.00AAC TAXIWAY P 0 3,283.00 41

Pavement Database: FDOT NetworkID: DTS
Section Condition ReportDate: 5 /17/2015 10 of 23
AgeAt
Inspection
LastInspection
Date(SqFt)True AreaLanesRankUseSurfaceLast
Const.Date
Section IDBranch ID PCI
01/01/1992212TW CONN (CONNECTOR TAXIW AY TOAPRON)
08/29/2013 49.00AAC TAXIWAY P 0 2,951.00 21
12/25/1999305TW HANG (TAXIW AY TO HANGARS) 08/29/2013 60.00AC TAXIWAY P 0 59,943.00 14
06/01/2011307TW HANG (TAXIW AY TO HANGARS) 06/01/2011 100.00AC TAXIWAY P 0 6,215.00 0
12/25/1999315TW HANG (TAXIW AY TO HANGARS) 08/29/2013 53.00AC TAXIWAY P 0 36,232.00 14
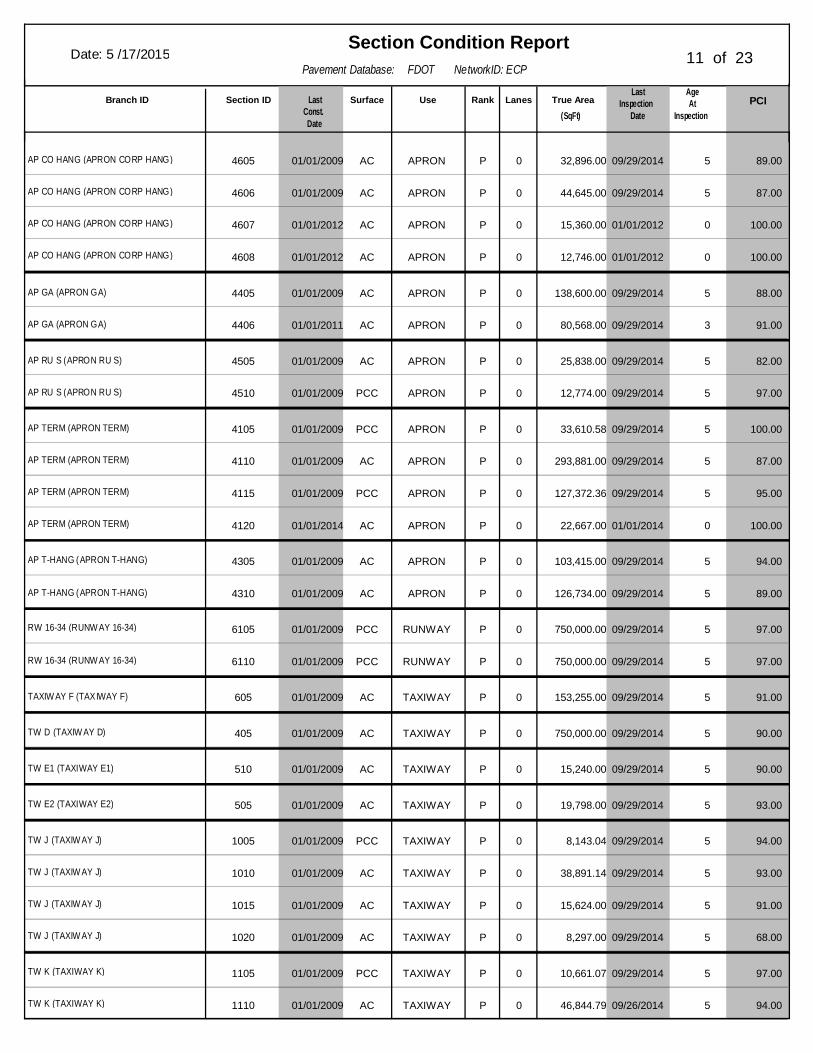
Pavement Database: FDOT NetworkID: ECP
Section Condition ReportDate: 5 /17/2015 11 of 23
AgeAt
Inspection
LastInspection
Date(SqFt)True AreaLanesRankUseSurfaceLast
Const.Date
Section IDBranch ID PCI
01/01/20094605AP CO HANG (APRON CORP HANG) 09/29/2014 89.00AC APRON P 0 32,896.00 5
01/01/20094606AP CO HANG (APRON CORP HANG) 09/29/2014 87.00AC APRON P 0 44,645.00 5
01/01/20124607AP CO HANG (APRON CORP HANG) 01/01/2012 100.00AC APRON P 0 15,360.00 0
01/01/20124608AP CO HANG (APRON CORP HANG) 01/01/2012 100.00AC APRON P 0 12,746.00 0
01/01/20094405AP GA (APRON GA) 09/29/2014 88.00AC APRON P 0 138,600.00 5
01/01/20114406AP GA (APRON GA) 09/29/2014 91.00AC APRON P 0 80,568.00 3
01/01/20094505AP RU S (APRON RU S) 09/29/2014 82.00AC APRON P 0 25,838.00 5
01/01/20094510AP RU S (APRON RU S) 09/29/2014 97.00PCC APRON P 0 12,774.00 5
01/01/20094105AP TERM (APRON TERM) 09/29/2014 100.00PCC APRON P 0 33,610.58 5
01/01/20094110AP TERM (APRON TERM) 09/29/2014 87.00AC APRON P 0 293,881.00 5
01/01/20094115AP TERM (APRON TERM) 09/29/2014 95.00PCC APRON P 0 127,372.36 5
01/01/20144120AP TERM (APRON TERM) 01/01/2014 100.00AC APRON P 0 22,667.00 0
01/01/20094305AP T-HANG (APRON T-HANG) 09/29/2014 94.00AC APRON P 0 103,415.00 5
01/01/20094310AP T-HANG (APRON T-HANG) 09/29/2014 89.00AC APRON P 0 126,734.00 5
01/01/20096105RW 16-34 (RUNW AY 16-34) 09/29/2014 97.00PCC RUNWAY P 0 750,000.00 5
01/01/20096110RW 16-34 (RUNW AY 16-34) 09/29/2014 97.00PCC RUNWAY P 0 750,000.00 5
01/01/2009605TAXIW AY F (TAXIWAY F) 09/29/2014 91.00AC TAXIWAY P 0 153,255.00 5
01/01/2009405TW D (TAXIW AY D) 09/29/2014 90.00AC TAXIWAY P 0 750,000.00 5
01/01/2009510TW E1 (TAXIWAY E1) 09/29/2014 90.00AC TAXIWAY P 0 15,240.00 5
01/01/2009505TW E2 (TAXIWAY E2) 09/29/2014 93.00AC TAXIWAY P 0 19,798.00 5
01/01/20091005TW J (TAXIW AY J) 09/29/2014 94.00PCC TAXIWAY P 0 8,143.04 5
01/01/20091010TW J (TAXIW AY J) 09/29/2014 93.00AC TAXIWAY P 0 38,891.14 5
01/01/20091015TW J (TAXIW AY J) 09/29/2014 91.00AC TAXIWAY P 0 15,624.00 5
01/01/20091020TW J (TAXIW AY J) 09/29/2014 68.00AC TAXIWAY P 0 8,297.00 5
01/01/20091105TW K (TAXIWAY K) 09/29/2014 97.00PCC TAXIWAY P 0 10,661.07 5
01/01/20091110TW K (TAXIWAY K) 09/26/2014 94.00AC TAXIWAY P 0 46,844.79 5
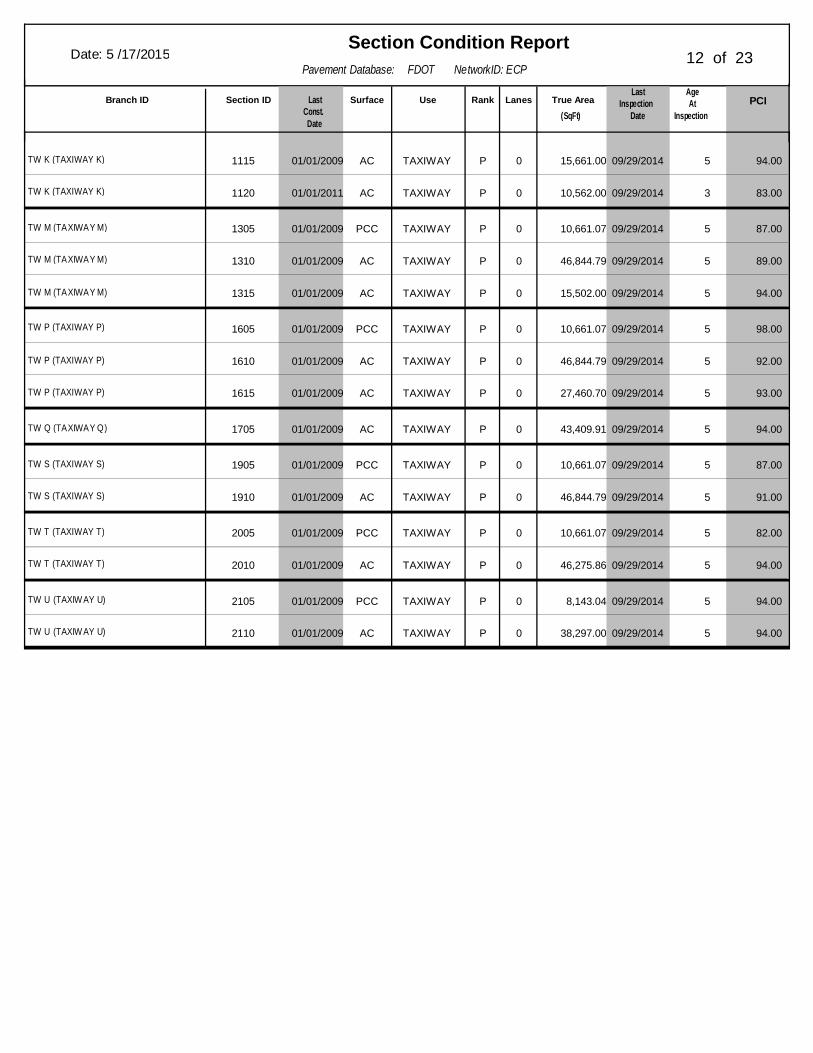
Pavement Database: FDOT NetworkID: ECP
Section Condition ReportDate: 5 /17/2015 12 of 23
AgeAt
Inspection
LastInspection
Date(SqFt)True AreaLanesRankUseSurfaceLast
Const.Date
Section IDBranch ID PCI
01/01/20091115TW K (TAXIWAY K) 09/29/2014 94.00AC TAXIWAY P 0 15,661.00 5
01/01/20111120TW K (TAXIWAY K) 09/29/2014 83.00AC TAXIWAY P 0 10,562.00 3
01/01/20091305TW M (TAXIWAY M) 09/29/2014 87.00PCC TAXIWAY P 0 10,661.07 5
01/01/20091310TW M (TAXIWAY M) 09/29/2014 89.00AC TAXIWAY P 0 46,844.79 5
01/01/20091315TW M (TAXIWAY M) 09/29/2014 94.00AC TAXIWAY P 0 15,502.00 5
01/01/20091605TW P (TAXIWAY P) 09/29/2014 98.00PCC TAXIWAY P 0 10,661.07 5
01/01/20091610TW P (TAXIWAY P) 09/29/2014 92.00AC TAXIWAY P 0 46,844.79 5
01/01/20091615TW P (TAXIWAY P) 09/29/2014 93.00AC TAXIWAY P 0 27,460.70 5
01/01/20091705TW Q (TAXIWAY Q) 09/29/2014 94.00AC TAXIWAY P 0 43,409.91 5
01/01/20091905TW S (TAXIWAY S) 09/29/2014 87.00PCC TAXIWAY P 0 10,661.07 5
01/01/20091910TW S (TAXIWAY S) 09/29/2014 91.00AC TAXIWAY P 0 46,844.79 5
01/01/20092005TW T (TAXIWAY T) 09/29/2014 82.00PCC TAXIWAY P 0 10,661.07 5
01/01/20092010TW T (TAXIWAY T) 09/29/2014 94.00AC TAXIWAY P 0 46,275.86 5
01/01/20092105TW U (TAXIW AY U) 09/29/2014 94.00PCC TAXIWAY P 0 8,143.04 5
01/01/20092110TW U (TAXIW AY U) 09/29/2014 94.00AC TAXIWAY P 0 38,297.00 5
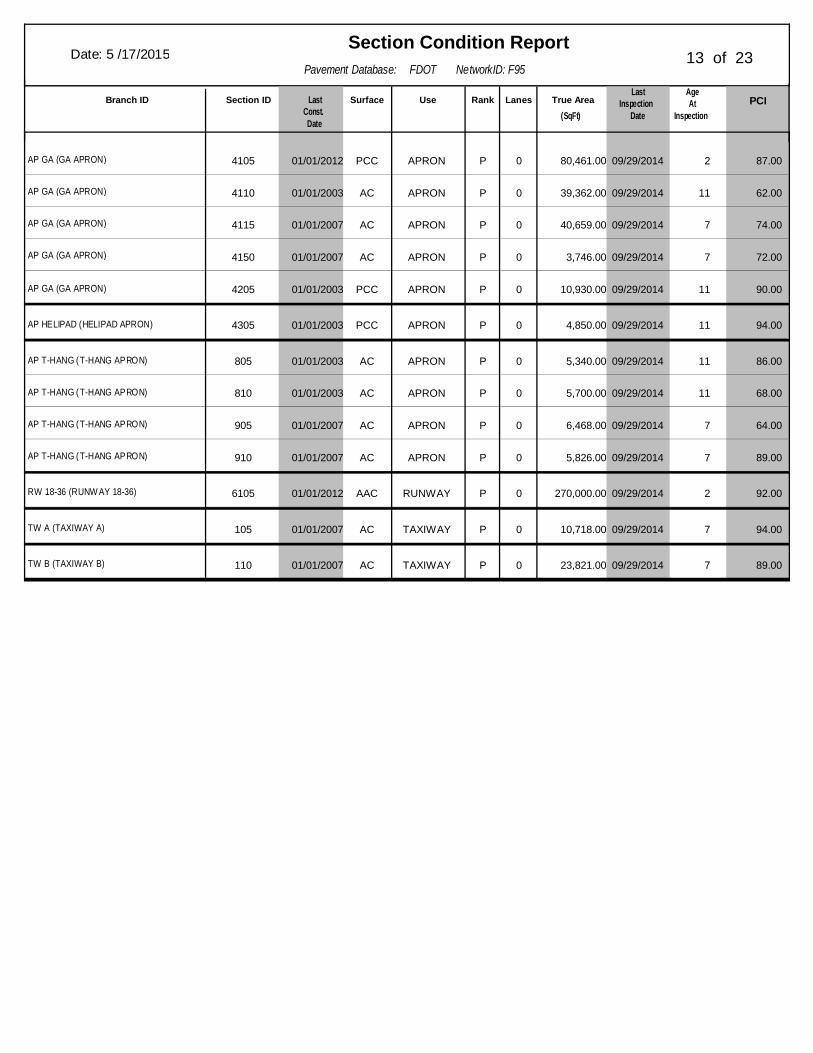
Pavement Database: FDOT NetworkID: F95
Section Condition ReportDate: 5 /17/2015 13 of 23
AgeAt
Inspection
LastInspection
Date(SqFt)True AreaLanesRankUseSurfaceLast
Const.Date
Section IDBranch ID PCI
01/01/20124105AP GA (GA APRON) 09/29/2014 87.00PCC APRON P 0 80,461.00 2
01/01/20034110AP GA (GA APRON) 09/29/2014 62.00AC APRON P 0 39,362.00 11
01/01/20074115AP GA (GA APRON) 09/29/2014 74.00AC APRON P 0 40,659.00 7
01/01/20074150AP GA (GA APRON) 09/29/2014 72.00AC APRON P 0 3,746.00 7
01/01/20034205AP GA (GA APRON) 09/29/2014 90.00PCC APRON P 0 10,930.00 11
01/01/20034305AP HELIPAD (HELIPAD APRON) 09/29/2014 94.00PCC APRON P 0 4,850.00 11
01/01/2003805AP T-HANG (T-HANG APRON) 09/29/2014 86.00AC APRON P 0 5,340.00 11
01/01/2003810AP T-HANG (T-HANG APRON) 09/29/2014 68.00AC APRON P 0 5,700.00 11
01/01/2007905AP T-HANG (T-HANG APRON) 09/29/2014 64.00AC APRON P 0 6,468.00 7
01/01/2007910AP T-HANG (T-HANG APRON) 09/29/2014 89.00AC APRON P 0 5,826.00 7
01/01/20126105RW 18-36 (RUNW AY 18-36) 09/29/2014 92.00AAC RUNWAY P 0 270,000.00 2
01/01/2007105TW A (TAXIWAY A) 09/29/2014 94.00AC TAXIWAY P 0 10,718.00 7
01/01/2007110TW B (TAXIWAY B) 09/29/2014 89.00AC TAXIWAY P 0 23,821.00 7
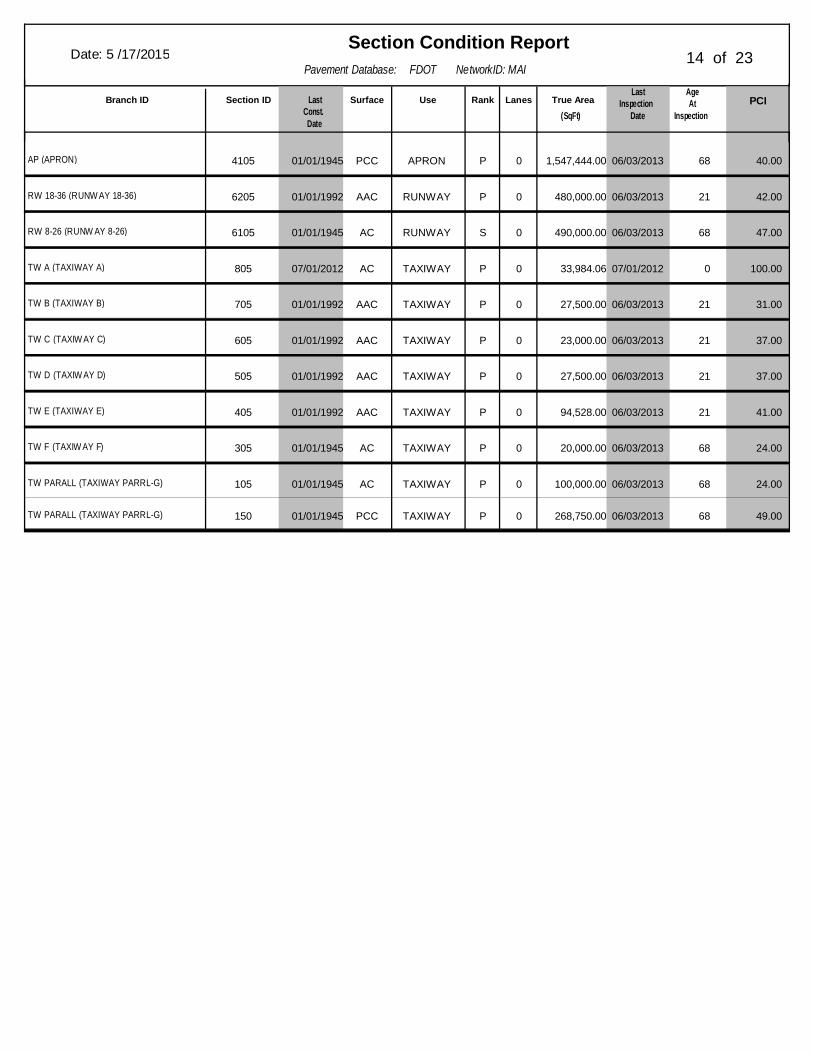
Pavement Database: FDOT NetworkID: MAI
Section Condition ReportDate: 5 /17/2015 14 of 23
AgeAt
Inspection
LastInspection
Date(SqFt)True AreaLanesRankUseSurfaceLast
Const.Date
Section IDBranch ID PCI
01/01/19454105AP (APRON) 06/03/2013 40.00PCC APRON P 0 1,547,444.00 68
01/01/19926205RW 18-36 (RUNW AY 18-36) 06/03/2013 42.00AAC RUNWAY P 0 480,000.00 21
01/01/19456105RW 8-26 (RUNW AY 8-26) 06/03/2013 47.00AC RUNWAY S 0 490,000.00 68
07/01/2012805TW A (TAXIWAY A) 07/01/2012 100.00AC TAXIWAY P 0 33,984.06 0
01/01/1992705TW B (TAXIWAY B) 06/03/2013 31.00AAC TAXIWAY P 0 27,500.00 21
01/01/1992605TW C (TAXIW AY C) 06/03/2013 37.00AAC TAXIWAY P 0 23,000.00 21
01/01/1992505TW D (TAXIW AY D) 06/03/2013 37.00AAC TAXIWAY P 0 27,500.00 21
01/01/1992405TW E (TAXIWAY E) 06/03/2013 41.00AAC TAXIWAY P 0 94,528.00 21
01/01/1945305TW F (TAXIW AY F) 06/03/2013 24.00AC TAXIWAY P 0 20,000.00 68
01/01/1945105TW PARALL (TAXIWAY PARRL-G) 06/03/2013 24.00AC TAXIWAY P 0 100,000.00 68
01/01/1945150TW PARALL (TAXIWAY PARRL-G) 06/03/2013 49.00PCC TAXIWAY P 0 268,750.00 68
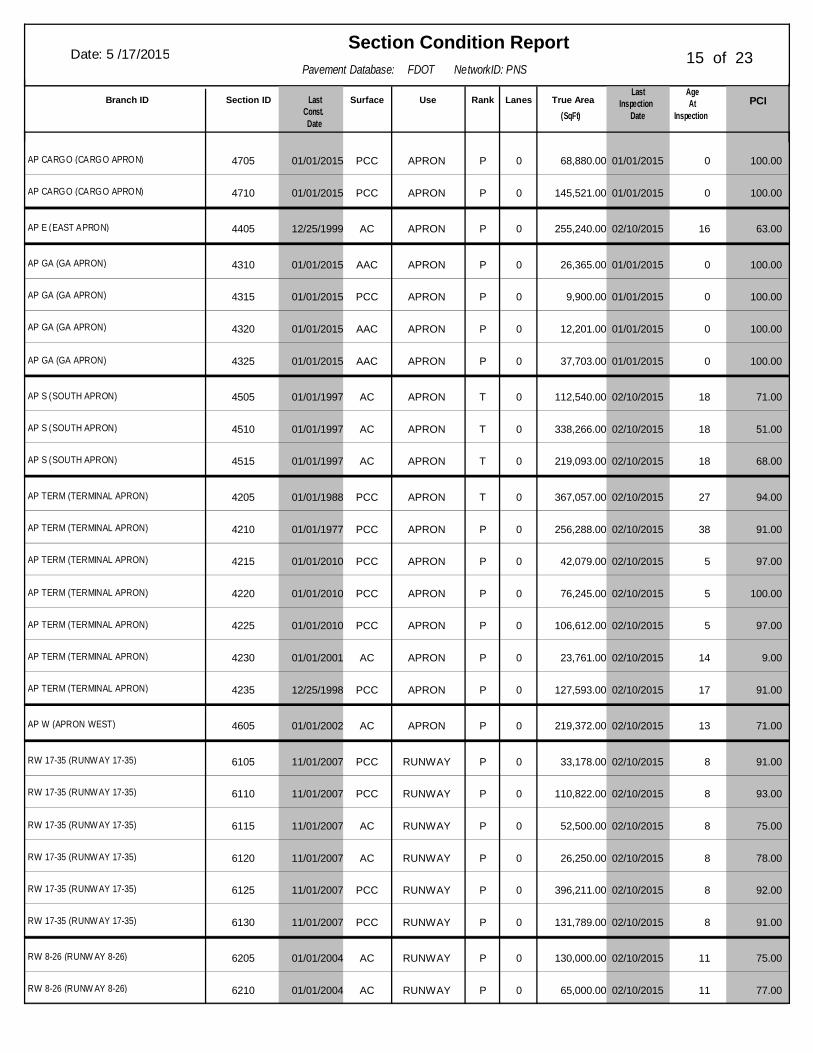
Pavement Database: FDOT NetworkID: PNS
Section Condition ReportDate: 5 /17/2015 15 of 23
AgeAt
Inspection
LastInspection
Date(SqFt)True AreaLanesRankUseSurfaceLast
Const.Date
Section IDBranch ID PCI
01/01/20154705AP CARGO (CARGO APRON) 01/01/2015 100.00PCC APRON P 0 68,880.00 0
01/01/20154710AP CARGO (CARGO APRON) 01/01/2015 100.00PCC APRON P 0 145,521.00 0
12/25/19994405AP E (EAST APRON) 02/10/2015 63.00AC APRON P 0 255,240.00 16
01/01/20154310AP GA (GA APRON) 01/01/2015 100.00AAC APRON P 0 26,365.00 0
01/01/20154315AP GA (GA APRON) 01/01/2015 100.00PCC APRON P 0 9,900.00 0
01/01/20154320AP GA (GA APRON) 01/01/2015 100.00AAC APRON P 0 12,201.00 0
01/01/20154325AP GA (GA APRON) 01/01/2015 100.00AAC APRON P 0 37,703.00 0
01/01/19974505AP S (SOUTH APRON) 02/10/2015 71.00AC APRON T 0 112,540.00 18
01/01/19974510AP S (SOUTH APRON) 02/10/2015 51.00AC APRON T 0 338,266.00 18
01/01/19974515AP S (SOUTH APRON) 02/10/2015 68.00AC APRON T 0 219,093.00 18
01/01/19884205AP TERM (TERMINAL APRON) 02/10/2015 94.00PCC APRON T 0 367,057.00 27
01/01/19774210AP TERM (TERMINAL APRON) 02/10/2015 91.00PCC APRON P 0 256,288.00 38
01/01/20104215AP TERM (TERMINAL APRON) 02/10/2015 97.00PCC APRON P 0 42,079.00 5
01/01/20104220AP TERM (TERMINAL APRON) 02/10/2015 100.00PCC APRON P 0 76,245.00 5
01/01/20104225AP TERM (TERMINAL APRON) 02/10/2015 97.00PCC APRON P 0 106,612.00 5
01/01/20014230AP TERM (TERMINAL APRON) 02/10/2015 9.00AC APRON P 0 23,761.00 14
12/25/19984235AP TERM (TERMINAL APRON) 02/10/2015 91.00PCC APRON P 0 127,593.00 17
01/01/20024605AP W (APRON WEST) 02/10/2015 71.00AC APRON P 0 219,372.00 13
11/01/20076105RW 17-35 (RUNW AY 17-35) 02/10/2015 91.00PCC RUNWAY P 0 33,178.00 8
11/01/20076110RW 17-35 (RUNW AY 17-35) 02/10/2015 93.00PCC RUNWAY P 0 110,822.00 8
11/01/20076115RW 17-35 (RUNW AY 17-35) 02/10/2015 75.00AC RUNWAY P 0 52,500.00 8
11/01/20076120RW 17-35 (RUNW AY 17-35) 02/10/2015 78.00AC RUNWAY P 0 26,250.00 8
11/01/20076125RW 17-35 (RUNW AY 17-35) 02/10/2015 92.00PCC RUNWAY P 0 396,211.00 8
11/01/20076130RW 17-35 (RUNW AY 17-35) 02/10/2015 91.00PCC RUNWAY P 0 131,789.00 8
01/01/20046205RW 8-26 (RUNW AY 8-26) 02/10/2015 75.00AC RUNWAY P 0 130,000.00 11
01/01/20046210RW 8-26 (RUNW AY 8-26) 02/10/2015 77.00AC RUNWAY P 0 65,000.00 11
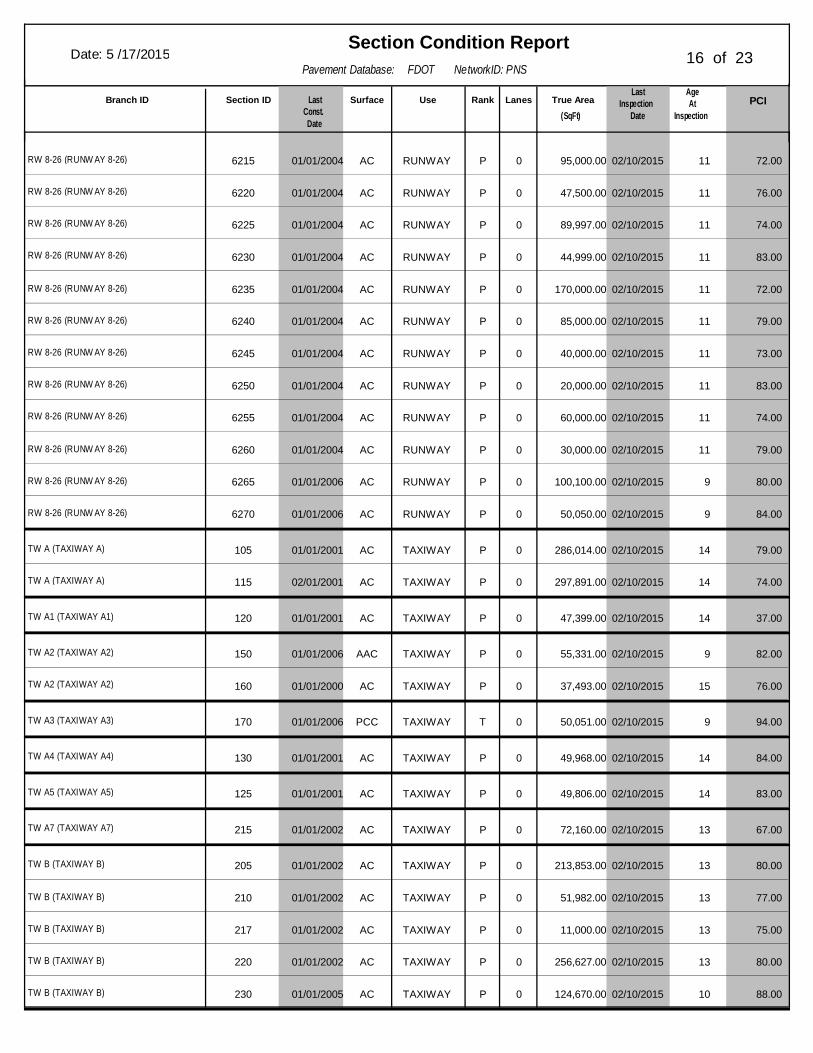
Pavement Database: FDOT NetworkID: PNS
Section Condition ReportDate: 5 /17/2015 16 of 23
AgeAt
Inspection
LastInspection
Date(SqFt)True AreaLanesRankUseSurfaceLast
Const.Date
Section IDBranch ID PCI
01/01/20046215RW 8-26 (RUNW AY 8-26) 02/10/2015 72.00AC RUNWAY P 0 95,000.00 11
01/01/20046220RW 8-26 (RUNW AY 8-26) 02/10/2015 76.00AC RUNWAY P 0 47,500.00 11
01/01/20046225RW 8-26 (RUNW AY 8-26) 02/10/2015 74.00AC RUNWAY P 0 89,997.00 11
01/01/20046230RW 8-26 (RUNW AY 8-26) 02/10/2015 83.00AC RUNWAY P 0 44,999.00 11
01/01/20046235RW 8-26 (RUNW AY 8-26) 02/10/2015 72.00AC RUNWAY P 0 170,000.00 11
01/01/20046240RW 8-26 (RUNW AY 8-26) 02/10/2015 79.00AC RUNWAY P 0 85,000.00 11
01/01/20046245RW 8-26 (RUNW AY 8-26) 02/10/2015 73.00AC RUNWAY P 0 40,000.00 11
01/01/20046250RW 8-26 (RUNW AY 8-26) 02/10/2015 83.00AC RUNWAY P 0 20,000.00 11
01/01/20046255RW 8-26 (RUNW AY 8-26) 02/10/2015 74.00AC RUNWAY P 0 60,000.00 11
01/01/20046260RW 8-26 (RUNW AY 8-26) 02/10/2015 79.00AC RUNWAY P 0 30,000.00 11
01/01/20066265RW 8-26 (RUNW AY 8-26) 02/10/2015 80.00AC RUNWAY P 0 100,100.00 9
01/01/20066270RW 8-26 (RUNW AY 8-26) 02/10/2015 84.00AC RUNWAY P 0 50,050.00 9
01/01/2001105TW A (TAXIWAY A) 02/10/2015 79.00AC TAXIWAY P 0 286,014.00 14
02/01/2001115TW A (TAXIWAY A) 02/10/2015 74.00AC TAXIWAY P 0 297,891.00 14
01/01/2001120TW A1 (TAXIWAY A1) 02/10/2015 37.00AC TAXIWAY P 0 47,399.00 14
01/01/2006150TW A2 (TAXIWAY A2) 02/10/2015 82.00AAC TAXIWAY P 0 55,331.00 9
01/01/2000160TW A2 (TAXIWAY A2) 02/10/2015 76.00AC TAXIWAY P 0 37,493.00 15
01/01/2006170TW A3 (TAXIWAY A3) 02/10/2015 94.00PCC TAXIWAY T 0 50,051.00 9
01/01/2001130TW A4 (TAXIWAY A4) 02/10/2015 84.00AC TAXIWAY P 0 49,968.00 14
01/01/2001125TW A5 (TAXIWAY A5) 02/10/2015 83.00AC TAXIWAY P 0 49,806.00 14
01/01/2002215TW A7 (TAXIWAY A7) 02/10/2015 67.00AC TAXIWAY P 0 72,160.00 13
01/01/2002205TW B (TAXIWAY B) 02/10/2015 80.00AC TAXIWAY P 0 213,853.00 13
01/01/2002210TW B (TAXIWAY B) 02/10/2015 77.00AC TAXIWAY P 0 51,982.00 13
01/01/2002217TW B (TAXIWAY B) 02/10/2015 75.00AC TAXIWAY P 0 11,000.00 13
01/01/2002220TW B (TAXIWAY B) 02/10/2015 80.00AC TAXIWAY P 0 256,627.00 13
01/01/2005230TW B (TAXIWAY B) 02/10/2015 88.00AC TAXIWAY P 0 124,670.00 10
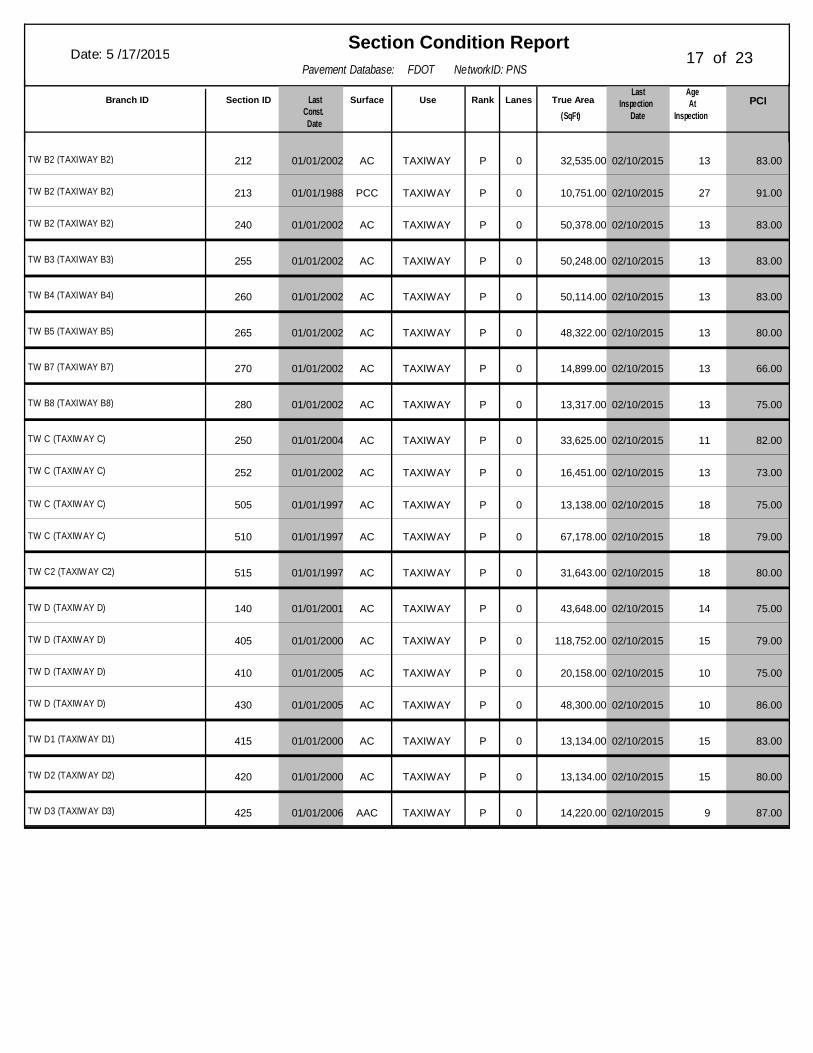
Pavement Database: FDOT NetworkID: PNS
Section Condition ReportDate: 5 /17/2015 17 of 23
AgeAt
Inspection
LastInspection
Date(SqFt)True AreaLanesRankUseSurfaceLast
Const.Date
Section IDBranch ID PCI
01/01/2002212TW B2 (TAXIWAY B2) 02/10/2015 83.00AC TAXIWAY P 0 32,535.00 13
01/01/1988213TW B2 (TAXIWAY B2) 02/10/2015 91.00PCC TAXIWAY P 0 10,751.00 27
01/01/2002240TW B2 (TAXIWAY B2) 02/10/2015 83.00AC TAXIWAY P 0 50,378.00 13
01/01/2002255TW B3 (TAXIWAY B3) 02/10/2015 83.00AC TAXIWAY P 0 50,248.00 13
01/01/2002260TW B4 (TAXIWAY B4) 02/10/2015 83.00AC TAXIWAY P 0 50,114.00 13
01/01/2002265TW B5 (TAXIWAY B5) 02/10/2015 80.00AC TAXIWAY P 0 48,322.00 13
01/01/2002270TW B7 (TAXIWAY B7) 02/10/2015 66.00AC TAXIWAY P 0 14,899.00 13
01/01/2002280TW B8 (TAXIWAY B8) 02/10/2015 75.00AC TAXIWAY P 0 13,317.00 13
01/01/2004250TW C (TAXIW AY C) 02/10/2015 82.00AC TAXIWAY P 0 33,625.00 11
01/01/2002252TW C (TAXIW AY C) 02/10/2015 73.00AC TAXIWAY P 0 16,451.00 13
01/01/1997505TW C (TAXIW AY C) 02/10/2015 75.00AC TAXIWAY P 0 13,138.00 18
01/01/1997510TW C (TAXIW AY C) 02/10/2015 79.00AC TAXIWAY P 0 67,178.00 18
01/01/1997515TW C2 (TAXIW AY C2) 02/10/2015 80.00AC TAXIWAY P 0 31,643.00 18
01/01/2001140TW D (TAXIW AY D) 02/10/2015 75.00AC TAXIWAY P 0 43,648.00 14
01/01/2000405TW D (TAXIW AY D) 02/10/2015 79.00AC TAXIWAY P 0 118,752.00 15
01/01/2005410TW D (TAXIW AY D) 02/10/2015 75.00AC TAXIWAY P 0 20,158.00 10
01/01/2005430TW D (TAXIW AY D) 02/10/2015 86.00AC TAXIWAY P 0 48,300.00 10
01/01/2000415TW D1 (TAXIW AY D1) 02/10/2015 83.00AC TAXIWAY P 0 13,134.00 15
01/01/2000420TW D2 (TAXIW AY D2) 02/10/2015 80.00AC TAXIWAY P 0 13,134.00 15
01/01/2006425TW D3 (TAXIW AY D3) 02/10/2015 87.00AAC TAXIWAY P 0 14,220.00 9
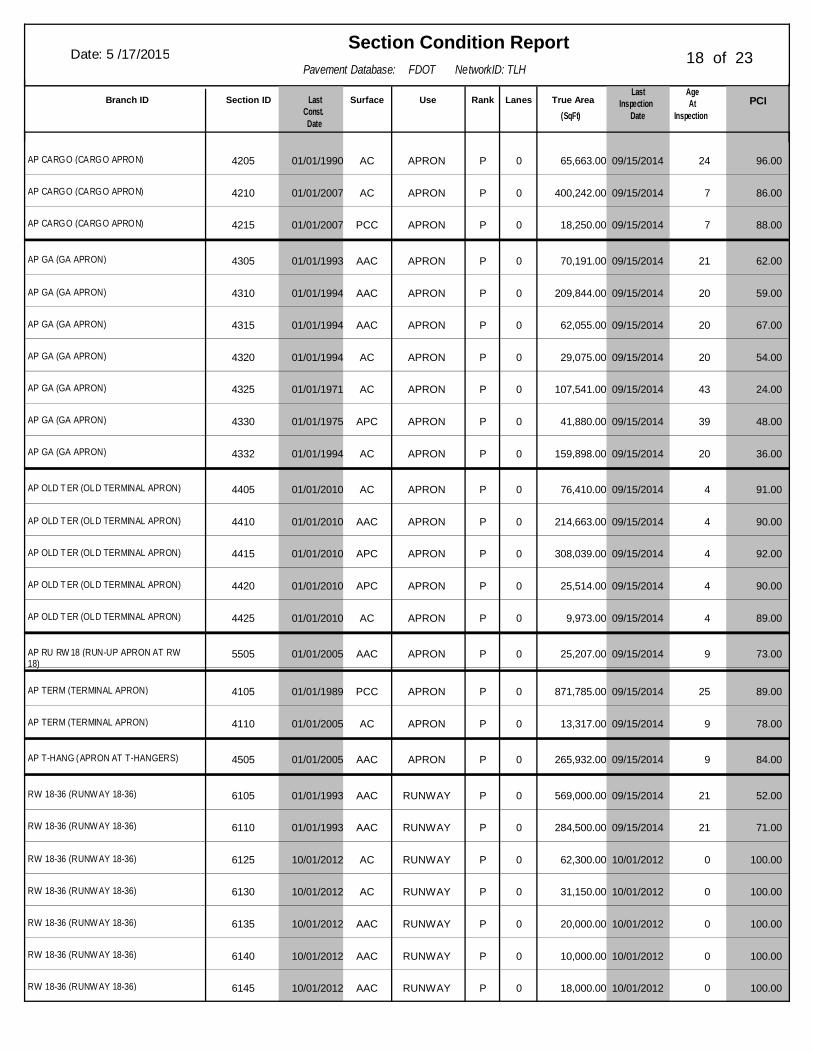
Pavement Database: FDOT NetworkID: TLH
Section Condition ReportDate: 5 /17/2015 18 of 23
AgeAt
Inspection
LastInspection
Date(SqFt)True AreaLanesRankUseSurfaceLast
Const.Date
Section IDBranch ID PCI
01/01/19904205AP CARGO (CARGO APRON) 09/15/2014 96.00AC APRON P 0 65,663.00 24
01/01/20074210AP CARGO (CARGO APRON) 09/15/2014 86.00AC APRON P 0 400,242.00 7
01/01/20074215AP CARGO (CARGO APRON) 09/15/2014 88.00PCC APRON P 0 18,250.00 7
01/01/19934305AP GA (GA APRON) 09/15/2014 62.00AAC APRON P 0 70,191.00 21
01/01/19944310AP GA (GA APRON) 09/15/2014 59.00AAC APRON P 0 209,844.00 20
01/01/19944315AP GA (GA APRON) 09/15/2014 67.00AAC APRON P 0 62,055.00 20
01/01/19944320AP GA (GA APRON) 09/15/2014 54.00AC APRON P 0 29,075.00 20
01/01/19714325AP GA (GA APRON) 09/15/2014 24.00AC APRON P 0 107,541.00 43
01/01/19754330AP GA (GA APRON) 09/15/2014 48.00APC APRON P 0 41,880.00 39
01/01/19944332AP GA (GA APRON) 09/15/2014 36.00AC APRON P 0 159,898.00 20
01/01/20104405AP OLD T ER (OLD TERMINAL APRON) 09/15/2014 91.00AC APRON P 0 76,410.00 4
01/01/20104410AP OLD T ER (OLD TERMINAL APRON) 09/15/2014 90.00AAC APRON P 0 214,663.00 4
01/01/20104415AP OLD T ER (OLD TERMINAL APRON) 09/15/2014 92.00APC APRON P 0 308,039.00 4
01/01/20104420AP OLD T ER (OLD TERMINAL APRON) 09/15/2014 90.00APC APRON P 0 25,514.00 4
01/01/20104425AP OLD T ER (OLD TERMINAL APRON) 09/15/2014 89.00AC APRON P 0 9,973.00 4
01/01/20055505AP RU RW 18 (RUN-UP APRON AT RW18)
09/15/2014 73.00AAC APRON P 0 25,207.00 9
01/01/19894105AP TERM (TERMINAL APRON) 09/15/2014 89.00PCC APRON P 0 871,785.00 25
01/01/20054110AP TERM (TERMINAL APRON) 09/15/2014 78.00AC APRON P 0 13,317.00 9
01/01/20054505AP T-HANG (APRON AT T-HANGERS) 09/15/2014 84.00AAC APRON P 0 265,932.00 9
01/01/19936105RW 18-36 (RUNW AY 18-36) 09/15/2014 52.00AAC RUNWAY P 0 569,000.00 21
01/01/19936110RW 18-36 (RUNW AY 18-36) 09/15/2014 71.00AAC RUNWAY P 0 284,500.00 21
10/01/20126125RW 18-36 (RUNW AY 18-36) 10/01/2012 100.00AC RUNWAY P 0 62,300.00 0
10/01/20126130RW 18-36 (RUNW AY 18-36) 10/01/2012 100.00AC RUNWAY P 0 31,150.00 0
10/01/20126135RW 18-36 (RUNW AY 18-36) 10/01/2012 100.00AAC RUNWAY P 0 20,000.00 0
10/01/20126140RW 18-36 (RUNW AY 18-36) 10/01/2012 100.00AAC RUNWAY P 0 10,000.00 0
10/01/20126145RW 18-36 (RUNW AY 18-36) 10/01/2012 100.00AAC RUNWAY P 0 18,000.00 0
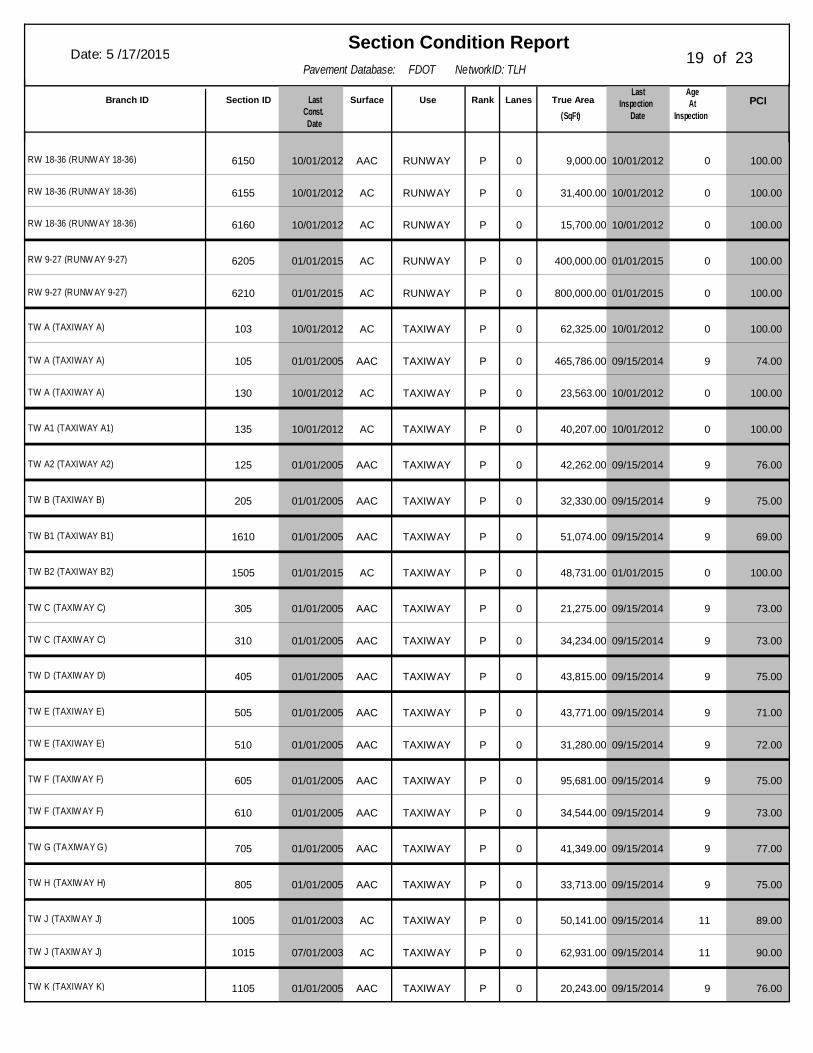
Pavement Database: FDOT NetworkID: TLH
Section Condition ReportDate: 5 /17/2015 19 of 23
AgeAt
Inspection
LastInspection
Date(SqFt)True AreaLanesRankUseSurfaceLast
Const.Date
Section IDBranch ID PCI
10/01/20126150RW 18-36 (RUNW AY 18-36) 10/01/2012 100.00AAC RUNWAY P 0 9,000.00 0
10/01/20126155RW 18-36 (RUNW AY 18-36) 10/01/2012 100.00AC RUNWAY P 0 31,400.00 0
10/01/20126160RW 18-36 (RUNW AY 18-36) 10/01/2012 100.00AC RUNWAY P 0 15,700.00 0
01/01/20156205RW 9-27 (RUNW AY 9-27) 01/01/2015 100.00AC RUNWAY P 0 400,000.00 0
01/01/20156210RW 9-27 (RUNW AY 9-27) 01/01/2015 100.00AC RUNWAY P 0 800,000.00 0
10/01/2012103TW A (TAXIWAY A) 10/01/2012 100.00AC TAXIWAY P 0 62,325.00 0
01/01/2005105TW A (TAXIWAY A) 09/15/2014 74.00AAC TAXIWAY P 0 465,786.00 9
10/01/2012130TW A (TAXIWAY A) 10/01/2012 100.00AC TAXIWAY P 0 23,563.00 0
10/01/2012135TW A1 (TAXIWAY A1) 10/01/2012 100.00AC TAXIWAY P 0 40,207.00 0
01/01/2005125TW A2 (TAXIWAY A2) 09/15/2014 76.00AAC TAXIWAY P 0 42,262.00 9
01/01/2005205TW B (TAXIWAY B) 09/15/2014 75.00AAC TAXIWAY P 0 32,330.00 9
01/01/20051610TW B1 (TAXIWAY B1) 09/15/2014 69.00AAC TAXIWAY P 0 51,074.00 9
01/01/20151505TW B2 (TAXIWAY B2) 01/01/2015 100.00AC TAXIWAY P 0 48,731.00 0
01/01/2005305TW C (TAXIW AY C) 09/15/2014 73.00AAC TAXIWAY P 0 21,275.00 9
01/01/2005310TW C (TAXIW AY C) 09/15/2014 73.00AAC TAXIWAY P 0 34,234.00 9
01/01/2005405TW D (TAXIW AY D) 09/15/2014 75.00AAC TAXIWAY P 0 43,815.00 9
01/01/2005505TW E (TAXIWAY E) 09/15/2014 71.00AAC TAXIWAY P 0 43,771.00 9
01/01/2005510TW E (TAXIWAY E) 09/15/2014 72.00AAC TAXIWAY P 0 31,280.00 9
01/01/2005605TW F (TAXIW AY F) 09/15/2014 75.00AAC TAXIWAY P 0 95,681.00 9
01/01/2005610TW F (TAXIW AY F) 09/15/2014 73.00AAC TAXIWAY P 0 34,544.00 9
01/01/2005705TW G (TAXIWAY G) 09/15/2014 77.00AAC TAXIWAY P 0 41,349.00 9
01/01/2005805TW H (TAXIW AY H) 09/15/2014 75.00AAC TAXIWAY P 0 33,713.00 9
01/01/20031005TW J (TAXIW AY J) 09/15/2014 89.00AC TAXIWAY P 0 50,141.00 11
07/01/20031015TW J (TAXIW AY J) 09/15/2014 90.00AC TAXIWAY P 0 62,931.00 11
01/01/20051105TW K (TAXIWAY K) 09/15/2014 76.00AAC TAXIWAY P 0 20,243.00 9
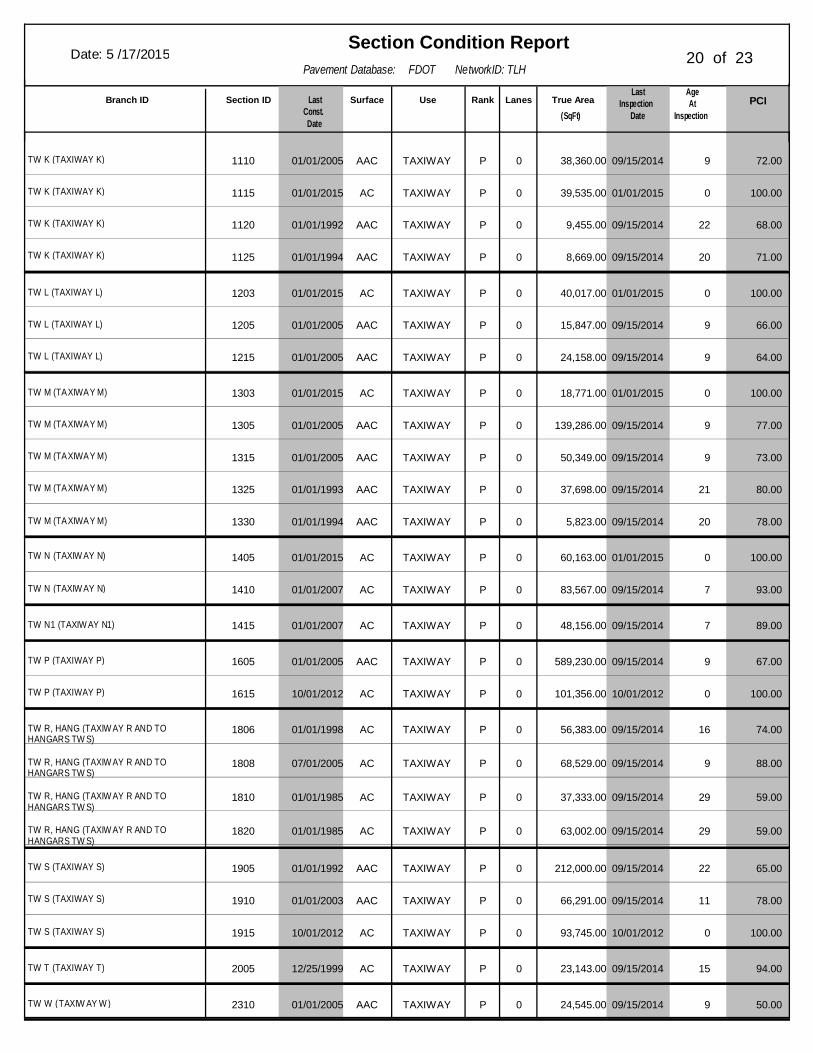
Pavement Database: FDOT NetworkID: TLH
Section Condition ReportDate: 5 /17/2015 20 of 23
AgeAt
Inspection
LastInspection
Date(SqFt)True AreaLanesRankUseSurfaceLast
Const.Date
Section IDBranch ID PCI
01/01/20051110TW K (TAXIWAY K) 09/15/2014 72.00AAC TAXIWAY P 0 38,360.00 9
01/01/20151115TW K (TAXIWAY K) 01/01/2015 100.00AC TAXIWAY P 0 39,535.00 0
01/01/19921120TW K (TAXIWAY K) 09/15/2014 68.00AAC TAXIWAY P 0 9,455.00 22
01/01/19941125TW K (TAXIWAY K) 09/15/2014 71.00AAC TAXIWAY P 0 8,669.00 20
01/01/20151203TW L (TAXIWAY L) 01/01/2015 100.00AC TAXIWAY P 0 40,017.00 0
01/01/20051205TW L (TAXIWAY L) 09/15/2014 66.00AAC TAXIWAY P 0 15,847.00 9
01/01/20051215TW L (TAXIWAY L) 09/15/2014 64.00AAC TAXIWAY P 0 24,158.00 9
01/01/20151303TW M (TAXIWAY M) 01/01/2015 100.00AC TAXIWAY P 0 18,771.00 0
01/01/20051305TW M (TAXIWAY M) 09/15/2014 77.00AAC TAXIWAY P 0 139,286.00 9
01/01/20051315TW M (TAXIWAY M) 09/15/2014 73.00AAC TAXIWAY P 0 50,349.00 9
01/01/19931325TW M (TAXIWAY M) 09/15/2014 80.00AAC TAXIWAY P 0 37,698.00 21
01/01/19941330TW M (TAXIWAY M) 09/15/2014 78.00AAC TAXIWAY P 0 5,823.00 20
01/01/20151405TW N (TAXIW AY N) 01/01/2015 100.00AC TAXIWAY P 0 60,163.00 0
01/01/20071410TW N (TAXIW AY N) 09/15/2014 93.00AC TAXIWAY P 0 83,567.00 7
01/01/20071415TW N1 (TAXIW AY N1) 09/15/2014 89.00AC TAXIWAY P 0 48,156.00 7
01/01/20051605TW P (TAXIWAY P) 09/15/2014 67.00AAC TAXIWAY P 0 589,230.00 9
10/01/20121615TW P (TAXIWAY P) 10/01/2012 100.00AC TAXIWAY P 0 101,356.00 0
01/01/19981806TW R, HANG (TAXIW AY R AND TOHANGARS TW S)
09/15/2014 74.00AC TAXIWAY P 0 56,383.00 16
07/01/20051808TW R, HANG (TAXIW AY R AND TOHANGARS TW S)
09/15/2014 88.00AC TAXIWAY P 0 68,529.00 9
01/01/19851810TW R, HANG (TAXIW AY R AND TOHANGARS TW S)
09/15/2014 59.00AC TAXIWAY P 0 37,333.00 29
01/01/19851820TW R, HANG (TAXIW AY R AND TOHANGARS TW S)
09/15/2014 59.00AC TAXIWAY P 0 63,002.00 29
01/01/19921905TW S (TAXIWAY S) 09/15/2014 65.00AAC TAXIWAY P 0 212,000.00 22
01/01/20031910TW S (TAXIWAY S) 09/15/2014 78.00AAC TAXIWAY P 0 66,291.00 11
10/01/20121915TW S (TAXIWAY S) 10/01/2012 100.00AC TAXIWAY P 0 93,745.00 0
12/25/19992005TW T (TAXIWAY T) 09/15/2014 94.00AC TAXIWAY P 0 23,143.00 15
01/01/20052310TW W (TAXIW AY W ) 09/15/2014 50.00AAC TAXIWAY P 0 24,545.00 9
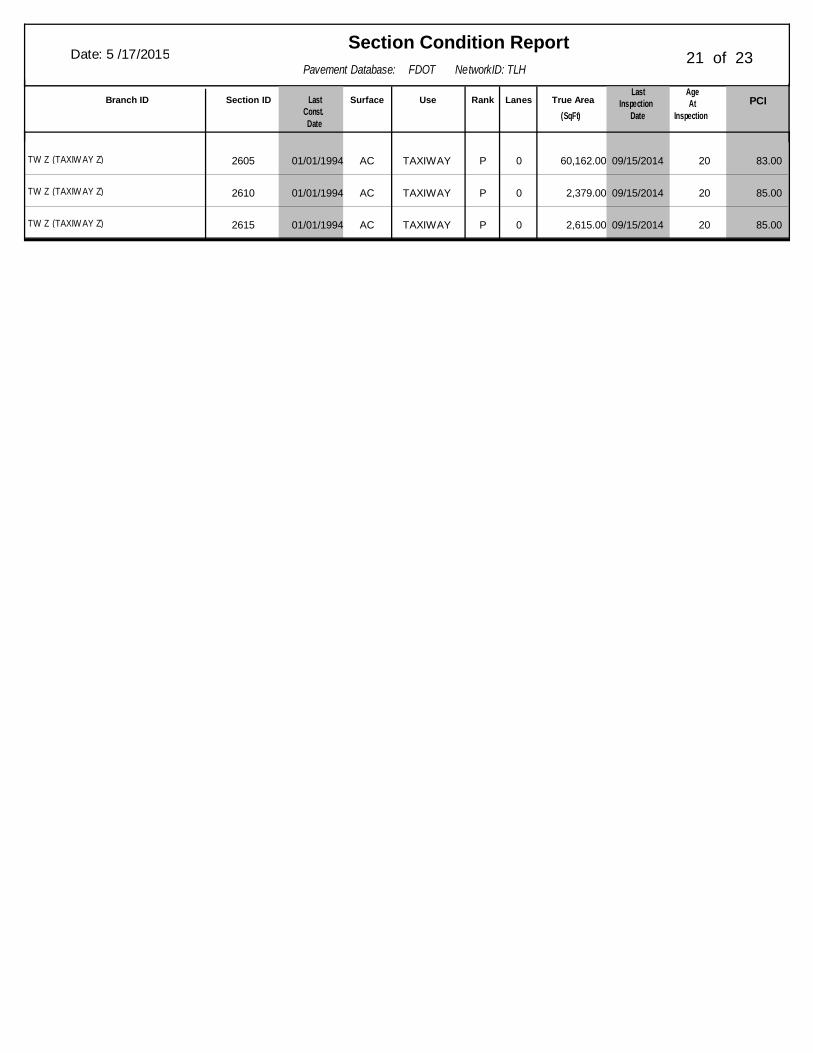
Pavement Database: FDOT NetworkID: TLH
Section Condition ReportDate: 5 /17/2015 21 of 23
AgeAt
Inspection
LastInspection
Date(SqFt)True AreaLanesRankUseSurfaceLast
Const.Date
Section IDBranch ID PCI
01/01/19942605TW Z (TAXIW AY Z) 09/15/2014 83.00AC TAXIWAY P 0 60,162.00 20
01/01/19942610TW Z (TAXIW AY Z) 09/15/2014 85.00AC TAXIWAY P 0 2,379.00 20
01/01/19942615TW Z (TAXIW AY Z) 09/15/2014 85.00AC TAXIWAY P 0 2,615.00 20
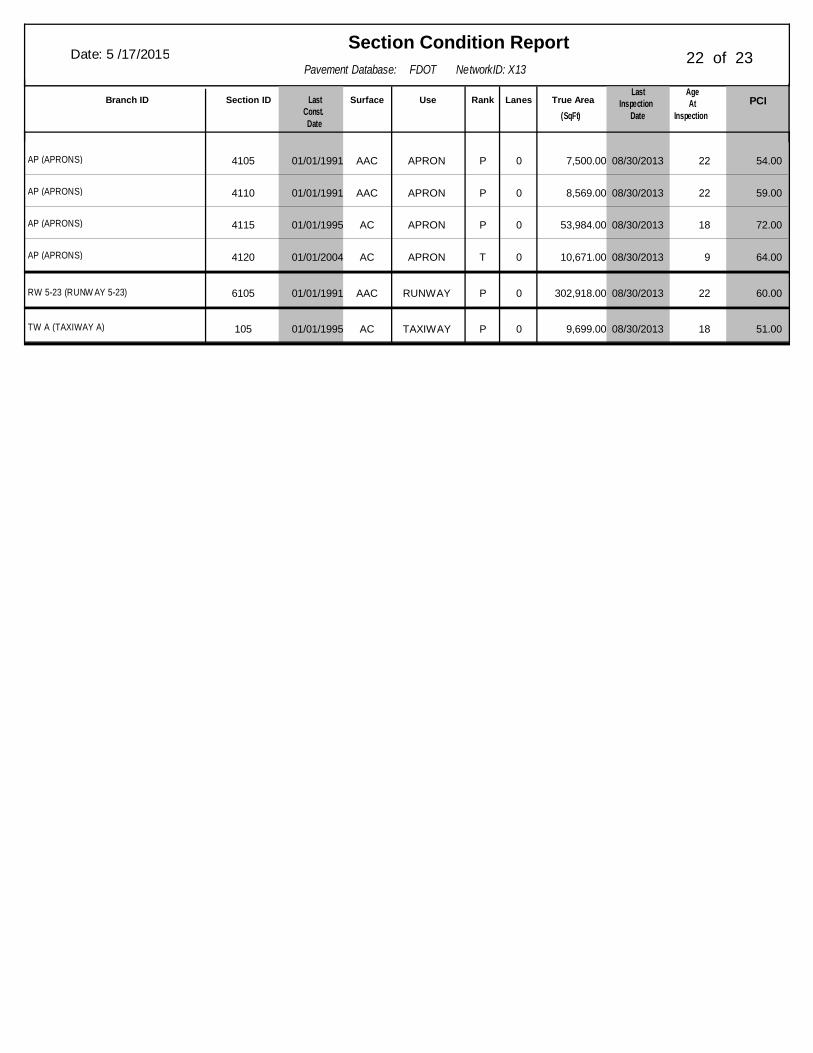
Pavement Database: FDOT NetworkID: X13
Section Condition ReportDate: 5 /17/2015 22 of 23
AgeAt
Inspection
LastInspection
Date(SqFt)True AreaLanesRankUseSurfaceLast
Const.Date
Section IDBranch ID PCI
01/01/19914105AP (APRONS) 08/30/2013 54.00AAC APRON P 0 7,500.00 22
01/01/19914110AP (APRONS) 08/30/2013 59.00AAC APRON P 0 8,569.00 22
01/01/19954115AP (APRONS) 08/30/2013 72.00AC APRON P 0 53,984.00 18
01/01/20044120AP (APRONS) 08/30/2013 64.00AC APRON T 0 10,671.00 9
01/01/19916105RW 5-23 (RUNW AY 5-23) 08/30/2013 60.00AAC RUNWAY P 0 302,918.00 22
01/01/1995105TW A (TAXIWAY A) 08/30/2013 51.00AC TAXIWAY P 0 9,699.00 18
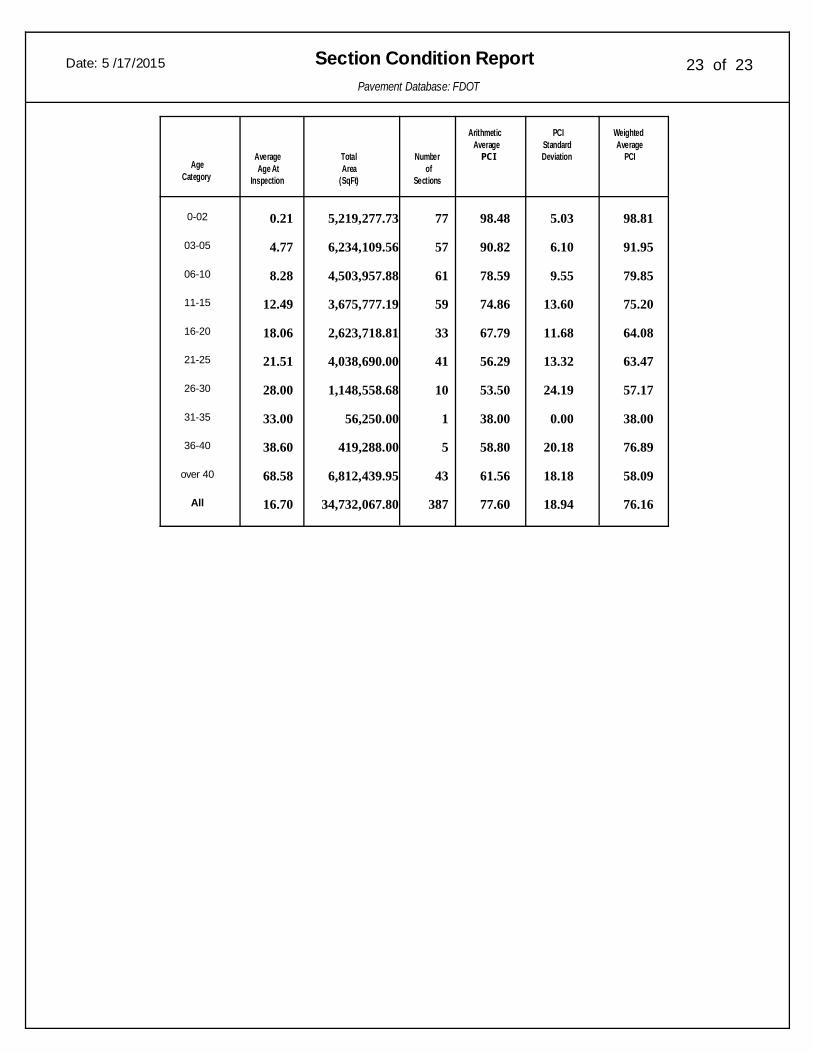
Date: 5 /17/2015 Section Condition ReportPavement Database: FDOT
23 of 23
PCIStandardDeviation
98.48
90.82
78.59
74.86
67.79
56.29
53.50
38.00
58.80
61.56
77.60
98.81
91.95
79.85
75.20
64.08
63.47
57.17
38.00
76.89
58.09
76.16
77
57
61
59
33
41
10
1
5
43
387
5,219,277.73
6,234,109.56
4,503,957.88
3,675,777.19
2,623,718.81
4,038,690.00
1,148,558.68
56,250.00
419,288.00
6,812,439.95
34,732,067.80
AverageAge At
Inspection
Numberof
Sections
0.21
4.77
8.28
12.49
18.06
21.51
28.00
33.00
38.60
68.58
16.70All
over 40
36-40
31-35
26-30
21-25
16-20
11-15
06-10
03-05
0-02
TotalArea
(SqFt)Age
Category
ArithmeticAverage
PCI
WeightedAverage
PCI
5.03
6.10
9.55
13.60
11.68
13.32
24.19
0.00
20.18
18.18
18.94


APPENDIX C� DISTRICT AIRFIELD PAVEMENT CONDITION INDEX
RATING EXHIBITS

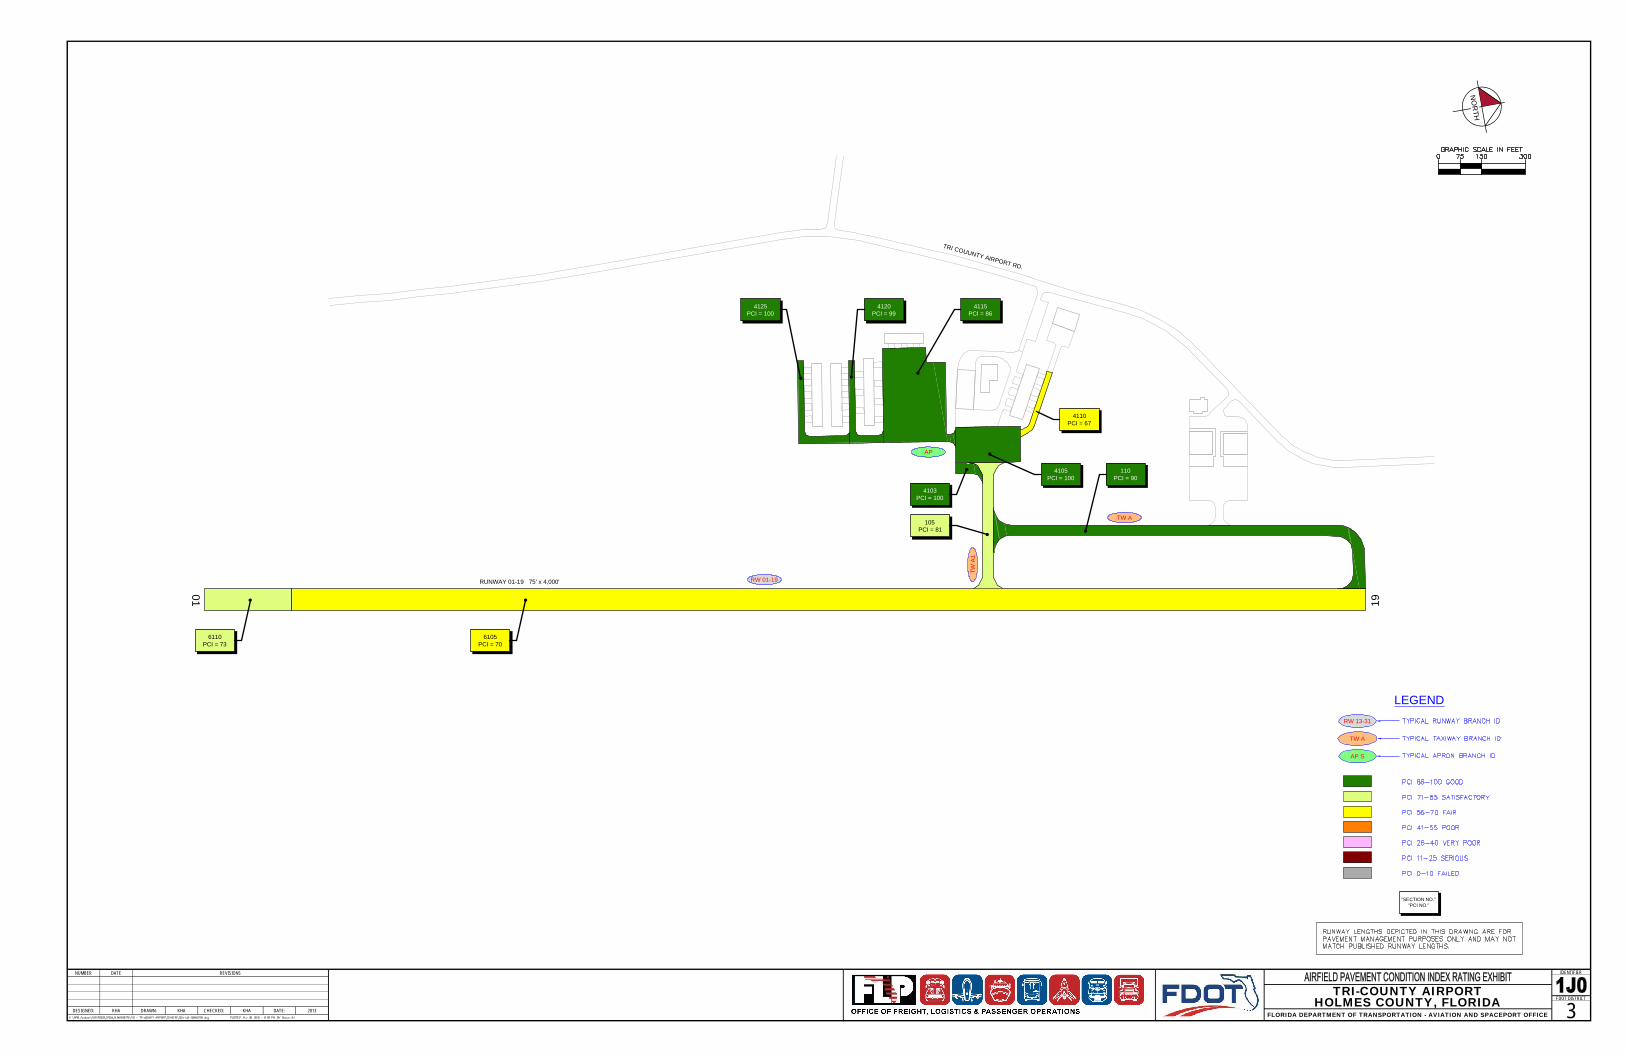
RW 01-19RUNWAY 01-19 75' x 4,000'
TW A
TWA1
AP
19
01
TRI COUUNTY AIRPORT RD.
NUMBER DATE REVISIONS
DESIGNED: DRAWN: CHECKED: DATE:
IDENTIFIER
FDOT DISTRICT
NO
RTH
TRI-COUNTY AIRPORTHOLMES COUNTY, FLORIDA
FLORIDA DEPARTMENT OF TRANSPORTATION - AVIATION AND SPACEPORT OFFICE 3KHA KHA KHA 2013
LEGEND
TW A
AP S
RW 13-31
"SECTION NO.""PCI NO."
110PCI = 90
4105PCI = 100
4115PCI = 86
4120PCI = 99
4125PCI = 100
4103PCI = 100
105PCI = 81
6110PCI = 73
6105PCI = 70
4110PCI = 67

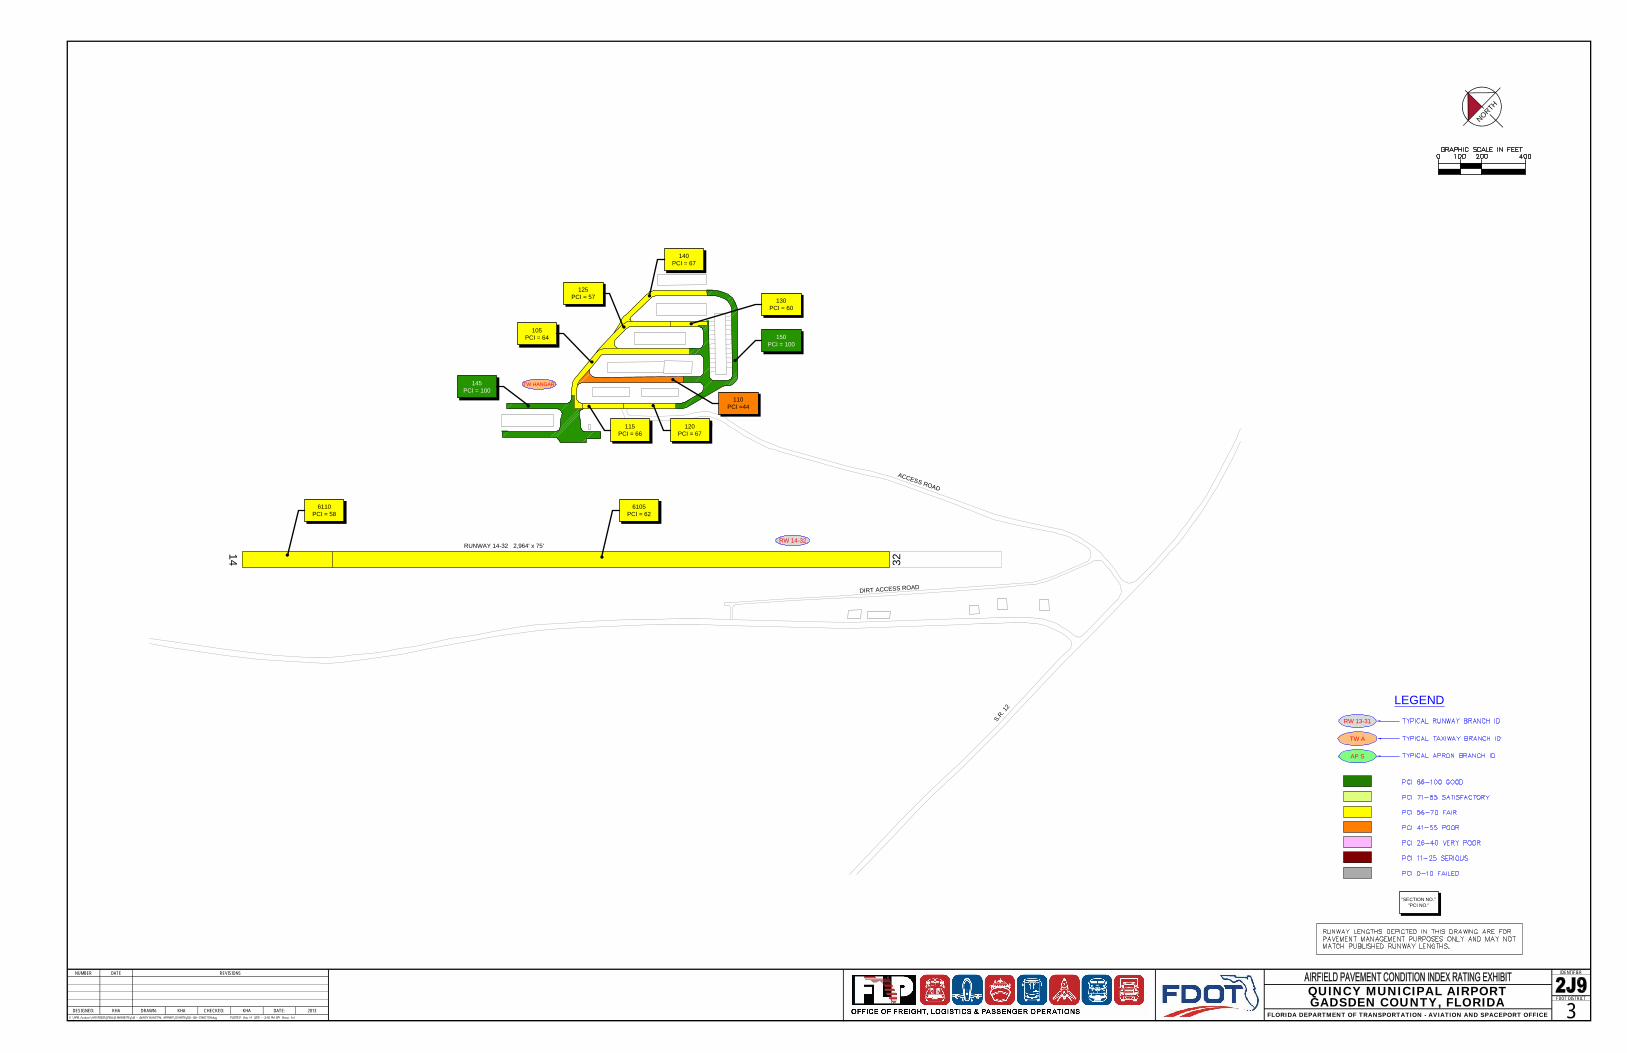
RW 14-32
TW HANGAR
RUNWAY 14-32 2,964' x 75'
DIRT ACCESS ROAD
ACCESS ROAD
S.R. 1
2
14 32
NUMBER DATE REVISIONS
DESIGNED: DRAWN: CHECKED: DATE:
IDENTIFIER
FDOT DISTRICT
NORTH
QUINCY MUNICIPAL AIRPORTGADSDEN COUNTY, FLORIDA
FLORIDA DEPARTMENT OF TRANSPORTATION - AVIATION AND SPACEPORT OFFICE 3KHA KHA KHA 2013
LEGEND
TW A
AP S
RW 13-31
"SECTION NO.""PCI NO."
6110PCI = 58
6105PCI = 62
105PCI = 64
115PCI = 66
120PCI = 67
125PCI = 57 130
PCI = 60
140PCI = 67
145PCI = 100
150PCI = 100
110PCI =44

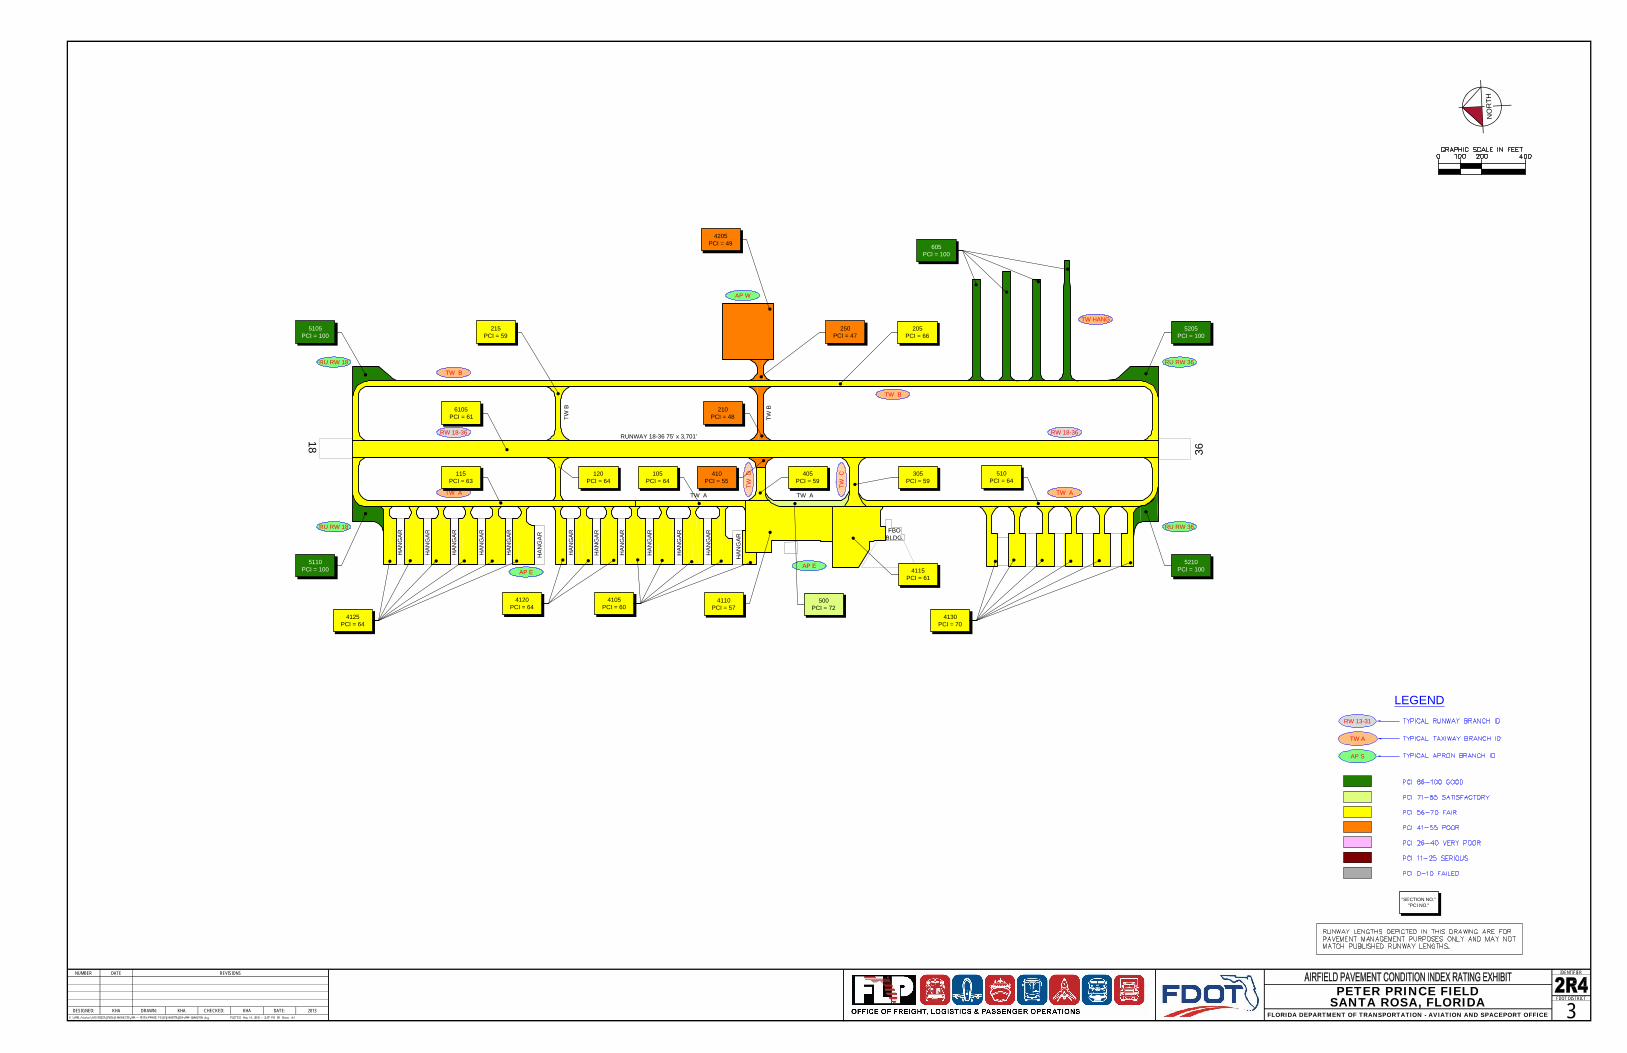
18
36
RUNWAY 18-36 75' x 3,701'
TW A
HA
NG
AR
HA
NG
AR
HA
NG
AR
HA
NG
AR
HA
NG
AR
HA
NG
AR
HA
NG
AR
HA
NG
AR
HA
NG
AR
HA
NG
AR
HA
NG
AR
HA
NG
AR
HA
NG
AR
TW A
FBOBLDG.
TW A
RW 18-36
TW B
TW A
RW 18-36
TW B
TWC
TWD
RU RW 18
RU RW 18
RU RW 36
RU RW 36
AP W
AP EAP E
TWB
TWB
TW HANG
NUMBER DATE REVISIONS
DESIGNED: DRAWN: CHECKED: DATE:
IDENTIFIER
FDOT DISTRICT
NO
RTH
PETER PRINCE FIELDSANTA ROSA, FLORIDA
FLORIDA DEPARTMENT OF TRANSPORTATION - AVIATION AND SPACEPORT OFFICE 3KHA KHA KHA 2013
LEGEND
TW A
AP S
RW 13-31
"SECTION NO.""PCI NO."
5210PCI = 100
5205PCI = 100
605PCI = 100
5105PCI = 100
5110PCI = 100
500PCI = 72
4130PCI = 70
205PCI = 66
305PCI = 59
510PCI = 64
4115PCI = 61
4110PCI = 57
4105PCI = 60
4120PCI = 64
4125PCI = 64
215PCI = 59
105PCI = 64
115PCI = 63
120PCI = 64
405PCI = 59
6105PCI = 61
4205PCI = 49
250PCI = 47
210PCI = 48
410PCI = 55

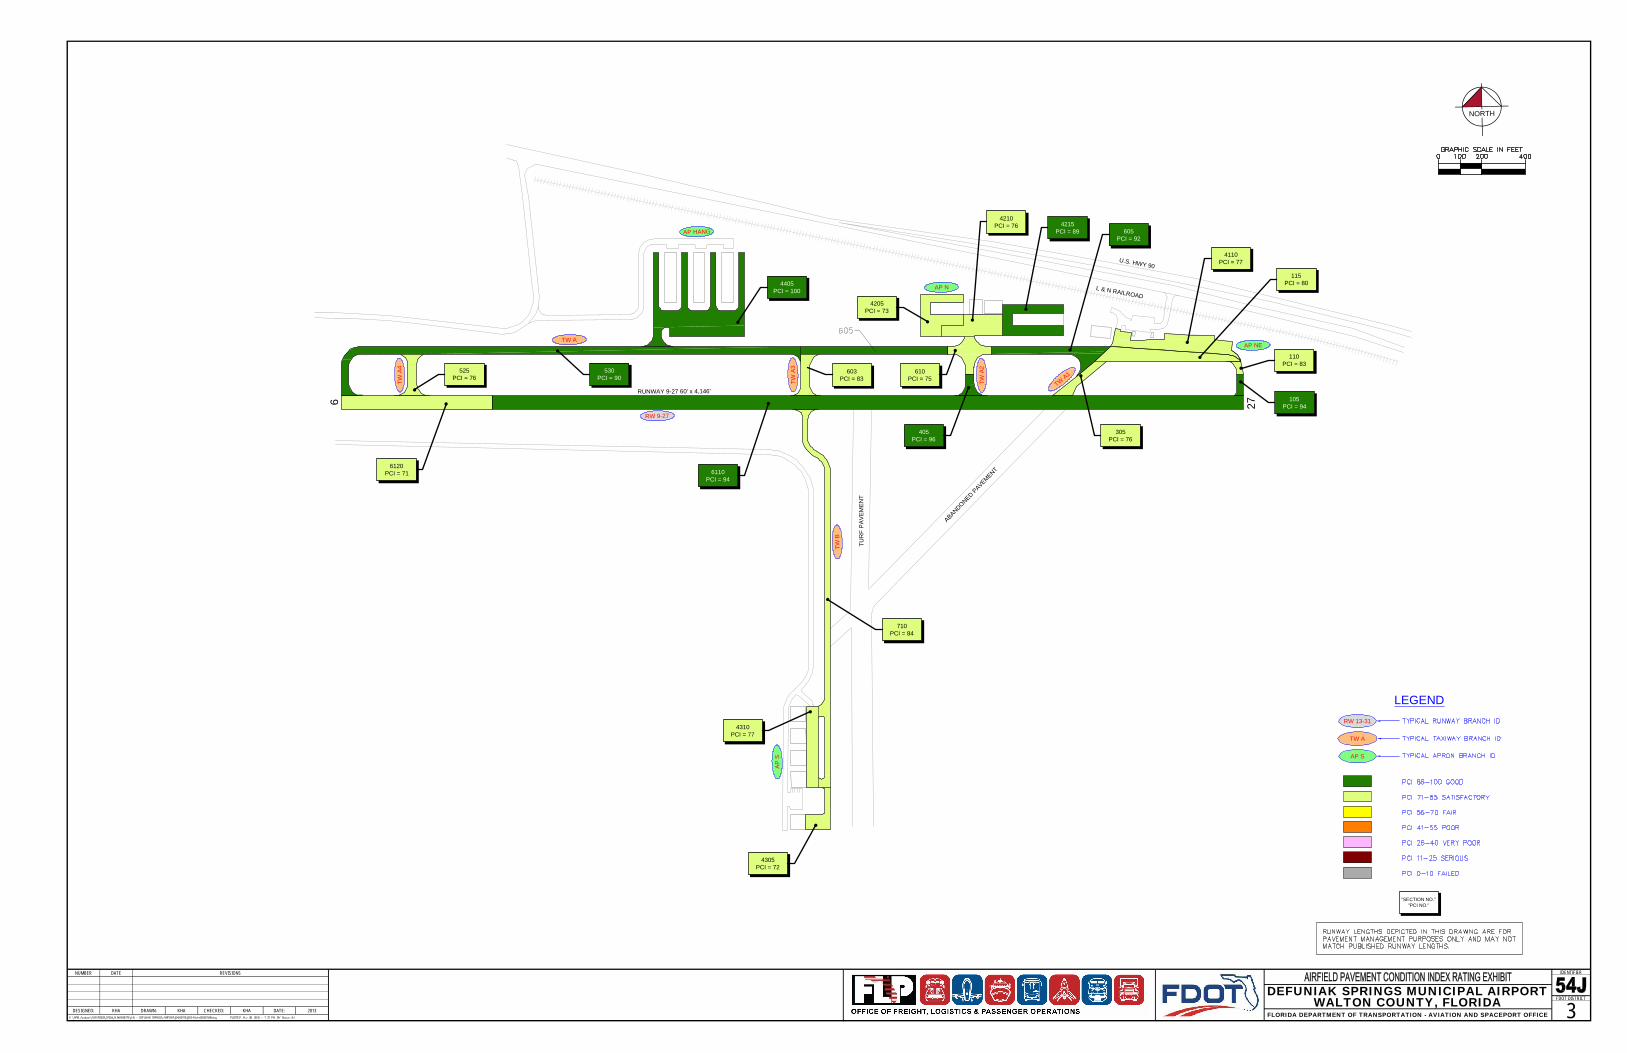
TW A
TWA3
TWA4
TWA2
TWA1
AP NE
AP N
TWB
AP
S
RW 9-27
RUNWAY 9-27 60' x 4,146'
TUR
FP
AVE
MEN
T
ABANDONEDPAVEMENT
U.S. HWY 90
L & N RAILROAD
27
9
AP HANG
NUMBER DATE REVISIONS
DESIGNED: DRAWN: CHECKED: DATE:
IDENTIFIER
FDOT DISTRICT
NORTH
DEFUNIAK SPRINGS MUNICIPAL AIRPORTWALTON COUNTY, FLORIDA
FLORIDA DEPARTMENT OF TRANSPORTATION - AVIATION AND SPACEPORT OFFICE 3KHA KHA KHA 2013
LEGEND
TW A
AP S
RW 13-31
"SECTION NO.""PCI NO."
6110PCI = 94
530PCI = 90
4405PCI = 100
405PCI = 96
4215PCI = 89 605
PCI = 92
115PCI = 80
4110PCI = 77
4210PCI = 76
4205PCI = 73
603PCI = 83
710PCI = 84
4310PCI = 77
4305PCI = 72
6120PCI = 71
525PCI = 76
610PCI = 75
105PCI = 94
110PCI = 83
305PCI = 76

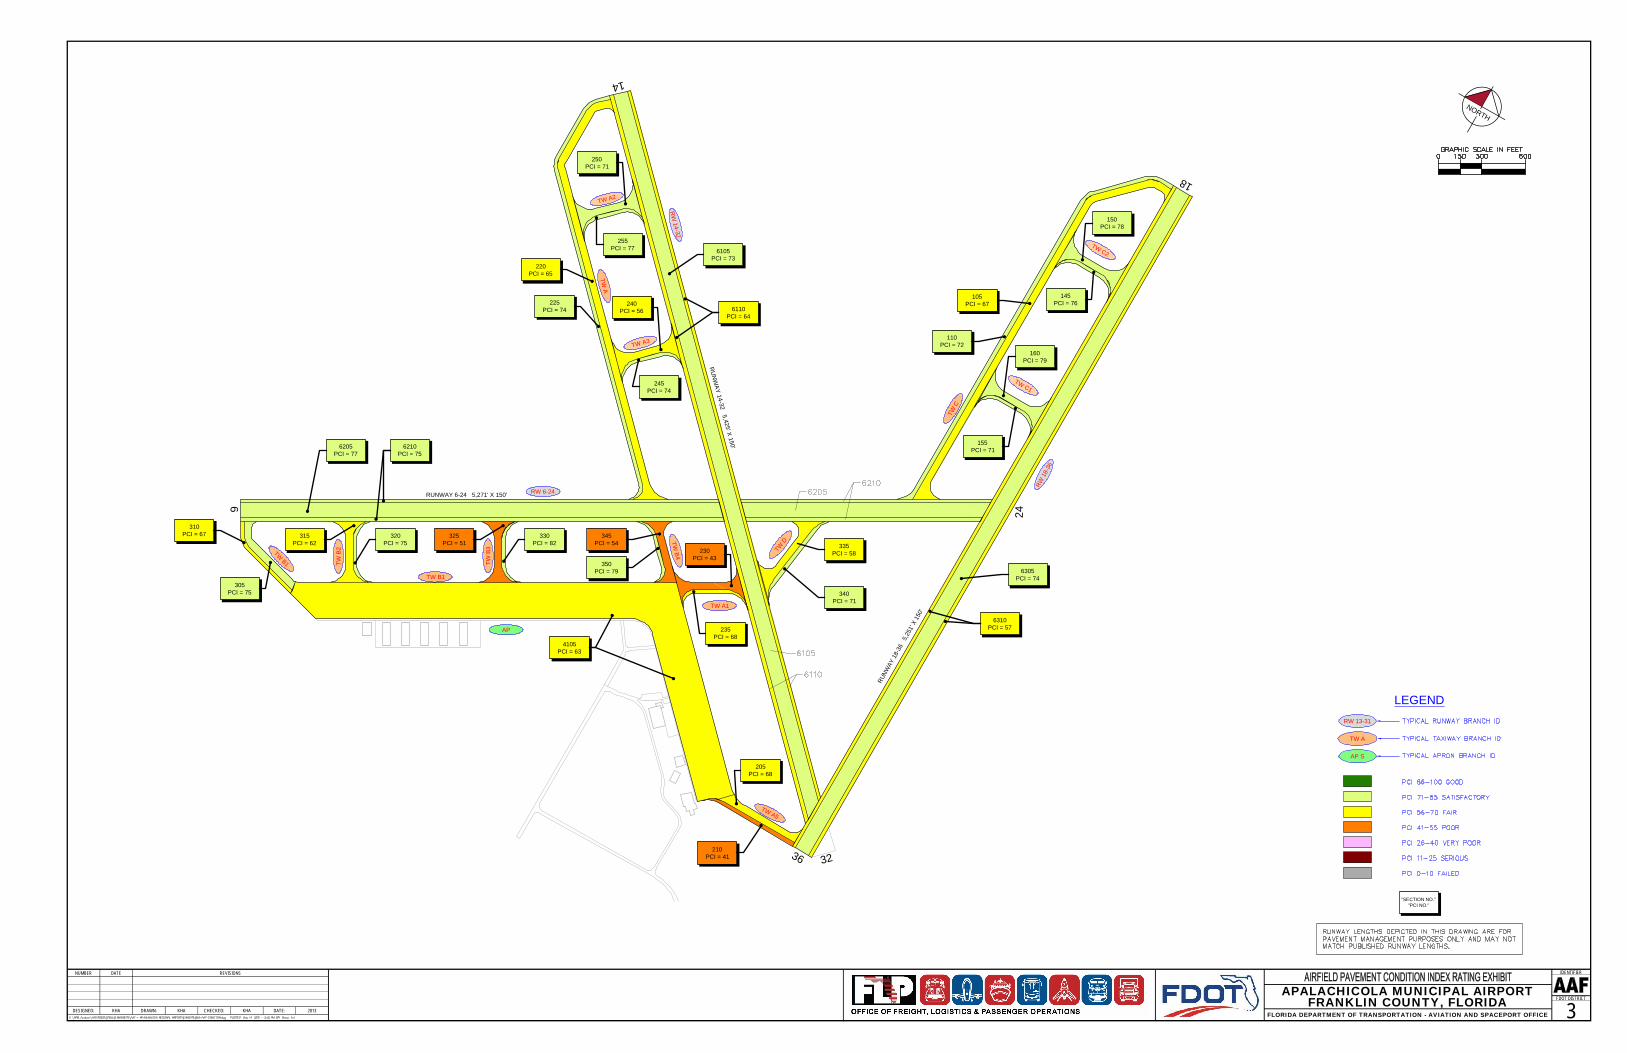
RW 6-24
RW
14-32
RW18
-36
TW A2
TW A3
TWA
TWB4TW
B1
TW B1
TWB2
TWB3
TW A1
TW A5
TWC
TW C1
TW C2
AP
RUNWAY 6-24 5,271' X 150'
RU
NW
AY14-32
5,425' X150'
RUNW
AY18
-36
5,25
1'X
150'
TWD
24
6
3236
14
18
NUMBER DATE REVISIONS
DESIGNED: DRAWN: CHECKED: DATE:
IDENTIFIER
FDOT DISTRICT
NORTH
APALACHICOLA MUNICIPAL AIRPORTFRANKLIN COUNTY, FLORIDA
FLORIDA DEPARTMENT OF TRANSPORTATION - AVIATION AND SPACEPORT OFFICE 3KHA KHA KHA 2013
6305PCI = 74
150PCI = 78
145PCI = 76
160PCI = 79
155PCI = 71
340PCI = 71
320PCI = 75
305PCI = 75
6205PCI = 77
6210PCI = 75
225PCI = 74
255PCI = 77
250PCI = 71
6105PCI = 73
245PCI = 74
350PCI = 79
330PCI = 82
110PCI = 72
205PCI = 68
4105PCI = 63
310PCI = 67 315
PCI = 62
220PCI = 65
240PCI = 56
335PCI = 58
235PCI = 68
6310PCI = 57
105PCI = 67
230PCI = 43
345PCI = 54
325PCI = 51
210PCI = 41
6110PCI = 64
LEGEND
TW A
AP S
RW 13-31
"SECTION NO.""PCI NO."

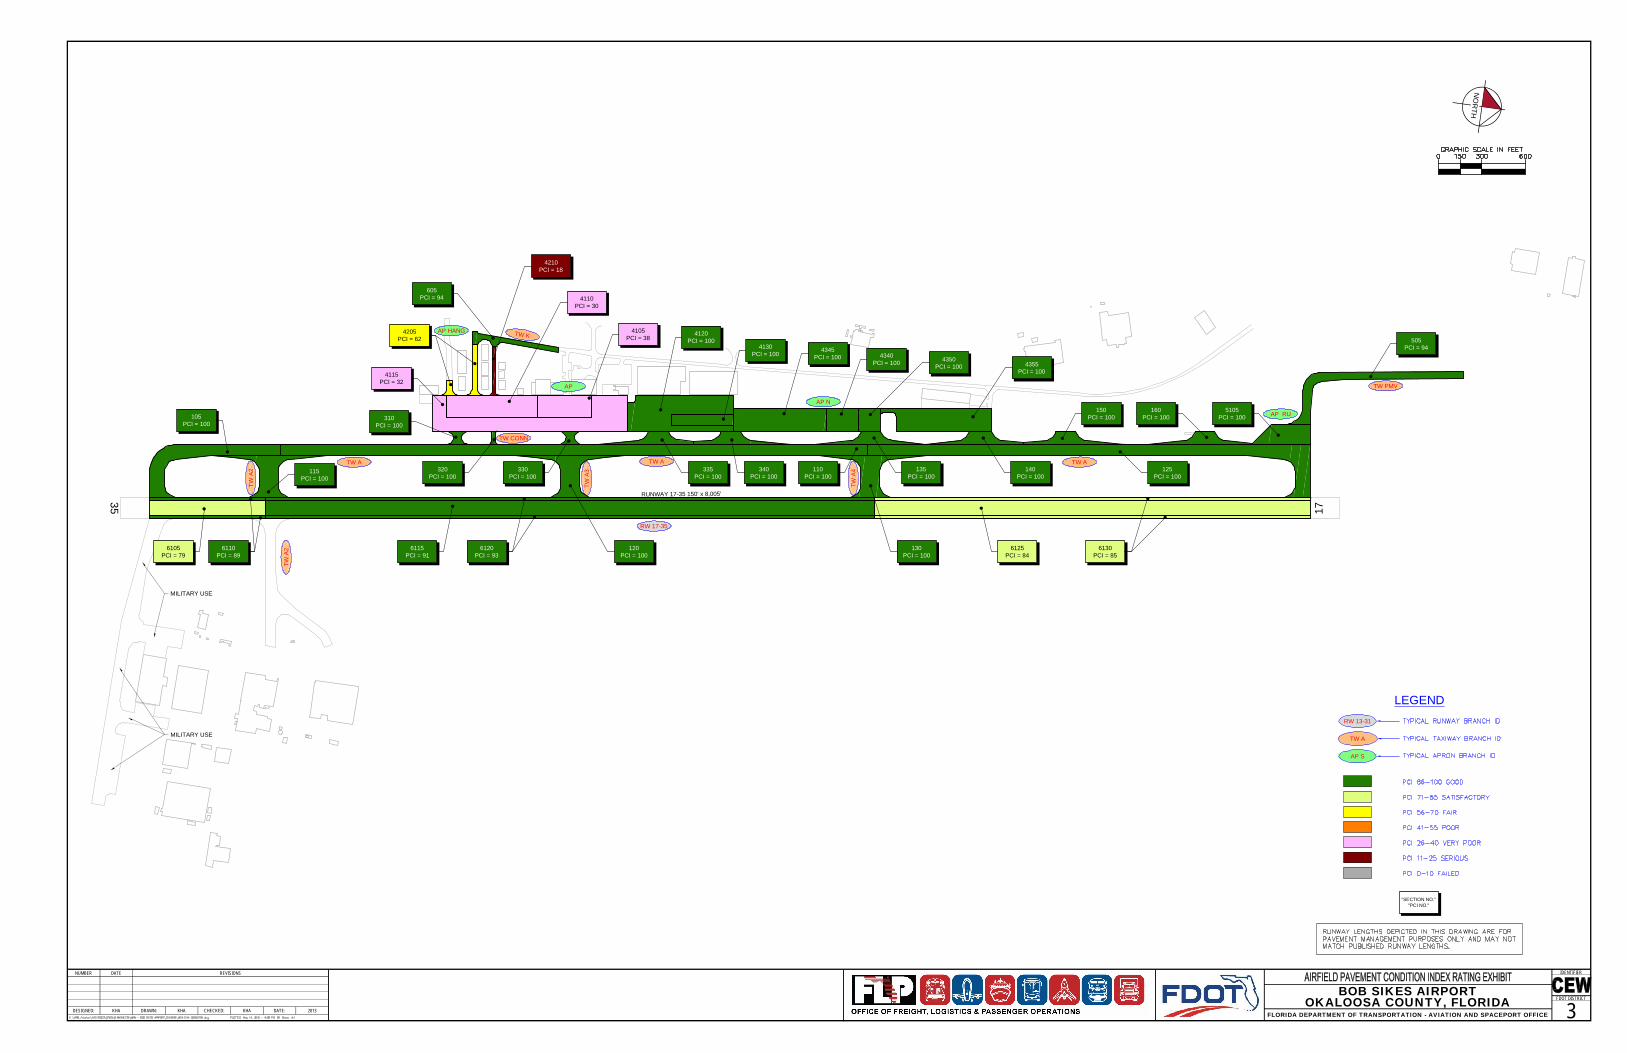
RW 17-35
TWA2
TW A
TW CONN
AP RU
AP N
17
3 5
RUNWAY 17-35 150' x 8,005'
AP
AP HANG TW K
TWA2
TWA3
TWA4
TW ATW A
TW PMV
MILITARY USE
MILITARY USE
NUMBER DATE REVISIONS
DESIGNED: DRAWN: CHECKED: DATE:
IDENTIFIER
FDOT DISTRICT
NO
RTH
BOB SIKES AIRPORTOKALOOSA COUNTY, FLORIDA
FLORIDA DEPARTMENT OF TRANSPORTATION - AVIATION AND SPACEPORT OFFICE 3KHA KHA KHA 2013
LEGEND
TW A
AP S
RW 13-31
"SECTION NO.""PCI NO."
505PCI = 94
5105PCI = 100
160PCI = 100
150PCI = 100
125PCI = 100
130PCI = 100
135PCI = 100
140PCI = 100
4355PCI = 100
4350PCI = 100
4340PCI = 100
4345PCI = 100
4130PCI = 100
4120PCI = 100
605PCI = 94
310PCI = 100
105PCI = 100
6110PCI = 89
6115PCI = 91
6120PCI = 93
120PCI = 100
115PCI = 100
320PCI = 100
330PCI = 100
335PCI = 100
340PCI = 100
110PCI = 100
6125PCI = 84
6130PCI = 85
6105PCI = 79
4205PCI = 62
4110PCI = 30
4105PCI = 38
4210PCI = 18
4115PCI = 32

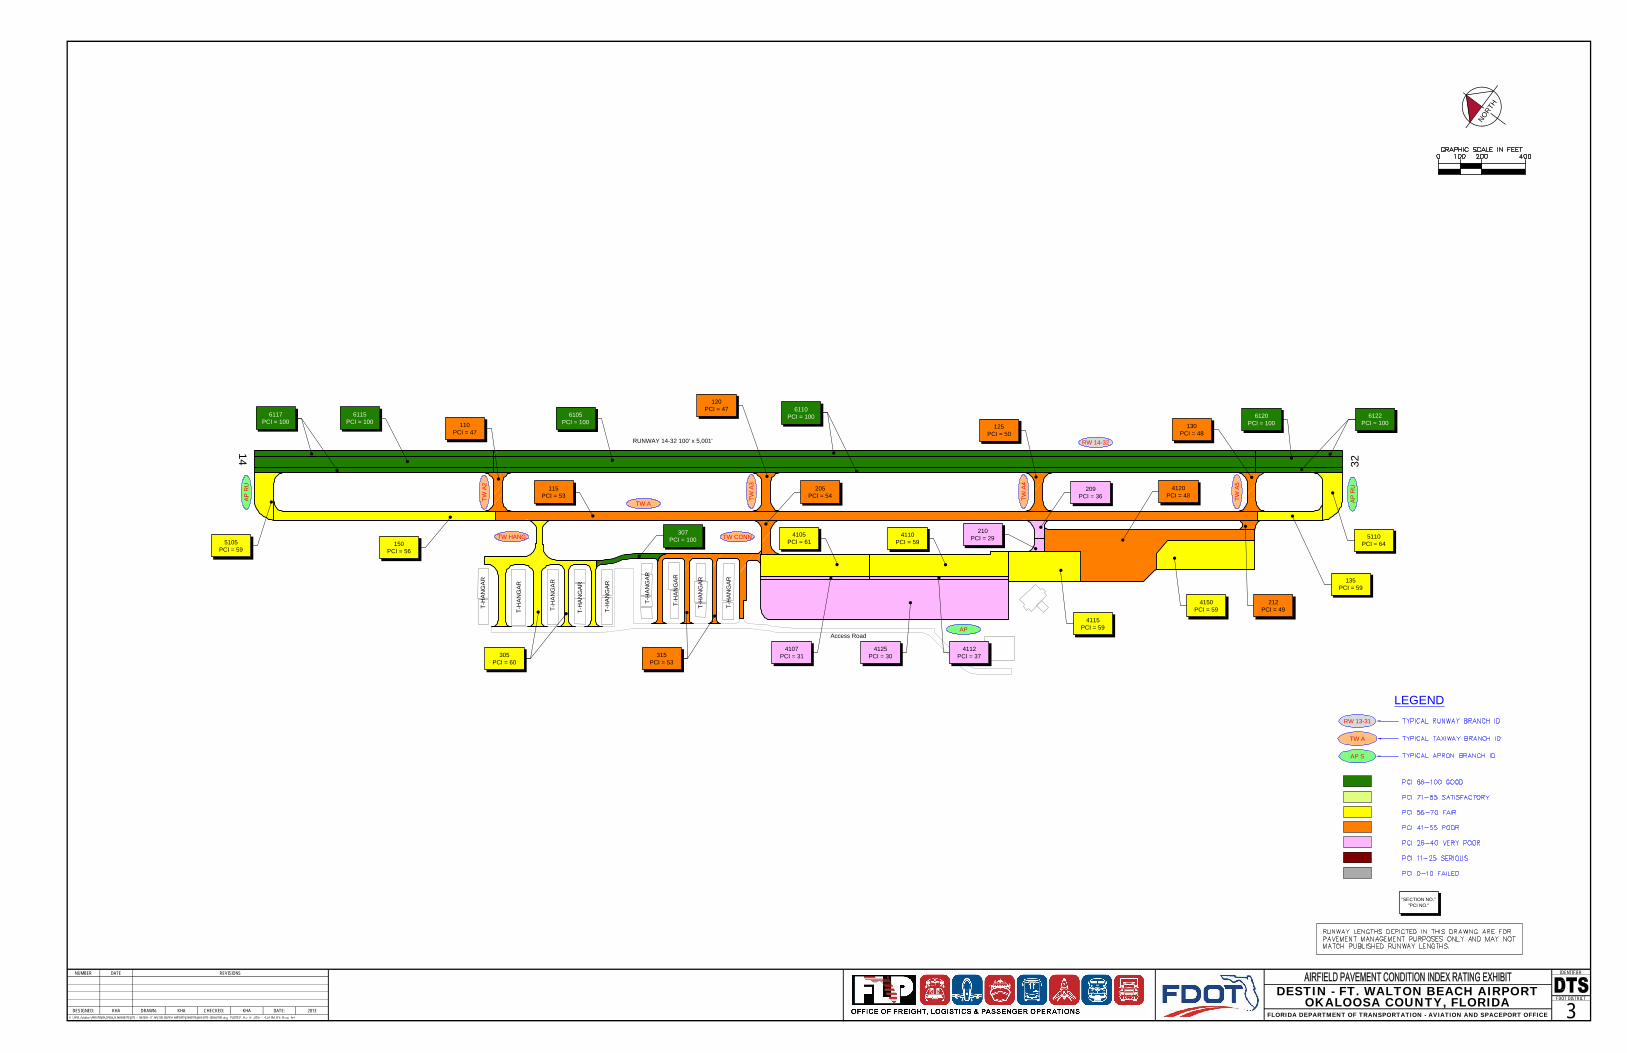
AP
RU
AP
RU
AP
RW 14-32
TW HANG TW CONN
14
32
RUNWAY 14-32 100' x 5,001'
Access Road
T-H
AN
GAR
T-H
AN
GAR
T-H
AN
GAR
T-H
AN
GAR
T-H
AN
GAR
T-H
AN
GAR
T-H
AN
GAR
T-H
AN
GAR
T-H
AN
GAR
TWA2
TWA3
TW A
TWA4
TWA5
NUMBER DATE REVISIONS
DESIGNED: DRAWN: CHECKED: DATE:
IDENTIFIER
FDOT DISTRICT
NORTH
DESTIN - FT. WALTON BEACH AIRPORTOKALOOSA COUNTY, FLORIDA
FLORIDA DEPARTMENT OF TRANSPORTATION - AVIATION AND SPACEPORT OFFICE 3KHA KHA KHA 2013
LEGEND
TW A
AP S
RW 13-31
"SECTION NO.""PCI NO."
6122PCI = 100
6120PCI = 100
6110PCI = 1006105
PCI = 1006115
PCI = 1006117
PCI = 100
307PCI = 100 5110
PCI = 64
135PCI = 59
4150PCI = 59
4115PCI = 59
4110PCI = 59
4105PCI = 61
305PCI = 60
150PCI = 56
5105PCI = 59
212PCI = 49
4120PCI = 48
125PCI = 50
130PCI = 48
205PCI = 54
120PCI = 47
115PCI = 53
315PCI = 53
110PCI = 47
210PCI = 29
209PCI = 36
4125PCI = 30
4107PCI = 31
4112PCI = 37

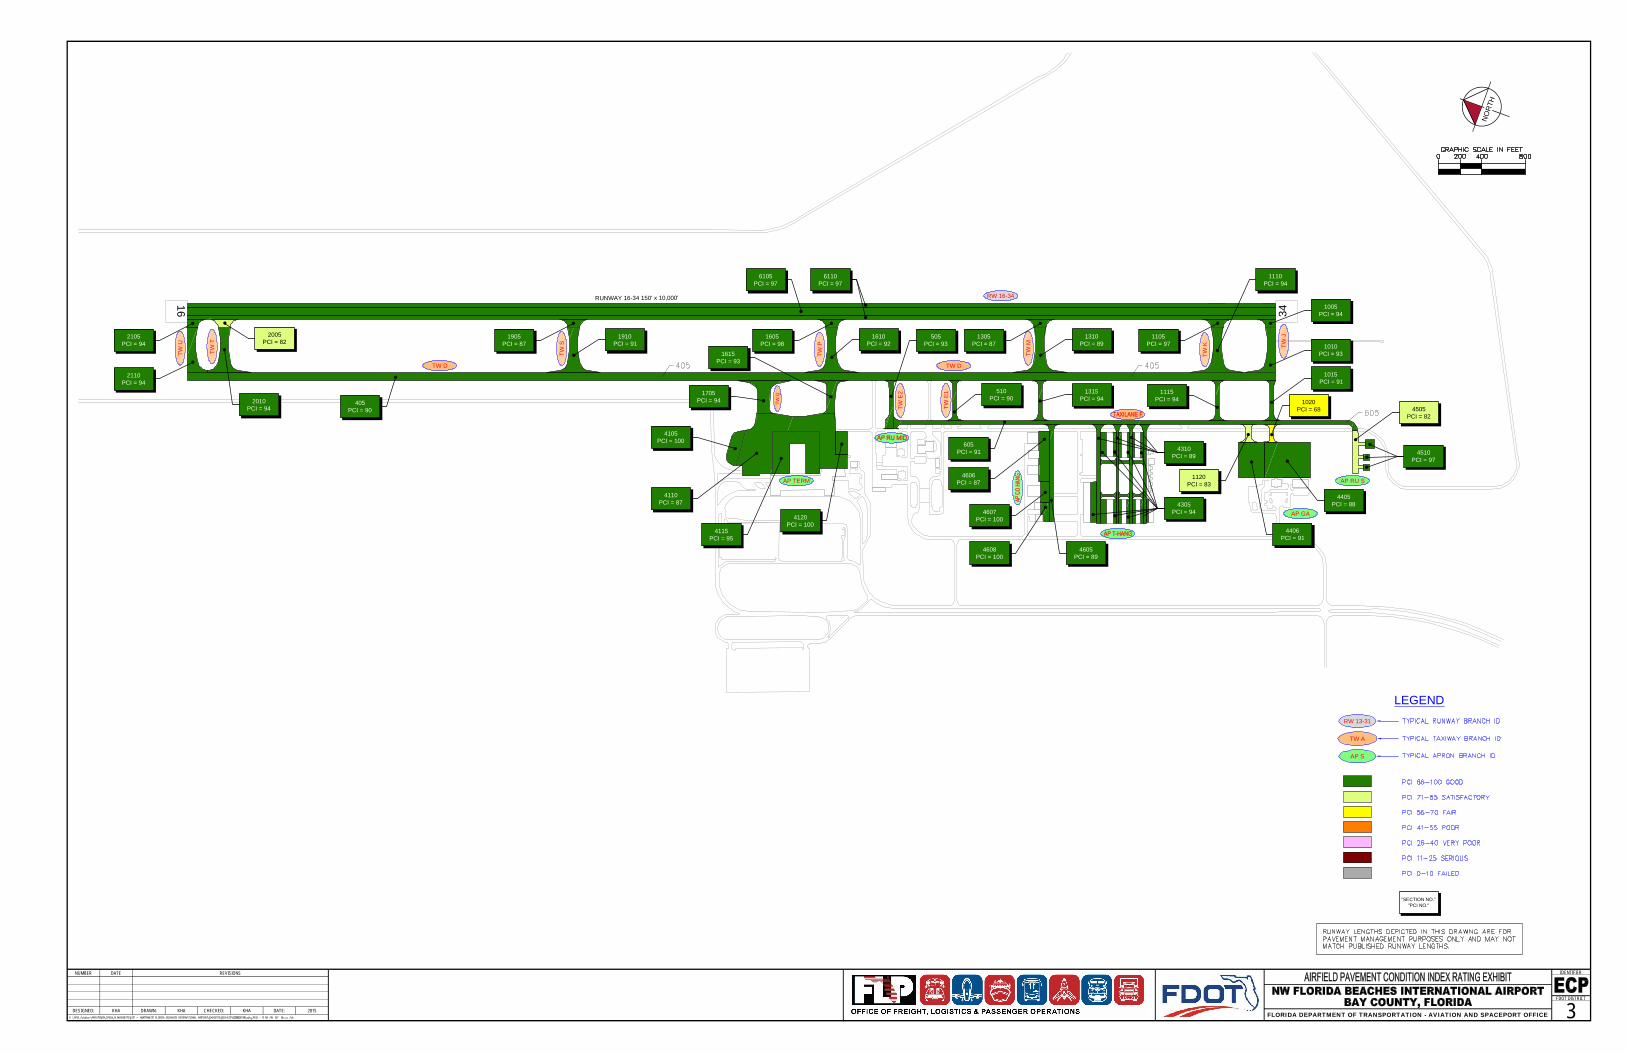
RUNWAY 16-34 150' x 10,000'
34
16
TWQ
RW 16-34
TWU
TWT
TW D
TWS
TWP
TW D
TWM
TWK TW
J
TWE2
TWE1
AP TERM
AP GA
AP RU S
LEGEND
TW A
AP S
RW 13-31
"SECTION NO.""PCI NO."
NUMBER DATE REVISIONS
DESIGNED: DRAWN: CHECKED: DATE:
IDENTIFIER
FDOT DISTRICT
NO
RTH
FLORIDA DEPARTMENT OF TRANSPORTATION - AVIATION AND SPACEPORT OFFICE 3KHA KHA KHA 2015
6105PCI = 97
6110PCI = 97
2005PCI = 82
2010PCI = 94
2105PCI = 94
2110PCI = 94
405PCI = 90
1905PCI = 87
1910PCI = 91
1605PCI = 98
1610PCI = 92
1615PCI = 93
1705PCI = 94
1305PCI = 87
1310PCI = 89
1315PCI = 94
1105PCI = 97
1110PCI = 94
1115PCI = 94
505PCI = 93
510PCI = 90 1020
PCI = 68
1015PCI = 91
1010PCI = 93
1005PCI = 94
4505PCI = 82
4510PCI = 97
4405PCI = 88
4406PCI = 91
4310PCI = 89
4305PCI = 94
1120PCI = 83
605PCI = 91
4606PCI = 87
4607PCI = 100
4608PCI = 100
4605PCI = 89
4105PCI = 100
4110PCI = 87
4115PCI = 95
4120PCI = 100

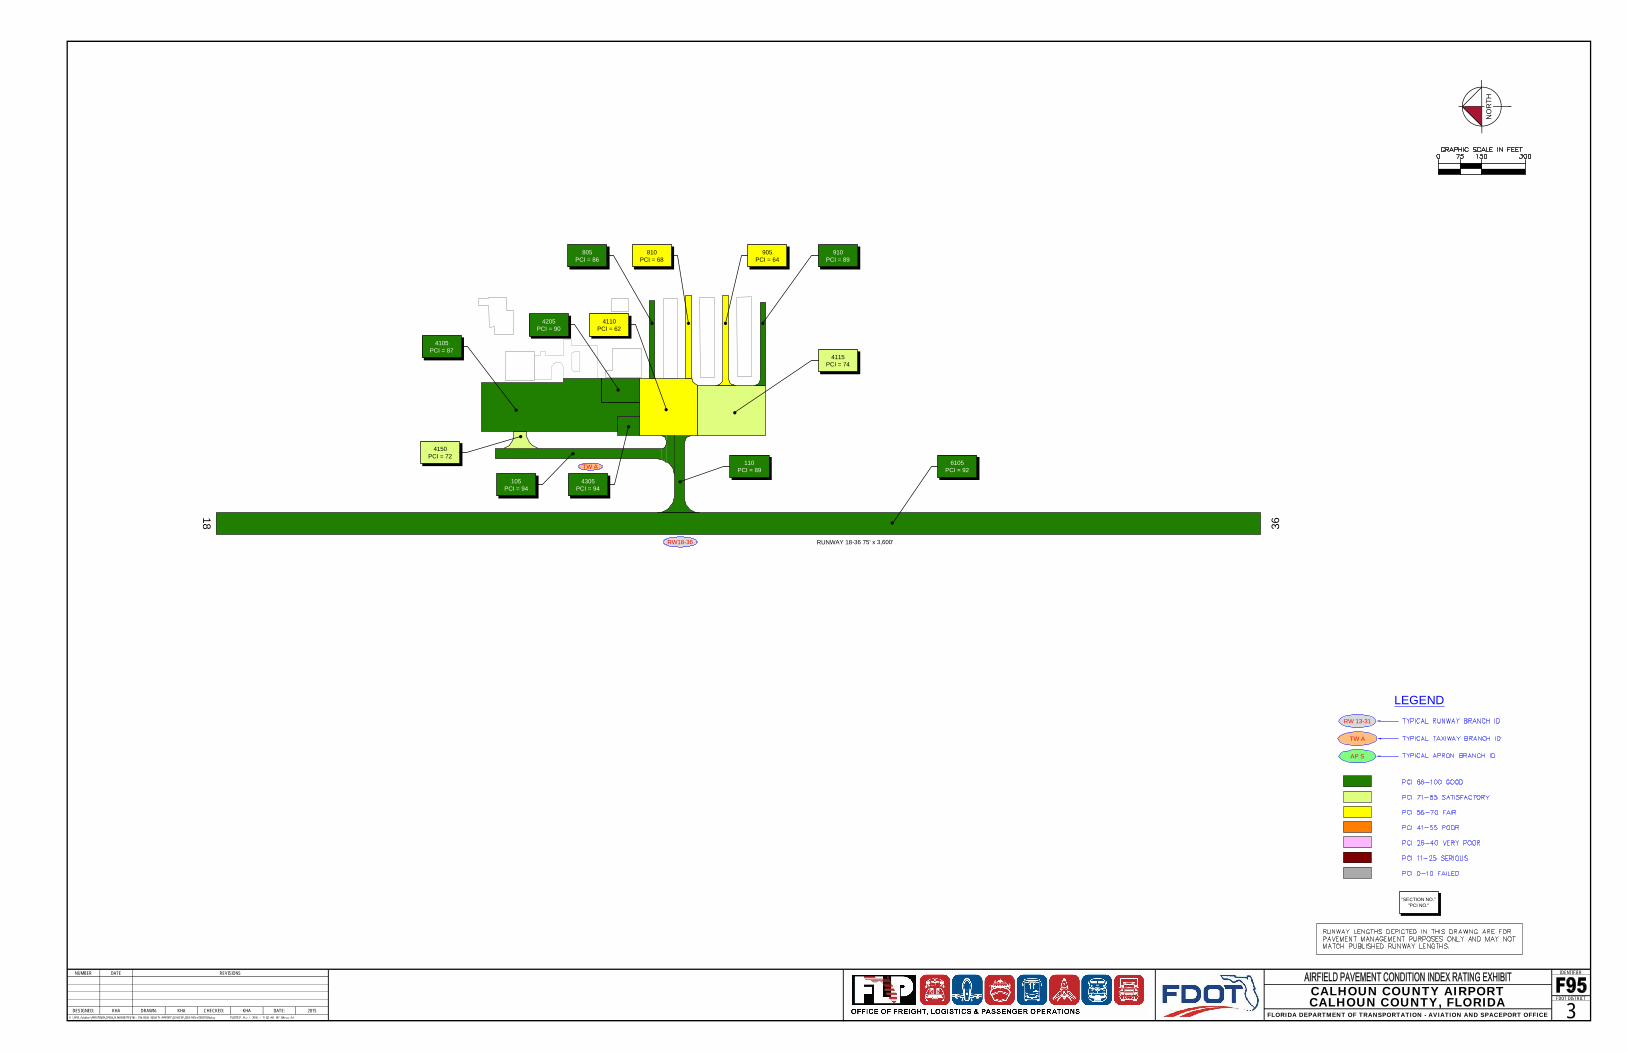
RW18-36
TW A
36
18
RUNWAY 18-36 75' x 3,600'
LEGEND
TW A
AP S
RW 13-31
"SECTION NO.""PCI NO."
NUMBER DATE REVISIONS
DESIGNED: DRAWN: CHECKED: DATE:
IDENTIFIER
FDOT DISTRICTCALHOUN COUNTY AIRPORTCALHOUN COUNTY, FLORIDA
FLORIDA DEPARTMENT OF TRANSPORTATION - AVIATION AND SPACEPORT OFFICE 3KHA KHA KHA 2015
NO
RTH
6105PCI = 92
110PCI = 89
105PCI = 94
4105PCI = 87
4205PCI = 90
4305PCI = 94
805PCI = 86
910PCI = 89
810PCI = 68
905PCI = 64
4115PCI = 74
4150PCI = 72
4110PCI = 62

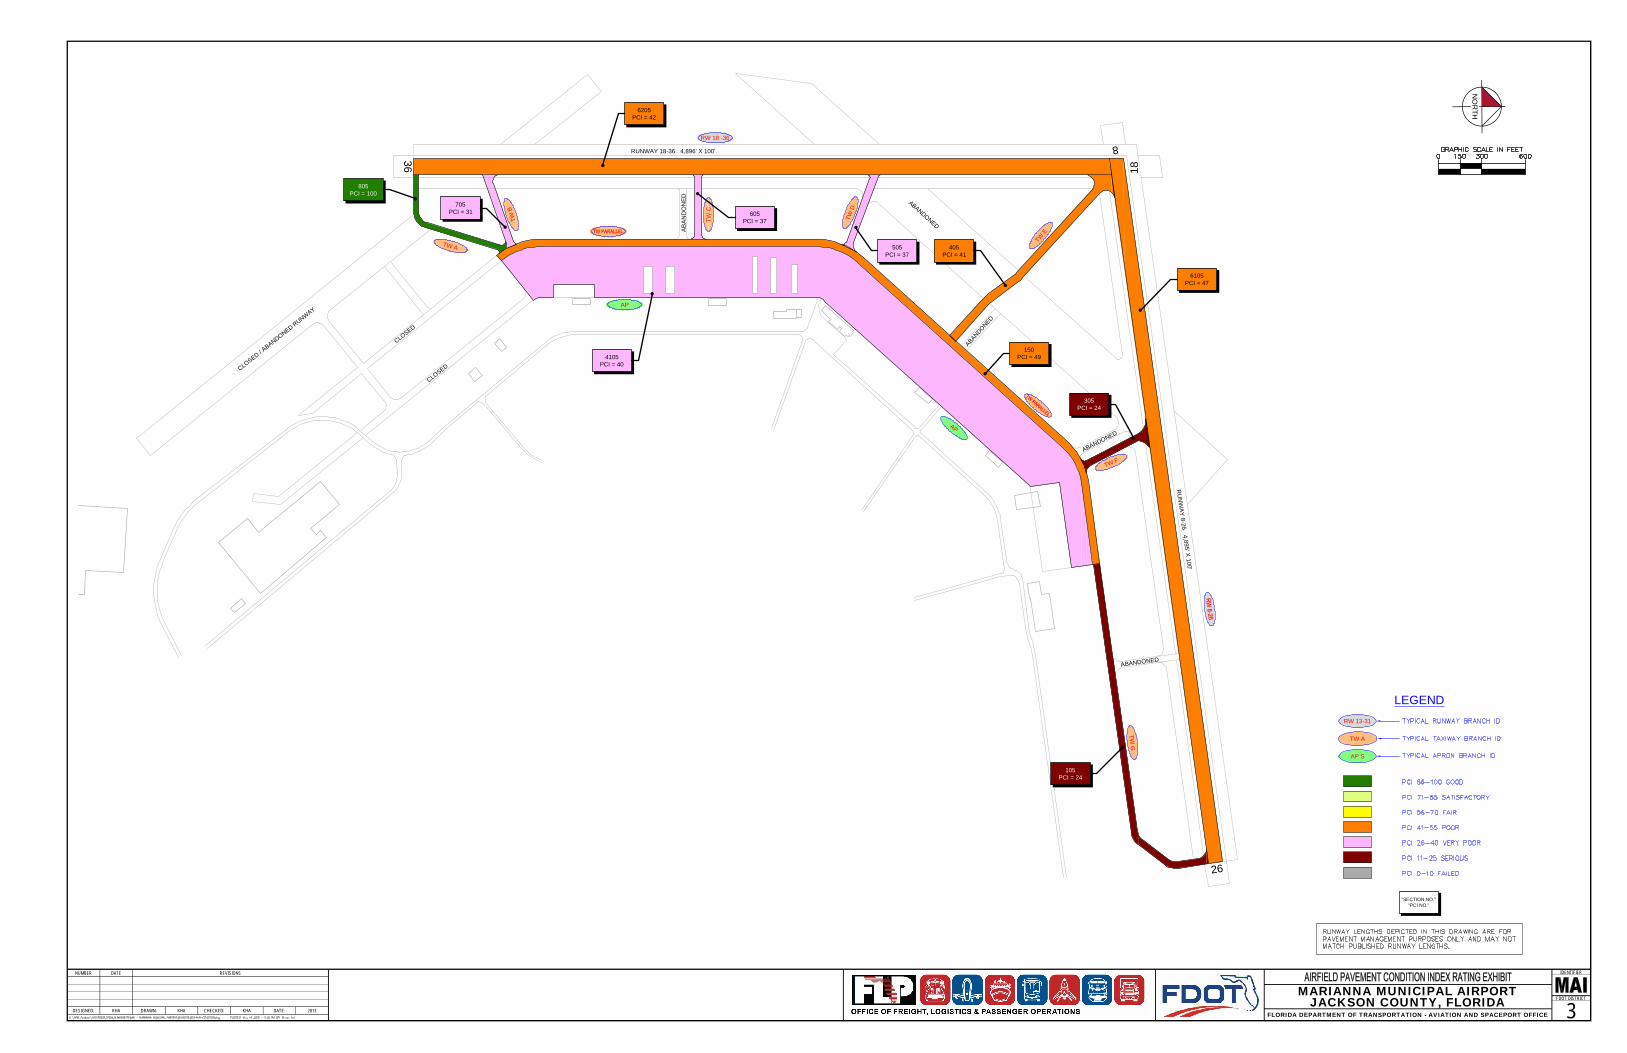
26
8
36 18
RUNWAY 18-36 4,896' X 100'
RU
NW
AY8-26
4,895' X100'
RW 18 -36
AB
AN
DO
NED ABANDONED
ABANDONED
ABANDONED
ABANDONED
CLOSED / ABANDONED RUNWAY
CLOSED
CLOSED
TWB
TWC
TWE
TW F
TWG
AP
AP
TWD
TW A
NUMBER DATE REVISIONS
DESIGNED: DRAWN: CHECKED: DATE:
IDENTIFIER
FDOT DISTRICT
NO
RTH
MARIANNA MUNICIPAL AIRPORTJACKSON COUNTY, FLORIDA
FLORIDA DEPARTMENT OF TRANSPORTATION - AVIATION AND SPACEPORT OFFICE 3KHA KHA KHA 2013
LEGEND
TW A
AP S
RW 13-31
"SECTION NO.""PCI NO."
805PCI = 100
105PCI = 24
505PCI = 37
605PCI = 37
705PCI = 31
4105PCI = 40
6105PCI = 47
405PCI = 41
6205PCI = 42
150PCI = 49
305PCI = 24

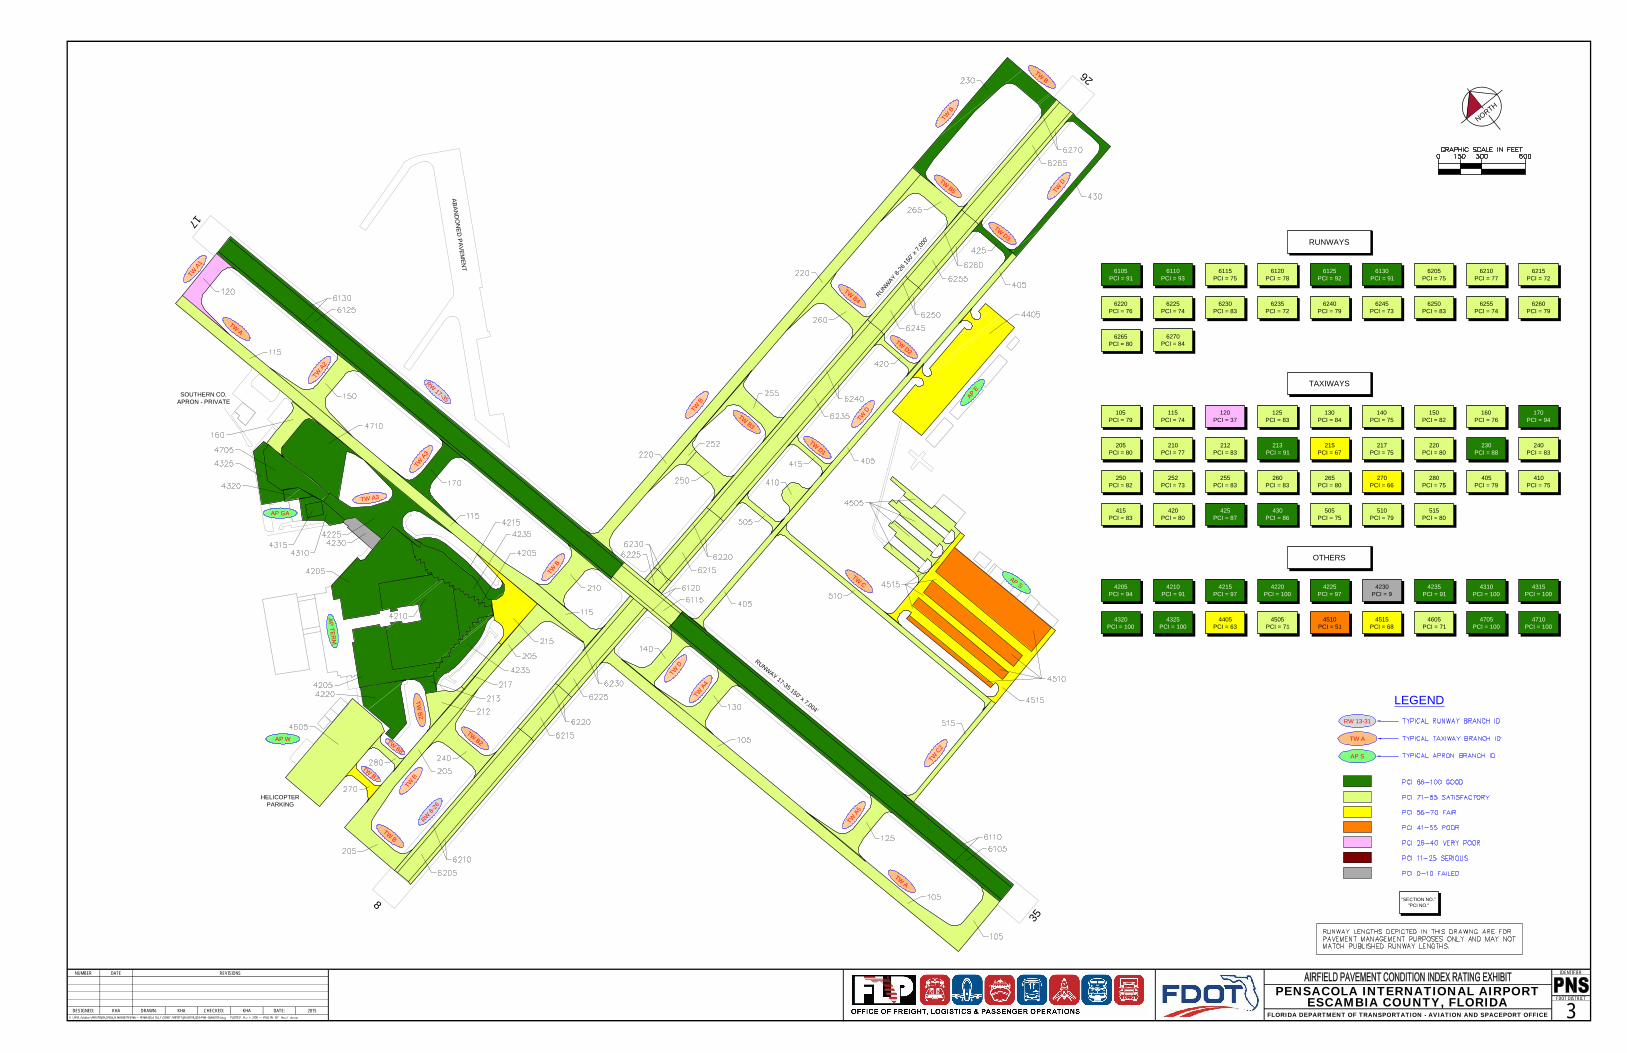
35
17
8
26
RUNWAY 17-35 150' x 7,004'
RUNWAY
8-26
150'
x 7,000
'
RW8-
26
RW17-35 AP
E
AP S
APTER
M
AP GA
AP W
TWA
TWA5
TWA
TWA4
TWD
TWB
TWA3
TWA2
TWA1
TWB
TWB
TWB
TWB
TWB2
TWB7
TWB8
TWB2
TW A3
TWB3
TWB4
TWB5
TWB
TWD3
TWD
TWD2
TWD1
TWD
TWC
TWC2
HELICOPTERPARKING
ABAN
DO
NE
DPAVEM
ENT
SOUTHERN CO.APRON - PRIVATE
LEGEND
TW A
AP S
RW 13-31
"SECTION NO.""PCI NO."
NUMBER DATE REVISIONS
DESIGNED: DRAWN: CHECKED: DATE:
IDENTIFIER
FDOT DISTRICTPENSACOLA INTERNATIONAL AIRPORT
ESCAMBIA COUNTY, FLORIDAFLORIDA DEPARTMENT OF TRANSPORTATION - AVIATION AND SPACEPORT OFFICE 3KHA KHA KHA 2015
NORTH
RUNWAYS
TAXIWAYS
OTHERS
6105PCI = 91
6110PCI = 93
6125PCI = 92
6130PCI = 91
6115PCI = 75
6120PCI = 78
6210PCI = 77
6215PCI = 72
6220PCI = 76
6225PCI = 74
6230PCI = 83
6235PCI = 72
6240PCI = 79
6245PCI = 73
6250PCI = 83
6255PCI = 74
6260PCI = 79
6265PCI = 80
6270PCI = 84
6205PCI = 75
105PCI = 79
115PCI = 74
125PCI = 83
130PCI = 84
120PCI = 37
140PCI = 75
150PCI = 82
160PCI = 76
170PCI = 94
205PCI = 80
210PCI = 77
212PCI = 83
213PCI = 91
215PCI = 67
217PCI = 75
220PCI = 80
230PCI = 88
240PCI = 83
250PCI = 82
252PCI = 73
255PCI = 83
260PCI = 83
265PCI = 80
280PCI = 75
270PCI = 66
405PCI = 79
410PCI = 75
415PCI = 83
420PCI = 80
425PCI = 87
430PCI = 86
505PCI = 75
510PCI = 79
515PCI = 80
4205PCI = 94
4210PCI = 91
4215PCI = 97
4220PCI = 100
4225PCI = 97
4235PCI = 91
4230PCI = 9
4310PCI = 100
4315PCI = 100
4320PCI = 100
4325PCI = 100
4405PCI = 63
4515PCI = 68
4505PCI = 71
4510PCI = 51
4605PCI = 71
4705PCI = 100
4710PCI = 100

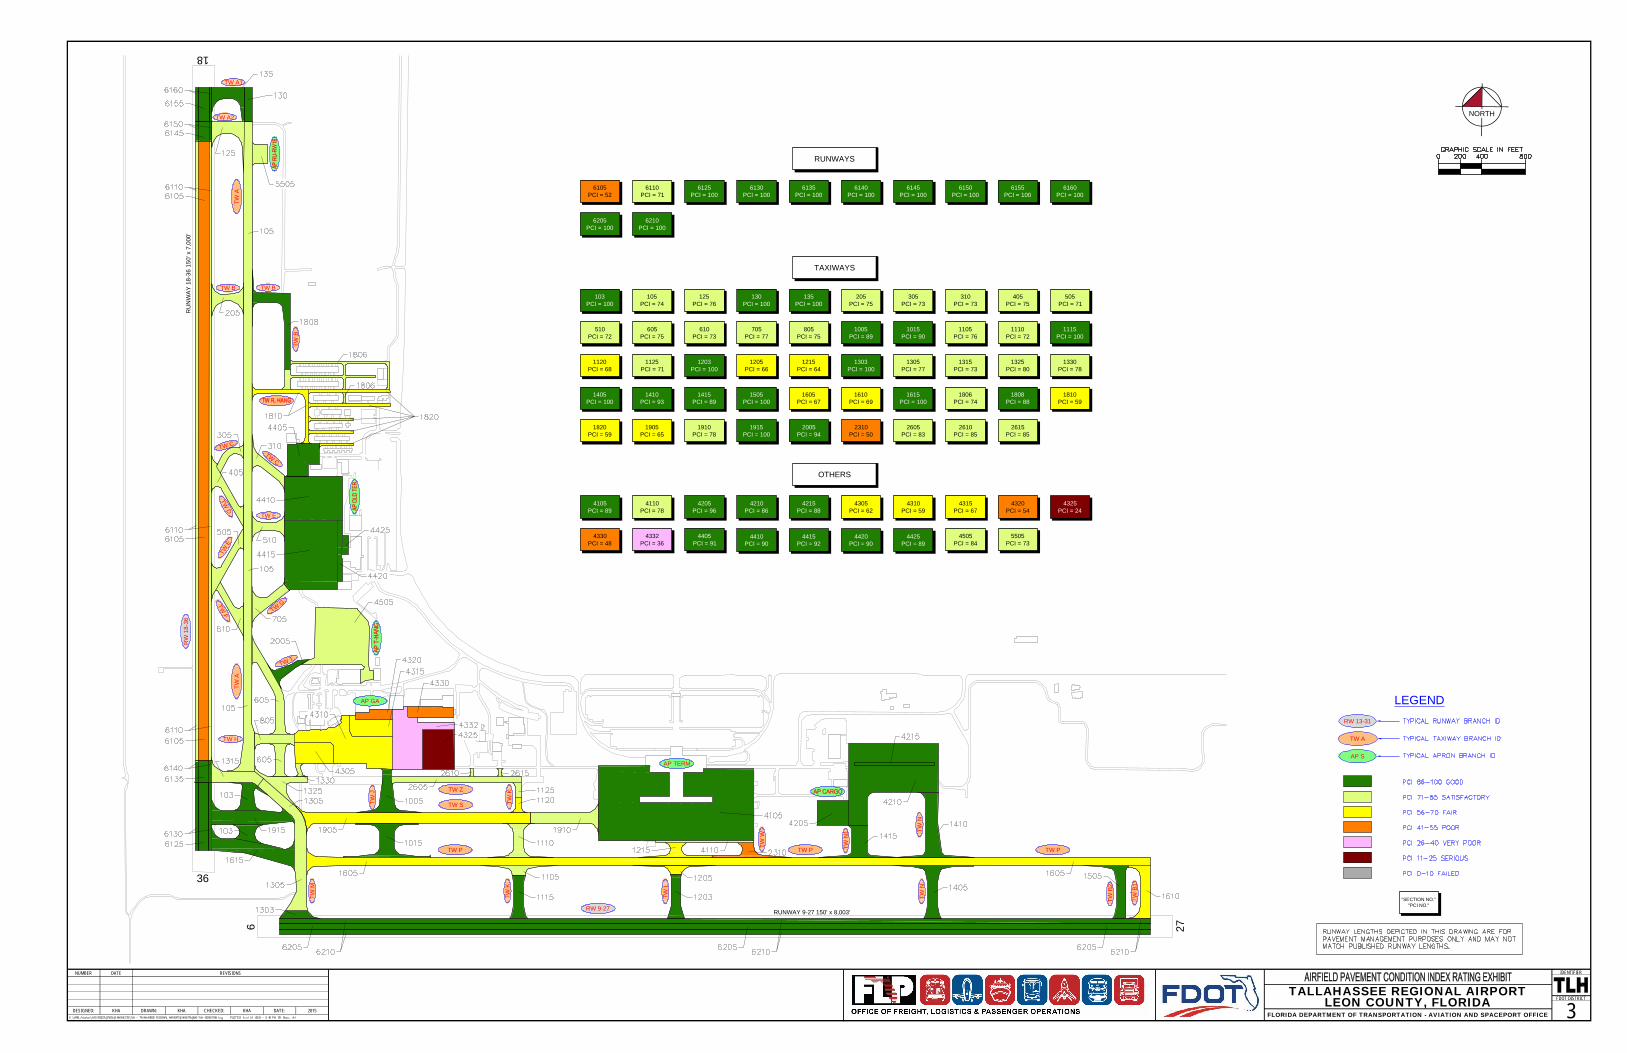
27
9
36
18
RW 9-27
RW
18-3
6
AP TERM
AP GA
TWA
TW P
TW S
TW P
RU
NW
AY
18-3
615
0'x
7,00
0'
RUNWAY 9-27 150' x 8,003'
TWA
TW B
TW C
TWD
TW E
TWC
TWF TW
G
TWE
TW T
TW H
TWJ
TWK
TWK
TWL
TWN
TWB2
TWB1
TW P
TWW
TW Z
TWM
TW A2
TW A1
TW BTW
B
TWN
1 TWN
LEGEND
TW A
AP S
RW 13-31
"SECTION NO.""PCI NO."
NUMBER DATE REVISIONS
DESIGNED: DRAWN: CHECKED: DATE:
IDENTIFIER
FDOT DISTRICT
NORTH
TALLAHASSEE REGIONAL AIRPORTLEON COUNTY, FLORIDA
FLORIDA DEPARTMENT OF TRANSPORTATION - AVIATION AND SPACEPORT OFFICE 3KHA KHA KHA 2015
6105PCI = 52
6125PCI = 100
6130PCI = 100
6135PCI = 100
6140PCI = 100
6145PCI = 100
6150PCI = 100
6155PCI = 100
6160PCI = 100
6205PCI = 100
6210PCI = 100
RUNWAYS
TAXIWAYS
103PCI = 100
105PCI = 74
125PCI = 76
130PCI = 100
135PCI = 100
205PCI = 75
305PCI = 73
310PCI = 73
405PCI = 75
505PCI = 71
510PCI = 72
605PCI = 75
610PCI = 73
705PCI = 77
805PCI = 75
1005PCI = 89
1015PCI = 90
1105PCI = 76
1110PCI = 72
1115PCI = 100
1120PCI = 68
1125PCI = 71
1203PCI = 100
1205PCI = 66
1215PCI = 64
1303PCI = 100
1305PCI = 77
1315PCI = 73
1325PCI = 80
1330PCI = 78
1405PCI = 100
1410PCI = 93
1415PCI = 89
1505PCI = 100
1605PCI = 67
1610PCI = 69
1615PCI = 100
1806PCI = 74
1808PCI = 88
1810PCI = 59
1820PCI = 59
1905PCI = 65
1910PCI = 78
1915PCI = 100
2005PCI = 94
2310PCI = 50
2605PCI = 83
2610PCI = 85
2615PCI = 85
OTHERS
4105PCI = 89
4110PCI = 78
4205PCI = 96
4210PCI = 86
4215PCI = 88
4305PCI = 62
4310PCI = 59
4315PCI = 67
4320PCI = 54
4325PCI = 24
4330PCI = 48
4332PCI = 36
4405PCI = 91
4410PCI = 90
4415PCI = 92
4420PCI = 90
4425PCI = 89
4505PCI = 84
5505PCI = 73
6110PCI = 71

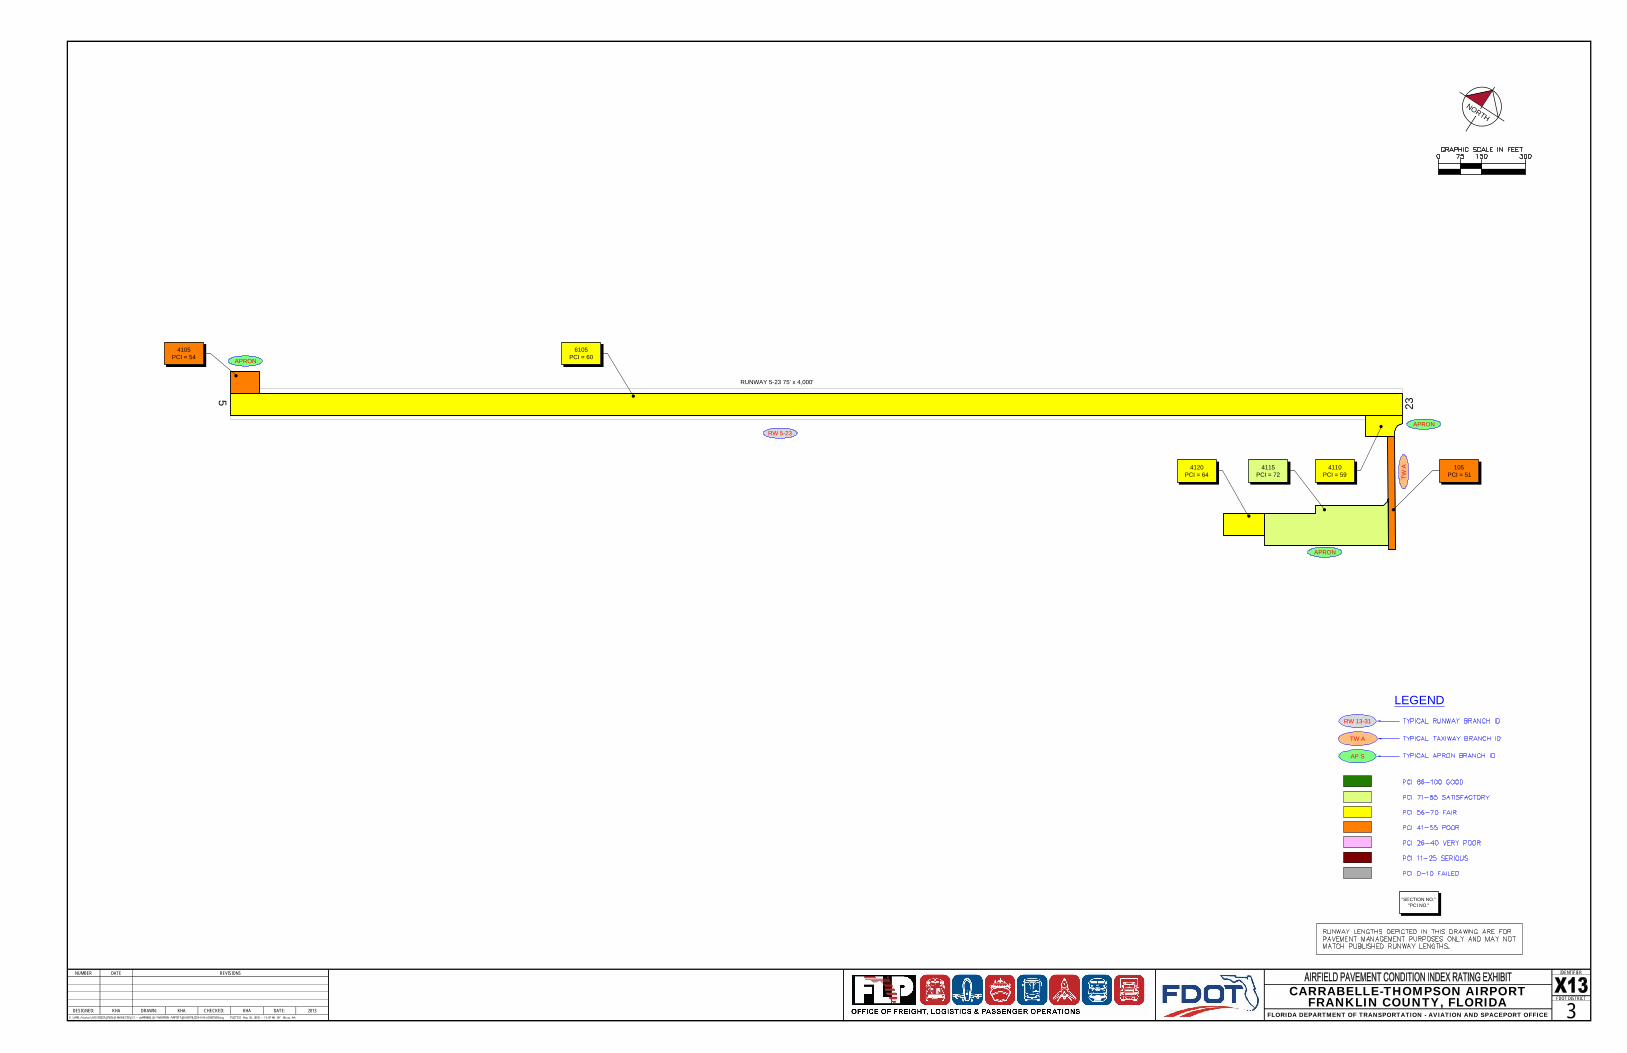
RUNWAY 5-23 75' x 4,000'
RW 5-23
235
APRON
APRON
APRON
TWA
NUMBER DATE REVISIONS
DESIGNED: DRAWN: CHECKED: DATE:
IDENTIFIER
FDOT DISTRICT
NORTH
CARRABELLE-THOMPSON AIRPORTFRANKLIN COUNTY, FLORIDA
FLORIDA DEPARTMENT OF TRANSPORTATION - AVIATION AND SPACEPORT OFFICE 3KHA KHA KHA 2013
LEGEND
TW A
AP S
RW 13-31
"SECTION NO.""PCI NO."
4115PCI = 72
4120PCI = 64
6105PCI = 60
4110PCI = 59
105PCI = 51
4105PCI = 54


APPENDIX D� DISTRICT 10-YEAR MAJOR REHABILITATION NEEDS

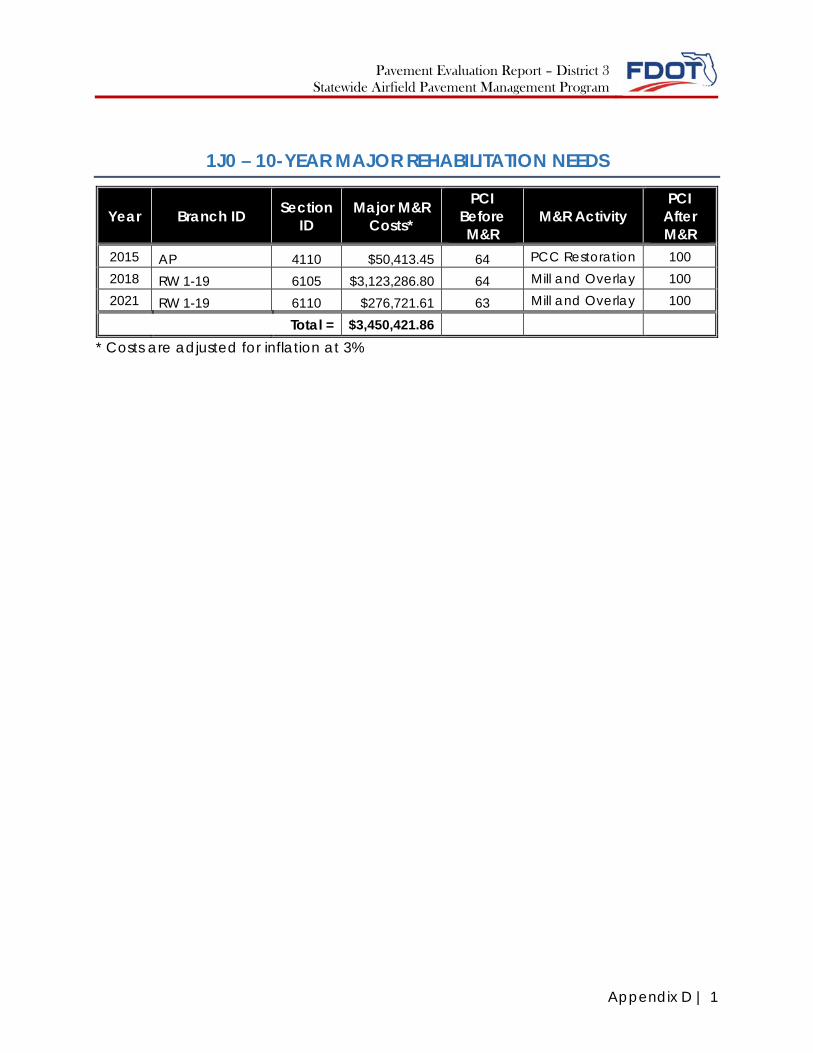
Pavement Evaluation Report – District 3 Statewide Airfield Pavement Management Program
Appendix D | 1
1J0 – 10-YEAR MAJOR REHABILITATION NEEDS
Year Branch ID Section ID
Major M&R Costs*
PCI Before M&R
M&R Activity PCI
After M&R
2015 AP 4110 $50,413.45 64 PCC Restoration 100 2018 RW 1-19 6105 $3,123,286.80 64 Mill and Overlay 100 2021 RW 1-19 6110 $276,721.61 63 Mill and Overlay 100
Total = $3,450,421.86 * Costs are adjusted for inflation at 3%

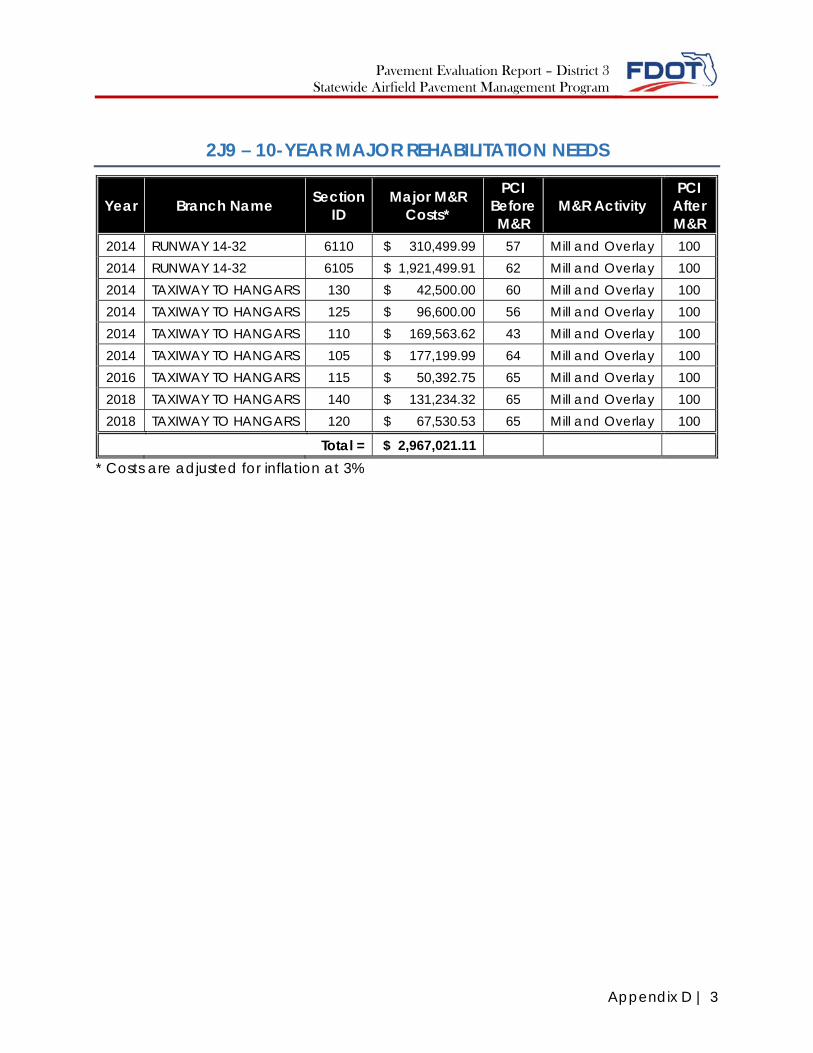
Pavement Evaluation Report – District 3 Statewide Airfield Pavement Management Program
Appendix D | 3
2J9 – 10-YEAR MAJOR REHABILITATION NEEDS
Year Branch Name Section ID
Major M&R Costs*
PCI Before M&R
M&R Activity PCI
After M&R
2014 RUNWAY 14-32 6110 $ 310,499.99 57 Mill and Overlay 100 2014 RUNWAY 14-32 6105 $ 1,921,499.91 62 Mill and Overlay 100 2014 TAXIWAY TO HANGARS 130 $ 42,500.00 60 Mill and Overlay 100 2014 TAXIWAY TO HANGARS 125 $ 96,600.00 56 Mill and Overlay 100 2014 TAXIWAY TO HANGARS 110 $ 169,563.62 43 Mill and Overlay 100 2014 TAXIWAY TO HANGARS 105 $ 177,199.99 64 Mill and Overlay 100 2016 TAXIWAY TO HANGARS 115 $ 50,392.75 65 Mill and Overlay 100 2018 TAXIWAY TO HANGARS 140 $ 131,234.32 65 Mill and Overlay 100 2018 TAXIWAY TO HANGARS 120 $ 67,530.53 65 Mill and Overlay 100
Total = $ 2,967,021.11 * Costs are adjusted for inflation at 3%

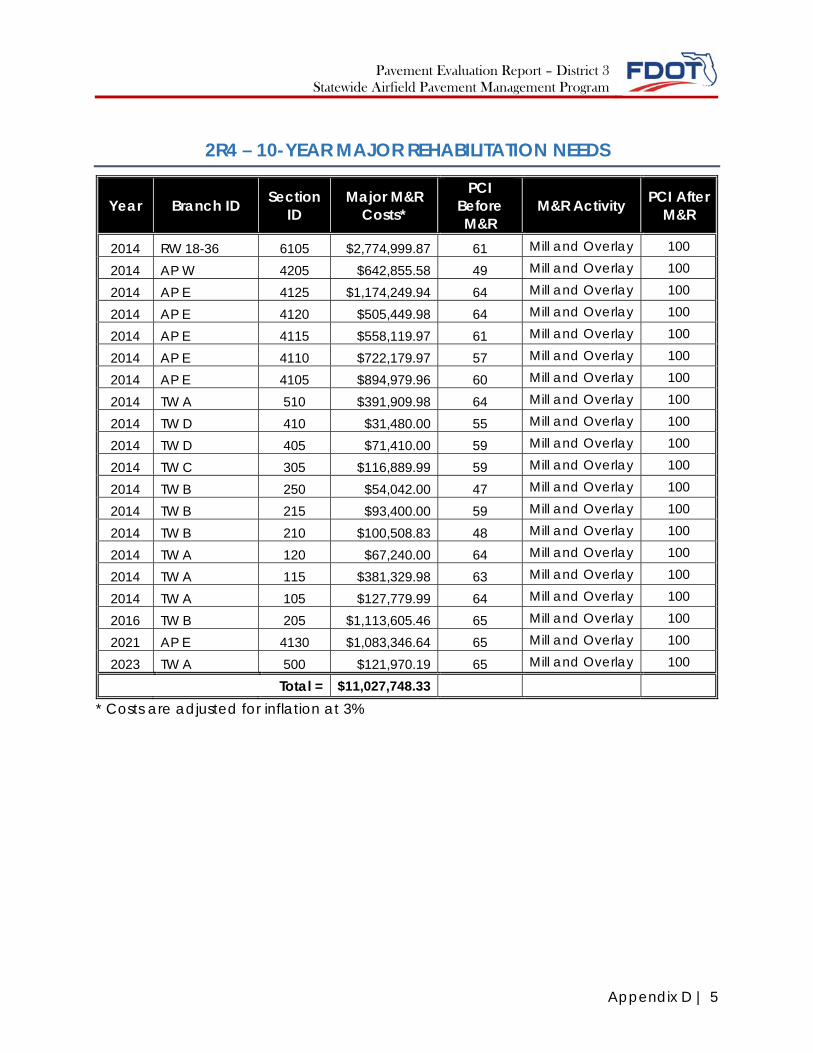
Pavement Evaluation Report – District 3 Statewide Airfield Pavement Management Program
Appendix D | 5
2R4 – 10-YEAR MAJOR REHABILITATION NEEDS
Year Branch ID Section ID
Major M&R Costs*
PCI Before M&R
M&R Activity PCI After M&R
2014 RW 18-36 6105 $2,774,999.87 61 Mill and Overlay 100
2014 AP W 4205 $642,855.58 49 Mill and Overlay 100
2014 AP E 4125 $1,174,249.94 64 Mill and Overlay 100
2014 AP E 4120 $505,449.98 64 Mill and Overlay 100
2014 AP E 4115 $558,119.97 61 Mill and Overlay 100
2014 AP E 4110 $722,179.97 57 Mill and Overlay 100
2014 AP E 4105 $894,979.96 60 Mill and Overlay 100
2014 TW A 510 $391,909.98 64 Mill and Overlay 100
2014 TW D 410 $31,480.00 55 Mill and Overlay 100
2014 TW D 405 $71,410.00 59 Mill and Overlay 100
2014 TW C 305 $116,889.99 59 Mill and Overlay 100
2014 TW B 250 $54,042.00 47 Mill and Overlay 100
2014 TW B 215 $93,400.00 59 Mill and Overlay 100
2014 TW B 210 $100,508.83 48 Mill and Overlay 100
2014 TW A 120 $67,240.00 64 Mill and Overlay 100
2014 TW A 115 $381,329.98 63 Mill and Overlay 100
2014 TW A 105 $127,779.99 64 Mill and Overlay 100
2016 TW B 205 $1,113,605.46 65 Mill and Overlay 100
2021 AP E 4130 $1,083,346.64 65 Mill and Overlay 100
2023 TW A 500 $121,970.19 65 Mill and Overlay 100
Total = $11,027,748.33 * Costs are adjusted for inflation at 3%

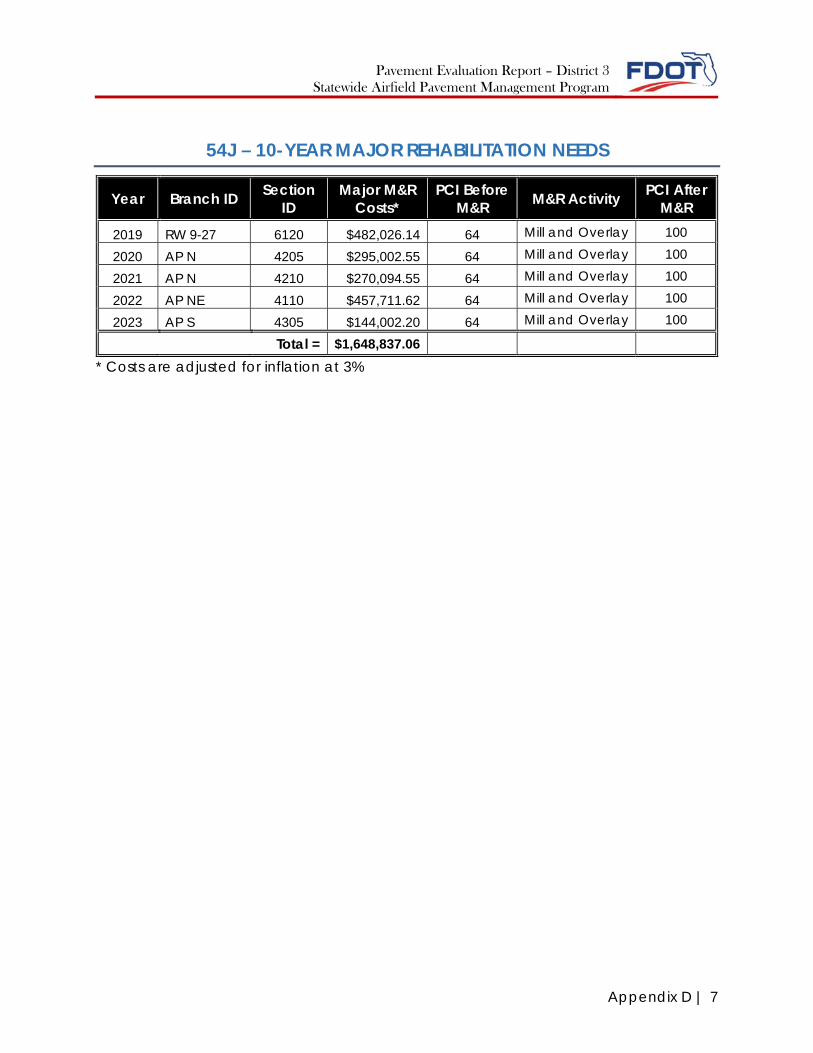
Pavement Evaluation Report – District 3 Statewide Airfield Pavement Management Program
Appendix D | 7
54J – 10-YEAR MAJOR REHABILITATION NEEDS
Year Branch ID Section ID
Major M&R Costs*
PCI Before M&R M&R Activity PCI After
M&R
2019 RW 9-27 6120 $482,026.14 64 Mill and Overlay 100
2020 AP N 4205 $295,002.55 64 Mill and Overlay 100
2021 AP N 4210 $270,094.55 64 Mill and Overlay 100
2022 AP NE 4110 $457,711.62 64 Mill and Overlay 100
2023 AP S 4305 $144,002.20 64 Mill and Overlay 100
Total = $1,648,837.06 * Costs are adjusted for inflation at 3%

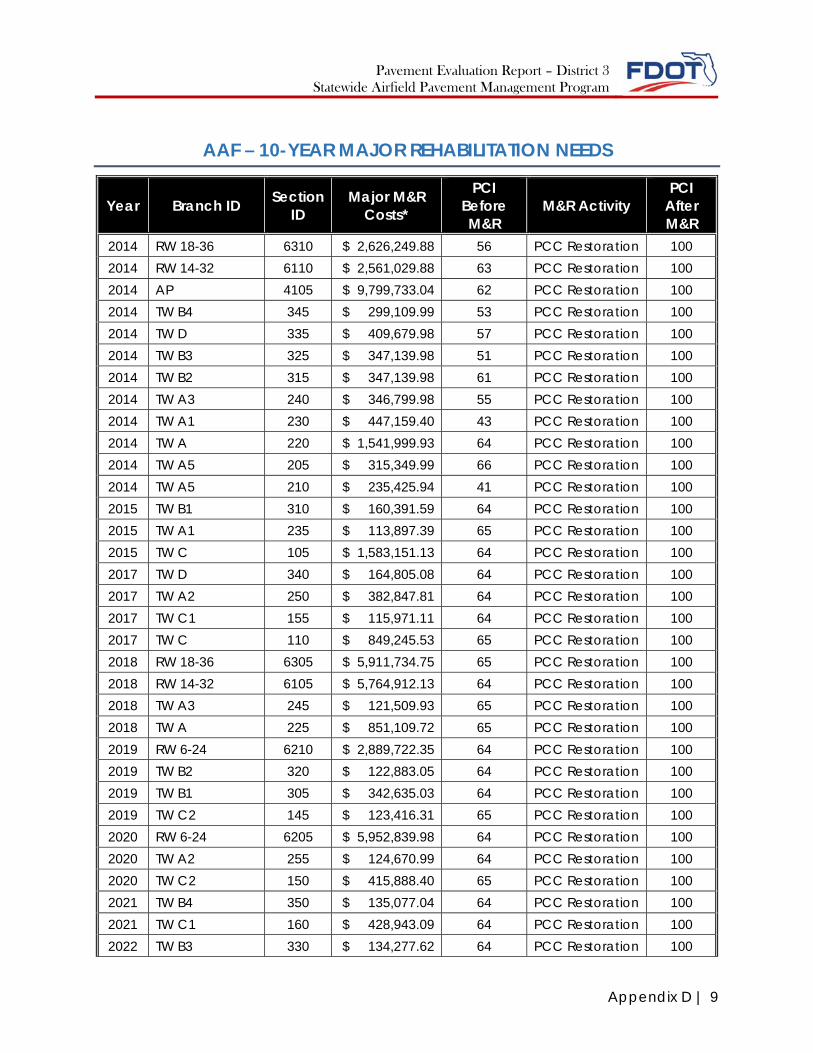
Pavement Evaluation Report – District 3 Statewide Airfield Pavement Management Program
Appendix D | 9
AAF – 10-YEAR MAJOR REHABILITATION NEEDS
Year Branch ID Section ID
Major M&R Costs*
PCI Before M&R
M&R Activity PCI
After M&R
2014 RW 18-36 6310 $ 2,626,249.88 56 PCC Restoration 100 2014 RW 14-32 6110 $ 2,561,029.88 63 PCC Restoration 100 2014 AP 4105 $ 9,799,733.04 62 PCC Restoration 100 2014 TW B4 345 $ 299,109.99 53 PCC Restoration 100 2014 TW D 335 $ 409,679.98 57 PCC Restoration 100 2014 TW B3 325 $ 347,139.98 51 PCC Restoration 100 2014 TW B2 315 $ 347,139.98 61 PCC Restoration 100 2014 TW A3 240 $ 346,799.98 55 PCC Restoration 100 2014 TW A1 230 $ 447,159.40 43 PCC Restoration 100 2014 TW A 220 $ 1,541,999.93 64 PCC Restoration 100 2014 TW A5 205 $ 315,349.99 66 PCC Restoration 100 2014 TW A5 210 $ 235,425.94 41 PCC Restoration 100 2015 TW B1 310 $ 160,391.59 64 PCC Restoration 100 2015 TW A1 235 $ 113,897.39 65 PCC Restoration 100 2015 TW C 105 $ 1,583,151.13 64 PCC Restoration 100 2017 TW D 340 $ 164,805.08 64 PCC Restoration 100 2017 TW A2 250 $ 382,847.81 64 PCC Restoration 100 2017 TW C1 155 $ 115,971.11 64 PCC Restoration 100 2017 TW C 110 $ 849,245.53 65 PCC Restoration 100 2018 RW 18-36 6305 $ 5,911,734.75 65 PCC Restoration 100 2018 RW 14-32 6105 $ 5,764,912.13 64 PCC Restoration 100 2018 TW A3 245 $ 121,509.93 65 PCC Restoration 100 2018 TW A 225 $ 851,109.72 65 PCC Restoration 100 2019 RW 6-24 6210 $ 2,889,722.35 64 PCC Restoration 100 2019 TW B2 320 $ 122,883.05 64 PCC Restoration 100 2019 TW B1 305 $ 342,635.03 64 PCC Restoration 100 2019 TW C2 145 $ 123,416.31 65 PCC Restoration 100 2020 RW 6-24 6205 $ 5,952,839.98 64 PCC Restoration 100 2020 TW A2 255 $ 124,670.99 64 PCC Restoration 100 2020 TW C2 150 $ 415,888.40 65 PCC Restoration 100 2021 TW B4 350 $ 135,077.04 64 PCC Restoration 100 2021 TW C1 160 $ 428,943.09 64 PCC Restoration 100 2022 TW B3 330 $ 134,277.62 64 PCC Restoration 100
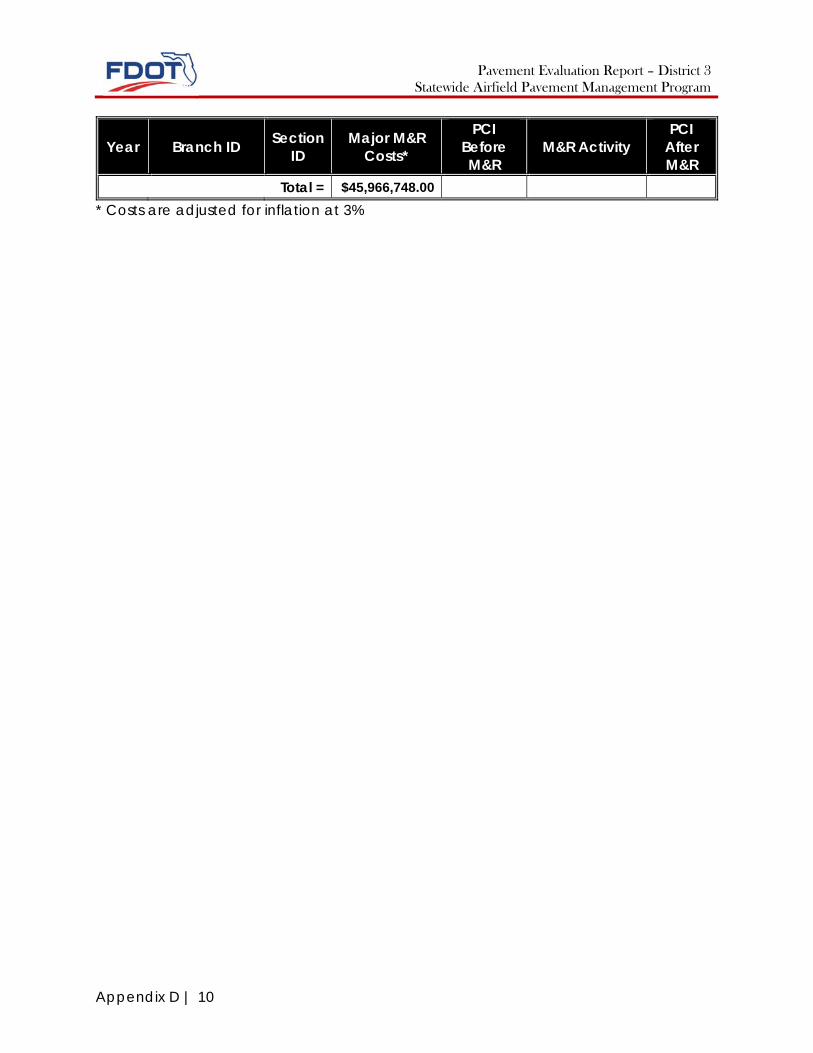
Pavement Evaluation Report – District 3 Statewide Airfield Pavement Management Program
Appendix D | 10
Year Branch ID Section ID
Major M&R Costs*
PCI Before M&R
M&R Activity PCI
After M&R
Total = $45,966,748.00 * Costs are adjusted for inflation at 3%
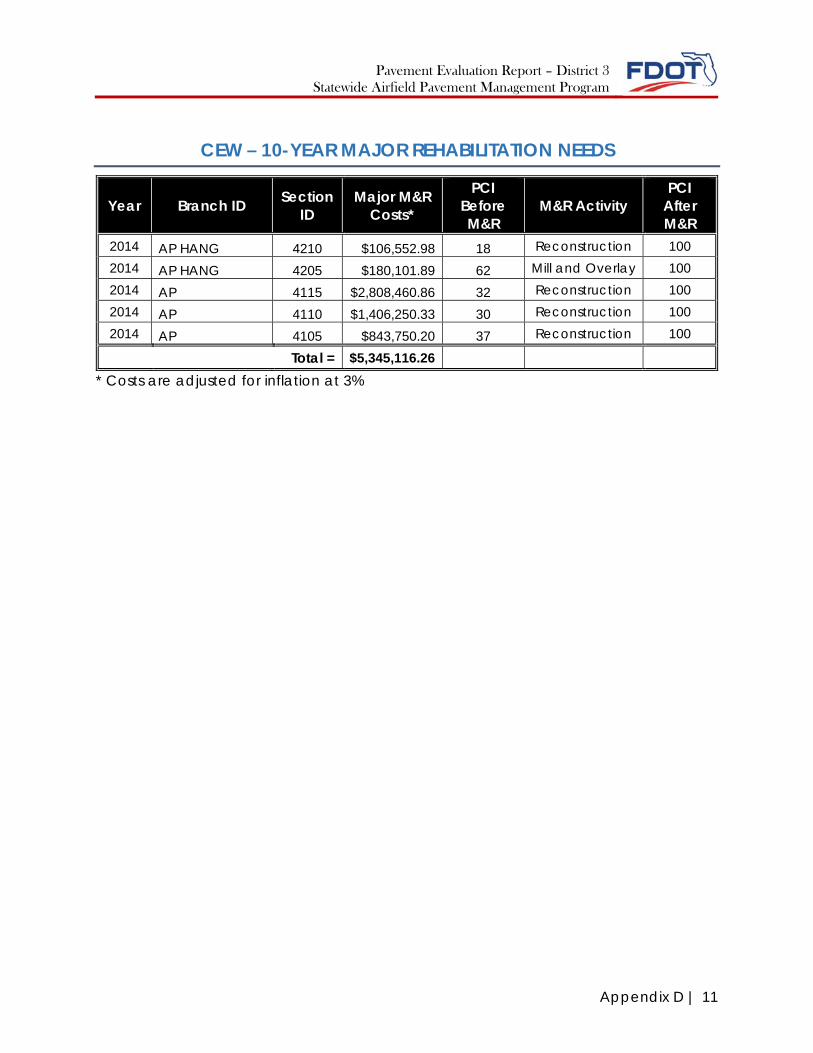
Pavement Evaluation Report – District 3 Statewide Airfield Pavement Management Program
Appendix D | 11
CEW – 10-YEAR MAJOR REHABILITATION NEEDS
Year Branch ID Section ID
Major M&R Costs*
PCI Before M&R
M&R Activity PCI
After M&R
2014 AP HANG 4210 $106,552.98 18 Reconstruction 100 2014 AP HANG 4205 $180,101.89 62 Mill and Overlay 100 2014 AP 4115 $2,808,460.86 32 Reconstruction 100 2014 AP 4110 $1,406,250.33 30 Reconstruction 100 2014 AP 4105 $843,750.20 37 Reconstruction 100
Total = $5,345,116.26 * Costs are adjusted for inflation at 3%

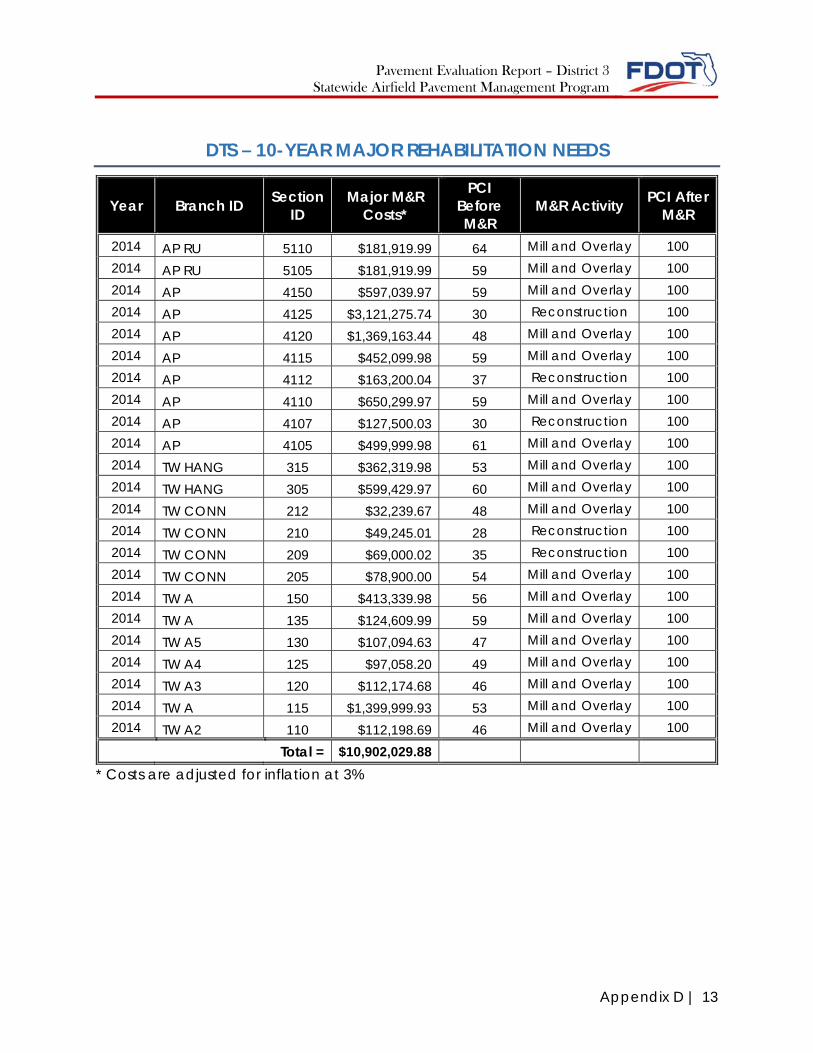
Pavement Evaluation Report – District 3 Statewide Airfield Pavement Management Program
Appendix D | 13
DTS – 10-YEAR MAJOR REHABILITATION NEEDS
Year Branch ID Section ID
Major M&R Costs*
PCI Before M&R
M&R Activity PCI After M&R
2014 AP RU 5110 $181,919.99 64 Mill and Overlay 100 2014 AP RU 5105 $181,919.99 59 Mill and Overlay 100 2014 AP 4150 $597,039.97 59 Mill and Overlay 100 2014 AP 4125 $3,121,275.74 30 Reconstruction 100 2014 AP 4120 $1,369,163.44 48 Mill and Overlay 100 2014 AP 4115 $452,099.98 59 Mill and Overlay 100 2014 AP 4112 $163,200.04 37 Reconstruction 100 2014 AP 4110 $650,299.97 59 Mill and Overlay 100 2014 AP 4107 $127,500.03 30 Reconstruction 100 2014 AP 4105 $499,999.98 61 Mill and Overlay 100 2014 TW HANG 315 $362,319.98 53 Mill and Overlay 100 2014 TW HANG 305 $599,429.97 60 Mill and Overlay 100 2014 TW CONN 212 $32,239.67 48 Mill and Overlay 100 2014 TW CONN 210 $49,245.01 28 Reconstruction 100 2014 TW CONN 209 $69,000.02 35 Reconstruction 100 2014 TW CONN 205 $78,900.00 54 Mill and Overlay 100 2014 TW A 150 $413,339.98 56 Mill and Overlay 100 2014 TW A 135 $124,609.99 59 Mill and Overlay 100 2014 TW A5 130 $107,094.63 47 Mill and Overlay 100 2014 TW A4 125 $97,058.20 49 Mill and Overlay 100 2014 TW A3 120 $112,174.68 46 Mill and Overlay 100 2014 TW A 115 $1,399,999.93 53 Mill and Overlay 100 2014 TW A2 110 $112,198.69 46 Mill and Overlay 100
Total = $10,902,029.88 * Costs are adjusted for inflation at 3%

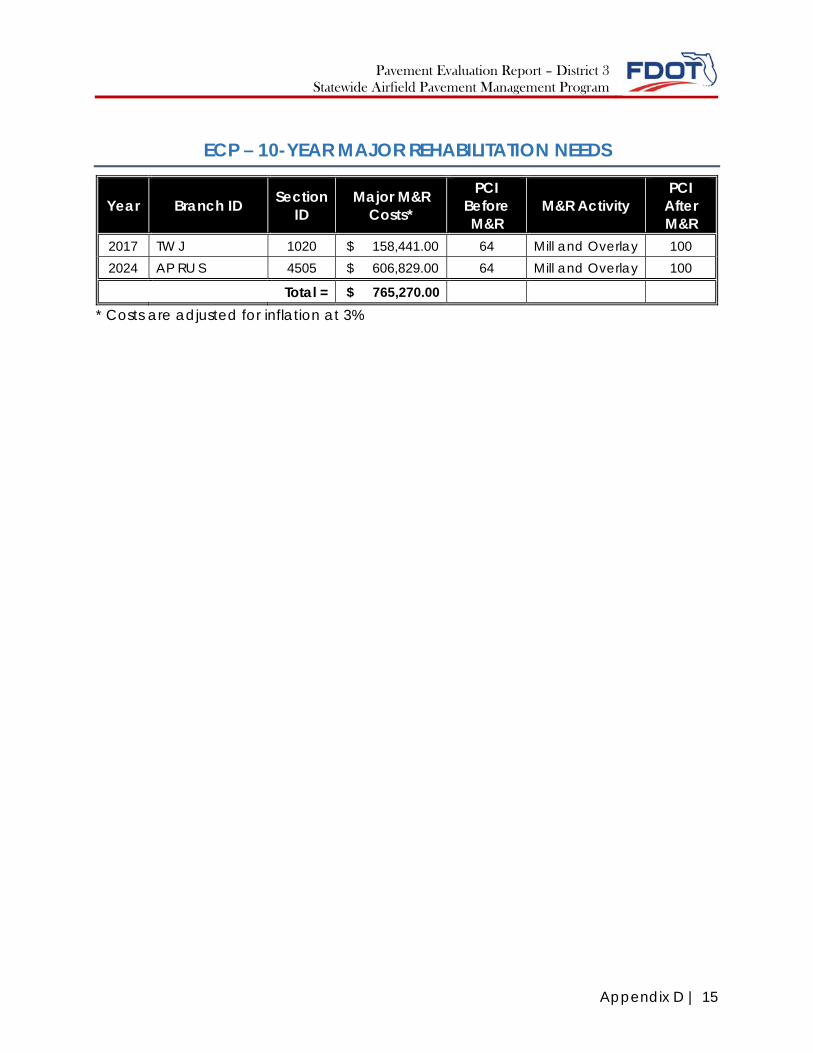
Pavement Evaluation Report – District 3 Statewide Airfield Pavement Management Program
Appendix D | 15
ECP – 10-YEAR MAJOR REHABILITATION NEEDS
Year Branch ID Section ID
Major M&R Costs*
PCI Before M&R
M&R Activity PCI
After M&R
2017 TW J 1020 $ 158,441.00 64 Mill and Overlay 100 2024 AP RU S 4505 $ 606,829.00 64 Mill and Overlay 100
Total = $ 765,270.00 * Costs are adjusted for inflation at 3%

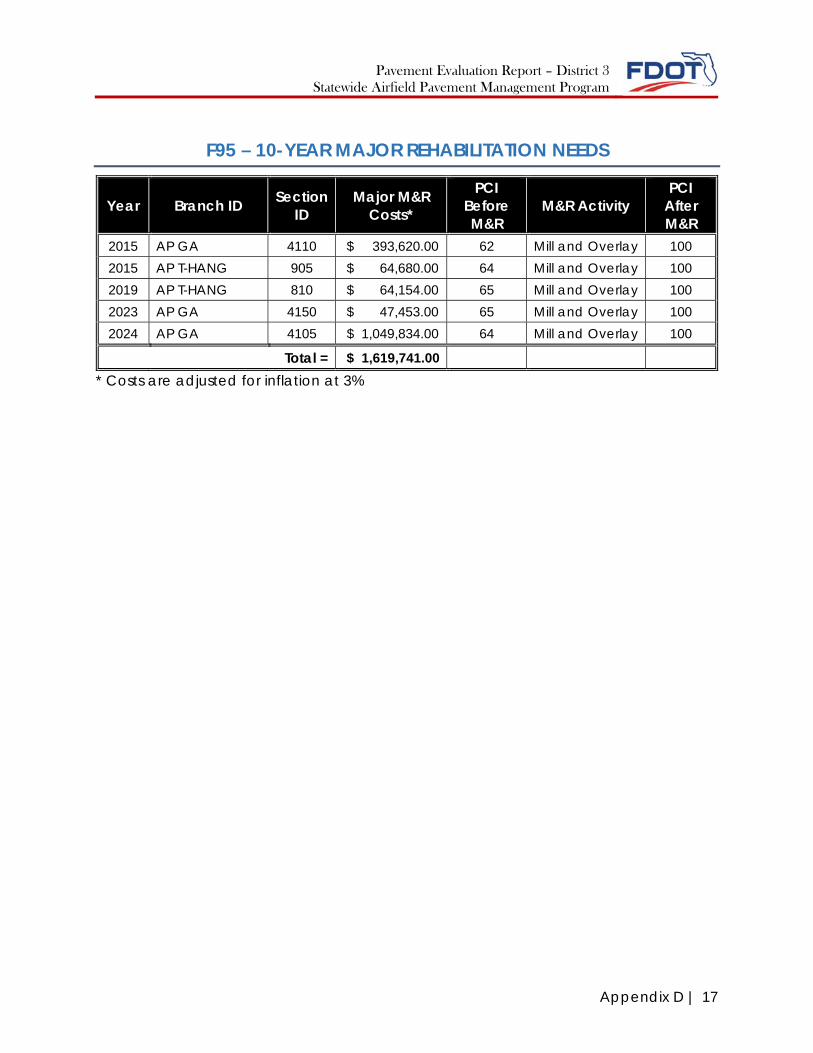
Pavement Evaluation Report – District 3 Statewide Airfield Pavement Management Program
Appendix D | 17
F95 – 10-YEAR MAJOR REHABILITATION NEEDS
Year Branch ID Section ID
Major M&R Costs*
PCI Before M&R
M&R Activity PCI
After M&R
2015 AP GA 4110 $ 393,620.00 62 Mill and Overlay 100 2015 AP T-HANG 905 $ 64,680.00 64 Mill and Overlay 100 2019 AP T-HANG 810 $ 64,154.00 65 Mill and Overlay 100 2023 AP GA 4150 $ 47,453.00 65 Mill and Overlay 100 2024 AP GA 4105 $ 1,049,834.00 64 Mill and Overlay 100
Total = $ 1,619,741.00 * Costs are adjusted for inflation at 3%

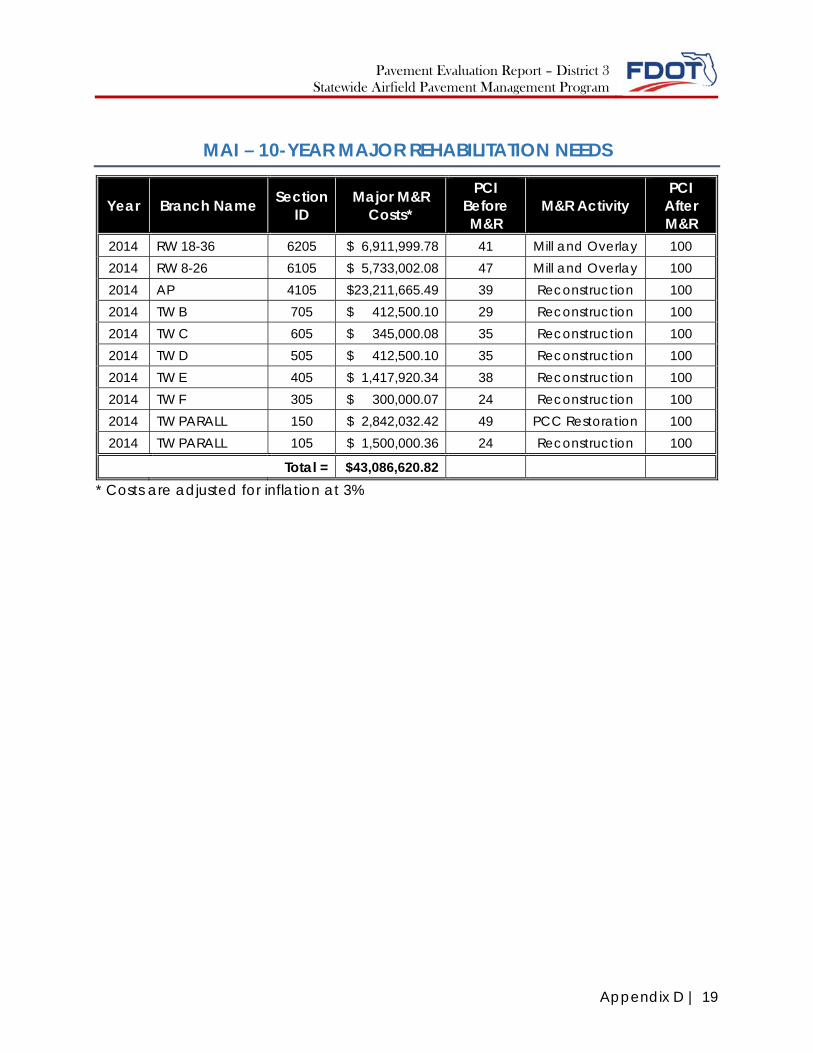
Pavement Evaluation Report – District 3 Statewide Airfield Pavement Management Program
Appendix D | 19
MAI – 10-YEAR MAJOR REHABILITATION NEEDS
Year Branch Name Section ID
Major M&R Costs*
PCI Before M&R
M&R Activity PCI
After M&R
2014 RW 18-36 6205 $ 6,911,999.78 41 Mill and Overlay 100 2014 RW 8-26 6105 $ 5,733,002.08 47 Mill and Overlay 100 2014 AP 4105 $23,211,665.49 39 Reconstruction 100 2014 TW B 705 $ 412,500.10 29 Reconstruction 100 2014 TW C 605 $ 345,000.08 35 Reconstruction 100 2014 TW D 505 $ 412,500.10 35 Reconstruction 100 2014 TW E 405 $ 1,417,920.34 38 Reconstruction 100 2014 TW F 305 $ 300,000.07 24 Reconstruction 100 2014 TW PARALL 150 $ 2,842,032.42 49 PCC Restoration 100 2014 TW PARALL 105 $ 1,500,000.36 24 Reconstruction 100
Total = $43,086,620.82 * Costs are adjusted for inflation at 3%

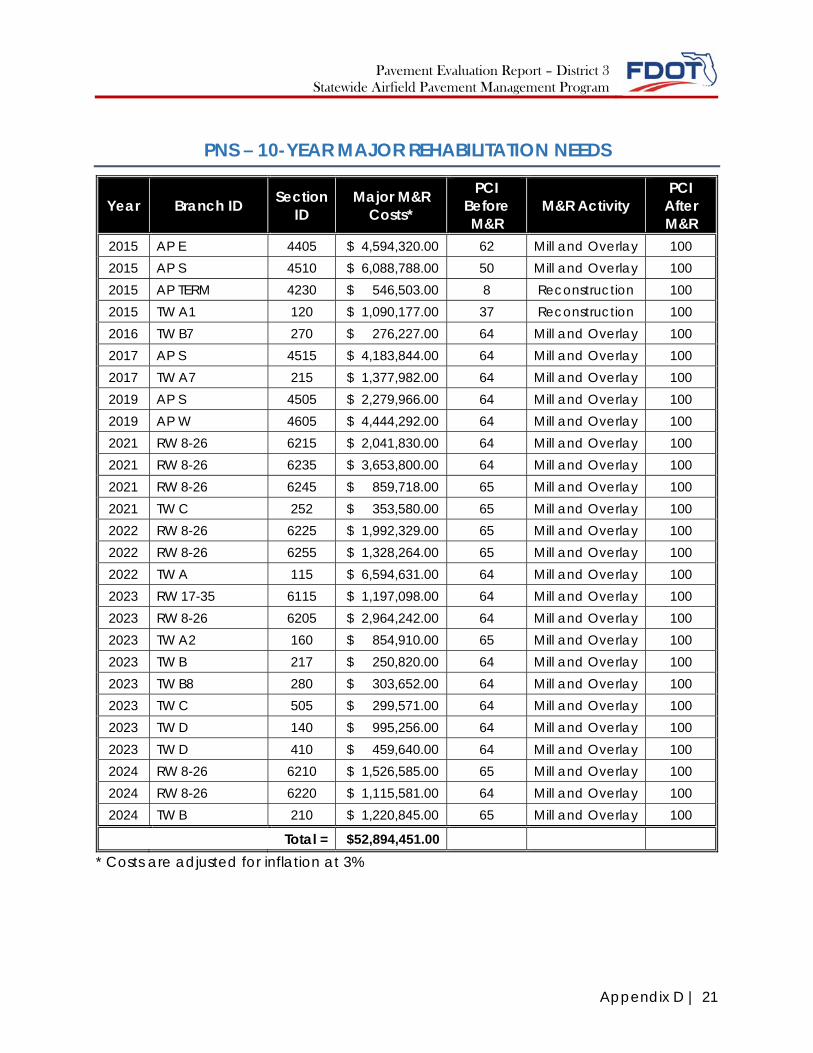
Pavement Evaluation Report – District 3 Statewide Airfield Pavement Management Program
Appendix D | 21
PNS – 10-YEAR MAJOR REHABILITATION NEEDS
Year Branch ID Section ID
Major M&R Costs*
PCI Before M&R
M&R Activity PCI
After M&R
2015 AP E 4405 $ 4,594,320.00 62 Mill and Overlay 100 2015 AP S 4510 $ 6,088,788.00 50 Mill and Overlay 100 2015 AP TERM 4230 $ 546,503.00 8 Reconstruction 100 2015 TW A1 120 $ 1,090,177.00 37 Reconstruction 100 2016 TW B7 270 $ 276,227.00 64 Mill and Overlay 100 2017 AP S 4515 $ 4,183,844.00 64 Mill and Overlay 100 2017 TW A7 215 $ 1,377,982.00 64 Mill and Overlay 100 2019 AP S 4505 $ 2,279,966.00 64 Mill and Overlay 100 2019 AP W 4605 $ 4,444,292.00 64 Mill and Overlay 100 2021 RW 8-26 6215 $ 2,041,830.00 64 Mill and Overlay 100 2021 RW 8-26 6235 $ 3,653,800.00 64 Mill and Overlay 100 2021 RW 8-26 6245 $ 859,718.00 65 Mill and Overlay 100 2021 TW C 252 $ 353,580.00 65 Mill and Overlay 100 2022 RW 8-26 6225 $ 1,992,329.00 65 Mill and Overlay 100 2022 RW 8-26 6255 $ 1,328,264.00 65 Mill and Overlay 100 2022 TW A 115 $ 6,594,631.00 64 Mill and Overlay 100 2023 RW 17-35 6115 $ 1,197,098.00 64 Mill and Overlay 100 2023 RW 8-26 6205 $ 2,964,242.00 64 Mill and Overlay 100 2023 TW A2 160 $ 854,910.00 65 Mill and Overlay 100 2023 TW B 217 $ 250,820.00 64 Mill and Overlay 100 2023 TW B8 280 $ 303,652.00 64 Mill and Overlay 100 2023 TW C 505 $ 299,571.00 64 Mill and Overlay 100 2023 TW D 140 $ 995,256.00 64 Mill and Overlay 100 2023 TW D 410 $ 459,640.00 64 Mill and Overlay 100 2024 RW 8-26 6210 $ 1,526,585.00 65 Mill and Overlay 100 2024 RW 8-26 6220 $ 1,115,581.00 64 Mill and Overlay 100 2024 TW B 210 $ 1,220,845.00 65 Mill and Overlay 100
Total = $52,894,451.00 * Costs are adjusted for inflation at 3%

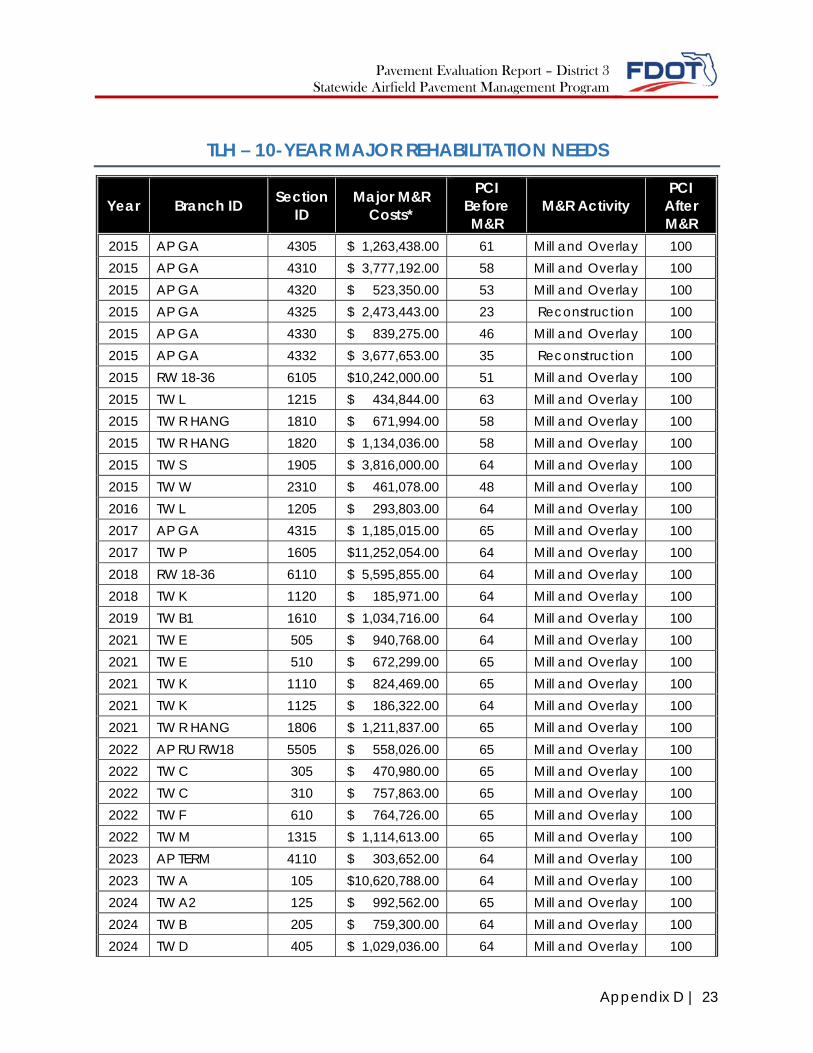
Pavement Evaluation Report – District 3 Statewide Airfield Pavement Management Program
Appendix D | 23
TLH – 10-YEAR MAJOR REHABILITATION NEEDS
Year Branch ID Section ID
Major M&R Costs*
PCI Before M&R
M&R Activity PCI
After M&R
2015 AP GA 4305 $ 1,263,438.00 61 Mill and Overlay 100 2015 AP GA 4310 $ 3,777,192.00 58 Mill and Overlay 100 2015 AP GA 4320 $ 523,350.00 53 Mill and Overlay 100 2015 AP GA 4325 $ 2,473,443.00 23 Reconstruction 100 2015 AP GA 4330 $ 839,275.00 46 Mill and Overlay 100 2015 AP GA 4332 $ 3,677,653.00 35 Reconstruction 100 2015 RW 18-36 6105 $10,242,000.00 51 Mill and Overlay 100 2015 TW L 1215 $ 434,844.00 63 Mill and Overlay 100 2015 TW R HANG 1810 $ 671,994.00 58 Mill and Overlay 100 2015 TW R HANG 1820 $ 1,134,036.00 58 Mill and Overlay 100 2015 TW S 1905 $ 3,816,000.00 64 Mill and Overlay 100 2015 TW W 2310 $ 461,078.00 48 Mill and Overlay 100 2016 TW L 1205 $ 293,803.00 64 Mill and Overlay 100 2017 AP GA 4315 $ 1,185,015.00 65 Mill and Overlay 100 2017 TW P 1605 $11,252,054.00 64 Mill and Overlay 100 2018 RW 18-36 6110 $ 5,595,855.00 64 Mill and Overlay 100 2018 TW K 1120 $ 185,971.00 64 Mill and Overlay 100 2019 TW B1 1610 $ 1,034,716.00 64 Mill and Overlay 100 2021 TW E 505 $ 940,768.00 64 Mill and Overlay 100 2021 TW E 510 $ 672,299.00 65 Mill and Overlay 100 2021 TW K 1110 $ 824,469.00 65 Mill and Overlay 100 2021 TW K 1125 $ 186,322.00 64 Mill and Overlay 100 2021 TW R HANG 1806 $ 1,211,837.00 65 Mill and Overlay 100 2022 AP RU RW18 5505 $ 558,026.00 65 Mill and Overlay 100 2022 TW C 305 $ 470,980.00 65 Mill and Overlay 100 2022 TW C 310 $ 757,863.00 65 Mill and Overlay 100 2022 TW F 610 $ 764,726.00 65 Mill and Overlay 100 2022 TW M 1315 $ 1,114,613.00 65 Mill and Overlay 100 2023 AP TERM 4110 $ 303,652.00 64 Mill and Overlay 100 2023 TW A 105 $10,620,788.00 64 Mill and Overlay 100 2024 TW A2 125 $ 992,562.00 65 Mill and Overlay 100 2024 TW B 205 $ 759,300.00 64 Mill and Overlay 100 2024 TW D 405 $ 1,029,036.00 64 Mill and Overlay 100
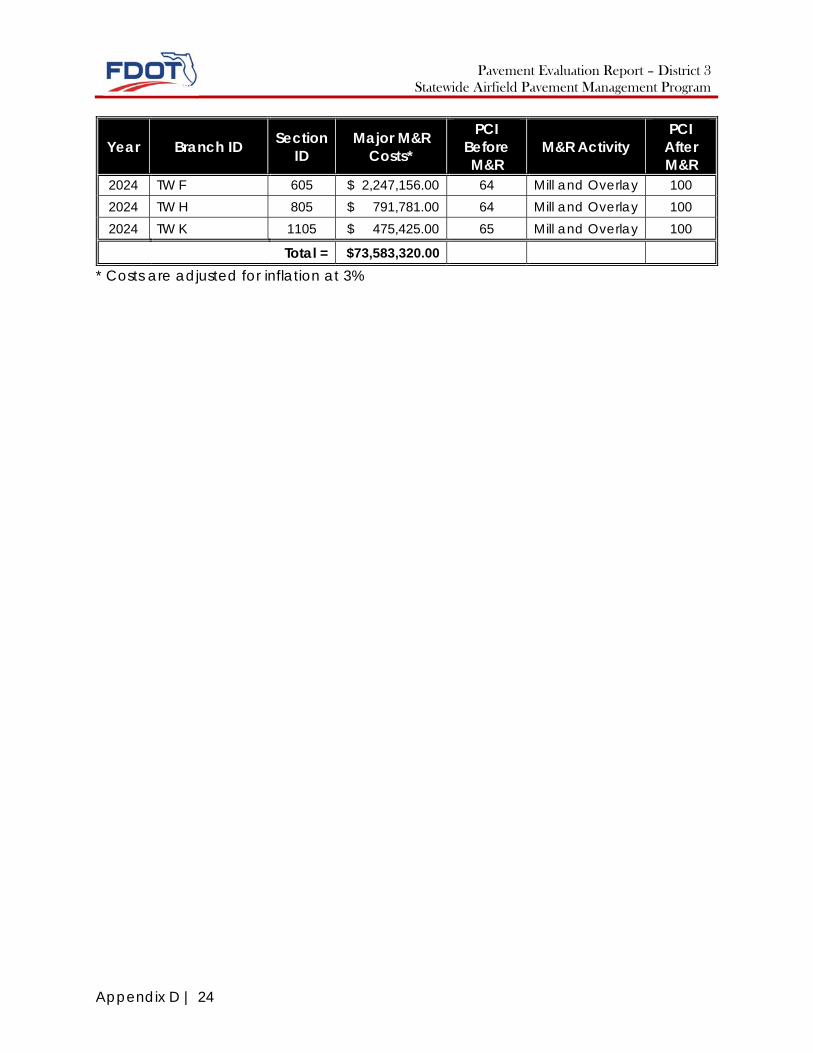
Pavement Evaluation Report – District 3 Statewide Airfield Pavement Management Program
Appendix D | 24
Year Branch ID Section ID
Major M&R Costs*
PCI Before M&R
M&R Activity PCI
After M&R
2024 TW F 605 $ 2,247,156.00 64 Mill and Overlay 100 2024 TW H 805 $ 791,781.00 64 Mill and Overlay 100 2024 TW K 1105 $ 475,425.00 65 Mill and Overlay 100
Total = $73,583,320.00 * Costs are adjusted for inflation at 3%
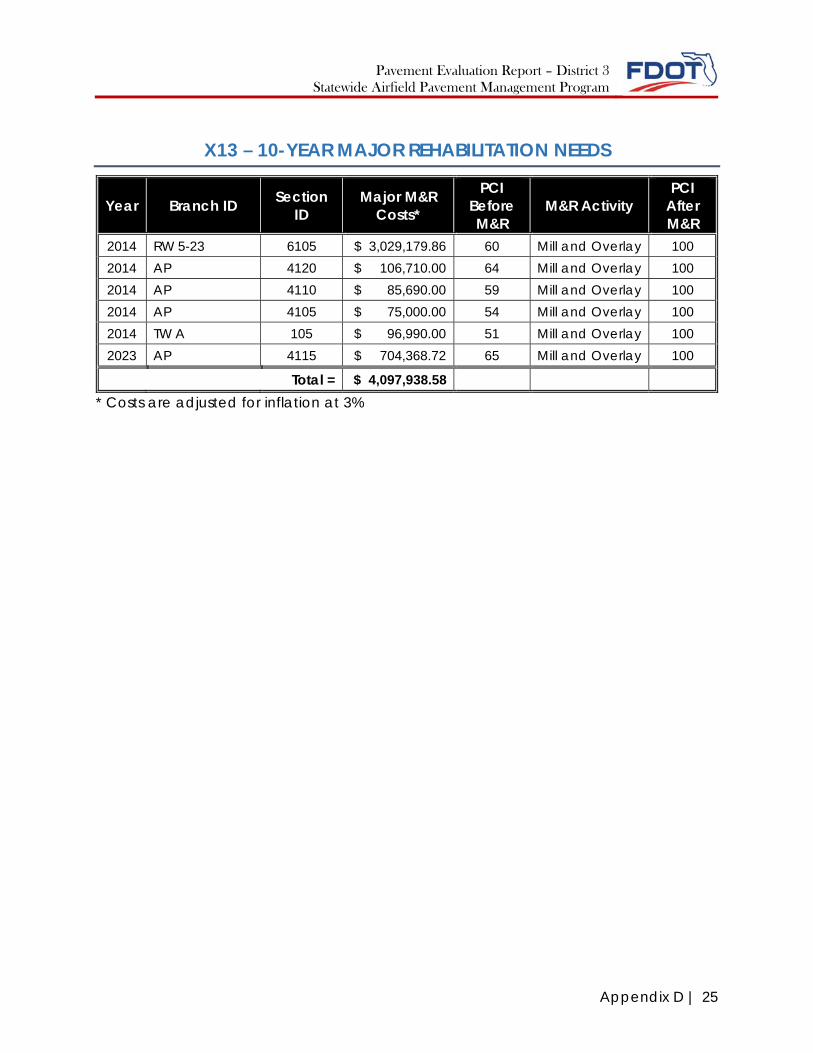
Pavement Evaluation Report – District 3 Statewide Airfield Pavement Management Program
Appendix D | 25
X13 – 10-YEAR MAJOR REHABILITATION NEEDS
Year Branch ID Section ID
Major M&R Costs*
PCI Before M&R
M&R Activity PCI
After M&R
2014 RW 5-23 6105 $ 3,029,179.86 60 Mill and Overlay 100 2014 AP 4120 $ 106,710.00 64 Mill and Overlay 100 2014 AP 4110 $ 85,690.00 59 Mill and Overlay 100 2014 AP 4105 $ 75,000.00 54 Mill and Overlay 100 2014 TW A 105 $ 96,990.00 51 Mill and Overlay 100 2023 AP 4115 $ 704,368.72 65 Mill and Overlay 100
Total = $ 4,097,938.58 * Costs are adjusted for inflation at 3%

APPENDIX E� DISTRICT AIRFIELD PAVEMENT 10-YEAR MAJOR
REHABILITATION EXHIBITS

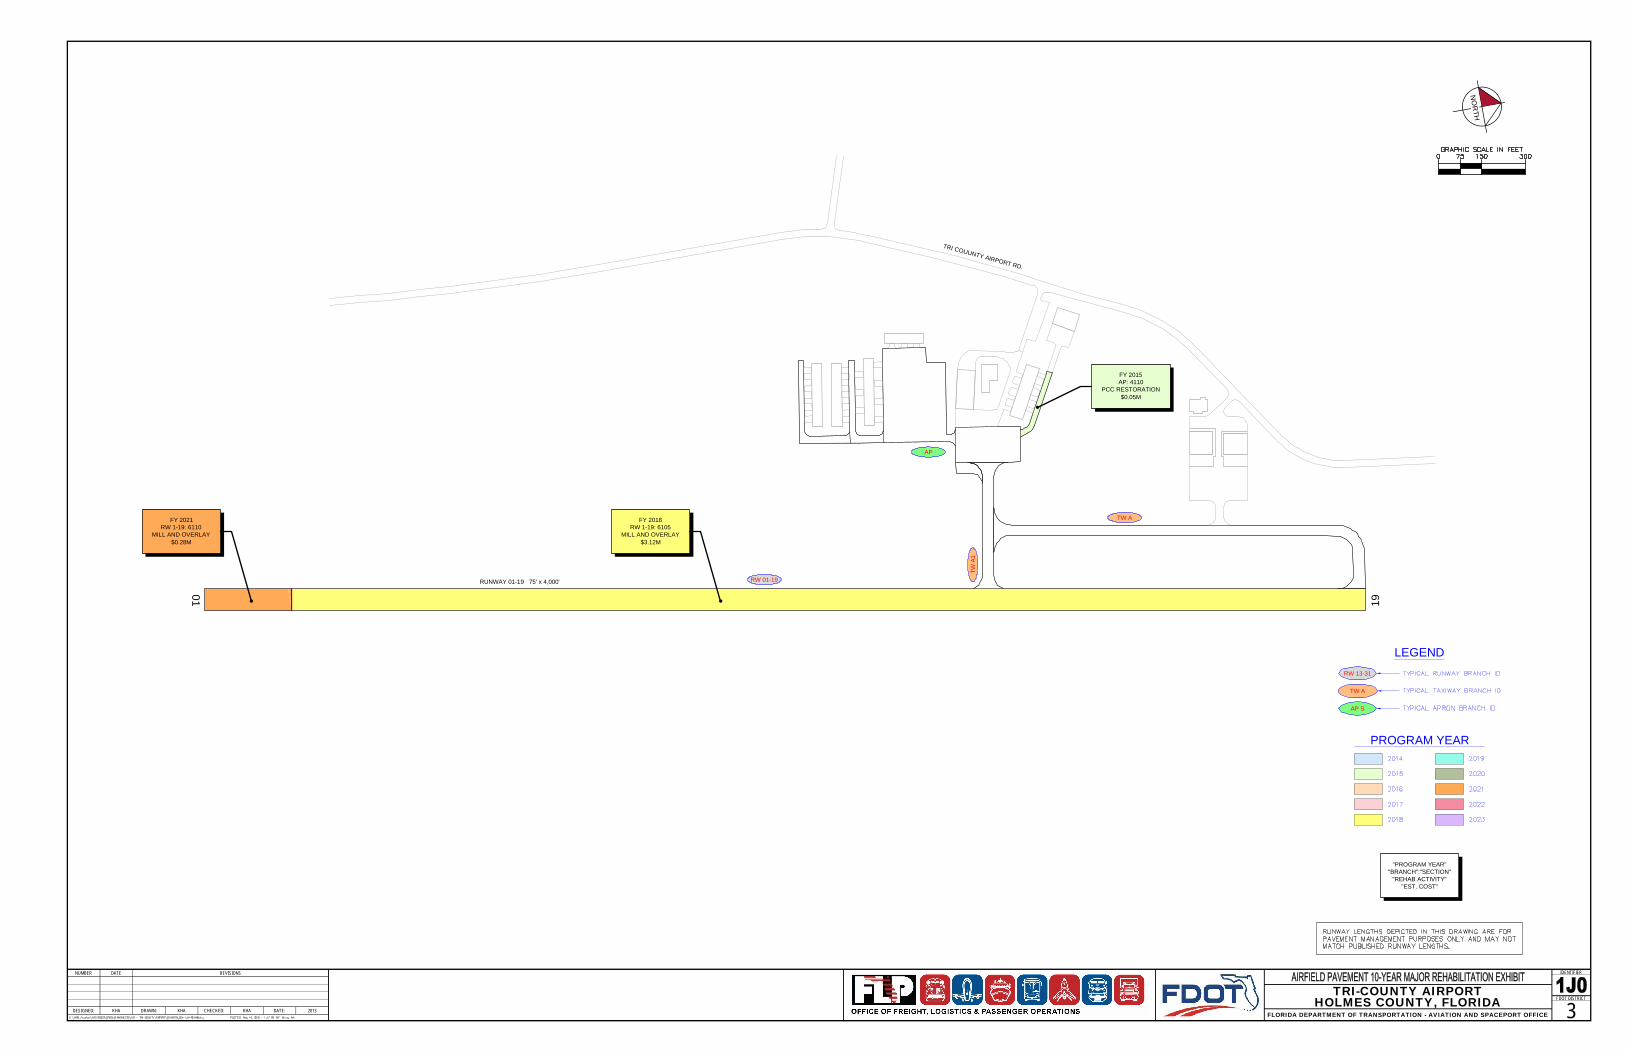
RW 01-19RUNWAY 01-19 75' x 4,000'
TW A
TWA1
AP
19
01
TRI COUUNTY AIRPORT RD.
LEGEND
PROGRAM YEAR
"PROGRAM YEAR""BRANCH":"SECTION"
"REHAB ACTIVITY""EST. COST"
TW A
AP S
RW 13-31
NUMBER DATE REVISIONS
DESIGNED: DRAWN: CHECKED: DATE:
IDENTIFIER
FDOT DISTRICT
NO
RTH
TRI-COUNTY AIRPORTHOLMES COUNTY, FLORIDA
FLORIDA DEPARTMENT OF TRANSPORTATION - AVIATION AND SPACEPORT OFFICE 3KHA KHA KHA 2013
FY 2015AP: 4110
PCC RESTORATION$0.05M
FY 2018RW 1-19: 6105
MILL AND OVERLAY$3.12M
FY 2021RW 1-19: 6110
MILL AND OVERLAY$0.28M

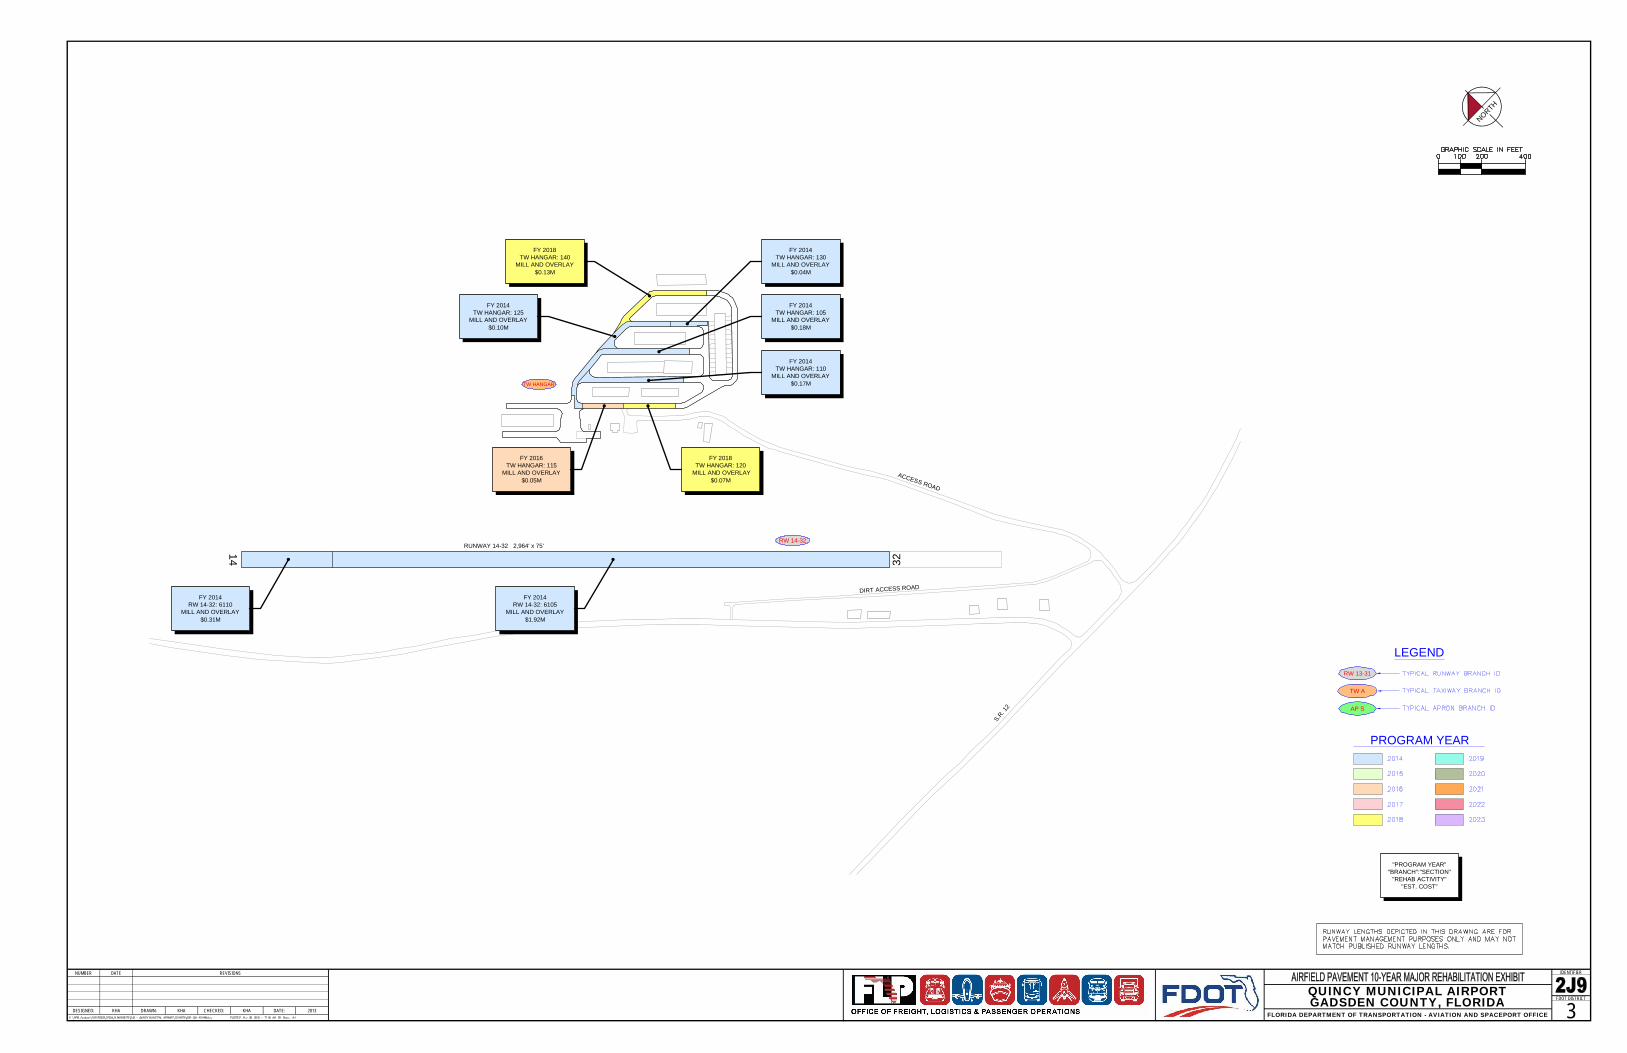
RW 14-32
TW HANGAR
RUNWAY 14-32 2,964' x 75'
DIRT ACCESS ROAD
ACCESS ROAD
S.R. 1
2
14 32
LEGEND
PROGRAM YEAR
"PROGRAM YEAR""BRANCH":"SECTION"
"REHAB ACTIVITY""EST. COST"
TW A
AP S
RW 13-31
NUMBER DATE REVISIONS
DESIGNED: DRAWN: CHECKED: DATE:
IDENTIFIER
FDOT DISTRICT
NORTH
QUINCY MUNICIPAL AIRPORTGADSDEN COUNTY, FLORIDA
FLORIDA DEPARTMENT OF TRANSPORTATION - AVIATION AND SPACEPORT OFFICE 3KHA KHA KHA 2013
FY 2014RW 14-32: 6110
MILL AND OVERLAY$0.31M
FY 2014TW HANGAR: 130
MILL AND OVERLAY$0.04M
FY 2014TW HANGAR: 105
MILL AND OVERLAY$0.18M
FY 2014TW HANGAR: 110
MILL AND OVERLAY$0.17M
FY 2014TW HANGAR: 125
MILL AND OVERLAY$0.10M
FY 2018TW HANGAR: 140
MILL AND OVERLAY$0.13M
FY 2014RW 14-32: 6105
MILL AND OVERLAY$1.92M
FY 2016TW HANGAR: 115
MILL AND OVERLAY$0.05M
FY 2018TW HANGAR: 120
MILL AND OVERLAY$0.07M

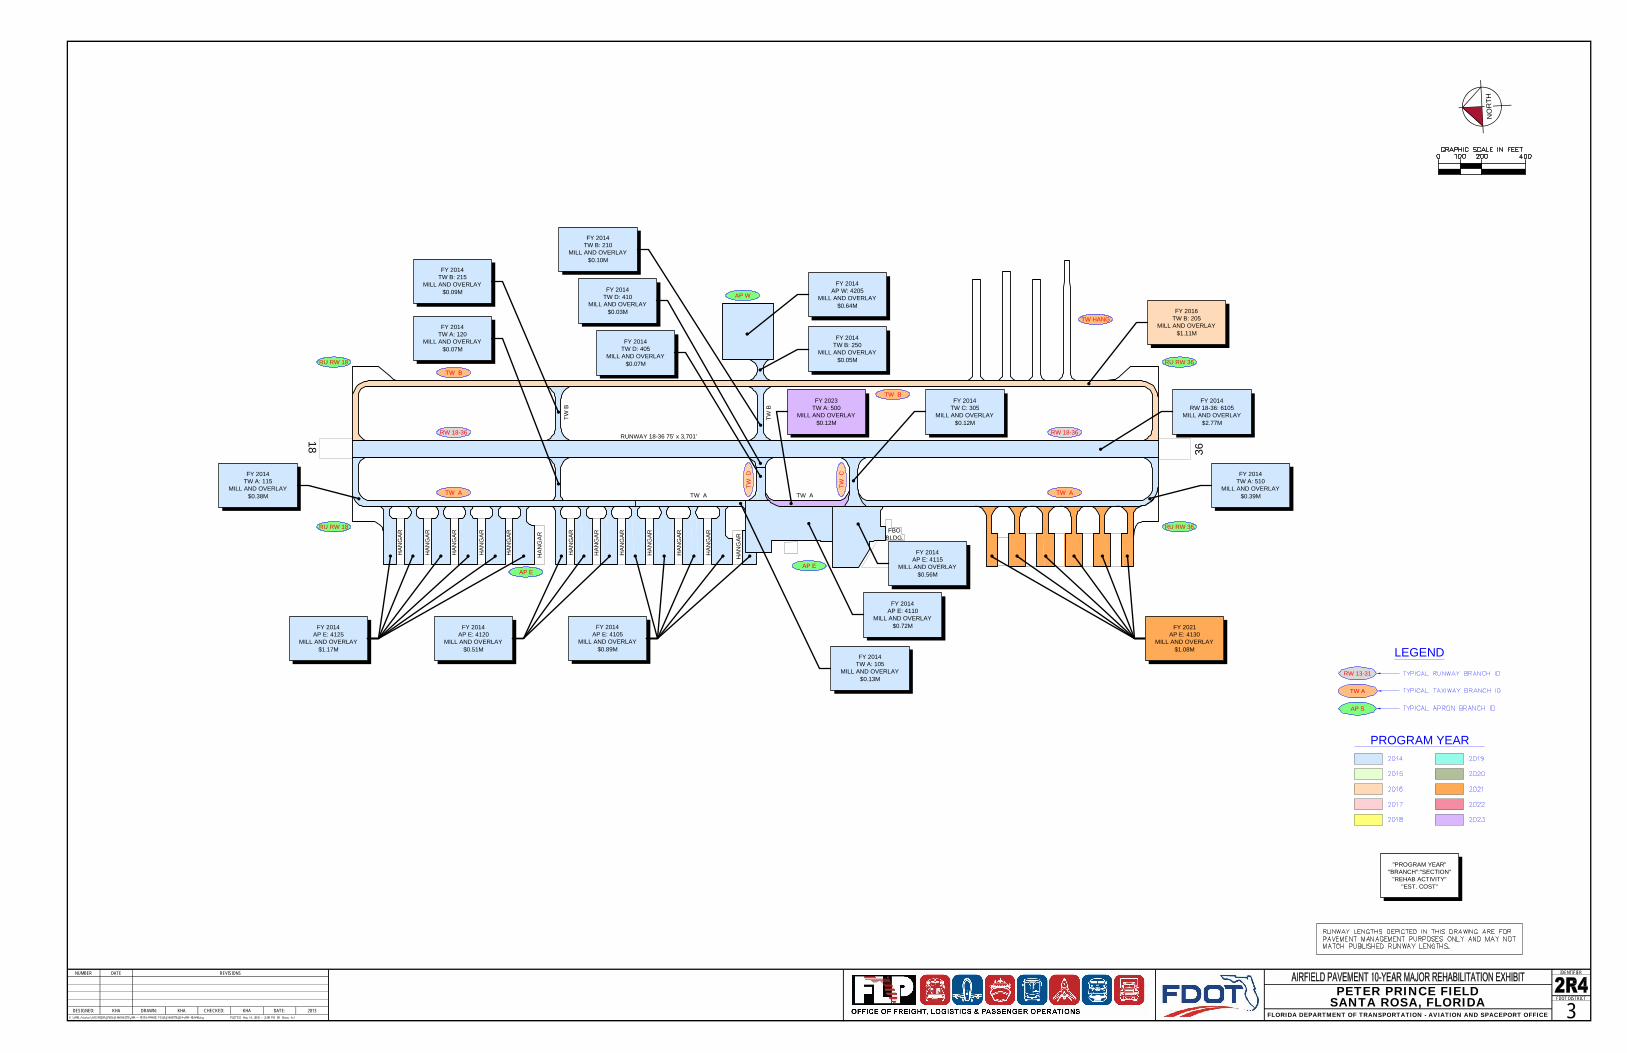
18
36
RUNWAY 18-36 75' x 3,701'
TW A
HA
NG
AR
HA
NG
AR
HA
NG
AR
HA
NG
AR
HA
NG
AR
HA
NG
AR
HA
NG
AR
HA
NG
AR
HA
NG
AR
HA
NG
AR
HA
NG
AR
HA
NG
AR
HA
NG
AR
TW A
FBOBLDG.
TW A
RW 18-36
TW B
TW A
RW 18-36
TW B
TWC
TWD
RU RW 18
RU RW 18
RU RW 36
RU RW 36
AP W
AP EAP E
TWB
TWB
TW HANG
LEGEND
PROGRAM YEAR
"PROGRAM YEAR""BRANCH":"SECTION"
"REHAB ACTIVITY""EST. COST"
TW A
AP S
RW 13-31
NUMBER DATE REVISIONS
DESIGNED: DRAWN: CHECKED: DATE:
IDENTIFIER
FDOT DISTRICT
NO
RTH
PETER PRINCE FIELDSANTA ROSA, FLORIDA
FLORIDA DEPARTMENT OF TRANSPORTATION - AVIATION AND SPACEPORT OFFICE 3KHA KHA KHA 2013
FY 2014AP W: 4205
MILL AND OVERLAY$0.64M
FY 2014TW C: 305
MILL AND OVERLAY$0.12M
FY 2014TW D: 405
MILL AND OVERLAY$0.07M
FY 2014TW A: 120
MILL AND OVERLAY$0.07M
FY 2014RW 18-36: 6105
MILL AND OVERLAY$2.77M
FY 2014TW B: 215
MILL AND OVERLAY$0.09M FY 2014
TW D: 410MILL AND OVERLAY
$0.03M
FY 2014TW A: 510
MILL AND OVERLAY$0.39M
FY 2014TW A: 115
MILL AND OVERLAY$0.38M
FY 2014AP E: 4125
MILL AND OVERLAY$1.17M
FY 2014AP E: 4120
MILL AND OVERLAY$0.51M
FY 2014AP E: 4105
MILL AND OVERLAY$0.89M
FY 2014TW A: 105
MILL AND OVERLAY$0.13M
FY 2014AP E: 4110
MILL AND OVERLAY$0.72M
FY 2014AP E: 4115
MILL AND OVERLAY$0.56M
FY 2021AP E: 4130
MILL AND OVERLAY$1.08M
FY 2016TW B: 205
MILL AND OVERLAY$1.11M
FY 2023TW A: 500
MILL AND OVERLAY$0.12M
FY 2014TW B: 250
MILL AND OVERLAY$0.05M
FY 2014TW B: 210
MILL AND OVERLAY$0.10M

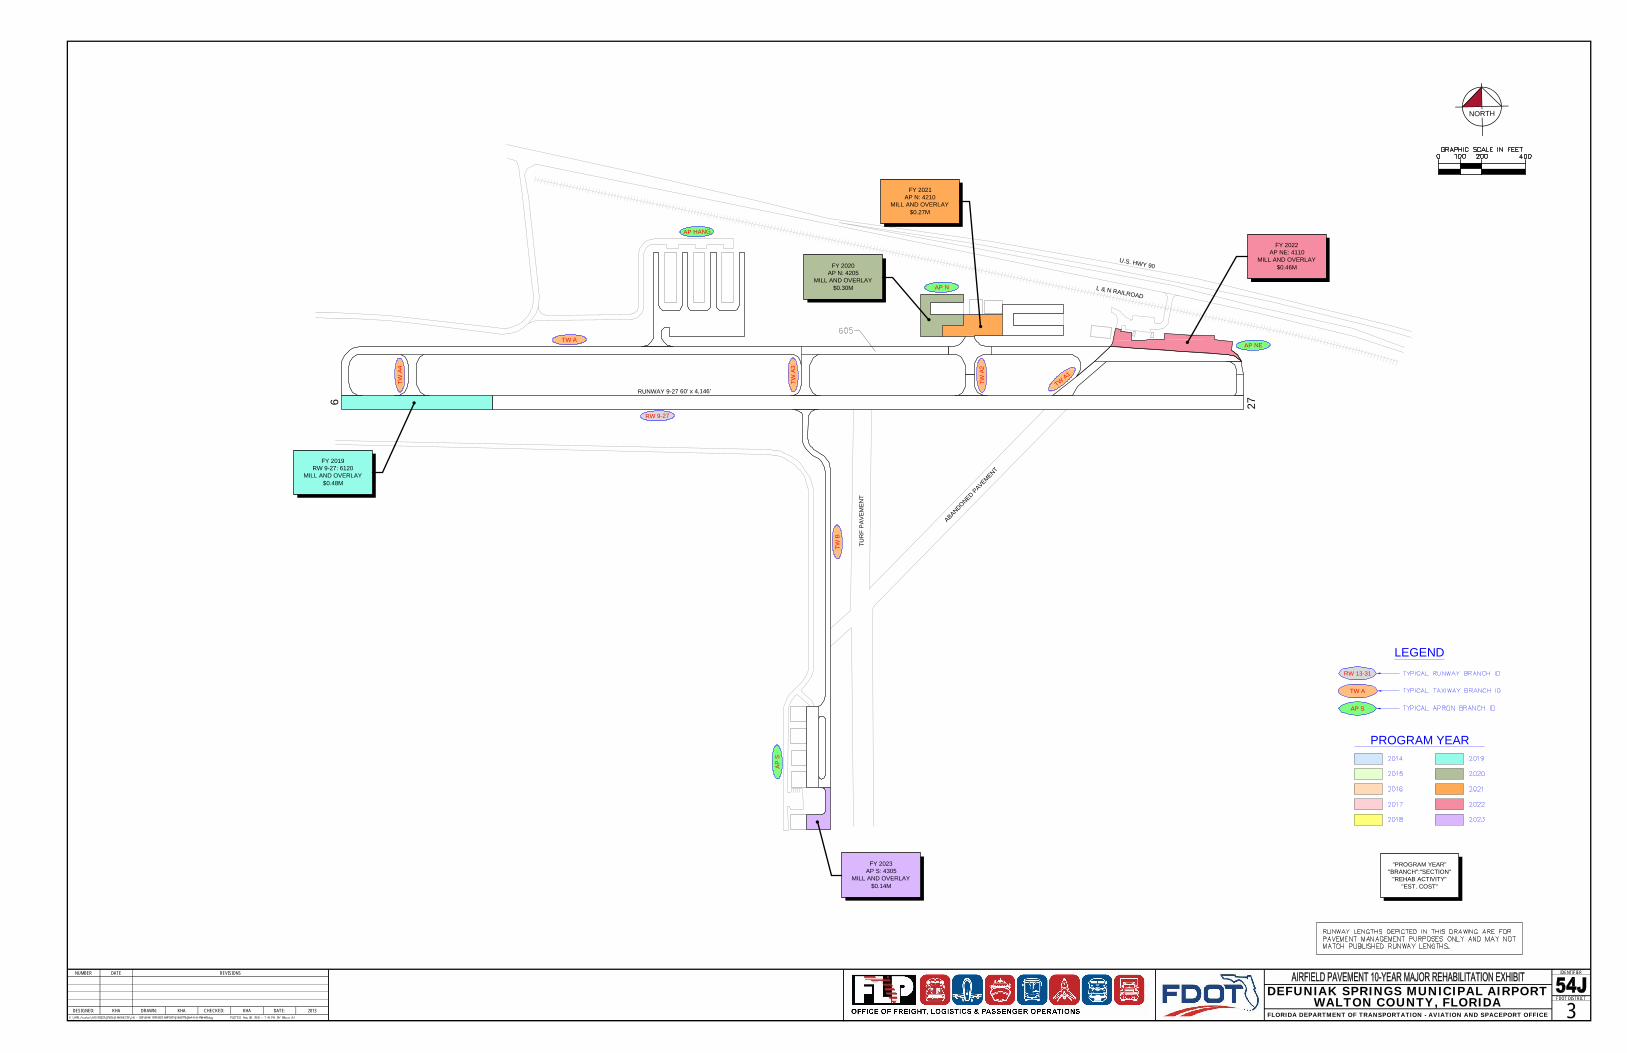
TW A
TWA3
TWA4
TWA2
TWA1
AP NE
AP N
TWB
AP
S
RW 9-27
RUNWAY 9-27 60' x 4,146'
TUR
FP
AVE
MEN
T
ABANDONEDPAVEMENT
U.S. HWY 90
L & N RAILROAD
27
9
AP HANG
LEGEND
PROGRAM YEAR
"PROGRAM YEAR""BRANCH":"SECTION"
"REHAB ACTIVITY""EST. COST"
TW A
AP S
RW 13-31
NUMBER DATE REVISIONS
DESIGNED: DRAWN: CHECKED: DATE:
IDENTIFIER
FDOT DISTRICT
NORTH
DEFUNIAK SPRINGS MUNICIPAL AIRPORTWALTON COUNTY, FLORIDA
FLORIDA DEPARTMENT OF TRANSPORTATION - AVIATION AND SPACEPORT OFFICE 3KHA KHA KHA 2013
FY 2019RW 9-27: 6120
MILL AND OVERLAY$0.48M
FY 2020AP N: 4205
MILL AND OVERLAY$0.30M
FY 2021AP N: 4210
MILL AND OVERLAY$0.27M
FY 2022AP NE: 4110
MILL AND OVERLAY$0.46M
FY 2023AP S: 4305
MILL AND OVERLAY$0.14M

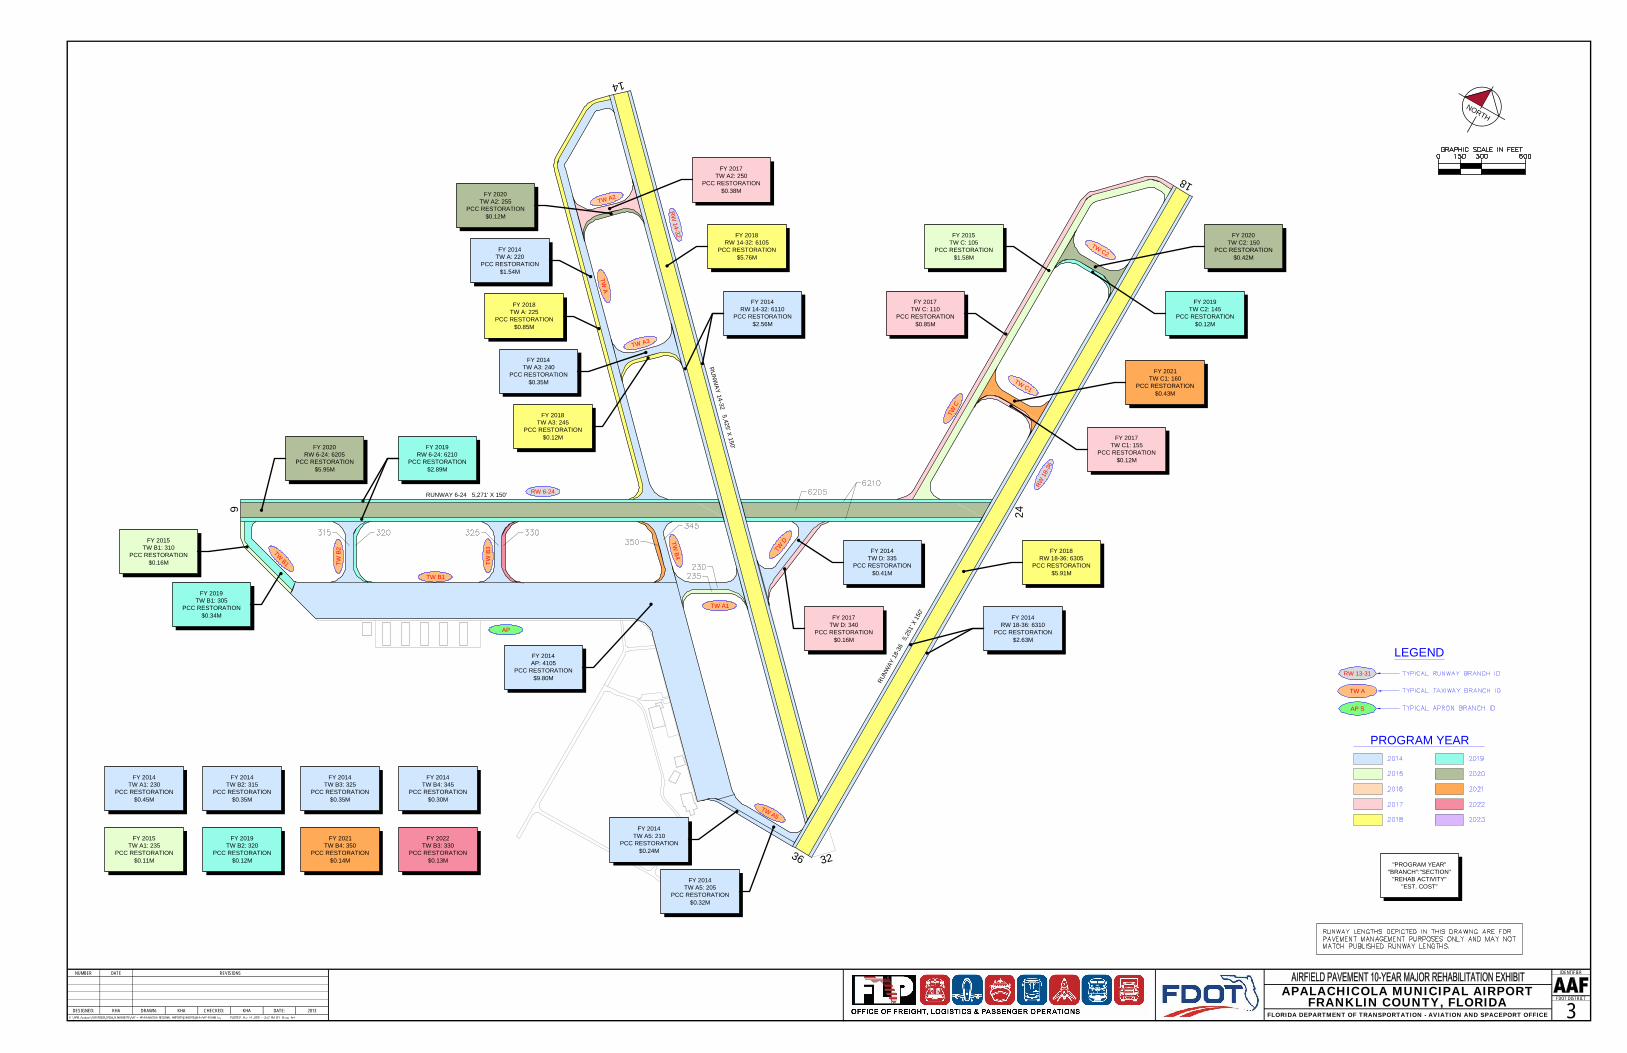
RW 6-24
RW
14-32
RW18
-36
TW A2
TW A3
TWA
TWB4TW
B1
TW B1
TWB2
TWB3
TW A1
TW A5
TWC
TW C1
TW C2
AP
RUNWAY 6-24 5,271' X 150'
RU
NW
AY14-32
5,425' X150'
RUNW
AY18
-36
5,25
1'X
150'
TWD
24
6
3236
14
18
LEGEND
PROGRAM YEAR
"PROGRAM YEAR""BRANCH":"SECTION"
"REHAB ACTIVITY""EST. COST"
TW A
AP S
RW 13-31
NUMBER DATE REVISIONS
DESIGNED: DRAWN: CHECKED: DATE:
IDENTIFIER
FDOT DISTRICT
NORTH
APALACHICOLA MUNICIPAL AIRPORTFRANKLIN COUNTY, FLORIDA
FLORIDA DEPARTMENT OF TRANSPORTATION - AVIATION AND SPACEPORT OFFICE 3KHA KHA KHA 2013
FY 2018TW A3: 245
PCC RESTORATION$0.12M
FY 2014TW A3: 240
PCC RESTORATION$0.35M
FY 2018TW A: 225
PCC RESTORATION$0.85M
FY 2014TW A: 220
PCC RESTORATION$1.54M
FY 2020TW A2: 255
PCC RESTORATION$0.12M
FY 2017TW A2: 250
PCC RESTORATION$0.38M
FY 2018RW 14-32: 6105
PCC RESTORATION$5.76M
FY 2014RW 14-32: 6110
PCC RESTORATION$2.56M
FY 2020RW 6-24: 6205
PCC RESTORATION$5.95M
FY 2019RW 6-24: 6210
PCC RESTORATION$2.89M
FY 2015TW C: 105
PCC RESTORATION$1.58M
FY 2017TW C: 110
PCC RESTORATION$0.85M
FY 2020TW C2: 150
PCC RESTORATION$0.42M
FY 2019TW C2: 145
PCC RESTORATION$0.12M
FY 2021TW C1: 160
PCC RESTORATION$0.43M
FY 2017TW C1: 155
PCC RESTORATION$0.12M
FY 2018RW 18-36: 6305
PCC RESTORATION$5.91M
FY 2014RW 18-36: 6310
PCC RESTORATION$2.63M
FY 2014TW D: 335
PCC RESTORATION$0.41M
FY 2017TW D: 340
PCC RESTORATION$0.16M
FY 2019TW B1: 305
PCC RESTORATION$0.34M
FY 2015TW B1: 310
PCC RESTORATION$0.16M
FY 2014AP: 4105
PCC RESTORATION$9.80M
FY 2014TW A5: 210
PCC RESTORATION$0.24M
FY 2014TW A1: 230
PCC RESTORATION$0.45M
FY 2014TW B2: 315
PCC RESTORATION$0.35M
FY 2014TW B3: 325
PCC RESTORATION$0.35M
FY 2014TW B4: 345
PCC RESTORATION$0.30M
FY 2015TW A1: 235
PCC RESTORATION$0.11M
FY 2019TW B2: 320
PCC RESTORATION$0.12M
FY 2021TW B4: 350
PCC RESTORATION$0.14M
FY 2022TW B3: 330
PCC RESTORATION$0.13M
FY 2014TW A5: 205
PCC RESTORATION$0.32M

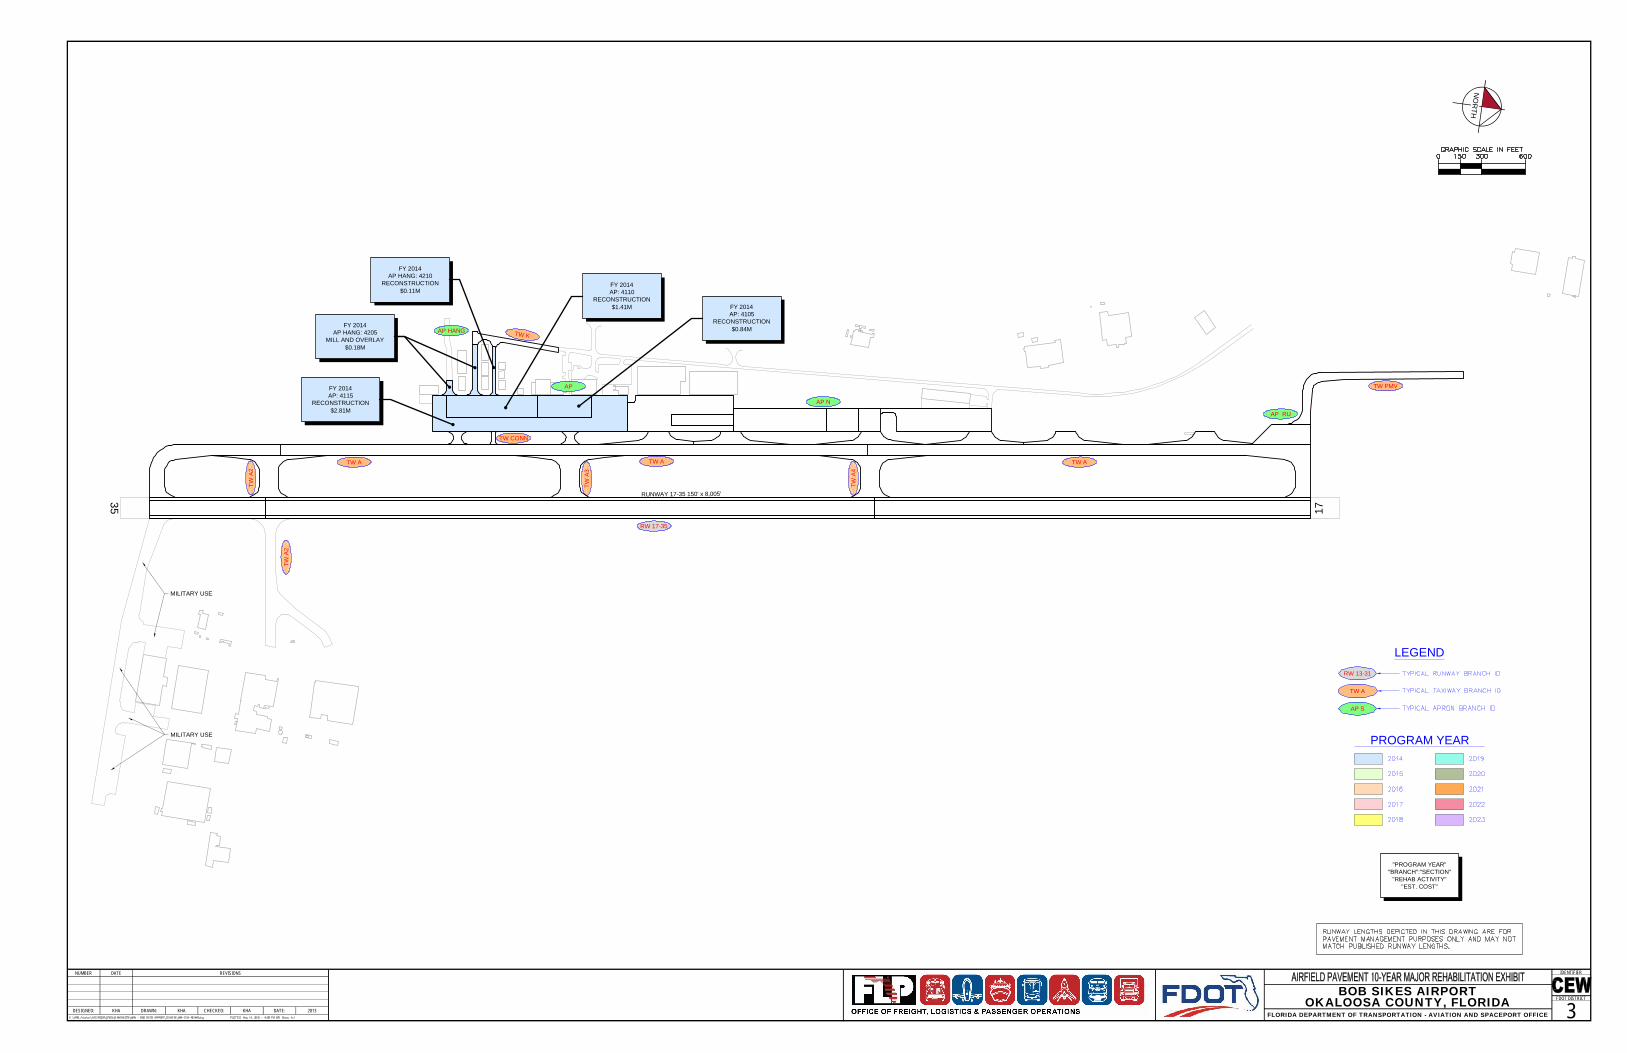
RW 17-35
TWA2
TW A
TW CONN
AP RU
AP N
17
3 5
RUNWAY 17-35 150' x 8,005'
AP
AP HANG TW K
TWA2
TWA3
TWA4
TW ATW A
TW PMV
MILITARY USE
MILITARY USE
LEGEND
PROGRAM YEAR
"PROGRAM YEAR""BRANCH":"SECTION"
"REHAB ACTIVITY""EST. COST"
TW A
AP S
RW 13-31
NUMBER DATE REVISIONS
DESIGNED: DRAWN: CHECKED: DATE:
IDENTIFIER
FDOT DISTRICT
NO
RTH
BOB SIKES AIRPORTOKALOOSA COUNTY, FLORIDA
FLORIDA DEPARTMENT OF TRANSPORTATION - AVIATION AND SPACEPORT OFFICE 3KHA KHA KHA 2013
FY 2014AP: 4115
RECONSTRUCTION$2.81M
FY 2014AP HANG: 4205
MILL AND OVERLAY$0.18M
FY 2014AP HANG: 4210
RECONSTRUCTION$0.11M
FY 2014AP: 4110
RECONSTRUCTION$1.41M FY 2014
AP: 4105RECONSTRUCTION
$0.84M

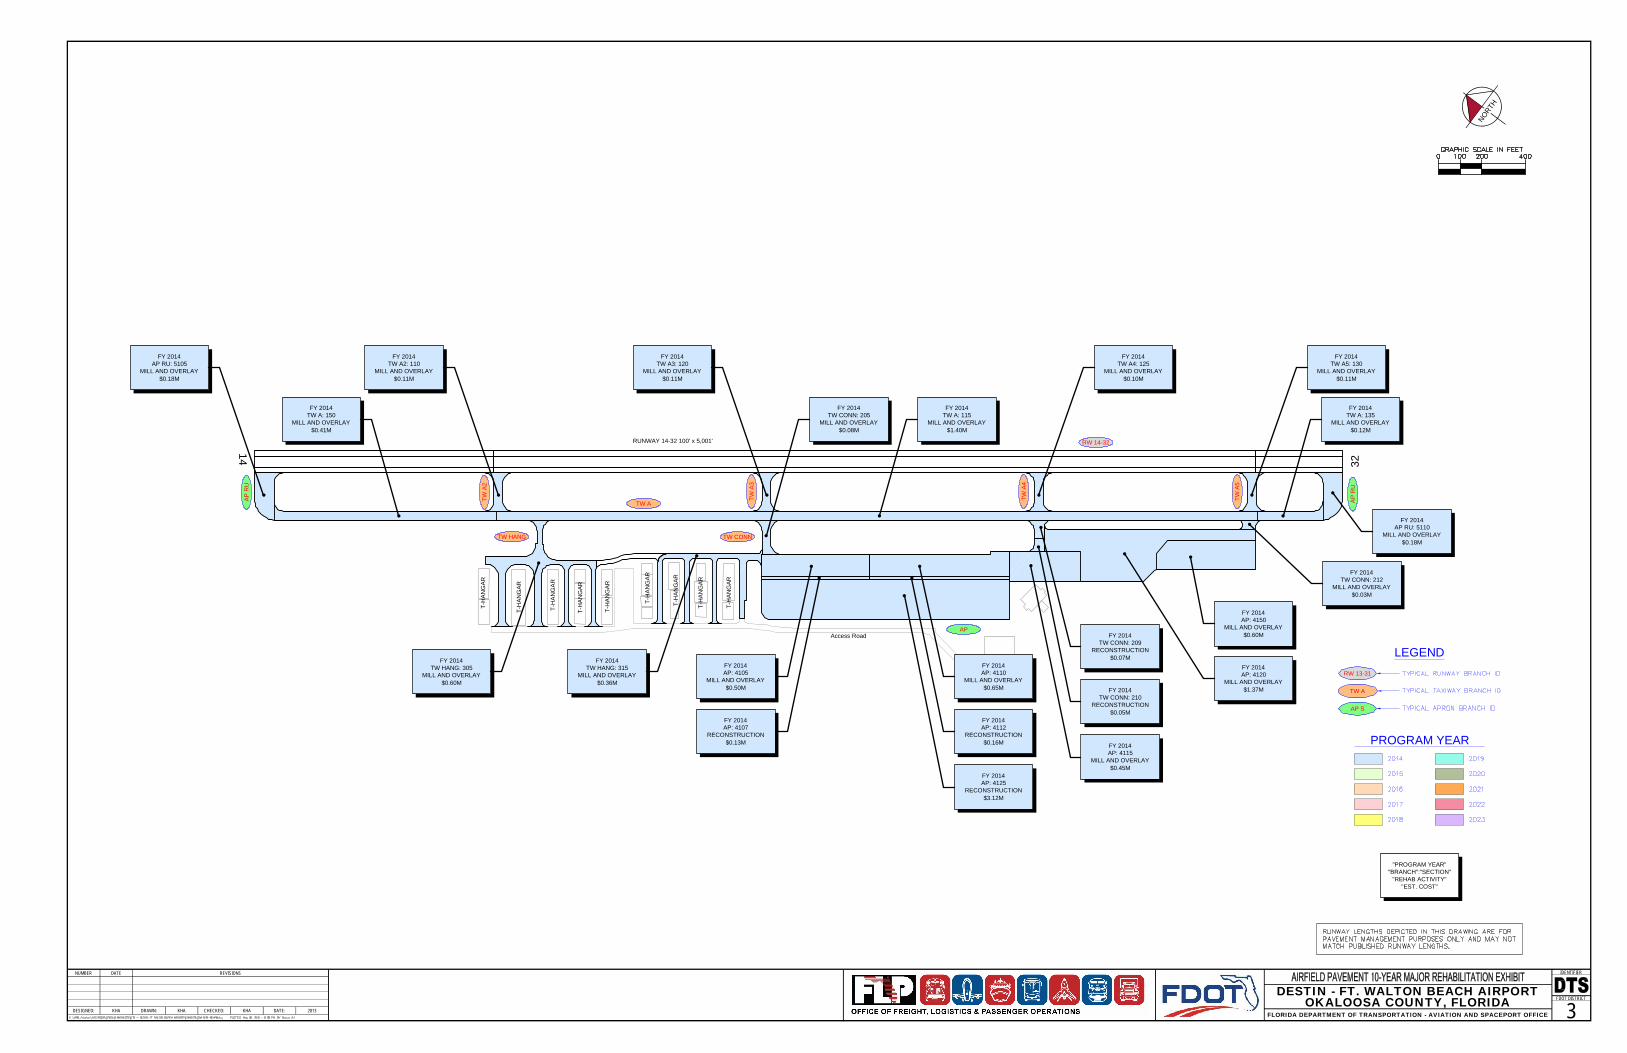
AP
RU
AP
RU
AP
RW 14-32
TW HANG TW CONN
14
32
RUNWAY 14-32 100' x 5,001'
Access Road
T-H
AN
GAR
T-H
AN
GAR
T-H
AN
GAR
T-H
AN
GAR
T-H
AN
GAR
T-H
AN
GAR
T-H
AN
GAR
T-H
AN
GAR
T-H
AN
GAR
TWA2
TWA3
TW A
TWA4
TWA5
LEGEND
PROGRAM YEAR
"PROGRAM YEAR""BRANCH":"SECTION"
"REHAB ACTIVITY""EST. COST"
TW A
AP S
RW 13-31
NUMBER DATE REVISIONS
DESIGNED: DRAWN: CHECKED: DATE:
IDENTIFIER
FDOT DISTRICT
NORTH
DESTIN - FT. WALTON BEACH AIRPORTOKALOOSA COUNTY, FLORIDA
FLORIDA DEPARTMENT OF TRANSPORTATION - AVIATION AND SPACEPORT OFFICE 3KHA KHA KHA 2013
FY 2014TW A: 135
MILL AND OVERLAY$0.12M
FY 2014AP RU: 5110
MILL AND OVERLAY$0.18M
FY 2014TW A: 150
MILL AND OVERLAY$0.41M
FY 2014TW A: 115
MILL AND OVERLAY$1.40M
FY 2014TW A5: 130
MILL AND OVERLAY$0.11M
FY 2014TW A4: 125
MILL AND OVERLAY$0.10M
FY 2014TW A2: 110
MILL AND OVERLAY$0.11M
FY 2014AP RU: 5105
MILL AND OVERLAY$0.18M
FY 2014TW CONN: 212
MILL AND OVERLAY$0.03M
FY 2014AP: 4150
MILL AND OVERLAY$0.60M
FY 2014AP: 4120
MILL AND OVERLAY$1.37M
FY 2014TW CONN: 209
RECONSTRUCTION$0.07M
FY 2014TW CONN: 210
RECONSTRUCTION$0.05M
FY 2014AP: 4115
MILL AND OVERLAY$0.45M
FY 2014TW HANG: 305
MILL AND OVERLAY$0.60M
FY 2014TW HANG: 315
MILL AND OVERLAY$0.36M
FY 2014TW A3: 120
MILL AND OVERLAY$0.11M
FY 2014TW CONN: 205
MILL AND OVERLAY$0.08M
FY 2014AP: 4110
MILL AND OVERLAY$0.65M
FY 2014AP: 4112
RECONSTRUCTION$0.16M
FY 2014AP: 4125
RECONSTRUCTION$3.12M
FY 2014AP: 4105
MILL AND OVERLAY$0.50M
FY 2014AP: 4107
RECONSTRUCTION$0.13M

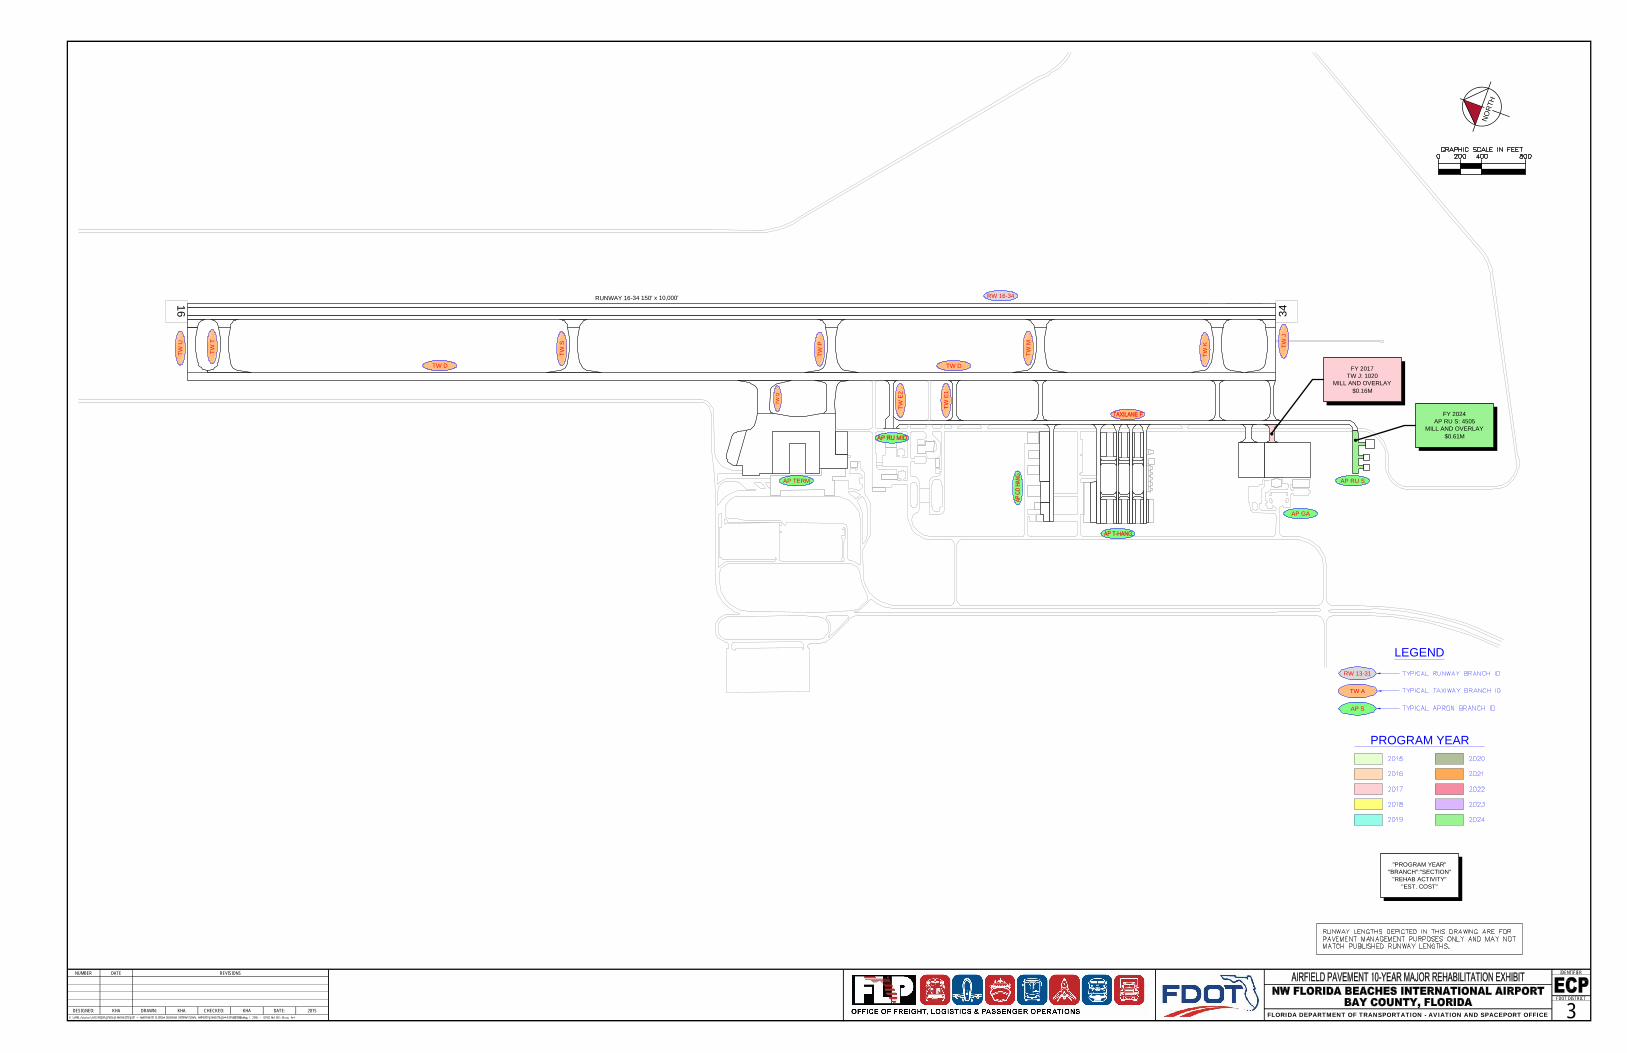
RUNWAY 16-34 150' x 10,000'
34
16
TWQ
RW 16-34
TWU
TWT
TW D
TWS
TWP
TW D
TWM
TWK TW
J
TWE2
TWE1
AP TERM
AP GA
AP RU S
LEGEND
PROGRAM YEAR
"PROGRAM YEAR""BRANCH":"SECTION"
"REHAB ACTIVITY""EST. COST"
TW A
AP S
RW 13-31
NUMBER DATE REVISIONS
DESIGNED: DRAWN: CHECKED: DATE:
IDENTIFIER
FDOT DISTRICT
NO
RTH
FLORIDA DEPARTMENT OF TRANSPORTATION - AVIATION AND SPACEPORT OFFICE 3KHA KHA KHA 2015
FY 2017TW J: 1020
MILL AND OVERLAY$0.16M
FY 2024AP RU S: 4505
MILL AND OVERLAY$0.61M

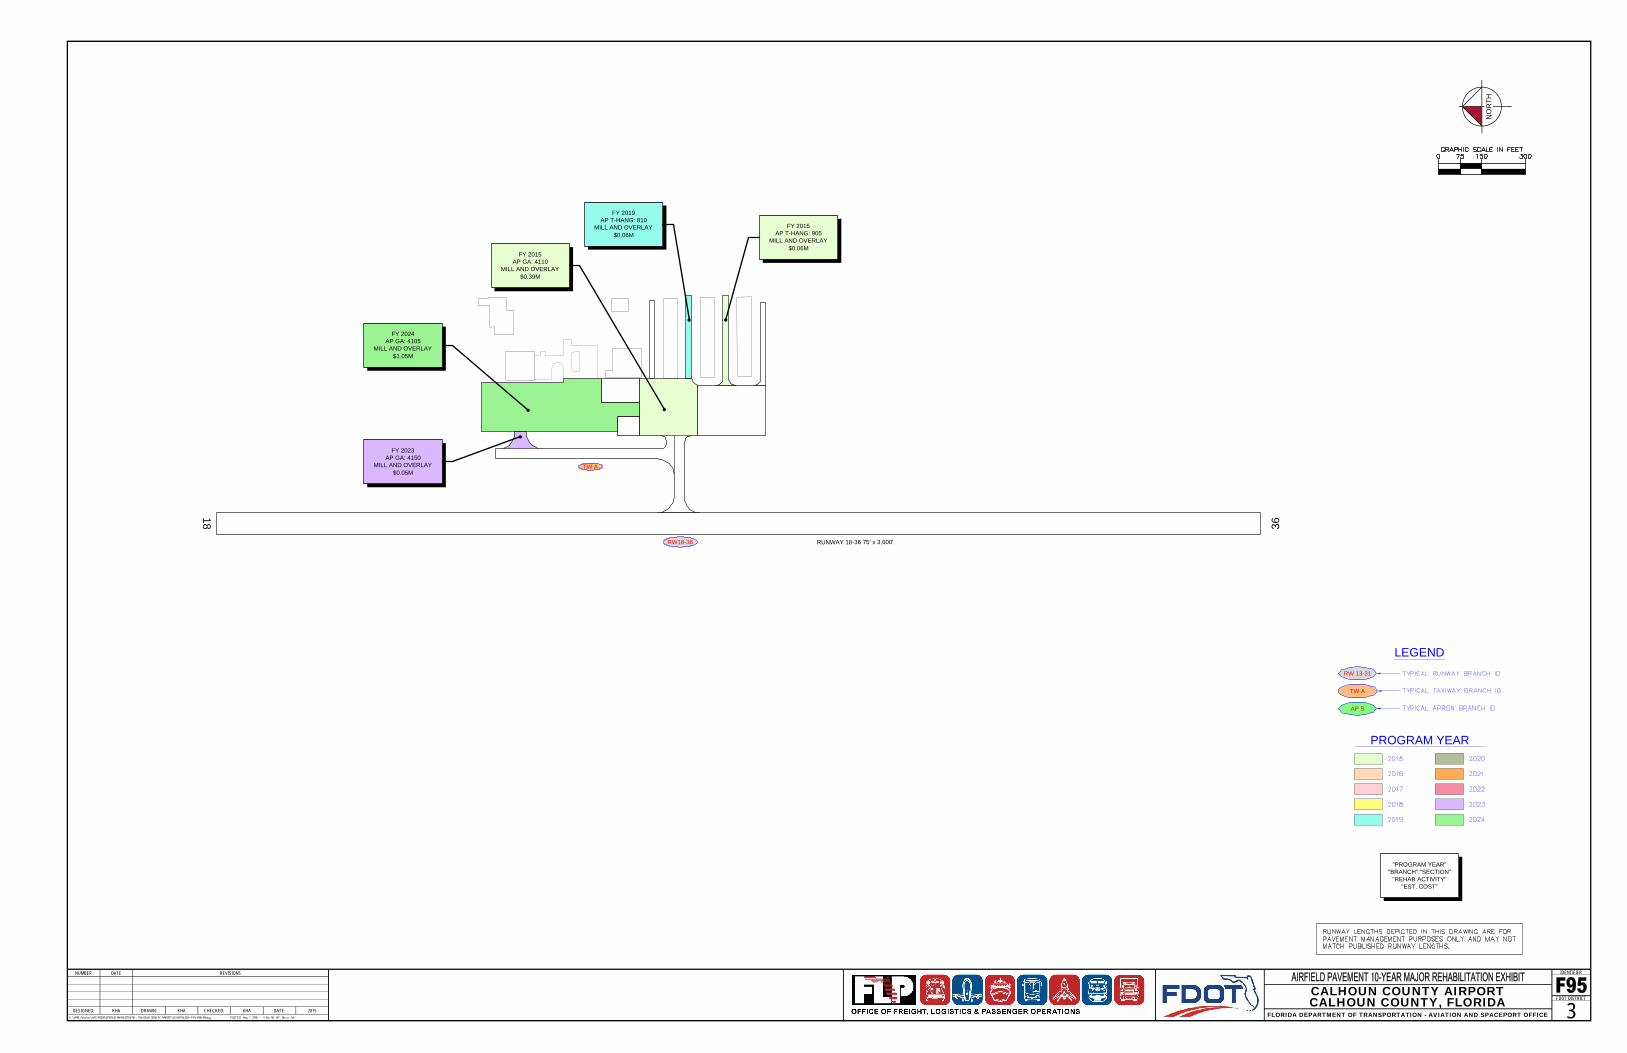
RW18-36
TW A
36
18
RUNWAY 18-36 75' x 3,600'
LEGEND
PROGRAM YEAR
"PROGRAM YEAR""BRANCH":"SECTION"
"REHAB ACTIVITY""EST. COST"
TW A
AP S
RW 13-31
NUMBER DATE REVISIONS
DESIGNED: DRAWN: CHECKED: DATE:
IDENTIFIER
FDOT DISTRICTCALHOUN COUNTY AIRPORTCALHOUN COUNTY, FLORIDA
FLORIDA DEPARTMENT OF TRANSPORTATION - AVIATION AND SPACEPORT OFFICE 3KHA KHA KHA 2015
NO
RTH
FY 2015AP T-HANG: 905
MILL AND OVERLAY$0.06M
FY 2015AP GA: 4110
MILL AND OVERLAY$0.39M
FY 2019AP T-HANG: 810
MILL AND OVERLAY$0.06M
FY 2023AP GA: 4150
MILL AND OVERLAY$0.05M
FY 2024AP GA: 4105
MILL AND OVERLAY$1.05M

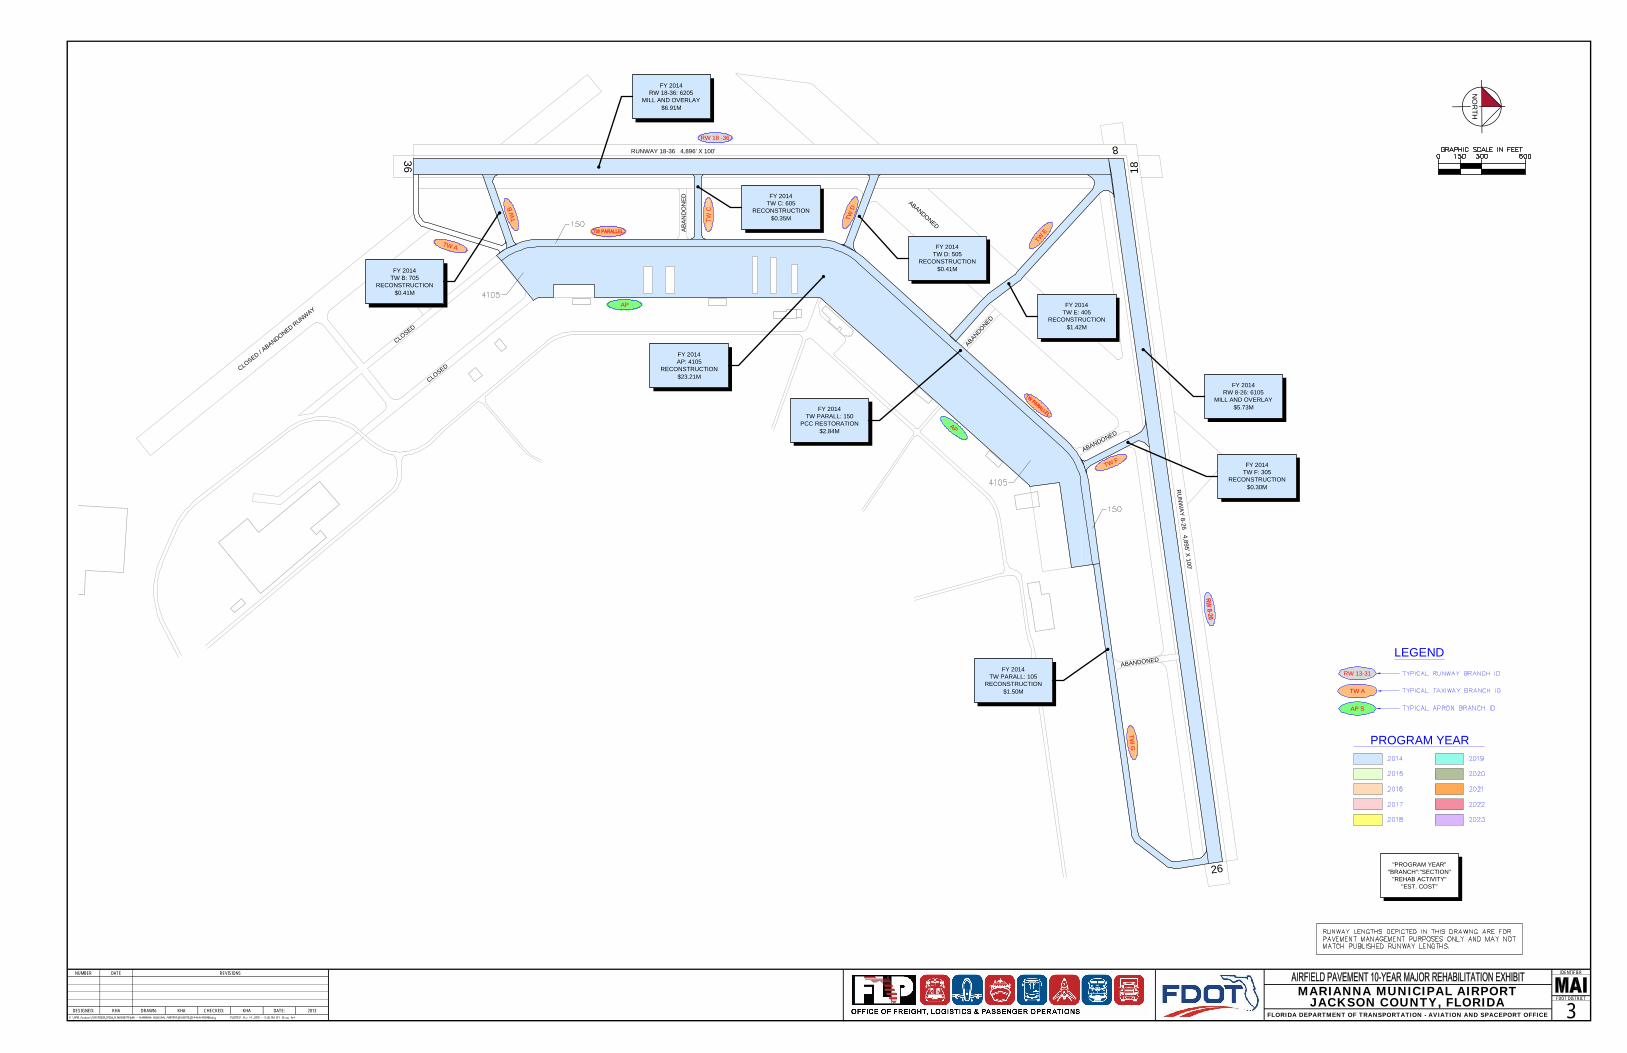
26
8
36 18
RUNWAY 18-36 4,896' X 100'
RU
NW
AY8-26
4,895' X100'
RW 18 -36
AB
AN
DO
NED ABANDONED
ABANDONED
ABANDONED
ABANDONED
CLOSED / ABANDONED RUNWAY
CLOSED
CLOSED
TWB
TWC
TWE
TW F
TWG
AP
AP
TWD
TW A
LEGEND
PROGRAM YEAR
"PROGRAM YEAR""BRANCH":"SECTION"
"REHAB ACTIVITY""EST. COST"
TW A
AP S
RW 13-31
NUMBER DATE REVISIONS
DESIGNED: DRAWN: CHECKED: DATE:
IDENTIFIER
FDOT DISTRICT
NO
RTH
MARIANNA MUNICIPAL AIRPORTJACKSON COUNTY, FLORIDA
FLORIDA DEPARTMENT OF TRANSPORTATION - AVIATION AND SPACEPORT OFFICE 3KHA KHA KHA 2013
FY 2014RW 18-36: 6205
MILL AND OVERLAY$6.91M
FY 2014RW 8-26: 6105
MILL AND OVERLAY$5.73M
FY 2014AP: 4105
RECONSTRUCTION$23.21M
FY 2014TW B: 705
RECONSTRUCTION$0.41M
FY 2014TW C: 605
RECONSTRUCTION$0.35M
FY 2014TW D: 505
RECONSTRUCTION$0.41M
FY 2014TW PARALL: 105
RECONSTRUCTION$1.50M
FY 2014TW E: 405
RECONSTRUCTION$1.42M
FY 2014TW F: 305
RECONSTRUCTION$0.30M
FY 2014TW PARALL: 150
PCC RESTORATION$2.84M

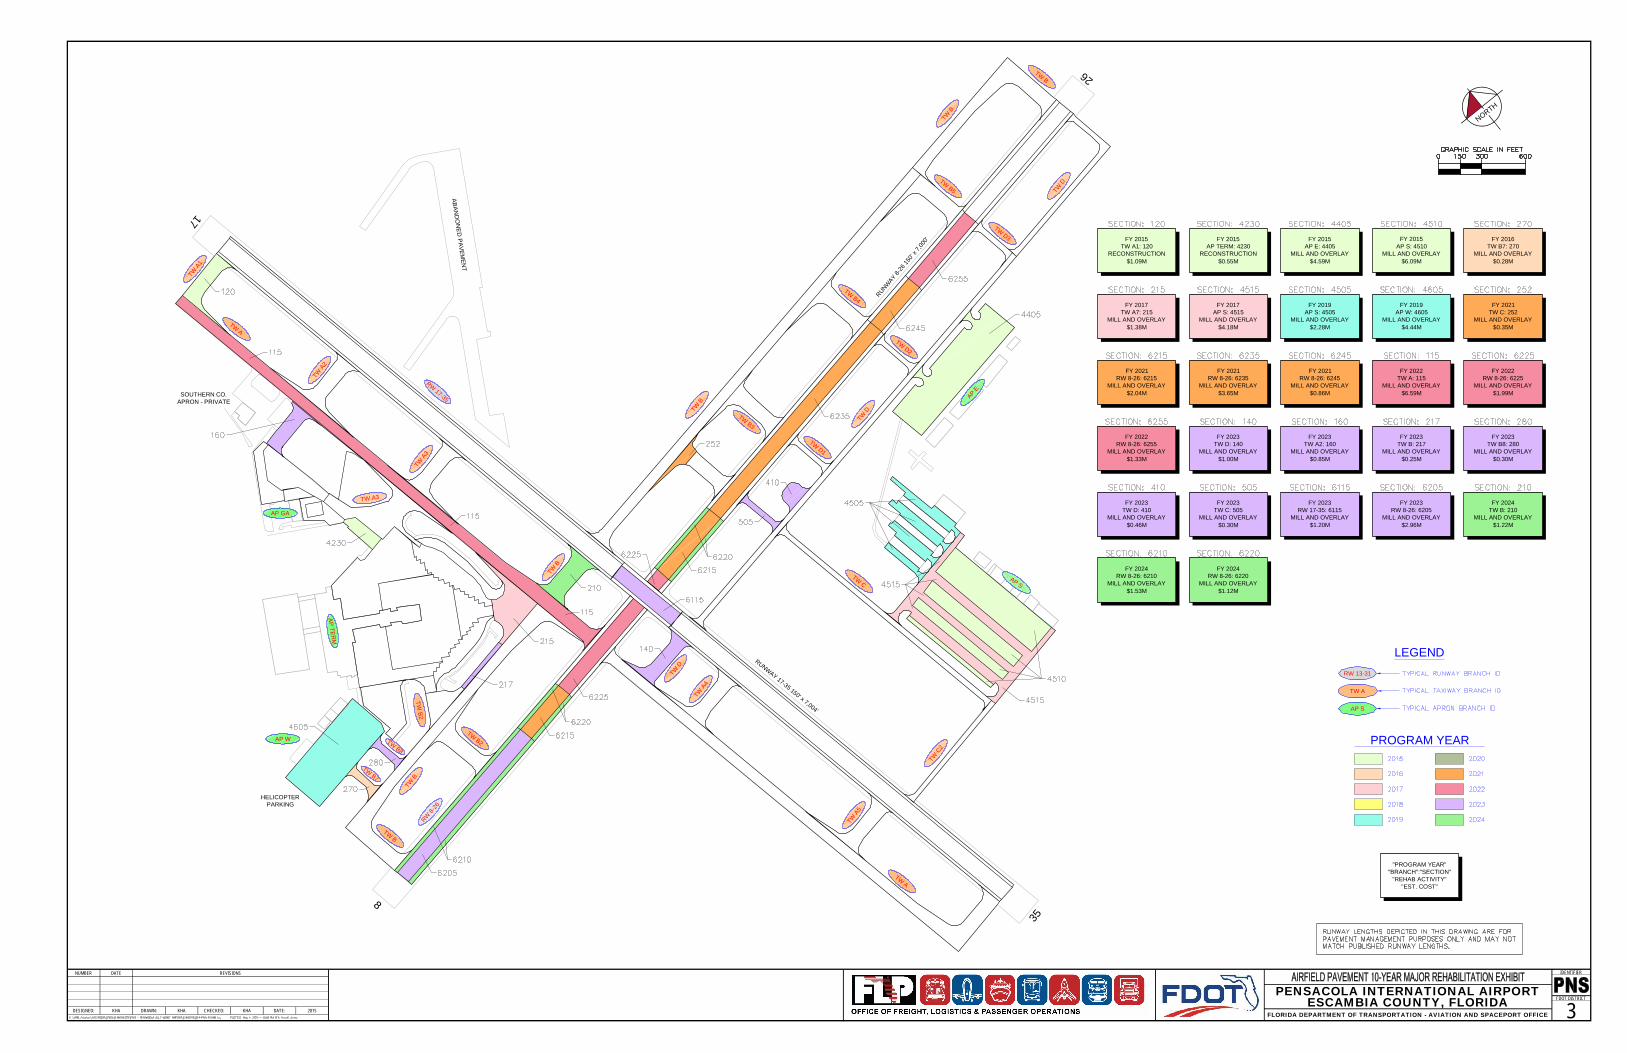
35
17
8
26
RUNWAY 17-35 150' x 7,004'
RUNWAY
8-26
150'
x 7,000
'
RW8-
26
RW17-35 AP
E
AP S
APTER
M
AP GA
AP W
TWA
TWA5
TWA
TWA4
TWD
TWB
TWA3
TWA2
TWA1
TWB
TWB
TWB
TWB
TWB2
TWB7
TWB8
TWB2
TW A3
TWB3
TWB4
TWB5
TWB
TWD3
TWD
TWD2
TWD1
TWD
TWC
TWC2
HELICOPTERPARKING
ABAN
DO
NE
DPAVEM
ENT
SOUTHERN CO.APRON - PRIVATE
LEGEND
PROGRAM YEAR
"PROGRAM YEAR""BRANCH":"SECTION"
"REHAB ACTIVITY""EST. COST"
TW A
AP S
RW 13-31
NUMBER DATE REVISIONS
DESIGNED: DRAWN: CHECKED: DATE:
IDENTIFIER
FDOT DISTRICTPENSACOLA INTERNATIONAL AIRPORT
ESCAMBIA COUNTY, FLORIDAFLORIDA DEPARTMENT OF TRANSPORTATION - AVIATION AND SPACEPORT OFFICE 3KHA KHA KHA 2015
NORTH
FY 2015TW A1: 120
RECONSTRUCTION$1.09M
FY 2015AP TERM: 4230
RECONSTRUCTION$0.55M
FY 2015AP E: 4405
MILL AND OVERLAY$4.59M
FY 2015AP S: 4510
MILL AND OVERLAY$6.09M
FY 2016TW B7: 270
MILL AND OVERLAY$0.28M
FY 2017TW A7: 215
MILL AND OVERLAY$1.38M
FY 2017AP S: 4515
MILL AND OVERLAY$4.18M
FY 2019AP S: 4505
MILL AND OVERLAY$2.28M
FY 2019AP W: 4605
MILL AND OVERLAY$4.44M
FY 2021TW C: 252
MILL AND OVERLAY$0.35M
FY 2021RW 8-26: 6215
MILL AND OVERLAY$2.04M
FY 2021RW 8-26: 6235
MILL AND OVERLAY$3.65M
FY 2021RW 8-26: 6245
MILL AND OVERLAY$0.86M
FY 2022TW A: 115
MILL AND OVERLAY$6.59M
FY 2022RW 8-26: 6225
MILL AND OVERLAY$1.99M
FY 2022RW 8-26: 6255
MILL AND OVERLAY$1.33M
FY 2023TW D: 140
MILL AND OVERLAY$1.00M
FY 2023TW A2: 160
MILL AND OVERLAY$0.85M
FY 2023TW B: 217
MILL AND OVERLAY$0.25M
FY 2023TW B8: 280
MILL AND OVERLAY$0.30M
FY 2023TW D: 410
MILL AND OVERLAY$0.46M
FY 2023TW C: 505
MILL AND OVERLAY$0.30M
FY 2023RW 17-35: 6115
MILL AND OVERLAY$1.20M
FY 2023RW 8-26: 6205
MILL AND OVERLAY$2.96M
FY 2024TW B: 210
MILL AND OVERLAY$1.22M
FY 2024RW 8-26: 6210
MILL AND OVERLAY$1.53M
FY 2024RW 8-26: 6220
MILL AND OVERLAY$1.12M

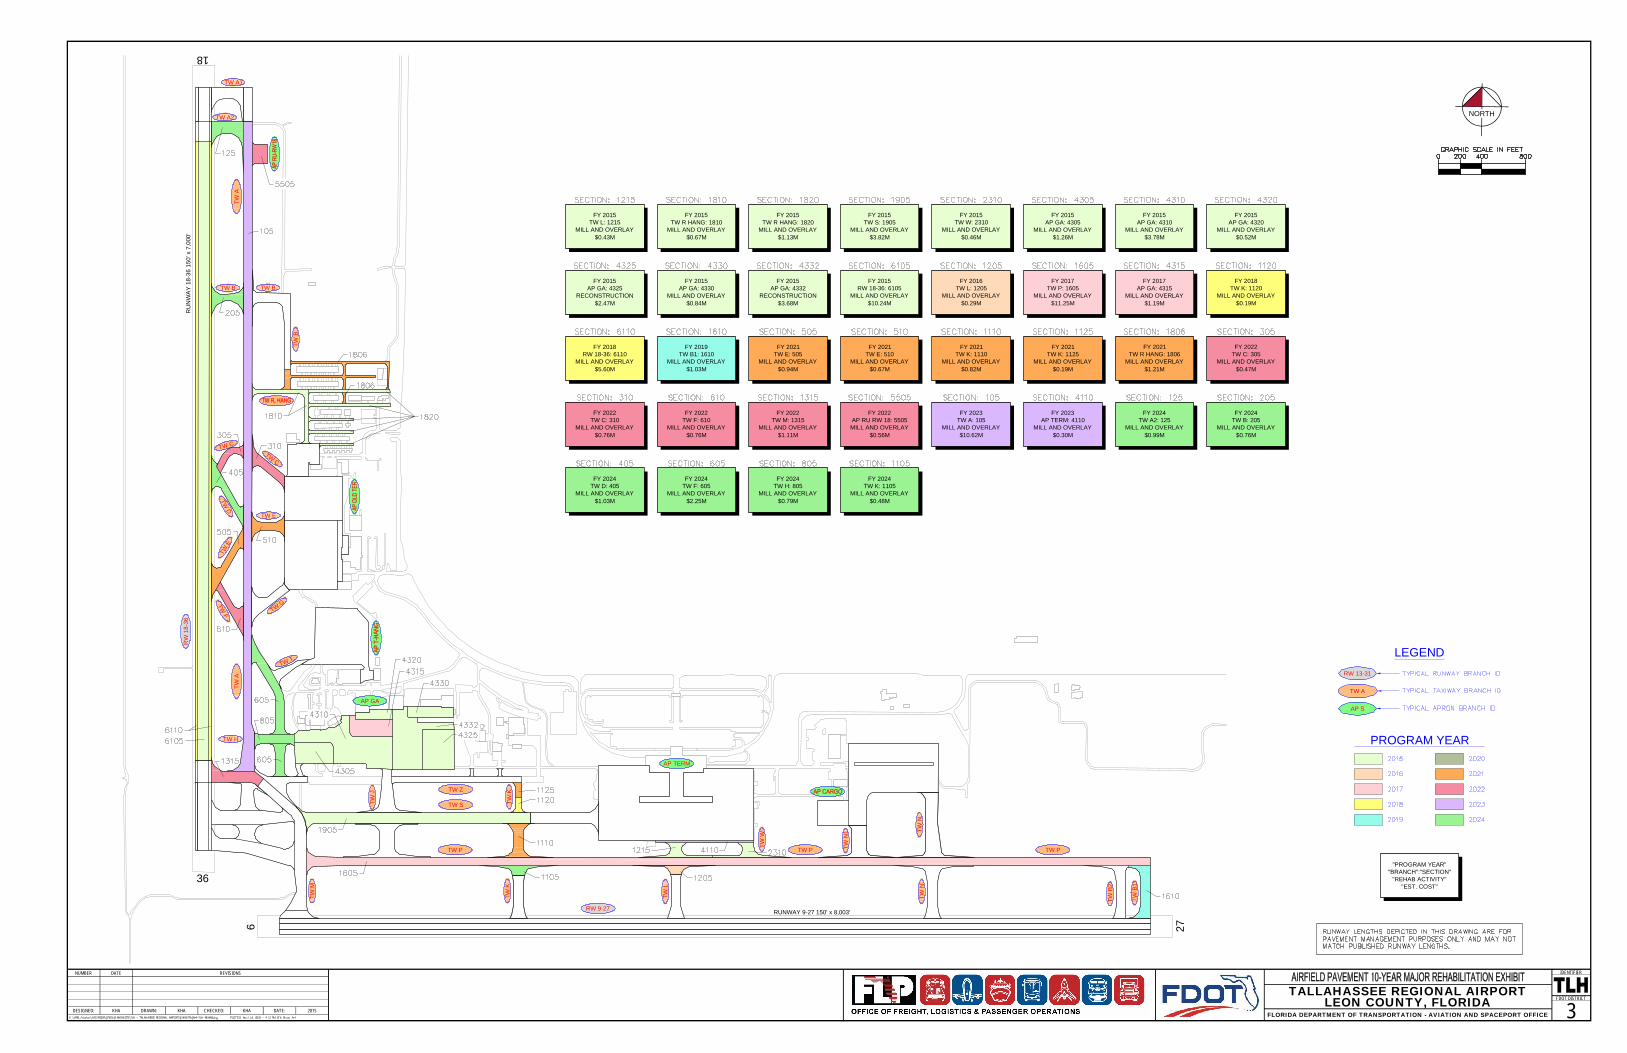
27
9
36
18
RW 9-27
RW
18-3
6
AP TERM
AP GA
TWA
TW P
TW S
TW P
RU
NW
AY
18-3
615
0'x
7,00
0'
RUNWAY 9-27 150' x 8,003'
TWA
TW B
TW C
TWD
TW E
TWC
TWF TW
G
TWE
TW T
TW H
TWJ
TWK
TWK
TWL
TWN
TWB2
TWB1
TW P
TWW
TW Z
TWM
TW A2
TW A1
TW BTW
B
TWN
1 TWN
LEGEND
PROGRAM YEAR
"PROGRAM YEAR""BRANCH":"SECTION"
"REHAB ACTIVITY""EST. COST"
TW A
AP S
RW 13-31
NUMBER DATE REVISIONS
DESIGNED: DRAWN: CHECKED: DATE:
IDENTIFIER
FDOT DISTRICT
NORTH
TALLAHASSEE REGIONAL AIRPORTLEON COUNTY, FLORIDA
FLORIDA DEPARTMENT OF TRANSPORTATION - AVIATION AND SPACEPORT OFFICE 3KHA KHA KHA 2015
FY 2015AP GA: 4305
MILL AND OVERLAY$1.26M
FY 2015AP GA: 4310
MILL AND OVERLAY$3.78M
FY 2015AP GA: 4320
MILL AND OVERLAY$0.52M
FY 2015AP GA: 4325
RECONSTRUCTION$2.47M
FY 2015AP GA: 4330
MILL AND OVERLAY$0.84M
FY 2015AP GA: 4332
RECONSTRUCTION$3.68M
FY 2015RW 18-36: 6105
MILL AND OVERLAY$10.24M
FY 2015TW L: 1215
MILL AND OVERLAY$0.43M
FY 2015TW R HANG: 1810
MILL AND OVERLAY$0.67M
FY 2015TW R HANG: 1820
MILL AND OVERLAY$1.13M
FY 2015TW S: 1905
MILL AND OVERLAY$3.82M
FY 2015TW W: 2310
MILL AND OVERLAY$0.46M
FY 2016TW L: 1205
MILL AND OVERLAY$0.29M
FY 2017AP GA: 4315
MILL AND OVERLAY$1.19M
FY 2017TW P: 1605
MILL AND OVERLAY$11.25M
FY 2018RW 18-36: 6110
MILL AND OVERLAY$5.60M
FY 2018TW K: 1120
MILL AND OVERLAY$0.19M
FY 2019TW B1: 1610
MILL AND OVERLAY$1.03M
FY 2021TW E: 505
MILL AND OVERLAY$0.94M
FY 2021TW E: 510
MILL AND OVERLAY$0.67M
FY 2021TW K: 1110
MILL AND OVERLAY$0.82M
FY 2021TW K: 1125
MILL AND OVERLAY$0.19M
FY 2021TW R HANG: 1806
MILL AND OVERLAY$1.21M
FY 2022AP RU RW 18: 5505MILL AND OVERLAY
$0.56M
FY 2022TW C: 305
MILL AND OVERLAY$0.47M
FY 2022TW C: 310
MILL AND OVERLAY$0.76M
FY 2022TW F: 610
MILL AND OVERLAY$0.76M
FY 2022TW M: 1315
MILL AND OVERLAY$1.11M
FY 2023AP TERM: 4110
MILL AND OVERLAY$0.30M
FY 2023TW A: 105
MILL AND OVERLAY$10.62M
FY 2024TW A2: 125
MILL AND OVERLAY$0.99M
FY 2024TW B: 205
MILL AND OVERLAY$0.76M
FY 2024TW D: 405
MILL AND OVERLAY$1.03M
FY 2024TW F: 605
MILL AND OVERLAY$2.25M
FY 2024TW H: 805
MILL AND OVERLAY$0.79M
FY 2024TW K: 1105
MILL AND OVERLAY$0.48M

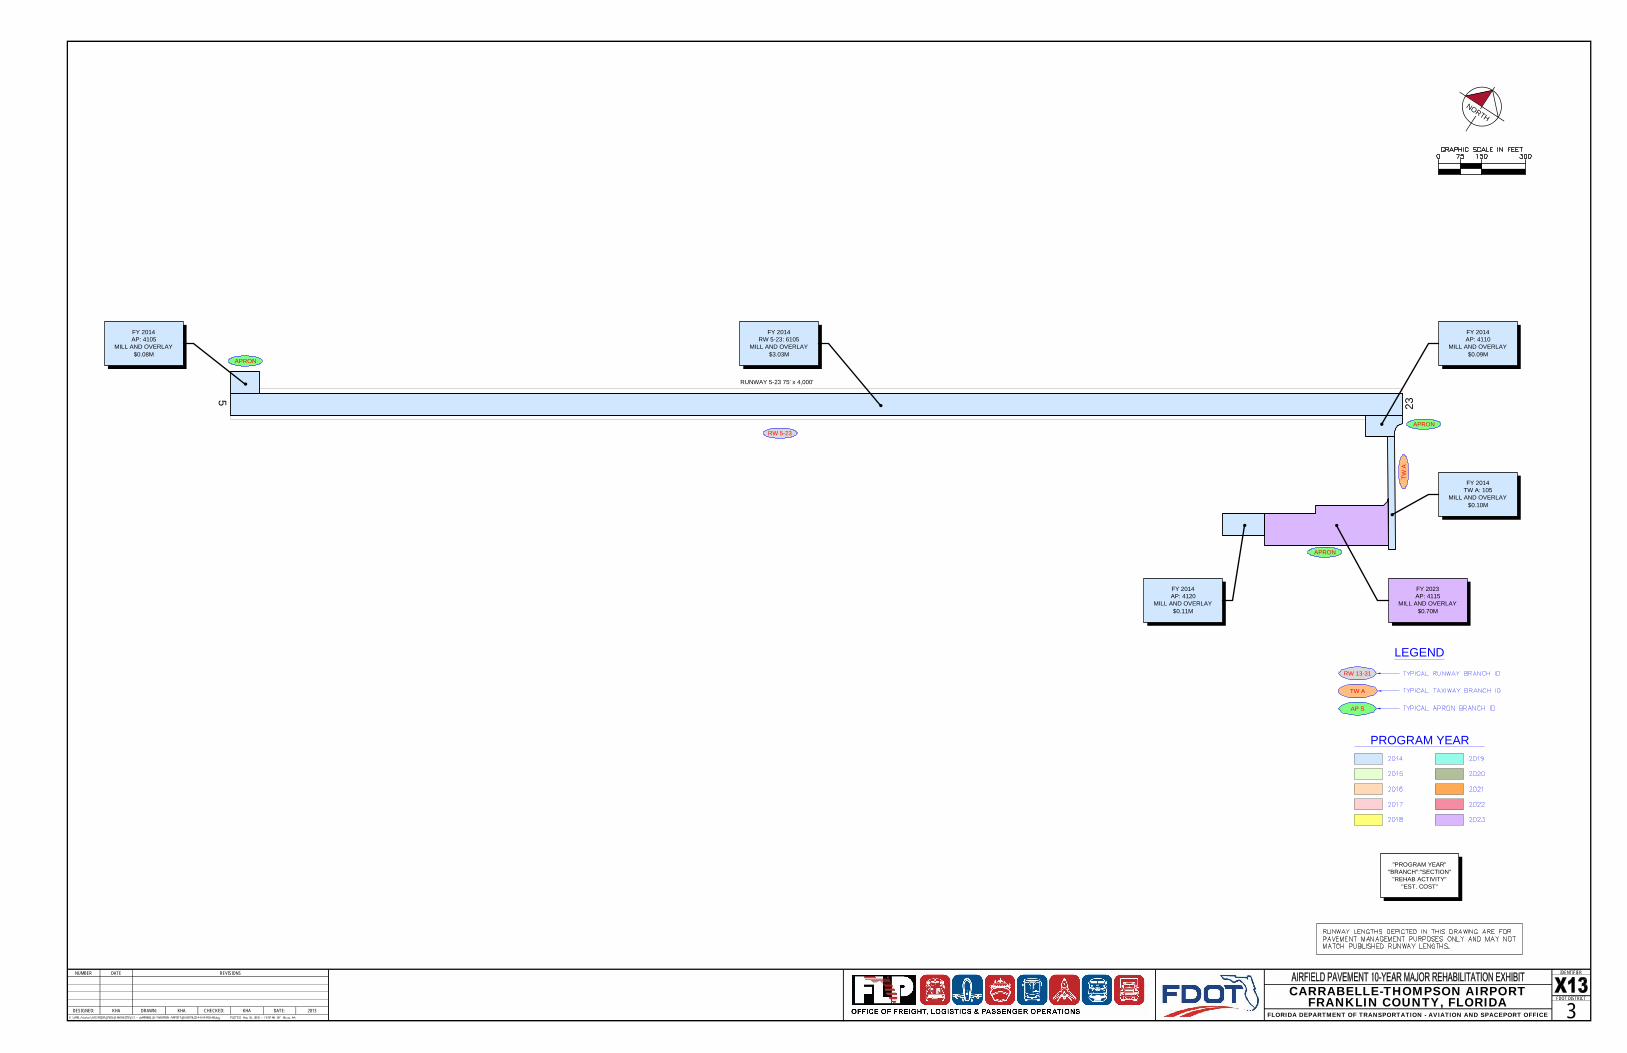
RUNWAY 5-23 75' x 4,000'
RW 5-23
235
APRON
APRON
APRON
TWA
LEGEND
PROGRAM YEAR
"PROGRAM YEAR""BRANCH":"SECTION"
"REHAB ACTIVITY""EST. COST"
TW A
AP S
RW 13-31
NUMBER DATE REVISIONS
DESIGNED: DRAWN: CHECKED: DATE:
IDENTIFIER
FDOT DISTRICT
NORTH
CARRABELLE-THOMPSON AIRPORTFRANKLIN COUNTY, FLORIDA
FLORIDA DEPARTMENT OF TRANSPORTATION - AVIATION AND SPACEPORT OFFICE 3KHA KHA KHA 2013
FY 2014AP: 4105
MILL AND OVERLAY$0.08M
FY 2014RW 5-23: 6105
MILL AND OVERLAY$3.03M
FY 2014AP: 4110
MILL AND OVERLAY$0.09M
FY 2014TW A: 105
MILL AND OVERLAY$0.10M
FY 2014AP: 4120
MILL AND OVERLAY$0.11M
FY 2023AP: 4115
MILL AND OVERLAY$0.70M

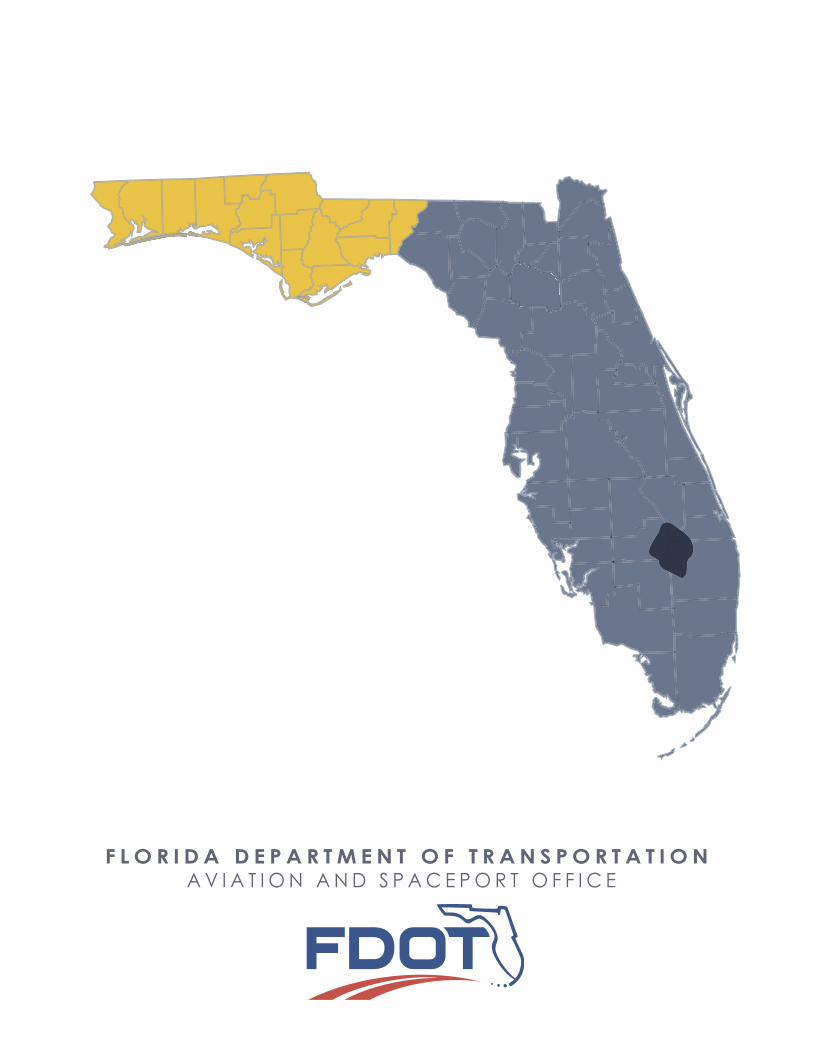
F L O R I D A D E P A R T M E N T O F T R A N S P O R T A T I O NA V I A T I O N A N D S P A C E P O R T O F F I C E