aircraft wire degradation study - the william j. hughes technical
TRANSCRIPT

DOT/FAA/AR-08/2 Air Traffic Organization Operations Planning Office of Aviation Research and Development Washington, DC 20591
Aircraft Degradation Study January 2008 Final Report This document is available to the U.S. public through the National Technical Information Service (NTIS), Springfield, Virginia 22161.
U.S. Department of Transportation Federal Aviation Administration

NOTICE
This document is disseminated under the sponsorship of the U.S. Department of Transportation in the interest of information exchange. The United States Government assumes no liability for the contents or use thereof. The United States Government does not endorse products or manufacturers. Trade or manufacturer's names appear herein solely because they are considered essential to the objective of this report. This document does not constitute FAA certification policy. Consult your local FAA aircraft certification office as to its use. This report is available at the Federal Aviation Administration William J. Hughes Technical Center’s Full-Text Technical Reports page: actlibrary.tc.faa.gov in Adobe Acrobat portable document format (PDF).

Technical Report Documentation Page 1. Report No. 2. Government Accession No. 3. Recipient's Catalog No. DOT/FAA/AR-08/2 4. Title and Subtitle
AIRCRAFT WI
5. Report Date
RING DEGRADATION STUDY January 2008 6. Performing Organization Code
7. Author(s)
Joseph Kurek, PRobert BernsteinTurner, Michael
rincipal , Mike Etheridge, Gary LaSalle, Roy McMahon, Jim Meiner, Noel Walz, and Cesar Gomez*
8. Performing Organization Report No.
9. Performing Organization N
Raytheon Technical Services Company LLC 6125 East 21st Street Indianapolis, IN 219-2058
*Federal Aviation Administration William J. Hugh Technical Center Airport and Aircraft Safety R&D Division Air Worthiness Assurance Branch Atlantic City International Airport, NJ 08405
10. Work Unit No. (TRAIS) ame and Address
46
es
11. Contract or Grant No. DTFA 03-02-C-00040
12. Sponsoring Agenc e and Address
U.S. Department f Transportation Federal Aviation Administration Air Traffic Organization Operations Planning Office of Aviati Research and Development Washington, DC 20591
13. Type of Report and Period Covered
Final Report 08/01-04/05
y Nam
o
on
14. Sponsoring Agency Code ANM-111
15. Supplementary Notes 16. Abstract The purpose of this initial research program was to evaluate the aging characteristics of three types of aircraft electrical wire: polyimide, poly trafluoroethylene/polyimide composite, and polyvinyl chloride/nylon. In addition, predictive models for the aging of these wire types were developed. These wire types were chosen because of their widespread use in commercial aircraft and the amount of reported incidents concerning them. The factors that cause the wire insulation to degrade were examined and techniques to determine when a wire will no longer be capable of transfer of electrical current were evaluated. The results in this study provided n aircraft. The results foun ommittee Intrusive Inspec
te
a platform to evaluate existing and new test methods that could be used to monitor the aging of wire id were similar to the aging samples found from the Aging Transport Systems Rulemaking Advisory Ction Report.
17. Key Words
Aged aircraft, Wire degradation, Electrical interconnect wire, Intrusive inspection, Electrical distribution, Aged wire
18. Distribution Statement
This document is available to the U.S. public through the National Technical Information Service (NTIS), Springfield, Virginia 22161.
19. Security Classif. (of this report) Unclassified
20. Security Classif. (of this page) Unclassified
21. No. of Pages 275
22. Price
Form DOT F 1700.7 (8-72) Reproduction of completed page authorized

ACKNOWLEDGEMENTS
members: Tim Baer—Qualstat Services
a National Laboratories echanical Design Corp.
Jim Meiner—Raytheon Technical Services Company n Technical Services Company, retired
ical Design Corp. al Aviation Administration William J. Hughes Technical Center
tributors included the following:
The Boeing Company e
Safety Board
Raychem Wire Products, Tyco Corp.
United Airlines ited States Air Force, Wright-Patterson Laboratories
. Werner—Sandia National Laboratories D. Lee—Naval Air Systems Command D. Johnson—United States Air Force S. Zingheim—Tyco P. LaCourt—DuPont
ing group—Raytheon Technical Services Co
The core team included the following
Robert Bernstein—SandiBill Linzey—LectromRobert Lofaro—Brookhaven National Laboratories Joe Kurek—Raytheon Technical Services Company
Ron Peterson—RaytheoDr. Noel Turner—LectromechanMike Walz—Feder The aircraft industry con Airbus Industries Airtran Airlines
Bombardier AerospacDuPont
nNational TransportatioNaval Air Systems Command Northwest Airlines QinetiQ
Tensolite
Un Assistance was necessary from the following: R. Pappas and C. Gomez—Federal Aviation Administration A. Bruning, M. Traskos, and S. Mishra—Lectromechanical E. Grove, M. Villaran, and L. Gerlach—Brookhaven National Laboratories Kathy Alam and P
Wir mpany David Puterbaugh—Analog Interfaces
iii/iv

TABLE OF CONTENTS
Page
xv
1
1 1
4
4 7
eriment Setup 8 t Methods and Procedures 11
ng Process 13 evelopment 13
ST RESULTS 15
g Data 15 erature 16
24 echanical Stress Cycles 24
et and Dry 28 3.6.3 Insulation Tensile and Elongation 31
33 34 34 36
39 41
A D TEST RESULTS 41
4.1 The PTFE/Polyimide Composite Aging Data 41 4.2 Temperature 42 4.3 Oxidation 46 4.4 Electrical Stress 47 4.5 Mechanical Stress Cycles 47
EXECUTIVE SUMMARY
1. INTRODUCTION
1.1 Purpose 1.2 Background
2. EVALUATION APPROACH
2.1 Test Program 2.2 Evaluation Method 2.3 Wire Samples 7 2.4 Exp
s2.5 Te2.6 The Agi2.7 Model D
3. POLYIMIDE AGING AND TE
3.1 Polyimide Agin3.2 Temp3.3 Oxidation 23 3.4 Electrical Stress 3.5 M3.6 Testing Results 25
3.6.1 Visual Examination 25 3.6.2 Insulation Resistance W
3.6.4 Inherent Viscosity 3.6.5 Dynamic Cut-Through 3.6.6 Weight 3.6.7 Thermogravimetric Analysis
3.7 Model Development 3.8 Discussion of PI
4. THE PTFE/POLYIMIDE COMPOSITE AGING N
v

4.6 Testing Results 47
4.6.1 Visual Examination 48 4.6.2 Insulation Resistance Wet and Dry 51
tion Tensile and Elongation 53 4.6.4 Inherent Viscosity 54
Cut-Through 55 4.6.6 Weight 56
ogravimetric Analysis 5
4.7 Model Development 60 6
5. E/POLYAMIDE AGING AND TEST RESULTS 62
/Polyamide Aging Data 62 6
69 5.6 Testing Results 69
5.6.1 Visual Examination 70 tance Wet and Dry 73
Tensile and Elongation 75 ic Cut-Through 77
alysis 78 form Infrared Spectroscopy
5.7 5.8
6. CONC
7. RECOM 92
. REFERENCES 93
9.
Pro
B—Discussion
4.6.3 Insula
4.6.5 Dynamic
4.6.7 Therm 7
4.8 Discussion of CP Wire 2
POLYVINYL CHLORID
5.1 Polyvinyl Chloride5.2 Temperature 3 5.3 Oxidation 68 5.4 Electrical Stress 69 5.5 Mechanical Stress Cycles
5.6.2 Insulation Resis5.6.3 Insulation5.6.4 Dynam5.6.5 Weight 77 5.6.6 Thermogravimetric An5.6.7 Fourier Trans 83
Model Development 87 Polyvinyl Chloride/Nylon Discussion 88
LUSIONS 89
MENDATIONS
8
RELATED DOCUMENTS 93
APPENDICES
A— cedure
vi

table Failures (Uncontrolled Perturbations) to the Wire Aging Process and Aircraft Wiring Terminology
D—Te
E—Qu
F—Sam ization and Router for Group 10 Setup 2PI70H
G—Te
C—Single-Event Nonpredic
st Plan
ality Plan
ple Work Author
st Methods Details and Discussion
H—Model Development
vii

LIST OF FIGURES Figure Page
2
2 Types of Wire Failures 3
5 Inverse Temperature Arrhenius Relationship of PI Wire 17
6 Arrhenius Relationship of PI Wire 18
7 Temperature Arrhenius Relationship of PI Wire 18
8 Comparison of PI Dynamic Stressors and Static Stressors 20
9 Additive Effect of PI Dynamic and Static Stressors 21
10 Polyimide Stressor Relationships at Multiple Temperatures 22
11 Life as Log of Hours for All PI Data Points 23
12 Failure Time of PI Specimens at Different Airflow Rates 24
13 Average Cycles to Failure vs Temperature 25
14 Progression of Insulation Damage, Aged at 250°C 26
15 Progression of Insulation Damage, Aged at 300°C 26
16 Unaged PI Wire and Aged Wire (Static) 27
17 Unaged PI Wire and Aged Wire (Dynamic) 27
18 Unaged PI Wire and Aged Wire (75 Hours) 28
19 Unaged PI Wire and Aged Wire (180 Hours) 28
20 Wet IR Results for PI 29
21 One-Minute Dry IR Results for PI 30
22 Ten-Minute Dry IR Results for PI 30
23 Tensile Strength Results for PI Wires 31
1 Wiring Conditions From Intrusive Inspection
3 Stressors Found in Aircraft 3
4 Oven Loaded for Testing 13
viii

24 Instron Elongation Results for 32
Mandrel Elongation Results for PI 32
3
esults for PI Wires 34
35
raight PI Life Specimens 36
re Type 37
al Plot 38
or 44
le Temperatures 46
cted to a Dynamic Stressor 48
-Times Dynamic Bend Test 49
est 50
) 50
sults for CP Wire 52
for CP Wires 53
P Wires 54
s 55
PI Wires
25
26 Inherent Viscosity Results for PI Wires 3
27 Dynamic Cut-Through R
28 Weight Results for PI Wires
29 Weight Loss Curves for St
30 Differential Scanning Calorimetry (Melt Point) for PI Wi
31 Unaged PI Wire TGA Isoconversion
32 Aged PI Wire TGA Isoconversional Plot 38
33 Arrhenius Relationship of CP Wire 43
34 Comparison of CP Dynamic Stressor vs Static Stress
35 Additive Effect of CP Dynamic and Static Stressors 45
36 The CP Stressor Relationships Across Multip
37 Failure Time of CP Specimens at Different Airflow Rates 47
38 Unaged CP Wire and Aged Wire, not Subje
39 Unaged CP Wire and Aged Wires Subjected to a 10
40 Unaged CP Wire and Aged Wire (Example 1) 49
41 Unaged CP Wire and Aged Wire, DWV T
42 Unaged CP Wire and Aged Wire (Example 2
43 Wet IR Results for CP Wires 51
44 One-Minute Dry IR Results for CP Wire 52
45 Ten-Minute Dry IR Re
46 Insulation Tensile Strength Results
47 Insulation Elongation Results for C
48 Inherent Viscosity Results for CP Wire
ix

49 Dynamic Cut-Through Results for CP Wires 56
erature of 490°C (in Nitrogen) 57
re of 490°C (in Air) 58
Hours for CP Wire 59
of PV Wire 64
Data for PV 65
tic Stressors 66
ssors 67
eratures 68
20 Hours 72
000 Hours 72
5200 Hours
74
75
res 77
50 Weight Results for CP Wires 56
51 The TGA Curves at an Isothermal Temp
52 The TGA Curves at an Isothermal Temperatu
53 The OIT Final wt.% vs Aging
54 The TGA Isoconversional Plot for Unaged CP Wire 59
55 The TGA Isoconversional Plot for Aged CP Wire 60
56 Inverse Temperature Arrhenius Relationship
57 Time-to-Failure Curve Compared to IEEE
58 Comparison of PV Dynamic and Sta
59 Additive Effect of PV Dynamic Stressors and Static Stre
60 The PV Stressor Relationships Across Multiple Temp
61 Failure Time of PV Specimens at Different Airflow Rates 69
62 Unaged PV Wire and Aged Wires for 560 and 640 Hours 70
63 Unaged PV Wire and Aged Wires for 400 and 380 Hours 71
64 Unaged PV Wire (White) and Wire Aged for 570 Hours 71
65 Unaged PV Wire (White) and Wire Aged for 7
66 Unaged PV Wire (White) and Wire Aged for 1
67 Unaged PV Wire and Aged Wires for 4200 and 73
68 Wet IR Results for PV Wires 74
69 One-Minute Dry IR Results for PV Wires
70 Ten-Minute Dry IR Results for PV Wires
71 Insulation Tensile Strength Results for PV Wires 76
72 Insulation Elongation Results for PV Wires 76
73 Dynamic Cut-Through Results for PV Wi
x

74 Weight Results for PV Wires 78
75 Differential Scanning Calorimetry for PV Wire 79
)
s at 135°C for PV Wire 81
tion 84
86
76 The TGA Curves at an Isothermal Temperature of 250°C (Unaged Wire 79
77 The TGA Curves at an Isothermal Temperature of 250°C 80
78 The OIT Final Percent Weight Loss vs Aging Hour
79 The TGA Isoconversional Plot for Unaged PV Wire 82
80 The TGA Isoconversional Plot for Aged PV Wire 82
81 An FTIR Spectrum of PV Wire Insulation Cross Section 83
82 An FTIR Spectrum of Partially Aged PV Insulation 84
83 An FTIR Spectrum of Polyamide From PV Insula
84 Two Areas of the PV Spectra to Quantitate 85
85 An FTIR of PV Immersed in Water at 70°C 86
86 Heat-Aged, Unaged-Control, and Humidity-Aged PV Wire
xi

LIST OF TABLES
le Pa
2 Test Setup Matrix 9
4 Comparisons of PI Aging Data With Original Estimated Failure Times 15 m 40
timated Failure Times 41
ilure Data by the Algorithm 61 ed Failure Times for PV 63
A Method 80 ata 87
Tab ge
1 Aircraft Wiring Stressors 5
3 Test Procedures 11
5 Comparison of Actual Failure Data to Predicted Failure Data by the Algorith6 The CP Comparisons of Aging Data With Originally Es7 Final Weight Loss for CP Wire Using TGA 58 8 Comparison of Actual Failure Data to Predicted Fa9 Comparisons of Aging Data With Original Estimat10 Final Weight Loss for PV Wire Aged at 135°C, Using TG11 Comparison of Actual Failure Data to Predicted Failure D
xii

LIST OF ACRONYMS
Alternating current
sport Systems Rulemaking Advisory Committee p assembly
gm
V
E Electrical specimens EWIS Electrical Wiring Interconnect System FAA Federal Aviation Administration FEP Fluorinated ethylene propylene FTIR Fourier transform infrared spectroscopy HFIP Hexafluoroisopropanol IIR Intrusive Inspection Report IPAM 3 Identer Polymer Aging Monitor IR Insulation Resistance L Life MSDS Material Safety Data Sheet NDT Nondestructive test NTSB National Transportation Safety Board OAM Original aircraft manufacturer ODA 4,4’-diamino-diphenyl ether OEM Original equipment manufacturer OIT Oxidation induction time P Property PC Personal computer PI Aromatic Polyimide Tape-Wrapped Isulated Wire PMDA Pyromellitic dianhydride PTFE Polytetrafluoroethylene PV Polyvinyl chloride/nylon PVC Polyvinyl chloride QA Quality assurance RH Relative humidity S Fit TDR Time Domain Reflectometry TGA Thermogravimetric Analysis THF Tetrahydrofuran
AC AI Analog Interfaces ATSRAC Aging TranCCA Cable clamCP Polytetrafluoroethylene/polyimide composites DC Direct current dl/ Intent viscosity units DLO Diffusion-limited oxidation DPA Dielelectric phase angle DS Dynamic stressor DSC Differential scanning calorimetry DW Dielectric Withstand Voltage EA Activation energy
xiii
UV-Vis Ultraviolet visWAMW Weight average molecular weight
on Analysis System
ible
WIDAS Wire Insulation DeterioratiZ Control Specimens
xiv
EXECUTIVE SUMMARY
e life depends on the safe ignals between aircraft electrical components.
his in turn requires that the physical integrity of electrical wire and its insulation be maintained. s aircraft increase in age and cycle time, the wire insulation may be degraded to the point that it no longer capable of ensuring the safe transfer of electrical current. The purpose of this initial search program was to evaluate the aging characteristics of three types of aircraft electrical ire: polyimide (PI), polytetrafluoroethylene/polyimide composite (CP), and polyvinyl
hloride/nylon (PV). In addition, predictive models for aging of these wire types were developed nd evaluated.
hese three wire types were chosen because of their widespread use in commercial aircraft and e amount of reported incidents concerning them. The factors that cause the wire insulation to
egrade were examined and techniques to determine when a wire will no longer be capable of ansfer of electrical current were evaluated. The results of this study provided a platform to valuate existing and new test methods that could be used to monitor the aging of wire in
aircraft. The results found were similar to the aging samples found in the Aging Transport Systems Rulemaking Advisory Committee Intrusive Inspection Report. A multivariable test program to assess the aging of the selected wire types was developed, which included dynamic bending, thermal cycling, vibration, chemical exposure, electrical stress, static stress, temperature, humidity, and airflow. The variables included results from previous test programs. The research program used accelerated aging techniques following a modified version of the “Standard Test Methods for Hook-Up Wire Insulation” (ASTM D 3032) and other industry-accepted methods, such as humidity and fluid exposure, static wrap conditions, and thermal cycling. The effects of nonpredictable, single-event failures were also assessed as part of this program. A quality assurance program to control the test procedures and results was implemented. The test results were tabulated and analyzed using statistical regression techniques to create the aging predictive models. They were continuously updated through the progression of the research program as data became available. The models were used to estimate when aircraft wire would fail due to degradation in multistressor environments in a laboratory setting. The results from this program predicted a median time-to-failure of the actual for PI from -25% to +30%, for CP from -20% to +20%, and for PV -16% to 20% for transformed (nonlogarithmic) time data. Additional data can be implemented into the models to improve on the confidence levels of the results as more data becomes available. The results demonstrate that PI and PV aircraft wires that are present in high-moisture areas will have a higher risk of aging or degradation. Single events such as cut-through or improper handling during maintenance can be more detrimental to the wire than aging from temperature and humidity exposure. Wires not subjected to dynamic and static stressors will last longer if they are undisturbed. Aircraft wiring systems should be designed to minimize wires being subjected to a tighter than 10-times dynamic bend (wrapping) either through a designed flex application or during maintenance and repair actions. Aged wire is more susceptible to these forces than a pristine wire, and the risk of failures to the insulation increases with age.
The continued safe operation of aircraft beyond their expected servicand effective transfer of power and electrical sTAisrewca Tthdtre
xv

Unpredictable single events such of the harness dominated as the main failure mechanism. Visual precursors for wire failure in PV, such as color change, crack
the various zones of the aircraft over its operational life, the environmental and stressor
r nvironments. This research study serves as a preliminary step to better understand and predict
as movement and handling
formation, and flaking, provided important evidence that the wire aged. These properties are an indication of increased risk of physical or electrical failure when a maintenance action is performed. Property tests such as insulation elongation, viscosity, dynamic cut-through, and visual inspection were identified as effective tools to monitor the degradation of wire. The inclusion of tests such as (1) visual for insulation cracking or color change, (2) insulation elongation, (3) inherent viscosity, and (4) dynamic cut-through can help to evaluate the age of the wiring. Other property tests have the potential to monitor degradation with further development. Inconditions to which wiring is subjected is often not completely understood. Current wire specifications do not include qualification requirements for various wire characteristics that would better define wire performance in a multistressor aircraft environment. Wire specifications should be revised to incorporate resistance to cut-through, abrasion, hydrolysis, and longer-term heat aging, as applicable. Predictive models, such as the ones developed under this study, can be a great resource for electrical wiring interconnect system designers to better understand how wire ages and to estimate how a wire may perform in certain multistressoethe degradation of different wire types. Future studies should look into additional wire types and use their respective data to update these models and thus increase their level of confidence and reliability as a design tool.
xvi
1. INTRODUCTION.
It has been an accepted industry standard practice to expect the Electrical Wiring Interconnect System (EWIS) to last for the full design life of the aircraft. The risk associated with this practice increases with the continued use of aircraft beyond the original design life. The Aging Transport Systems Rulemaking Advisory Committee (ATSRAC) Intrusive Inspection Report documented the presence of wire deterioration in different zones of aged aircraft [1]. The quantitative aging of the wire could not be determined because an original wire of the same age was not available for a direct comparison to understand the deterioration of the wire’s physical characteristics. A number of different factors did appear to affect the condition of the wire,
cluding the specific aircraft age, type, maintenance, and aircraft zone. The ATSRAC report
ecialized areas of the aircraft, such as the engine compartment, were not evaluated in the study ecause special types of wire are required in these areas. Also, aging stressors that could not be
controlled in a laboratory setting were identified as perturbations and were not included in the test plan. The test plan, however, did attempt to consider the wire’s ability to withstand some of the uncontrolled conditions, such as elongation. It is known that many of the uncontrolled stressors play a large role in the aging of wire, and some may overshadow the normal aging process due to the environmental and mechanical stresses of routine service application. 1.1
inindicated that the inspected wire age could not be related to its environmental exposure except in extreme instances. A description of the findings can be found in appendix A. A test plan was developed with various aging stressors to determine the relationships between them and wire degradation. Aging stressors are the specific environmental, chemical, mechanical, and electrical factors that impose a stress on the wire installed in an aircraft. Every wire type is expected to have different aging characteristics based on the various stressors to which it is exposed. Every condition that places a stress on the wire will have some effect on the aging. Due to the large number of factors that impact aging wire characteristics, only the most predominant and general factors were examined in this study to define the majority of the aging characteristics of the wire type. Spb
PURPOSE.
This initial research program evaluated the aging characteristics of three types of aircraft electrical wire: polyimide (PI), polytetrafluoroethylene/polyimide composites (CP), and polyvinyl chloride/nylon (PV). Predictive models were developed for the aging of these wire types. The aging process and a preliminary predictive technique was defined to determine when a wire subjected to certain known conditions will not be able to transfer electrical current. 1.2 BACKGROUND.
There are many physical, chemical, and electrical mechanisms that affect the degradation of the wire insulation polymers and conductors. These include thermal oxidation, chemical oxidation, photo-oxidation, ultraviolet exposure, and hydrolysis. Results from the Intrusive Inspection Report [1] regarding the condition of wires from various examined aircraft are shown in figure 1. These conditions define some of the stressors that were present in the aircraft, such as heat,
1

vibration, and chemical contamination, while other conditions present a consequence of the stressors that may have been present, such as cracked and abraded insulation.
Fluid/Chemical Contamination
Cracked/Abraded Insulation
Broken Shield/Conductor
Exposed Shield/Conductor
Corrosion
Other
Heat/Vibration Damage
ss
Indirect Damage
Previous Repairs
important to know how the condition of the wire may be degrading in normal ber of failures due to poor design, installation, or maintenance in order to
Exposed Shield/Conductors
Broken Shield /Conductors
Figure 1. Wiring Conditions From Intrusive Inspection Failures from design, installation, and maintenance issues create stresses that are much more difficult to control and model. Many of these wire failures are due to physical and mechanical damage and are often exacerbated the wire age. Aircraft service data from the National Transportation Safety Board Accident and Incident database, the Aircraft Service Reporting
ystem, Service Difficulty Reports database, and the Navy safety and maintenance data were Sevaluated. It is service and the numselect a wire for an application and ensure that it is installed and maintained properly. A query of these service databases show many accidents and incidents reports were caused by the wire’s inadequate performance in normal service environments, and by application issues related to the design, installation, and maintenance, as shown in figure 2.
2

Insufficient DataDesign, Maintenance,
etc. Related
Wire Performance Related
Insufficient DataDesign, Maintenance,
etc. Related
Wire Performance Related
55 % 33 %
12 %
Figure 2. Types of Wire Failures A Federal Aviation Admi AA) research intenance evaluated multiple aircraft fro operato ber of stressors that were present. These stressors shown in figure 3 were reviewed for implementation into the research study.
nistration (Fm multiple commercial
program on aircraft mars and identified a num
Figure 3. Stressors Found in Aircraft
3

2. EVALUATION APPROACH.
The “Standard Test Methods for Hook-Up Wire Insulation” (ASTM D 3032) method was modified to allow the aging program to evaluate a multitude of environmental stresses. The testing was performed using strict procedural guidelines for ensuring the validity of the data. The Dielectric Withstand Voltage (DWV) test was used as the final criteria to determine when a wire can no longer safely carry the required current. Other stre a part of the multivariate design of experiments, were examined separately. Many of these additional stressors were deemed single-point, nonpredictive events (perturbations to the normal aging process) that could not be effectively modeled in an aging program due to the complexities of modeling degradation for each variable. Analysis of these events was primarily qualitative and attempted to assess how these perturbations affected the normal degradation equations. A more detailed discussion can be found in appendix B. ASTM D 3032 was used to determine the temperature rating of wire based on oxidation degradation; it uses a combination of thermal, mechanical, and electrical stresses to define the life of a wire sample. Changing the level of the stress factors affects the wire temperature rating,which is typically the maximum lation for a specific period of
me, often 10,000 hours. Me ral accelerated temperatures,
ssors, not directly
exposure temperature of the insu
asurement of the wire life at sevetibased on the DWV failure, allows analysis of the data to make predictions on the potential life of the wire at the rated and lower temperatures. These lower temperatures are often more typical of the actual temperatures to which the wire is exposed or operated. .1 2 TEST PROGRAM.
The test program was designed to generate and analyze data that would facilitate the development of models designed to predict the time-to-failure of aircraft wiring. Different stressor combinations were tested at multiple temperatures and were fitted by a line to approximate the Arrhenius relationship. A list of aging stressors is shown in table 1. Median life estimates for any specific temperature can be computed for the wires subjected to any dynamic-static stressor combination using the models developed. Separate aging models were developed for each wire type tested in this program to enable the extrapolation of median life for the wire subjected to combinations of these dynamic and static stressors as well as temperature and relative humidity. Development of the aging models required the generation of data points for time-to-failure for each wire type with combinations of the various stressors over various temperature and humidity environments. The detailed test plan can be seen in appendix D.
4

Table 1. Aircraft Wiring Stressors
Stressor Levels in Aircraft Notes Test Program Temperature, High (Life)
Up to 260°C One of the central stressors for the thermal oxidative aging of aircraft wire.
Yes, up to 300°C
Temperature, Cold (Cold Bend)
-40°C Very low temperatures do not affect the aging, but do affect the properties due to the increased rigidity of the insulation (
No
maintenance, operation). Temperature Cycling and Shock
Typically -40° to +85°C
Stress of continually cycling temperatures during periods of operation at altitude and idling on the ground may directly affect abrasion insulation integrity.
Yes, down to -55°C
Chemical Resistance Humidity/Moisture
Depends on Insulation Type
Evaluated many potential fluid types: comm
Yes, selected a high
High/Low pH Fluids/Cleaners Corrosion Preventative Compounds Fuels, Lubricants Deicing Fluid Others
certain insulation types and corrosion preventive compounds very similar to fuels and lubricants.
on aircraft fluids as well as fluids known to affect
pH cleaner, jet fuel, deicing fluid, and hydraulic fluid
Pressure, Barometric High Altitude Some insulations are known to outgas, creating mass loss, increased rigidity, etc.
No
Bending, Flexing tress
Ten times bend to straight. Three times
Stress seen during installation and
Yes S
allowed in certain applications. Flexing per application or during maintenance
maintenance actions. Design allows for a certain bend radius in the wire (static strain), while maintenance actions may flex wire. A notch or other insulation flaw will be magnified by this stress.
5

Table ued)
Str Levels N
1. Aircraft Wiring Stressors (Contin
essor in Aircraft otes Test ProgramVibration Stress
Sine, High Frequency
Force tha or chafinor may ca
Random, t can cause abrasionuse flexing.
g, Yes
Shock, High-G Force
By airframe Mechanic No
(Landing)
al force acting on the wire.
Abrasion or Chafing With or Without Debris
Wire to Wire Wire to Structure
One of th l stressors. and vibrationinsulation integrity.
Yes e most important mechanica Directly affected by shock . Direct affect of the ’s mechanical
Debris Sand, Drill i
and L
Directly ion, may hold sulationnd may
No
was evaluated in the FAA Mixed Wire Program
Shav ngs, Dust int a
affects the severity of abras fluids closer to the increate a flame hazard.
, This parameter
Current Stress Loads
High, Overload High current causes resistive current as temperatu
See high temperature re increases.
Lightning DO-1rtu
Can weak pertie per
groundin onthe wirin
60 rbation prope
en or damage the dielectrics of the insulation. Prog should minimize impactg.
No
Ozone, Oxidative Pollutants
168 hours at 0.5 ppm
Expectedinsulationexposure minimal.
Yes to force the aging of s due to oxidation, but
in aircraft is suspected to be
Arcing Perturbation Not seen as an aging stressor. No Corona Perturbation Not seen as an issue with lower voltages.
bove 10 micro-corona siaircraft p
No See voltage stress
A 00 volts may producetes in dielectric. Typical ower <300 V.
Ultraviolet Perturbation A definit r to certain er insulations. Most wire
e from iole
No Radiation
e aging stressopolymconsiderultrav
d to be protectedt exposure in service.
Thermal, Humidity, and Mechanical Strain
Combabove levels
This com e past on p w a direct synergistic effect. May apply to
u t expected to apply to fluoropolymer insulation
Yes inations of bination has been tested in tholyimide materials to sho
lation types as well, but no
s.
other ins
6

2.2 EVALUATION METHOD.
The ocol ipal insulation deg echanism is oxidegrad s i e ation and
zation deg m ASTM D 3032 test method. This k nerally owev t does not
s stressors have specific thermal, mechanical, and electrical characteristics. By se str ore r a b predictive
elo
of the aging stressors are ely proportional to the service life of a wire. The hig aster the material
ted. In ge of inerepresentative lev y typically designed to exceed 10,000 hours of servic peratures with specific mechanical and electrical factors. Therefore, to induce wire de a shorter period of time, the stress levels were increased to accelerate the aging he
ve the dat cting e o al
tress f crease tress ors and by combining them; ide in n the aging process that may radically affect the rate of degradation. In other words,
as a cata s faster. Ea essor was s static nv various lev were then o test f ractions.
ressors ar efine straight appl ns or in a ition. Th define the aging Dynamic action nd
chemical contamination regardless of tal s he specific conditions under which a sam lude var vels and
s of and as use the final n of w
2.3
test prot assumes the princ radation m dation and the secondary volatili
ation mechanismradation mechanis
nclude hydrolysis and volatilization. Ths are addressed by the
oxid
method is well address the impact of the mThe aging
nown and geany stressors that ma
accepted in the aircraft industry; hy affect these aging mechanism
er, i or hydrolysis.
changing themodel was dev The levels
essors to be m eflective of aircraft wiring applications,
important factors and are invers
etter ped.
useable is affec
her the level of stress on a material, the fthe various aging stressors were determthe wire in the aircraft. The wire types being studied are
e life at rated tem
neral, the levelsels experienced b
d based on the
when stressedterioration in process. T
models were dethe performanc
loped to provide f wire under norm
most appropriate method to extrapolate operating conditions.
a for predi
Particular s actors may in
they may prov the susceptibility of a wire to other ssight into the presence of interactions i
the presence of stress factor A
fact
may actclassified acombined t
lyst causing stres, dynamic, and e
or inte
factor B to age the wire muchironmental. These stressors, at
ch strels,
Static st e those that d whether a wire is installed in icatiobent posprocess.
e bend radii stressors are
the strain that a specimen is subjected to durings that can occur on the wire such as flexinthe static stressor applied. Environmenple will age. These stressors inc
g, abrasion, atressors are tying le
combinationdeterminatio
temperature ire failure.
humidity. The wet DWV test w d as
WIRE SAMPLES.
ac e, being used for w Thes ire types could be
the future. All the wire s
The Aromatic Polyimide Tape-Wr milar to other wire specifications such as MIL-W-81381 BMS 13-51 and has been commonly used in
1970s. The wire tested was a nickel-coated copper conductor rapped with two layers of fluorinated ethylene propylene (FEP)-coated polyimide N film,
followed by a thin topcoat of polyimide/polyamide. The FEP provides adhesion between the
The aging charairframe wiringevaluated in
teristics of three were evaluated.
ire types that have been, or currently are provide a framework to which other w
amples were 22 gauge.
apped Insulated Wire (PI) is si and Boeing
transport aircraft since the w
7

layers of polyimide, which themselves cannot be easily fused together within temperature limits that would not damage the finished wire.
he extruded polyvinyl chloride (PVC) is a tin-coated copper conductor with a polyvinyl
The Aromatic Polyimide Tape Wrap With Fluorocarbon Bonding Layers and a polytetrafluoroethylene (PTFE) outer wrap composite (CP) is a nickel-coated copper conductor wrapped with multiple layers of fluorocarbon-coated polyimide N film in accordance with Boeing BMS 13-60, which is similar to specifications such as the initial MIL-W-22759/80 and /92 construction and Airbus. This wire type is often referred to as TKT wire and has been commonly used on large transport aircraft since the mid 1990s. Tchloride extrusion followed by a polyamide extrusion. The wire type was commonly used on large commercial and military transport aircraft from the early 1960s to the late 1970s [1]. Similar constructions include Boeing type BMS 13-13 and Douglas type 7616964 and are commonly referred to as PV. 2.4 EXPERIMENT SETUP.
A multivariate test program using stressors and environments was developed for each wire type evaluated. Time was the independent variable throughout the test program. The dynamic
ressors were randomly assigned an identifier number, and identifier letter codes defined the
ative humidity (RH) at up to 95ºC.
ded to be secured, except for flex applications.
osed to a straight, 1-time, 6-times, and 10-times static strain. Typical wire installation guidelines recommend 10-times strain or less; however, higher strain is allowed
e wire samples were also subjected thermal cycling of 100 cycles at -55º to 85ºC after each aging cycle. Four aircraft fluids, a
stspecific environmental and static stressors. A list of definitions for the stressors and environments can be found in appendix G. Several of the stressors selected for this program were varied in severity. For PI and CP wires, the test temperature was elevated beyond what wire normally experiences on aircraft, with an elevated temperature of 300ºC. For PV wire, the elevated temperature was 135ºC. Humidity exposure was also varied in certain setups with some samples being exposed to 100% rel
Wire samples were subjected to 4 cycles of bend per aging cycle, totaling between 40-60 cycles. This interval is estimated to be in the range of what may be expected from maintenance actions or modifications for a typical aircraft wire, but not in a flex application. Wire radii bend dynamic tests were varied from 3-times radii to 10 times. The 3-times radii bend is more severe than what would be expected from a maintenance action, while the 10-times radii bend may be experienced periodically during maintenance, but is usually less severe. Generally, wire is typically not moved and is inten Wire samples were exp
in certain situations. In addition, the samples were subjected to a vibration abrasion test, approximately 0.032 lb/linear inch for 2400-3000 cycles of 0.9 inch length, using a flat 6061 T6 aluminum plate with a 24- to 30-microinch surface finish. Thtohigh pH cleaner, jet fuel, de-icing fluid, and hydraulic fluid were used in the test program. The wire samples were exposed to 8-12 hours per fluid type, which may be less than what is experienced in actual applications.
8

A test matrix showing the tests performed for each wire type is shown in table 2. The numbers within each cell refer to the temperature in degrees Centigrade for each setup run at that nvironmental, dynamic, and static stressor combination. Setups marked with a “+” have an
eadditional electrical stress variation. The setups selected for this program were designed to evaluate the selected critical variables and to model their effects. The total number of setups tested for each wire type was: PI 39, CP 28, and PV 26 setups. Additional experiments were done to PI to quantify the known degradation mechanism of hydrolysis.
Table 2. Test Setup Matrix
Conditions A/A+ B C6/C1 D E6/E1 F G H I J
0% RH – Ovens
85%-25%
70% RH RH,
Cycled 85% RH 100% RH
(Immersion)
Wire Type Stressors
Straight (°C)
Static Strain (°C)
Static Strain (°C)
Static Strain(°C)
Static Strain(°C)
Static Strain (°C)
Straight (°C)
Static Strain (°C)
Straight(°C)
Static Strain(°C)
10-imes
6-/1-Times
10-Times
6-/1-Times
10-Times
10-Times
10-Times T
PI No stressor protocol (only DWV test)
260+, 280, 300+
260, 280, 300
300/300 95 95/95 95
PI Dynamic bend (roll up/down x
250+,270, 280, 300+*
250, 280, 300
70, 95 70 95 70, 95 95 45, 70, 95
2) 10-times mandrel
PI Dynamic bend (roll up/down x 2) 3-times mandrel
250, 280, 300
280
PI Temp shock (100 cycles,
260
-55° to +85°C)
PI Vibration (abrasion)
260
9

Table 2. Test Setup Matrix (Continued)
Conditions A/A+ B C6/C1 D E6/E1 F G H I J
0% RH – Ovens 70% RH
85%-25% RH,
cycled 85% RH 100% RH
(Immersion)
Wire Type StressStraight
(°
Static Strain
Static
C)
tattra°C )
mes atic ain
) Straight
)
10-Times Static Strain
) Straight
)
10-Times Static Strain
)
10-Times
6-/1-Times
10-imes
6-/1-Times
10-Ti
ors C) (°C) Strain(°
S(
TS ic
inStatic Strain
StSt
) (°Cr
(°C (°C (°C (°C (°CPI Fluid soak
preceded by 10-times mandrel bend
300 300
PI/PTFE No stressor protocol (only DWV test)
260+, 280, 300+
260, 280, 300
PI/PTF ip
el
E Dynam(roll u
c bend /do
times wn x
2) 10-mandr
260+, 2 60, 2300 80,
95 70, 95280, 300+*
PI/P ic bend
-timrel
2280,
280 TFE Dynam(roll up/2) 3mand
down x es
60,
300
PI/Pcles,
° to
260 TFE Temp shock (100 cy-55 +85° C)
PI/PTFE Vibr(abra
atision)
260 300 on
PI/PTFE Fluid soak ded by es l ben
300 300 prece10-timmandre d
aded cells are the reference conditions to the ASTM D 3032 test method. Some setups are
t expected to fail within the testing time available. ns with additional electrical stress variable samples will be run at the setups with
res identified by a superscript +.
* Will be used to evaluate oxidation rate and will be run at low, medium, and high oven air exchange rates.
Notes: 1. Letters in the Conditions columns for a particular stressor represent undetermined
temperatures at which that combination will be run. Two- and three-digit numbers represent actual temperatures in degrees centigrade (°C).
2. A blank indicates that no tests will be performed in that condition.
Shno
+ Conditiotemperatu
10

The effects of two addition ugh damage, although not predictable, were evaluated. These are refer nonpredictable failures. Unfortunately, not all stressors can be quantitatively con measured. For example, a wire that is stressed during lla nc by an rrant drill bit may be damaged and fail immediately. An example of the resulting ge is a mechanical gouge in the insulation that exposes the conductor. This cannot be effectively modeled because the damage is so severe and so quick, completely overwhelming g process and rendering aging algorithms useless. T s, however, where the wire can conwithout failing if an exposed cond t th a con surfaceshort circuit. Wire abrasion agains s due to sign, brprimary support, or drill s
pro w e d operturbations and their effects on each wire type are con d and complete descriptions, including tests performed, testing frequencies, and types of specimens are in appe 2
al stressors, fluid exposure and cut-throred to as single-event
trolled and insta tion or during maintena e e
dama
the aginhere are instance
does nuctureundle
tinue to age uctor
t the strin a b
ot mak or othare all e
e coner comother
act wiponentperturb
ductive poor de
at do t
and oken se an havings
ilations thm e
not caui iimmediate blem, but l manifest over tim if undetect
ta ed. Ain
ore d ailed scuss n of in appendix C. The test protocols
ndix D.
.5 TEST METHODS AND C RE PRO EDU S.
Several ins ocum e veloped to define the specific quality assurance aspects o q p con ained n app ndix .) Sta ard c ureaging and property tests were used when possible. Where no previous procedure existed for aging and property test, new pro ented. The referenced aging procedures and property tests ted in tab e 3.
Table 3. Test Procedures
oNum 100 Environmental Series Industry Standard Methods
tructional d ents w re def this test program. (The uality
cedures were developed and docum
lan is t i e E nd test pro ed s for
are lis l
Test Pr cedure ber
AWD-TP n aging ASTM D 3032, SAE AS4373 method 804, modified
-101 Ove
AWD-TP-102 Temperature shock MIL-STD-810 AWD-TP-103 Humi SAE AS4373 method 603,
modified dity
AWD-TP ersion SAE AS4373 method 602, modified
-104 Water imm
AWD 01, modified
-TP-105 Fluid immersion SAE AS4373 method 6
AWD 1 -TP-106 Flammability SAE AS4373 method 80AWD-TP-107 WIDAS Lectromec Proprietary 200 Physical/Mechanical Series AWD
procedure -TP-201 Visual inspection Standard laboratory
AWD-TP-202 Dynamic bend test SAE AS4373 method 71modified
2,
AWD-TP RTSC-developed procedure -203 Vibration (Abrasion) AWD-TP-205 Indenter developed AI/FAA
11

Table 3. Test Procedures (Continued)
Test Procedure Number 200 Physical/Mechanical Series Industry Standard Methods
AWD-TP-206 Weight measurement SAE AS4373 method 902, modified
AWD-TP-207 Insulation tensile and elongation SAE AS4373 method 705, modified
AWD-TP-208 Conductor tensile and elongation SAE AS4373 method 402, modified
AWD-TP-209 Dynamic cut-through SAE AS4373 method 703 AWD-TP-210 Static cut-through Lectromec Method AWD-TP-211 Density Standard laboratory
procedure AWD-TP-212 Modulus profiling Per Intrusive Inspection
procedure 300 Electrical Series
AWD-TP-301 Wet Dielectric Withstand Voltage SAE AS4373 method 510, modified
AWD-TP-302 Insulation resistance (wet) SAE AS4373 method 504 300 Electrical Series
AWD-TP-303 Insulation resistance BNL/RTSC-developed procedures
AWD-TP-304 Dielectric ph BNL/RTSC-developed procedures
ase angle
A Time domain reflectometry BNL/RTSC-developed p
WD-TP-305 rocedures
AWD-TP-307 Conductor resistance SAE AS4373, method 403 400 Materials/Miscellaneous Series AWD-TP-401 Thermogravimetric analysis cedure NAWC-developed proAWD-TP-402 Inherent viscosity DuPont/Lectromec-develop
procedure ed
AWD-TP-403 Oxidation induction time BNL/RTSC-developed procedure
AWD-TP-404 Ultraviolet-visible spectroscopy Sandia-developed procedureAWD-TP-405 Fourier transform infrared spectroscopy Sandia-developed procedure,
Standard laboratory procedure
R hnical ircraft wiB Nation AI = Analog interfaces
TSC = Raytheon TecNL = Brookhaven
Serval Laboratory
ices Company AWD = A ring degradation
12

2.6 THE AGING PROCESS.
The s were thermally aged using the oven aging method from ASTM D 3032. This m vides a me empera i ire ins he life specimens were placed into the aging cycle along with all the specimens in the property testing setup in the heating ovens. The second and t specim r approxi rst cycles, respectively, were com in order t rd A st pro al definit fe specime onditio ype were aged toget In s nd CP n the same chamber. ens w ace fo
wire specimenethod pro ans for developing time versus t ture curves and temperature
ndices for the w ulation. One third of t
hird sets of life ens were placed in the ovens aftepleted. This was done
mately 1/3 and 2/3 of the fio improve upon the standa
STM D 3032 teens. Due to the large number of setups, the samples that were aged with common
cedure since this provided addition ion of failure times for the li
nvironmental c ns of the same wire td i
her in the same chamber. ded ovome cases, PI a samples were place
lation. Figure 4 shows loa
ith plenty of sp r air circu
Figure 4. Oven Loaded for Testing A of agi ed and were st mples ectrically with Insulationsaltwater solution, and other testr ired fo ed for each test s I lysis o appropri t . Fo w problems seen early in the testing. Aging times for a cycle were also modified as the testing progressed in order to focus on the period when the life specimens would begin to fail.
fter each cycle ng, the specimens were remov tressed in accordance with the est plan. The sa were then tested el Resistance (IR), DWV in 5%
methods, as defined by the test plan. The specimr the property tests schedul
ens were etup. emoved as requ
ntermediate ana f the time-to-failure data allowed ate adjustments to be made tohe test program r example, the stress level of vibration as reduced due to specimen
2.7 MODEL DEVELOPMENT.
Tmultim
he models were developed assuming that a single or coordinated thermally based echanism reaction was occurring and the overall effective activation energy (EA) can be
estimated and used to effectively model thermal oxidative aging. When all samples failed, the median life was calculated using the standard log average life approach. If some of the samples did not fail (censored data), the median failure time was calculated based on a probability/hazard
13
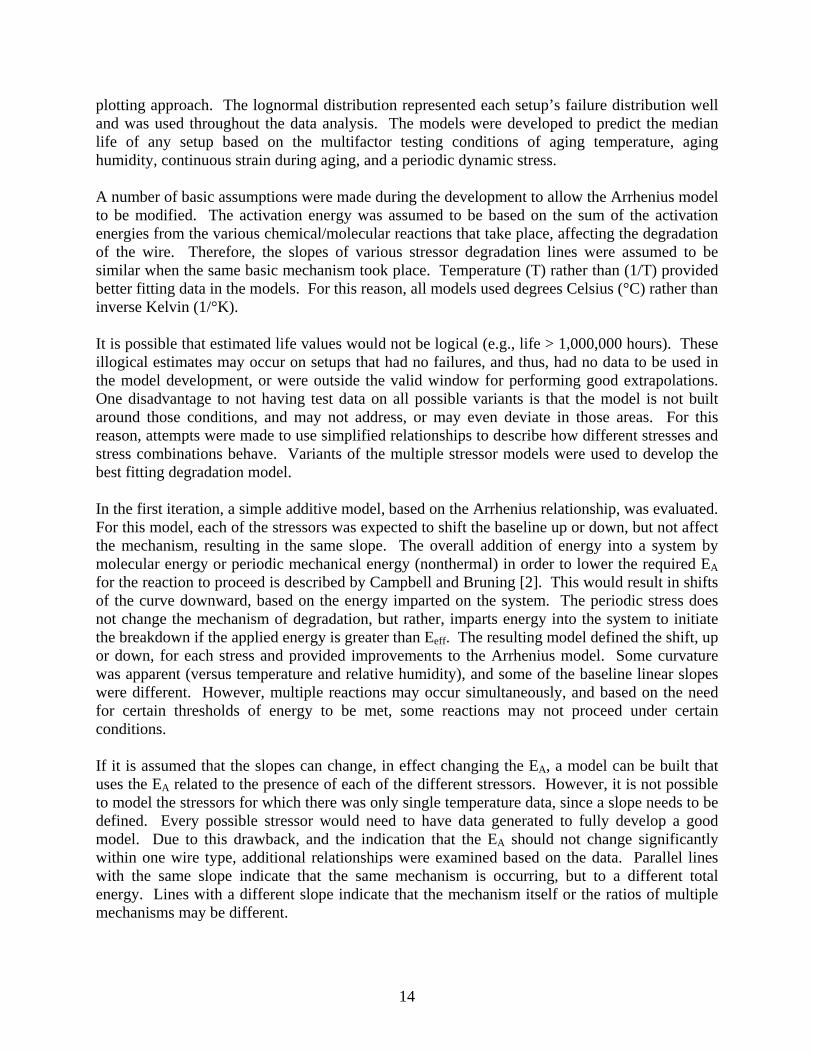
plotting approach. The lognormal distribution represented each setup’s failure distribution well and was used throughout the data analysis. The models were developed to predict the median
is possible that estimated life values would not be logical (e.g., life > 1,000,000 hours). These illogical estimates may occur on setups that had no failures, and thus, had no data to be used in the model development, or were outside the valid window for performing good extrapolations. One disadvantage to not having test data on all possible variants is that the model is not built around those conditions, and may not address, or may even deviate in those areas. For this reason, attempts were made to use simplified relationships to describe how different stresses and stress combinations behave. Variants of the multiple stressor models were used to develop the best fitting degradation model. In the first iteration, a simple additive model, based on the Arrhenius relationship, was evaluated. For this model, each of the stressors was expected to shift the baseline up or down, but not affect the mechanism, resulting in the same slope. The overall addition of energy into a system by molecular energy or periodic mechanical energy (nonthermal) in order to lower the required EA for the reaction to proceed is described by Campbell and Bruning [2]. This would result in shifts of the curve downward, based on the energy imparted on the system. The periodic stress does not change the mechanism of gy into the system to initiate
e breakdown if the applied energy is greater than Eeff. The resulting model defined the shift, up
proceed under certain onditions.
eds to be efined. Every possible stressor would need to have data generated to fully develop a good
nd the indication that the EA should not change significantly within one wire type, additional relationships were examined based on the data. Parallel lines
life of any setup based on the multifactor testing conditions of aging temperature, aging humidity, continuous strain during aging, and a periodic dynamic stress. A number of basic assumptions were made during the development to allow the Arrhenius model to be modified. The activation energy was assumed to be based on the sum of the activation energies from the various chemical/molecular reactions that take place, affecting the degradation of the wire. Therefore, the slopes of various stressor degradation lines were assumed to be similar when the same basic mechanism took place. Temperature (T) rather than (1/T) provided better fitting data in the models. For this reason, all models used degrees Celsius (°C) rather than inverse Kelvin (1/°K). It
degradation, but rather, imparts enerthor down, for each stress and provided improvements to the Arrhenius model. Some curvature was apparent (versus temperature and relative humidity), and some of the baseline linear slopes were different. However, multiple reactions may occur simultaneously, and based on the need for certain thresholds of energy to be met, some reactions may not c If it is assumed that the slopes can change, in effect changing the EA, a model can be built that uses the EA related to the presence of each of the different stressors. However, it is not possible to model the stressors for which there was only single temperature data, since a slope nedmodel. Due to this drawback, a
with the same slope indicate that the same mechanism is occurring, but to a different total energy. Lines with a different slope indicate that the mechanism itself or the ratios of multiple mechanisms may be different.
14

The following sections provide a description of the aging and property test results for each wire type. The test data generated in this program included aging time to DWV failure, electrical measurements, physical property measurements, and visual observations. The time-to-failure data was analyzed from which aging models for each wire type were developed. In the figures
r property tests, the final data point for each test setup generally represents the final aging focycle, which was typically when the last life specimens failed the DWV test. 3. POLYIMIDE AGING AND TEST RESULTS.
3.1 POLYIMIDE AGING DATA.
The aging data for the 1onsidered complete upo
1 life specimens from each test setup was recorded at each cycle and n the final DWV failure. Table 4 shows the median time-to-failure for
a straight sample would be expected to have a longer median me-to-failure than a 10-times static-wrapped sample. The complete aging data can be found in
ceach of the test setups, as well as estimated failure times based upon previously generated aging data. The failures were generally accompanied by cracking of the wire insulation. The dynamic wrap around a mandrel 10 times the diameter of the wire and no static strain during oven aging exhibited consistently longer times-to-failure than those documented by Elliot [3] for the same stressor conditions. The median time-to-failure of the samples varied due to the stressor combinations. In most cases, the time-to-failure mirrors the generally accepted view of how detrimental a stressor or stressor combination is to a wire. However, Group 1 setup 9 differed from Group 1 setup 13, wheretiappendix H.
Table 4. Comparisons of PI Aging Data With Original Estimated Failure Times
Group Setup Temp. (°C)
RH (%)
Dynamic Stressor
Static Stressor
Estimated Failure Time
(hr)
Median Failure Time
(hr) 1 9 250 0 10 times Straight 5821 7,276 1 13 250 0 10 times 10 times 7,695 1 16 250 0 3 times Straight 3,485 2 4 260 0 None 10 times 7,732
2 21Temp 260 0 Cycling 10 times 8,805
3 5 280 0 None 10 times 3,291 3 11 280 0 10 times Straight 1226 2,662 3 14 280 0 10 times 10 times 2,245 3 17 280 0 3 times Straight 970 4 3 300 0 None Straight 2,977 4 6 300 0 None 10 times 932 4 7 300 0 None 6 times 932 4 8 300 0 None 1 time 2,546 5 12 300 0 10 times Straight 474 843 5 15 300 0 10 times 10 times 564 5 18 300 0 3 times Straight 335
15

Table 4. Comparisons of PI Aging Data With Original Estimated Failure Times (Continued)
Group Setup Temp. (°C)
RH (%)
Dynamic Stressor
Static Stressor
Estimated Failure Time
(hr)
Median Failure Time
(hr) 5 19 300 0 3 times 10 times 441 7 28 300 0 Fluid Straight 875 7 29 300 0 Fluid 10 times 752 8 34 70 70 10 times 10 times 7,456 9 30 95 70 None 10 times 6,239 9 35 95 70 10 times 10 times 4,274 10 38 70 85 10 times 10 times 1,766 11 41 45 100 10 times 10 times 1,908 12 42 70 100 10 times 10 times 349 13 33 95 100 None 10 times 90 14 40 95 100 10 times Straight 2,316 15 43 95 100 10 times 10 times 136 16 36 70 85-25 10 times 10 times 5,755 17 37 95 85 10 times Straight 7,371 17 39 95 85 10 times 10 times 488 2 1 260 0 None Straight >10,150* 2 24 260 0 Vibration Straight >10,150* 3 2 280 0 None Straight >4,444* 9 64* 31 95 70 None 6 times >2,89 32 95 70 None 1 time >3,537* 18 10 270 0 10 times Straight 2016 >800*
et d o fail specim al hou when stop
3.2 EMP TU
*These s
ups stoppe prior t ure of ens. Actu rs of aging ped.
T ERA RE.
The aging data from each setup was analyzed using techniques defined by Relative Th ife and Temperature Index (SAE AS4851). When al failed, the median life values were ca lated g st d log vera etho e of the samples did not fail, the m an fai tim calcu ted b ro , 5, an ]. Th ogno distri ion throughout the data analysis since it represented each setup failure distribution
The analysis was based on up to 11 life specimen re aged to fa ure within ea tup. Thirty-seven sample setups were aged at various conditions. Ten to 11 specimens failed in 24 of th tups, while 6 s ures in the specimens. One additional setup had two fa spec ates of the time-to-failure and the 90 percent of expected life were developed for each of the 37 setups. Finally, a comprehensive model was developed to pr ct the ian f any up, b e m test conditions.
ermal Ll samples
lcu usinl e
andar a ge life mn a probability and hazard plotting app
d. If somedid 6
ure
e wasrmal
labut
ased owas us
ach [[4l ed
.
s that we il ch se
e se setups had at lea t 4 faililed imens. Estim median
edi med life o set ased on th ultifactor
16

H t ultiple temperatures were fitted by a line to approximate the Arrhenius curve. Median life
estimates for any specific temperature, which was similar to the al reg be computed for any nati f dyn sor, tresso h
d ro Arr s plo vatio (EA) can be determined as well as the estima en thousan hours is typically used to determin e wi axim tem re ratin itary purpose . Insulation a h r acti n e epe us slope) an a higher te ure index would be preferred for better longevity in a general application with thermal oxidative environme ince leads n in me-to-failure at lower temperatures. The concept of desiring a high E r tem ture d hi ature index be extended to desiring a high hum y slop d a idity index. The EA, as classically defined, could n dete ned f the m s d The Arrhenius plot for the 11 samples that failed at h of three up te atu wn figure 5. An approximation in the activation energy (EA 5.1) the te atu oul ated at a spe ific time fro lot. A parison to the IEEE [3 is figu
umidity/static, strain/dynamic stressor combinations that were applied to the specimens am
experimentr, and relative
ion, can umidity from combi
m theon oheniu
amic strest, the acti
static sn energythe fitte line. F
tion of the temperature index for a specific time. T d e th re’s m um peratu g for mil s
with ighe vatio nergy (ste r Arrheni d mperat
nt, s this to a creased tiA fo pera slope an gh-temper can alsoidit e an high hum
ot be rmi rom odel eveloped. ho eac the set mper res is s
= 2 and mper re index c d be estim c m the p com ] data shown in re 6.
[1/Temp(°K)]
Log(
Hrs
)
0.00
1925
0.00
1900
0.00
1875
0.00
1850
0.00
1825
0.00
1800
0.00
1775
0.00
1750
4.
4.
3.
3.
25
00
75
50
3.25
3.00
2.75
2.50
S 0.R-SqR-Sq(adj)
082494795.7%95.5%
Regres99.7%
P 1, Hrs) + 5 p(°K)]
sion PI
I: DS=2 RH=0%Log( = - 6.565 474 [1/Tem
Figure 5. Inverse Temperature Arrhenius Relationship of PI Wire
17

(1/ T)
Log(
Hrs
)
0.001
925
0.001
900
0.001
875
0.001
850
0.001
825
0.001
800
0.001
775
0.001
750
4.00
3.75
3.50
S catterplot of Log(Hrs) vs (1 /T) - PI: 1 0 x.S
FAA S tudy1972 IEEE
3.25
3.00
2.75
2.50
Figure 6. Arrhenius Relationship of PI Wire When plotting the individual log life values from each sample against the direct temperature (°C) at each of the three setups, a simplified Arrhenius relationship can be seen. The linear fit of the failure data is shown in figure 7. Traditional approaches plot log life against inverse Kelvin temperatures (1/°K). An extrapolation of the log life versus temperature fit from the figure 7 results in a temperature rating of 244°C at 10,000 hours and 200°C at 60,000 hours. While figure 5 uses the traditional Arrhenius model approach, the extrapolation results in the same temperature rating of 245°C at 10,000 hours, but a slightly higher 209°C at 60,000 hours.
Temp
Log(
Hrs
)
300290280270260250
4.2
4.0
3.8
3.6
3.4
3.2
3.0
2.8
2.6
S 0.074551R-Sq 96.5%R-Sq(adj) 96.4%
5
Regression99.7% PI
PI: DS=21, RH=0%Log(Hrs) = 8.492 - 0.01839 Temp
Figure 7. Temperature Arrhenius Relationship of PI Wire
18
Clearly, within the region of the temperatures tested, it is simpler to model directly against temperature instead of adding the complexity of using inverse temperature. Outside the testing envelope, the confidence decreases and the models diverge. The use of temperature in the models fit the data better for all stressors of each wire type, even though the theoretical basis is to use inverse temperature (1/T). For comparison, using the PI model resulted in temperatures of 245°C for 10,000 hours and 206°C for 60,000 hours. A general rule of thumb for extrapolation is to stay within 20°C for a decent extrapolation. Sixty thousand hours is beyond this, and the estimate of time-to-failure should be viewed with that perspective. The solid prediction line in figure 7 is bounded by dashed 99.7% prediction interval lines. These 99.7% PI lines are similar to ±3S control chart limits and should contain approximately 99.7% (almost all) of the future individual failure times. Any individual failures outside these PI limits would be considered a statistical outlier. Figure 8 shows the comparison of the main effects of each dynamic stressor and static stressor for DWV failure to occur. This comparison averages the values across temperatures and the logarithmic mean of hours to failure increases when a stressor is less stressful. For examdynamic stressor 1 (no dynamic stress) shows a 1000% longer mean time-to-failure, while dynamic stressor 3 (3-tim e baseline of stressor 2
STM baseline with 10-times wrap).
al the ire into a new form, allowing the insulation to reduce its effective strain [7]. This infers that
combinations of stressors may have a significant effect on the mean time-to-failure.
ple,
es wrap) exhibits 2/3 the average life over th(A This comparison also shows that a 10-times static strain exhibits roughly 20% of the average life as the ASTM baseline setup. The 10-times and 6-times bends reduce the mean failure time by half. This would indicate that if the wire was used in service with a static bend, the estimated service life for that wire would be half of what would otherwise normally be used. Previous testing has shown that the presence of a static strain in the wire will increase the aging of wire. However, it has also been shown that the temperature at which a wire ages can also annew
19

Comparison of PI Dynamic Stressors and Static Stressors
Figure 8. Comparison of PI Dynamic Stressors and Static Stressors Figure 9 depicts the additive effects from each of the dynamic and static stressors for each test setup. The black points are the means of aging, based on the actual test results determined in this test program, while the red points are the predicted means, based on the predictive model that was developed. As the figure shows, the model tracks the actual aging fairly well. The data analysis was performed using the pooled data from all the individual PI specimen failures. The final model combines the additive effects of the discrete dynamic/static stressors with the gradual trend effects that temperature and relative humidity have on the expected life of the samples. As temperature and/or relative humidity increases, the expected life systematically decreases. Interactions between some of these factors are also incorporated. For example, the presence or absence of humidity has a significant impact on how much a 10-times static wrap sample will reduce life versus a straight sample aged without strain. At 0% RH, straight and 10-times static strain samples have similar expected lives, but the 10-times static samples fail much earlier with humidity. Additional interactions and some temperature/humidity curvature were incorporated into the model.
643 2 1
3.4
3.2
3.0
2.8
2.6
2.4
2.2
2.0 43 21
Dyn Sta
Main Effects Plot (fitted means) for Log(Hrs)
Dynamic Stressors Static Stressors
Mea
n of
Log
(H
rs)
1 – no stressor, 2 – 10-times bend, 3 – 3-times bend, 4 – Temperature cycling, 6 – fluid exposure
1 – none; 2 – 10-times wrap; 3 – 6-times wrap; 4 – 1-time wrap
20

4.0
3.0
2.0
3.5
Dat
a
2.5
6261423231222114131211
Setup
VariableDynSta.Add(Dyn,Sta)
Time Series Plot of DynSta., Add(Dyn,Sta) - PI
Across all setups, a total of 301 PI sam les eventually failed the DWearly failures (2.3%) were identified as statistical outliers and were not used in the final model. For setups tha ere estimated y the distribu a probability
ed whenever
Figure 9. Additive Effect of PI Dynam
p
ic and Static Stressors
V test. Of these, seven
t did not reach 100% failure of all life specimens, the failure rates wtion of the specimens that had failed to that point in each setup usingb
plot. There were several setups that did not have any failures of the life specimens. These provided no data and were not used in the model. The relationships of dynamic and static stressors and the effects of temperature and humidity are hown in figure 10. Individual failure times are plotted, and a simple linear fit is uss
a specific dynamic-static-humidity stress combination crosses at least two temperatures. Several of the stressor curves versus temperature are parallel straight lines, but shifted up or down, while other lines have different slopes.
21

Temp
Log(
Hrs
)
30025020015010050
4.0
3.5
3.0
2.5
2.0
DynStaH
2200022070220852210031000
1200021000
Scatterplot of Log(Hrs) vs Temp - PI
Figure 10. Polyimide Stressor Relationships at Multiple Temperatures
A large number of setups resulted in data that could not be tracked across multiple temperatures. These additional setup data points were analyzed by comparing them to corresponding relationships of similar stressors so that shifts in the baseline could be quantified. By comparing these points to curves that would have the same slopes, a new curve was estimated, as shown in
gure 11. fi
22

Temp
Log(
Hrs
)
30025020015010050
4.0
3.5
3.0
2.5
2.0
Dy nS ta
7 0 .0
2 1 0 .0
2 1 7 0 .0
2 1 7 2 .8
2 1 8 5 .0
2 1 1 0 0 .0
2 1 *
2 2 0 .0
2 2
1 1
7 0 .0
2 2 7 2 .8
2 2 8 5 .0
7 2 .8
2 2 1 0 0 .0
2 2 *
3 1 0 .0
3 1 7 0 .0
3 1 7 2 .8
3 1 8 5 .0
3 1 1 0 0 .0
3 1
1 1
*
3 2 0 .0
3 2 7 0 .0
8 5 .0
3 2 7 2 .8
3 2 8 5 .0
3 2 1 0 0 .0
3 2 *
4 2 0 .0
RH
4 2 7 0 .0
4 2 7 2 .8
4 2
1 1
8 5 .0
4 2 1 0 0 .0
4 2 *
1 0 0 .0
5 1 0 .0
5 1 7 0 .0
5 1 7 2 .8
5 1 8 5 .0
5 1 1 0 0 .0
5 1 *
6 1 0 .0
6 1
1 1
7 0 .0
6 1 7 2 .8
*
1 2 0 .0
1 2 7 0 .0
1 2 7 2 .8
1 2 8 5 .0
1 2 1 0 0 .0
1 2
1 1
*
1 3 0 .0
1 3 7 0 .0
0 .0
1 3 7 2 .8
1 3 8 5 .0
1 3 1 0 0 .0
1 3 *
1 4 0 .0
1 4 7 0 .0
1 4 7 2 .8
1 4
1 1
8 5 .0
1 4 1 0 0 .0
1 4 *
Scatterplot of Log(Hrs) vs Temp
Figure 11. Life as Log of Hours for All PI Data Points 3.3 OXIDATION.
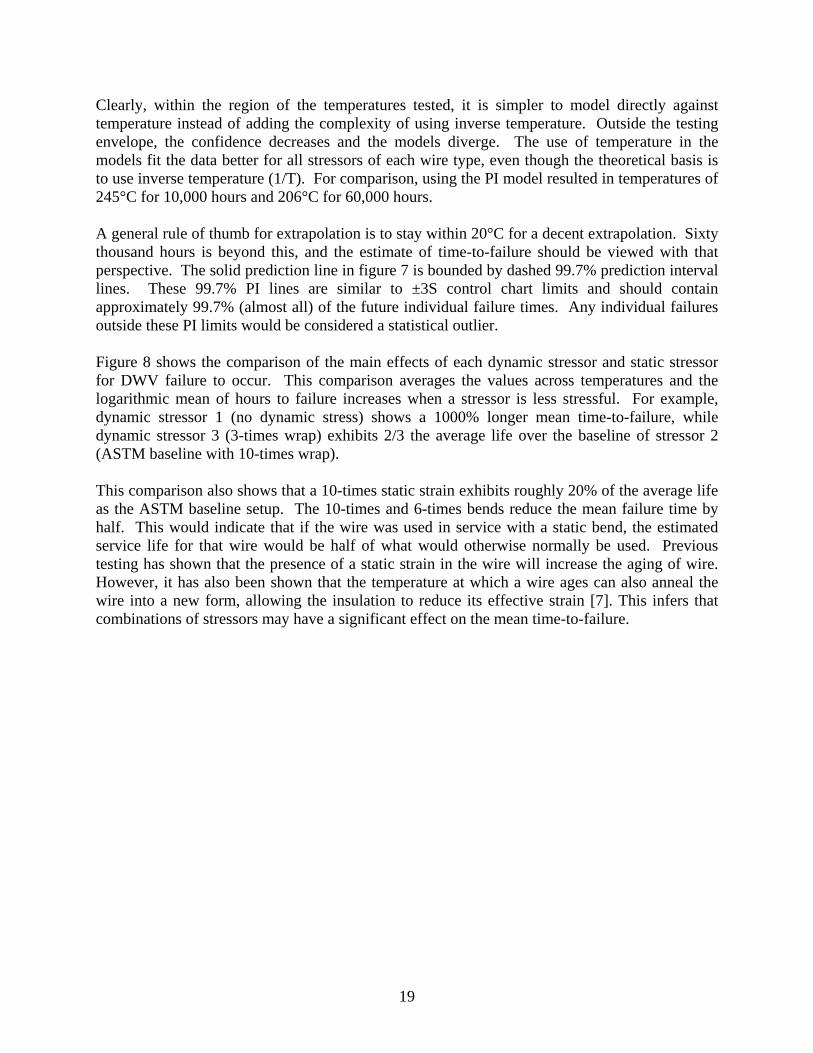
The rate of oxidation was approached using a separate airflow experiment. Since the samples were generally aged at reduced airflow compared to the ASTM method, the rate of oxidation was examined to determine whether the lower airflows limited the rate of aging due to insufficient oxygen. The results of the intrusive inspection showed that wire inside large bundles or protected from the general aircraft environment were often in better condition (less rigidity, less racking, less color change) than the more exposed wire. Samples that were aged in humidity
conditions may have been exposed to less oxidation due to differences in the airflow in humidity chambers, especially with the 100% RH immersed specimens for which there was no airflow. The data from the airflow experiment show that the aging at the ASTM conditions with a change in airflow did slightly affect the aging of the PI wire. Tests were run at 2-5 oven air exchanges per hour, 61 air exchanges per hour, and 125 air exchanges per hour, which is slightly less than the 150 +15 air exchanges per hour in the standard ASTM test method. For PI, the average life of the wire decreased statistically at the highest (125 exchanges per hour) air supply, as shown in figure 12. This may partially explain the resulting higher values of life compared to other industry data. Although the differences from wire lot to wire lot and from manufacturer to manufacturer are expected to potentially have a greater difference than a decrease from 840 to 711 hours of average life to failure.
c
23
Airflow
Log(
PI)
125615
2.98
2.96
2.94
2.92
2.90
2.88
2.86
2.84
2.82
2.80
Individual Value Plot of Log(PI) vs Airflow
Figure 12. Failure Time of PI Specimens at Different Airflow Rates 3.4 ELECTRICAL STRESS.
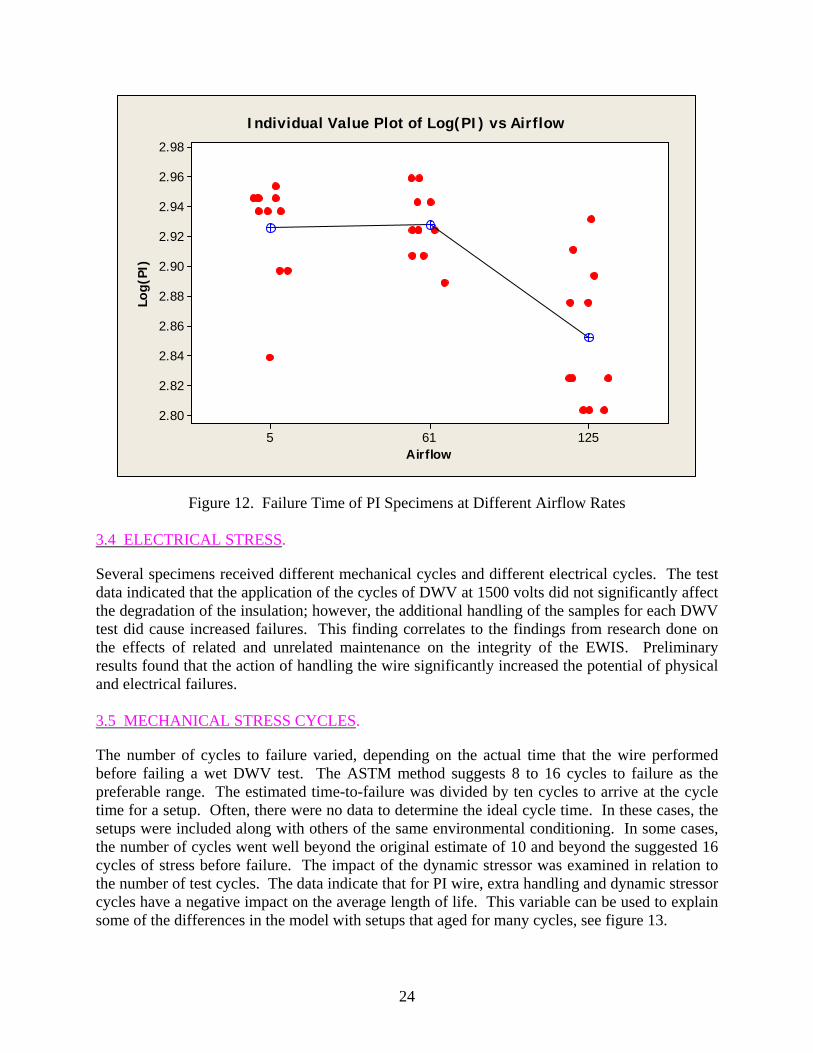
Several specimens rdata indicated that th
eceived different mechanical cycles and different electrical cycles. The test e application of the cycles of DWV at 1500 volts did not significantly affect
the degradation of the insulation; however, the additional handling of the samples for each DWV test did cause increased failures. This finding correlates to the findings from research done on the effects of related and unrelated maintenance on the integrity of the EWIS. Preliminary results found that the action of handling the wire significantly increased the potential of physical and electrical failures. 3.5 MECHANICAL STRESS CYCLES.
The number of cycles to failure varied, depending on the actual time that the wire performed before failing a wet DWV test. The ASTM method suggests 8 to 16 cycles to failure as the preferable range. The estimated time-to-failure was divided by ten cycles to arrive at the cycle time for a setup. Often, there were no data to determine the ideal cycle time. In these cases, the setups were included along with others of the same environmental conditioning. In some cases, the number of cycles went well beyond the original estimate of 10 and beyond the suggested 16 cycles of stress before failure. The impact of the dynamic stressor was examined in relation to the number of test cycles. The data indicate that for PI wire, extra handling and dynamic stressor cycles have a negative impact on the average length of life. This variable can be used to explain ome of the differences in the models
with setups that aged for many cycles, see figure 13.
24

Temp
Cycl
eAvg
300290280270260
13.0
12.5
12.0
11.5
11.0
10.5
10.0
S 0.265317R-Sq 57.1%R-Sq(adj) 55.7%
Regression99.7% PI
Fitted Line Plot - PICycleAvg = 6.456 + 0.01817 Temp
Figure 13. Average Cycles to Failure vs Temperature After fitting a reasonably adequate model (R² = 95.7%) to the failure data, the unexplained variation leftover from the model indicated that a curve-linear relationship existed with the average number of cycles needed to fail all the samples within a setup. After fully incorporating the average number of failures into the model, the expected life appeared to decrease as the average number of test cycles for the setup increased. This negative slope relationship also exhibited some concave-up curvature. R² for this new model increased slightly. 3.6 TESTING RESULTS.
Various tests were used to compare agingand dry insulation resistance, tensile, elo
to properties of the PI wire. Visual inspection, wet ngation, inherent viscosity, weight loss, and dynamic
cut-through test results correlate to aging. Selected data are presented here to provide an overview of the positive trends that developed. Additional summaries of results and discussions, including reproducibility and variability of test data, are provided in appendix G. A complete compilation of the results is provided in appendix H. 3.6.1 Visual Examination.
PI changed color slightly after several hundred hours at elevated temperature. The insulation developed fine cracks in the outer topcoat layer, which eventually led to larger cracks and flaking of the thin outer layer. The wire type is fairly stiff and aging accentuated the stiffness. The onductor began to exhibit breakage and stripability problems by 5000 hours of aging at c
F250°C.
igure 14 shows the changes in the insulation for PI that were aged at 250ºC and subjected to the
25

10-times dynamic bend test. The top wire was not aged, and the middle and bottom wires were aged for approximately 6670 hours (first life specimen DWV failure) and 8730 hours (last failure), respectively. Cracking of the insulation through to the conductor, flaking of the insulation top coat, and changes in the insulation color were noted as the aging progressed.
Figure 14. Progression of Insulation Damage, Aged at 250°C
PI with the same stressors but aged at 300ºC showed similar characteristics to those aged at the lower temperature, but also exhibited a white residue on the insulation, as shown in figure 15. The top wire was not aged, and the middle and bottom wires were aged for approximately 730 and 950 hours, respectively.
Figure 15. Progression of Insulation Damage, Aged at 300°C
26

Figures 16 and 17 compare unaged PI wires to samples that were aged in the 10-times static wrapped condition and subjected to the 10-times dynamic bend test between aging cycles. The samples in figure 17 that were aged for a longer duration exhibited more severe cracking and flaking of the insulation and the presence of a white residue as the aging continued.
Figure 16. Unaged PI Wire (top) and Aged Wire (Static)
Figure 17. Unaged PI Wire (top) and Aged Wire (Dynamic) Figures 18 and 19 compare unaged PI wires to ones that were aged in the 10-times static wrapped condition at 95ºC in 100% humidity for approximately 75 and 180 hours, respectively. Between aging cycles, the samples were subjected to the 10-times dynamic bend stressor. The insulation damage was similar to what was seen on the samples aged in ovens; however, the failures occurred much earlier in the aging process and more circumferential cracks were noted on these samples.
27

Figure 18. Unaged PI Wire (Left) and Aged Wire (75 Hours)
Figure 19. Unaged PI Wire (Left) and Aged Wire (180 Hours) 3.6.2 Insulation Resistance Wet and Dry.
(wet) is a sta sistance of wire IR ndard wire test that is used to determine the electrical reinsulation when immersed in a 5% saltwater solution. Change in the insulation resistance of a wire due to environmental stresses is a classic method of evaluating the ability of insulation to perform its primary function. Figure 20 shows that the oven-aging temperature had a significant impact on the IR wet results (comparison of black and green plots). However, for aging at lower temperatures and high RH, the dynamic and static stressors also contributed to the degradation. This is when comparing the blue plot (no dynamic or static stressor) to the red, green, and orange
28

plots. Although the figure shows some fluctuation from cycle to cycle, the general trend shows a decrease in the wet IR as the wire aged.
Aging Hours
Ave
rage
Log
(G.
ohm
s+1)
9000800070006000500040003000200010000
4
3
2
1
0
Setup Info.
PI, 300 °C, 0% RH, Dynamic.Static = 10x.StraightPI, 300 °C, 0% RH, Dynamic.Static = None.StraightPI, 95 °C, 85% RH, Dynamic.Static = 10x.10x
PI, 250 °C, 0% RH, Dynamic.Static = 10x.StraightPI, 300 °C, 0% RH, Dynamic.Static = 10x.10x
IR Wet
Figure 20. Wet IR Results for PI IR (dry) is not a standard wire test that is used to determine the electrical resistance of insulated wire. In place of using the typical procedure of immersing the wire in a 5% saltwater solution to bring the ground lead of the tester into full-body contact with the insulation, a foil wrap was used to form a grounding surface around the wire. Although there was some variability in the dry IR results from hold point to hold point, there was typically a trend of decreasing values as aging progressed. Figures 21 and 22 show that the specimens aged at 95º and 300°C and 100% RH experienced a decrease in the dry IR sooner than the specimens aged at 250ºC.
29
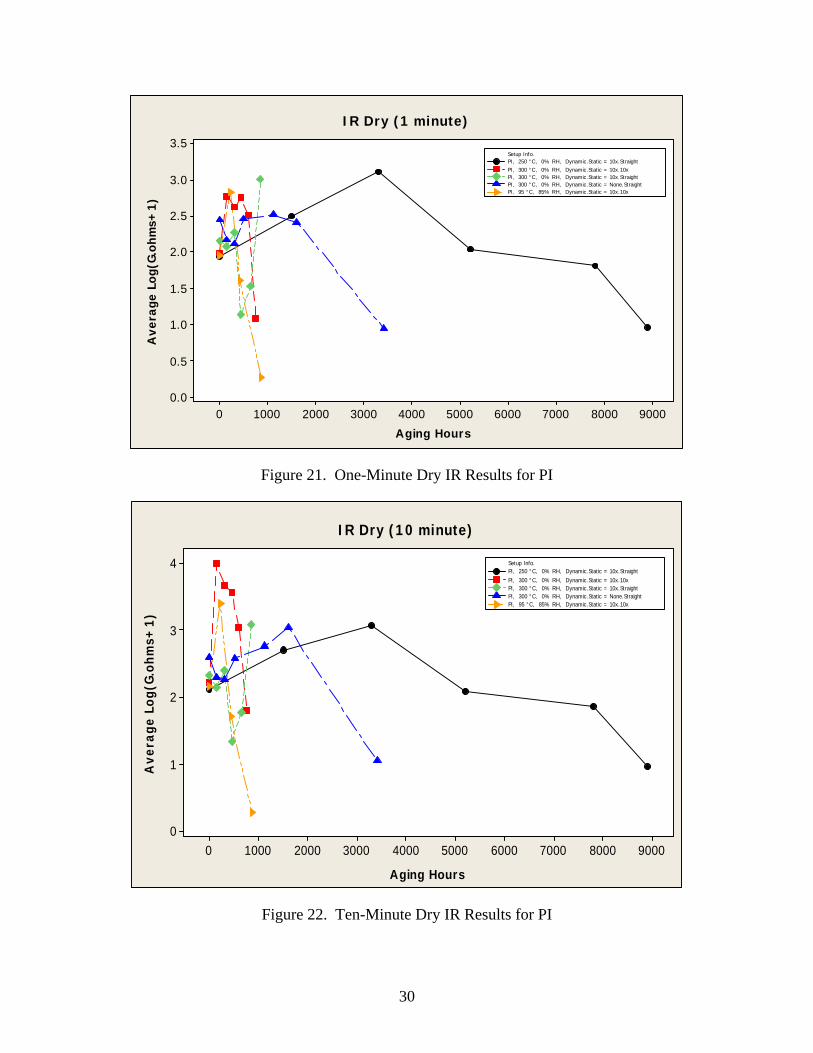
Aging Hours
Ave
rage
Log
(G.o
hms+
1)
9000800070006000500040003000200010000
3.5
3.0
2.5
2.0
1.5
1.0
0.5
0.0
Setup Info.
PI, 300 °C, 0% RH, Dynamic.Static = 10x.StraightPI, 300 °C, 0% RH, Dynamic.Static = None.StraightPI, 95 °C, 85% RH, Dynamic.Static = 10x.10x
PI, 250 °C, 0% RH, Dynamic.Static = 10x.StraightPI, 300 °C, 0% RH, Dynamic.Static = 10x.10x
IR Dry (1 minute)
Figure 21. One-Minute Dry IR Results for PI
Aging Hours
Ave
rage
L
4
1
0
Setup IPI, 250 °
og(G
.ohm
s+1)
9000800070006000500040003000200010000
3
2
nfo.C, 0% RH, Dynamic.Static = 10x.Straight
PI, 300 °C, 0% RH, Dynamic.Static = 10x.10x
IR Dry (10 minute)
Figure 22. Ten-Minute Dry IR Results for PI
PI, 300 °C, 0% RH, Dynamic.Static = 10x.StraightPI, 300 °C, 0% RH, Dynamic.Static = None.StraightPI, 95 °C, 85% RH, Dynamic.Static = 10x.10x
30

3.6.3 Insulation Tensile and Elongation.
The wire insulation was evaluated for tensile and elongation properties using the Instron method. When possible, 2 to 3 inches of insulation was stripped from the aged wire samples at periodic cycles to determine changes in the properties. Figure 23 shows the insulation tensile strength decreasing significantly as the PI wire ages. This was especially true for the 10-times dynamic- and static-stressed samples aged at 100% RH, which displayed a drastic decrease after less than 100 hours of exposure. Figure 24 shows that the elongation degradation patterns for the samples in these test conditions were very similar to those of the tensile strength. Since the insulation could not be stripped from many aged samples, an alternate method was developed to calculate the elongation. Figure 25 shows the elongation results from five aging conditions using the mandrel method. Note that in this figure, the data recorded at 0 hour is the average of the bulk data from the Instron testing, and several middle-cycle elongation results could only be quantified as being greater than the value that was plotted. The figure shows that the Mandrel method was also capable of detecting changes in the insulation properties as the wire aged.
Hours
Tens
ile S
tren
gth,
psi
16001400120010008006004002000
26000
24000
22000
20000
18000
16000
14000
12000
10000
Setup InfoPI, 250 °C, 0% RH, Dy
PI, 95 °C, 100% RH, Dynamic.Static = 10x.10x
namic.Static = 10x.StraightPI, 300 °C, 0% RH, Dynamic.Static = None.Straight
Insulation Tensile Strength - Instron
Figure 23. Tensile Strength Results for PI Wires
31

Hours
120
100
80
Setup Info
PI, 95 °C, 100% RH, Dynamic.Static = 10x.10x
PI, 250 °C, 0% RH, Dynamic.Static = 10x.StraightPI, 300 °C, 0% RH, Dynamic.Static = None.Straight
Elon
gati
on, %
60
40
20
016001400120010008006004002000
Insulation Elongation - Instron
Figure 24. Instron Elongation Results for PI Wires
Aging Hours
Elon
gati
on, %
9000800070006000500040003000200010000
100
80
60
40
20
0
Setup Info
PI, 300 °C, 0% RH, Dynamic.Static = 10x.StraightPI, 300 °C, 0% RH, Dynamic.Static = None.StraightPI, 95 °C, 85% RH, Dynamic.Static = 10x.10x
PI, 250 °C, 0% RH, Dynamic.Static = 10x.StraightPI, 300 °C, 0% RH, Dynamic.Static = 10x.10x
Insulation Elongation - Mandrel Method
Instron bulk result at 0 hours
Several middle-cycle elongation resultsactually greater than plotted value
Figure 25. Mandrel Elongation Results for PI
32

33
3.6.4 Inherent Viscosity.
Inherent viscosity is a method that is used to measure the weight average molecular weight of a polymer after dissolution into a solvent at a known concentration. The polyimide films were evaluated for changes in the average polymer chain length over time, as the polymeric chain length distribution affects the viscosity of the solution. A polymer with a higher average chain length will exhibit higher viscosity. In most cases, results could not be obtained from specimens that were fully aged at 250ºC or higher, but some data was collected from specimens partially aged at 250ºC. Inherent viscosity results for three PI wire setups are shown in figure 26. Specimens from test runs at aging temperatures of 95ºC or lower easily dissolved. The findings from these determinations followed a nice trend with the specimens having less exposure time at a given condition having a higher inherent viscosity, which correlates to higher weight average molecular weights. Samples aged at 100% RH showed a sharper decline in the inherent viscosity than the samples aged at 85% RH.
Aging Hours
Vis
cosi
ty, c
enti
stok
es
9000800070006000500040003000200010000
1.6
1.4
1.2
1.0
0.8
0.6
0.4
0.2
Setup Info
PI, 95 °C, 85% RH, DPI, 95 °C, 100% RH, D
ynamic.Static = 10x.10x
PI, 250 °C, 0% RH, Dynamic.Static = 10x.Straightynamic.Static = 10x.10x
Inherent Viscosity
Figure 26. Inherent Viscosity Results for PI Wires The results for the 250oC determinations are very questionable. The material dissolved very slowly compared to the other determinations. There was a large amount of small, dark matter as the dissolution proceeded, which never completely disappeared, and the filtration was very slow. Most likely, the polyimide changed, and the residual material was soluble in the solvent. Thus,
Viscosity, dl/gm

the results are probably not usable. In all the other determinations, the inherent viscosity at the end of the environmental exposures was not lower than 0.8 dl/gm. 3.6.5 Dynamic Cut-Through.
This test is designed to measure the ability of wire insulation to resist being cut by a sharp edge and shorting in-service environments. This compression test measures the force required for a blade to cut-through the insulation to the conductor. Figure 27 shows that the dynamic cut-through force decreased as the PI wire specimens aged. There was a significant difference in the ut-through force between samples aged at 250ºC versus 300ºC, and the samples aged at 85% c
RH showed a greater resistance to cut-through than the samples aged at 100% RH. Up to a point, the plots for the cut-through forces were very similar for straight samples, regardless of whether or not they were subjected to the dynamic bend test. However, the life of the dynamic bend samples was only about 1/4 of those not subjected to the 10-times dynamic stressor.
Aging Hours
Cut-
thru
, lbs
.
9000800070006000500040003000
80
70
60
50
40
30
20
10201000 000
Setup Info
PI, 300 °C, 0% RH, Dynamic.Static = 10x.StraightPI, 300 °C, 0% RH, Dynamic.Static = None.StraightPI, 95 °C, 100% RH, Dynamic.Static = 10x.10xPI, 95 °C, 85% RH, Dynamic.Static = 10x.10x
PI, 250 °C, 0% RH, Dynamic.Static = 10x.StraightPI, 300 °C, 0% RH, Dynamic.Static = 10x.10x
Dynamic Cut-thru
Figure 27. Dynamic Cut-Through Results for PI Wires .6.6 Weight3 .
samples aged at 250ºC did not change much over time, until near the time they failed the DWV
This test evaluates whether or not the weight of a specimen changes as a wire is aged and determines if DWV failures correlated to weight loss. Figure 28 shows the weight loss percentages for four oven-aged conditions. This evaluation was not performed on the humidity-aged conditions since moisture absorption could skew the results. The figure shows that the
34

test. However, the samples aged at 300ºC showed signs of weight loss earlier in the aging process. The average weight of the PI life specimens decreased more dramatically for the specimens aged at 300ºC than at 250ºC, and the 10-times dynamic stressor and 10-times static strain also contributed to weight loss. The samples that were subjected to neither dynamic nor static stresses exhibited a lower weight loss.
Aging Hours
Ave
rage
Wei
ght
Ret
aine
d
Weight Retained1.05
1.00
, %
0.95
0.90
0.85
0.80
0.75
0.70800070006000500040003000200010000
ByVar1
PI, 300 °C, 0% RH, Dynamic.Static = 10x.StraightPI, 300 °C, 0% RH, Dynamic.Static = None.Straight
PI, 250 °C, 0% RH, Dynamic.Static = 10x.StraightPI, 300 °C, 0% RH, Dynamic.Static = 10x.10x
Figure 28. Weight Results for PI Wires Figure 29 shows the trend in weight loss for the straight life specimens that were aged at 300ºC. The blip in the graph that increases is from an additional lug. When the lug with the specimen identification number broke from the specimen and a new lug was crimped on the wire, the originally marked lug was attached to the new lug. In the analysis of the wire specimens, the weight of the terminals was subtracted from the specimens.
35

Weight Loss
2
2.2
2.4
2.6
2.8
3
L1L2L3L4
0 500 1000 1500 2000 2500 3000 3500 4000
Aging Time, hrs
wei
ght,
g
L5L6L7L8L9L10L11
Figure 29. Weight Loss Curves for Straight PI Life Specimens 3.6.7 Thermogravimetric Analysis.
Figure 30 shows the differential scanning calorimetry (DSC) analysis performed on PI insulation. From this and additional experimentation, an isothermal oxidation temperature of 350ºC was selected for oxidation induction time (OIT) testing to keep the test temperature below a major material transition point. Attempts to perform the thermogravimetric analysis (TGA) were unsuccessful due to s as due to internal energy
leased when the FEP glue looses its properties. Based on the results for CP wire, it is expected ample movement during testing. This w
rethat the test would provide valid results if movement of the sample could be controlled. It was found that using a closed sample pan (one pan on top of the other) controlled this effect.
36

Figure 30. Differential Scanning Calorimetry (Melt Point) for PI Wire Type A sufficient number of PI samples were tested for kinetic determinations, although the data became unusable after about a 20% weight loss due to the sample jumping off the apparatus. Analysis for kinetics was performed per R. Beach’s report, “Thermogravimetric Analysis (TGA) of Cross-Linked ETFE Wire Insulation and Comparison With ASTM-D 3032 Thermal Index TI Results.” The OIT tests were not performed satisfactorily to analyze the results. Figures 31 and 32 show the TGA isoconversional plots for PI bulk and aged wires. Activation energies had a onsistent transition around 10%-20% weight loss where a drop of ~30 kJoules was observed.
c
37

PI-BULK
-3.5
-3
-2.5
-2
-1.5
-1
-0.5
00.0011 0.00115 0.0012 0.00125 0.0013 0.00135 0.0014
1/T (K)
-LN
(BET
A) 5%
10%
15%
20%
Figure 31. Unaged PI Wire TGA Isoconversional Plot
PI-1165-6
-3.5
-3
-0.5
-2.5
-2
-1.5
-1
-ln(b
eta)
00.00115 0.0012 0.00125 0.0013 0.00135 0.0014 0.00145
1/T (deg K)
5%
10%
15%
20%
Figure 32. Aged PI Wire TGA Isoconversional Plot
38

3.7 MODEL DEVELOPMENT.
The algorithm developed for PI defines how the wire is degraded by the stressors examined in this test program. The model (Model 1) takes into account temperature, humidity, and each of the dynamic and static stressors, and the interactions between the stressors. These are expressed in linear slopes as well as quadratic terms. Failure times were different when compared to a previous study [3] conducted over 30 years ago, using specimens cut from a particular spool of wire. The difference in results may be due to the air exchange rates in the aging chambers. The typical setup in the current study used approximately two to five air exchanges per hour during aging. If the Elliot study [3] was conducted at higher airflow, the oxidation rates may have been faster, resulting in earlier failure times. Two extra PI setups were run at 300°C (at 61 and 125 air exchanges per hour). Test results showed that PI failure times were lower at the highest airflow. This suggests that it is important to maintain a consistent airflow while conducting any comparative tests using PI wire. The results show that the difference in oxidation is fairly small for short-term testing. This indicates that the aging is probably not diffusion limited. For longer-term aging at lower temperatures, this effect may be more pronounced and would be more similar to the differences seen on aircraft inspections between wire that was in the interior or exterior of large bundles. It is postulated that the diffusion
ive inspection hape (more flexible, less discoloration, and fewer cracks) than wire that was more exposed.
The time-to-failure at very high temperature is not indicative of most aircraft conditions. Correlation to more typical aircraft operating conditions (temperature = 71°C and RH = 33%) shows the estimated hours to be approximately 240,000 hours to the median failure when a 10-times dynamic bend is present. For wire that is not mechanically disturbed, the time increases dramatically to 4x10⁶ hours, provided no nonaging unpredictable event takes place to severely damage the wire. It is estimated that over long periods, the effects of vibration and general surface wear will increase the aging somewhat faster than no stress at all. Conditions that approach ambient should actually estimate life based on total hours since installation rather than operating hours. The predicted values are very close to the original estimates for the setups that were aged with the standard ASTM baseline conditions. The difference between the failure times for other stressors compared to the ASTM baseline shows how important taking these other stressors into account can be. Table 5 shows the model results for predicted values that are very close to the values actually determined based on the test results. The model validates the engineering judgment regarding the effects of various stressors on the life of the wire.
of oxygen is less toward the interior of large bundles. The showed that the wire on the interior of large bundles was often in betterintrus
s
39

Table 5. Comparison of Actual Failure Data to Predicted Failure Data by the Algorithm
GroupSetup Temp. (°C)
RH (%)
Dynamic Stressor
Static Stressor
Actual Median Failure Time (hr)
Predicted Median Failure Time (hr)
Percent Difference
1 9 250 0 10 times Straight 7,276 8,079 11 1 13 250 0 10 times 10 times 7,695 7,786 1 1 16 250 0 3 times Straight 3,485 3,796 9 2 4 260 0 None 10 times 7,732 7,698 0 2 21 260 0 Temp 10 times 8,805 8,805 0 3 5 280 0 None 10 times 3,291 3,071 -7 3 11 280 0 10 times Straight 2,662 2,036 -24 3 14 280 0 10 times 10 times 2,245 1,962 -13 3 17 280 0 3 times Straight 970 957 -1 4 3 300 0 None Straight 2,977 2,259 -24 4 6 300 0 None 10 times 932 1,225 32 4 7 300 0 None 6 times 932 932 0 4 8 300 0 None 1 time 2,546 2,546 0 5 12 300 0 10 times Straight 843 812 -4 5 15 300 0 10 times 10 times 564 783 39 5 18 300 0 3 times Straight 335 382 14 5 19 300 0 3 times 10 times 441 354 -20 7 28 300 0 Fluid Straight 875 1,070 22 7 29 300 0 Fluid 10 times 752 603 -20 8 34 70 70 10 times 10 times 7,456 8,226 3 9 30 95 70 None 10 times 6,239 6,239 0 9 35 95 70 10 times 10 times 4,274 2,932 -50
10 38 70 85 10 times 10 times 1,766 1,491 5 11 41 45 100 10 times 10 times 1,908 1,908 -15 12 42 70 100 10 times 10 times 349 379 29 13 33 95 100 None 10 times 90 90 0 14 40 95 100 10 times Straight 2,316 2,150 -9 15 43 95 100 10 times 10 times 136 135 -9
16 36 70 85-25 10 times 10 times 5,755 5,829 2
17 37 95 85 10 times Straight 7,371 8,448 18 17 39 95 85 10 times 10 times 488 531 6 2 1 260 0 None Straight >10,150*† 14,192 2 24 260 0 Vibration Straight >10,150* 14,192 3 2 280 0 None Straight >4,444* 5,662 9 31 95 70 None 6 times >2,864* 4,747 9 32 95 70 None 1 time >3,537* 12,964
18 10 270 0 10x10 times Straight >800* 3,223
* These setups stopped prior to failure of specimens. Actual hours of aging when stopped. † Setup failed (9 of 11 specimens) when excess handling (mechanical) stress placed on the wires outside the
prescribed protocol.
40

Not ical ata from the test program, the model was designed to be flexible so terms could be added in the
future if neede l ec he h ed 3.8 D CU SIO F P
all the data points match the predicted values. Although the model is based on the empird
d. The mode is very sp ific to t setups for whic data were collect .
IS S N O I.
PI ch ge lo ht era d hours vated temp . The ins tion developed fine cracks in the outer topc which ally led to larger cracks and flaking of th hin te r. The wire type is fairly stiff, and aging accentuated the stiffness. The cond or s by 5000 hours of aging at 250°C. The data indicated that for PI wire, extra handling and dynamic stressor cycles have a negative impact on the average length of life. For P wir ns n, e tem ad th pact propertie e wire, as determ by IR dr ic cut-through, and weight loss, more than the dyna idity conditions had a greater effect on the tensile and e nga n rti dyn essors, stressors, o -aging con ions. One nd pe R c ng had a greater adverse effect on the polyimide mo ules by ca ing re h r d g ain scis han the 85% onditionin 4. TH P /P IM OS ING AN EST RESUL
an d co r slig ly after sev l hundre at ele erature ulaoat layer, eventu
e t ou r layeuct began to exhibit breakage and stripability problem
I e i ulatio th aging perature h e greatest im on the s of thined IR wet, y, dynam
mic or static stressors. Aging in high-humlo tio prope es than the
onditioniamic str static r oven dit
hu red rcent H lecus mo rapid yd olysis an reater ch sion t RH c g.
E TFE OLY IDE COMP ITE AG D T TS.
4.1 THE PTFE/POLYIMIDE COMPOSITE AGING DATA.
The a ng e e t p were rec at each cy and were considered complete upon DWV failure. This f as often c rized by c ing of the underlying wire insulation, but not the outer lay le 6 shows average -to-failu f h he nd ly esti failure tim ed on pr sly gene d g fo st m the baseline ASTM method. As shown in the table an f th P ite longe to failure than in the previous test program.
le Th P C of ta With Originally Estim ailure Times
up ST RH
) ic
or S
Estimated
(hr) **ean FailurTime (hr)
gi data for th 11 life specim ns from each est setu orded cle r kailure w haracte ac
er. Tabm
the loge s
timee ure o eac of t CP setups a
ith original ated s, ba vio
rate agin data r setups w ressors fro, m y o e C setups exhib d slightly r times
Tab 6. e C omparisons Aging Da ated F
Gro etup emp. (°C) (%
DynamStress
Static Failure Titressor
me M
e
17 5 10 2,857 30 9 85 10 times times 21 1 0 S 14,517 6 260 3 times22 1 0 es 10 4,863 4 280 10 tim times 22 S 4,220 17 280 0 3 times22 19 10 tim 3,679 280 0 3 times es 23 3 300 0 None S 3,279 23 6 300 0 None 10 times 1,577 23 7 300 0 None 6 times 859 23 8 300 0 None 1 time 1,416
41

Table 6. The CP Comparisons of Aging Data With Originally Estimated Failure Times (Continued)
Group Setup p.
(°C) RH (%)
Dynamic Stressor
Static Stressor
Estimated Failure Time
(hr) ** Mean Failure
Time (hr) Tem
24 12 300 0 10 times S 570 1,450 24 15 300 0 10 times 10 times 1,122 24 18 300 0 3 times S 702 26 28 300 0 Fluid S 1,165 26 29 300 0 Fluid 10 times 979 27 31 70 100 10 times 10 times 2,853 28 32 95 100 10 times 10 times 1,538 18 10 270 0 10 times S 3340 >800* 20 1 260 0 None S >4,898* 20 4 260 0 None 10 times >4,898* 20 21 260 0 Temp. 10 times >4,898* 20 24 260 0 Vibe S >4,898* 21 9 260 0 10 times S 6290 >8,072* 21 13 260 0 10 times 10 times >8,072* 22 2 280 0 None S >5,465* 22 5 280 0 None 10 times >5,465* 22 11 280 0 10 times S 1810 >5,465*
* These setups stopped prior to failure of specimens. Actual hours of aging when stopped. ** These values are based on a different construction of PTFE-bonded polyimide. S = Stop
4.2 TEMPERATURE.
Aging data was initially analyzed using the AS4851 test method. The log average life of the specimens for each baseline setup was determined. Using the log average life of the specimens cross mua
dltiple temperatures, the aging relationship based on the Arrhenius model was
eter the ilur
generated. A distribution was used throughout the data analysis since it captured the failure distribution well fo test setup e tion rgy n e wit one da but a temperature index could be estima at ing the same slope as the IEEE study [3].
mined, as shown in figure 33. Unfortunately, many of the aging groups did not reache point and only one setup from the stressor combination was completed to failure. fa
Therefore, a full Arrhenius plot could not be lognormal
h only r most of the
ta point, s. Th activa ene could ot be d terminedted a specific time us
42

(1/T)
Log(
Hrs
)
0.00190001850.0017.0017 0.0.0018050 0
4.0
3.5
3.0
2.5
Scatterplot of Log T) - CP: 10x.S
1972 IEEFAA Stud
(Hrs) vs (1/
Ey
Figure 33 rrh Re of CP Wire The analysis was based on up to 11 life specimens that were aged to failure within each setup. Agi leven specimens fail “censored” data) in the
ec nal setup had a single failed specimen. These failure data points were re estimates that could then be used in the model. Wire/stressor done at multiple temperatures were fitted by a line to approximate the
the least squares means of the log average time for DWV failure to occur. This parison averages the values across temperatures. The logarithmic mean of hours to aging
increases when a stressor is less stressful. For example, no dynamic stress showed more than 62% mean time-to-failure when compared to the ASTM baseline with 10-times wrap. While the setup, using a 3-times wrap, exhibits a 56% decrease in the average life.
. A enius lationship
ng was done to 26 setups of samples aged at various conditions. Ten to eed in ninimens. One additio
e of the setups; while six setups had at least four failures (spused to determine failucombinations that were Arrhenius curve. From the fitted line, additional estimates were provided for each combination of dynamic stressor, static stressor, and relative humidity. The activation energy of EA = 36.3 was used, and a temperature index could be estimated at a specific time from the Arrhenius plot. Assuming the same curve slope, the rating would be approximately 267°C at 10,000 hours. For comparison, the final CP model resulted in 276°C for 10,000 hours and 255°C for 60,000 hours. The temperature was plotted using °C rather than 1/K, since the resulting relationships modeled better. Figure 34 shows the comparison of the main effects of each dynamic stressor and static stressor singu
com
43

Mea
n of
Log
(Hrs
)
6321
3.3
3.2
3.1
3.0
2.9
2.8
2.7
4321
Dyn Sta
Main Effects Plot (fitted means) for Log(Hrs) - CP
Static Stressors Dynamic Stressors
ndition.
be due to the tendency of the wire samples
1 – no stressor, 2 – 10-times bend, 3 – 3-times bend, 6
1 – none; 2 – 10-times wrap; – 1-time wrap – fluid exposure 3 – 6-times wrap; 4
Figure 34. Comparison of CP Dynamic Stressor vs Static Stressor The figure also shows that a 10-times static strain exhibited approximately 60% of the average life as the ASTM baseline setup. For a 6-times wrap, the mean failure time is 30% of the ASTM baseline average life. Annealing may help with this wire type to eliminate strain, similar to PI, allowing the insulation to reduce its effective strain and increase the time-to-failure somewhat. This is shown by comparing the highly strained sample to an unstrained sample, once it was
rapped (1-time wrap) and annealed in a tightly wrapped cow Figure 35 depicts the additive effects from each of the dynamic and static stressors for each setup. The black points are the means of aging based on the actual test result determined in this test program, while the red points are the predicted means based upon the resulting model. As shown in the figure, the model tracks the actual aging fairly well except for the dynamic stressor DS) (3,2) stress combination. This difference could (
to turn and follow the same track when performing the wrap, in effect, not subjecting the samples to the full stress, and allowing the time-to-failure to increase more than it otherwise would.
44

Setup.
Dat
a
62613231222114131211
3.7
3.6
3.5
3.4
3.3
3.2
3.1
3.0
2.9
VariableDynSta.Add(Dyn,Sta)
Time Series Plot of DynSta., Add(Dyn,Sta) - CP
Figure 35. Additive Effect of CP Dynam The data analy from all the
dividual CP specimen failures. The final model combines the additive effects of the discrete
del. The final model has a 5% (R-squared) of the CP failure variation.
d by omparing the hours aged to the hours predicted for failures to occur.
The relationships of the various dynamic and static stressors, and the effects of temperature and humidity are shown in figure 36. Individual failure times are plotted, and a simple linear fit is used whenever a specific dynamic-static-humidity stress combination crosses at least two temperatures. The stressor curves versus temperature at 0% RH are parallel straight lines, but shifted up or down, while the humidity line has a different slope.
ic and Static Stressors
sis for model development was performed using the pooled dataindynamic and static stressors discussed above with gradual trend effects that temperature and relative humidity have upon the expected life of the samples. As temperature and/or RH increases, the expected life decreases. Interactions between some of these factors are also incorporated; however, fewer failed samples were available. For example, the RH has a significant impact on the median life of 10-times dynamic and 10-times static wrapped samples. Additional interactions were identified and incorporated into the mo8 Across all setups, a total of 136 CP samples eventually failed the DWV test. Of these, three early failures (2.2%) were identified as statistical outliers and were not used in the final model. For setups that did not reach 100% failure of all life specimens, the failure rates were estimated by the distribution of the specimens that had failed to that point in each setup using a probability plot. There were several setups that did not have any failures of the life specimens and did not provide data that could be used in the model. However, the model could be validatec
45

Temp
Log(
Hrs
)
4.5
4.0
3.5
3.0
2.5300250200150100
DynStaH
13000140002100022000220852210031000320006100062000
1100012000
Scatterplot of Log(Hrs) vs Temp - CP
.3 OXIDATION
Figure 36. The CP Stressor Relationships Across Multiple Temperatures Humidity tests were limited to three setups. A setup at 100% RH was run across two temperatures, allowing a line fit of that data. The slope of this line is different from the 0% RH setups. Using the similar offset relationships discussed in section 3, with the slope assumptions for the humidity setups, the model was developed. 4 .
ly, as shown in figure 37. he differences from wire lots and manufacturers are expected to potentially have a greater
The rate of oxidation was approached using the separate airflow experiment. The data from the airflow experiment shows that the aging at the ASTM conditions with a change in airflow did not significantly affect the aging of the CP wire. Tests were run at 2-5 oven air exchanges per hour, 61 air exchanges per hour, and 125 air exchanges per hour, which is slightly less than the 150 ±15 air exchanges per hour in the standard ASTM test method. For CP, the average life of the wire increased slightly at the highest (125 exchanges per hour) air suppTdifference than a slight increase of from 1870 to 2200 testing hours for average life to failure.
46
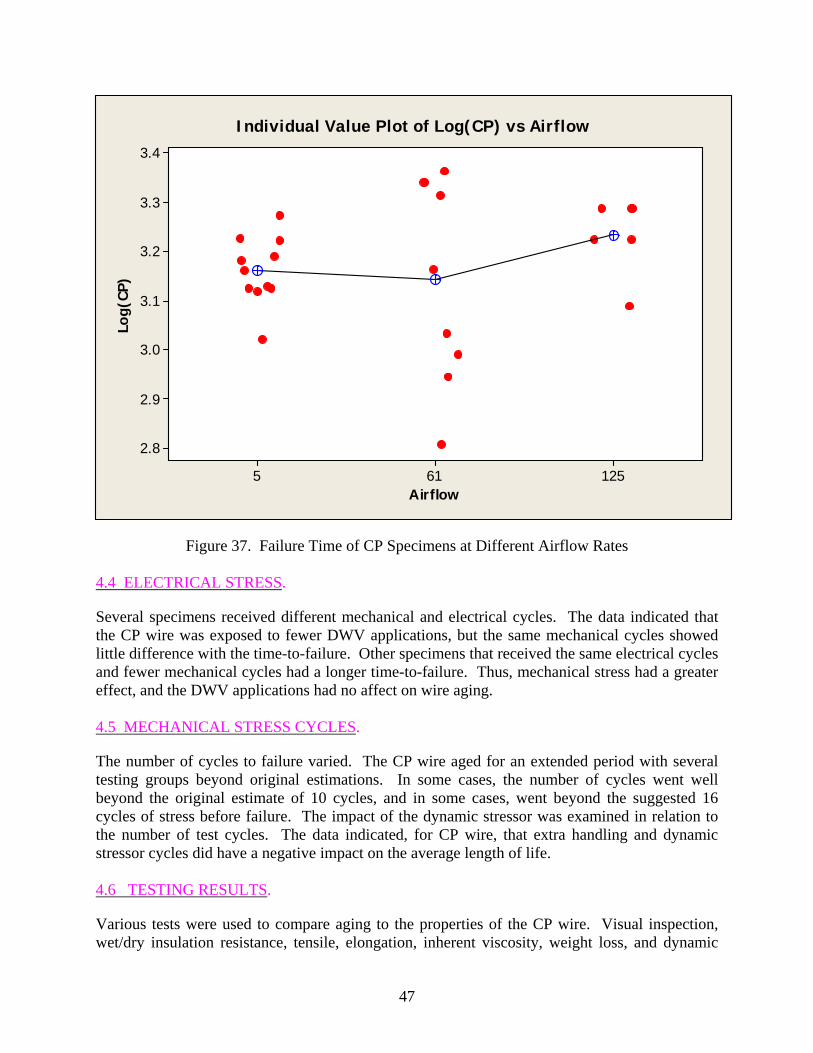
Airflow
Log(
CP)
125615
3.4
3.3
3.2
3.1
3.0
2.9
2.8
Individual Value Plot of Log(CP) vs Airflow
Figure 37. Failure Time of CP Specimens at Different Airflow Rates
4.4 ELECTRICAL STRESS.
Several specimens received different mechanical and electrical cycles. The data indicated that the CP wire was exposed to fewer DWV applications, but the same mechanical cycles showed little difference with the time-to-failure. Other specimens that received the same electrical cycles
al cycles had a longer time-to-failure. Thus, mechanical stress had a greater applications had no affect on wire aging.
and fewer mechaniceffect, and the DWV 4.5 MECHANICAL STRESS CYCLES.
The number of cycles to failure varied. The CP wire aged for an extended period with several testing groups beyond original estimations. In some cases, the number of cycles went well beyond the original estimate of 10 cycles, and in some cases, went beyond the suggested 16 cycles of stress before failure. The impact of the dynamic stressor was examined in relation to the number of test cycles. The data indicated, for CP wire, that extra handling and dynamic stressor cycles did have a negative impact on the average length of life. 4.6 TESTING RESULTS.
Various tests were used to compare aging to the properties of the CP wire. Visual inspection, wet/dry insulation resistance, tensile, elongation, inherent viscosity, weight loss, and dynamic
47

cut-through test results correlate to aging. Selected data are presented here to provide an overview of the positive trends that developed. Additional summaries of results and discussions, including reproducibility and variability of test data and a complete compilation of the results, are provided in appendix G. 4.6.1 Visual Examination.
CP wires exhibited little color change, but in some aging conditions, a white coating was observed on the PTFE topcoat after significant aging. Over time, the inner layer began to develop cracks, but this is difficult to discern at times, unless the user specifically looking for this effect. The wires did not become appreciably stiffer after aging. The conductor remained unoxidized for much longer than the other wire types and continued to be easily stripped after many aging cycles. Figure 38 compares an unaged CP wire to a sample that was aged at 300ºC for approximately 3900 hours and not subjected to a dynamic stressor. There was no change in the color of the insulation, but the aged sample exhibited a burn hole and separation at a seam of the tape wrap layers. Figure 39 compares an unaged CP wire to samples that were aged at 300ºC, but were subjected to a 10-times dynamic bend test between each aging cycle. The middle and bottom wires were aged for approximately 1100 and 1980 hours, respectively. The specimen aged for 1980 hours also exhibits a burn hole at the tape wrap seam from the DWV test.
Figure 38. Unaged CP Wire (Top) and Aged Wire (Bottom), not Subjected to a Dynamic Stressor
48

Figure 39. Unaged CP Wire (Top) and Aged Wires (Bottom) Subjected to a 10-Times Dynamic Bend Test
Figure 40 shows an unaged CP wire and a CP wire aged for approximately 1000 hours at 300ºC in the 10-times static wrapped condition. The aged samples were also subjected to the 10-times dynamic bend stressor between each aging cycle. The figure shows wrinkles that formed in the insulation, likely from degradation of the PI insulation below the PTFE topcoat. Figure 41 shows the insulation damage that caused the same sample to fail the DWV test.
Figure 40. Unaged CP Wire (Right) and Aged Wire (Left) (Example 1)
49
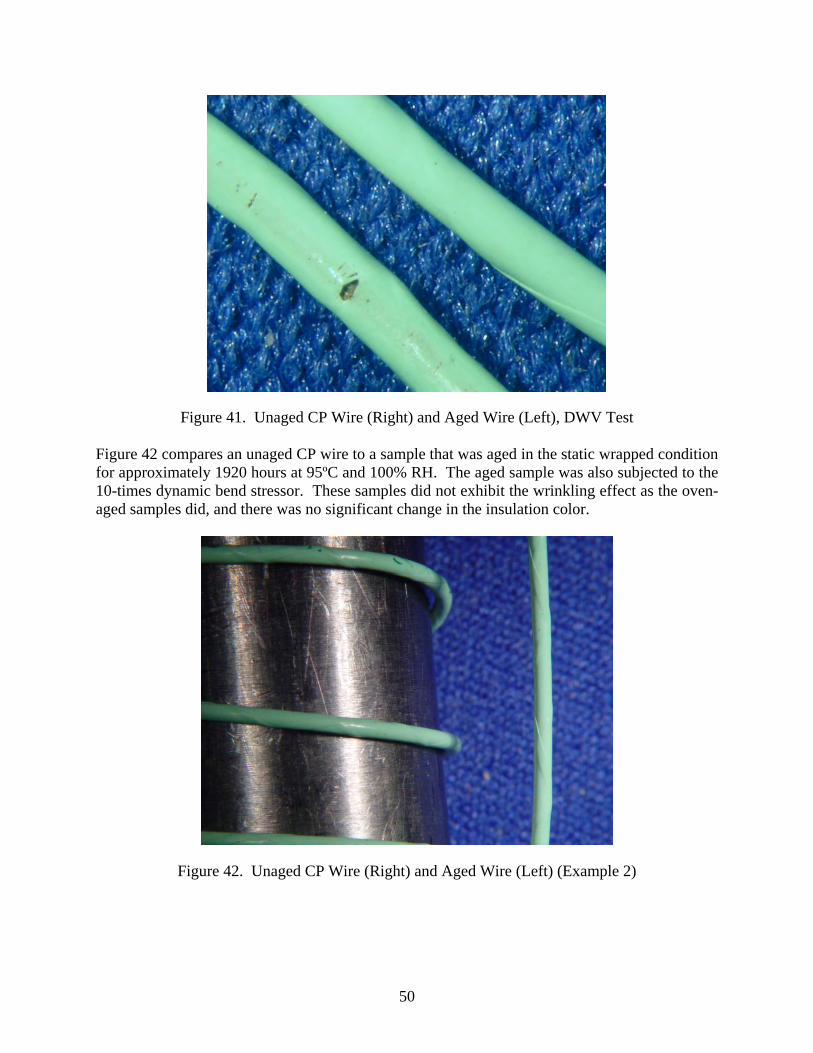
Figure 41. Unaged CP Wire (Right) and Aged Wire (Left), DWV Test
Fr approximately 1920 hours at 95ºC and 100% RH. ple was also subjected to the
igure 42 compares an unaged CP wire to a sample that was aged in the static wrapped condition
The aged samfo10-times dynamic bend stressor. These samples did not exhibit the wrinkling effect as the oven-aged samples did, and there was no significant change in the insulation color.
Figure 42. Unaged CP Wire (Right) and Aged Wire (Left) (Example 2)
50

4.6.2 Insulation Resistance Wet and Dry.
Figure 43 shows the wet IR results for one humidity condition and four temperature-aged conditions. The figure shows that on partially aged samples the results may fluctuate somewhat from the initial values, possibly due to equipment, laboratory conditions, or operators. However, there is a trend of a sharper decline, which occurs around the time that DWV failures start to occur. An exception to this trend was seen in the 260ºC setup with no dynamic or static stressor, where the initial and final values were similar. Figures 44 and 45 show the dry IR results for 1- and 10-minute test points, respectively, for one humidity condition and four temperature-aged conditions. Comparison of these figures shows that the plots from these results have almost identical shapes. The samples from these setups all showed an increase in the IR after partial aging, but the values declined as the samples continued to age.
Aging Hours
Ave
rage
Log
(G.
ohm
IR Wet
5
4
3
2
1
0
Setup Info.
CP, 300 °C, 0% RH, Dynamic.Static = 10x.StraightCP, 300 °C, 0% RH, Dynamic.Static = None.StraightCP, 95 °C, 85% RH, Dynamic.Static = 10x.10x
CP, 260 °C, 0% RH, Dynamic.Static = 10x.StraightCP, 300 °C, 0% RH, Dynamic.Static = 10x.10x
s+1)
500040003000200010000
Figure 43. Wet IR Results for CP Wires
51

Aging Hours
Av
4
3
Setup Info.
CP, 300 °C, 0% RH, Dynamic.Static = 10x.StraightCP, 300 °C, 0% RH, Dynamic.Static = None.StraightCP, 95 °C, 85% RH, Dynamic.Static = 10x.10x
CP, 260 °C, 0% RH, Dynamic.Static = 10x.StraightCP, 300 °C, 0% RH, Dynamic.Static = 10x.10x
erag
e Lo
g(G.
ohm
s+1)
2
1
0
500040003000200010000
IR Dry (1 minute)
Figure 44. One-Minute Dry IR Results for CP Wire
Aging Hours
Ave
rage
Log
(G.o
hms+
1)
500040003000200010000
4
3
2
1
0
Setup Info.
CP, 300 °C, 0% RH, Dynamic.Static = 10x.StraightCP, 300 °C, 0% RH, Dynamic.Static = None.StraightCP, 95 °C, 85% RH, Dynamic.Static = 10x.10x
CP, 260 °C, 0% RH, Dynamic.Static = 10x.StraightCP, 300 °C, 0% RH, Dynamic.Static = 10x.10x
IR Dry (10 minute)
Figure 45. Ten-Minute Dry IR Results for CP Wire
52

4.6.3 Insulation Tensile and Elongation.
Figure 46 shows that the samples aged at 100% RH exhibited a drastic drop in tensile strength at the first hold point, but thereafter very little change occurred. Figure 47 shows that the insulation elongation for oven-aged samples decreased as the wire aged, but the values for samples aged at 100% RH actually showed a slight increase. This could be from the PTFE outer jacket absorbing moisture and causing it to become more elastic rather than brittle.
Aging Hours
Tens
ile S
tren
gth,
psi
500040003000200010000
14000
12000
10000
8000
6000
4000
2000
Setup Info
CP, 300 °C, 0% RH, Dynamic.Static = 10x.StraightCP, 95 °C, 100% RH, Dynamic.Static = 10x.10xCP, 95 °C, 85% RH, Dynamic.Static = 10x.10x
CP, 280 °C, 0% RH, Dynamic.Static = 3x.StraightCP, 300 °C, 0% RH, Dynamic.Static = 10x.10x
Insulation Tensile Strength - Instron
Figure 46. Insulation Tensile Strength Results for CP Wires
53

Aging Hours
Elon
gati
on, %
500040003000200010000
250
200
150
100
50
0
Setup Info
CP, 300 °C, 0% RH, Dynamic.Static = 10x.StraightCP, 95 °C, 100% RH, Dynamic.Static = 10x.10xCP, 95 °C, 85% RH, Dynamic.Static = 10x.10x
CP, 280 °C, 0% RH, Dynamic.Static = 3x.StraightCP, 300 °C, 0% RH, Dynamic.Static = 10x.10x
Insulation Elongation - Instron
Figure 47. Insulation Elongation Results for CP Wires 4.6.4 Inherent Viscosity.
Similar to the samples with PI insulation, inherent viscosity results could not be obtained on CP wire from samples that were aged at 260ºC or higher. Figure 48 shows the results from samples aged at 95ºC and either 85% or 100% RH. Both plots show decreasing viscosity values as the samples aged, indic e degradation
the wire insu nt viscosity of pproximately 1.20. It may be that a lower viscosity is needed to get a thinner tape. Values did
drop after exposure to humidity.
ating that this test provides beneficial information related to thlation. CP wire has a lower than expected initial inhereof
a
54

Aging Hours
Vis
cosi
ty, c
enti
stok
es
300025002000150010005000
1.3
1.2
1.1
1.0
0.9
0.8
0.7
0.6
Setup InfoCP, 95 °C, 100% RH, Dynamic.Static = 10x.10xCP, 95 °C, 85% RH, Dynamic.Static = 10x.10x
Inherent Viscosity
Viscosity, dl/gm
Figure 48. Inherent Viscosity Results for CP Wires 4.6.5 Dynamic Cut-Through.
Figure 49 shows the dynamic cut-through for aged CP wire. The figure shows that, initially, the 10-times static-stressed, oven-aged samples exhibited a sharp increase in the force required to cut
ped samples. However, the samples subjected to the 10-times ynamic bend test had higher cut-through values than the samples not subjected to the dynamic
stressor. This suggests that the bend test may have caused the insulation to experience some degree of strain hardening.
through the insulation. However, as the aging continued, the values decreased, and eventually dropped below the average value for unaged wire. The initial increase in cut-through force may be explained by the fact that the static-stressed samples were all tested on the inside of the coils where the material is in a compressed state. The figure also shows that the straight-aged samples exhibited a more linear decrease in cut-through force than the static-wrapd
55

Dynamic Cut-Through
Fi gure 49. Dynamic Cut-Through Results for CP Wires
4.6.6 Weight.
Figure 50 shows the weight results for CP wires from four aged conditions. The figure shows that the temperature at which the wire is aged does have an impact on the weight loss, but the dynamic bend test does not.
Aging Hours
Ave
rage
Wei
ght
Ret
aine
d, %
500040003000200010000
1.00
0.85
0.80
0.95
0.90
ByVar1
CP, 300 °C, 0% RH, Dynamic.Static = 10x.StraightCP, 300 °C, 0% RH, Dynamic.Static = None.Straight
CP, 260 °C, 0% RH, Dynamic.Static = 10x.StraightCP, 300 °C, 0% RH, Dynamic.Static = 10x.10x
Figure 50. Weight Results for CP Wires
Weight Retained
Aging Hours
Cu
t-Th
rou
gh, l
b
45
40
35
30
25
20
15
Setup Info
CP, 300 °C, 0% RH, Dynamic.Static = None.Straigh
300025002000150010005000
t CP, 95 °C, 85% RH, Dynamic.Static = 10x.10
CP, 300 °C, 0% RH, Dynamic.Static = 10x.10xCP, 300 °C, 0% RH, Dynamic.Static = 10x.Straight
x
56

4.6.7 Thermogravimetric Analysis.
Based upon the DSC analysis performed on PI insulation, and trial and error, an isothermal oxidation temperature of 490°C was selected for the CP wir perature below a major material transition point. Figure 51 shows the difference in weight loss of the CP insulation in a nitrogen (21.78% weight loss) environment compared to an oxygen environment (57.24% weight loss). The higher the oxygen content in the atmosphere, the more susceptible the insulation is for oxygen absorption. Oxygen diffusion toward the interior of the polymer has the effect of depleting antioxidants, causing degradation (weight loss).
e to keep the test tem
Figure 51. The TGA Curves at an Isothermal Temperature of 490°C (in Nitrogen) Figure 52 shows the CP insulation aged at 0 cycles (light blue), 8 cycles (red), and 18 cycles (blue), which were analyzed for weight loss and tangents. This particular material has an inflection point of 9 ±1 minute, which is the same for all three curves. From 60-80 wt.%, the curve has a different onset point of 65 ±1 minute, which is the same for the three aged cycles. Note that CP is a composite polymer that consists of different layers of PI and PTFE. At a time range of 50-90 minutes, the bulk curve had a slight increase. In the bulk CP wire, the slight increase seen in the middle of the run may be due to the oxidation of the next material layer that was protected by the top lay ecomes straight where, at
is point, the layers are already exposed to the oxidation. In addition, the final weight loss at er. For the higher aged cycles, the curve b
th
57

120 minutes decreases as the aged cycles increase, as shown in table 7. The higher the aging cycles, the less oxidation absorption occurs on the polymer, since oxidation already took place during the process.
Table 7. Final Weight Loss for CP Wire Using TGA
CP Final Weight Loss (wt.%)Bulk (0 cycles) 57.24 Aged 8 cycles 50.70 Aged 18 cycles 46.19
Figure 52. The TGA Curves at an Isothermal Temperature of 490°C (in Air) Figure 53 shows that the CP wire had a rapid increase in weight loss at the beginning of aging (up to 500 hours) and continued to slowly increase as the material continued to age. Figures 54 and 55 show the isoconversional plots for bulk and aged CP wire. The Activation energies where statistically consistent throughout the aging cycles (260 kJ/mole) except for the temperature shifts. At higher aging cycles, the activation energy for the reactions to occur would
58

be at a lower temperature compared to bulk samples. The wire that was aged at 95ºC at 100% humidity had an activation energy of 10 kJ/mole higher than bulk (avg. 257 kJ/mole).
CP Aging Hours vs. % Weight Loss
0
500
1000
1500
2000
2500
3000
3500
30 35 40 45 50 55 60
% wt loss
Hou
rs
Figure 53. The OIT Final wt.% vs Aging Hours for CP Wire
CP-Bulk
-3.5
-3
-2.5
-2
-1.5
-1
-0.5
00.00116 0.00118 0.0012 0.00122 0.00124 0.00126 0.00128 0.0013 0.00132 0.00134
10%loss
20%loss
30%loss
40%loss
50%loss
60%loss
1/ T ( K )
Figure 54. The TGA Isoconversional Plot for Unaged CP Wire
59

CP-3449-18
-3.5
-3
-2.5
-2
-1.5
-1
-0.5
00.00114 0.00116 0.00118 0.0012 0.00122 0.00124 0.00126 0.00128 0.0013 0.00132 0.00134
1/T (K)
-ln(B
eta
10% w eight loss
20% Weight loss
30% Weight loss)
40% Weight loss
50% w eight loss
60%
70%
80%
Figure 55. The TGA Isoconversional Plot for Aged CP Wire .7 MODEL DEVELOPMENT4 .
The process used to develop the aging model for CP wire was very similar to PI; however, the number of test points was significantly less. The degradation of CP was significantly different from PI, which was surprising, considering that the polyimide itself was the same. The PTFE outer layers provided substantial protection for the underlying polyimide. Moisture was not an overriding degradation stressor as it was for PI wire. The number of aging cycles was more important in the CP degradation model since the failures were widely distributed. The CP wire tended to not fail in the same bell-shaped curve as the other wire types. Failures were more spread out over a longer period of time from initial failure to final failure. Censored data was also weighted and used in the model as in the PI analysis. Oxidation and hydrolysis were the overriding stressors that affected the degradation of the wire, although hydrolysis was not as significant a degradation mechanism to CP as it was to PI insulated wire. Other additional mechanical and fluid stressors were not as significant to the degradation of the CP wire. There were insufficient data to differentiate the effects of thermal cycling or vibration from the nonstressed configuration. The algorithm tracks the actual aging fairly well, as described above, with the exception of a general shift down of the equation. The square of the residuals, R square, is 84.6%, and the fit (S) is 0.1167, in ith the various environmental stresso d vibration re the same as with no dynamic stressor because no failure data was obtained from these
dicating a good correlation with the actual results of aging wrs that were evaluated. The values for temperature cycling an
a
60

stressors separately, and the setups did not age long enough to determine a difference in time-to-failure. Increasing temperature leads to a corresponding decrease in the average life of the wire. Data from this test program validated the temperature dependence of the wire degradation, following an Arrhenius relationship. Table 8 shows comparisons for the baseline stressor combination as well as several other stressor combinations. A comparison of the setups shows how the time-to-failure can be affected by the stressor combination present. The Arrhenius-based model was not designed to accommodate these stressors beyond what was incorporated into the standard test procedure. All setups that had not yet failed were within the prediction times-to-failure of the model.
Table 8. Comparison of Actual Failure Data to Predicted Failure Data by the Algorithm
Group Setup Temp. (°C)
RH (%)
Dynamic Stressor
Static Stressor
Actual Median Failure Time
(hr)
Predicted Median Failure
Time (hr) Percent
Difference 17 30 95 85 10 times 10 times 2,857 2,857 0 21 16 260 0 3 times S 14,517 21,818 50 22 14 280 0 10 times 10 times 4,863 5,549 14 22 17 280 0 3 times S 4,220 4,157 -1 22 19 280 0 3 times 10 times 3,679 3,120 -15 23 3 300 0 None S 3,279 2,590 -21 23 6 300 0 None 10 times 1,577 1,944 23 23 7 300 0 None 6 times 859 859 0 23 8 300 0 None 1 time 1,416 1,416 0 24 12 300 0 10 times S 1,450 1,408 -3 24 15 300 0 10 times 10 times 1,122 1,057 -6 24 18 300 0 3 times S 702 792 13 26 28 300 0 Fluid S 1,165 1,233 6 26 29 300 0 Fluid 10 times 979 925 -5 27 31 70 100 10 times 10 times 2,853 2,853 0 28 32 95 100 10 times 10 times 1,538 1,538 0 18 10 270 0 10 times S >800 * 16,935 20 1 260 0 None S >4,898 * 71,366 20 4 260 0 None 10 times >4,898 * 53,573 20 21 260 0 Temp. 10 times >4,898 * 80,073 20 24 260 0 Vibe S >4,898 * 71,366 21 9 260 0 10 times S >8,072 * 38,799 21 13 260 0 10 times 10 times >8,072 * 29,126 22 2 280 0 None S >5,465 * 13,596 22 5 280 0 None 10 times >5,465 * 10,206 22 11 280 0 10 times S >5,465 * 7,392
* These setups stopped prior to failure of specimens. Actual hours of aging when stopped. S = Stop
61

4.8 DISCUSSION OF CP WIRE.
Low-temperature aging had less impact on the dynamic cut-through and weight test results than
not change color as it aged. The aged wire that failed DWV looked new, but the olyimide inner layers may have disintegrated within the insulation, and this effect could not
often eak ot of the wire construction. The conductor held up well until after many hours of aging at high
temperature. At this point, the conductor exhibited h , kage, and falling lugs. The wire ne al h ing. DW u e rou to s othe e types d o ny cycl The sence PTF the n the the pr s of the a wire were so different than PI wire. PTFE on the interior of th posite ta wed the to be easily strippe fter g, w le surfa the wir rovided significant prot n fro ss . st owe he diffe n oxidati very small for short-term g. is te agin t diffusion limited from macro level. Since e co site u is p of multiple layers, inner layers could be prot d fro ario ress including oxidation and hydrolysis. For longer-term ing at lower temperatures, this effect ma ced. The time-to- re ery h a e is not i ive of ircraft c itions. Corr ion t re al ai af tin ons ( rature = RH = 33 shows the estimated urs e a urs median failure when a dynamic bend 10-t is ent. echa disturb e time increases to 81,0 hours ovi o n g e ev s plac erely dam ge the wire. It is estimated that over long periods, the effects n and l surface w ar will incr the ng s wha as n at ditio approach mbient shou ctual stim ife b ed l e i rather than operating hours. 5. P VINYL CH IDE O GING A RES
the dynamic stressors, static stressors, or high-temperature aging. High-humidity aging had a greater negative impact on the tensile strength results than dynamic stressors, static stressors, or oven-aging temperature; however, the elongation was improved by the humidity. Relative humidity of 100% conditioning had a greater adverse effect on inherent viscosity results than 85% conditioning. CP wire did not have the visual indicators that PI showed as the wire aged. The outer PTFE layer didp
be visually noticed. Failures were generally through the tape at a seam, which is a wsp
eavy oxidationly easily stri
r wir
strand breapped even after
, but spreaver becanot g
me brped
ittle and wgether a
as usu with the
eavy agut over maV fail res wer
es.
pre of E in co struction could be reason opertie gede com pe allo wire
d a agin hi on the exterior ce of e, it pectio m various stre ors The te results sh
s that the d that t rence i on is
testin Th indica g is no a th mpo ins lation made u
ecte m v us st es, agy be more pronoun
failu at v hig temper tur ndicatt
most a,
ondelat o mo typic rcr t opera g conditi empe 71°C %)
ho to b pproximately 44,000 ho to the of imes pres For
awire that is not m
ictablnically ed, th
00 , pr ded n on ing, unpred ent take e to sev aof vibratio genera e
ease agi ome t f ter tha no stress all. Con ns that ald a ly e ate l as on tota hours sinc nstallation
OLY LOR /P LYAMIDE A ND TEST ULTS.
5.1 POLYVINYL CHLORID P M AGINGE/ OLYA IDE DATA.
Agi ata w init ana ed same techniques described throughout this report. The log average life approach was used to determine the median time-to-failure. The lognormal
types, and was used ut the data analysis. The failure data was fairly tight, allowing for analysis with high
confidence levels. All the aging setups reached failure, thereby allowing plenty of data to be analyzed. Table 9 shows the comparisons of the aging data generated in this test program to
ng d as ially lyz using the
distribution captured the failure distribution well, as with the other wire througho
62

previous tests. The original predicted aging times for each of the aging setups was based on previous test results and engineering judgment.
Table 9. Comparisons of Aging Data With Original Estimated Failure Times for PV
Group Setup Temp. (°C)
RH (%)
Dynamic Stressor
Static Stressor
Estimated Failure Time (hr)
Mean Failure Time (hr)
53 1 110 0 None S 5027 53 4 110 0 None 10 times 5682 53 9 110 0 10 times S 5210 4311 53 13 110 0 10 times 10 times 3914 53 16 110 0 3 times S 4455 53 21 110 0 Temp. 10 times 5769 53 24 110 0 Vibe S 5991 54 2 120 0 None S 2323 54 5 120 0 None 10 times 2098 54 10 120 0 10 times S 1620 1881 54 14 120 0 10 times 10 times 1601 54 17 120 0 3 times S 1881 56 3 130 0 None S 1071 56 6 130 0 None 10 times 951 56 7 130 0 None 6 times 1130 56 8 130 0 None 1 time 990 57 11 130 0 10 times S 520 835 57 15 130 0 10 times 10 times 403 57 18 130 0 3 times S 786 57 19 130 0 3 times 10 times 446 59 28 120 0 Fluid S 715 59 29 120 0 Fluid 10 times 390 60 12 135 0 10 times S 300 537 61 30 95 100 10 times 10 times 817
S = Stop
5.2 TEMPERATURE.
The analysis was based on up to 11 life specimens that were aged to failure within each setup. roximately 10 or 11 specimens
had failed in all setups. These failure data points were used to determine failure estimates that Twenty-six sample setups were aged at various conditions. App
could then be used in the model. Failure data from the ASTM standard conditions at 0% RH could be graphed across four temperatures, as shown in figure 56, following the Arrhenius model.
63

(1/T)
Log(
Hrs
)
0.002
625
.000
00
26057
5
00 .0.0202
55
0
0
.0052
502
500
0.002
4
0.00 2
0.075
2450
3.75
3.5
3.25
3.00
2.75
2.50
0SR-SqR-Sq(ad
0.039447298.8%98.7%j)
Regression99.7% PI
t - PV: 10x.SLog(Hrs) = - 11.05 + 5629 (1/T)
Figure 56. Inverse Tempe Arr lationshi of PV Wire The estimated time-to-f per rediction interval for each setup with ures was determ d. W and sor co inations that were run at multiple temperatur re fitted by a line to approxima e Arr ius F fitted line, additional es tes were provided for each comb on of nam o ressor, an RH. From the Arrhenius plot, the activation energy (EA = 25.8) was determestima at a cific . The lop cu different han the slop orted by Elliot A = .5, al h upo eca on i pears to be 32. , as shown in figure 57. Figure show n ex lation the a time-to-failure versus temperature from the results a te ratur ting o pr t 10,000 ours and 82 t 60,000 ou comparison, the final PV model resulted in 101.5°C for 10,000 hours and 82°C for 0, s. The temperature was plotted from this point forward using °C rather than 1/°K,
odeled better.
Fitted Line Plo
rature henius Re p
ailure and up 90% p failine ire stres mb es we
te th hen curve. s
rom the tatic st
timainati dy ic stres r, s d
ined, and a temperature index could be rve was ted spe time s e of the t e rep
[3] (E 35 thoug n r lculati t ap 3)
57 s a trapo of log aver ge in mpe e ra f ap oximately 101°C a h °C a
h rs. For 000 hour6
since the resulting relationships m
64

Figure 57. Time-to-Failure Curve Compared to IEEE [3] Data for PV Figure 58 shows a comparison of the main effects of each dynamic and static stressor using the least squares means of the log average time for DWV failure to occur. This comparison averages the values across temperatures. The logarithmic mean of hours to aging increases when a stressor is less stressful. For example, no dynamic stress showed more than 45% mean time-to-failure when compared to the baseline of stressor with 10-times wrap; while using a dynamic tressor with a 3-times wrap exhibits a 7% decrease in the average life. This indicates ths at
dynamic wrap is detrimental to the wire.
65

he ASTM baseline average life. This effect was not nderstood. Annealing may help with this wire type to eliminate strain, similar to PI, allowing
the insulation to reduce its effective strain and increase the time-to-failure somewhat. Static stress 4 was just below the nonstressed time-to-failure. The static stressor does not have as significant an affect on wire aging as the other wire types. The low annealing temperature of the materials may allow the PV wire to reduce strain somewhat. With fluid exposure, however, the materials tended to crack readily. By looking at figure 59, a better understanding of the additive effects from each of the dynamic and static stressors is shown. For example, the DS (1,1) condition (dynamic stressor 1, static stressor 1) and the DS (1,3) condition are the least damaging to the wires as they age. The baseline combination DS (2,1) appears to be a fairly average view of wire aging, while the tight 3-times dynamic wrap of both straight DS (3,1) and static wrapped DS (3,2) specimens and the dynamic wrapped specimens with static strain are on the lower end of the aging curve. The effect of exposure to aircraft fluids can have a significant effect on the wire, especially when the
1 – no strebend, 4 – T6 – fluid exposure
ssor, 2 – 10-times bend, 3 – 3-times emperature cycling, 5 – vibration,
1 – none; 2 – 10-times wrap; 3 – 6wrap; 4 – 1-time wrap
-times
Figure 58. Comparison of PV Dynamic and Static Stressors Static stressor 1 is the ASTM baseline, with specimens aging straight. The figure also indicates that the setups using static stressor 2, a 10-times static strain, exhibited approximately 80% of the average life as the ASTM baseline setup. For static stressor 3, a 6-times wrap, the mean failure time actually increased to the same as tu
66

wire is strained DS (6,2). This strain allows the chemical bonds to be broken or otherwise affected much easier than when the samples are not strained. The black points are the means of aging based on the actual test results determined in this test program, while the red points are the predicted means based on the resulting model. As shown in the figure, the model tracks the actual aging quite well for all stress combinations.
Setup.
Dat
a
626151423231222114131211
VariableDynSta.Add(Dyn,Sta)
Time Series Plot of DynSta., Add(Dyn,Sta) - PV
3.4
3.3
3.2
3.1
3.0
2.9
2.8
2.7
2.6
2.5
Figure 59. Additive Effect of PV Dynamic Stressors and Static Stressors The data analysis for model development was performed using the pooled data from all the individual PV specimen failures. The final model combines the additive effects of the discrete dynamic and static stressors discussed above with gradual trend effects that temperature and RH have upon the expected life of the samples. As temperature and/or RH increases, the expected life decreases. Interactions between some of these factors are also incorporated; however, only a single RH test group was performed. The lack of data limits the development that can occur on the PV degradation model. Interactions were identified and incorporated into the model. The final model explains 97% (R-squared) of the PV failure variation. Across all setups, a total of 261 PV specimens failed the DWV test. Of these, four early failures (1.5%) were identified as statistical outliers and were not used in the final model. For setups that did not reach 100% failure of all life specimens, the failure rates were estimated by the distribution of the specimens that had failed to that point in each setup using a probability plot. The relationships of the dynamic and static stressors and the effects of temperature and humidity are illustrated in figure 60. Individual failure times are plotted and a simple linear fit is used whenever a specific dynamic-static-humidity stress combination crosses at least two
67

temperatures. The figure provides insight into how the aging model was developed. A few of the stressor versus temperature curves at 0% RH are parallel straight lines, but shifted up or down. There are the only two setups with a 10-times wrap. A slope could not be calculated for the humidity data point. The fluid exposed wire degraded much faster than the non-fluid exposed samples. The curve offsets are apparent in the figure, assuming that the slopes would be
milar to the other setups, and show that the fluids greatly reduce the median time-to-failure. si
Temp
Log(
Hrs
)
14013012011010090
3.75
3.50
3.25
3.00
2.75
2.50
DynStaH
13000140002100022000221003100032000420005100061000
11000
62000
12000
Scatterplot of Log(Hrs) vs Temp - PV
Figure 60. The PV Stressor Relationships Across Multiple Temperatures Only one humidity setup for PV wire was run. The setup at 100% RH was run at one temperature only, preventing fit of the data across multiple temperatures. The slope of the theoretical line was assumed to be similar to the 0% RH setups. Using the similar offset relationships discussed in section 3, with the slope assumptions for the humidity setups, the model could be developed. 5.3 OXIDATION.
lightly less than the 150 ±15 air exchanges per hour in the standard ASTM test method. For
The data from the airflow experiment showed that the aging at the ASTM conditions with a change in airflow did not significantly affect the aging of the PV wire. Tests were run at 2-5 oven air exchanges per hour, 61 air exchanges per hour, and 125 air exchanges per hour, which issPV, the average life of the wire increased slightly from the lowest (2-5 exchanges per hour) air supply, as shown in figure 61. The difference (537 hours to 600 hours to failure) is within the
68

variability of the results however, but the fact the median time-to-failure increases indicates that the increased oxidation rate did not affect the life at these levels.
Airflow
Log(
PV)
125615
2.800
2.775
2.750
2.725
2.700
2.675
2.650
Individual Value Plot of Log(PV) vs Airflow
Figure 61. Failure Time of PV Specimens at Different Airflow Rates 5.4 ELECTRICAL STRESS.
Test data s ure of the dditional life specimens, rather than the electrical stress. The reduced electrical stress did not
howed that the increase in mechanical stress dictated the rate of failaaffect the aging of the PV wire. 5.5 MECHANICAL STRESS CYCLES.
All the life specimens failed in very tight groups; therefore, differences based on the number of mechanical cycles was not a factor in the normal aging samples. Based on the impact that the
d on the aging of PV wire, it is expected that the number of cycles is an important factor in rate of degradation of the wire. It is expected that the offset would increase dynamic stressor ha
with increased levels or cycles of mechanical cycling stress. 5.6 TESTING RESULTS.
Various tests were utilized to compare aging to the properties of the CP wire. Visual inspection, wet and dry IR, tensile, elongation, inherent viscosity, weight loss, and dynamic cut-through test results correlated to aging. Selected data are presented here to provide an overview of the
69

positive trends that developed. Additional summaries of the results and discussions, including reproducibility and variability of test data, are provided in appendix G. A complete compilation f the results is provided in appendix H.
5.6.1 Visual Examination
o
.
The PV insulation type exhibited the most dramatic visible changes of the three wires tested. The color changed from the original white to brown over a couple of cycles at temperatures just slightly higher than the rated temperature, and eventually became nearly black. The wire developed cracks throughout the sample during aging, and stiffness quickly changed from very flexible to very stiff. The nylon, which is present to provide mechanical support and protection to the PV, became brittle early in testing. The PV and nylon layers bonded to form a single insulation layer, which cracked through to the conductor upon bending. This decreased the protection provided by a dual-layer insulation system, making the sample more prone to notch propagation. Figure 62 compares an unaged PV wire to samples that were aged at 135ºC and subjected to the 10-times dynamic bend test between aging cycles. The middle and bottom wires were aged for approximately 560 and 640 hours, respectively. As shown in the figure, the insulation color changed from white to brown, and numerous circumferential cracks formed as the wire aged. Figure 63 shows an unaged PV wire with samples that were also subjected to the 10-times dynamic bend test, but were aged in the 10-times static-wrapped condition at 130ºC. The middle and bottom wires, which were aged for approximately 400 and 380 hours, respectively, exhibited cracks on the inside of the wire coils. The color change was not as dramatic on these samples, but they were subjected to aging at a lower temperature for a shorter duration. However, the color change was darker on the inside of the coils where the wire was in contact with the Teflon mandrel.
®
Figure 62. Unaged PV Wire (Top) and Aged Wires (Bottom) for 560 and 640 Hours
70

Figure 63. Unaged PV Wire (Top) and Aged Wires (Bottom) for 400 and 380 Hours
Figure 64 compares an unaged PV wire to a wire aged in the static-wrapped condition for 570 hours at 130ºC. The sample was also subjected to the 10-times dynamic bend test between aging cycles. The figure shows the burn hole from the DWV test on the inside of the coil, and the significant change in the insulation cover, especially on the inside of the coil that was in contact with the Teflon mandrel.
Figure 64. Unaged PV Wire (White) and Wire Aged for 570 Hours
71

Figures 65 and 66 show unaged PV wires with samples that were aged at 95ºC and 100% RH for 720 and 1000 hours, respectively. The samples were aged in the 10-times static-wrapped condition, and subjected to a 10-times dynamic bend test after each aging cycle. Both aged samples exhibited the formation of circumferential cracks and a browning of the insulation.
Figure 65. Unaged PV Wire (White) and Wire Aged for 720 Hours
Figure 66. Unaged PV Wire (White) and Wire Aged for 1000 Hours
72

Figure 67 compares an unaged PV wire to samples that were aged at 110ºC and subjected to a 10-times dynamic bend test at the completion of each aging cycle. The middle and bottom wires were aged for approximately 4200 and 5200 hours, respectively. The figure shows that as the aging continued, more closely spaced circumferential cracks formed, and the insulation turned a arker shade of brown.
d
Figure 67. Unaged PV Wire (Top) and Aged Wires (Bottom) for 4200 and 5200 Hours 5.6.2 Insulation Resistance Wet and Dry.
Figure 68 shows a relatively steady decrease in the wet IR for straight PV wires aged at 110º and 135ºC, but the wires aged at 130ºC exhibited variation in the results from cycle to cycle. The figure also shows a much earlier decrease in the IR for samples exposed to the higher aging temperature. Figures 69 and 70 show that the plots for the 1- and 10-minute dry IR tests are very similar. The figures show that for the five oven-aged conditions and one humidity-aged condition plotted, an increase in the IR was often noted in the earlier stages of aging, but the measured values then began decreasing as the aging continued.
73

Aging Hours
Ave
rage
Log
(G.
ohm
s+1)
500040003000200010000
3.0
2.5
2.0
1.5
1.0
0.5
0.0
ByVar1
PV, 130 °C, 0% RH, Dynamic.Static = 10x.Straight
PV, 110 °C, 0% RH, Dynamic.Static = 10x.StraightPV, 130 °C, 0% RH, Dynamic.Static = 10x.10x
IR Wet
PV, 130 °C, 0% RH, Dynamic.Static = None.StraightPV, 135 °C, 0% RH, Dynamic.Static = 10x.Straight
Figure 68. Wet IR Results for PV Wires
Aging Hours
Ave
r
IR Dry (1 minute)
2.5
age
Log(
G.oh
ms+
1) 2.0
1.5
1.0
0.5
0.0
500040003000200010000
Setup Info.
PV, 130 °C, 0% RH, Dynamic.Static = 10x.StraightPV, 130 °C, 0% RH, Dynamic.Static = None.StraightPV, 135 °C, 0% RH, Dynamic.Static = 10x.Straight
PV, 110 °C, 0% RH, Dynamic.Static = 10x.StraightPV, 130 °C, 0% RH, Dynamic.Static = 10x.10x
Figure 69. One-Minute Dry IR Results for PV Wires
74

Aging Hours
Ave
rage
Log
(G.o
hms+
1)
500040003000200010000
3.0
2.5
2.0
1.5
1.0
Setup Info.
PV, 130 °C, 0% RH, Dynamic.Static = 10x.StraightPV, 130 °C, 0% RH, Dynamic.Static = None.StraightPV, 135 °C, 0% RH, Dynamic.Static = 10x.Straight
PV, 110 °C, 0% RH, Dynamic.Static = 10x.StraightPV, 130 °C, 0% RH, Dynamic.Static = 10x.10x
IR Dry (10 minute)
Figure 70. Ten-Minute Dry IR Results for PV Wires 5.6.3 Insulation Tensile and Elongation.
A general progression of decreasing tensile strength and elongation was seen with PV wire. Mandrel bend data could also be used to show the decrease in elongation as the wire aged. Unfortunately, the discrimination of the diameter bend decreases substantially as the sample goes to zero, or more accurately, to the wire diameter. The ability to distinguish values in the mid range of about 20%-40% elongation was not very good, and midterm aging values were difficult to obtain with this method. Figures 71 and 72 provide the insulation tensile and elongation results from five oven-aged and one humidity-aged conditions. For the samples aged at 135ºC and not subjected to a dynamic stress, the tensile strength increased at several of the hold points initially. This may have been due to the hardening of the insulation without introducing stressors that could initiate cracks. An increase in tensile strength was also noted on the 10-times static-wrapped samples that were subjected to a 10-times dynamic bend. This may have resulted from the insulation on the inside of the coils being in the compressed state. Figure 72 shows that as the insulation aged and became more brittle, the percent elongation decreased.
75

Aging Hours
Tens
ile S
tren
gth,
psi
40003000200010000
5500
5000
4500
4000
3500
3000
Setup Info
PV, 130 °C, 0% RH, Dynamic.Static = 10x.StraightPV, 130 °C, 0% RH, Dynamic.Static = None.StraightPV, 135 °C, 0% RH, Dynamic.Static = 10x.StraightPV, 95 °C, 100% RH, Dynamic.Static = 10x.10x
PV, 110 °C, 0% RH, Dynamic.Static = 10x.StraightPV, 130 °C, 0% RH, Dynamic.Static = 10x.10x
Insulation Tensile Strength - Instron
Fig es ure 71. Insulation Tensile Strength Results for PV Wir
Aging Hours
400
300
Setup Info
PV, 130 °C, 0% RH, Dynamic.Static = 10x.StraightPV, 130 °C, 0% RH, Dynamic.Static = None.StraightPV, 135 °C, 0% RH, Dynamic.Static = 10x.StraightPV, 95 °C, 100% RH, Dynamic.Static = 10x.10x
PV, 110 °C, 0% RH, Dynamic.Static = 10x.StraightPV, 130 °C, 0% RH, Dynamic.Static = 10x.10x
Elon
gati
on, %
200
100
0
200010000 500040003000
Insulation Elongation - Instron
Figure 72. Insulation Elongation Results for PV Wires
76

77
5.6.4 Dynamic Cut-Through.
Similar to the results on the CP wire samples, the dynamic cut-through forces of the PV wire samples increased in the earlier stages of aging but then decreased, as shown in figure 73. This is likely from the fact that the material can become harder when heated or from measurements being taken on the inside of the coils where the insulation is in a compressed state.
Setup info PV, 100°C, 0% RH, DynamicStatic = 10xStraight PV, 130°C, 0% RH, DynamicStatic = 10x10 PV, 130°C, 0% RH, DynamicStatic = NoneStraight PV, 135°C, 0% RH, DynamicStatic = 10xStraight PV, 95°C, 100% RH, DynamicStatic =10x30x
Figure 73. Dynamic Cut-Through Results for PV Wires 5.6.5 Weight.
Figure 74 shows the results from the weight evaluation performed on PV samples from four oven-aged conditions. The plots show that there was more substantial weight loss when samples were aged at 130º or 135ºC than when aged at 110ºC.

Aging Hours
Ave
rage
Wei
ght
Ret
aine
d,
1.00
%
0.99
0.98
0.97
0.96
500040003000200010000
ByVar1
PV, 130 °C, 0% RH, Dynamic.Static = None.StraightPV, 135 °C, 0% RH, Dynamic.Static = 10x.Straight
PV, 110 °C, 0% RH, Dynamic.Static = 10x.StraightPV, 130 °C, 0% RH, Dynamic.Static = 10x.10x
Weight Retained
Figure 74. Weight Results for PV Wires 5.6.6 Thermogravimetric Analysis.
Figure 75 provides the DSC analysis performed on PV insulation. From this analysis and trial and error, an isotherm oxidation temperature of 250ºC was selected to keep the test temperature below a major material transition point. Figure 76 shows the weight loss of the unaged PV insulation in nitrogen (40% weight loss) and oxygen environments (50% weight loss). The weight loss and tang lack), and 7 cycles
ed) were analyzed ber ncreases, as shown table 10, which was opposite from the CP bulk curve.
ctrum represents the antioxidants being onsumed as it is heating (aging), holding back the degradation process. As soon as the
antioxidants are depleted, the polymer becomes unprotected and will degrade at a higher rate (steeper slope). At higher aged cycles, there are less antioxidants to protect the insulation material, moving the onset tangent back on the curve. The length of time to when the antioxidants are depleted is the called OIT.
ents for PV insulation aged at 0 cycles (blue), 4 cycles (bin figure 77. The final weight loss at 120 minutes decreases as the num(r
of aging cycles i The more cycles of aging, the less oxidation occurs on the polymer, since it takes place during the aging process. The onset tangents describe the change of slope that occurs during the TGA spectrum. It is assumed that the first slope of the spec
78

Figure 75. Differential Scanning Calorimetry for PV Wire
Figure 76. The TGA Curves at an Isothermal Temperature of 250°C (unaged wire)
79

Figu 0°C
Table 10. Final Weight Loss for PV Wire Aged at 135°C, Using TGA Method
PV Final Weight Loss (wt.%) Onset Tangents (minute)
re 77. The TGA Curves at an Isothermal Temperature of 25
Bulk (0 cycles) 49.61 36.24 Aged 4 Cycles 42.25 24.01 Aged 7 Cycles 35.64 6.18
Figure 78 shows a linear relationship where weight loss increases as aging increases. This is in contrast to CP wire that had a fast increase of weight loss in the beginning of aging (up to 500 hours) following a slow increase as the material continued aging.
80
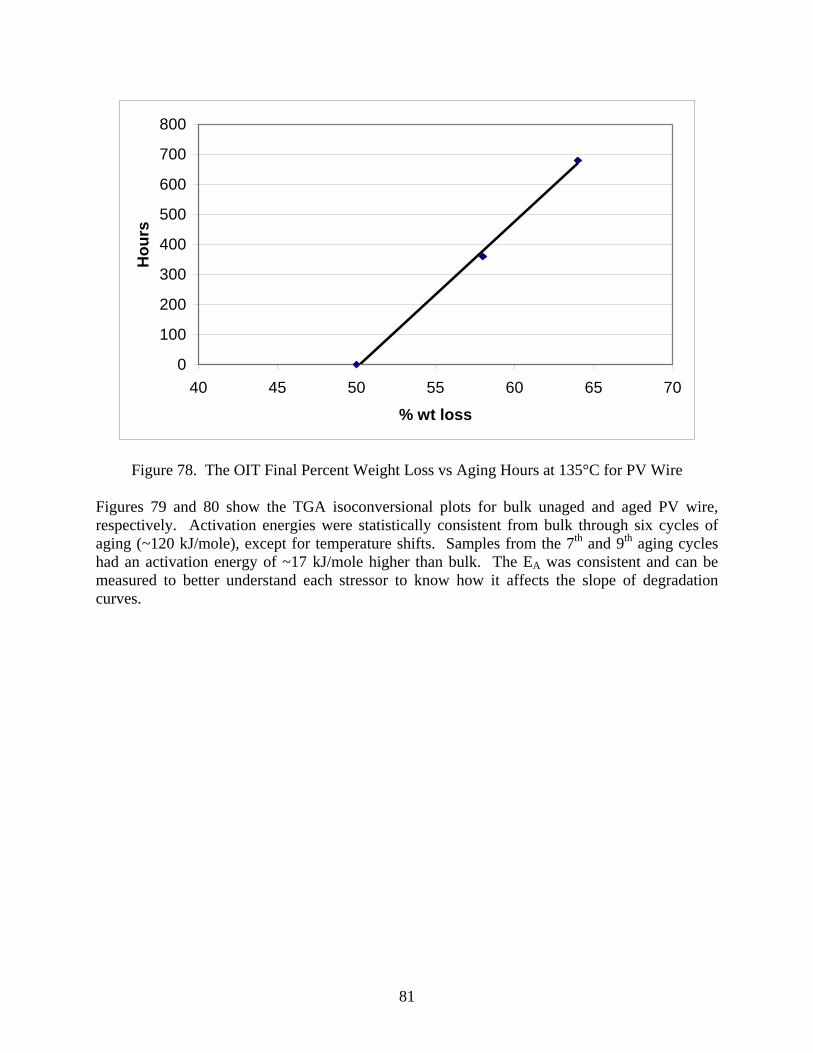
0
100
200
300
400
500
600
700
800
40 45 50 55 60 65 70
% wt loss
Hou
rs
Figure 78. The OIT Final Percent Weight Loss vs Aging Hours at 135°C for PV Wire
Figures 79 and 80 show the TGA isoconversional plots for bulk unaged and aged PV wire, respectiv ycles of ging (~120 kJ/mole), except for temperature shifts. Samples from the 7th and 9th aging cycles
had an activation e y of ~ lk and can be measured to better understand each stressor to know how it affe slope of degradation curves.
ely. Activation energies were statistically consistent from bulk through six ca
nerg 17 kJ/mole higher than bu . The EA was consistentcts the
81

PV-BULK
-3.5
-3
-2.5
-2
-1.5
-1
-0.5
00.0016 0.00165 0.0017 0.00175 0.0018 0.00185 0.0019
1/T (K)
-ln(B
eta)
10% weight loss
20% Weight loss
30% Weight loss
40% Weight loss
50% weight loss
Figure 79. The TGA Isoconversional Plot for Unaged PV Wire
PV-6548-6
-0.5
00.0016 0.00165 0.0017 0.00175 0.0018 0.00185 0.0019 0.00195
-3.5
-3
-2.5
-2
-1.5
-1
1/T (K)
-ln(B
eta
10% weight loss)
20% Weight loss
30% Weight loss
40% Weight loss
50% weight loss
Figure 80. The TGA Isoconversional Plot for Aged PV Wire
82

5.6.7 Fourier Transform Infrared Spectroscopy.
Background scans of the unaged wire insulation were taken using a Fourier transform infrared spectroscopy (FTIR) in a 64 x 64 pixel area. The two layers of PV and polyamide could be discerned from the scores plotted in figure 81. The baselined PV sample was found to contain one primary component, polyvinyl, with several additional peaks not directly from the polyvinyl material (C=O at 1730 cm-1, 1530 cm-1 band-amide or amine). These peaks are likely from a plasticizer present.
1000 1500 2000 2500 3000 35000
50
100
150
Factor 2
Wavenumber
Rel
ativ
e In
tens
ity
SCORES PLOT20 40 60
20
40
60246810
x 10-3
Figure 81. An FTIR Spectrum of PV Wire Insulation Cross Section
An aged sample was compared to the unaged polyvinyl spectrum above, as shown in figure 82. Change in the aged PV is noted in the fingerprint region (1000-1600 cm-1), as well as in the C-H stretch region (2800-3000 cm-1), presumably due to changes in the C=C bonds. Note the plasticizer band at 1530 cm-1 has disappeared. The polyamide spectrum, figure 83, shows a band at 1700 cm-1 (C=O), indicative of oxidation.
83

1 0 0 0 1 5 0 0 2 0 0 0 2 5 0 0 3 0 0 0 3 5 0 00
0 .0 5
0 .1
0 .1 5
0 .2rb
ance
W a v e n u m b e r
Abs
o
Figure 82. An FTIR Spectrum of Partially Aged PV Insulation
1 0 0 0 1 5 0 0 2 0 0 0 2 5 0 0 3 0 0 0 3 5 0 00
2
4
6
F a c to r 4
W a v e n u m b e r
Rel
ativ
e In
tens
ity
S C O R E S P L O T2 0 4 0 6 0
2 0
4 0
0 .2 50 .2
0 .10 .1 5
0 .0 56 0
Figure 83. An FTIR Spectrum of Polyamide From PV Insulation Two areas of the PV spectra can be examined specifically and the change quantified, as shown in figure 84. It is difficult to know whether the sample thickness is the same, and this is one issue that would have to be further examined to be able to use FTIR to properly quantify the molecular changes as the material ages. This figure shows that the chemical changes can be quantified over time.
84

1650 1700 1750 1800 18500
0.05
0.1
0.15
0.2
Wavenumber
Abs
orba
nce
2800 2850 2900 2950 3000 30500
0.02
0.04
0.06
0.08
0.1
0.12
0.14
0.16
Wavenumber
Abs
orba
nce
ydrolysis, the results were slightly different, as shown in figure 85. A comparison of hydrolyzed to unaged PV wire is shown in figure 86. Specific differences in the spectra due to hydrolysis were indicated by peak changes, such as the change in the fingerprint region (1000-1600 cm-1) as well as the C-H stretch region (2800-3000 cm-1) presumably due to changes in the
6435-6: 0.0102
6435-7 is red; 6435-6 is blue; pv control is green; Ratio of methylene/methyl (292 2)
6435-7 is red; 6435-6 is blue; pv control is green; Increase in C=O at 1780: Con
7/296
85
Figure 84. Two Areas of the PV Spectra to Quantitate With h
6435-7: 0.0188 6435-6: 0.8631 6435-7: 0.8198
trol: 0.0024 decreases: Control: 0.9518

C=C bonds. These differences can be used to monitor the aging of the PV material. An important difference is that the plasticizer band at 1530 cm-1 is still present in the sample that was immersed. Also, the polyamide spectrum shows little, if any, change from the reference spectrum. No oxidation band at 1700 cm-1 band (C=O) is noted. Changes in the plasticizer for aged PV, discussed by Shashoua [8], can be used to monitor aging in an elevated temperature environment.
1 0 0 0 1 5 0 0 2 0 0 0 2 5 0 0 3 0 0 0 3 5 0 00
0 .0 2
0 .0 4
0 .0 6
0 .0 8
0 .1
0 .1 2
0 .1 4
0 .1 6
0 .1 8
0 .2
W a v e n u m b e r
Abs
orba
nce
Figure 85. An FTIR of PV Immersed in Water at 70°C
1000 1200 1400 1600 1800 20000
0.2
0.15
0.05
0.1
W av e num be r
Figure 86. Heat-Aged (Green), Unaged Control (Black), and Humidity-Aged (Red) PV Wire
Abs
orba
nce
86

Differences can be used to distinguish between samples undergoing oxidation and those undergoing hydrolysis and no oxidation. This indicates that the FTIR can differentiate between different chemical mechanisms that may be occurring, and can quantify the levels. The outer polyamide layer also changed. Peak ratios between 1550 cm-1 and 1630 cm-1 equalized, with 1470 cm-1 as the nylon aged. There were also changes noted in the 3500 cm-1 region (-NH) and in the 1715 cm-1 region with C=O. 5.7 MODEL DEVELOPMENT.
The process used to develop the aging model for PV wire was very similar to PI; however, the number of test points was significantly less than with PI, and only one setup was subjected to temperature and humidity. The degradation of PV was significantly different than PI. The polyamide outer layer provided a strong mechanical shield for the soft PVC underneath; however, the polyamide began to crack and would encourage PVC failure underneath when the layers bonded during aging. Oxidation was the significant chemical factors that affected the degradation of the wire. Hydrolysis was a more significant degradation mechanism to PV insulated wire than was originally anticipated. Nearly all specimens of PV failed during the aging, so there was little need to use censored data in the development of the model. The algorithm for the PV model tracks the actual aging fairly well with the exception of a general shift down of the equation. The square of the residuals, R square, is 96.6%, and the fit (S) is 0.0727, indicating a good correlation with the actual results of aging with the various environmental stressors that were evaluated. Thermal cycling is actually a positive impact on the wire, and the vibration is somewhat negative. Increasing temperature leads to a corresponding decrease in the average life of the wire. Data from this test program validated the temperature dependence of the w .
Table 11 provides comparisons for the baseline stressor combination as well as several other stressor combinations. Comparisons of the setups show how the time-to-failure can be affected by the stressor combination present. The Arrhenius-based model was not designed to accommodate these stressors beyond what was incorporated into the standard test procedure. All setups that had not yet failed were within the prediction times to failure of the model.
Table 11. Comparison of Actual Failure Data to Predicted Failure Data
Group Setup Temp. (°C)
RH (%)
Dynamic Stressor
Static Stressor
Mean Failure
Time (hr)
Predicted Mean Failure
Time (hr)
Percent
Difference
ire degradation when following an Arrhenius relationship
53 1 110 0 None S 5027 6596 31 53 4 110 0 None 10 times 5682 4881 -14 53 9 110 0 10 times S 4311 4680 9 53 13 110 0 10 times 10 times 3914 3463 -12 53 16 110 0 3 times S 4455 4370 -2 53 21 110 0 Temp. 10 times 5769 5769 0 53 24 110 0 Vibe S 5991 5991 0 54 2 120 0 None S 2323 2671 15
87

Table 11. Comparison of Actual Failure Data to Predicted Failure Data (Continued)
Group Setup Temp. (°C)
RH (%)
Dynamic Stressor
Static Stressor
Mean Failure
Time (hr)
Predicted Mean Failure
Time (hr)
Percent
Difference 54 5 120 0 None 10 times 2098 1977 -6 54 10 120 0 10 times S 1881 1895 1 54 14 120 0 10 times 10 times 1601 1403 -12 54 17 120 0 3 times S 1881 1770 -6 56 3 130 0 None S 1071 1082 1 56 6 130 0 None 10 times 951 800 -16 56 7 130 0 None 6 times 1130 1130 0 56 8 130 0 None 1 time 990 990 0 57 11 130 0 10 times S 835 768 -8 57 15 130 0 10 times 10 times 403 568 41 57 18 130 0 3 times S 786 717 -9 57 19 130 0 3 times 10 times 446 530 19 59 28 120 0 Fluid S 715 604 -16 59 29 120 0 Fluid 10 times 390 447 14 60 12 135 0 10 times S 537 488 -9 61 30 95 100 10 times 10 times 817 817 0
S = Stop 5.8 POLYVINYL CHLORIDE/NYLON DISCUSSION.
PV wire quickly turned a tan color, and then eventually turned dark brown. By the fourth cycle of aging, the wire was very difficult to strip. The conductor was sticking to the insulation,
he reduced oxidation rate did not seem to affect the rate of degradation of the PV wire. Exposure to n. The use f PV wire near aircraft fluids warrants special precautions. Although specific aircraft fluids
were not evaluated separately, the fluids that were evaluated caused heavy damage to the samples. Due to t m d, fic or f b ad st d ta co t b erm Static stresso did reat aff agin PV PV w nds to a l at whatever stra is in d an bec re ly brittle. bility t e from that state bec s very difficult due to how he po strongly they bond together and to the conductor. This mak intenance actions on PV wire very difficult for heavily aged wire. sing ure to a cor ding decrease in the average of th re. ta his test program validated the temperature dependence of the wire degradation when following an Arrhenius relationship.
resulting in the inability of the insulation to slip over the conductor. By the eighth cycle, it had developed radial cracks on the outside of the bend, and one crack all the way around the specimen. The insulation became so brittle that cracks formed while trying to cut-through the insulation with a razor blade. T
aircraft fluids had by far the greatest impact on the specimen degradatioo
he test uld no
ethoe det
the speciined.
fluid luid com ination that h the moetrimen l effect
rs not g ly ect the g of the wire. ire te nneain stalle d omes ext me The a o mov
ome brittle t PVC and lyamide coating become, and howes ma
Increa temperat leads responlife e wi Da from t
88

The t tions. Correlation to more typical aircraft operating conditions, temperature = 71°C and RH = 33%, [9] shows the estimated hours to be approximately 47,000 h the failure w en a dynamic bend of 1 se wir is n a ed e in s to 00 rs, n in cta tak severely dam e the wire. In a dry environme ith H, the es strained wire with no me ical ing, e e tim -to-failure is expected to increase sharply to roughly 160 hou ond ns oa nt sh actually ate life based on total hours since installation ra er t atin ours. The effects of vibration and general surface wear are not expected to significantly affect the aging since the outer polyam la for p of t layer. perature cycling showed that the mea actu ly i co to the tressed setups. The reason for this is not known; however, it is po t t wor of the w ay keep the wire som hat f le, ning e th ed surface abrasion of poly e o r l t d ect nner PVC layer. The results act y indi d th on ligh on the a character s of the PV wire. Increasing the stress of th cou crease the aging. It is unclear wh e 6-t s ag mpl ex lo er time-to- e than the 10-times s ples. Vibration of aircraft should not have too great ect, ded the ation of t wire
sulation is sufficient to withstand other stressors. When aged sufficiently, as seen by testing external physical stressors, the slightest physical movement can cause disintegration of
e insulation.
icant role in the aging process for straight wire. Single-event
ime-to-failure at very high temperature is not indicative of most aircraft condi
ours toot mech
g unpredi
median nically disturb
ble event
h0 times 66,0
is pre hou
nt. For provided
e that o nonag
, the times place tocreases lightly
ag nt, 71°C w 0% R 10-timchan flex th stimated e,000 rs. C itio that appr ch ambie ould estim
th han oper g h
ide yer is rotectioared
n he PV Temn life al ncreased mp nons
ssible thaf
he gentleechanical strain. Vibration caus
king ire mew lexib lesse th effect o e m
the amid ute ayer, bu s
id not aff positive ef
the iuall cate at the abrasi had a tly fect ging istic
levels ese setups ld iny th ime ed sa es hibited a ng failur am
of an aff provi elong he inwith no th When no stressor was applied, even careful handling in the laboratory was enough to cause the specimens to fail. Dynamic bending was a medium-level stress, and the 3-times bend was only a little more stressful than the 10-times bend. Thermal shock and vibration were lower-level stresses. Fluid contamination, when present, significantly increases the rate of degradation. Static strain can cause significant changes in the aging; however, it, in itself, only played a part in the increased aging. The geometry of the specimens, and how they had to be handled and bent, played the most signifperturbations to the aging process are expected to have the greatest role in the failure of the wire, since they usually become the initiation of the failure. 6. CONCLUSIONS.
A multivariable test program to assess the aging of the selected wire types was developed that included dynamic bending, thermal cycling, vibration, chemical exposure, electrical stress, static
ress, temperature, humidity, and airflow. The research program used accelerated aging
d to estimate when aircraft ire would fail due to degradation in multistressor environments in a laboratory setting. The
sttechniques following a modified version of the Standard Test Methods for Hook-Up Wire Insulation (ASTM D 3032) and other industry-accepted methods such as humidity and fluid exposure, static wrap conditions, and thermal cycling. The test results were tabulated and analyzed using statistical regression techniques to create aging predictive models. They were continuously updated through the progression of the research program as data became available. The models were usew
89

results from this program predicted a median time-to-failure of the actual for Aromatic Polymide Tape-Wrapped Insulated Wire (PI) from -25% to +30%, polytetraflouroethylene/polymide composite (CP) from -20% to +20%, and for polyvinyl chloride/nylon (PV) it was -16% to 20% for transformed (nonlogarithmic) time data. Additional data can be implemented into the models to improve on the confidence levels of the results as more data becomes available. The results demonstrate that PI and PV aircraft wires that are present in high moisture areas will have a higher risk of aging or degradation. Single events, such as cut-through or improper handling during maintenance, can be more detrimental to the wire than aging from temperature nd humidity exposure. Wires not subjected to dynamic and static stressors will last longer if
lation elongation, (3) inherent viscosity, and (4) dynamic cut-through can help to valuate the age of the wiring. Other property tests have the potential to monitor degradation
to predict the life of PI, CP, and PV wires pes when exposed to specific single, common stressors in the aircraft. The developed wire
ide life estimations for PI, CP, and PV wires when exposed to specific multistressed aircraft environments. These predictive models account for the data and the degree
e time-to-failure data for the PI wire tested was significantly higher at any given temperature
athey are undisturbed. Aircraft wiring systems should be designed to minimize wires being subjected to a tighter than 10-times dynamic bend (wrapping) either through a designed flex application or during maintenance and repair actions. Aged wire is more susceptible to these forces than a pristine wire, and the risk of failures to the insulation increases with age. Unpredictable single events such as movement and handling of the harness dominated as the main failure mechanism. Visual precursors for wire failure in polyvinyl chloride (PVC), such as color change, crack formation, and flaking, provided important evidence that the wire aged. These properties are an indication of increased risk of physical or electrical failure when a maintenance action is performed. Property tests such as insulation elongation, viscosity, dynamic cut-through, and visual inspection were identified as effective tools to monitor the degradation of wire. The inclusion of tests such as (1) visual for insulation cracking or color change, (2) insuewith further development. The results of the test program correlated well with the Aging Transport Systems Rulemaking Advisory Committee Intrusive Inspection Report where high-temperature-aged wire resembled wires that were suspected of having been exposed to high heat. Humidity-aged wire similarly compared to those found in the intrusive inspection. Cracking exhibited by failed PV and PI correlated with service aircraft wire. The developed degradation models provide the ability tyaging algorithms prov
of error, which is expressed as the square of the residuals between the results and the algorithms and presented as R-squared values greater than 96% for PI wire, 85% for CP, and 97% for PV. The fit, represented by the standard deviation in log time, was 0.1042 for PI, 0.1167 for CP, and 0.0727 for PV. The models were based on empirical data for median time to dielectric withstand voltage (DWV) failure. Ththan the data cited by Elliott, due to material differences and the oxidation environment. However, the test results compared positively to the relationships between temperature and humidity effects.
90

The aging algorithms can be used to estimate when there is an increased risk of unsafe aircraft operation due to wire degradation in multistressor environments. The algorithms predicted median time-to-failure of wire, typically ranging from -25% to +30% of the actual for PI, -20% to +20% for CP, and -16% to 20% for PV for transformed (nonlogarithmic) time data. Algorithms that could be developed using first failure data would provide more accurate results.
d that 5 onths of aging could be analytically predicted.
mbinations were affected by the change in the relative humidity at levated temperatures, confirming that humidity is a major contributor to failure for the wire
tressor in the degradation of CP and PV wire. Increasing mperature leads to a corresponding decrease in the average life of all three wire types tested.
o dynamic bend. A static stressor, such as strain, can alter the effective ctivation energy of an aging mechanism, possibly by interacting with the other stressors to
Physical dynamic stressors do not affect the activation energy (EA) or change the mechanism of degradation; however, they do impart energy to shift the aging curve up or down, resulting in a change in the time-to-failure. Thermal analysis techniques validated that the EA increased with increased stress from static stressors on PV wire. Insulation with the higher activation energy (steeper Arrhenius slope) and higher temperature index would provide better longevity in a general application with a high thermal oxidative environment. Kinetic rates of reaction determined from thermogravimetric analysis were found to correlate to the activation energies of the degradation mechanisms for PV wire. Results from a simple series of tests showem Moisture was the most significant stressor in the aging of PI, but it also played a significant role in the aging of PV wire. Humidity affects the various dynamic, static, and temperature stressor combinations and causes hydrolysis and embrittlement of the polymers. Conversely, moisture can positively affect tests such as elongation and Indenter, causing the insulation to be softer and less brittle. Fluid contamination (jet fuel, hydraulic fluid, deicing fluid, and aircraft cleaner) had a profound effect on degradation for all types of insulations tested, with a greater than 70% decrease in life for PV wire, 15% decrease for CP wire, but up to a 20% increase for PI wire. The slopes of the stressor coetypes tested in this program. Specimen handling increases the mechanical stresses in the wire and induces failures. Specimens not subjected to dynamic and static stressors will last longer if undisturbed. Temperature was the most important steThermal cycling decreased the hours to failure by 70% for PI wire and increased hours to failure by 15% for PV wire. The aging process makes the wire much more susceptible to insulation cut-through damage. Depending on the dynamic and static stressors and temperature to which the wire is exposed, the resistance to insulation cut-through can decrease by as much as 80% for PI wire, 40% for CP wire, and 15% for PV wire. When PI wire is exposed to a 10-times dynamic bend stress, the life decreased by 90% (when compared to no dynamic bend stress). A 3-times dynamic bend resulted in a 94% decrease in life when compared to naallow the aging mechanisms to proceed more quickly. Increased static strain from straight to 10 times to 6 times resulted in decreased time-to-failure by 85% for PI wire and 70% for CP wire but less than 20% for PV wire. Humidity-aged PI samples subjected to a 10-times static strain
91

resulted in an 80% decrease in time-to-failure when compared to samples with no static strain. The life of CP and PI wire will increase exponentially with decreased strain. Nondynamically stressed wire will not fail until subjected to mechanical intervention, such as during maintenance actions or by single-point events. When highly aged, the amount of stress to
ause the failure is very low. This was found to be true for all three wire insulation types tested c
(PI, PV, and CP). Visual precursors to wire failure, such as color change, crack formation, and flaking as seen in PV wire, provided evidence that the wire had aged and indicate an increased risk of physical or electrical failure. 7. RECOMMENDATIONS.
Aircraft wiring systems should be designed to minimize the risk of wires being subjected to a tighter than 10-times dynamic bend. The use of PI or PV wire in high moisture level areas is not a recommended safe practice because of the significant role that moisture plays in the aging of
ose wire types.
he environmental and stressor conditions on the various aircraft zones to which wiring is
perty test methods.
hniques to improve current aircraft service ocumentation to define the extent and cause of unpredictable single-event damage. Monitor
and cause of this type of damage. Wire resistance to cut-through, abrasion, hydrolysis, and be
th The models developed under the requirements of this program can be used by original aircraft manufacturers and operators to better understand how certain environments will affect the wire in their aircraft. Maintenance personnel can also use these models to better understand the effect that maintenance actions can have on the Electrical Wiring Interconnect System (EWIS) and can also establish inspection cycles for the different zones likely to be affected. Tsubjected over the operational life is often not completely understood. The environments should be better defined. These environmental and stress conditions could then be used in the predictive models to determine wire aging. Although the results of this program correlate to other test programs, more empirical data from wire aged in aircraft would further validate the aging models and pro The degradation models developed in this test program were based on median DWV failures. Alternative degradation models using first DWV failure data or other property test data, such as elongation or inherent viscosity, need to be developed. Additional aging of CP and PV wire types can provide additional data to improve the accuracy of the predictive aging algorithms, specifically related to effects of humidity. Conduct additional research on new tecdfuture research regarding unpredictable single events, which can dominate the failure mechanism, to understand the risks associated with these single events and determine how best to update the predictive models. The effects of nonpredictable, single events such as cut-through and fluid exposure can be more detrimental to the wire than aging from temperature and humidity exposure. Current aircraft service data and reporting methods have not incorporated sufficient details to define the extent
92

apt to longer-term heat aging, as applicable, are properties that should be further enhanced in the future. 8. REFERENCES.
1. ATSRAC Intrusive Inspection Report, 1999.
2. Bruning, A.M. and Campbell, F.J., “Aging in Wire Insulation Under Multifactor Stress,” IEEE, Vol 28 No. 5, October 1993.
3. Elliot, David, “A StandTemperature Rating of Thin-W
ardized Procedure for Evaluating the Relative Thermal Life and all Airframe Wire Insulation,” IEEE, March 1972.
ics,” November 1972.
. RELATED DOCUMENTS
4. Nelson, W., Applied Life Data Analysis, John Wiley & Sons, 1982, pp. 146-149.
5. Nelson, W., “Theory and Applications of Hazard Plotting for Censored Failure Data, Technometr
6. Nelson, W., “IEEE Guide for the Statistical Analysis of Thermal Life Test Data,” Std 101-1972, pp. 24-26.
7. “Characterization of Aged Air Force Aircraft Wire in Harsh Environments,” United States Air Force Research Laboratory, January 6, 2003.
8. Shashoua, Y.R., “Effect of Indoor Climate on the Rate and Degradation Mechanism of Plasticized Poly (Vinyl Chloride),” Department of Conservation, December 13, 2002.
9. LaSalle, G., “Induced Environment for Naval Aircraft Wiring, Preliminary Report,” Naval Avionics Center, 1985.
9 .
ed Reliability and Life Testing,” Reliability and Life
s., Vol. 67, Pt. 1, 1948.
• SAE ARP 1931, Glossary of Terms
• Swiss Air 111 Accident Report
Kececioglu, D., “Applied Accelerat•Testing Handbook, Vol 2.
• Theory of Reaction Rates, Textbook of Physical Chemistry, Glasstone, 2nd ed., 1946.
• Dakin, T.W., “Electrical Insulation Deterioration Treated as a Chemical Rate Phenomenon,” AIEE Tran
• “Acceptable Methods, Techniques, and Practices. Aircraft Inspection and Repair,” Department of Transportation, FAA Advisory Circular, AC 43.13-1B.
• 14 CFR Part 25, Department of Transportation, Federal Aviation Administration.
93

• SAE AS4373, Test Methods for Insulated Electric Wire.
• MIL-W-81044, Military Specification, Wire, Electric, Crosslinked Polyalkene, lkene-Imide Polymer, or Polyarylene Insulated, Copper or Copper Alloy.
, Electric, Polyvinyl Chloride Insulated, Copper or Copper Alloy.
ment, Aerospace, General Specification For.
NAVAIR 01-1A-505, Technical Manual, Installation Practices, Aircraft Electric and
stallation Practices, Aircraft Electric and
Electrical Standard Practices.
Manual.
Report TR-2333, Testing of Selected Aircraft Electrical Wire Insulations, June 1983.
Aged Kapton-Insulated Wire, Test Report Number 95-83, 5 August 1983.
val Avionics Center Materials Test Report Number 27-83, 27 June 1983.
• The End-Use Effects of Heat Aging Various Electrical Interconnecting Wires, Naval
• Sizing New Generation Aircraft Wire and Circuit Breakers Utilizing Computer
• Long-Term Aging Characteristics of Conductors for Aircraft Wiring Cables, BICC
Crosslinked A
• MIL-W-5086, Military Specification, Wire
• MIL-HDBK-5400, Electronic Equip
• MIL-HDBK-454, General Guidelines for Electronic Equipment.
• MIL-W-5088L, Military Specification, Wiring, Aerospace Vehicle.
•Electronic Wiring.
• Air Force T.O. 1-1A-14, Technical Manual, InElectronic Wiring.
• Airbus Industries Manual 20-33-10,
• Boeing Standard D6-54446, 20-00-14, Wiring Practices
• Boeing Specification Support Standard BSS 7324F, Procedure for Testing Electrical Wire and Cable.
• Performance Comparison of M81381/9, M22759/33 and non-mil spec Wire and Cable, McDonnell Douglas Corp., Report No. B0482, 1987.
• Naval Avionics Center
• Cut-Through Resistance and Notch Propagation Testing of Naval Avionics Center Materials
• Correlation of Damage to Kapton Wire Insulation with Properties and Constituents of Four Aircraft Cleaners, Na
Avionics Center Presentation to SAE-AE8C1 on September 18, 1986.
Techniques, The Boeing Company, 1972.
Report ME/T.515, November 8, 1977.
94

• Analysis of Accelerated Life Test Data—Part I: The Arrhenius Model and Graphical Methods, General Electric Reprint 6996, December, 1971.
, General Electric Reprint 7081, March, 1972
ulating Materials, American Institute of Electrical Engineers S-61, June, 1954.
• Thermal Aging of MIL-W-22759/32-/35, /41-/46 Crosslinked, Modified Ethylene-eport TR-2468, January
•
, January 1,
Alternative Coating,
le Inspection: It is Scientific, Not Magic,” Materials Technologies
t, McDonnell Aircraft Corporation
Environmental Testing, Flight Dynamics Laboratory, Research
pment of New Techniques for Abrasion Testing Aircraft Wire Insulation,
stries, Inc. Report
stems for Aerospace Wire, Grumman Aircraft
• Analysis of Accelerated Life Test Data—Part II: Numerical Methods and Test Planning
• Thermal Evaluation of Ins
Tetrafluoroethylene Insulated Wire, Naval Air Warfare Center R13, 1992.
WIDAS Aging Test Plan, Lectromec electronic mail message, Proprietary, February 28, 2002.
• Proposed FAA Technical Standard Order on Aircraft Wire, Society of Automotive Engineers, Inc., February 16, 1970.
• “How to Select a Flexible Coaxial Cable,” Belden Electronic Wire and Cable1984.
• Silver and Tin-Plated Wire-Wrap Wire Deficiencies and anMaterials Performance, National Association of Corrosion Engineers, January 1, 1985.
• “Wiring and CabCorporation, June 21, 1995.
• Testing; Environmental, Aircraft Electronic EquipmenReport 8186, April 1, 1961.
• The Evolution of USAFand Technology Division, Air Force Systems Command, Wright-Patterson Air Force Base, October 1 1965.
• Working Voltage Classification of Insulated Wire, IIT Research Institute Report 1305, October 12, 1965.
• The DeveloNorth American Aviation, Inc., Report 1311, October 12, 1965.
• Abrasion Resistance Testing of Electric Wire Insulation, Haveg Indu1311, October 12, 1965.
• Evaluation of Light-Weight Insulation SyEngineering Corp., October 12, 1965.
95

• Hot Stamp Marking of Raychem Specification 44 Air Frame Wire, Raychem Corp. Report 776, May 13,1966.
• Dielectric Fault Detection Hitemp Wires Company, Division of Simplex Wire and Cable Co., October 1, 1966.
• Candle-Type Test for Flammability of Polymers, Modern Plastics Report 1306, November 1, 1966.
in and Status of the Arrhenius Equation,” University of Ulster, School of Physical Sciences, Logan, S.R., Vol. 59, No. 4, April 1982.
tion Aging: A Historical and Critical Review,” IEEE, Brancato, E.L., Vol. EI-13, No. 4, August 1978.
ctions From an Arrhenius Plot With Only One Data Point,” IEEE, Vol EI-15, No. 4, August 1980.
l, T., “Predicting Service Life of Plastics,” Plastics Technology, October 1962.
Wire Replacement Program, 727-200
Webb, Everette L., T-7410-20862, Polyimide (Kapton) Insulated Wire, Model 767-231
, Boeing, (Proprietary), Circa 1983.
86, Failure Analysis of Kapton Insulated Wire in Operational Use, Airforce, Slenski, George, December 13, 1982.
on Aircraft, Boeing,
• 7HP Military Aircraft Subcommittee, High Temperature Wire and Cable Section,
ise, J., “Extrapolation of Accelerated Aging Data—Arrhenius or Erroneous?” TRIP, Vol. 5, No. 8, Sandia National Lab., August 1997.
• Glycol Water Effects on Wiring, Manned Spacecraft Center, NASA, November 20, 1967.
• “The Orig
• “Insula
• Dixon, R.R., “Thermal Aging Predi
• Raphae
• Meeker, W.Q. and Hahn, G.J., “How to Plan an Accelerated Life Test—Some Practical Guidelines,” ASQC, Vol. 10, 1985.
• De Hart, J.W., Kapton 616 –2/3 Lap, Liquid H Topcoat, DuPont, February 5, 1971.
• Copes van Hasselt, F.W., R-7254-28771, PVAircraft, Boeing, August 30, 1977.
•Airplane, Boeing, September 11, 1981.
• Deterioration of the Insulative Properties of Kapton Insulated Wire and Cable Installed in Commercial Jet Transport Aircraft
• AFWAL/MLS 82-
• Owens, R.C., Haus, I.C., Elliot, D.K., and Jimenez, V.M., SYST-B-8711-L83-23, Kapton Insulated Wire and Cable Usage in Commercial Jet TransportatiSeptember 2, 1983.
NEMA, July 21-22, 1982.
• Gillen, K.T., Celnia, M., Clough, R.L., and W
96

• Determination of Degradation Limits of Aircraft Wire for the FAA, Lectromec (proprietary), March 4, 2001.
966.
Strength and Power Factor of Magnet Wire Measured at the Aging Temperature,” AIEE.
tability of High Temperature Magnet Wire Insulation, AIEE, Insulation, Magnet Wire.
oigan, P., “Calculation of Life Characteristics of Insulation,” AIEE.
l Index TI Results,” Naval Air Warfare Center, 1995.
• Gillen, K.T., Clough, R.L., and Quintana, C.A., “Polymer Degradation and Stability,
• Gillen, K.T. and Clough, R.L., “Applications of a Modulus Profiling Apparatus to ision
Polymer Aging Insights Available From Modulus Profiling Data,” Polymer Engineering and Science, 29, 1989, pp. 29-35.
, R.M., “Modulus Mapping of Rubbers Using
•
Chemistry, 24, 1983, pp. 145-146.
• Junker, V.J., AFFDL-TR-65-197, “The Evolution of USAF Environmental Testing,” WPAFB, January 14, 1
• Mathes, K.N., “Principles for Temperature Classification of Insulating Materials by Functional Test.”
• Saums, H.L. and Pendleton, W.W., “Effects of Accelerated Aging on the Dielectric
• Scheideler, A.L., Significant Measurements for Determining the S
• Whitman, L.C. and D
• Beach, R., “Thermogravimetric Analysis (TGA) of Cross-Linked ETFE Wire Insulation and Comparison With ASTM D3032 Therma
Modulus Profiling of Polymers,” 17, 1987, pp. 31-47.
Polymer Lifetime Predictions,” Polymer Preprints, American Chemical Society, Divof Polymer Chemistry, 29, 1988, pp. 110-111.
• Gillen, K.T. and Clough, R.L., “
• Gillen, K.T., Terrill, E.R., and WinterMicro- and Nano-Indentation Techniques,” Rubber Chemistry and Technology, 74, 2001, pp. 428-450.
Gillen, K.T., Celina, M., Clough, R.L., and Wise, J., “Extrapolation of Accelerated Aging Data—Arrhenius or Erroneous?” Trends in Polymer Science, Cambridge, United Kingdom, 5, 1997, pp. 250-257.
• Gillen, K.T. and Clough, R.L., “Density Profiling—A New Technique for Understanding Oxidation Effects in Polymers,” Polymer Preprints, American Chemical Society, Division of Polymer
97

• Gillen, K.T., Clough, R.L., and Dhooge, N.J., “Density Profiling of Polymers,” Polymer, 27, 1986, pp. 225-232.
• Bernstein, R., Derzon, D.K., and Gillen, K.T., “UV-VIS Studies of Nylon Degradation,” Polymer Preprints, American Chemical Society, Division of Polymer Chemistry, 44, 2003, pp. 1237-1238.
98

APPENDIX A—PROCEDURE
A.1 WIRING DESIGN. Electrical wire is chosen for a specific application as part of the design process. The Electrical Wiring Interconnect System (EWIS) is designed to take into account all the necessary parameters of the circuitry: current and voltage loading, environmental factors, etc. Wire must be capable of performing in the harshest environmental areas from one terminating end to the other, and a wire might traverse the whole aircraft. The weakest point along the way is usually either the point of most severe stressing or the point that is most susceptible to a perturbation to the aging process. In many cases, the actual conditions in the final aircraft may not be known. Much work is done to try to establish the environmental conditions inside the aircraft in the development phase; however, this will generally be after the wiring designs have been completed. During design, the wire is chosen for the worst stress area, and is often protected from outside damage from a perturbation if the location can be identified or the risk known. Unfortunately, this may not be known during the design phase, and changes may need to be made later. An example would be a harness that becomes a convenient handhold for maintenance personnel. Areas to consider when designing and installing wire are temperature, voltage, current, circuit breaker protection, and specific stressors such as heat ducts, tight bends, sharp edges, loose wire that vibrates/abrade. All of these are known stressors, but have not necessarily been quantified. A.1.1 INVESTIGATIVE REASONING. The Federal Aviation Administration (FAA) identified a number of well-defined areas in its disposition of comments published in the Intrusive Inspection Report, January 21, 2003, that provided recommendations to the Aging Transport Systems Rulemaking Advisory Committee Intrusive Inspection Report (IIR) conclusions. The recommendations provided significant insight into the state of understanding the aging of wire in aircraft. Several of these areas are investigated to provide additional data that can be used to further the aircraft industry knowledge base and promote the use of wire characteristics to improve the safety of aging aircraft. Several specific recommendations made by the FAA include: • “…visual indications be provided to more precisely characterize symptoms of wiring
degraded by heat or contaminants, such as high pH…” • “Manufacturer guidelines for cleaning and conditional inspection for contaminated,
overheated, or damaged wiring are to be included in the appropriate maintenance documentation.”
• “The use of non-destructive testing to troubleshoot suspect wire installations be
investigated.”
A-1

The following statement was indicated by the FAA and industry in the IIR:
“It was recommended that the use of general and detailed visual inspections of wiring installed in airplanes presently remains the preferred method of detecting actual or the potential for damage to wiring. This preference accounts for the present level of diagnostic equipment available to the industry, the needs of the industry, and the potential for undetected damage to result in failure. The manufacturers and FAA will continue to consider non-destructive test (NDT) methods other than visual inspections as a method of identifying actual or potential wiring faults. However, the use of NDT is insufficiently mature to apply on a scheduled basis at this time.”
1.1 “General and detailed inspections of wiring installation in airplanes are the normal methods of detecting actual or potential damage to wiring, because these types of inspections are presently more practicable than NDT.”
Many nondestructive test (NDT) methods may need to be baselined against wire using data such as that generated in this test program. The data are necessary to provide a better understanding of the limits of certain types of nondestructive testing, and an understanding of the properties of the wire that is to be monitored. To provide this data, an extensive test program was established. This work is occurring in parallel to specific research, development, and evaluation of various nondestructive inspection and NDT methods and diagnostic equipment. The proposed scenario would be that this data would be available to provide a foundation for the various methods as needed, allowing the NDT methods to better identify the condition of the wiring, wiring faults, or the potential for faults, such as cracks, and high-resistance interconnects. This test program concentrated on the wire portion of the EWIS, with primary emphasis on the dielectric materials of the wire, as well as looking at the conductor. Current accepted test methods do not account for many of the variables to which wire is subjected to in the aircraft. Although this or any other test program cannot be all encompassing, this test program evaluated a variety of commonly encountered stressors to quantify the effects on the wire. Risk assessment tools, such as those being developed by Lectromec, can potentially use the type of degradation data generated in this test program. A.2 CHARACTERIZATION OF THE PROBLEM. A.2.1 INDUSTRY WIRING PRACTICES. Wiring designers are expected to design the lightest EWIS possible within certain specific cost limitations. Circuits are designed with the smallest wire gauge possible. High-temperature wire is usually selected to allow more current in a specific gauge size wire. Thin, but tough insulations are selected to meet these goals. Because of this, designers incur risk to satisfy their design goals. The main design method used to achieve these goals is often the conscious effort to not select wires that have a poor track record in actual aircraft use. For instance, the military
A-2

makes an attempt to assist and control this situation by defining allowable wire types for use in aircraft or disallowing the use of whole families of wires based on performance in the fleet. Designers attempt to limit the number of different wire types in any one design. There are areas that require certain wire types, such as in extreme high temperature applications, but the amount of these wire types used in the aircraft is normally a low quantity. Therefore, the ideal design situation consists of one wire type for all nonspecial aircraft areas. This is why wire types with “general purpose” characteristics and no known catastrophic failure modes are selected. Over the last 30 years, wire types that have proven to be troublesome or even dangerous in their behavior and operation have been selected and installed in some aircraft models. The lessons learned are often implemented in newer designs to eliminate a wire type once problems have been identified with it, and often result in the development of regulations. In an application, several wire types may perform adequately, but a wire type with specific deficiencies should not be used. A.2.2 APPLICATIONS OF WIRE TO AEROSPACE APPLICATIONS. Wire is chosen by the original aircraft manufacturer (OAM) during design and installation, during maintenance, and during modifications. The OAM must ensure that the wire will meet the environmental conditions anticipated on the aircraft. They are required to define replacement wire for maintenance in the Instructions for Continued Airworthiness. The design development, installation, and general design philosophy may impact the performance of the EWIS and the wire in particular. Wire is chosen for an application based upon a number of factors, including the electrical needs of the circuit (current, voltage, signal loss allowable, etc.), the surrounding environmental conditions (temperature, moisture, contamination, etc.), the physical requirements for the application (vibration, flexing, abrasion, etc.), and other factors such as how long the wire should be able to perform its intended function, whether it will be part of inspections, and a little extra for unknown conditions. Various current requirements have come about from previously unknown stresses or properties that only become known when problems arise. Examples of this are resistance to arc tracking, and hydrolysis in very moist applications. Once chosen, the wire needs to be installed properly, with proper supports, spacing, protection from other systems, etc. Many aircraft manufacturers will use their own design and installation guidelines, or use standard industry guidelines, such as AS50881, which was based on the military document MIL-W-5088, ARP4404, or Advisory Circular 43-13. These documents provide guidance, based on years of industry experiences, for ensuring proper installation of wiring systems and for inspecting previously installed wiring to ensure continued proper state of being. These factors will directly affect the performance of the wire over time. One purpose of these documents is to minimize the effect that various stressors or known conditions have on the performance of wire in the aircraft. Modifications made to the EWIS may result in induced stressors that were not originally designed into the wiring system. An example would be the mixing of different wire types, which has subsequently been shown to not be a significant impact. Each stress on the wire in an
A-3

aircraft application may reduce the overall ability of the wire to perform as intended and may significantly reduce the time for which a wire can adequately perform its intended function. The maintenance actions themselves may impart stresses on the wire, and if this is performed inappropriately, the ability of the wire to perform adequately after being disturbed may again be negatively affected. A.2.3 HOW WIRE IS USED. Wire constructions generally fall into two distinct categories: extruded wire and tape-wrapped wire. Extruded insulations are applied by the melt extrusion process directly to the conductor, while tape-wrapped insulations are produced by tightly wrapping thin tapes on the conductor. Each type of finished product has advantages and disadvantages, and each type of processing can have its own pitfalls. The degradation of the wire is dependent on the types of materials used, the type of processing, and many other factors. For this project, a type of each was evaluated, and some of the advantages and disadvantages of each are discussed. Since wire can vary between manufacturers, and even from lot to lot due to manufacturing variability, all wire of a single type used in this test program was made by one manufacturer and is from a single lot of production. Qualification programs are designed to minimize the variation of wire performance under a specification and to ensure that the wire from a specific manufacturing plant will meet the minimum performance requirements defined by the specification. The qualification process may include thorough initial evaluations, periodic testing of the finished wire, and in-process quality conformance checks to be sure that the wire continues to meet the requirements of the specification. An example is a requirement to test the wire 100% to find spots that may not hold up to a certain voltage. This provides the designer with some assurance that the wire has been tested to some minimal threshold. A.3 TEST PROGRAM. This section describes the overall test program for the aircraft wiring degradation study. Section A.3.1 contains the overall testing approach and philosophy. Section A.3.2 discusses measures taken to assure the quality of the results generated by the test program. Section A.3.3 describes the test samples used. The detailed test plan is attached as appendix D. A.3.1 TEST APPROACH AND PHILOSOPHY. This study was designed to examine the aging characteristics of several specific wire types that are commonly used in the aircraft industry. The wire types examined were aircraft interconnect wires typically used between the power or signal source and the load in commercial transport aircraft. The study does not examine hook up wire, which is used internally to electronic equipment, or specialty wire, such as engine wire. The test protocol assumes the principal insulation degradation mechanism is oxidation, and the secondary degradation mechanism for certain wire types is hydrolysis. The oxidation degradation prediction test procedure for wire, as determined in ASTM D 3032, is well-known
A-4

and accepted in the aircraft industry. The stressors used to define the wire-aging curves have specific mechanical and electrical characteristics. By changing these stressors to be more reflective of aircraft wiring applications, it is anticipated to obtain a better predictive tool for wire aging in the aircraft. The levels of the aging stressors are important factors. The higher the level of stress on a material, the harder or faster the material is affected. In general, the levels of the various aging stressors were determined based on the actual levels experienced by the wire in the aircraft. The wire types being studied are typically designed to exceed 10,000 hours service life at rated temperature when stressed with specific mechanical and electrical factors. Therefore, in order to induce deterioration in wire within a shorter period of time, the stress levels needed to be increased to accelerate the aging process. The Dielectric Withstand Voltage (DWV) test was used to determine the failure criteria of the wire. This is a somewhat arbitrary definition; however, this is the commonly used laboratory definition of wire failure. In application, a wire failing the DWV test may still be able to safely carry electrical current; however, the safety risk may have increased substantially. The wire degradation test plan incorporated a subset of the major aging stressors. This plan also addresses the interactions of the stressors, because the presence of certain stress factors may increase the wire’s susceptibility to other stress factors. In other words, the presence of stress factor A may act as a catalyst causing stress factor B to age the wire a lot faster. A.3.2 QUALITY. An important facet of this test program was to ensure the highest quality of data so that the protocol could potentially be used to characterize the aging of other wire types. This was accomplished through the methodology used to select the test samples and the documentation developed to execute the testing. Wire specimens were selected from the same manufacturing lot to minimize variation. Wire of the same lot means that the wire was manufactured under the same conditions, with the same raw materials, and during the same period. A similar type of wire from another manufacturer or different lot may behave differently to some degree. To better understand the variation within a lot of wire, the wire was cut and divided into approximately 50-foot sections, with each section producing several types of specimens. Each specimen was given a unique serial number to aid in tracking throughout the test program. In the test where one could expect significant variation between different sections of the same wire, such as Indenter testing, tensile testing, and elongation testing, special care was taken to ensure that the exact same piece of wire was tested over many cycles of aging. Other property tests were expected to be more stable, and these results were compared to bulk properties of that wire type, using data generated over a number of unaged samples.
A-5

A.3.3 TEST SAMPLES. Wiring of the follow constructions was evaluated. All wire tested was 22 gauge. A.3.3.1 Insulation Types. Aromatic polyimide tape-wrapped insulated wire (PI) manufactured to BXS7007 was evaluated. This wire is manufactured to other nearly identical wire specifications, MIL-W-81381, BMS 13-52, Airbus, etc., which was commonly used in transport aircraft from the 1970s through the mid-1990s. The wire was a nickel-coated copper conductor wrapped with two layers of fluorinated ethylene propylene (FEP)-coated polyimide N film, followed by a thin extruded topcoat of liquid N film. The FEP provides adhesion between the layers of polyimide, which themselves cannot be easily fused together within temperature limits that would not damage the finished wire. PI with fluorocarbon bonding layers and polytetrafluoroethylene outer wrap composite (CP) was also evaluated. The wire was nickel-coated copper conductor wrapped with multiple layers of fluorocarbon-coated polyimide (initial MIL-W-22759/80-/92 construction, Boeing type BMS 13-60, TKT). Polyvinyl chloride/nylon (PV) insulated wire with an extruded polyamide outer jacket (MIL-W-5086/2, Boeing type BMS 13-13, Douglas type, PV) was also evaluated. This wire contains a tin-coated copper conductor. A.3.3.2 Conductor Types. There is considerable data showing acceptable aging characteristics for conductor materials; therefore, the conductor type will not be evaluated as part of this study. The conductor type is a variable that has little bearing on the aging of the wire, except from the standpoint of changing the flexibility characteristics. In some cases, the coating of the annealed copper conductor (tin, silver, or nickel) may interact with the insulation, which could affect the aging characteristics. Aluminum conductors or high-strength copper alloy conductors are used in much smaller volumes in commercial aircraft compared to annealed copper. Nickel exhibits the least oxidization in aging conditions and should minimize problems when stripping the insulation. Therefore, when available, the conductor type used for the test protocol was nickel-coated annealed copper. A.3.3.3 Specimen Description. Two primary types of specimens, with several subtypes of specimens, from each wire type described above, were subjected to the aging protocols. Each of the specimen types was necessary for one or more of the aging or property tests that were performed on the wire during or following the aging protocol. Life (L) specimens were 15 inches long and were used to determine the life of the wire under the specific aging stressors and conditions. Eleven L specimens were aged in each stressor and
A-6

environment aging setup. After each cycle of aging, the specimens were removed for stressing and DWV testing. These specimens were removed from the testing on an individual basis as soon as they failed DWV. Once all L specimens failed DWV, the testing of that aging setup was considered complete. In some cases, the group was determined to be complete if only a couple L specimens remained, but sufficient data had been collected. Better statistical data could be obtained by a higher number of failed L specimens. Property (P) specimens were needed to perform the various follow-on property tests whether they failed or not. These P specimens were 10 feet in length. P specimens, or sections thereof, were removed at prescribed times, whether or not they had failed. The P specimens were removed, labeled with a serial number and cycle (e.g., 1165-6 was specimen 1165 that was removed following the sixth cycle of aging) and bagged for follow-on testing. Three adjoining P specimens were included in each aging setup to provide sufficient samples for testing. DWV and wrap testing of these specimens was stopped when the conductor was clearly exposed. Electrical (E) specimens were a specific type of P specimen that was necessary in order to continue to test the exact same piece of wire over time. The E specimens were used to monitor the condition of the wire during aging with a variety of electrical tests until the point of DWV failure of the L specimens. The purpose was to see if the electrical monitoring tests could be used to identify when the performance of the wire had degraded to the point where it was likely to fail. Certain tests, such as insulation resistance, are length sensitive, and the longer the wire, the more accurate the test results were expected to be. The E specimens remained in the aging setup until aging ceased, or the specimen broke, in which case, the specimen would no longer be functional. As with the P specimens, DWV and wrap testing of the specimen was stopped when the conductor was clearly exposed. In some cases, an E specimen was used for final property testing if all P specimens had previously been removed. Terahertz specimens were another specific type of P specimen. These were removed part way through aging, once it became clear that the terahertz test would not be developed sufficiently for use in this test program. Virgin specimens were special L specimens that were not aged and would be available for follow-on testing. Control (Z) specimens were a specific type of L specimen of PI, and were placed into the setups of other wire types to allow for an additional independent cross check of aging conditions. This was done because multiple runs of a specific aging setup could not be performed in this test program due to the extensive nature of each setup. Z specimens were aged with the setup; however, they were not exposed to any of the dynamic stressors. Slugs of prestripped insulation strung on coated copper buss wire were included in the straight “A” aging conditions. Stripping problems were anticipated with wire from the heavily aged groups. Having these slugs available allowed insulation tensile and elongation testing to be performed when the wire specimens could no longer be stripped.
A-7

A.3.3.4 Specimen Preparation. Wire sections from each wire type were cut into multiple specimens in a specific order. The PI wire section was 56 feet long and from that, 137 sections were cut into 2184 specimens following the order LLLLLLLLLLLLPPPP, etc. CP and PV wire were cut into 80 sections and 76 sections, respectively, each being 58 feet long, following the order LLLLLLPPPPP. Note: it is expected that there would be specimen variation within a section, due to manufacturing variation, but it was not feasible to track specimens to that degree in this test program. The sections were marked sequentially on the ends within the final inch of the specimen using a hot-stamp machine. The specimens were marked as follows then assigned to each aging setup using a randomized scheme. • PI: Specimens 0001 through 2184 • CP: Specimens 3001 through 3879 • PV: Specimens 6001 through 6835 Hot-stamp marks are known to degrade thin electrical wire, especially when not applied properly; therefore, this marked portion of the specimen was not tested. After long-term aging at high-temperature conditions, the hot-stamp mark became unreadable. Additional marks were then etched into a standard nickel-coated copper ring terminal that was crimped onto the ends of the conductor, but not on the insulation. This terminal provided a location to physically handle and age the specimens, and also provided a specific location on the specimen to perform testing. After long-term aging at high temperatures, many of the conductors became brittle, leading to terminals breaking off the specimens. The wire specimen ends were restripped and crimped as needed.
A-8

APPENDIX B—DISCUSSION B.1 DISCUSSION. Where applicable, issues in the testing, changes from the original test plan, and a comparison of results to those from past test programs are provided. B.2 AGING STRESSORS DISCUSSION. B.2.1 THERMAL STRESS. The aging models for each wire type show that increased temperature generally increases the rate that each chemical mechanism degrades the insulation and conductor, whether the mechanism is thermal oxidation or hydrolysis. Based on the general chemical mechanisms occurring, temperature has an effect on most by increasing the rates. It was determined that the temperature to which polytetrafluoroethylene/polyimide composites (CP) and polyvinyl chloride/nylon (PV) wire is exposed is the primary factor that affects aging of those insulation types. B.2.2 MOISTURE. Water or moisture played the most significant role in the degradation of polymide (PI) wire, as evidenced by the resulting aging algorithm, Model 1. This effect was less for CP and PV wire, reference Model 2 and Model 3, respectively. PI is greatly affected by the moisture directly, but it also interacts with the dynamic stressor and temperature to compound the effects of hydrolysis and the resulting consequences of weakened insulation properties. DuPont [B-1] proposed the mechanism by which the PI is hydrolyzed, leading to the scission of imide chains, and the resulting decrease in average molecular length. The data generated in this test program has validated that the effect of moisture diminishes rapidly when the humidity is below a certain level and the extent of the degradation of PI due to hydrolysis [B-2]. One setup was tested at a cycled humidity (85% to 25% relative humidity (RH), 2 weeks at each humidity) and directly compared to setups aged at a constant humidity level. DuPont [B-1] presented data to show that as the PI dries out during use at elevated temperatures, the hydrolysis of the imide bonds will reverse to some degree. The data in this test program indicates that the cyclic humidity aging was equivalent to steady-state aging at 72.5% RH. This is about 15% less aging than the sample would receive at 85% RH and clearly shows that the reversal of the hydrolysis reaction does take place; however, it is only a small percentage of the driving force of the higher humidity. If the circuit were to operate at higher temperatures, the reverse reaction may occur more readily; however, the high-humidity condition may not exist any longer. The test data also shows a different mechanism in play with the CP and PV wires. Although the CP wire is manufactured using the same basic polyimide tapes as the PI wire, the construction is significantly different, using polytetrafluoroethylene (PTFE) materials for bonding the tapes rather than fluorinated ethylene propylene (FEP) material. This provides a wire with higher-temperature capabilities and decreased degradation over the same aging parameters as PI wire.
B-1

The overall effect of the moisture leads to algorithms that focus more on the high temperature and other stressors. The effect of humidity on PV wire was greater than originally expected. The resulting aging model incorporates a setup that failed much earlier than anticipated. Based upon the model, the moisture has a more equivalent effect than temperature. B.2.3 DYNAMIC BENDING STRESS. The aging model was shifted up or down based on the amount of energy that a dynamic mechanical stressor imparted on the system. In addition, the dynamic stress had interactions with other stressors. Certain combinations of stressors, for example, dynamic stress 2 and humidity, had interactions that greatly affected the rate of aging. The insulations were found to anneal after being aged. This resulted in a new baseline state for the wire from which stress was then measured. The annealed wire took on the resulting state, such as a coil, and would then be stressed from that point. Results from Wolf and Solomon [B-3] showed that annealed wire, when aged, would survive significantly longer than un-annealed wire, which became quite stressed when undergoing a dynamic bend. The dynamic stress also provided an initiating point for a potential failure on the wire. B.2.4 STATIC STRAIN. Increased strain from straight to 10 times to 6 times resulted in decreased time-to-failure of the specimens. The 1-time wrap specimens had a longer life than the 10 times and 6 times, but they were not subjected to any dynamic stressors, and the configuration of the Life specimens was such that they did not need to be bent when placed in the salt-water bath for Dielectric Withstand Voltage (DWV) testing. Testing in this program validated the results of DuPont report [B-1] that increased strain does not significantly affect aging properties, provided the samples have been annealed. B.2.5 ABRASION AND VIBRATION. Abrasion affects the surface of the wire and can eventually wear through the insulation; however, it does not cause the insulation to age, but rather, introduces the beginning of the potential failure mode. A decrease in the insulation diameter may actually reduce the stress on the surface of the wire farthest from the bend initiation point, where the insulation is in the most tension. This not only weakens the wire, resulting in the greater risk of failure due to cut-through or other mechanical damage, but also opens new surfaces of the insulation to chemical degradation mechanisms. With the levels tested in this program, no difference was noted between the samples that were abraded and not abraded. Increased stiffness of the wires as they age will lead to less ability of the wire to prevent abrasion damage.
B-2

B.2.6 THERMAL CYCLING. Subjecting the samples to thermal cycling actually increased the time-to-failure. The expansion and contraction of the insulation during the heating and cooling cycles prevents the insulation from annealing and becoming stiff. B.2.7 AIRCRAFT FLUIDS. The strain of the coiled samples did not play a large role in the effect of the fluids on the wire. The effect of the fluid seemed to override other strain that was present. Wires contained within bundles or against outer surfaces that either hold fluids by capillary action or absorption will have greater exposure to the deleterious effects of the fluids. This was especially noted in the increased failure rate of the coiled samples. This is an example of the synergistic effect of multiple stresses on a wire. With the program methodology, the effects of the selected fluids could not be differentiated. Further evaluation would be needed to assess the effects of each. Additional discussion of aircraft fluids is in appendix G. B.2.8 AIRFLOW (OXIDATION). The rate of oxidative aging is expected to increase as the availability of oxygen increases. A rate of 2-5 air exchanges per hour was used for this aging study, compared to 150 ±10 per hour for the ASTM baseline, thus a slower rate of aging was expected. However, comparison of data from experiments conducted at several different airflow rates revealed that only the PI wire showed a decrease in the aging life at the higher airflow rate. The aging life of the PV wire actually went up slightly as the airflow rate increased, but if the early failures in the low airflow experiment are disregarded due to possible handling issues, the airflow rate had very little effect on aging. The CP insulation also showed very little effect from the different airflow rates, possibly because the relative resistance of the PTFE outer insulation to oxidation. This testing suggests that PI wires that are internal to the bundle or in a more protected area will exhibit a decrease in the aging rate. (See appendix G.) The data generated from the PI samples were consistent with observations made in previous test programs where wire was found to age differently, depending on the type of environment and to what extent the wire was exposed to the environment. Separated bundles showed that the interior wire was generally in better condition than wire on the exterior of large bundles. An exception to this was when outer wires of a bundle hold in a fluid contaminant, causing the interior wires to be more exposed to the fluid [B-4]. B.2.9 ELECTRICAL STRESS. Electrical stress was not expected to cause significant differences with the aging of wire. Airframe wire, including the types evaluated in this program, is generally rated at 600 volts, although most airframe generators produce roughly 120 volts alternating current (AC) three-phase power, per MIL-STD-701. The maximum electrical potential across two phases is 240 volts AC, but the wiring circuit designer defines the power, and the circuit current is limited by the circuit breakers. Black boxes and other specific applications can have electrical potentials
B-3

much higher than this, but those applications are generally not considered part of the airframe wiring. An electrical potential can create field stress within the dielectric insulation, and voltages of approximately 1000 volts can create sufficient stress to initiate corona within the molecular structure of the polymer [B-5]. This is especially true in areas of tight bends and disturbances within the insulation, such as voids or separated insulation layers. Although the normal voltages of operation do not reach this level, manufacturing, assembly, and routine maintenance with quality assurance testing, such as high-frequency spark, insulation resistance (IR) or DWV, can often use high-voltage levels to check aircraft circuits. High-voltage field stress has been shown to cause degradation damage to wiring [B-6], but the middle voltages were questioned. This test program used 1500 volts AC and 500 volts direct current to perform DWV and IR dielectric integrity testing, respectively. To answer this question, two additional types of life (L) specimens (L+ and L++) were placed into several baseline conditions to quantify the effects of the electrical stress on the specimens that age through their normal cycles. The first set of specimens (L+) was aged with the L specimens, but the specimens were not subjected to electrical stress until half of the L specimens, which received electrical stress every cycle, had failed DWV. Electrical stress was then applied to these specimens every cycle from that point on, just as the L specimens. The second set of specimens (L++) aged with the L specimens was also exempt from the electrical stress until half the L specimens failed DWV. However, an electrical stress was then applied to the L++ specimens repeatedly until they had received the same number of electrical stresses as the L specimens. From this point forward, the L++ specimens received electrical stress along with the L and first set of L+ specimens until the aging was terminated. Differences in the average time-to-failure for the set of specimens would determine the difference imparted by the electrical stress itself. Test data from the L specimens indicated that multiple applications of high voltage up to 1500 volts did not significantly degrade the wire. There was not a significant difference in the time-to-failure between the two sets of L+ samples. In some setups, more L specimens failed than L+ specimens, and failures occurred at earlier aging cycles, but this was attributed to the additional dynamic stress that the specimens were subjected to when placed in the salt-water bath for DWV testing. By this same philosophy, it is expected that high concentrations of oxidizing sources will encourage oxidation of the polymer and metallic materials of the wire. Ozone (O3), nitrogen oxides (NOx), sulfur oxides (SOx), and elevated diatomic oxygen (O2) are chemical species that could be present in the aircraft environment, potentially contributing to increased oxidation levels. B.3 AGING RESULTS. The aging process proceeded with a few issues. The general process was to age the samples in the specified environmental conditions, then following the specific applicable test protocol, stress the samples, test the samples for performance, then take samples of the wire at intervals for follow-on testing of various property tests. With a 1500-volt AC voltage applied across the specimens in a salt-water solution, a 10-mA leakage current was defined as a failure. Although the DWV performed in a salt solution does
B-4

not predict when a specimen will catastrophically fail in service, it does indicate that the insulation has been compromised, and the potential for a significant event in service is greatly increased. Ionic contamination will increase the potential that the cracks will lead to DWV failures or shorts in the Electrical Wiring Interconnect System. Other test methods that do not use a liquid or gaseous ground plane that completely envelopes the sample often cannot make this determination, because the air gap distance across the insulation at a breach is often sufficient to prevent a short from occurring. This breach may never be seen with some of the currently used equipment, but may prove disastrous in service if vibration and movement allows the breach to align with another conductive surface, resulting in an arc or short. Dynamic bending or even static strain on the conductor caused failures of the conductor by breaking off just below the terminations. DWV proved to be an effective pass or fail criteria for the wire specimen. Further details of the aging process, documented through specific test types, are provided in section B.5. The aging setups provided detailed indications of the progression of aging. The accelerated aging does not mirror what is seen in actual service, but the progression, as shown in appendix G, is similar to what has been identified in previous testing [B-4 and B-7]. As evidenced by the data generated by the various aging setups, each of the stressors affects the aging of the wire in a specific manner. B.4 RELATED PROPERTY TESTING PROGRAMS. The development of the test program relied strongly on an exhaustive list of previous test data regarding the effects of various stressors. Previous test programs on degradation factors and specific stressors, including oxidative, hydrolytic, mechanical, and other chemical effects on wire, were used to develop test methods, aging mechanisms, and commonly used stressor limits for aircraft. Some of the more current programs that were reviewed are discussed here and in the subsequent sections. The Federal Aviation Administration (FAA) Mixed Wire test program [B-8] performed at Raytheon Technical Services Company showed that the mixing of different wire types had little impact on the abrasion of the wire; however, the clamping, presence of fluids, such as hydraulic fluid, or dirt and debris did have a significant impact on the resulting wear of the wire due to increased stresses. The results for CP and PV wire from this program correlated well with the Mixed Wire program, finding that fluid contamination has a significant impact on aging; however, these results showed that the life of PI wire was extended when exposed to the fluids used in this program. The Analog Interfaces (AI) Indenter report [B-9] showed some correlation between aging and the modulus values, as did the results from this test program. Original aircraft manufacturers (OAM), such as Airbus, The Boeing Company, and the military, have performed tests because the aging of electrical systems is such an important aspect of aircraft service.
B-5

Navy service data and follow-on tests showed the impact of moisture on PI insulating materials. Much more work has been done in this area by Lectromec and DuPont, as well as others (Airbus, Boeing, etc.). Data generated through these avenues has been instituted into newer specifications requiring the development of moisture-resistant materials for use in moisture-prone environments [B-10]. Industry has continually attempted to standardize the test methods used to characterize and quantify wire and its performance characteristics. Test methods have been developed over many years, yet new methods and new issues continue to develop out of necessity. When field problems arose, it became the challenge of industry to capture and quantify the issues with standardized test methods. This program used standard test methods whenever possible. B.5 PROPERTY TESTING RESULTS DISCUSSION. B.5.1 VISUAL INSPECTION. The samples were visually examined initially and after each aging cycle. Some workmanship issues were noticed on the wire, such as blisters, but these did not seem to lead to early failures. The results for rigidity and color were very subjective because of an insufficient level of guidance in the test procedure. Provided the same person documented these characteristics, the aging of wire can be followed, but standards for stiffness and color assessment would make the tracking more accurate. Each wire type changed uniquely, with specific characteristics that indicated degradation (e.g., discoloration, cracking, crazing, residue, etc.). These characteristics were similar to those observed on similar wire types during previous aircraft studies [B-4, B-7, B-11, and B-12]. Fine cracks in the outer layer of the PI wires did not immediately jeopardize the integrity of the insulation. Small cracks began to develop in the second layer of polyamide at the specimen ends, and then throughout the specimen, signaling impending electrical failures. The smaller L specimens tended to get darker faster. The ends could be cracking earlier due to maintenance actions, heavier oxidation at the ends (where oxygen uptake can occur inside and outside the specimen), or by increased thermal transfer. This helps explain why most failures occur near the terminations [B-13]. Samples aged in the straight position that were not dynamically flexed or wrapped tended not to develop cracks as quickly, and those that did form typically occurred during handling. Without the stress of a maintenance cycle or other flexing motion, some of these specimens would have no initiation of the failure for a significantly longer period of time. Humidity-aged L specimens exhibited a faster color change than heat-aged specimens, even though they aged at a lower temperature, indicating that the humidity may be affecting the color changing chromophores in the samples. The white residue observed on some samples may have resulted from the adhesive (used to bond the tape wrap layer together) seeping out at the seams. The color of the CP wire insulation did not change, except for a white residue observed on some samples. However, other signs of degradation were noted, such as wrinkling of the PI tape wraps under the PTFE layer. Shrinkage of the PI insulation during aging can lead to exposure of the conductor near the terminations.
B-6

Maintenance on aged PV wire is a major issue due to the brittle nature of the system; however, despite the brittleness, untouched and undisturbed samples will survive for a long time compared to those that are handled or experience a major shock or impact. The PV insulation developed darker areas on the insulation in some locations, as shown in figure B-1. These specific areas were noted to be more brittle than the remainder of the specimen. The reason for this uneven aging is not known. The specimens were kept away from the oven walls, but there are areas of the specimens that may see elevated heat, such as through the weights or hose clamps on the ends. This discoloration may have been from a nonpredictable single event that could have occurred during the aging process, or inconsistencies in the material may have resulted in accelerated oxidation.
Figure B-1. Localized Discoloration on PV Wire B.5.2 INSULATION DIELECTRIC WITHSTAND VOLTAGE, WET. The DWV test was conducted as planned, and no changes were required over the testing period. This test was used to define when failure occurred in a specimen. A 10-mA leakage current at 1500 volts was specified as the pass/fail threshold for the test, as shown in figure B-2. Values are usually fairly steady across cycles, but at times the values varied significantly. For example, the IR for specimen 1072 plummeted after cycle 8, yet the leakage current never decreased significantly. In general, the data indicate that the leakage current does not change much until the samples fail.
B-7

Figure B-2. CP (10-Times Static Wrapped) Test Specimens in Wet DWV Test
B.5.3 INSULATION RESISTANCE, WET. The test plan in appendix D specified to perform the wet IR test at room temperature, but review of the data shows that the laboratory room temperature varied throughout the aging program. All three wire types tested showed variability in the results. This variability may be partially explained by the temperature variation, which is expected to have an impact on IR results. A temperature correction of the data may be able to decrease some of the variability seen in the data. Values were evaluated using the logarithm of the data. B.5.4 CONDUCTOR RESISTANCE AND ELECTRICAL CONTINUITY. During the aging cycles, there were numerous incidents in which the lugs on the wire samples came off, and new lugs were crimped on the wire. In some cases, the new length may not have been recorded on the datasheet or could not be measured due to sample rigidity or configuration. While in other cases, the original recorded length may have been the sample length rather than the distance between the test leads. Since the sample length is part of the resistance equation, the results could be skewed by up to 0.2% if the appropriate length was not used in the calculation. The conductor resistance aging trends were different for humidity and oven-aged samples. High-temperature aging of copper wire has a tendency to decrease the conductor resistance at the beginning and middle cycles of aging testing, possibly due to annealing of the material. But when these wires are aged to failure, the conductor resistance increases from the original baseline measurements by 5% to 20% for the nickel-coated and 100% for the tin-coated conductors. The performance of an aircraft electrical circuit is related to the condition of the conductor and whether any shorts are affecting the current and voltage in the circuit. It is anticipated that aircraft equipment can continue to function with a partially oxidized conductor and with
B-8

damaged insulation; however, the risk of a conductor failure or a short occurring increases dramatically as the insulation is compromised and the conductor is oxidized and weakens. B.5.5 INSULATION RESISTANCE, DRY. The results of this test seemed to have similar issues as the other “surrounding foil” tests (see figure B-3). Consistency of the foil wrap was difficult to control. In the other tests, the foil was used as a shield, but in this test, it served as a contact surface. Since it cannot be confirmed that the foil was in continuous contact with the outer surface of a test wire, the validity of the data is uncertain. This is identical to the situation regarding the performance of this test in many commercial pieces of test equipment. Additionally, important environmental factors that would greatly influence the test results, such as humidity, were not controlled. Even if the environmental conditions were recorded and the results corrected, the physical aspects of the test setup have an overriding influence on the results. The nature of the classic wet IR test eliminates the influence of factors, such as humidity, by immersing the test sample in a water bath, therefore increasing the accuracy of the measurement.
Figure B-3. Foil-Wrapped Sample for Electrical Testing B.5.6 POLARIZATION INDEX. The polarization index is calculated as the ratio of the 10-minute IR reading over the 1-minute IR reading. It was observed during testing that the IR readings were very sensitive to the surrounding environment; therefore, the testing had to be performed in quiet conditions with little or no disturbances nearby. However, no significant problems were noted during the performance of this test. The data obtained appear to be consistent and reproducible. Samples from some aging conditions showed a slight increase over the first couple of aging cycles. This is opposite of what is expected since aging should decrease the IR of the wire, thus resulting in a higher leakage current. An increased leakage current would be manifested in a lower 10-minute resistance value, which would result in a lower polarization index. This initial increase could be an anomaly. Evaluated over a longer aging period, the value begins to drop, and may be
B-9

following the trend of a decreasing polarization index over time. Additional data must be examined to determine whether or not the results of this test can indicate if any significant trends are occurring. B.5.7 DIELECTRIC PHASE ANGLE. The inclusion of the dielectric phase angle (DPA) test in this program was an attempt to include the use an established test in a manner that it is not normally used, in this case, as a wire performance test. DPA is normally used as an acceptance test for such items as radio frequency circuitry on printed circuit boards. Therefore, it was reasoned that it could be used successfully as a wire performance test in this program. The DPA test was conducted using the folded foil as a ground plane for the test measurement. As with the other tests using the foil in this manner, the inconsistency of the foil geometry added to the uncontrolled lay of the test wires in the foil, which resulted in measurement inconsistencies. The data accumulated using the current test procedure may show some trend of the wire aging; however, the measurement variability, due to fixturing, leads to questions as to whether it will be possible to perform data analysis to observe any statistically relevant changes in the phase angle as a result of thermal aging. Measuring a small change in phase angle after a prescribed amount of oven time requires that the phase angle measured during the test be significantly more precise than the change in phase angle attributable to the thermal aging process. Variations in phase angle measurements can be due to how the individual wire specimens are placed into the ground plane. In an ideal situation, wire insulation from the two wires would be in contact with each other over the entire length of the ground plane. In independent trials, the variation in phase angle diminished significantly. Unfortunately, it is very difficult to keep the wires in contact with each other in this manner. For example, during aging and handling, wires naturally get kinked and bent. As aging continues, the ability of a wire to be pulled straight decreases significantly. A different approach, which may solve these problems in future testing, could be to use twisted pair cable as the test specimens for the phase angle testing. With pairs, a ground plane would not be required, as the two wires themselves would serve as the high and low conductors for the tester. The pairs would be positioned in free air, away from the influence of unintentional ground planes. In addition, the twisting would protect the test from common laboratory electromagnetic impulse, such as 60-Hz power coupling, which is apparent in the plot traces while the phase angle data are being collected. Since the pairs would be put through the aging process, there should be no problem with gaps between the wires during testing. (Any gaps that may develop would be attributable to the aging stresses.) B.5.8 TIME DOMAIN REFLECTOMETRY. Time domain reflectometry (TDR) is normally displayed as a graph of characteristic impedance versus distance. This allows for a line, such as a 50-ohm coax, to be evaluated for condition and
B-10

quality of installation over its entire length with only direct access to one end of the cable. Many anomalies, such as tight bends, crushed sections, or poor terminations, will show up on a TDR display as unaccounted for changes in characteristic impedance from, in this example, the desired 50-ohm reading. Because TDRs can check for cable conditions over a distance, there is much interest in applying the technique to other types of cables and wires used in aircraft. TDR has been useful to detect shorts and opens in regular wires and cables. In this test program, the intention was to attempt to correlate TDR measurements to the known degraded condition of various wire samples at specified points in the test program. Even though it is simple to hook up a TDR to a wire in a harness and collect a data trace, the nature of both the measuring technique and aircraft wiring bundles conspires to make such measurements difficult to evaluate and use. A wire in a normal bundle can change location in the cross section of the bundle along its entire length, and therefore, any characteristic impedance associated with the wire will vary along its length as its spatial relationship to other wires and the structure changes. As such, TDR data for single wires in bundles normally vary greatly over length and do not have constant characteristic impedance. Other wiring types, such as individually shielded cables (single wire, pairs, triples, etc.) and twisted constructions, can usually provide fairly stable TDR results, but even these types are influenced by shield grounding methods and bundle geometry. A single wire can exhibit a constant characteristic impedance only if its positional relationship to its effective ground plane does not change along its length. This test program was structured to use only single wire test samples. As such, a TDR test technique was needed to provide the samples with the required effective ground plane. As with measurements of coaxial cable, where deviations from the known characteristic impedance of the cable are interpreted as anomalies, it was beneficial to get the test samples to exhibit as constant impedance as possible to simplify data evaluation. The variables associated with the foil wrap technique used were such that consistency of the measurements and the repeatability of the data on any one sample at specified hold points in the test program were not good. The inherent rigidity of the foil allowed for the distance between the wire and the foil to vary along its length, affecting the characteristic impedance that the TDR would detect. Even though the wire was sandwiched between layers of foil, there was still insufficient control of the results that could eliminate variability and lack of sensitivity of the TDR effects of degradation. Other methods were evaluated for gathering this data, and the most promising included using a mandrel upon which the wires were wrapped as the ground plane. At the 2004 Aging Aircraft Conference in Palm Springs, CA, TDR experts stated that using “standard” TDR techniques to detect wiring insulation degradation, such as chafing and cracks, is not just difficult, but virtually impossible. This type of degradation is exactly what the TDR testing was intended to reveal. The results of this test program have shown that control of the ground plane is paramount importance to gathering useful TDR data. Without good control, the results are not reproducible and often not stable. Even if a method for controlling the ground
B-11

plane was devised, the question still remains as to whether the TDR can be sensitive enough to detect degradation. In assessing the test results, a new TDR procedure was developed to minimize ground plane effects. To eliminate the problem of providing single-wire test samples with a ground plane, existing samples were twisted together into pairs so that one wire could serve as the ground plane for the other. Standard twisted pairs, held away from any possible ground plane, provided consistent TDR traces because the characteristic impedance was reliant only on the geometry of the pair and the dielectric constant of the insulation. The sample pairs were compared to virgin pairs made from unstressed wires of the same type. A 10-foot-long wire pair was twisted around itself 40 times and destressed by heating with a heat gun along the entire length, which allowed the most consistent geometry between the two wires. This would not have been done if test sample pairs had been available and subjected to the stresses of the test program. Some aged samples broke during the twisting process and were used in their shortened forms. For test samples that were formed into pairs and tested away from any ground plane, the consistency of the measurements was striking, whether formed from aged or new wire. Even where the aged wires were not nesting tightly against one another due to remaining residual stress from the aging cycles, the traces were still consistent. As a check on the resultant traces, an additional measurement was made on the two PI pairs. With the aged pair on the test setup and attached to the TDR leads, the vertical scale adjustment was changed to exaggerate the vertical scale. This had the effect of making the aged PI trace appear very inconsistent. Without making any adjustments to the TDR, the aged pair was removed and the virgin pair was positioned and attached to the TDR leads. The expanded vertical trace of the new wires looked just as inconsistent as the aged pair at the same settings. This supported the notion that the TDR cannot easily discern from new and aged samples. B.5.9 INSULATION TENSILE AND ELONGATION. Adhesion between the conductor and insulation reduces the ability of the insulation to slide over the surface of the conductor and reduces elongation. This condition offers no protection from nicks or damage to the outer layer of insulation from propagating to the conductor. Heavy oxidation of the conductor decreases the strength of the conductor, increasing the possibility of the conductor breaking before the insulation can be stripped. Maintenance actions, repair operations, and normal operational stresses of flexing and vibration all require the wire to maintain some degree of flexibility, elongation, and tensile strength. In applications where there is no stress, the functionality of wire that exhibits very low tensile and elongation properties can still be good. All unaged wire specimens could be hand stripped, as required by the wire specifications, but some PV wire specimens were difficult. Aged specimens that could not be stripped were addressed in one of several ways. PV specimens were carefully slit down the side and the conductor pulled out, being careful not to nick the insulation at any point. PI and CP wires did
B-12

not have the same problem with stripping, and the insulation could often be removed well into the cycles of aging. PI did show some stripability problems as the aging progressed. Since these wire types were tape wrapped, the insulations could not be slit down the side, or the tapes would unravel. Slugs of insulation were stripped from property specimens in select setups, and strung on nickel-coated buss wire prior to aging. The buss wire allowed the specimens to be aged similarly to the normally aged specimens, although in the straight position only. These samples were aged alongside the regular property specimens in the nonstressed (1,1) condition in anticipation of stripability problems arising as the wire samples aged. Slug specimens were sampled periodically in the same way that the specimens designated for tensile and elongation testing were sampled. The CP wire stripped fine, even after significant aging, so most of the testing could be performed using the tensile method, as shown in figure B-4. The CP wire was difficult to test with the alternate method because the cracks generally would occur in the PI layers below the PTFE outer layer and could not be readily seen on the exterior, though the crack formation was heard during the test. The conductor used in the CP wire is nickel-coated copper, which does not oxidize like the tin-coated conductor does, and does not adhere to the insulation as well. In addition, the CP wire insulation has an inner layer of PTFE that minimizes adhesion.
Figure B-4. Test Setup for Insulation Tensile and Elongation Method When samples were too brittle or would not strip due to conductor-insulation adhesion, an alternate method was used to estimate the elongation of the insulation. This condition was especially prevalent in samples that had annealed in the coiled position. The alternate method used a conical mandrel, figure B-5, around which the specimens were bent while minimizing the mechanical working of the specimen. The elongation of the specimen was estimated from the bend diameter at the point of insulation rupture. Specimens that still had a significant amount of
B-13

elongation would not fail on the lowest mandrel diameter, which was equivalent to a self-wrap. This method is similar to the wrap test that is a part of the ASTM baseline. Wire must retain a certain amount of elongation to undergo a maintenance action where the wire may be flexed or bent. The ASTM method uses a 10-times mandrel for the wrap, which is approximately 50% elongation. If the material does not have the proper elongation, it will crack under this stress and fail the subsequent DWV test. For bent wires annealed in a curved formation, there are differences between the inside and outside of the specimen’s arc of curvature. For this test, the elongated surfaces were assumed to be a 50% ratio to the compressed surfaces.
Figure B-5. Conical Fixtures Used for Mandrel Insulation Tensile and Elongation Method
Brittle specimens of PV wire could not be tested. The insulation had lost so much elongation that the specimen could not even be cut with a razor. Aged wire could not be stripped after a few cycles. Some specimens were carefully slit down the edge of the wire, and the conductor was removed, allowing a test to be performed. Slitting the PV wire down the side was possible on the PV wire since it is an extruded insulation and not tape wrapped, however, the quality of the specimen was somewhat degraded because it was difficult to strip the specimen in a perfectly straight line along the axis of the conductor, especially with a stranded conductor underneath. Any nick in the line could lead to a crack initiation and premature tensile failure and lowered apparent elongation. This is also true in the wire itself where nicks in the insulation due to cracks from aging can be an initiation point for a tensile or elongation failure. The results from the slit samples were very similar to those obtained from slugs. Strong threads remained in the wire insulation specimen, which contribute to the tensile strength. Static-wrapped specimens were nearly impossible to slit. Heavily aged samples broke before the samples could even be straightened. The mandrel method for determining elongation was used often to obtain data. For the outer diameter, the side-to-side measurement was the only measurement that could be taken on the coiled specimens without causing the heavily aged specimens to break. During the
B-14

aging process, insulation flows somewhat, thinning the area around the bend. This thinner area becomes the weak point where initiation of the specimen failure would occur. Heat conducts through the wire to the interior of the insulation, but does not allow much air circulation. This may be a reason for the lower elongation values seen towards the ends of specimens relative to the center of the specimens. Additional insulation tensile and elongation results can be found in appendix G. Polyvinyl chloride (PVC) wire removed from United States Air Force KC-135 aircraft showed tensile and elongation differences between sections of wire that exhibited varying degrees of aging. Reference B-7 states that although the data were sparse, there appears to be trends in the tensile and elongation results, which revealed that certain areas of the PVC wire were more aged than others. For the PVC layer only, tensile strength increased from 3000 to 7000 psi with the more aged wire from the aircraft, but elongation decreased from 280% to 45%. There was no virgin wire evaluated to which to compare these numbers. The testing performed in this program supported the preliminary findings from reference B-7 that the tensile and elongation properties change with aging. Baseline specimens from this test program had a tensile strength of approximately 4000 psi. This value increased to a maximum of 5500 psi before decreasing to 3500 psi or below when the final life specimens failed the DWV test. The elongation of the baseline samples in this program was approximately 350%, and at the time of failure, had decreased to nearly 0%. B.5.10 CONDUCTOR TENSILE STRENGTH AND ELONGATION. The conductor tensile strength and elongation testing was performed on aging samples as a property test. This test was performed to determine if the aging process of the insulation affects the tensile strength and elongation of the soft or annealed copper conductors. The conductor tensile strength and elongation decreased slightly when aged from baseline to failure, but was not significant enough to affect the wire functionality. During the aging cycles, the conductor tended to break at the crimp joint, due to that being a high stress point. See appendix G for supporting data. B.5.11 INSULATION MODULUS OR HARDNESS, INDENTER TYPE. The Indenter modulus and relaxation values are only comparable to previous measurements made on the same sample since no standard ranges have been agreed upon for each wire type from different manufacturers and production lots. It is incumbent upon organizations using this equipment to establish testing criteria and limits that reflect known changes in wire insulation modulus and relaxation values and their relationships to determine acceptable or unacceptable wire insulation performance. Performing accurate Indenter tests requires that the wire always be precisely positioned and supported in the cable clamp assembly (CCA), figure B-6. This may be problematic for field-testing installations where the wires are tightly bundled with little available slack to allow a wire
B-15

to be extracted far enough from the bundle to properly clamp it into the CCA and not exert undue forces or stresses on the wire.
Figure B-6. Indenter Test
Specimens of PI, CP, and PV insulated wire were artificially aged and tested at predetermined intervals in their aging cycles to generate Indenter modulus and relaxation profiles. Testing of these aged specimens proceeded per the previously established test plan with the following exceptions: • Wire that was aged in the static-wrapped condition was difficult to position correctly in
the Indenter CCA for measurement. Because of the increasing brittleness of the wire with increasing aging cycles, the only method for performing Indenter testing was to make sure that the outer radius of the relaxed coiled specimen was placed against the supporting CCA V-block. This positioning ensured that the wire under test was securely clamped and would not deflect when contacted by the measurement probe. Any other orientation of these wires would not support the section of wire behind the probe contact area, causing the wire to deflect and yield inaccurate readings. Therefore, on these types of specimens, all readings were taken with the measurement probe contacting the inside radius of the wire’s relaxed curvature.
• Through the course of their aging cycles, specimens exhibited increasing brittleness and
cracks if overly straightened or flexed. In all cases, areas on the samples that were free of visible cracks were selected for Indenter measurements. As the aging process continued and the wires became increasingly brittle, placing the wire in the CCA clamping mechanism to hold a small segment of the wire straight caused cracking failures through both outer and inner insulation layers. This cracking prevented valid readings from being generated. Samples of PV, 1-time, 6-times, and 10-times static wrapped, all exhibited this effect.
From the limited data, relaxation values for CP wire appear to be showing a degree of linkage to the modulus values, but the relaxation values may better predict the condition of the wire. All L specimen failures occurred at or after the second knee in the relaxation curve, as opposed to the relatively flat decline of the modulus values before and after 1100 hours of aging.
B-16

Some concerns related to this test are that the humidity and temperature at which the wire is tested, or an uneven surface on a tape wrap insulation type, may affect the results. Straightening of a wire for testing could damage the insulation and affect the accuracy of the results, but if that is the case, a maintenance action poses a potential risk of causing a failure. The outside layer of polyamide (nylon) would be tested, even though it is only one layer of several. The PVC would also be expected to go through modulus changes over time and aging. To test the PVC, however, would require exposing some of the inner insulation. If the aging of the insulation system can be monitored with the outside layer only, then there is no problem. Sources of variation in the data were as follows: • Consistency of the wire insulation and its reaction to the aging process • Testing techniques • Curvature of the wire as it aged While the tests did show detectable changes in modulus and relaxation values over time, due to the limited analysis performed to date, no definitive conclusions can be reached. More consistent results would be expected on extruded insulation compared to tape wrapped since the overlapped layers of insulation caused odd results. See appendix G for additional Indenter results and discussion. There were several differences in the Indenter test from this program and the one performed by AI [B-9]. First, many of the wires in this test program were aged at higher temperatures. Second, wires from different manufacturers and production lots were tested. In addition, the aging in this program was continued until the L specimens failed, whereas it was stopped after 8 or 12 weeks in the AI program. The AI report [B-9] gave baseline Indenter modulus values of 870, 740, and 380 for PI, CP, and PV wire, respectively, compared to values of 500-800 for PI, 425-500 for CP, and 500-550 for PV wire in this program. For several of the PI setups in this program, the modulus did increase initially, but then started decreasing, which was not observed in the AI data. However, it is unknown whether the samples in the AI program would have decreased had the aging continued. The AI report [B-9] indicates that the correlation between Indenter results and aging can be moderate to very good for PVC wire, but inconclusive for PI wire and CP wire. While some changes in modulus and relaxation values were detected over time in this program, no definitive conclusions could be reached. The results did not consistently go up or down for PI wire. The CP wire showed some decrease in the values as aging progressed, and the PV wire showed some increase, but limited data were analyzed in both cases. The difficulty in testing tape-wrapped (PI and CP) wires may have contributed to the inconsistent results.
B-17

B.5.12 INSULATION MODULUS OR HARDNESS, CROSS-SECTIONAL TYPE. When looking at a cross section of an aged insulation material, higher modulus values would be expected on the surfaces compared to the middle of the material, as shown in figure B-7.
(a) (b)
Figure B-7. Examples of Ideal Modulus Profiling Studies The insulation modulus is closely related to the Shore A hardness (a value more familiar to the materials community), as shown in figure B-8.
Figure B-8. Modulus Versus Shore A Hardness
0 20 40 60 80 1P, %
001
10
100
1000
D-1
, MPa
18 days
14 days
7 days
4 days
0 days
125oC
BNMOD125
0 20 40 60 80 1P, %
001
10
100
1000
Mod
ulus
, MPa
176 days
127 days
84 days
36 days
0 days
BNMOD95
95oC
B-18

Prior to testing the aged samples, unaged materials of the same composition were used to establish the modulus profiling procedures and to obtain initial baseline values. It should be mentioned that ideally, the conductor is removed from a material of interest before modulus profiling because of the influence of the hard conductor on the modulus of the surrounding polymeric material. As a result of shrinkage of the insulation during aging, removal of the conductor while keeping the insulation intact became impossible. Therefore, data were collected from some aged samples with and without the conductor in the hope of gathering any useful information. Unstripped samples had cross-sectional measurements taken from the copper conductor (center of sample) out to an aluminum plate. Therefore, edge readings may be artificially elevated due to the influence of the copper conductor and aluminum plate on such thin samples. Stripped samples had similar measurements taken. Once again, readings may be artificially elevated due to the aluminum plates in such close proximity of each other because the samples were very thin. Modulus profiles were obtained for stripped unaged green CP, see figure B-9. Similar profiles were not generated for the aged CP material. Removal of the conductor from the aged sample, while keeping the insulation intact, was not possible. It was attempted to take modulus measurements with the conductor present; however, only artificial values were obtained. The thinness of the sample combined with the close proximity of the conductor and aluminum plates led to unbelievably high readings for this material.
Modulus Measurements: Unaged Green CP
1
10
100
1000
10000
0 10 20 30 40 50 60 70 80 90 100
Position, %
Mod
ulus
D-1
(MPa
)
Unaged Green CP Cross Section
Unaged Green CP Along Crease
Figure B-9. Modulus Profile for Unaged Green CP Modulus profiles were obtained for stripped unaged PV and PI materials. In contrast to the CP wire, some of the aged PV and PI samples could be separated from the conductor. Although profiles were generated for these samples (see figures B-10, B-11, and B-12), examination of the data suggests that modulus profiling is not a technique that provides valuable information for these wire types. There is not a clear trend or dramatic difference between unaged samples and heavily aged samples.
B-19

Based on these results and additional information provided in appendix G, further research of this type, on these samples, is not recommended.
Modulus Measurements: Unaged White PVC vs. 2PV130B TP-212-6776-6 (PVC)
1
10
100
1000
10000
0 10 20 30 40 50 60 70 80 90 10
Position, %
Mod
ulus
D-1
(MPa
)
0
Unaged White PVC Cross SectionUnaged White PVC Along CreaseUnaged White PVC Along Crease 2nd2PV130B TP 212-6776-6 Stripped2PV130B TP 212-6776-6 Unstripped
Figure B-10. A PV Modulus Profile for Unaged Wire and PV Wire (Sample 1)
Modulus Measurements: Unaged White PVC vs. TP-212-6435-0 2PV135A (PVC)
1
10
100
1000
10000
100000
0 10 20 30 40 50 60 70 80 90 100
Position, %
Mod
ulus
D-1
(MPa
)
Unaged White PVC Cross SectionUnaged White PVC Along CreaseUnaged White PVC Along Crease 2ndTP-212-6435-0 2PV135A StrippedTP-212-6435-0 2PV135A Unstripped
Figure B-11. A PV Modulus Profile for Unaged Wire and PV Wire (Sample 2)
B-20

Modulus Measurements: Unaged White PVC vs. 2PV135A TP-212 PI6435 (PVC)
1
10
100
1000
10000
100000
0 10 20 30 40 50 60 70 80 90 100
Position, %
Mod
ulus
D-1
(MPa
)
Unaged White PVC Cross SectionUnaged White PVC Along CreaseUnaged White PVC Along Crease 2nd2PV135A TP-212 PI6435 Stripped2PV135A TP-212 PI6435 Unstripped
Figure B-12. A PV Modulus Profile for Unaged Wire and PV Wire (Sample 3) B.5.13 INHERENT VISCOSITY. Analyses of the PI specimens were performed on the inner tape only for two reasons. (1) The inner tape of the wire tested was twice as thick as the outer tape. This gave more material for the analysis. (2) Often, the topcoat adhered strongly to part of the outer tape. This further reduced the amount of material available for analysis. Also, if some of the topcoat inadvertently remained and was dissolved, the results would not be valid. There were problems with the inherent viscosity determinations from the PI control specimens from the AWD-WA-1PV120A test protocol. The outer layer of PI tape adhered to itself very strongly. When the outer layer was finally removed, the inner layer of tape was removed in a similar fashion as the other specimens. The inherent viscosity dissolution (inner tape) for specimen Z3-1827-4 proceeded in a typical manner. However, there was still some undissolved PI after several hours in the sulfuric acid. When trying to filter the solution, the flow of fluid almost stopped, thus, not enough solution was available for a viscosity determination. When the filtered part of the solution was recombined with the unfiltered portion, there appeared to be two phases. The sample preparation for the Z3-1827-4 specimen was more difficult than the Z4-1828-8 sample. With concentrated sulfuric acid, it is desirable to obtain dissolution within a certain amount of time (6-8 hours) for more valid results. If there is a lot of material remaining after the dissolution time, then any remaining material will reduce the comfort level of the result. For the PI specimens heated to 250ºC and above, there is a very good chance that the PI has degraded to something far different than at lower temperatures. This was observed while trying to dissolve the resultant material in concentrated sulfuric acid. At lower temperatures, it appears that there was just simple chain breaking in the polymer. There are two possible reasons that the higher temperature aged material did not dissolve. First, even though the color of the PI did not
B-21

change with heating, it may have undergone some sort of change that made it almost impossible to dissolve. The second possibility is that the PTFE that covers the tape started to interact with the PI, resulting in a layer of fluorocarbon on the PI that was inert to sulfuric acid. Since there was very little dissolution in the PI specimens at high temperature, a limited number of experiments were performed to try to dissolve the PI in the CP wires that had been aged at a high temperature. Samples subjected to 4 and 11 aging cycles at 300ºC, figure B-13, showed little discoloration in either solution after more than 8 hours of stirring in concentrated sulfuric acid, especially compared to the PI from the PI sets of wire aged at 280º or 300ºC. With the material that had been heated to 95ºC, there was reasonably fast dissolution. Therefore, stirring was stopped on the 300ºC specimens, since it appeared that there would be little dissolved PI from these specimens, and any inherent viscosity measurement would not be useful. While the PI was somewhat brittle, it appeared to be somewhat close in appearance to the starting material.
Figure B-13. Very Little Discoloration of CP Wire Although the samples aged at 95°C typically showed nice trends, the PI control specimens aged with the PV groups had mixed results. There are some possible explanations for the results from the PI control specimens that were aged with the PV specimens. The conditions of the environmental exposure were such that a large change in the wires occurred. However, the determinations for PI samples aged at 135ºC for seven cycles and at 110ºC for seven cycles were very typical of all determinations made within a month’s time. Unless there was an extreme difference in the environmental exposure conditions between these various experiments, it is hard to suggest that this is the cause of the differences observed. Another possibility is that there is something very unusual locally with these two specimens in their material or manufacture, although the identification numbers indicate the samples were next to each other in the cutting sequence. Since the Z4-1828-8 sample was somewhat easier to prepare than the Z3-1827-4 sample, this explanation seems a little more reasonable, especially since this wire had a longer exposure time. A third possibility could be that some reaction occurred because it was aged with PVC wire.
B-22

The PI wire inherent viscosity results from the humidity-aged setups in this program correlated well to the results from the Aging Transport Systems Rulemaking Advisory Committee (ATSRAC) Intrusive Inspection Report. The inherent viscosity of the baseline specimens in this program was approximately 1.6 dl/gm. The ATSRAC Intrusive Inspection Report stated that the inherent viscosity for a new construction PI material is typically in the range of 1.0-1.65 dl/gm. The inherent viscosity of samples in this program at the time of failure was 0.8-0.9 dl/gm. The samples from the ATSRAC Intrusive Inspection Report measured in the range of 0.61-1.24 dl/gm, depending on the location in the aircraft, with the sample at 0.77 dl/gm having failed the wet DWV test, but the others passing. Further research may be necessary to determine whether a material with a lower starting inherent viscosity would also have a lower value at the time of failure. The conductor for both PI and CP wires was nickel-coated copper. It is believed that the cross-linking of the PI at higher temperatures may account for some of the impediment to the solubility of the polyimide films, and the heat-induced effects may play a part in the solubility regardless of the matrix it is in (between FEP or fluorocarbon polymer/PTFE). Also, the PI specimens have polyimide that changed form after exposure to high temperature. The polyimide may be further changed, forming a hard, strongly adhered material that is more brittle. This test can be used to assess aging if the CP or PI wire is not exposed to high-temperature aging. In almost all instances there was a decrease of ηinh compared to the new polyimide, as the various environmental exposure times increased, due to the breaking of some bonds in the polymer under various environmental stresses. In addition, ηinh decreased as the exposure time increased under a given set of conditions. In the instances where this trend was not found, the variations were within the experimental error. B.5.14 INSULATION CUT-THROUGH. Many variables will affect the results, including insulation thickness and variability of the thickness, humidity, temperature, whether the wire is single or multistranded, and the sharp edge used. The cut-through value can be related to the modulus of the material. The test assumes the resistance to cut-through is proportional to the insulation hardness. B.5.15 DYNAMIC. CP wire had lower cut-through values than PI wire, including in the baseline testing, but this may be due to a thinner layer of insulation. The trends seen in the test program indicate that this test could be used in a laboratory environment as an effective tool to determine degradation of wire. Determining the effects of humidity and temperature on the results may possibly help to correlate the data better. The dynamic cut-through results for the 22 American Wire Gauge PI wire from this program did not correlate as well with those from the ATSRAC Intrusive Inspection Report for the same size PI wire. The average cut-through force on the baseline specimens was approximately 74 lb, which decreased to 40-50 lb and 15 lb for oven- and humidity-aged setups, respectively, at the time of failure. The values from the ATSRAC Intrusive Inspection Report were >80 lb, but the
B-23

physical measurements of the blade size used were not documented. If the physical measurements of the blade size was larger, that may account for the difference. B.5.16 STATIC. The static cut-through typically has a narrow weight range (1 to 2 lb) for a given wire type, to provide a good distribution of time readings. Despite this, there was a large variation in the cut-through times in this test program. For example, the average cut-through times on new CP wires using 22-, 23-, and 24-lb loads were 115 seconds (range 0 to 300 seconds), 86 seconds (range 0.1 to 300 seconds), and 5 seconds (range 0 to 25.3 seconds), respectively, with one set of data. Standard deviations with these data are meaningless. Cut-through weights for bulk PV and PI wires were higher than CP wire, but there was also a large variation at a given weight for these insulation materials. Except for a few tests, the results on the aged PI wire specimens were very similar, with the blade cutting through the wire within 1 second. If a short occurred prior to the full load being applied, the time was recorded as 0 second. Identifying an appropriate load that will not cause shorts too quickly is critical, otherwise differentiating between good and aged wire is difficult. With the PV wires, the specimens from the end of the environmental exposure often cut-through immediately, i.e., within a second. However, there were some exceptions. Those that were in the middle of the environmental life cycle, roughly, had the same cut-through times as the starting wires. Some of the variability in the results may be due to where the cutting occurs. Since the wires are multistranded, there may be differences at the exact point where the blade strikes with respect to the individual strands and how the load is distributed. Another factor with the PI insulation is the wrapping may result in a different number of insulation layers being tested, depending on the location along the wire. This latter factor is not a concern with the PV wire, since the insulation is extruded. Although some variation in the results can be attributed to different operators, the standard deviations at a given load indicates that a wide variation can be seen from the same operator, even on virgin wire. The results were not consistent, so this test, as it was performed, would not be an effective tool in assessing wire degradation. B.5.17 INSULATION MASS LOSS/KINETICS BY THERMOGRAVIMETRIC ANALYSIS. This test allows the activation energy of the degradation reaction to be calculated at some temperature. The goal of using this test was to determine if there was any way to (1) predict the service life of a wire quickly, (2) determine if the age of a sample could be determined based upon a change in activation energy, and (3) determine if calculating the activation energy at certain weight losses give the activation energy for the reaction taking place at that point.
B-24

PI insulation exhibited problems with the thermogravimetric analysis test, using the equipment in figure B-14, due to problems with the samples jumping off the scale during the test run. This was due to internal energy released when the FEP glue gives way. Data were only collected through 20% weight loss with any kind of certainty. This problem was not experienced with either the CP or PV wires.
Figure B-14. Thermogravimetric Analysis Test Equipment PV insulation provided much better, more reproducible test runs. The 100% RH-aged sample appeared much different than the heat-aged samples. The polyamide (nylon) could be separated much easier from the PVC. The sample was hydrolyzed during the humidity aging, greatly weakening the material, and not allowing the polyamide to bond to the PVC, as it did in the heat-aged samples. The PVC and polyamide materials, especially after a long period of heat aging, could not be easily separated. The bonding of these two materials created problems with crack propagation. Since the material layers are no longer distinct layers, damage will tend to go through to the conductor more easily. In actual use at lower temperatures, the polyamide does not bond quite as strongly; however, this phenomenon has been seen in older PVC-insulated wires pulled from aircraft [B-4]. A wire from the ATSRAC Intrusive Inspection Report Boeing DC-9 that had burned from light exhibited this phenomenon, but would be considered a perturbation. B.5.18 WEIGHT LOSS. The weight was measured to the nearest 0.1 mg with an analytical balance. The test procedure required or stated that the length only needed to be recorded initially, but the length changed when lugs were periodically replaced. In addition, a small amount of conductor and insulation was lost each time a lug was replaced or an old conductor broke when the insulation was stripped. To address this issue, new and aged lugs were weighed to look at averages weights with standard deviation, and the amount of conductor that broke off in the lug was also assessed. It was determined that weight loss from the lugs was negligible. Therefore, for analysis
B-25

purposes, the measured weights were adjusted by subtracting the weight of the lugs and any amount of conductor and insulation loss, leaving only the weight of the wire specimen. When there was a significant weight change without documentation of a lug replacement, the data for the sample were not analyzed from that point forward. Weight loss trends were noticed in those cases where lugs were not replaced, or the weight was appropriately adjusted. Weight loss occurred from the insulation material flaking off, oxidation, and volatilization or off-gassing of the insulation material. The conductor may also have undergone oxidation that results in a weight loss. The nickel-coated conductor did not appear to be heavily oxidized, but if it does reach this state, it is not useable in the aircraft because no maintenance actions can be performed on the wire. Since the wire sample weight loss is small compared to the weight of lug loss, the weight measurements are affected significantly. During maintenance, repair and rewiring, or modifications, wires are typically cut/stripped and may be recrimped. Therefore, using weight loss itself may be difficult to manage in a service environment. In addition, there may be variability of weight between production lots of material and manufacturers, and the conductor forms a significant portion of the weight measured. Contamination, conductor breakage, and insulation abrasion are other examples of factors that will greatly affect weight readings beyond the levels of change due to aging. This decreases the sensitivity of the weight loss of the insulation itself. Recording the sample lengths would have helped determine when lugs were replaced if it was not recorded in the procedure manual. This would have helped to better define when weight loss occurred. B.5.19 DENSITY. As materials age, changes in density may occur from either the physical loss of material, or more likely, from chemical changes associated with aging. Two common examples of this are (1) the polymer can cross-link and shrink, leading to a volume change and (2) the polymer can chemically react with oxygen (oxidation), increasing the mass of the polymer. For these reasons, density changes have been a valuable metric to gauge aging of certain materials [B-9 and B-10]. Examination of one of the degradation pathways possibly involved in the aging of PVC is based on the loss of hydrogen chloride. Elimination of the heavy chloride ion would change the mass significantly as the polymer ages. Based on the chemistry of the other polymers received, studies of density changes were attempted only with this material. Since density changes can be relatively small in polymers, the conductor must be removed to eliminate such a huge unchanging mass. Data from unaged material were obtained because the conductor could be easily stripped from the samples (figure B-15) while conserving at least 50 mg of intact insulation. The average density of the unaged PVC was 1.31 g/ml.
B-26

(a) (b) (c)
Figure B-15. Unaged PV Efforts were taken to remove the nylon outer coating and conductor from the aged samples (figure B-16). Unfortunately, this was impossible due to the way the samples were aged. Because the wires were aged with the nylon coating and conductor intact, and nylon and PVC shrink with aging, the nylon, PVC, and conductor became inseparable components. As a result of the significant mass of the conductor, differences in density between unaged and aged PVC could not be detected. Consequently, the density technique was no longer a viable option to monitor aging of this material.
Figure B-16. Heavily Aged PV
Possible solutions would include aging the PVC without the conductor, and dissolving away the nylon outer coating (vide infra).
B-27

B.5.20 WIRE INSULATION DETERIORATION ANALYSIS SYSTEM. Originally, three test setups that had not been aged to complete failure were to be subjected to the Wire Insulation Deterioration Analysis System (WIDAS) test. All specimens initially passed a pretest using a MEGGER®. However, while wrapping the specimens on the 0.5-inch mandrels for the test, deep cracks formed, revealing the conductor in two of the setups. Then, the specimens failed the MEGGER test. Therefore, WIDAS tests could only proceed on one setup. Since this is an aging condition, data to assess the current state of wire degradation would not be obtained quickly, so this would not be an effective test in the field/fleet. B.5.21 FOURIER TRANSFORM INFRARED SPECTROSCOPY. Fourier transform infrared (FTIR) spectroscopy provides a sensitive means of examining the functional bonds of molecules. Changes in the molecules can be monitored based on the changes in the functional bonds. Samples were prepared by cross-sectioning the insulation with a microtome, and potting this in an epoxy medium. The surface of the cross-sectioned area was polished for improved viewing. A 64- by 64-pixel area was scanned by the infrared equipment. Each pixel was 10 microns square in area, resulting in a scanned area of approximately 25 by 25 mil. The thickness of aerospace wire insulation is in the order of 6 to 20 mil. The full cross section could then scan across the full thickness of the insulation. The scan of the surface provided 4096 spectra for the area. From these, the different individual layers or materials could be identified. A good spectrum from the target material was chosen, and a SCORES plot would provide an indication of how well all the other scans compared to that spectrum. An error plot shows what is left after everything is identified. Infrared spectroscopy allows the quantitative determination of chemical species. Unfortunately, several impediments existed, including the thickness of the samples could not be controlled sufficiently. Peaks can be normalized to account for sample variation, but this was not done. With PI, the IR could see the tape of the construction, along with the FEP used between the tape layers. After aging, the FEP peaks began to disappear. This followed what was seen visually with the FEP adhesive exuding to the surface of the wire insulation. After oven aging, the PI showed changes in the material, including a broadening of the -NH2 and -NH3 bands (3400-3600 cm-1 and 2000-2700 cm-1) and an increase in the C=O band (1700 cm-1). The outer layer exhibited greater differences than the inner layers after aging. Some changes were also identified in the fingerprint region (1100-1300 cm-1). The liquid hydrogen coating looked quite similar to the PI tape before aging, but could be distinguished after aging. Unfortunately, FTIR spectra showed no good correlation between the bond changes and partial aging. During hydrolysis, the PI molecule breaks to form smaller chains with modified molecular ends. These ends take up an -OH species that should be apparent in the IR spectra. Unfortunately, little -OH could be identified. The presence of water absorbed into the molecule may be masking this as well. With humidity-aged samples, the inside layers of PI exhibited the most degradation.
B-28

Heavily aged samples could be evaluated and differences seen more easily than with the partially aged samples. More research would have to be done to better identify and quantitate the formation of degradation by-products in the PI material. The ability of the IR to monitor the degradation of the PI is based on the theoretical sensitivity of the IR to changes in the PI material. The affect of chain scission on the properties of the PI, whether due to oxidation or hydrolysis, is dramatic with the alteration of only a few bonds. An example to show this can be seen with the following. A repeating unit of the -imide molecule has a molecular weight of approximately 336. The polymer would generally have a bell curve distribution of various molecular lengths. Assuming an average molecular weight of 100,000 (300 units), a change in one bond of the polymer could theoretically decrease the molecular weight by one-half to 50,000, causing a major decrease in the polymer properties. The IR can identify some chemical bonds at very low levels, but there are many variables that would have to be overcome to allow the IR to be able to effectively quantitate the levels necessary in order to monitor the aging process from a chemical standpoint. Much work would have to be done to gain good control over the test method, sampling, material, analysis, etc. Similar results were obtained with the CP wire as the PI wire. B.5.22 ULTRAVIOLET-VISIBLE SPECTROSCOPY. The degree of cross-linking defines how well the material goes into solution. Unaged PV wire samples were easily separated from the nylon outer jacket, then stripped off the metal conductor. Baseline ultraviolet-visible (UV-Vis) spectroscopy spectra were easily generated after dissolving the PVC in tetrahydrofuran (THF). Unstabilized THF was used to allow full spectral analysis without interference attributed to additives normally placed in the solvent. An H2O3 solution was used to calibrate the instrument for wavelength accuracy. The condition of the aged PV samples lead to disappointing results. The PVC could not be physically separated from the conductor or the nylon outer jacket, imposing the same problem seen for the density studies. Due to previous experience in another program where degradation of nylon was studied using UV-Vis spectroscopy, it was known that nylon could be dissolved using hexafluoroisopropanol (HFIP) [B-14]. As expected, the nylon readily dissolved in the HFIP, whereas the PVC did not. This provided a methodology to separate the two materials. In the case of UV-Vis studies, the sample size required was minuscule compared to the density studies. Therefore, after some effort, very small pieces of the PVC could be physically separated from the metal conductor. Despite the ability to isolate PVC, it was observed that in most cases, the aged samples were too heavily cross-linked to dissolve in THF (figure B-17). Even after extensive sonication, the only two samples that dissolved were the unaged sample and 2PV130B GP57 6776-4. Although the samples were clearly darkened, which would have shown a dramatic difference in the UV-Vis spectra, the lack of solubility eliminates this procedure. Interestingly, the degree of cross-linking between the samples was visually noticeable due to the differential swelling of the samples.
B-29

From left to right: Virgin, Gr59 set 28 6PV130A PI 6600-4, Gr59 set 28 6PV130A PI 6600-7, Gr53 S9 2PV110A PI-6534-6 (Final), Gr57 6778-9 2PV130B, 2PV130B Gr57 6778-8, 2PV130B Gr57 6776-4, 2PV135A RevA 6435-4 1/6/04
Figure B-17. Pieces of PVC in THF
Upon examination of the data, it appears that the chromophore is part of the polymer matrix, which is not a small molecule. Had the chromophore been a small molecule/low molecular weight fragment, some would have migrated to the THF (assuming that it is soluble in THF) after extensive sonication. A series of different solvents (DMSO, DMF, etc.) could be tried in an attempt to improve the extraction. The data suggest that the chromophore has cross-linked to the point where it is completely insoluble. Ironically, this increased cross-linking and subsequent color change, which could be caused by the heavy loss of chloride ion, made density studies an attractive technique. Colorimetric techniques could be probed to obtain the color change of the PVC as a function of aging in the solid state. B.5.23 FLAMMABILITY. The 60° flammability test is a requirement to be met before wire can be placed in new aircraft. Limited data were available to suggest how the flammability characteristics of an insulated wire may change as the wire ages. The 60° flammability tests were performed on bulk samples and on aged samples that had reached their final aging cycles. The PV wire samples tested for flammability burned longer and further than the PI and CP samples, but the results for aged samples of each wire type were similar to those of the baseline specimens. Any flame-retardants that may be present in the wires did not become less effective when the wires were aged. The FEP in the PI wire and the PTFE in the CP wire, which are used to bond the PI tapes, are materials that may be intrinsically flame-retardant. Volatile materials, such as phthalate plasticizers, are expelled early during the aging process, decreasing the potential for flammability. The flammability results in this program (see appendix G) were consistent with previous findings [B-15]. No testing was performed on fluid-soaked wires; however, the FAA maintenance report documented that even the presence of hydraulic fluid and particulates did not increase the flammability characteristics of the wire tested. Different fluids may have other results, but many of the fluids on the aircraft are intentionally flame-resistant. Flammable solvents may be present
B-30

at times, but often will have dissipated prior to the aircraft being placed back into service. Fuels, which may be present during service, are combustible, are expected to have different results until the point that they have evaporated. Flammability of wire in cable configurations will be much different than in single-end wire applications [B-16]. B.6 CORRELATION TO PREVIOUS PROGRAMS AND AIRCRAFT. B.6.1 RELATED AGING MODELS STUDIES. The data generated from PI samples were consistent with observations made in previous test programs and studies performed by the Naval Research Laboratory, Lectromec Inc., and others [B-2, B-14, B-17, and B-18]. The wire was found to age differently, depending on the type of environment and to what extent the wire was exposed to the environment. Separated bundles showed that wires inside a bundle were generally in better condition than the wires that were on the outside of the bundle. PI and PV wires both show that the rate of aging is somewhat affected by the presence of oxygen. B.6.2 CORRELATION TO AIRCRAFT. Although the accelerated aging profiles in this test program do not mirror what is seen in actual service, the characteristics of the aged wires were similar to what was observed in previous investigations. Figure B-18 shows a comparison of a wire aged during this test program (right) and a wire that was inspected from the National Transportation Safety Board (NTSB) TWA Flight 800 investigation (left).
Figure B-18. Aged Wire Comparison The data in this report correlated well to other test programs that have shown the impact from fluids (jet fuel, hydraulic fluid, deicing fluid, etc.) on the wire during normal aircraft operation [B-4 and B-11].
B-31

The PV and PI materials could not be easily separated for follow-on analysis, especially after a long period of heat aging. The bonding of these two materials creates potential problems. Since the material layers are no longer distinct layers, cracks will tend to propagate through to the conductor more easily. In actual use at lower temperatures, the PI does not bond quite as strongly; however, this phenomenon has been seen in older PVC-insulated wires pulled from aircraft [B-4 and B-14]. The stressors selected for this program caused the wires to exhibit characteristics such as cracking, crazing, discoloration, or abrasion similar to what was observed on wires removed from the intrusive inspection. Radial cracking on forced hydrolysis samples (left) and aged specimens (right) from this program are shown in figure B-19.
Figure B-19. Aged Specimens Comparison Figure B-20 shows a wire that was found from the NTSB investigation of TWA Flight 800 that was abraded.
Figure B-20. Wire Abrasion During the intrusive inspection and in the nonintrusive survey, the presence of damaged wires was found in many areas of the aircraft. Correlations were made of wire damage to the maintenance access areas. Reference B-7 states that although the data was sparse, there appears
B-32

to be some possible trends in tensile and elongation results that revealed that certain areas of the PV wire where more aged than others. The additional testing performed in this program supported the preliminary findings that the wire tensile and elongation properties change with aging. Wire from harsher environmental areas of the aircraft, such as wing tips, wheel wells, and near engines, correlated to more heavily damaged wire. The inspections identified specific stressors that did not appear to be from normal aging. These stressors are categorized as single-event perturbations to the normal aging process. For example, during an intrusive inspection of a DC-9 aircraft, a wire was observed to be burned by a light. Other examples include cut-through damage that can be sustained from a nonpredictable single event, as evidenced by wires observed during the NTSB TWA Flight 800 investigation, as shown in figure B-21. Therefore, a dynamic cut-through test was included in the test program to simulate this condition and to evaluate the ability of an aged wire to resist this type of damage.
Figure B-21. Sample Wire Damage From the TWA Flight 800 Investigations B.6.2.1 Environment and Stressors. It is typical for a wire of substantial length in an airplane to be routed through several environmental zones during installation. Tight bends, extreme temperatures, and fluid exposure can affect a long run of the same wire type. A wire could fail at a single point due to some of these stresses, while 99.9% of the rest of the wire may still be in good condition. When this occurs, maintenance is performed so that the airplane can operate safely. A failure does not necessarily indicate that the wire has degraded beyond its useful life since the failure may have been caused by a nonpredictable single event. This failure point may pose an immediate threat to aircraft safety, depending on the potential for arcing or shorting, based on its location and the presence of ionic contaminants. Poor performance of a particular wire type under specific environmental conditions may convince an OAM to avoid using that wire in their aircraft operational situation. OAMs select wire types that will last the designed service life of the aircraft. Alternatively, the designer may use the same wire, but increase its protection in specific areas that go beyond the characterized
B-33

environmental conditions such as placing wire in conduit or covering wire with protective sleeving when it is exposed to severe abrasion environments. B.6.2.2 Simulation Testing and Conditioning. Laboratory-simulated conditions were performed during the research program to define degradation parameters. The methods used in this program were standard, repeatable methods that are accepted by industry. A 10-times dynamic bend test, for example, has been used to simulate repeated maintenance actions such as a box replacement. A 10-times static bend simulates the bend radius allowable for typical wire installation, while the 6-times bend and a 1-time bend simulate the tightest conditions that may be experienced in the aircraft. In general, the operating time of the aircraft is considered the length of time that a wire has been exposed to its environment, and is usually expressed in hours. A 20-year-old aircraft could have many operational hours or only a few if flown sparingly. During that operational time, the aircraft and its various components experience changes in temperature and humidity. It may experience specific stressors such as installation with a 10-times radius bend, exposure to fluids, vibration, or not be mechanically stressed at all. Furthermore, there may be maintenance actions that create stress, such as periodic movement of avionics equipment and wire. The steady-state conditions of each aircraft, and each area within the aircraft, have to be known to understand the normal stressors present that affect the wire. Each of the stressors defined in this test program contribute a certain amount of aging on a wire. An aircraft wire may see only 8 to 20 cycles of bend during its entire lifetime. The abrasion induced by the vibration test method was sufficient to wear the surface of the wire by a couple of mil. This may be similar to what wires will experience over 30 years of service as observed on wires evaluated during the intrusive inspection [B-4]. But the result is much less than what would be expected from a wire abrading heavily against a clamp. Due to a large array of conditions on the aircraft (the service life, usage, environment), and the many actions that occur (service, maintenance, overhaul, rewire, etc.), the actual stressors that affect the wire over its lifetime may never be known. There will always be some degree of uncertainty in the correlation of the degradation of the wire. Even the variety of fluids and exposure are too numerous to fully characterize. Therefore, many of these potential stressors were noted as perturbations to the normal aging process. Accelerated aging was shown to be effective in estimating time-to-failure within the boundaries of the test parameters. The uncertainty in the estimation increased further with the extrapolation outside the testing boundaries methods that were attempted. This test program attempted to use the lowest acceleration possible to obtain results within the program boundaries that are as close to real conditions as possible. The data generated from the test methods used in this test program are comparable to data from industry-accepted test methods. Industry test methods attempt to correlate the parameter levels to what an aircraft may experience over its operational service, but this is highly variable. For this test program, certain stressor levels were higher (temperature, humidity, and 6- and 1-times
B-34

static wraps), similar (straight and 10-times static wrap), or lower (vibration, thermal cycling, and fluid contamination) than what is typically expected on aircraft. Several techniques developed during this test program exhibited promising results for monitoring wire degradation. Further exploration of these methods may improve the understanding of wire aging and the ability to assess the condition of the wire in aircraft. Maintainers and operators can use one or more of these methods to monitor the wire in their aircraft at specified inspection intervals. These techniques can be used as a part of the enhanced zonal analysis program procedures that each operator may implement on the aircraft. B.6.2.3 Qualification Testing. The majority of wire qualification tests do not subject the wire to long-term tests, with a few exceptions. The tests generally evaluate a specific parameter of the wire, and often conclude with an electrical DWV test to ensure that the dielectric properties of the wire are intact. As a wire ages, the resistance to the forces of a bending motion (maintenance action) decreases, and the probability that a crack will evolve over time increases. Newer wire types have incorporated multistressor tests that are longer term, including accelerated life testing (1 to 3 weeks in a high-heat environment), similar to the ASTM D 3032 method (age, wrap, and DWV), but for only one cycle. The test, therefore, provides a single data point that could be compared to an Arrhenius curve to indicate whether or not the wire should perform as intended. Based on the importance of the stressors, several specific characteristics are not appropriately incorporated into many current qualification test requirements. For example, resistance to abrasion is identified as the most important single-point failure initiator for wire [B-4 and B-16], even though the tests in this program did not affect the normal degradation of the wire type tested. Extended oxidative aging and forced hydrolysis (strain, temperature, moisture, and DWV) may provide indications for long-term performance in multistressor environments. Dynamic cut-through testing and fluid exposure are additional tests that should be incorporated into the qualification requirements, as appropriate, to ensure that the performance characteristics of a wire construction are met. Other properties, such as flammability, do not change significantly with time. B.6.2.4 Correlation of Aging Model to Aircraft. The goal of this phase was to develop a degradation model that allows extrapolation as far out as possible (towards the 100,000-hour level) with high confidence. The confidence interval becomes larger the further out estimates are extrapolated; therefore, some of the aging in this test program was above 10,000 hours to try to achieve a decent correlation. Using DWV as the failure criteria, the aging data for the wire specimens from each test setup were initially analyzed using established methods to define the life of aircraft wire. Many similarities were found with the results of previous studies of aged wire removed from aircraft. Analysis of more empirical data or samples from aged aircraft may validate and improve the aging models.
B-35

Estimates of the median time-to-failure and 90% of the expected life were developed for each of the setups. A comprehensive model was then developed for each wire type to predict the median life of any setup based on the multifactor testing conditions (aging temperature, aging humidity, a continuous strain during aging, and a periodic dynamic stress). Conversely, the model can provide a temperature (temperature index) or stress level that would estimate a certain number of hours to the median failure point, such as 60,000, 20,000, or 10,000 hours. Although 10,000 hours is typically used to determine the wire’s maximum temperature rating for military purposes, commercial aircraft can operate up to 100,000 hours with a limit on the number of pressurization cycles. By comparing these stressors directly to the environment of the aircraft, the model can be used to predict the median time-to-failure for a wire at certain conditions. B.6.3 CORRELATION TO PROPERTY TEST PROGRAMS. Wires from this research study and the intrusive inspection showed similar changes in the inherent viscosity and dynamic cut-through results with aging. Analog Interfaces performed some aging and Indenter tests, which were compared to the results from this program. Despite differences in the test programs, similar trends were observed on some setups. For more details regarding correlation of the results, see appendix G. B.7 REFERENCES. B-1. DeHart, John W., Heacock, James F., and Punderson, John O., “Why Long Term
Performance Exceeds Some Limited Laboratory Projections on Hydrolysis,” DuPont, September 18, 1985.
B-2. Bruning, A.M. and Campbell, F.J., “Aging in Wire Insulation Under Multifactor Stress,”
IEEE, Vol. 28, No. 5, October 1993. B-3. “Aging of Aromatic Polyimide Insulated Electrical Wire,” SAMPE Technical
Conference, Clarence J. Wolf and Ronald S. Soloman, October 1983 and MDRL 83-36, Aging of Aromatic Polyimide Insulated Electrical Wire, McDonnell Douglas Corp., Wolf, C.J. and Soloman, R.S., 4-6 November 1983.
B-4. ATSRAC Intrusive Inspection Report, 1999. B-5. Hammond, Ahmed N., Stavnes, Mark W., Ide, James R., and Muegge, Ed, “Performance
of Partially Fluorinated Polyimide Insulation for Aerospace Applications,” NASA. B-6. Dunbar, W.G. and Tjelle, P.A., Electrical Insulation for High Voltage Electronics
Packaging, Boeing. B-7. “Characterization of Aged Air Force Aircraft Wire in Harsh Environments,” United
States Air Force Research Laboratory, January 6, 2003.
B-36

B-8. Kurek, J. and Meiner, J., “Effects of Mixed Wire Types in Aircraft Electrical Wiring Interconnect Systems (EWIS),” FAA report, DOT/FAA/AR-05/26.
B-9. Material Testing Research and Indenter Equipment Modifications for Determining Aging
of Wires (Cables) In Aircraft, Analog Interfaces, Inc. B-10. AS22759, SAE Aerospace Standard, Wire, Electrical, Fluoropolymer-Insulated, Copper
or Copper Alloy. B-11. Performance Comparison of M81381/9, M22759/33 and Non-Mil Spec Wire and Cable,
McDonnell Douglas Corp., Report No. B0482, 1987. B-12. Naval Avionics Center Report TR-2333, Testing of Selected Aircraft Electrical Wire
Insulations, June 1983. B-13. Hood, D., “The Other Side of the Fence, A Report on Some of the NAVAIR Problems
Associated with Military Connectors,” Naval Air Systems Command, 1977. B-14. Campbell, Francis J. and Bruning, Armin M., “Deterioration Rate Formula for Aromatic
Polyimide Naval Aircraft Wiring,” NRL and Lectromec, November 6, 1991. B-15. FAA Maintenance Program report. B-16. Raytheon—Indianapolis and FAA report Aircraft Wire System, Recommendations for a
TSO to Address Minimum Safety Performance of 30 June 2003. B-17. Cygan, P. and Laghari, J.R., “Models for Insulation Aging Under Electrical and Thermal
Multistress,” IEEE, Vol. 25, No. 5, October 1990. B-18. Elliot, David, “A Standardized Procedure for Evaluating the Relative Thermal Life and
Temperature Rating of Thin-Wall Airframe Wire Insulation,” IEEE, March 1972.
B-37/B-38

APPENDIX C—SINGLE-EVENT NONPREDICTABLE FAILURES (UNCONTROLLED PERTURBATIONS) TO THE WIRE AGING PROCESS AND AIRCRAFT
WIRING TERMINOLOGY
Specific single-event nonpredictable failures (uncontrolled perturbations) to the aging process that were identified during this research are categorized below. The research has shown that uncontrolled perturbations can affect normal wiring degradation. C.1 MATERIAL DEGRADATION. A number of aging processes affect the insulation materials. These were discussed in the main body of this report. However, although these were expected to be minimal in the majority of cases, wire that is mishandled can be subjected to accelerated levels outside the normal process. An example of this would be ultraviolet or gamma radiation. Under normal circumstances, wire should not be exposed to radiation such as this, except during the manufacturing process itself. However, a significant, uncontrolled event could take place that could subject the wire to radiation, such as leaving wire unprotected in the sunlight for an extended period (as might be the case during a periodic overhaul at a depot if not performed in an aircraft hangar). This could have a dramatic effect on the material and performance. C.2 WIRING DESIGN. Poor design that would lead to stresses on the wiring could lead to accelerated aging and damage to the insulation. This could also include the lack of design knowledge on the actual operating stresses during the life of the wire. Most failures occur within 3 inches from the rear of the connector. This usually is the result of improper strain relief design used at the connector-wire interface. Newer connector strain relief designs are available that can correct this design problem. Connector clamps if not sized properly will cause damage to the wire at the clamp. If it is too small, the wires will be clamped too tightly and pinch individual wires, damaging the wire insulation. If the clamp is too large, not enough strain relief will occur on the cable, and the wires can be pulled out of the connector and pins, or chafe the insulation from the movement in the clamp. Improper assembly practices can also lead to taut wires that stress the contact wire crimp interface. Proper strain relief should be applied to the entire wire/cable bundle in an even manner, which allows all the wiring to share the load. It should not allow a bending motion to be concentrated at one specific point on the wiring bundle, rather, the bend should occur over the length of the wiring bundle. It should also ensure that a bend does not pull excessively on wires as they enter the contact area. This can cause two problems: (1) this can stretch the grommet and cause openings in the interfacial seal of the rear of the connector and allow moisture or debris to enter, and (2) it can place excessive stress on the contact retention pins, which can lead to misalignment of the contacts, bent pins, and damage to the contact retention device. Clamp-type back shells should have at least a layer of insulating tubing, or insulating cushion applied over the wires under the clamp to protect the wires. The wiring should be supported and protected against chafing due to vibration or movement (such as slide-out racks or drawers or excess movement by a cable bundle that is not properly
C-1

anchored). Using polyamide clamps or metal clamps with an insulation cushion provides this protection. Vibration of wire-to-wire, wire-to-structure (clamps, etc.), and wire-to-flat structure (aircraft skin) will cause abrasion and chaffing of the wire. Wiring bundle clamps that are located too close to the connector can cause bending stresses to the wires when the connector is detached. If the wire bundle clamp is too far away, excessive movement from vibration may result in wire damage that causes a premature failure. The proper distance between the wire bundle clamp and the connector should allow a gradual bending of the wire bundle upon detaching of the connector. The wire and cable should be as short as practicable, except that sufficient slack should be provided to prevent stress due to temperature extremes, prevent undue stress on cable forms, structure movement, wire and connections, and enable connections to be removed for maintenance. Connectors, terminal blocks, and other electrical interface areas should be mounted in a horizontal position to prevent pooling of moisture at the wire entry points. Whenever wires are routed through holes, such as in metal partitions, the holes should be equipped with a suitable mechanical protection, such as a grommet, to prevent chaffing. In some aircraft, wires are routed through a pressurized bulkhead feed-through and are potted. An alternate design would be to use bulkhead connectors. Wires can be bundled by lacing twine, sleeving insulation, or plastic wrapping ties. The heads of plastic-wrapping ties can get snagged on other objects, causing stress to the wires. Improper lacing ties can come loose and allow the wires to come in contact with abrasive or damaging items such as pulleys, steel wires, or edges on the structure. Cables need to be protected in areas of the aircraft where aircraft personnel may use the cable as a handhold or foothold. This also causes stress on the wires. The bend radius of polyethylene cable should not be less than five times the cable diameter to avoid establishing a permanent set in the cable. PVC and fluorinated ethylene propylene/polyimide (Kapton®) wire insulation materials should not be used in airborne applications. Wire marking should be performed in a way that the wire insulation is not damaged. Flexible insulation should be used on cables that are subject to frequent flexing, such as panel door cables. The sleeving should be secured under cable clamps at each end, and the cable should be formed and secured so that the cable will not be subject to abrasion in its normal flexing motion. In cases where abrasion cannot be avoided, additional protection to the wires should be provided, or rerouting or redesigning shall be considered. Wiring to parts on a hinged door should be in a single cable if possible, arranged twisted rather than bended without being damaged when the door is opened and closed. C.3 WIRING INSTALLATION. The installation process itself may lead to the wire being subjected to forces that may directly affect the performance and possibly aging. Wiring installation deficiencies, either originally or during modifications, can cause problems. Improper or bad installation practices due to poorly trained or inattentive personnel can cause wire degradation. Such things as poor crimping of lugs, splices and connector pins, bad solder
C-2

connections, and improper use of parts can degrade wire. Wire may be installed with tight bends or kinks, or may lack the proper sized clamps. Proper lacing techniques are required to prevent loose wires from coming into contact with sharp metal edges or corners of structural members. Wiring should not be allowed to contact any structure, which will lead to abrasion and chaffing due to vibration. Movement of any kind with wiring must be minimized. When it is unavoidable, additional protection such as convoluted tubing can be used to add another layer of protection. Wiring installation cannot result in bundles being used as handholds or steps, or installed in areas where it may be stepped on, driven on, or have items placed or dropped on it. There should be enough room near equipment and aircraft to allow the wire to be removed without damage. The area should be protected by being roped off to outside sources. Wire bundles that are twisted should not be installed, as this may cause stresses on the wires and abrasion between the wires in the cable. If an area of excessive moisture or condensation is present, drip loops should be used to prevent water from reaching the rear of the connector. When installing wiring, care should be taken to prevent wiring from being stepped on, stretched, dragged across the floor, etc. When working with exposed wire such as crimping operations, cleanliness should be considered to prevent contaminants from contacting bare wire. Proper tools, which are calibrated, should be used. Components should be installed per manufacturer instructions. These should not be deviated from, or left up to the installer’s desecration. If the installer thinks that there is a better method for the modification, the installer should contact the engineer or supervisor in charge for a design change. During aircraft wiring modification, the wires being removed and installed should not be pulled through clamps that have not been removed or loosened. Pulling the wires through clamping points that are tight causes heat from friction that can damage wire insulation and the clamp-insulating material. During wire installation, wire clippers may nick the insulation and conductor on adjacent wires, and soldering irons may melt insulation during the soldering process. Tools left near wires can also damage them. Tape, rubber wrap, and spiral wrap are used in areas that the cables may come into contact with abrasive structures. If these protective covers become damaged, the wire might also become damaged. Cables need to be kept away from metal braided cooling and fuel lines because the braid will cause chafing and damage the wire insulation, leading to shorts. Terminal strip screws that become nicked when the screw is tightened can cause a sharp edge that can damage wire insulation that comes into contact with the screw head. Terminal strip covers help eliminate this problem.
C-3

C.4 WIRE MAINTENANCE. Poor maintenance may greatly accelerate the aging of wire. The wire is exposed to a number of additional forces that are outside normal operating forces. At times, the wiring may be abused or exposed to things such as cleaners, sand blasting for paint removal, soldering temperatures, and pulling that would stress the wire in uncontrollable manners. Clamps that have come loose and out of alignment, or have their rubber cushion dislodged, damaged, or missing, are a major cause of wire degradation in aircraft. The wire bundle can be chafed by the clamp or by rubbing/riding on adjacent aircraft structures, brackets, braces, standoffs, clips, other wire bundles, and other clamps. During service and repair, wire and cable should be properly supported and secured to prevent undue stress on the conductors and terminals, and undue change in position (flexing) of the wire or cabling. The number of times that cable connectors are mated and unmated should be held to the life cycle rating, which is often 500 cycles. Each mating and unmating causes the wire bundle to be flexed and adds stress on the wires. Aircraft that have wires routed through a pressurized feed-through that is potted is a major wiring maintenance problem. The potting material has to be removed without damaging the wires. This process is very time-consuming, tedious, and very hard on the wires. The sealant must be removed by hand in tight areas. Maintenance personnel use cutters, knives, and pliers to dig away the potting material, causing stress to the wires. The wire insulation can be chaffed, and cut from the tools and the edge of the hole during this process. After modification and electrical testing, the feed-through is repotted and retested for pressurization. C.5 OPERATIONAL EXTREMES. An aircraft operating under conditions beyond its intended design could stress the wire more than expected. An example of operating extremes includes excessive heat caused by aircraft that are heat-soaked by sitting in the sun on a runway or at a gate for extended lengths of time. Other extremes would be excessive heat due to the aircraft being close to fires and weapon blasts during combat. This may also require the aircraft to see increased maintenance, which would subject it to more possible problems with poor maintenance or repairs. Wire bundles that move because of hinging (e.g., at doors, wings, and rudders) can cause wire failure. This is because of the constant bending of the wires. Wire bundles may see greater extremes of shock and vibration when wind shear and turbulence wake are encountered, increasing the potential for abrasion. Lightning strikes to the aircraft, some of which can be extreme, can cause dielectric failure to the insulation. It has been calculated that commercial aircraft sustain one lightning strike for every 10,000 hours of flight operation. Arcing due to lightning strike or induced capacitive and inductive transient voltages increases wire degradation [C-1]. An area of the aircraft that causes the most extreme aging on wire is in the wings’ leading and trailing edges. Other extreme areas are at pressurized bulkhead feed-through, the hellhole (area of aircraft that is hard to access and wire is used as hand- and foot-holds), and the wheel area. Chafing in the area of the fuel system can cause catastrophic failures.
C-4

C.6 EXPOSURE TO VARIOUS DEBRIS. During its life, wire on an aircraft may be exposed to a number of different materials that would be considered outside the normal operating environment. These could include debris such as wire clippings, dust, lint, sand, drill shavings, as well as lubricating oils, hydraulic fluids, cleaners, aircraft fuel, and deicing fluid. These may affect the performance and aging characteristics of the wire by causing swelling or abrasion between the wire and perturbation. Exposure to sticky materials/residues such as grease will attract and hold dirt and debris. C.7 HIGH-TEMPERATURE OVEREXPOSURE. Exposure of wire to temperatures beyond the expected range may occur for a variety of reasons, including overheating of an electrical device, shorts, lightning, and fires. This potentially very high-temperature exposure could cause extremely accelerated aging of the wire. An area of high temperature concern is in the engine compartments. C.8 COMPONENT FAILURE. Wire can be destroyed and cause a fire hazard due to component failure. Aircraft design protects the aircraft and wires with various kinds of circuit breakers. However, these circuit breakers can fail and cause overload currents in the wires that overheat and burn open. Circuits that were designed with a circuit breaker of an improperly high amperage rating can cause wires to overheat and age. Re-setting of circuit breakers in-flight can also lead to wire overheating. C.9 AIRCRAFT WIRING TERMINOLOGY. Airframe Interconnect Wire—Wire that is used throughout the body of the aircraft rather than in black boxes. This is typically wire that is used in unprotected applications, meaning that the wire can be used in applications for which additional protection is not necessary, or in protected applications, meaning that the wire must be protected from the general aircraft environment by sleeving, jackets, conduit, or other means. This wire is more robust than hookup wire. Conductor—Metal or metallic component of the wire that is used to conduct or transfer electrical current or signals. Dielectric—Nonconductive insulator used to enclose the conductor to minimize lost electric current between intended locations at the terminations. Environmental Stressor—A condition caused by the environment, which puts stress on the wire. This can be temperature, electrical, physical, etc. Hookup Wire—Wire that is used in distinct packaged applications, such as in avionics boxes, and is well protected from the rigors associated with airframe wire.
C-5

Nonenvironmental Stressor—A stress placed on the wire that is caused by a person performing some action on the wire. Examples include bending and stripping that may be caused during a maintenance action. Property test—A test use to characterize a specific property of the wire. A property test may be performed to monitor the condition of the wire during the aging process’s monitoring test, or it may be performed after the aging has been complete. Static Stressor—A stress placed on the wire at some point that remains during aging. Wire—The component made of an electrical conductor that is insulated with a dielectric material. Wiring—A term used to define the system and all components associated with transferring electric current from one location to another. More technically defined as the Electrical Wiring Interconnect System. C.10 REFERENCES. C-1. SAE ARP 5412, “Aircraft Lighting Environment and Related Test Waveforms.”
C-6

APPENDIX D—TEST PLAN
D.1 INTRODUCTION. This appendix provides the test plan and test protocols to use for a test program to characterize the degradation of aircraft wire insulation. The wire types included in this plan were chosen from the primary wire types currently used on aircraft in service and that were identified as part of the Federal Aviation Administration (FAA) Intrusive Inspection Report. This plan is designed to examine factors that cause degradation, and assist in establishing techniques to predict the wire’s ability to safely transfer electrical current under specified conditions. The technical basis and methodology for the test plan is presented. D.2 WIRE AGING TEST PLAN. Aircraft wire is manufactured from a variety of insulation and conductor materials. Many of these materials have known weaknesses that are exploited in certain aircraft environments. These known weaknesses were used to determine the major aging stressors to be evaluated. Interactions of the stressors are examined, since stress on a wire may increase a wire’s susceptibility to other aging forces. The levels of the aging stressors are also important factors. The higher the level of the stress on a material, the harder or faster the material is affected. In general, the levels of the various aging stressors were determined based on the actual levels seen by the wire in the aircraft. The wire types being studied are typically designed to exceed 10,000 hours service life at rated temperature when stressed with specific mechanical and electrical factors. Therefore, in order to induce deterioration in wire within a shorter period of time, the stress levels will have to be increased to accelerate the aging process. D.2.1 SCOPE OF TEST PROTOCOL. The study is designed to examine the aging characteristics of several specific wire types that are commonly used in the aircraft industry. The wire types to be examined are aircraft interconnect wires typically used between the power or signal source and the load in commercial transport aircraft. The study will neither examine hookup wire used internally to electronic equipment nor areas which require the use of specialty wire, such as around the engines. The test protocol assumes the principal insulation degradation mechanism is oxidation, and the secondary degradation mechanism for certain wire types is hydrolysis. The oxidation degradation prediction test procedure for wire is well known and accepted in the aircraft industry. The stressors used to define the wire aging curves have specific mechanical and electrical characteristics. Changing these stressors to be more reflective of aircraft wiring applications is expected to provide a better predictive tool for wire aging in the aircraft. D.2.2 TEST SAMPLES. D.2.2.1 Insulation Types. The test samples are chosen from the primary wire types currently used on aircraft in service. The major types of wire in use were identified as a part of the FAA Intrusive Inspection Report.
D-1

Several new wire types may be used in the near future for aircraft wiring, while others have nearly been phased out of old aircraft. The general wire types that will be evaluated will include • Aromatic polyimide tape-wrapped (PI) with fluorinated ethylene propylene bonding
layers and aromatic polyimide topcoat (MIL-W-81381 construction, Airbus type, Boeing type BMS 13-51, Douglas type BXS 7007, others)
• Aromatic polyimide tape wrap with fluorocarbon bonding layers and
polytetrafluoroethylene outer wrap (PI/PTFE) composite (CP) (initial MIL-W-22759/80-/92 construction, Boeing type BMS 13-60, Teflon®-Kapton®-Teflon®)
• Polyvinyl chloride with extruded polyamide outer jacket (PV), (MIL-W-5086/2, Boeing
type BMS 13-13, Douglas type, polyvinyl chloride/nylon). A number of additional wire types are presently used on current aircraft, but mostly for specific applications such as very high temperature and electromagnetic interference protection. These special areas are considered outside the scope of the study. Wire cable constructions will not be evaluated, because shields are generally of the same material as the conductor, and jackets are similar to the insulation of the primary wire. Jackets may see different stresses than wire, such as the bend radius, but a study of these characteristics is considered outside the scope of this wire-only study. Depending on the results of this study, recommendations could be made regarding the need to look separately at shielded and jacketed wire. D.2.2.2 Conductor Types. The conductor type is a variable that has little bearing on the aging of the wire, except from the standpoint of changing the flexibility characteristics. In some cases, the coating of the annealed copper conductor (tin, silver, or nickel) may interact with the insulation, which could affect the aging characteristics. Conductors are rated to certain temperatures, above which their performance characteristics decrease substantially. Tin is rated to 150oC, silver to 200oC, and nickel to 260oC. Oxidation above the rated temperature is greatly accelerated for tin-coated conductor. Aluminum conductors or high-strength copper alloy conductors are used in much smaller volumes in commercial aircraft compared to annealed copper. There is considerable data showing acceptable aging characteristics for conductor materials; therefore, the conductor type will not be evaluated as part of this study.
When available, the recommended conductor type to use for the test protocol was nickel-coated annealed copper. Nickel exhibits the least oxidization in aging conditions, and should therefore, minimize insulation stripping problems. D.2.2.3 Additional Test Sample Boundaries. A number of additional secondary sample variables may affect the test protocol. The sample variations include insulation wall thickness, conductor gauge size, insulation and conductor
D-2

materials, and suppliers and processes. These variations are not considered significant, but will be controlled to the maximum extent possible. Sample variations that cannot be controlled will be documented to assist in data analysis.
Sample variations within a length of wire will be controlled to the extent possible, with the wire samples being obtained from a single manufacturer and a single lot of production for each wire type. Some wire types may have limited choices of conductor material, but all wire types will be of a similar gauge size (22 gauge is preferred) to eliminate a variable caused by the fixtures and test sets. Commonly used airframe wire types currently in use on commercial aircraft will be evaluated. One wire insulation thickness, generally a medium-wall airframe version, will be examined for each wire type. D.2.3 ENVIRONMENTAL VARIABLES AND VARIABLE LEVELS. Actual conditions to which aircraft electrical wiring is exposed can vary greatly, depending on the aircraft type, the specific area within the aircraft, the flight profiles, the aircraft’s operating conditions, and the aircraft’s nonoperating conditions. Aircraft environments are not homogeneous, and aircraft wiring extends throughout almost all areas. These conditions affect the wire aging in many different ways. The test protocol establishes the environmental conditions and stressors (variables) to be examined and explores multiple levels of each variable to study the effects of those variables on the aging characteristics of the wire. The variable levels chosen were to bound the actual levels experienced by the aircraft wire, ranging from benign areas to very harsh areas. As a baseline, MIL-STD-202 and MIL-STD-810 test method standards were used to define the environment of the aircraft. In addition to the above standards, several other environmental factors were identified and considered for inclusion into the test protocol. Based on the current knowledge of the single-mechanism relationships of polymer degradation, many of the environmental conditions defined in these standards are not expected to affect the aging of wire insulation (e.g., salt spray). Others, however, are known to contribute substantially to the aging process (e.g., temperature and ultraviolet radiation). Each wire insulation (polymer) type may be uniquely affected by the various environmental conditions. The interactions of these various environmental conditions may affect the aging of a wire to a greater or lesser degree than a simple addition. Since not all potential conditions can be considered, only the variables expected to have the greatest effect were incorporated into the test plan. Specific variables were incorporated into the test plan based on the current knowledge of the individual variables, the wire insulation type, and the wire location on the aircraft. Previous test results that showed direct or indirect correlation to the performance of wire over time (aging) were also considered. D.2.3.1 Polymer Degradation Mechanisms. Previous test results from various organizations have shown that a number of mechanisms affect the aging of aircraft wire or polymers. These mechanisms include biological, electrical, mechanical, radiation, and chemical degradation. Each mechanism was examined as a stressor that could possibly affect wire insulation aging. Wire degradation due to biological, low-level radiation, and low-voltage electrical stressors were determined to not degrade the wire insulation
D-3

materials. Electrical overload stresses, abusive mechanical stresses, and uncontrolled chemical stresses were viewed as perturbations to the normal aging process. D.2.3.2 Stressors Considered for Aging Wire. The stressors are the specific conditions or actions that occur to induce aging of the polymer by one or more of the degradation mechanisms. The stressors are defined as independent variables in the test plan. The following stressors affect the mechanical and chemical degradation mechanisms and will be evaluated in the test protocol at the stated levels: D.2.3.2.1 Mechanical Stressors. A variety of mechanical stresses that age the wire occur in the aircraft environment. These include the following: • Bend Stress—Bend stress is a result of manufacturing, installation, and/or maintenance
actions, which may create a bent area in a wire that will remain indefinitely during its life. Design guidelines generally allow a minimum bend radius that is expressed as a function of the wire diameter. The bend stress increases the wire’s susceptibility to other aging forces. A notch or other insulation flaw will be magnified by the bend stress level. A tight, static mandrel bend stressor is used to approximate the bend applications in the aircraft.
Stress Levels: Bend radii of straight wire or wires static wrapped around a mandrel 40 times (40x), 10 times (10x), 6 times (6x), or 1 time (1x) the diameter of the wire.
• Flex Stress—Maintenance actions often flex wiring. Flex stress is simulated by wrapping
the wire around a mandrel periodically during the aging process. The wrap is performed per the ASTM D 3032 test method, stressing each side of the wire twice with compression and tensile forces.
Stress Levels: No wrap, wrap around 10x mandrel, or wrap around 3x mandrel. • Vibration Stress—Vibration stress, due to the aircraft engine, generates forces that
abrades, chaffs, or flexes improperly installed wire. To simulate the vibration stressor, the straight or bent wire is vibrated in two directions (-x to +x), against a steel plate with rounded edges. The steel plate finish is defined and placed against the wire surface. The test is designed to be a modification of a mandrel abrasion test but will allow almost the full wire length to be abraded evenly.
Stress Levels: No vibration and vibration at a load to be determined based on the initial
test results. Initially, 5 minutes of vibration after each aging cycle. Modified to 7.5 seconds of vibration per wire segment after the first and second aging cycles.
• Thermal Stress—The temperature of a wire may directly affect the behavior of a certain
wire type as it undergoes mechanical strain. In general, wire insulation becomes more supple as it warms above room temperature and more brittle as it gets colder. Since most
D-4

maintenance actions will occur at room temperature, all monitoring tests will be performed at room temperature.
Stress Levels: All monitoring testing at room temperature. • Thermal Cycling—Thermal cycling from aircraft flight cycles induces mechanical stress
in the wire due to differences in the coefficients of thermal expansion for the insulation and the conductor materials. Each time that a thermal cycle occurs, a stress is placed on the insulation, especially if there is some mechanical force on the wire, such as bends or clamps.
Stress Levels: No thermal cycling, or 100 cycles of thermal cycling from -55°C to +85°C
at each hold point. D.2.3.2.2 Chemical Stressors. The two major chemical degradation mechanisms to be examined are oxidation and hydrolysis. The degradation is affected by the presence of various chemical stressors. Many of the chemical stressors are viewed as perturbations to the normal aging process, such as water leaking from lavatories. However, wires exposed to the environment in the wings and wheel wells are often exposed to a number of different chemicals that are considered in the test protocol. • Exterior Fluid Exposure Stress—Periodic immersion in jet fuel, hydraulic fluid, exterior
aircraft cleaning fluids, and deicing fluids are typical aircraft exposures. To simulate these types of exposures, the wire is immersed in a fluid for 1 hour at room temperature (jet fuel), 50°C (deicing fluid and hydraulic fluid), or 65°C (cleaning fluid), then allowed to drain for 1 hour and returned to the aging condition. At each aging cycle, the wire is subjected to a different one of the four fluids in a rotation. Immediately following the aging period, the wire will be subjected to the bend stressor and the dielectric withstand voltage (DWV) tests.
Stress Levels: Fluid exposure or no fluid exposure. • Humidity Stress—The aircraft is exposed to a variety of humidity conditions. Humidity
directly affects the hydrolysis mechanism of certain insulation materials. The level of exposure to humidity as a percent relative humidity (%RH) is based on the wire insulation types.
Stress Levels: PI insulated wire: 0% RH, 70% RH, 85% RH, 100% RH, and 85% to
25% RH cycled.
PI/PTFE insulated wire: 0% RH, 85%, and 100% RH. PVC/nylon insulated wire: 0% RH and 100% RH.
D-5

• Thermal Stress—On the aircraft, wire can be expected to see increased temperatures in the presence of chemicals due to the environment or current loading. Temperature affects most chemical mechanisms by increasing the available energy for a reaction to take place, i.e., the rate of the reaction increases with rising temperature. Thermo-oxidation and hydrolysis both accelerate with increased temperature. Aging due to temperature will depend on the wire type. The protocol assumes that no thermal transitions of the materials are encountered during the aging process. Several temperature levels will be chosen based on the depth of data to be generated at any one condition.
Stress Levels: PI insulated wire: 250° to 300°C.
PI/PTFE insulated wire: 260° to 300°C. PVC/Nylon insulated wire: 110° to 135°C. • Altitude Stress—Atmospheric pressure, from aircraft flight cycles, can affect the
chemical degradation mechanisms by changing the probability of molecular interaction based on the molecular kinetic theory. Pressure and concentration of chemical species, such as oxygen, affects the average molecular distance for reaction pathways to proceed. Temperature affects the ability of the chemical species to reach the activation energy for the reactions to proceed. Reducing available oxygen and decreasing the temperature at altitude (see also Thermal Stress) could slow the aging process based on chemical degradation mechanisms. Some insulation types are known to out-gas, e.g., plasticizers, resulting in mass loss and increased rigidity. Altitude levels commonly flown by commercial aircraft, however, do not exhibit large differences in oxygen content. Although altitude effects are seen as a potential factor for wire degradation, atmospheric pressure is not included in the test protocol.
Stress Levels: Conditioning performed at various temperatures (see Thermal Stress). All
testing performed at room temperature and atmospheric pressure. D.2.3.2.3 Thermal Stressors. In addition to affecting the chemical and mechanical degradation mechanisms, thermal stress from the aircraft environment or current load can also affect other potential degradation pathways, especially those which overcome the thermal limitations of the insulation polymers. The test protocol stays within the thermal boundaries of the insulations being evaluated. D.2.3.3 Perturbations to the Aging Process. A number of stressors that affect the aging process are uncontrollable. Many of these stresses are related to the installation and maintenance of the wire or nearby components. SAE AS50881 and ARP4404 define the installation of the wiring systems in aircraft. Although these documents have existed for many years, changes such as decreasing the overall stresses on the wire, allowing for easier maintenance, and improving reliability of systems are continually being incorporated to improve the final product. Older aircraft may not meet the current wiring practices and may have additional stresses on the wire than aircraft manufactured more recently. Each of the stresses can affect the aging of the wire and wiring systems. Due to the uncontrolled
D-6

nature of such stresses and the practicality of designing a realistic test program, these stresses are not included in the test protocol. Typical uncontrollable stressors include wiring design, wiring installation or installation deficiencies, wire maintenance, operational extremes outside the design guidelines, exposure to various debris outside the design guidelines, and exposure to high temperature caused by unpredicted environmental conditions, such as lightning, electrical shorts, and component failure. D.2.4 TEST METHODS AND TEST PASS/FAIL CRITERIA. A variety of test methods will be used to monitor specific parameters of the samples. A large number of different tools will be used to monitor the changing characteristics of the wire samples during the laboratory-accelerated aging process. Parameters that can be monitored and have specific values will be more useful than parameters that are strictly pass/fail. However, all parameters will be correlated to the traditional pass/fail criteria as determined by the insulation DWV test. Although the insulation is the primary focus of the study, the conductor integrity will also be monitored since it is an integral part of the wire component. Part of the study evaluated the value of new test methods. If it is determined that a test method is not providing useful data, that method may be terminated. The recommended methods are as follows: • Visual Inspection—Used to inspect the wires with unaided eye for damage that can be
easily seen. Perform initially and after each cycle when the wire specimens are removed from conditioning and testing. Microscopic inspection is performed on selected specimens to further evaluate the degradation visually. Photographic documentation is taken when appropriate.
• Insulation DWV, Wet—Used to determine the failure point of the insulation and to create a minor electrical stress. The test level is a 60 Hz, 1500 volt alternating current potential for 1 minute with a leakage current greater than 10 mA. DWV will be used to test all life (L), property (P), and control specimens initially and after each aging cycle until failure.
• Insulation Resistance (IR), Wet—Used to detect changes of the insulation resistance. The test level is a 500-volt applied direct current (DC) potential. Ten-foot electrical specimens will be tested initially, then after every other cycle until the conditioning is ended.
• Conductor Resistance and Electrical Continuity—Used to determine if the conductor is affected by the aging process of the insulation. The test, combined with the DWV test, will indicate potential problems for functional circuits in an aircraft. The test will be performed on three 10-foot electrical specimens during the DWV test initially, after every third cycle, and at the end of the exposure.
• Functional Performance—Used to demonstrate the effect of the wire degradation on a typical aircraft electrical circuit. This test was not used in the test program.
• Insulation Resistance (IR), Dry—Used to detect changes in the insulation resistance. The test level is a 500-volt applied DC potential. The polarization index of 1:10 minute ratio is measured. Three 10-foot electrical test specimens (same specimens as wet IR) will be
D-7

tested. Wires will be tested initially, at every third cycle, and at the end of the test. Some specimens have reduced testing frequency (initially and at the end of the test).
• Dielectric Phase Angle—Used to monitor the electrical degradation characteristics of the insulation properties. Three 10-foot electrical test specimens (same specimens as dry IR) will be tested. Wires will be tested initially, at every third cycle, and at the end of the test. Some specimens have reduced testing frequency (initially and at the end of the test).
• Time Domain Reflectometry (TDR)—Used to observe electrical defects or changes in the insulation characteristics that change the relative absorption patterns. Three 10-foot electrical test specimens (same specimens as dry IR) will be tested. Wires will be tested initially, at every third cycle, and at the end of the test. Some specimens have reduced testing frequency (initially and at the end of the test).
• Terahertz Testing—No valid test procedure was developed, so this test was not included as part of the program.
• Insulation Tensile Strength and Elongation—Used to test the insulation material properties without the conductor. An initial test will be performed on an unconditioned wire to establish a baseline for changes in tensile and elongation as the specimens age. The test will be performed on the P specimens from each condition-stressor combination and select control specimens initially, and on aged specimens from specified hold points. Results will be obtained from a minimum of three test samples per specimen from the specified hold points.
• Conductor Tensile Strength and Elongation—Used to determine if the aging stressors selected affect the conductor in addition to the insulation. Initial testing will be performed on bulk samples of each wire type, and final tests will be performed on P specimens from selected setups of each wire type in the oven and humidity design experiments.
• Insulation Modulus or Hardness, Indenter Type—Analog Interfaces’ equipment was used to determine if there is a measurable change of the modulus over time. This is considered a nondestructive test. The test measures and averages the hardness at several locations along the length and circumference of the P and control specimens. The test is performed on specimens that have equilibrated and are from specified hold points.
• Insulation Modulus or Hardness, Cross-Sectional Type—Modulus profiling is performed across the wire cross section to determine the changes in modulus over time. The test will be performed on unconditioned wire initially to establish a baseline, then on P specimens at the test midpoint and endpoint of selected aging conditions for each wire type. The test procedure is to be written by the test laboratory performing the initial tests. If initial and final test results show clear differences in aging, the test may be performed on midpoint aging specimens of various test combinations.
• Inherent Viscosity—The PI films will be evaluated for changes in the average polymer chain length over time. For each wire type, P specimens from the midpoint and final
D-8

aging cycles of selected setups will be compared to the results of insulation from unconditioned wire specimens.
• Insulation Cut-Through—Two versions of this test will be performed (static cut-through and dynamic cut-through) to determine the change in insulation hardness. The test assumes the resistance to cut-through is proportional to the insulation hardness. Perform this test initially, after every fourth aging cycle, and after the final aging cycle on P specimens.
• Insulation Mass Loss/Kinetics by Thermogravimetric Analysis (TGA)—The technique will be used to determine whether the activation energy, as measured by TGA, relates to the calculated parameters. The test will be performed per the test procedure described by Component Test Report AW50.93 of the Naval Air Warfare Center, Indianapolis. Several P specimens will be tested initially, after partial aging, and following thermal aging of several condition-stressor combinations.
• Weight Measurement—The test is used to measure the change in mass of a wire over time. The weight of the L specimens of specific stressor combinations will be performed initially, at every third aging cycle, and at the life endpoint when the specimens fail DWV.
• Density—The test is used to measure changes in the density of the polymer material. PVC is suspected to change density during the aging process. The test will be performed on a select group of specimens from the PVC/nylon construction. This test will be performed initially and after the midpoint and final aging cycles on P specimens from select oven conditions.
• Oxidation Induction Time—The test is used to measure the quantity of antioxidants remaining in the insulation. The test procedure is to be written by the test laboratory subject to initial test results. If the initial and final test results show clear differences in aging, the test will be performed on P specimens of to-be-determined test combinations every fourth aging cycle.
• Wire Insulation Deterioration Analysis System (WIDAS)—The test is used to determine the aging of PI wire due to thermal, mechanical, and humidity stresses. The method will be used to approximate the life of samples from three test combinations that have not been aged to complete failure. The test will use a test procedure developed by Lectromec, Inc.
• Infrared Spectroscopy (FTIR)—The test is used to determine the functional chemical bonds that are affected by the aging process, then to determine how those bonds change with time. The test procedure is to be written by the test laboratory subject to initial test results from the bulk material. If the initial and final test results show clear differences in aging, also perform the test on P specimens from selected test combinations after the sixth aging cycle.
D-9

• Ultraviolet-Visible Spectroscopy (UV-Vis)—The test will be evaluated for its ability to measure the quantitative change of molecular species of the PVC polymer due to the formation of polyenes during the aging degradation. The test will be performed initially on bulk material and after the midpoint and final cycles on P specimens for a select group of specimens from the PVC/nylon wire construction.
• Flammability—This test will be performed to determine if the flammability characteristics of the wire types change due to aging of the wire insulation. The test will be performed initially on bulk material and after final cycles on P specimens from select ovens and humidity conditions.
D.6 DESIGN OF EXPERIMENT. An aircraft generally experiences four environmental phases that make up the flight profile. These phases are nonoperational, takeoff, flight, and landing. Testing based on a specific flight profile with nonchanging variable levels will provide correlation to real flight time, but is expected to reveal little about the mechanisms and interactions that affect wire aging. Alternatively, a controlled test matrix will provide insight into the mechanisms and interactions, but little correlation to real flight time. To best meet the goals of the test program, the mechanisms and interactions are the primary focus of this investigation. D.6.1 METHODOLOGY AND SETUP. The test plan incorporates a number of accelerated environmental conditions in the laboratory based on the inputs of the most important environmental variables (stressors) that should be evaluated. Periodically, wire specimens will be removed from the accelerated aging environment to perform property or performance tests to monitor the degradation characteristics of the specific conditions on the wire. Certain specimens will be placed into the accelerated environments for further aging, while other specimens will be destructively tested at specific times. D.6.2 STATISTICAL ANALYSIS. The distribution of the time-to-failure data, at the various combinations of the independent variables, will be input into the statistical analysis program. Intermediate analysis of the time-to-failure data will be performed and adjustments made according to the sample removal time intervals. The time-to-failure data is based on a reasonable number of DWV proof cycles to failure (8-16 in the ASTM D 3032 test method). Data from each property test will be analyzed to determine the correlation with the aging time and the dielectric failure data. The experimental matrix used to define the methodology is based on a central composite design, although highly modified due to the many constraints encountered in testing this type of product. To improve the data from this test program, a number of other potential variables will be controlled to the extent possible. The experiment design will evaluate the samples and the variables to determine the effect of each independent variable and the interaction of the independent variables on the expected life of the wire. A multiple regression analysis will be used to analyze the data and to develop equations relating the aging factors to predicted life for
D-10

each wire type evaluated. The experimental method is based on the single variable (temperature) life prediction laboratory test techniques and analysis method of ASTM D 3032 section 14 to multiple exposure variables and analysis by statistical multiple regression techniques. D.6.3 ASTM D 3032 TEST PROCEDURE BACKGROUND. The ASTM D 3032 test procedure is an industry-accepted test procedure used to determine the temperature rating of wire based on oxidation degradation. The test uses a combination of thermal, mechanical, and electrical stresses to define the life of a wire sample. Changing the level of the stress factors will affect the wire temperature rating. The temperature rating is typically the maximum exposure temperature of the insulation for a specific period of time, often 10,000 hours. Measurement of the wire life at several accelerated temperatures, based on the DWV failure, allows for analysis of the data to make predictions on the potential life of the wire at the rated and lower temperatures. These lower temperatures are often more typical of the actual temperatures to which the wire is exposed or operated. Due to the high thermal stability of insulation materials commonly used in commercial and military aircraft, the designed upper temperature requirement for a wire may be anywhere between 150° and 260oC, even though the actual operating temperature may be much less (around 80oC maximum). The aging characteristics of a wire at these lower operating temperatures and stresses are difficult to measure because of the extended time required for the wire to be monitored. Testing a wire’s aging characteristics at room temperature may take up to 20 years or more. The ASTM-accelerated condition allows the wire to be tested in a shorter time period. D.6.4 ADDITIONAL TEST DATA. Secondary testing will also be designed to use a number of shorter-term aging test methods tailored for specific types of wire insulation. These tests would use similar failure criteria, but only use a very limited subset of the environmental variables. These alternative test methods will provide additional life estimation equations on a limited number of variables. Other test methods, such as TGA, will be performed based on standard test methods and analysis techniques. D.6.5 TEST PROTOCOL. The test protocol assumes the principal insulation degradation factor is oxidation. The ASTM D 3032 method is used to measure the oxidation degradation, but the stressors have been modified to stress the wires in ways that better reflect the aircraft applications. For comparison purposes, the standard ATSM D 3032 test is also performed. Each wire type is expected to display unique aging characteristics. The test protocol was developed based on the stressors used to condition the wire samples, the wire types to be evaluated, and the test methods to be used for wire specimen evaluation (see table 2 in the main body of this report).
D-11

D.6.6 TEST SPECIMENS. Four specimen types will be used for this test program in thermal and humidity conditions, except for 100% RH. The water immersion (100% RH) will use reduced P specimen sizes due to space limitations. • Life (L) Specimens—Eleven 16-inch-long specimens will be conditioned as defined by
the test protocol to determine the point when DWV failure occurs. An extra set of specimens (L+) will be added to several conditions, but the DWV testing will be delayed so the effect of the application of the DWV can be evaluated.
• Property (P) Specimens—A specified number of 10-foot-long specimens will be placed
in the same conditions as the L specimens and will undergo the same stressors per the test protocol. Three specimens are dedicated to electrical monitoring throughout the test conditioning. From the remaining specimens, various length pieces will be cut at specified hold points for the specified property tests, or for saving for additional testing that may be desired. The P specimens cut at the specified hold points are to monitor the change of properties as the wire ages.
Note: In the 100% RH test, multiple shorter specimens will be used, with one specimen removed after every other aging cycle.
• Control (Z) Specimens—Six 16-inch specimens of one specific wire type (PI) will be
placed in each chamber in the nonstressed condition (straight) and DWV tested only. No other stressors will be applied to these specimens. At every third cycle, one specimen will be removed and tested to define whether the chamber conditions remain consistent across all test groups.
• Virgin (V) Specimens—Sufficient length of each wire type in the unconditioned state
will be sent along with aged specimens to provide the baseline for wire performance on each test performed on the wire specimens. These specimens will be from the same sample lengths and lots as the specimens which are conditioned.
Table D-1 lists the types of specimens and frequency of hold points for testing each of the recommended tests.
D-12

Table D-1. Frequency and Number of Specimens to Hold/Test
Test Wire Types
Tested Type of
SpecimensFrequency of Specified
Hold Points
Estimated Number of Stressor-Condition
Combinations Tested per Wire Type
Visual Inspection All wire types
All Initially and after every cycle
All
Insulation DWV All wire types
All Initially and after every cycle (except L+ specimens)
All
IR Wet All wire types
Electrical specimens
Initially and after every 2nd cycle
All, except 100% RH
Conductor Resistance
All wire types
Electrical specimens
Initially and after every 3rd cycle
All, except 100% RH
Functional Performance
All wire types
Electrical specimens
Not included in test program
Two conditions each wire type
IR Dry All wire types
Electrical specimens
Initially and after every 3rd cycle, or initially and after final
Nineteen oven conditions and five humidity conditions. An additional eight oven and five humidity initial and final only
Dielectric Phase Angle
All wire types
Electrical specimens
Initially and after every 3rd cycle, or initially and after final cycle
Nineteen oven conditions and five humidity conditions. An additional eight oven and five humidity initial and final only
TDR All wire types
Electrical specimens
Initially and after every 3rd cycle, or initially and after final cycle
Nineteen oven conditions and five humidity conditions. An additional eight oven and five humidity initial and final only
Terahertz All wire types
10-ft Terahertz specimen
Not included in test program
Approximately four conditions—two for each wire type in oven and one or two in humidity
Insulation Tensile Strength and Elongation
All wire types
P and Z specimens
Initially and after every 2nd cycle (P), and every 3rd cycle (Z)
All
D-13

Table D-1. Frequency and Number of Specimens to Hold/Test (Continued)
Test Wire Types
Tested Type of
Specimens
Frequency of Specified Hold
Points
Estimated Number of Stressor-Condition
Combinations Tested per Wire Type
Conductor Tensile Strength and Elongation
All wire types
P specimens
On bulk and after final cycle on select conditions
One oven and one humidity condition for each wire type
Insulation Modulus Hardness—Indenter
All wire types
P and Z specimens
Initially and after every 3rd cycle for (P) and every 4th for (Z)
All
Insulation Modulus Profiling
All wire types
P specimens
On bulk and after mid and final cycle on select conditions
Three per wire type in oven. One PVC and XETFE, two PI/PTFE and XPI, and three PI in humidity
Inherent Viscosity PI and PI/PTFE wire types
P specimens
On bulk and after midpoint and final aging cycles
Ten PI and ten PI/PTFE for ovens, no fluid exposures, and fifteen humidity
Insulation Cut-Through (dynamic and static)
All wire types
P specimens
Initially and after every 4th cycle and final
Twelve conditions for each wire type oven
Mass Loss/Kinetics by TGA
All wire types
P specimens
Initially and after midpoint and final cycles on select conditions
Three for oven and one for humidity
Weight Measurement All wire types
L specimens
Initially and after every 3rd cycle and final on select conditions
Ten for ovens, none for humidity
Density PVC/nylon P specimens
Initially and after midpoint and 8th and final for select conditions
Five for ovens and one for humidity
Oxidation Induction Time
All wire types
P specimens
Initially and after every 4th and final cycles on select conditions
Eight for ovens and all for humidity
WIDAS PI only Three test groups
Following aging Three for humidity and none for ovens
FTIR All wire types
Select P specimens
Initially and after sixth and final cycles
Four for ovens for each wire type
D-14
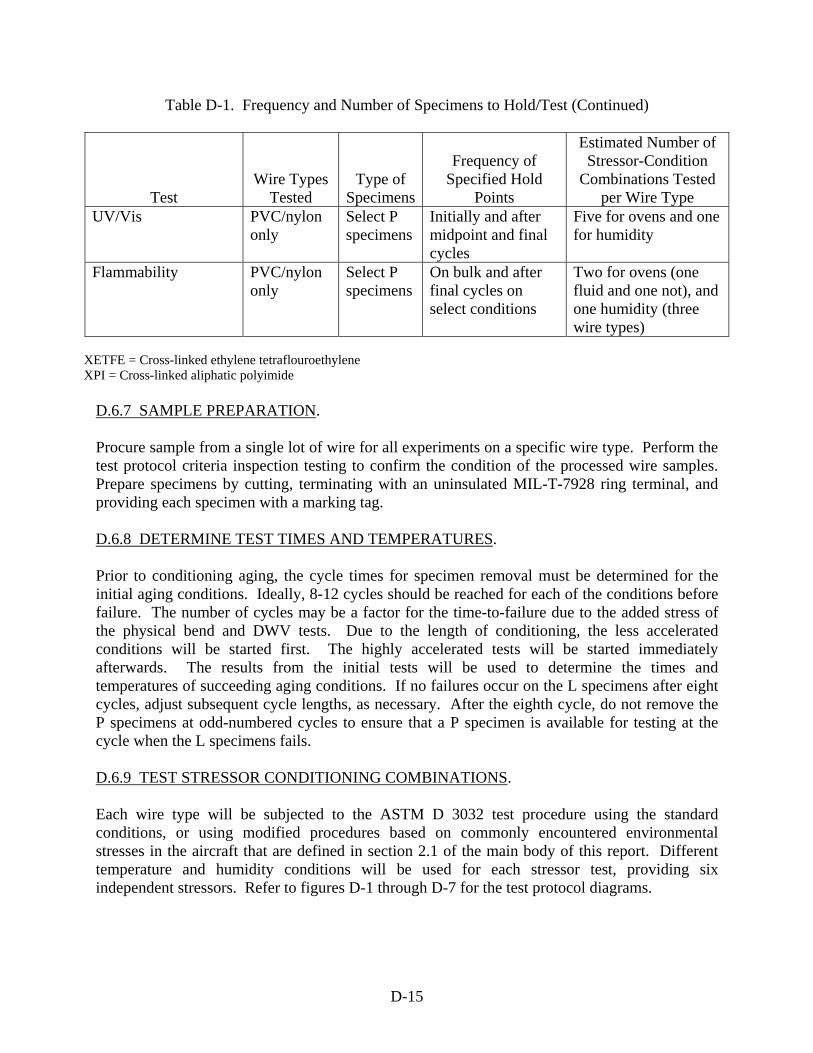
Table D-1. Frequency and Number of Specimens to Hold/Test (Continued)
Test Wire Types
Tested Type of
Specimens
Frequency of Specified Hold
Points
Estimated Number of Stressor-Condition
Combinations Tested per Wire Type
UV/Vis PVC/nylon only
Select P specimens
Initially and after midpoint and final cycles
Five for ovens and one for humidity
Flammability PVC/nylon only
Select P specimens
On bulk and after final cycles on select conditions
Two for ovens (one fluid and one not), and one humidity (three wire types)
XETFE = Cross-linked ethylene tetraflouroethylene XPI = Cross-linked aliphatic polyimide
D.6.7 SAMPLE PREPARATION. Procure sample from a single lot of wire for all experiments on a specific wire type. Perform the test protocol criteria inspection testing to confirm the condition of the processed wire samples. Prepare specimens by cutting, terminating with an uninsulated MIL-T-7928 ring terminal, and providing each specimen with a marking tag. D.6.8 DETERMINE TEST TIMES AND TEMPERATURES. Prior to conditioning aging, the cycle times for specimen removal must be determined for the initial aging conditions. Ideally, 8-12 cycles should be reached for each of the conditions before failure. The number of cycles may be a factor for the time-to-failure due to the added stress of the physical bend and DWV tests. Due to the length of conditioning, the less accelerated conditions will be started first. The highly accelerated tests will be started immediately afterwards. The results from the initial tests will be used to determine the times and temperatures of succeeding aging conditions. If no failures occur on the L specimens after eight cycles, adjust subsequent cycle lengths, as necessary. After the eighth cycle, do not remove the P specimens at odd-numbered cycles to ensure that a P specimen is available for testing at the cycle when the L specimens fails. D.6.9 TEST STRESSOR CONDITIONING COMBINATIONS. Each wire type will be subjected to the ASTM D 3032 test procedure using the standard conditions, or using modified procedures based on commonly encountered environmental stresses in the aircraft that are defined in section 2.1 of the main body of this report. Different temperature and humidity conditions will be used for each stressor test, providing six independent stressors. Refer to figures D-1 through D-7 for the test protocol diagrams.
D-15

The following is a list of test conditions associated with the protocols shown in figures D-1 through D-7. 1. Stressor 1, Conditions A, G, I—Nonstressed wire, temperature and humidity exposure
only. Specimens hang straight, periodic DWV testing 1500 volts for 1 minute (figure D-1).
2. Stressor 1, Condition A+—Nonstressed wire, temperature exposure only. Straight life (L+) specimens, DWV delayed (figure D-1).
3. Stressor 1, Condition B, D, H, J—Static strain (10 times), temperature and humidity exposure only. Periodic DWV testing (figure D-1).
4. Stressor 1, Condition C, E—Static strain (6 times or 1 time), temperature and humidity exposure only. Periodic DWV testing (figure D-1).
5. Stressor 2, Conditions A, G, I—Per ASTM D 3032 procedure. Specimens hang straight in an oven at specified temperature and humidity, perform dynamic bend periodically at each cycle across 10-times mandrel, twice up one direction and twice up the other direction, followed by DWV (figure D-2).
6. Stressor 2, Condition A+—Nonstressed wire, temperature exposure only. Straight life (L+) specimens, DWV delayed (figure D-2).
7. Stressor 2, Condition B, D, F, H, J—Per ASTM procedure, but specimens aged with 10-times static strain (figures D-2 and D-3).
8. Stressor 3, Condition A—Per ASTM procedure, except dynamic bend performed with a 3-times mandrel (figure D-4).
9. Stressor 3, Condition B—Per ASTM procedure, except dynamic bend performed with a 3-times mandrel and specimens aged with 10-times static strain (figure D-4).
10. Stressor 4, Condition A—Temperature shock performed on samples after each cycle of aging, then DWV. The temperature shock profile is 100 cycles of -55oC (12 minutes) to +85oC (12 minutes) (figure D-5).
11. Stressor 4, Condition B—Temperature shock performed on samples after each cycle of aging, then DWV. In addition, specimens aged with 10-times static strain (figure D-5).
12. Stressor 5, Condition A—Vibration performed on samples after each cycle of aging, then DWV (figure D-6).
13. Stressor 5, Condition B—Vibration performed on samples after each cycle of aging, then DWV. In addition, specimens aged with 10-times static strain (figure D-6).
D-16

D-17
14. Stressor 6, Condition A—Fluid exposure to one of three fluids, hydraulic fluid per SAE AS1241, exterior aircraft cleaner, and glycol-based deicing fluid. Exposure to be 1 hour at 50°C followed by aging. After aging, perform bend test and DWV, expose to the next fluid, then age for next cycle (figure D-7).
15. Stressor 6, Condition B—Fluid exposure as above, but with specimens aged with 10-times static strain (figure D-7).
D.6.10 FREQUENCY OF TESTS. The wire specimens will be removed at each cycle and subjected to the required stressors and monitoring tests. Not all monitoring tests are performed every cycle, but range from every cycle to once at the beginning and the end of the conditioning, as defined by the time at which the final L specimen fails DWV. D.6.11 TEMPERATURE AND HUMIDITY LEVELS. The temperature and humidity levels that will be used for testing each wire type are provided in table D-2 for the six different stressors. D.6.12 QUALITY ASSURANCE PLAN. The FAA aircraft wiring degradation study will be performed in accordance with a quality assurance (QA) program to ensure the results are of high quality, and that they are traceable and defensible. The QA program includes three elements: (1) description of the QA plan, (2) implementation of the QA plan, and (3) audits to ensure compliance with the QA plan. The QA program embraces the principles of performance-based independent assessments. This will ensure both QA compliance and feedback to program personnel to maintain program focus and provide high-quality results. The QA plan includes a variety of items, including the need for documented test procedures, defined and controlled documentation, calibration of test equipment, handling, storage and shipping of samples, audits, roles and responsibilities, and inspection testing to confirm the condition of wire samples received. The QA plan incorporates methods to assist with data validation within and across laboratories. Allowances are made to generate statistically relevant results for studying the aging characteristics of the wire specimens as they are subjected to various stressors and test procedures. To validate data across laboratories, some duplicate sampling and environmental conditioning will be performed at different sites.

Table D-2. Test Setup Matrix and Stressor—Conditioning Combinations 1/, 2/
CONDITIONS A/A+ B C 3/ D E 3/ F G H I J
0% RH-Ovens 70% RH
85%-25%RH,
Cycled 85% RH 100% RH
(Immersion)
WIRE TYPE STRESSORS Straight
10x Static Strain
6x/1x Static Strain
10x Static Strain
6x/1x Static Strain
10x Static Strain Straight
10x Static Strain Straight
10x Static Strain
PI 1. No stressor protocol (only DWV test) 260+, 280, 300+
260, 280, 300
300/300 95 95/95 95
PI 2. Dynamic bend (roll up/down x 2)—10-times mandrel (ASTM D 3032)
250+*,270, 280, 300+
250, 280, 300
70*, 95 70 95* 70, 95 95 45, 70, 95
PI 3. Dynamic bend (roll up/down x 2)— 3-times mandrel
250, 280, 300
280
PI 4. Temperature shock (100 cycles, -55° to +85°C)
260
PI 5. Vibration (abrasion) 260 PI 6. Fluid soak preceded by 10-times
mandrel bend 300 300
PI/PTFE 1. No stressor protocol (only DWV test) 260+, 280, 300+
260, 280, 300
PI/PTFE 2. Dynamic bend (roll up/down x 2)—10x mandrel (ASTM D 3032)
260+, 280, 300+
260, 280, 300
95 70, 95
PI/PTFE 3. Dynamic bend (roll up/down x 2)— 3-times mandrel
260, 280, 300
280
PI/PTFE 4. Temperature shock (100 cycles, -55° to +85° C)
260
PI/PTFE 5. Vibration (abrasion) 260 300 PI/PTFE 6. Fluid soak preceded by 10-times
mandrel bend 300 300
D-18

Table D-2. Test Setup Matrix and Stressor—Conditioning Combinations 1/, 2/ (Continued)
CONDITIONS A/A+ B C 3/ D E 3/ F G H I J
0% RH—Ovens 70% RH
85%-25%RH,
Cycled 85% RH 100% RH
(Immersion)
WIRE TYPE STRESSORS Straight
10x Static Strain
6x/1x Static Strain
10x Static Strain
6x/1x Static Strain
10x Static Strain Straight
10x Static Strain Straight
10x Static Strain
PVC/Nylon 1. No stressor protocol (only DWV test)
110+, 120, 130+
110, 120, 130
PVC/Nylon 2. Dynamic bend (roll up/down x 2)—10-times mandrel (ASTM D 3032)
110+, 120, 130, +
110, 120, 130
95
PVC/Nylon 3. Dynamic bend (roll up/down x 2)—3-times mandrel
110, 120, 130
130
PVC/Nylon 4. Temperature shock (100 cycles, -55° to +85°C)
110
PVC/Nylon 5. Vibration (abrasion) 110 PVC/Nylon 6. Fluid soak preceded by 10-times
mandrel bend 120 120
D-19
Notes: Shaded cells are the reference conditions to the ASTM D 3032 test method. * – These conditions are not expected to fail, but will be removed in one year and placed in the WIDAS test to failure. + – Condition A+ will be run at the temperatures identified with a superscript +. 1/ Letters in the Conditions columns for a particular stressor represent undetermined temperatures at which that combination will be run. Two and three digit
numbers represent actual temperatures in degrees centigrade (°C). 2/ A blank indicates that no testing will be performed in that condition. 3/ Half of the specimens in Conditions C and E will be 1-time static strained specimens, and half 6x strained specimens. 1x = 1-time static All temperatures in °C.

Ic. Weigh L specimens
Return remaining L/L+
specimens
Ie. DWV on L/(L+)
specimens 2/ & Visual Inspection
L/L+
Ig. Remove 1 P and 1 Z
specimens at specified
cycles
P, Z
Ia. Pretest as needed
Ib. Condition L/L+, P, Z
Id. Visual & DWV, wet IR, Indenter test &
Electrical Testing
If. Hold failed L/L+ specimens
Ih. Hold removed Z & P specimens
for distribution
Return remaining P and Z
specimens 1/ See test block descriptions for test frequencies. 2/ Test L+ after sixth L specimen fails.
Figure D-1. Test Protocol I—Stressor 1 and Conditions A, A+, B, C, D, E, and J 1/
D-20

BLOCK DESCRIPTIONS: TEST PROTOCOL I – STRESSOR 1 & CONDITIONS A, A+, B, C, D, E, and J Ia. Pretest. Pretest the specimens necessary to monitor the exact specimens throughout the aging conditioning process. Perform all testing to the appropriate test procedures.
• Initial Visual Inspection. • Weigh the life specimens of Condition A (low temp and high temp), B (low temp and high temp), C,
D, and E. • Perform the indenter test on the property specimens and control specimens. • Soak all specimens in the electrolyte solution for approximately 1 hour. • Perform the wet insulation resistance (IR) test on the electrical test property specimens. • Perform the wet DWV test on all specimens. Remove failures from the test program, mark and replace
with new specimens. Ib. Conditioning. Conditioning setup of specific temperature and humidity conditions. Condition 11 16-inch Life (L) specimens, 10-foot property (P & E) specimens, and 6 16-inch control (Z) specimens.
NOTE: For Condition A+, add 9 (L+) specimens (two temperatures for each wire type.) For Conditions B, C, D, E, and J, strain the specimens by wrapping around the respective size
mandrel prior to conditioning, then place the strained specimens into the conditioning chamber. The 1x mandrel wrap uses the wire itself as the mandrel (wrapback.)
For Condition J, use ten 18-inch L specimens, six 18-inch P specimens and four 16-inch Z specimens.
Ic. Cycle Testing Life (L) specimens. Following the time of an aging cycle (which must be determined when the test is begun), let the chamber cool to room temperature (approximately 40 minutes). Remove the life specimens.
• NOTE: For conditions A and B, at low temperature and high temperature aging, weigh L specimens after every 3rd aging cycle, following the appropriate test procedure.
Id. Cycle Testing Property (P), and Control (Z) specimens. Remove the property and control specimens.
• Visual inspection of the test specimens for signs of aging or other degradation. • Perform the Indenter test on P and Z specimens. • Soak and perform the DWV test on P and Z specimens every cycle. • Perform Wet IR every 2nd cycle and Electrical Testing (Dry IR, Dielectric Loss, TDR, and Conductor
Resistance) every 3rd cycle on the same 3 electrical P specimens. Ie. DWV proof testing and Visual Inspection. Soak all L specimens and perform the DWV test. Visually inspect the failed specimens for cracking or other aging conditions.
NOTE: For condition A+, following the failure of the 6th L specimen, subject the L+ specimens to the same number of bend and DWV applications (at one time) as the 6th failed L specimen. Test all remaining L+ specimens in the same manner as the L specimens from that point forth.
If. Failed Life Specimens. Remove the failed L/L+ specimens (by the DWV test) and return the remaining specimens to the chamber for the next cycle of conditioning. Ig. Separate Property (P) and Control (Z) Specimens. Remove 1 P specimen every 2nd cycle. Remove 1 Z specimen every 3rd cycle. Return remaining specimens to the chamber for the next cycle of conditioning. Ih. Hold Specimens. Hold the removed P and Z specimens for later distribution to the test laboratories based on the testing protocol, figure 7. Make all applicable changes from figure 1 and block description to other figures and block descriptions as applicable.
D-21

IIi. Hold removed Z & P specimens for distribution
IIh. Remove 1 P
and 1 Z specimens every 2nd
cycle
IIc. Weigh L specimens
Dynamic Bend on L/(L+) specimens
IIf. DWV L/(L+)
specimens 2/. Visual
Inspection
Return remaining L/L+
specimens
L/L+
Z IIe. Indenter test, DWV
IId. Dyn. Bend, Indenter test, wet
IR & DWV, Electrical Testing
P
IIa. Pretest as needed
IIb. Condition L/L+, P, Z
Return remaining P and Z
specimens
IIg. Hold Failed L/L+ specimens
1/ See test block descriptions for test frequencies. 2/ Test L+ after sixth L specimen fails.
Figure D-2. Test Protocol II—Stressor 2 and Conditions A, A+, B, D, F, G, H, I, and J 1/
D-22

BLOCK DESCRIPTIONS: TEST PROTOCOL II – STRESSOR 2 & CONDITIONS A, A+, B, D, F, G, H, I, and J IIa. Pretest. Pretest the specimens necessary to monitor the exact specimens throughout the aging conditioning process. Perform all testing to the appropriate test procedures.
• Initial Visual Inspection. • Weigh the life specimens for conditions A (low temp and high temp), B (low temp and high temp), and
D (low temp only). • Perform the indenter test on the property specimens and control specimens. • Soak all specimens in the electrolyte solution. • Perform the wet insulation resistance (IR) test on the 4 electrical test property specimens. • Perform the wet DWV test on all specimens. Remove the failures from the test program, mark and
replace with new specimens. IIb. Conditioning. Conditioning setup of specific temperature and humidity conditions. Condition 11 16-inch Life (L) specimens, 14 10-foot property (P) specimens, and 6 16-inch control (Z) specimens.
NOTE: For Condition A+, add 9 (L+) specimens (two temperatures for each wire type.) For Conditions B, C, D, E, H, and J strain the specimens by wrapping around the respective size
mandrel prior to conditioning, then place the strained specimens into the conditioning chamber. The 1x mandrel wrap uses the wire itself as the mandrel (wrapback.)
For Condition F, the conditioning setup is a cycling humidity at a set temperature. For Conditions I and J, use 10 18-inch L specimens, 6 18-inch P specimens and 4 16-inch Z
specimens. IIc. Cycle Testing Life (L) specimens. Following the time of an aging cycle (which must be determined when the test is begun), let the chamber cool to room temperature (approximately 40 minutes). Remove the L specimens.
• NOTE: For Conditions A and B, at low temperature and high temperature aging, weigh L specimens after every 3rd aging cycle, following the appropriate test procedure.
• Subject all L specimens to the bend test around a 10x mandrel IId. Cycle Testing Property (P) specimens. Remove the P specimens.
• Visual inspection of the test specimens for signs of aging or other degradation. • Perform the dynamic bend test on P specimens around a 10x mandrel. • Perform the indenter test. • Soak and perform the DWV test every cycle. • Perform Wet IR every 2nd cycle and Electrical Testing (Dry IR, Dielectric Loss, TDR, and Conductor
Resistance) every 3rd cycle on the same 3 electrical P specimens. IIe. Cycle Testing Control (Z) Specimens. Remove Z specimens.
• Perform the indenter test. • Soak and perform the DWV test every cycle.
IIf. DWV proof testing and Visual Inspection. Soak, then perform the DWV test on all L specimens every cycle. Visually inspect the failed specimens for cracking or other aging conditions.
NOTE: For condition A+, following the failure of the 6th L specimen, subject the L+ specimens to the same number of bend and DWV applications (at one time) as the 6th failed L specimen. Test all remaining L+ specimens in the same manner as the L specimens from that point forth.
IIg. Failed Life Specimens. Remove the failed L/L+ specimens (by DWV) and return remaining specimens to the chamber for the next cycle of conditioning. IIh. Separate Property (P) and Control (Z) Specimens. Remove 1 P specimen every 2nd cycle for the first 6 cycles, then remove 1 P specimen following each additional cycle thereafter. Remove 1 Z specimen every 2nd cycle. Return the remaining specimens to the chamber for the next cycle of conditioning. IIi. Hold Specimens. Hold the removed P and Z specimens for later distribution to the test laboratories based on testing protocol, figure 7.
D-23
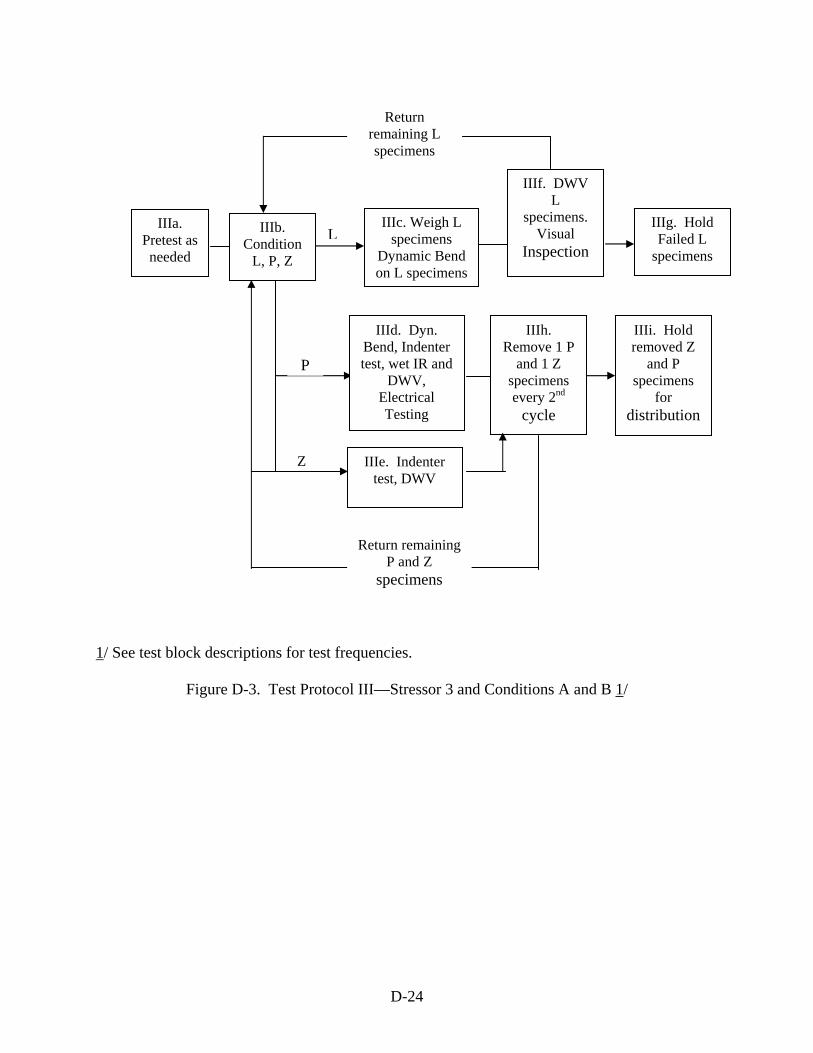
Z
IIIc. Weigh L specimens
Dynamic Bend on L specimens
IIIg. Hold Failed L
specimens
IIIf. DWV L
specimens. Visual
Inspection L
IIIa. Pretest as needed
Return remaining L specimens
IIIb. Condition
L, P, Z
IIId. Dyn. Bend, Indenter test, wet IR and
DWV, Electrical Testing
P
IIIi. Hold removed Z
and P specimens
for distribution
IIIh. Remove 1 P
and 1 Z specimens every 2nd
cycle
IIIe. Indenter test, DWV
Return remaining P and Z
specimens
1/ See test block descriptions for test frequencies.
Figure D-3. Test Protocol III—Stressor 3 and Conditions A and B 1/
D-24

BLOCK DESCRIPTIONS: TEST PROTOCOL III – STRESSOR 3 & CONDITIONS A and B IIIa. Pretest. Pretest the specimens necessary to monitor the exact specimens throughout the aging conditioning process. Perform all testing to the appropriate test procedures.
• Initial Visual Inspection. • Weigh the life (L) specimens for conditions A (middle temp), B. • Perform the indenter test on the property (P) specimens and control (Z) specimens. • Soak all specimens in the electrolyte solution. • Perform the wet insulation resistance (IR) test on the 4 electrical test P specimens. • Perform the wet DWV on all specimens. Remove the failures from the test program, mark and replace
with new specimens. IIIb. Conditioning. Conditioning setup of specific temperature and humidity conditions. Condition 11 16-inch Life (L) specimens, 14 10-foot property (P) specimens, and 6 16-inch control (Z) specimens.
NOTE: For Condition B strain the specimens by wrapping around the respective size mandrel prior to conditioning, and place the strained specimens into the conditioning chamber.
IIIc. Cycle Testing Life (L) specimens. Following the time of an aging cycle (which must be determined when the test is begun), let the chamber cool to room temperature (approximately 40 minutes). Remove the L specimens.
• NOTE: For Conditions A (middle temp only) and B, weigh L specimens after every 3rd aging cycle, following the appropriate test procedure.
• Subject all L specimens to the bend test around a 3x mandrel IIId. Cycle Testing Property (P) specimens. Remove the P specimens.
• Visual inspection of the test specimens for signs of aging or other degradation. • Perform the dynamic bend test on P specimens around a 3x mandrel. • Perform the indenter test. • Soak and perform the DWV test every cycle. • Perform Wet IR every 2nd cycle and Electrical Testing (Dry IR, Dielectric Loss, TDR, and Conductor
Resistance) every 3rd cycle on the same 3 electrical specimens. IIIe. Cycle Testing Control (Z) Specimens. Remove Z specimens.
• Perform the indenter test. • Soak and perform the DWV test every cycle.
IIIf. DWV proof testing and Visual Inspection. Soak, then perform the DWV test on all L specimens every cycle. Visually inspect the failed specimens for cracking or other aging conditions. IIIg. Failed Life (L) Specimens. Remove the failed L specimens (by DWV) and return the remaining specimens to the chamber for the next cycle of conditioning. IIIh. Separate Property (P) and Control (Z) Specimens. Remove 1 P specimen every 2nd cycle for the first 6 cycles, then remove 1 P specimen following each additional cycle thereafter. Remove 1 Z specimen every 2nd cycle. Return the remaining specimens to the chamber for the next cycle of conditioning. IIIi. Hold Specimens. Hold the removed P and Z specimens for later distribution to the test laboratories based on testing protocol, figure 7.
D-25

Return
remaining L specimens
IVc. Weigh L specimens
Thermal Shock
IVg. Hold Failed L
specimens
IVf. DWV L specimens
Visual Inspection
L
IVd. Thermal Shock, Indenter test, wet IR and
DWV, Electrical Testing
P
Return remaining P and Z
specimens
Z IVe. Indenter test, DWV
IVa. Pretest as needed
IVb. Condition
L, P, Z
IVi. Hold removed Z
and P specimens
for distribution
IVh. Remove 1 P
and 1 Z specimens every 2nd
cycle
1/ See test block descriptions for test frequencies.
Figure D-4. Test Protocol IV—Stressor 4 and Conditions A and B 1/
D-26

BLOCK DESCRIPTIONS: TEST PROTOCOL IV – STRESSOR 4 & CONDITIONS A and B IVa. Pretest. Pretest the specimens necessary to monitor the exact specimens throughout the aging conditioning process. Perform all testing to the appropriate test procedures.
• Initial Visual Inspection. • Weigh the life (L) specimens for conditions A, and B (middle temp only). • Perform the indenter test on the property (P) specimens and control (Z) specimens. • Soak all specimens in the electrolyte solution. • Perform the wet insulation resistance (IR) test on the 4 electrical test P specimens. • Perform the wet DWV test on all specimens. Remove the failures from the test program, mark and
replace with new specimens. IVb. Conditioning. Conditioning setup of specific temperature and humidity conditions. Condition 11 16-inch Life (L) specimens, 14 10-foot property (P) specimens, and 6 16-inch control (Z) specimens.
NOTE: For Condition B strain the specimens by wrapping around the respective size mandrel prior to conditioning, and place the strained specimens into the conditioning chamber.
IVc. Cycle Testing Life (L) specimens. Following the time of an aging cycle (which must be determined when the test is begun), let the chamber cool to room temperature (approximately 40 minutes). Remove the L specimens.
• NOTE: For Conditions A and B (middle temp only), weigh L specimens after every 3rd aging cycle, following the appropriate test procedure.
• Subject all L specimens to 100 Cycles of Thermal Shock. IVd. Cycle Testing Property (P) specimens. Remove the P specimens.
• Visual inspection of the test specimens for signs of aging or other degradation. • Subject all P specimens to 100 cycles of Thermal Shock. NOTE: subject all specimens to thermal
shock in groups. • Perform the indenter test. • Soak and perform the DWV test every cycle. • Perform Wet IR every 2nd cycle and Electrical Testing (Dry IR, Dielectric Loss, TDR, and Conductor
Resistance) every 3rd cycle on the same 3 electrical specimens. IVe. Cycle Testing Control (Z) Specimens. Remove Z specimens.
• Perform the indenter test. • Soak and perform the DWV test every cycle.
IVf. DWV proof testing and Visual Inspection. Soak, then perform the DWV test on all L specimens every cycle. Visually inspect the failed specimens for cracking or other aging conditions. IVg. Failed Life (L) Specimens. Remove the failed L specimens (by DWV) and return the remaining specimens to the chamber for the next cycle of conditioning. IVh. Separate Property (P) and Control (Z) Specimens. Remove 1 P specimen every 2nd cycle for the first 6 cycles, then remove 1 P specimen following each additional cycle thereafter. Remove 1 Z specimen every 2nd cycle. Return the remaining specimens to the chamber for the next cycle of conditioning. IVi. Hold Specimens. Hold the removed P and Z specimens for later distribution to the test laboratories based on testing protocol, figure 7.
D-27

Z Ve. Indenter test, DWV
Vc. Weigh L specimens Vibration
Vg. Hold Failed L
specimens
Vf. DWV L specimens
Visual Inspection
L
Vd. Vibration, Indenter test,
wet IR & DWV,
Electrical Testing
P
Va. Pretest as needed
Vb. Condition
L, P, Z
Return remaining P and Z
specimens
Vi. Hold removed Z
& P specimens
for distribution
Vh. Remove 1 P
and 1 Z specimens every 2nd
cycle
Return remaining L specimens
1/ See test block descriptions for test frequencies.
Figure D-5. Test Protocol V—Stressor 5 and Conditions A and B 1/
D-28

BLOCK DESCRIPTIONS: TEST PROTOCOL V – STRESSOR 5 & CONDITIONS A and B Va. Pretest. Pretest the specimens necessary to monitor the exact specimens throughout the aging conditioning process. Perform all testing to the appropriate test procedures.
• Initial Visual Inspection. • Weigh the life (L) specimens for conditions A (middle temp only) and B. • Perform the indenter test on the property (P) specimens and control (Z) specimens. • Soak all specimens in the electrolyte solution. • Perform the wet insulation resistance (IR) test on the 4 electrical test P specimens. • Perform the wet DWV test on all specimens. Remove the failures from the test program, mark and
replace with new specimens. Vb. Conditioning. Conditioning setup of specific temperature and humidity conditions. Condition 11 16-inch Life (L) specimens, 14 10-foot property (P) specimens, and 6 16-inch control (Z) specimens.
NOTE: For Condition B strain the specimens by wrapping around the respective size mandrel prior to conditioning, and place the strained specimens into the conditioning chamber.
Vc. Cycle Testing Life (L) specimens. Following the time of an aging cycle (which must be determined when the test is begun), let the chamber cool to room temperature (approximately 40 minutes). Remove the L specimens.
• NOTE: For Conditions A (middle temp only) and (B), weigh L specimens after every 3rd aging cycle, following the appropriate test procedure.
• Subject all L specimens to Vibration. Vd. Cycle Testing Property (P) specimens. Remove the P specimens.
• Visual inspection of the test specimens for signs of aging or other degradation. • Subject all P specimens to Vibration. NOTE: subject all specimens to vibration in groups. • Perform the indenter test. • Soak and perform the DWV test every cycle. • Perform Wet IR every 2nd cycle and Electrical Testing (Dry IR, Dielectric Loss, TDR, and Conductor
Resistance) every 3rd cycle on the same 3 electrical specimens. Ve. Cycle Testing Control (Z) Specimens. Remove Z specimens.
• Perform the indenter test. • Soak and perform the DWV test every cycle.
Vf. DWV proof testing and Visual Inspection. Soak, then perform the DWV test on all L specimens every cycle. Visually inspect the failed specimens for cracking or other aging conditions. Vg. Failed Life (L) Specimens. Remove the failed L specimens (by DWV) and return the remaining specimens to the chamber for the next cycle of conditioning. Vh. Separate Property (P) and Control (Z) Specimens. Remove 1 P specimen every 2nd cycle for the first 6 cycles, then remove 1 P specimen following each additional cycle thereafter. Remove 1 Z specimen every 2nd cycle. Return the remaining specimens to the chamber for the next cycle of conditioning. Vi. Hold Specimens. Hold the removed P and Z specimens for later distribution to the test laboratories based on testing protocol, figure 7.
D-29

L
Z
VIc. Condition L,
P, Z
VIg. Weigh and Hold Failed L
specimens
VIf. DWV L
specimens. Visual
Inspection
VId. Indenter test, wet IR &
DWV, Electrical Testing
P
VIh. Remove 1 P
and 1 Z specimen every 2nd
cycle
VIi. Hold removed Z & P specimens for distribution
VIb. Fluid Soak L and P specimens (using one
fluid) Drain
VIe. Indenter
test, DWV
Return Z specimens Return
remaining P specimens
VIa. Pretest as needed
Return remaining L specimens
1/ See test block descriptions for test frequencies.
Figure D-6. Test Protocol VI—Stressor 6 and Conditions A and B 1/
D-30

BLOCK DESCRIPTIONS: TEST PROTOCOL VI – STRESSOR 6 & CONDITIONS A and B VIa. Pretest. Pretest the specimens necessary to monitor the exact specimens throughout the aging conditioning process. Perform all testing to the appropriate test procedures.
• Initial Visual Inspection. • Weigh the life (L) specimens for conditions A and B. • Perform the indenter test on the property (P) specimens and control (Z) specimens. • Soak all specimens in the electrolyte solution. • Perform the wet insulation resistance (IR) test on the 4 electrical test P specimens. • Perform the wet DWV on all specimens. Remove failures from the test program, mark and replace
with new specimens. VIb. Fluid Soak. Subject all L and P specimens to Fluid Soak for 1 hour at 50°C. Soak using fluid number 1. After the first aging cycle, soak in fluid number 2. After the second aging cycle, soak in fluid number 3. Continue this rotation through each set of three cycles, until test endpoint.
• NOTE: For Condition B strain the specimens by wrapping around the respective size mandrel prior to the fluid soak. Place the strained specimens into the fluid soak and the conditioning chamber.
VIc. Conditioning. Conditioning setup of specific temperature and humidity conditions. Condition 11 16-inch Life (L) specimens, 14 10-foot property (P) specimens, and 6 16-inch control (Z) specimens. VId. Cycle Testing Property (P) specimens. Remove the P specimens.
• Visual inspection of the test specimens for signs of aging or other degradation. • Perform indenter test. • Soak and perform DWV every cycle. • Perform Wet IR every 2nd cycle and Electrical Testing (Dry IR, Dielectric Loss, TDR, and Conductor
Resistance) every 3rd cycle on the same 3 electrical specimens. VIe. Cycle Testing Control (Z) Specimens. Remove Z specimens.
• Perform indenter test. • Soak and perform DWV every cycle.
VIf. DWV proof testing and Visual Inspection. Remove L specimens. Soak, then perform DWV test on all L specimens every cycle. Visually inspect failed specimens for cracking or other aging conditions. VIg. Failed Life (L) Specimens. Remove failed L specimens (by DWV) and weigh. Return remaining specimens to Block VIb for the next cycle of fluid soak and conditioning. VIh. Separate Property (P) and Control (Z) Specimens. Remove 1 P specimen every 2nd cycle for the first 6 cycles, then remove 1 P specimen following each additional cycle thereafter. Remove 1 Z specimen every 2nd cycle. Return remaining P specimens to Block VIb for the next cycle of fluid soak and conditioning. Do not perform fluid soak on Z specimens. Return remaining Z specimens directly to the chamber for conditioning only. VIi. Hold Specimens. Hold removed P and Z specimens for later distribution to the test laboratories based on testing protocol, figure 7.
D-31

VIIf. LAB 4 Inherent Viscosity Static Cut-Through
VIIc. LAB 1 Insulation Tensile and Elongation Inherent Viscosity Dynamic Cut-through TGA Flammability Conductor Tensile and Elongation
VIId. LAB 2 Modulus Profiling FTIR Spectroscopy Microscopic Inspection UV/Vis Spectroscopy Insulation Tensile & Elongation Density
VIIe. LAB 3 Oxidation Induction Time Terahertz IR (dry) Dielectric Loss TDR Functional Performance Conductor Resistance
VIIa. Cut Virgin
Samples
VIIb. Cut P Specimens
Figure D-7. Testing Protocol for Property Tests BLOCK DESCRIPTION: VIIa. Send appropriate amount of wire from each wire type to be studied for each laboratory to perform needed studies. VIIg. Cut and distribute the 10 foot property specimens to each laboratory. Quantity for each laboratory is dependent on the specific tests to be run (not shown on figure). VIIb. Through VIIf. Each laboratory will perform the work which has been determined by the test protocol and the capabilities of each laboratory.
D-32

APPENDIX E—QUALITY PLAN
E-1

Report No. AWD-QA-001A
Federal Aviation Administration Aircraft Wiring Degradation Program
Project No. 50-01-161
Quality Assurance Plan
December 17, 2002
Program Prime Contractor: Raytheon Technical Services Company
Indianapolis, Indiana
Program Sponsor: Airworthiness Assurance Research & Development Branch
Federal Aviation Administration U.S. Department of Transportation

ii
Review and Approvals
This document defines the provisions of a quality assurance (QA) plan for the aircraft wiring degradation (AWD) program being sponsored by the Federal Aviation Administration (FAA), at the William J. Hughes Technical Center in Atlantic City, New Jersey. This QA plan will be used by a technical team assembled by the FAA to examine factors that cause degradation, and to assist in establishing techniques to predict the wire’s ability to safely transfer electrical current under specified conditions. The technical team consists of scientists, engineers, and technicians with supporting experts from laboratories located at various geographical locations. Selected test laboratories will conduct testing and analysis of various wire specimens as part of the AWD program in accordance with these quality provisions.
Reviewed by: ______________________________________ Date: _______________
Joseph Kurek Raytheon Technical Services Company (RTSC)
Approved by: ______________________________________ Date: _______________ Robert Pappas
Federal Aviation Administration, Atlantic City

iii
Table Of Contents
Review and Approvals....................................................................................................................... ii
Table Of Contents ............................................................................................................................ iii
Foreword ...........................................................................................................................................v
Acronyms..........................................................................................................................................vi
1. Organization ............................................................................................................................. 1
1.1 Purpose ............................................................................................................................ 1 1.2 Scope ............................................................................................................................... 1 1.3 Responsibility ................................................................................................................... 1 1.4 Requirements ................................................................................................................... 1
2 Quality Assurance Program ..................................................................................................... 4
2.1 Purpose ............................................................................................................................ 4 2.2 Scope ............................................................................................................................... 4 2.3 Responsibilities ................................................................................................................ 4 2.4 Requirements ................................................................................................................... 4
3. Procurement and Control of Purchased Materials, Equipment and Services ......................... 5
3.1 Purpose ............................................................................................................................ 5 3.2 Scope ............................................................................................................................... 5 3.3 Responsibilities ................................................................................................................ 5 3.4 Requirements ................................................................................................................... 5
4. Development and Use of Procedures...................................................................................... 6
4.1 Purpose ............................................................................................................................ 6 4.2 Scope ............................................................................................................................... 6 4.3 Responsibilities ................................................................................................................ 6 4.4 Requirements ................................................................................................................... 6
4.4.1 Procedure Types ...................................................................................................... 6 4.4.2 Procedure Labeling .................................................................................................. 6 4.4.3 Procedure Development .......................................................................................... 7 4.4.4 Procedure Modification............................................................................................. 7
5. Generation and Control of Quality-Related Documents .......................................................... 9
5.1 Purpose ............................................................................................................................ 9 5.2 Scope ............................................................................................................................... 9 5.3 Responsibilities ................................................................................................................ 9 5.4 Requirements ................................................................................................................... 9
5.4.1 General Document Control Requirements............................................................... 9 5.4.2 Procedure Control .................................................................................................. 10 5.4.3 Test Data Control ................................................................................................... 10

iv
6. Preparation, Identification and Control of Test Specimens ................................................... 11
6.1 Purpose .......................................................................................................................... 11 6.2 Scope ............................................................................................................................. 11 6.3 Responsibilities .............................................................................................................. 11 6.4 Requirements ................................................................................................................. 11
6.4.1 Test Specimen Preparation.................................................................................... 11 6.4.2 Test Specimen Identification .................................................................................. 11 6.4.3 Test Specimen Control........................................................................................... 12
7. Performance of Inspections During Testing .......................................................................... 13
7.1 Purpose .......................................................................................................................... 13 7.2 Scope ............................................................................................................................. 13 7.3 Responsibilities .............................................................................................................. 13 7.4 Requirements ................................................................................................................. 13
7.4.1 Performance of Inspections ................................................................................... 13 7.4.2 Required Inspections ............................................................................................. 14
8. Control of Test Activities ........................................................................................................ 15
8.1 Purpose .......................................................................................................................... 15 8.2 Scope ............................................................................................................................. 15 8.3 Responsibilities .............................................................................................................. 15 8.4 Requirements ................................................................................................................. 15
9. Control Of Measuring And Test Equipment ........................................................................... 17
9.1 Purpose .......................................................................................................................... 17 9.2 Scope ............................................................................................................................. 17 9.3 Responsibilities .............................................................................................................. 17
10. Handling, Storage, And Shipping of Test Specimens ....................................................... 18
10.1 Purpose .......................................................................................................................... 18 10.2 Scope ............................................................................................................................. 18 10.3 Responsibilities .............................................................................................................. 18 10.4 Requirements ................................................................................................................. 18
11. Non-Conforming Items, Services, and Activities................................................................ 19
11.1 Purpose .......................................................................................................................... 19 11.2 Scope ............................................................................................................................. 19 11.3 Responsibilities .............................................................................................................. 19 11.4 Requirements ................................................................................................................. 19
12. Internal Audits..................................................................................................................... 20
12.1 Purpose .......................................................................................................................... 20 12.2 Scope ............................................................................................................................. 20 12.3 Responsibilities .............................................................................................................. 20 12.4 Requirements ................................................................................................................. 20

v
Foreword
The continued safe operation of aircraft well into their expected service life depends on the safe and effective transfer of power and electrical signals between aircraft electrical components and equipment. This in turn requires the enduring physical integrity of electrical wire and cable, and wire insulation. Recently there have been concerns that wire insulation on older aircraft may be degraded to the point that it is no longer capable of ensuring the effective and safe transfer of electrical current. Based on the results of the Federal Aviation Administration (FAA) intrusive inspection of older aircraft, wire was found degraded in some aircraft locations and not in others. The FAA has requested the Raytheon Technical Services Company (RTSC) at Indianapolis, Indiana, to lead a technical team of wiring experts to develop a test protocol(s) to study the aging characteristics that address concerns regarding aircraft wire. Developing the test protocol(s) is considered as part of Phase I of a three-part program to study aircraft wire degradation. Phase II is implementation of the test protocol(s) by various geographically located test laboratories. Phase III is the evaluation of the data generated by the test protocol(s), and preparation of a final report. The purpose of this program is to determine the factors that cause insulated wire to degrade, and to establish, if possible, a predictive technique to determine wire performance at various times in the life of the aircraft, when subjected to certain known conditions that cause degradation relative to the original wire specifications. The technical team members will include experts from various laboratories around the country. The team will develop the test protocol(s) and carry out tests on various wire specimens to obtain data on wire degradation. These data will be analyzed to characterize the degradation of aircraft wiring due to aging. A final report will be prepared for use by the FAA based on the results of this testing. This quality assurance (QA) plan identifies the practices and procedures to be followed to ensure that the test protocol(s) are performed accurately, and the tests are repeatable regardless of laboratory location. The QA plan is not intended to replace an existing laboratory quality control system, but to supplement the laboratory’s quality program with the unique characteristics required by the Aircraft Wiring Degradation (AWD) program. The QA plan does require a minimum quality control standard for participating laboratories. The QA plan embraces the principles of independent reviews by requiring certification and internal audit reports for the requirements specified herein.

vi
Acronyms AWD ...................................................................................................... Aircraft Wiring Degradation BNL................................................................................................Brookhaven National Laboratory FAA..................................................................................................Federal Aviation Administration FAA-AWD...........................................Federal Aviation Administration Aircraft Wiring Degradation POC......................................................................................................................... Point of Contact PQAR .......................................................................... Program Quality Assurance Representative QA.........................................................................................................................Quality Assurance QAR............................................................................................ Quality Assurance Representative RTSC................................................................................. Raytheon Technical Services Company SNL..................................................................................................... Sandia National Laboratories

AWD-QA-001A 12/17/2002
Page 1
1. Organization 1.1 Purpose This section defines the organization of the technical team responsible for the quality control of the Federal Aviation Administration (FAA) Aircraft Wiring Degradation (AWD) program. 1.2 Scope The provisions of this section are applicable to all quality aspects of the FAA-AWD program. 1.3 Responsibility Figure 1 details the organization of the technical team and their interfaces. The FAA-AWD program manager at the lead laboratory shall be responsible for managing the team in support of FAA requirements, and for ensuring that quality results are obtained. A Program Quality Assurance Representative (PQAR) shall be designated by the FAA-AWD program manager and shall be responsible for overseeing the implementation of the provisions in this QA plan. Each test laboratory shall designate a point of contact (POC) responsible for the performance of the test protocol(s) and the quality of the results in accordance with this plan. The test laboratory shall provide the FAA-AWD program manager with the POC name, telephone, and E-mail address as well as any changes in the POC during the test program. The POC may designate a quality assurance person to assist in this effort. The POC at each laboratory shall interface directly with the FAA-AWD program manger or his designee on programmatic issues. More laboratories than depicted in the figure may be included based on test protocol needs. The POC at each test laboratory shall be responsible for identifying the laboratory Quality Assurance Representative (QAR) with the appropriate experience or training to perform internal audits at their facility. The PQAR shall be notified as to who has been identified. The QAR at each test laboratory shall interface directly with the PQAR. 1.4 Requirements
• The FAA-AWD program manager, or his designee, shall determine what technical organizations or types of experts will be included on the technical team.
• A PQAR shall oversee the implementation of the provisions in this QA plan and verify that all quality-related requirements are performed in accordance with these provisions. The PQAR shall interface directly with the FAA.
• Each test laboratory QAR shall provide a statement to the PQAR certifying that their test facility meets the requirements specified in this QA plan.
• A test laboratory may use a subcontracted laboratory provided sufficient oversight is provided to ensure compliance to this plan, and an audit is performed by the contracting organization.

AWD-QA-001A 12/17/2002
Page 2
• All communication between laboratories shall include a copy to the FAA-AWD program manager in the form of e-mails, teleconferences, letters, etc.
• The FAA-AWD program manager, or his designee, will receive direction and perform as the team interface with the FAA.

Test
Labo
rato
ry 1
P
OC
/QA
R
Test
Labo
rato
ry 2
P
OC
/QA
R
Test
Labo
rato
ry 3
P
OC
/QA
R
Test
Labo
rato
ry 4
P
OC
/QA
R
Fede
ral A
viati
on A
dm
inis
trati
on
A
tlantic C
ity
Lead L
ab
ora
tory
F
AA
-AW
D P
rogra
m M
ana
ger
Technic
al E
xpe
rts
Pro
gra
m Q
ualit
y
Assura
nce
Rep
resenta
tive
(P
QA
R)
FA
A-A
WD
= F
edera
l Avia
tion A
dm
inis
tratio
n A
ircr
aft W
irin
g D
egra
datio
n
P
OC
= P
oin
t of
Cont
act
PQ
AR
= P
rogra
m Q
uality A
ssu
rance
Repr
esen
tativ
e Q
AR
= Q
ualit
y A
ssura
nce R
epre
senta
tive
Fig
ure
1 A
ircra
ft W
irin
g D
eg
rad
ati
on
Pro
gra
m T
ech
nic
al T
eam
Org
an
izati
on
al C
hart

AWD-QA-001A 12/17/2002
Page 4
2 Quality Assurance Program 2.1 Purpose This section establishes the requirement and assigns responsibility for the development and implementation of a QA program meeting the intent of a nationally recognized QA standard that will govern the performance of all quality-related test activities. This section also defines the elements of the QA program and describes how they will be administered.
2.2 Scope The QA program shall be applied to all quality-related tests and research activities associated with the FAA-AWD program. 2.3 Responsibilities The PQAR appointed by the FAA-AWD program manager is responsible for ensuring that a QA plan is developed and implemented, including the necessary controls and procedures. The POC at each test laboratory is responsible for developing and implementing site-specific controls and procedures needed at their laboratory to ensure that the QA requirements specified in this QA plan are met at their laboratory. 2.4 Requirements
• The QA program shall consist of the following three elements:
− A QA plan (this document),
− A procedure, for each conditioning exposure and performance measurement, for implementing the requirements of the QA plan, and
− Periodic internal audits to ensure compliance with the QA plan.
• Each test laboratory must meet the requirements specified in this QA plan for ensuring high quality test results.
• Each test laboratory shall perform an internal audit (see section 12) to verify compliance with these requirements, and shall submit documentation to the PQAR certifying that these requirements are met prior to the initiation of any testing at that laboratory.

AWD-QA-001A 12/17/2002
Page 5
3. Procurement and Control of Purchased Materials, Equipment and Services 3.1 Purpose This section establishes the requirements and assigns responsibility for the procurement and control of purchased material, equipment, and services for the FAA-AWD program. 3.2 Scope The requirements of this section are applicable to all quality-related materials, equipment, and services procured for the FAA-AWD program. Specific items included are:
• Procurement of wire for test specimens,
• Procurement of any special test equipment or instrumentation
• Procurement of testing services
• Procurement of test materials (e.g., fluids) Disposable materials and supplies, as well as materials, equipment, and services for the benefit of, or specific to one test laboratory (e.g., calibration services) shall be controlled by the existing procurement process at that test laboratory. 3.3 Responsibilities The FAA-AWD program manager, or his designee, shall be responsible for the procurement of all quality-related materials, equipment, and services for the FAA-AWD program. Existing procurement controls and procedures at the program manager’s organization will be used. 3.4 Requirements
• The FAA-AWD program manager, or his designee, shall procure all test samples, instrumentation, and services required for performing the wire degradation program. The lead laboratory will provide support in accordance with the organization’s documented procurement procedures, and the FAA contract.
• The FAA-AWD program manager, or his designee, shall procure the samples for the Phase II test program as part of the Phase I program.
• Disposition of all instrumentation procured for this program shall be determined by FAA.
• Disposition of all samples, tested and untested, shall be determined by the FAA.
• Disposition of all test fixtures procured or developed for the program shall be determined by the FAA.
• Disposable materials needed to perform the Phase II protocols shall be procured by each laboratory in accordance with the organization’s documented procurement procedures.

AWD-QA-001A 12/17/2002
Page 6
4. Development and Use of Procedures 4.1 Purpose This section establishes requirements and assigns responsibility to ensure that quality-related program activities will be performed in accordance with approved procedures. The process for developing and modifying the procedures is also defined in this section. 4.2 Scope The requirements of this section are applicable to all quality-related program activities. Specific activities include, but are not limited to:
• Preparation of test specimens,
• Handling, storage and shipping of test specimens,
• Accelerated aging of test specimens,
• Performance and materials testing of test specimens, and
• Quality assurance administrative activities 4.3 Responsibilities The FAA-AWD program manager, or his designee, shall be responsible for identifying the need for, assigning staff to develop, reviewing, approving, and issuing test procedures, as necessary, to perform quality-related program activities. The FAA-AWD program manager shall designate one organization as the central tracking facility. This organization shall be responsible for developing and maintaining a master list of all program procedures. The POC at each test laboratory shall be responsible for ensuring that the correct and latest revision of the test procedures is used at their test laboratory. 4.4 Requirements 4.4.1 Procedure Types The following types of procedures shall be developed for quality-related program activities prior to initiation of testing:
• Test specimen test procedures (AWD-TP-XXXR series)
• Test specimen handling procedures (AWD-HP-XXXR series)
• QA Administrative Procedures (AWD-QA-XXXR series) 4.4.2 Procedure Labeling
• Each procedure in the series shall be assigned a control number starting with 001 for the first procedure, increasing consecutively for subsequent procedures, preceded by the series label designators noted in the above paragraph.

AWD-QA-001A 12/17/2002
Page 7
• For test procedures only, the assigned control numbers will start with a series number beginning with “1XX” for environmental test procedures, “2XX” for physical/mechanical test procedures, “3XX” for electrical test procedures, and “4XX” for miscellaneous test procedures.
• Each procedure shall include a date and, if revised, a revision letter starting with “A” placed at the end of the control number for the first revision and increasing consecutively for subsequent revisions.
4.4.3 Procedure Development
• The FAA-AWD program manager shall identify the need for a procedure and assign an organization to develop the procedure. Once a draft is completed, all appropriate test laboratories shall review it and a copy submitted to the FAA.
• Each test procedure shall include sufficient detail to permit duplicate testing at various laboratory locations, unless the procedure is proprietary and is performed at only one laboratory.
• Proprietary test procedures shall not be developed using FAA funding, but may be used for the test program. A general procedure that can be made publicly available shall be developed based upon each proprietary procedure.
• The FAA-AWD program manager, or his designee, shall approve the procedure once all comments have been dispositioned, and the procedure shall then be distributed to the appropriate test laboratories and the FAA.
• Procedures shall be prepared, reviewed, approved, and distributed prior to commencement of the activity controlled by the individual procedure.
• A master list of all program procedures shall be developed and maintained to document the latest revisions to each procedure. The lead laboratory shall make the master list readily available to all test laboratories. The master list shall include the following information for each procedure: o Control number o Title o Latest revision letter (i.e. A, B, C, etc) and date o Originating organization
4.4.4 Procedure Modification
• Each laboratory shall have a documented process for changing test procedures with a POC approval requirement.
• Modifications to a procedure that is used exclusively by one test laboratory shall be made by notifying the test laboratory POC and redlining the affected procedure. Once the changes are prepared, the central tracking facility shall be notified to update the master list with a new procedure revision letter. Work can continue using the redlined procedure until a formal revision to the document is generated. The modified test procedure shall be issued for review and approval within 14 calendar days after the revision letter has been assigned.
• When a change to a test procedure requires a one-time modification to permit testing to continue, the laboratory POC shall request the FAA-AWD program manager or his designee to concur on the change, and the change shall be recorded on the test

AWD-QA-001A 12/17/2002
Page 8
procedure data sheet.
• Modifications to a procedure that is used by more than one test laboratory shall be made by notifying the FAA-AWD program manager and all test laboratories using the procedure. Once concurrence is obtained, the modifications shall be redlined into the affected procedure, and the central tracking facility will be notified to update the master list with a new procedure revision letter and submit a copy to the FAA. Work can continue using the redlined procedure until a formal revision to the document is generated. The modified test procedure shall be issued for review and approval within 14 calendar days after the revision letter has been assigned.

AWD-QA-001A 12/17/2002
Page 9
5. Generation and Control of Quality-Related Documents 5.1 Purpose This section establishes the requirements and assigns responsibility for generating and controlling quality-related documents, including the implementation of a document control system, for all quality-related FAA-AWD program documents, data, and results. 5.2 Scope The provisions of this section are applicable to all quality-related FAA-AWD program documents, including:
• Test procedures,
• Test plans and flow charts,
• Test schedules,
• Test data sheets, and
• Program reports 5.3 Responsibilities The FAA-AWD program manager, or his designee, shall be responsible for developing and implementing an effective document control system. The PQAR shall verify correct implementation of this system, as deemed necessary. The POC at each test laboratory shall be responsible for ensuring that the requirements of this section are met at their facility. 5.4 Requirements 5.4.1 General Document Control Requirements
• All quality-related documents shall be controlled to ensure that current and applicable documents are available. The control of documents and revisions thereto shall have provisions to preclude the possibility of using outdated or inappropriate documents.
• All completed quality-related documents (i.e. work instructions, data sheets, etc) shall be stored in a secure location with controlled access to prevent inadvertent loss, tampering, or damage to the document. Completed documents shall be stored at the originating organization.
• Each completed data sheet shall contain, as a minimum, the protocol test block number, the test procedure control number and revision, the date when data were recorded, the specimen identification number(s), the name and signature of the tester, the test equipment type with serial number, and calibration information.
• All quality-related program documents shall be completed in their entirety with any blanks labeled “Not Applicable” to indicate that no data were inadvertently omitted.
• Each completed data sheet shall be legible, hand written using indelible ink, and stored in a secure location with controlled access at all times except when being completed as part of the test program. Automated test data collection generated by the test equipment will
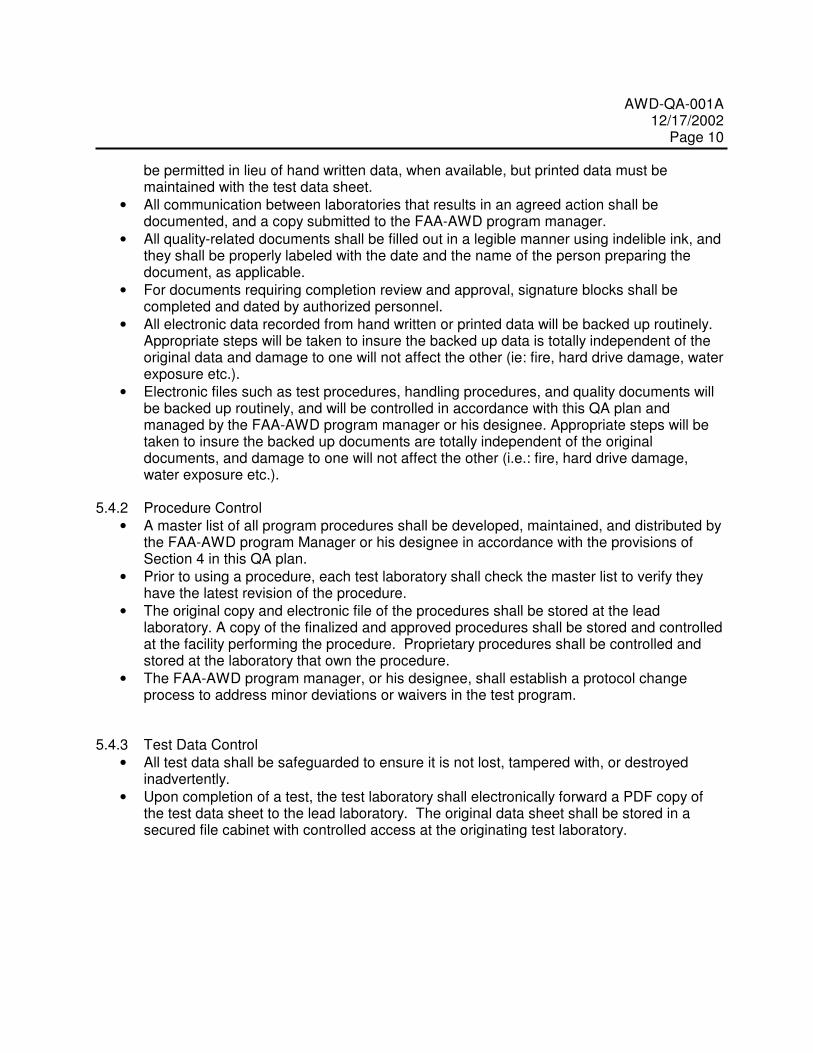
AWD-QA-001A 12/17/2002
Page 10
be permitted in lieu of hand written data, when available, but printed data must be maintained with the test data sheet.
• All communication between laboratories that results in an agreed action shall be documented, and a copy submitted to the FAA-AWD program manager.
• All quality-related documents shall be filled out in a legible manner using indelible ink, and they shall be properly labeled with the date and the name of the person preparing the document, as applicable.
• For documents requiring completion review and approval, signature blocks shall be completed and dated by authorized personnel.
• All electronic data recorded from hand written or printed data will be backed up routinely. Appropriate steps will be taken to insure the backed up data is totally independent of the original data and damage to one will not affect the other (ie: fire, hard drive damage, water exposure etc.).
• Electronic files such as test procedures, handling procedures, and quality documents will be backed up routinely, and will be controlled in accordance with this QA plan and managed by the FAA-AWD program manager or his designee. Appropriate steps will be taken to insure the backed up documents are totally independent of the original documents, and damage to one will not affect the other (i.e.: fire, hard drive damage, water exposure etc.).
5.4.2 Procedure Control
• A master list of all program procedures shall be developed, maintained, and distributed by the FAA-AWD program Manager or his designee in accordance with the provisions of Section 4 in this QA plan.
• Prior to using a procedure, each test laboratory shall check the master list to verify they have the latest revision of the procedure.
• The original copy and electronic file of the procedures shall be stored at the lead laboratory. A copy of the finalized and approved procedures shall be stored and controlled at the facility performing the procedure. Proprietary procedures shall be controlled and stored at the laboratory that own the procedure.
• The FAA-AWD program manager, or his designee, shall establish a protocol change process to address minor deviations or waivers in the test program.
5.4.3 Test Data Control
• All test data shall be safeguarded to ensure it is not lost, tampered with, or destroyed inadvertently.
• Upon completion of a test, the test laboratory shall electronically forward a PDF copy of the test data sheet to the lead laboratory. The original data sheet shall be stored in a secured file cabinet with controlled access at the originating test laboratory.

AWD-QA-001A 12/17/2002
Page 11
6. Preparation, Identification and Control of Test Specimens 6.1 Purpose This section establishes requirements and assigns responsibility for developing and implementing a system for preparing, uniquely identifying and labeling, and tracking all test specimens throughout the test process. 6.2 Scope The provisions of this section are applicable to all wire test specimens that can impact the quality of results in the FAA-AWD program. 6.3 Responsibilities The FAA-AWD program manager, or his designee, shall be responsible for developing and implementing an effective identification and control system for all wire test specimens. The FAA-AWD program manager, or his designee, shall be responsible for preparing and labeling all wire test specimens, and distributing them to the various other test laboratories. The FAA-AWD program manager or his designee shall be responsible for developing and maintaining a database for tracking all wire test specimens during the program based on information received from the individual test laboratories. 6.4 Requirements 6.4.1 Test Specimen Preparation
• Preparation of all test specimens shall be in accordance with the appropriate procedure identified in the master procedure list.
• Test specimens shall be packaged and shipped in accordance with the appropriate procedure identified in the master procedure list to ensure they are not damaged during shipping.
• Any damage to test specimens shall be documented. The FAA-AWD program manager or his designee shall determine if the specimen can be subjected to further testing, replaced, or removed from the program.
6.4.2 Test Specimen Identification
• The lead laboratory shall establish a specimen identification control document to be used by all laboratories.
• A system shall be developed and implemented to ensure that all test specimens used in the performance of this program that could affect the quality of the research results are properly and uniquely identified and controlled.
• The identification system shall allow for traceability of each test specimen back to the original source. Each test specimen shall be labeled with a unique identification number. Each unique number will represent all aspects of the wire specimen, such as the source

AWD-QA-001A 12/17/2002
Page 12
of supply, wire sample serial number, and length of the specimen. The specimen numbers shall be sequential in order to help identify a perturbation caused by inconsistencies in the wire sample production process.
• The assigned identification number shall be affixed to the test specimen. The identification mark shall be readable after all test exposure. When a test sample is dissected for specific measurement(s), the sections of the specimen(s) shall be individually bagged. The bag shall be identified with the test block designator used for that measurement being performed, and the original specimen number.
6.4.3 Test Specimen Control
• A database shall be developed and maintained to allow tracking of each wire test specimen and to accurately ascertain the status of each test performed on the specimen.
• Test specimen data from completed tests, or the status of ongoing tests, shall be reported to the lead laboratory by each test laboratory at least once per month to allow timely updating of the tracking database.

AWD-QA-001A 12/17/2002
Page 13
7. Performance of Inspections During Testing 7.1 Purpose This section establishes the requirements and assigns responsibility for any inspections to be performed during testing to ensure conformance to specified requirements or determine test specimen condition. 7.2 Scope The provisions of this section are applicable to all inspections of quality-related items and services for the FAA-AWD program. 7.3 Responsibilities The FAA-AWD program manager, or his designee, shall be responsible for developing and implementing an effective inspection program. The PQAR shall periodically verify its correct implementation by audits (see section 12). The POC, or designee, of the test laboratory performing the inspections shall be responsible for following any applicable inspection procedures or instructions, and for approving any unusual observations. 7.4 Requirements 7.4.1 Performance of Inspections
• Any damage to test specimens shall be documented. The POC shall request the FAA-AWD program manager or his designee to determine if the specimen can be subjected to further testing, replaced, or removed from the program.
• Inspection personnel shall be knowledgeable and experienced in the assigned inspection tasks.
• If mandatory inspection points are specified in the test plan, work shall not proceed until the inspection is completed. If any unusual observations are observed, the next step in the test protocol cannot begin until the laboratory POC makes a disposition on the observation and authorizes testing to continue. The POC will notify the FAA-AWD program manager in a timely manner of the observation and actions taken. Consent to waive any designated hold points in a procedure must be obtained from the FAA-AWD program manager, and shall be documented. The procedure modification process in Section 4.4.4 of this QA plan shall be followed when it is determined that a procedure must be permanently revised to delete a hold point(s).
• Inspection instructions or procedures, shall be developed, as directed by the FAA-AWD program manager, and shall include specific guidance on characteristics to be inspected, acceptable methods of inspection, and acceptance criteria.
• The FAA shall be notified by the FAA-AWD program manager or his designee of any discrepancies and schedule delays.

AWD-QA-001A 12/17/2002
Page 14
7.4.2 Required Inspections
• Prior to shipping any test specimens, a pre-shipping visual inspection shall be performed to document the condition of the test specimens. The pre-shipping visual inspection shall be performed in accordance with the appropriate procedure identified in the master procedure list.
• Upon receipt of any shipment of test specimens, a receipt visual inspection shall be performed by the receiving organization to document the as-received condition of the test specimens. The results shall be compared to the pre-shipping condition to verify that no damage has occurred during shipping. The receipt visual inspection shall be performed in accordance with the appropriate procedure identified in the master procedure list.
• Special inspections at hold points during the testing process will be identified in the specific test plans.

AWD-QA-001A 12/17/2002
Page 15
8. Control of Test Activities 8.1 Purpose This section establishes requirements and assigns responsibility for the control of all quality-related test activities performed for the FAA-AWD program. 8.2 Scope The provisions of this section are applicable to all quality-related testing activities performed in support of the FAA-AWD program. 8.3 Responsibilities The FAA-AWD program manager, or his designee, shall be responsible for developing and implementing an effective test control system. The PQAR shall be responsible for periodically verifying the correct implementation of this test control system (see section 12). The POC at each test laboratory shall be responsible for the development and implementation of any controls required by the test control system for testing to be performed at their laboratory. The POC shall also be responsible for identifying staff with appropriate experience or training to perform the required testing at their laboratory. 8.4 Requirements
• All quality-related test activities shall be performed in accordance with approved instructions or procedures.
• All quality-related test activities shall be performed by staff with appropriate experience or training to perform the testing.
• All quality-related test activities shall be performed using appropriate and properly calibrated test equipment.
• A test plan shall be developed for each sequence of tests to be performed. The test plan shall clearly show the test protocol to be followed, along with the test specifications and acceptance criteria. The test protocol shall follow a flow diagram depicted by blocks with each block numerically or alpha-numerically identified. The test plan shall also include a test schedule showing the sequence and estimated duration of each test block, the test specification allowable tolerances, hold points, and any inspections to be performed during testing. The test plan shall be reviewed and approved by the FAA-AWD program manager, or his designee, prior to the initiation of testing.
• The FAA-AWD program manager, or his designee, shall approve and initiate all testing, including the identification of the specimens to be tested, defining the test specifications, and the distribution of the specimens to the laboratory performing the tests by a Work Authorization form (work order).
• All unusual observations or results noted during testing shall be immediately reported to the POC for final disposition with the FAA-AWD program manager and sign off on the data sheet.

AWD-QA-001A 12/17/2002
Page 16
• Each test laboratory shall implement a system to track and document the performance and completion of each block in the test plan, such as a logbook or a “traveler” sheet that follows the test specimens and lists the status of all test activities.
• All test data shall be documented in a data sheet provided in the procedure being used. The data sheet shall be completed in accordance with the requirements specified in Section 5 of this QA plan. If test equipment automatically generates data, a printed copy of that data shall be attached to the data sheet and referenced on the data sheet as a permanent attachment. Once a test is completed, a PDF copy of all the data shall be sent electronically to the FAA-AWD program manager or his designee to update the tracking database. The original data sheet and attachments shall be stored at the originating facility in accordance with the requirements specified in Section 5 of this QA plan.

AWD-QA-001A 12/17/2002
Page 17
9. Control Of Measuring And Test Equipment 9.1 Purpose This section establishes the requirements and assigns responsibilities for the control of measuring and test equipment (M&TE) used in the FAA-AWD program. 9.2 Scope The provisions of this section are applicable to all measuring and test equipment used to obtain quality-related data. 9.3 Responsibilities The POC at each test laboratory shall be responsible for identifying the measuring and test equipment covered by this section, and implementing an effective measuring and test equipment control system that meets the intent of ISO 17025, or equivalent, QA standard. 9.4 Requirements
• The M&TE control system at each test laboratory shall meet the intent of ISO 17025 to ensure that appropriate tools, gauges, instruments, and other inspection, measuring, test equipment and devices used in the program are of the proper range, type, and accuracy to perform the specified tests within established accuracy requirements.
• This requirement is not intended to imply the need for special calibration and control measures for calipers, rulers, tape measures, micrometers, and other such devices if normal commercial practices provide adequate accuracy.
• All inspection, measuring, and test equipment is to be within the required tolerance before use. When inspection, measuring, and test equipment are found to be out-of-tolerance, an evaluation shall be made and documented on the validity of all inspection or test results obtained since the last instrument calibration, and of the acceptability of items previously inspected or tested. Inspection, measuring, or test equipment consistently found to be out-of-tolerance shall be repaired or replaced.

AWD-QA-001A 12/17/2002
Page 18
10. Handling, Storage, And Shipping of Test Specimens 10.1 Purpose This section establishes the requirements and assigns responsibilities for the proper handling, storage, and shipping of quality-related items for the FAA-AWD program to prevent damage and deterioration. 10.2 Scope The provisions of this section are applicable to all wiring specimens used to obtain quality-related test data during testing, shipping between test locations, and storage at any test location. 10.3 Responsibilities The FAA-AWD program manager, or his designee, shall be responsible for developing effective handling, storage, and shipping procedures and/or instructions for all wire test specimens. The POC at each test laboratory shall be responsible for implementing adequate controls to meet the requirements in the established procedures and/or instructions and preserve the integrity of the test specimens prior to and during the testing process. 10.4 Requirements The handling, storage, and shipping or all quality-related test specimens shall be performed in accordance with the appropriate test procedure(s) identified in the master procedure list, or in accordance with any special documented instructions provided by the FAA-AWD program manager or his designee on a unusual need basis. Any damage to test specimens shall be documented. The POC shall request the FAA-AWD program manager or his designee to determine if the specimen can be subjected to further testing, replaced, or removed from the program.

AWD-QA-001A 12/17/2002
Page 19
11. Non-Conforming Items, Services, and Activities 11.1 Purpose This section establishes the requirements and assigns responsibilities for the control of quality-related activities in the FAA-AWD program that do not conform to specified requirements. 11.2 Scope The provisions of this section are applicable to all quality-related items, services, and activities in the FAA-AWD program, including those performed by supporting organizations. 11.3 Responsibilities The FAA-AWD program manager, or his designee, shall be responsible for developing and implementing a system for the control of non-conforming items, services, and activities. The POC at each test laboratory shall be responsible for implementing the necessary controls to meet the requirements of the control system for non-conforming items, services, and activities at their test laboratory. The POC shall also be responsible for notifying the FAA-AWD program manager of any non-conforming items, services, and activities related to the wire degradation program. 11.4 Requirements
• A system shall be developed and implemented to control quality-related items, services, or activities that do not conform to specified requirements. The system shall address the process for approving the non-conforming item, preventing its inadvertent use, developing corrective actions to prevent recurrence, and documenting the completion of the corrective actions. Copies of all corrective actions shall be submitted to the PQAR, FAA-AWD program manager or his designee, and the FAA.
• Any quality-related items, services, or activities that do not conform to specified requirements shall be controlled and approved using the process specified in the appropriate procedure identified in the master procedure list. The item shall also be reported to the FAA-AWD program manager, other team members, and the FAA.
• Any damage to test specimens shall be documented. The POC shall request the FAA-AWD program manager or his designee to determine if the specimen can be subjected to further testing, replaced, or removed from the program.

AWD-QA-001A 12/17/2002
Page 20
12. Internal Audits 12.1 Purpose This section establishes the requirements and assigns responsibility for performing internal audits to verify compliance and effectiveness of all quality-related aspects of the FAA-AWD program. 12.2 Scope The provisions of this section are applicable to all quality-related aspects of the FAA-AWD program. 12.3 Responsibilities The Program Quality Assurance Representative (PQAR) shall be responsible for performing external audits to verify compliance with the requirements of this QA plan when deemed necessary. The POC at each test laboratory shall be responsible for identifying a quality assurance representative (QAR) with the appropriate experience or training to perform an internal audit of the test activities performed at their facility. The PQAR shall be notified as to who has been assigned. The QAR at each test laboratory shall interface directly with the PQAR in regard to this program plan. 12.4 Requirements
• Internal audits shall be performed, as appropriate, by personnel not having direct responsibilities in the area being audited.
• The audit shall verify compliance with the requirements specified in this QA plan, and shall identify any areas of non-conformance, along with recommended corrective actions.
• Auditing personnel shall document the audit results, and review them with the test laboratory POC and staff. A copy of the audit report shall be forwarded to the FAA-AWD program manager in a timely manner.
• The test laboratory POC shall take appropriate actions to correct any deficiencies noted by the audit in a timely manner.
• The FAA shall be notified by the FAA-AWD program manager or his designee when deficiencies are identified during audits.

F-1
APPENDIX F—SAMPLE WORK AUTHORIZATION AND ROUTER FOR GROUP 10 SETUP 2PI70H
Group 10 setup 2pi70h

F-2
FAA Aircraft Wiring Degradation Program – Work Authorization Form AWD-QA-003 1/14/2003
I. WORK AUTHORIZATION ASSIGNMENT: Page _1_ of _1_
Work Authorization & Protocol No.AWD-WA-2PI70H-2
Authorization Date:3/23/04 Organization Authorized to Perform this Work: RTSC
II. Test Specimens to be Used: Polyimide wire (Code PI), Group 10, Setup 38
L1. 0328 L2. 0388 L3. 0393 L4. 0540 L5. 0587
L6. 0652 L7. 0691 L8. 0791 L9. 0919 L10. 1323
L11. 1770
E1. 0063 E2. 0239 E3. 0382
P1. 1901 P2. 1902 P3. 0093 P4. 0446
P5. 0896* P6. 0926* P7. 1645* *Bag & do not test.
III. Work to be Performed: (See attached protocol flowchart on continuation sheet, if applicable.) Test Procedure Number and Title Test Parameter(s) Comments
Aging and Stressor Tests 1. Humidity aging - TP-103 70C, 85% RH, ~9 days/cycle All, but aging of L5-L8 shall not begin until 1/3 of 1st aging cycle is completed, and aging of L9-L11 shall not begin
until 2/3 of 1st cycle is completed. Specimens being aged shall be wrapped on 0.500 inch diameter Teflon mandrel. 2. Dynamic bend – TP-202 10-times bend after each aging cycle All. Use 0.500 inch diameter steel mandrel and 0.88 lb weight. Monitoring and Electrical Tests 3. Visual examination – TP-201 After each aging/stressor cycle All, but inspect for major damage only. 4. Wet IR – TP-302 @ each specified hold point E1-E3 5. DWV – TP-301 After each aging/stressor cycle All, but measure leakage current on E1-E3 and L1-L3 only 6. Conductor resistance – TP-307 @ each specified hold point E1-E3 7. Functional performance – TP-308 @ each specified hold point E1-E3 8. Dry IR – TP-303 @ each specified hold point E1-E3. Items 8-10 are not required to be performed in sequence. 9. Dielectric phase angle – TP-304 @ each specified hold point E1-E3. Items 8-10 are not required to be performed in sequence. 10. TDR – TP-305 @ each specified hold point E1-E3. Items 8-10 are not required to be performed in sequence. 11. Functional performance – TP-308 @ each specified hold point E1-E3. Testing after final cycle to be conducted when other setups are tested. Cut, Bag, and Hold for Property Tests 12. Insulation T&E - TP-207 Cut 1 ft. @ each specified hold point P1. Always cut piece from modified terminal end of specimen. Bag and Label with WA no., TP no., & specimen
no. followed by a dash and number identifying the last completed aging cycle. After required piece has been cut for the specified hold point, replace modified terminal on specimen being returned to aging.
13. Indenter - TP-205 same piece as for insulation T&E Same as for item 11. Add indenter TP number on Insulation T&E specimen bag 14. Inherent viscosity – TP-402 Cut 0.25 ft. @ each specified hold pt. Same as for item 11. 15. Remove and save 10 ft @ each specified hold point P2-P4. Bag and Label with WA no. & the specimen no. followed by a dash and number identifying last completed
aging cycle. Return remaining specimens to aging IV. Special Instructions: (Note – If additional space is needed, check the “continued” box and attach a continuation sheet.)
Polyimide (PI). This test setup (Group 10) is to be aged alone. See the latest revision of the “Setups.xls” test protocol spreadsheet, noting that a test is only to be performed at the specified cycle when there is an “X” in the row for the applicable test setup. If 4 or more L specimens fail prior to the sixth aging cycle, contact the program manager for redefinition of cycle parameters before proceeding. Direct questions to Ralph Martin, x3767, or Joe Kurek, x7029. WBS R-0553-C1WDSHUM. P5-P7 specimens shall be bagged and not tested.
Continued V. Signoffs: Step Responsible Name Date (MM/DD/YY) 1. Above work is authorized to be performed FAA-AWD Program Manager, or Designee 2. Above instructions received and understood Test Lab POC 3. Above work completed Test Lab POC 4. Results of above work received FAA-AWD Program Manager, or Designee

F-3/F-4
FAA Aircraft Wiring Degradation Program – Aging Router and Sign-off Sheet
2PI70H-2 03/23/2004 Group 10; Setup No. 38
Documentation of Completion (Initial and Date)
Aging and Stressor Tests Virgin
Cycle 1 2 3 4 5 6 7 8 9 10 11 12 13 Final
Humidity aging – TP-103 | | Dynamic bend – TP-202 Monitoring and Electrical Tests Visual examination – TP-201 DWV – TP-301 Wet IR – TP-302 Conductor resistance – TP-307 Dry IR – TP-303 Dielectric phase angle – TP-304 TDR – TP-305 Functional performance - TP-308 Cut, Bag, and Hold for Property Tests Insulation T&E - TP-207 Indenter - TP-205 Inherent viscosity – TP-402 Save 10 ft Not Applica ble

APPENDIX G—TEST METHODS DETAILS AND DISCUSSION
G.1 POTENTIAL FLUID EXPOSURE OF AIRCRAFT WIRING. Inputs were received from several operators, original equipment manufacturers (OEM), and aircraft services organizations to cross check the lists of possible fluids to which the aircraft wiring may be routinely exposed. These fluids were placed in several categories as described below. An evaluation took place to determine the best method to expose the wires to fluids. Data was collected through technical datasheets, materials safety datasheets, infrared spectra, etc. Due to the large number of possible fluids, and the inability to determine whether any wire may have actually been exposed to the fluids, it was necessary to approach some of these as possible perturbations and provide estimated predictions of the effects on the different wire types. If there are predominant mechanisms expressed by these materials that may affect the aging of wire and to which the wire would very likely have been exposed, those fluids and wire type combinations were identified. A great many fluids are used on the aircraft during its life cycle, and an accurate list of the fluids cannot be captured for a specific aircraft. Each location (airport, operator, maintenance facility, contracted facility, etc.) may have used various materials that could have changed over the past 20-25 years. In addition, the question remains as to which wires are actually exposed. The OEM has defined materials specifications that are recommended for use on specific aircraft, and technically, only fluids approved to those specifications should be used. However, it can probably be assured that there may be times when those approved materials were not available and waivers were (or were not) obtained to use alternate materials. Water—The base or diluent of many fluids used around the aircraft, such as cleaners, anti-icing fluids, and sanitizing and deodorizing fluids. In addition, water in the form of rain, sleet, snow, ice, condensation, and humidity is often present, depending on the environmental conditions around the aircraft. Wiring in nonsealed areas of the aircraft will be exposed to the environmental conditions surrounding the aircraft. Drinks—Drinks are spilled many times during an aircraft’s life. Drinks are water-based, but can contain a number of other components, including acids, sugars, alcohol, etc. Coatings—Paints and coatings are used during maintenance for aesthetics or for corrosion control. These coatings may be applied directly over areas containing wiring. These coatings are often alkyd-, epoxy-, or urethane-based. In the past, these coatings were solvent-based, while today some are water-based or water-dilutable. The solvents used were often ketones, naphthas, aromatic (toluene/xylene), or mixtures thereof. Corrosion Inhibiting Compounds—A family of materials that are used to prevent or slow the galvanic corrosion and oxidation of aluminum or other metals. These materials, manufactured to specifications such as MIL-C-81309, MIL-C-85054, Boeing 3-23, MIL-C-16173, and DMS 2150, are designed to protect the metal surface from the deposition of salts and water that can cause galvanic corrosion sites as well as oxidation. A variety of types include either solvent-dispersed or non-solvent-dispersed, oily films (generally light hydrocarbon or silicone oils),
G-1

waxy films (heavy hydrocarbon waxes), dry removeable films (polytetrafluoroethylene particulate), or dry nonremoveable films (epoxy- or alkyd-type coatings.) Many of these films are also used for lubrication. Generally, the solvents appear to be water- or hydrocarbon-based. Examples include Corrosion X (light hydrocarbon oils plus unidentified components), LPS-3 (70%-80% aliphatic petroleum hydrocarbon, 2%-3% dipropylene glycol methyl ether, 10%-15% hydrotreated petroleum oil, and CO2 propellant) and LPS-813, and ACF-50 (Material Safety Data Sheet (MSDS) lists as a “proprietary blend of ultrapure synthetic and organic hydrocarbons,” aerosol also contains propellant; flash point of bulk material is 165°F; the manufacturer stated that when tested in accordance with the specification, the material does not damage polyimide wire any more than distilled water). Of course, with these, there are also corrosion-inhibiting compound removers or cleaners. (AMS 1526 and other cleaners can be used for this and are discussed in Aircraft Cleaners.) Hydraulic Fluid, Petroleum-Based—Similar to MIL-H-5606. Although this military specification has been deactivated, it has been a widely used hydraulic fluid. Aeroshell 4, Aeroshell 41, and Royco 756 are three materials meeting this specification. Content descriptions from MSDSs indicate the fluids are hydrotreated light to middle fraction petroleum oil distillates based with various additives, including oxidation inhibitors and antiwear additives. Royco 756 MSDS specifies 10%-15% polymeric additive and <0.5% butylated triphenyl phosphate. Aeroshell MSDS lists hydrocarbon and 10%-20% additives. A Fourier transform infrared spectrum of generic MIL-H-5606 fluid from a qualified, but unknown, source indicates that no aromatic compounds are present. Hydraulic Fluid, Synthetic—Fire-Resistant Phosphate Ester-based fluid per SAE AS1241. The prime example is Skydrol 500B, although Hy-Jet is another. Skydrol MSDS information indicates the main contents are tributyl phosphate, dibutyl phosphate, and butyl diphenyl phosphate. Additional technical information shows the general materials compatibility with Skydrol 500B is excellent for most of the insulation types except polyvinyl chloride (PVC), which is very bad. Fuel, Jet A and Jet A-1—Jet fuel for turbine engines is kerosene-based. Commercially, Jet fuel A and A-1 are used to the ASTM D 1655 Standard. Per the Standard, these are relatively high flash point cuts of kerosene. Table 1 in the Standard lists some of the properties of the fuel. The difference between the two appears to be the freezing point, with Jet A at -40°C maximum and Jet A-1 at -47°C maximum. Jet B fuel has a wide boiling point range and a freeze point of -50°C maximum, but is not as widely used. A number of additives are allowed per the Standard. MSDS information from various manufacturers show the kerosene-type hydrocarbon content. An anti-icing additive used in military versions and for business jets is a glycol ether material, but this is rarely used for large commercial transports with heated fuel lines. Lubricating Oil, Synthetic—Lubricants based on the MIL-L-7808 or MIL-L-23699 specifications. Tricresyl phosphate is allowed, but not more than 1% of the additive shall be ortho isomer. Organometallic titanium compounds and silicone antifoam agents are prohibited. The specification gives maximum allowed deterioration of standard elastomers, Acrylonitrile butadiene (Buna N), silicone, fluoroelastomer, and fluorosilicone. MSDS for Royco 808 shows organic esters with a variety of additives, and the MSDS for Aeroshell 500 shows synthetic
G-2

esters (pentaerythritol esters 68424-31-7) tricresyl phosphate, phenyl-alpha-naphthylamine 90-30-2 1 4, and other minor additives. Lubricating Oil, Petroleum-Based—These are based on straight mineral oil. This type has limited or nonexistent use in large commercial transports today. Anti-Icing/Deicing Fluid—A commercial specification is SAE AMS 1424 and a military specification is MIL-A-8243. All anti-icing fluids appear to be of one of the following types with water and various additives, including trade secret inhibitors, surfactants, and dyes (up to about 3%): ethylene glycol-based, diethylene glycol-based, or propylene glycol-based. The ethylene glycol-based products are somewhat older, while the newer products appear to be propylene glycol-based, probably due to the environmental regulations and toxicity of using the ethylene glycol. These fluids are diluted with various amounts of water when used, depending on temperatures. Several products are listed below. • UCAR Aircraft Deicing Fluid concentrate (from 1994 MSDS) is 91.5% ethylene glycol,
7.5% water with 1.0% nonhazardous processing additives.
• UCAR DEGree Aircraft Deicing Fluid (from 2002 product information) is 88% diethylene glycol with inhibitors, wetting agents, and orange dye.
• Arcoplus Aircraft Deicing Fluid (from 1998 MSDS) is 88% propylene glycol, 9% water, and less than 1% each of five trade secret additives.
• 146AR Aircraft Deicing Fluid (1978 MSDS) is 89% ethylene glycol, 5% higher glycols, 1.6% of unidentified inhibitors and surfactants, and 5.5% water with dye. In a 1985 MSDS, the 5% higher glycol was named diethylene glycol, with 4% water, leaving 2% for unnamed additives.
• MIL-A-8243 Type I is a propylene glycol-based fluid.
Aircraft Cleaners—Cleaning materials are used during wire maintenance and repair. Often, isopropanol is used to clean the wiring. Following wiring repairs, isopropanol or isopropanol/stoddard solvent mixtures are used for cleaning flux residues. It is assumed that this is usually a quick and controlled operation in any one specific area; therefore, solvent contact and residue will be minimal. Exterior cleaning materials have changed significantly over the past 20 years. As can be seen from the variety of cleaning materials below, the list is almost endless. Various acidic and alkaline cleaners, as well as solvent- and water-based cleaners, are nearly endless. Several military specifications that are similar include:
• MIL-C-5410—Cleaning compound, aluminum surface, nonflame sustaining. Type II is
“for the maintenance of transport aircraft” per the specification. The Revision B base specification was dated 1960 and was canceled in 1980. Per the specification, the material is a phosphoric acid base, which shall not corrode aluminum, damage painted surfaces, or cause crazing of stressed acrylic. Type II can be used full strength or diluted with a mineral spirits/water mixture. Unsure of what the actual commercial products contained. In the early days of these
G-3

older aircraft, it is possible that cleaning was performed using these cleaners. Examples of Type II commercial products include Cee Bee A-302, Turco 4909, and El Dorado AC-102.
• MIL-C-43616—Aircraft surface cleaning compound. Original specification was dated
1968, Revision B was dated 1970, and Revision C was dated 1981 (current document). No requirements except: shall not cause streaking, fading, blistering of the aircraft paint, nor shall it decrease the paint hardness more than one pencil hardness. Shall not cause cracking or crazing of stressed acrylic. Shall not corrode aircraft metals (Al, Mg, Ti, steel or cad-plated steel.) pH requirements of 8.0 minimum to 10.0 maximum. Used diluted 1:4 with water for heavy cleaning, up to 1:16 for light cleaning per specification. Example products Turco 5975A and Cee Bee R-677 and R-679.
• MIL-C-25769—Alkaline, water-based fluid. Original specification was dated 1957, and
Revision J was dated 5/1/79. These fluids were used for many years. Canceled in 1984 and superceded by MIL-C-87936 Type I. Examples include Brulin 815-M6 and Cee Bee A-69. The A-69 data sheet indicates the fluid is mildly alkaline, and instructs to use diluted from 1:1 up to 1:8 with water or diluted 1:2 to 1:3 with water, and 1:8 to 1:12 with low aromatic petroleum solvent. The A-69 MSDS indicates presence of 2-butoxyethanol 5%-10% and pH of 11-12 for the concentrated liquid.
• MIL-C-87936—Type I is water-based alkaline and Type II is solvent-based, water-
dilutable aircraft cleaner. Base specification dated 1984 and Revision A dated 1985. Canceled and superseded by MIL-C-87937 in 1995. Type I examples include Blue Gold (per MSDS, contains 9% diethylene glycol n-butyl ether, pH of concentrate 13, pH of 1% solution is 11.1), Brulin 815AF (per datasheet and MSDS, contains ethanolamine (1-5%), surfactant, ethylene dinitrilo tetraacetic acid (EDTA), and dodecylbenzene sulfonic acid), and Turco Air Tec 23. Type II examples include Turco Air Tec 22 (per datasheet, contains aromatic hydrocarbons and 2-butoxyethanol.)
• MIL-C-87937—Aerospace equipment cleaning compound. Base specification was dated
1990. Latest is Revision D, dated 2001. Type I is terpene-based, solvent emulsion, water dilutable. Types II-IV are water-based and water-dilutable. Formulations are not specified except that Type I is terpene hydrocarbon-based (25%-40% by weight) and Types II, III, and IV shall contain no terpenes or other hydrocarbon solvents. Per the specification, the concentrated Type III or 10% solution of Types I, II, and IV cleaners shall not stain unpainted metal surfaces, discolor or soften paint by more than one pencil hardness, stress craze acrylic or polycarbonate, soften polysulfide sealant or chloroprene or other synthetic rubber elastomers more than 5 durometer units (Shore A), and shall not harm polyimide insulated wire more so than distilled water. Type II example: Cee Bee A882. The MSDS indicates A882 contains no hazardous materials and the data sheet specifically says it is safe for polyimide insulated wire.
G-4

• MIL-C-85570—Aircraft exterior cleaning compound of various types. Type I is aromatic solvent-based (Cee Bee R-681), Type II is not solvent-based but does contain some solvents (Cee Bee R-682, Turco 6692 (per data sheet, 112 g/L VOCs, nonflammable, pH 8.7—9.2, water soluble, use as 5%-15% solution in water), Type III is an abrasive spot cleaner, Type IV is a rubberized spot cleaner, and Type V is a low solvent gel-type cleaner for wheel wells (Cee Bee R-685).
• AMS 1526 through 1530, 1533, 1550, Commercial Specifications such as Douglas
CSD#1 and Boeing D6. Various commercial products will meet these requirements and are approved for use. Some of the products will actually meet multiple specifications. Examples are:
– Astromat Orange DF, a nonpetroleum, solvent-based cleaner for painted
and unpainted surfaces. No hazardous components per technical data sheet. Gelled material will cling to vertical surfaces to soak in before being rinsed off with water. Can use straight or diluted down to a 10% solution with water, depending on application. The pH of the concentrated material is roughly 11.
– Cee Bee Super Bee Cleaner 210, “a concentrated general purpose cleaner specifically designed for cleaning aircraft exterior and interior surfaces” with no hazardous components per the MSDS (pH of concentrated liquid is 11-12).
– Cee Bee Cleaner 280 which “is a versatile, alkaline, waterbase cleaner for aircraft, ground support equipment and trucks…” and contains 3%-6% dipropylene glycol methyl ether per the MSDS (pH of concentrated liquid is 11-12). For emulsion mixtures, the data sheet recommends hydrocarbon solvent contain ≤10% aromatics.
Blue Sanitary Water—Deodorant materials used for cleaning/deodorizing and for sanitizing galley areas of the aircraft. SAE AMS 1476B covers some of these materials. Examples include: • Celeste Industries SP-97000 (liquid) and SP-77000 (solid) series (MSDS has trade secret
for contents, but lists pH as 5-6). This material contains a quanternary ammonium compound. The material is diluted significantly prior to use (8 g per 5-7 gallons of water).
• Cee Bee Honey Bee 50C—per MSDS, contains 5%-10% alkyl dimethyl ammonium chloride and 5%-10% hexylene glycol and has a pH of 5-7. Data sheet gives instructions to place concentrated material into toilet tank during layovers longer than 6 hours or to use up to a 10% diluted solution.
• Cee Bee Deodorant 24—per MSDS, contains 5%-10% alkyl dimethyl ammonium chloride and has a pH of 5-7.
G-5

G.2 CONCLUSIONS. Each of the fluid categories above may contact wire during service, although some more than others. Lubricating oil, hydraulic fluid, and jet fuel are all part of the operation of the aircraft, and its daily servicing. Anti-icing/defrosting fluids are routinely applied during winter months over the entire aircraft. Aircraft cleaners are routinely washed using an external aircraft cleaner such as diluted mineral spirits, type 1. Lubricating oil and corrosion inhibiting compound are chemically similar to jet fuel, with aliphatic hydrocarbon constituents. Jet fuel is considered to be more aggressive and will be used in this study. Paints and coatings are stripped and applied during maintenance, and there are provisions to protect the wiring during these operations in the maintenance guidelines. Therefore, exposing wire to these materials will be considered perturbations to the aging process. Drinks are not considered very aggressive, and these, along with lavatory water and other cleaners, could not be tested to practically limit the number of fluids. Due to funding, the number of fluids tested had to be limited. Specimens were exposed to the following four fluids, rotating for each in the sequence specified. • Expose wire to Fluid #1 Jet A Turbine Fuel 4 hours at 25°C, drain 1 hour Age
• Expose wire to Fluid #2 AS1241 Hydraulic Fluid 4 hours at 49°C, drain 1 hour Age
• Expose wire to Fluid #3 MIL-A-8243 Type I propylene glycol-based anti-icing fluid 4 hours at 49°C Age
• Expose wire to Fluid #4 AMS 1533A diluted 50% with water 4 hours at 65°C, drain 1 hour Age
• Repeat with the next cycle, exposing again with Fluid #1, Age, etc.
Using typical requirements from the SAE or MIL-SPEC documents to define times of exposure at temperature, then expose wire to a standard aging cycle based on the ASTM baseline setup at high temperature, with the exception that the immersion takes place at each cycle before aging. These results can be compared directly to the ASTM baseline setup results. Water was evaluated separately, with specific test setups specifically devoted to the action of water on the degradation of the wire. Water was tested using multiple levels, including 0%, 70%, 85%, cycled 85%-25%, and 100% relative humidity and multiple temperatures, including 45°, 70°, and 95°C with humidity. G.3 VISUAL INSPECTION. This test is used to document the physical condition of a wire test specimen in an effort to determine if certain characteristics correlate to a level of degradation that indicates potential failure.
G-6

G.4 INSULATION DIELECTRIC WITHSTAND VOLTAGE, WET. Leakage current was measured using a 1500-volt alternating current potential across the insulation in a 5% salt-water solution to determine whether or not the insulation was breached. The test duration was set at 1 minute, and the failure level was 10 mA. Analysis of the data was performed by comparing the values over time as the specimens aged. The leakage current data shown in figures G-1 and G-2 varies slightly among samples at any given hold point, but is fairly reproducible in a laboratory. Very little change was noted until the samples failed.
PI, 300 °C, 0% RH, Dynamic.Static = 10x.Straight
0.000
0.100
0.200
0.300
0.400
0.500
0.600
0.700
0.800
0
100
200
300
400
500
600
700
800
900
1000
Aging Hours
E-sa
mpl
e D
WV
Leak
age
, m
A
(group 5, setup 12)
Figure G-1. The DWV Leakage Current for Polyimide Electrical Property Samples (E) in Group 5
PI, 300 °C, 0% RH, Dynamic.Static = 10x.Straight
0.000
0.010
0.020
0.030
0.040
0.050
0.060
0.070
0.080
0.090
0.100
0
100
200
300
400
500
600
700
800
900
1000
Aging Hours
L-sa
mpl
e D
WV
Leak
age,
mA
(group 5, setup 12)
Figure G-2. The DWV Leakage Current for Polyimide Life Samples in Group 5
G.5 INSULATION RESISTANCE, WET. Figures G-3 through G-5 show that insulation resistance (IR) wet values for polyimide (PI) and polytetrafluoroethylene/polyimide composite (CP) samples were significantly different at some hold points, yet similar at others. The variability at each hold point is greater than it would first appear since it is evaluated on a log scale. There may be ways to use this data, but variability
G-7

must be reduced, possibly by always using the same equipment and operator, keeping the temperature conditions the same, and keeping the readings specimen-specific.
PI, 300 °C, 0% RH, Dynamic.Static = 10x.Straight
0.0
0.5
1.0
1.5
2.0
2.5
3.0
3.5
4.0
0
100
200
300
400
500
600
700
800
900
Aging Hours
E: I
R W
et,
Log(
G.o
hms+
1)
(group 5, setup 12)
Figure G-3. Wet IR Variability Data for PI Electrical Specimens Aged at 300ºC
Figure G-4. Wet IR Variability Data for PI Electrical Specimens Aged at 250ºC
PI, 250 °C, 0% RH, Dynamic.Static = 10x.Straight
0.000
0.500
1.000
1.500
2.000
2.500
3.000
3.500
4.000
4.500
0
1000
2000
3000
4000
5000
6000
7000
8000
9000
1000
0
Aging Hours
E: I
R W
et,
Log(
G.o
hms+
1)
(group 1, setup 9)
G-8

CP, 300 °C, 0% RH, Dynamic.Static = None.Straight
0.0
1.0
2.0
3.0
4.0
5.0
6.0
0
500
1000
1500
2000
2500
3000
3500
Aging Hours
E: I
R W
et,
Log(
G.o
hms+
1)
(group 23, setup 3)
Figure G-5. Wet IR Variability Data for CP Electrical Specimens Aged at 300ºC
Figures G-6 and G-7 show that there was significant variation when comparing baseline results from different laboratories on the same samples. Wet IR is very sensitive to test setups and fixturing, bath temperature, and equipment.
Mea
n of
L(I
Rw
et)
RL
4.2
4.0
3.8
3.6
3.4
3.2
3.0
654321
Lab Sample
Main Effects Plot (fitted means) for L(IRwet)
Figure G-6. Comparison of Lectromec and RTSC Baseline Wet IR Values
G-9
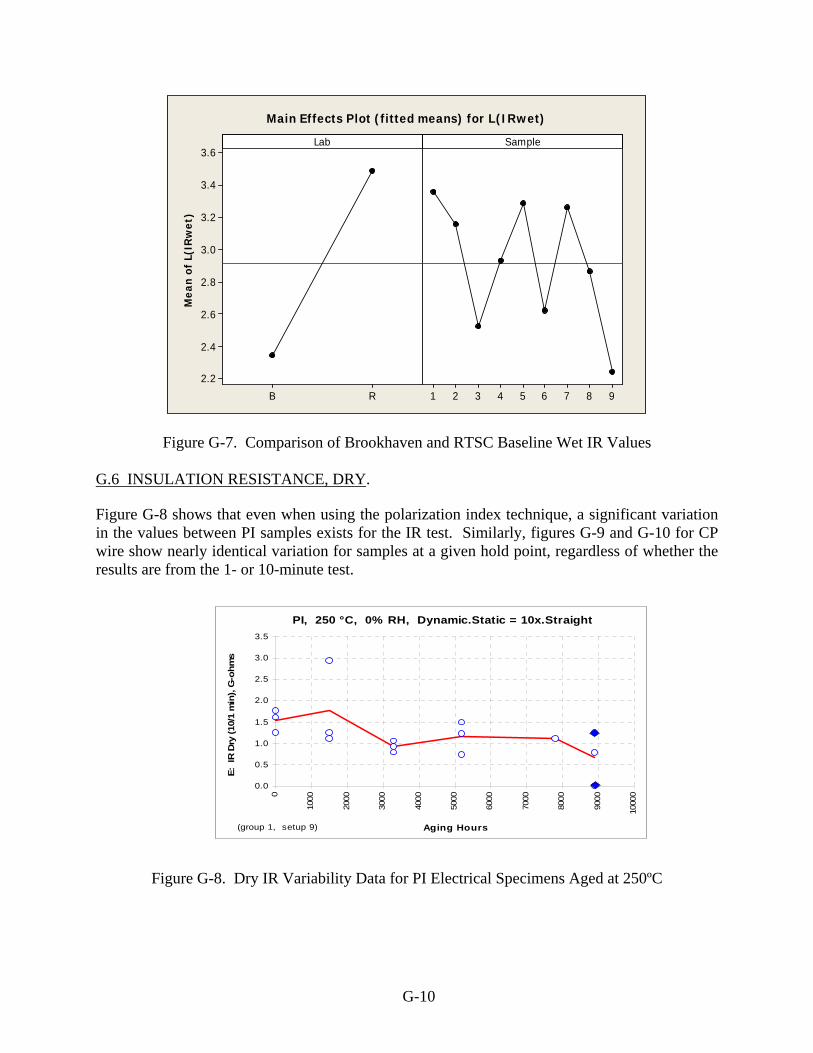
Mea
n of
L(I
Rw
et)
RB
3.6
3.4
3.2
3.0
2.8
2.6
2.4
2.2
987654321
Lab Sample
Main Effects Plot (fitted means) for L(IRwet)
Figure G-7. Comparison of Brookhaven and RTSC Baseline Wet IR Values G.6 INSULATION RESISTANCE, DRY.
Figure G-8 shows that even when using the polarization index technique, a significant variation in the values between PI samples exists for the IR test. Similarly, figures G-9 and G-10 for CP wire show nearly identical variation for samples at a given hold point, regardless of whether the results are from the 1- or 10-minute test.
PI, 250 °C, 0% RH, Dynamic.Static = 10x.Straight
0.0
0.5
1.0
1.5
2.0
2.5
3.0
3.5
0
1000
2000
3000
4000
5000
6000
7000
8000
9000
1000
0
Aging Hours
E: I
R D
ry (1
0/1
min
), G
-ohm
s
(group 1, setup 9)
Figure G-8. Dry IR Variability Data for PI Electrical Specimens Aged at 250ºC
G-10

CP, 300 °C, 0% RH, Dynamic.Static = None.Straight
0.0
0.5
1.0
1.5
2.0
2.5
3.0
3.5
4.0
0
500
1000
1500
2000
2500
3000
3500
4000
4500
Aging Hours
E: I
R D
ry (1
min
),
Log(
G.o
hms+
1)
(group 23, setup 3)
Figure G-9. One-Minute Dry IR Variability Data for CP Electrical Specimens Aged at 300ºC
CP, 300 °C, 0% RH, Dynamic.Static = None.Straight
0.0
0.5
1.0
1.5
2.0
2.5
3.0
3.5
4.0
0
500
1000
1500
2000
2500
3000
3500
4000
4500
Aging Hours
E: I
R D
ry (1
0 m
in),
Lo
g(G
.ohm
s+1)
(group 23, setup 3)
Figure G-10. Ten-Minute Dry IR Variability Data for CP Electrical Specimens Aged at 300ºC
Figure G-11 shows that there was significant variation when comparing baseline results from different laboratories on the same samples. Dry IR is very sensitive to test setups and fixturing, consistent backplane contact is essential, which can vary easily between laboratories, or even over time at the same laboratory.
G-11

Sample
Mea
n
987654321
4.0
3.5
3.0
2.5
2.0
1.5
1.0
LabBR
Interaction Plot (fitted means) for L(IRdry.10)
Figure G-11. Comparison of Brookhaven and RTSC Baseline Dry IR Values G.7 CONDUCTOR RESISTANCE AND ELECTRICAL CONTINUITY. The purpose of this test was to determine the resistance of the conductor in an insulated wire at 20°C. The wire specimen length between the terminals was measured to within ±0.02 feet. The test specimen conductor was connected to the ohmmeter, and the test leads were placed on the exposed conductor directly behind the terminal crimp barrels. The room temperature was recorded to the nearest 0.1°C. Once the test specimens equilibrated at room temperature, the direct current (DC) resistance of the test specimen conductor was measured and recorded. The polarity of the applied test voltage was reversed, then the second DC resistance of the test specimen conductor was measured and recorded. The average of the two resistance measurements was divided by the length of the wire specimen, and the result was multiplied by 1000. The result was standardized to a temperature of 20°C by using the following temperature correction equation:
RT = Rt/[1+ α(t-T)]
Where:
RT = Resistance at reference temperature (20°C) Rt = Resistance as measured at temperature α = Temperature coefficient of resistance (see below) T = Reference temperature t = Temperature at which measurement is made
α Coefficients: Copper - 0.00393 High-Strength Copper Alloy - 0.00342 (units are per °C)
G-12

Conductor resistance increased with aging as expected, and in some cases, reached the point where the conductor became the weak point and broke. Vibrations through the aircraft, due to operational oscillations and flexing, are sufficient to cause this breakage over time. Silver- and nickel-coated copper conductors provided additional high-temperature capabilities. The PI and CP samples used in this study consisted of nickel-coated copper conductor. The polyvinyl chloride/nylon (PV) samples used in this study consisted of tin-coated copper conductor. Figure G-12 shows that the conductor resistance can fluctuate significantly throughout the aging process, but the values typically ended up higher than the baseline values at the last cycle or failure point.
Aging Hours
Avg
Con
duct
or R
esis
tanc
e, O
hm/1
000f
t @
20°C
9000800070006000500040003000200010000
20
15
10
5
ByVar3
PI, 300 °C, 0% RH, Dynamic.Static = 10x.StraightPI, 300 °C, 0% RH, Dynamic.Static = None.Straight
PI, 250 °C, 0% RH, Dynamic.Static = 10x.StraightPI, 300 °C, 0% RH, Dynamic.Static = 10x.10x
Conductor Resistance
Figure G-12. Conductor Resistance for Four PI Aging Conditions Conductor resistance values for PI wire that was aged at high temperature are provided in figures G-13 through G-15. The decrease in conductor resistance at the beginning and middle aging cycles may be due to the wire conductors annealing during the high-temperature aging process. The figures also show that at certain hold point, the results were very similar for the specimens, but at other points, the results varied significantly. Figure G-16 shows, for PV wire, how the conductor resistance decreases from the baseline then goes higher than the baseline at the last cycle or failure. The slight decrease in conductor resistance at the beginning and middle aging cycles may be due to the high-temperature aging, causing the wire conductors to anneal while going through the high-temperature aging process. There was nearly no variation in the results from sample to sample at the same hold point.
G-13

PI, 250 °C, 0% RH, Dynamic.Static = 10x.Straight
0.0
2.0
4.0
6.0
8.0
10.0
12.0
14.0
16.0
18.0
0
1000
2000
3000
4000
5000
6000
7000
8000
9000
1000
0
Aging Hours
E: C
ondc
tor
Res
ista
nce
, O
hm
/100
0ft @
20C
(group 1, setup 9)
Figure G-13. Conductor Resistance Variability Data for PI Wire Aged at 250ºC With a
10-Times Dynamic Bend Stressor and no Static Stressor
PI, 250 °C, 0% RH, Dynamic.Static = 10x.10x
0.0
2.0
4.0
6.0
8.0
10.0
12.0
14.0
16.0
18.0
0
1000
2000
3000
4000
5000
6000
Aging Hours
E: C
ondc
tor
Res
ista
nce
, O
hm
/100
0ft @
20C
(group 1, setup 13)
Figure G-14. Conductor Resistance Variability Data for PI Wire Aged at 250ºC With a
10-Times Dynamic Bend Stressor, and 10-Times Static Wrap
G-14
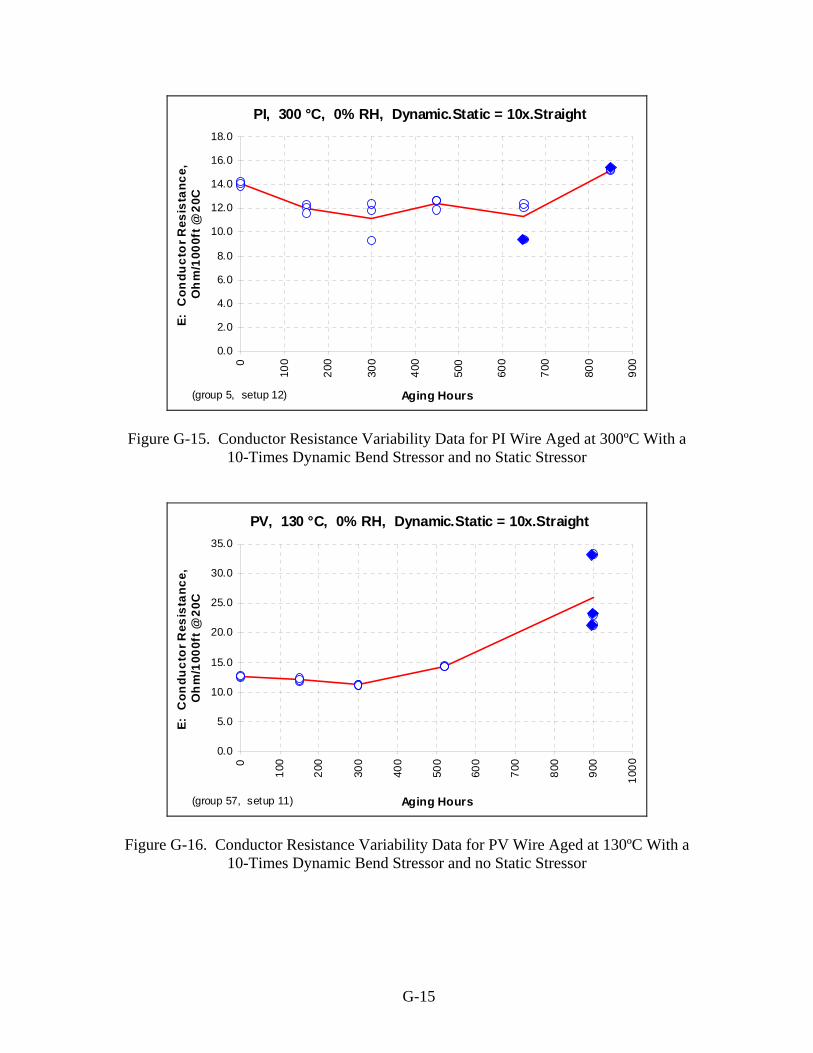
PI, 300 °C, 0% RH, Dynamic.Static = 10x.Straight
0.0
2.0
4.0
6.0
8.0
10.0
12.0
14.0
16.0
18.0
0
100
200
300
400
500
600
700
800
900
Aging Hours
E: C
ondu
cto
r Res
ista
nce,
O
hm
/100
0ft @
20C
(group 5, setup 12)
Figure G-15. Conductor Resistance Variability Data for PI Wire Aged at 300ºC With a
10-Times Dynamic Bend Stressor and no Static Stressor
PV, 130 °C, 0% RH, Dynamic.Static = 10x.Straight
0.0
5.0
10.0
15.0
20.0
25.0
30.0
35.0
0
100
200
300
400
500
600
700
800
900
1000
Aging Hours
E: C
ondu
cto
r Res
ista
nce,
O
hm
/100
0ft @
20C
(group 57, setup 11)
Figure G-16. Conductor Resistance Variability Data for PV Wire Aged at 130ºC With a
10-Times Dynamic Bend Stressor and no Static Stressor
G-15

G.8 CONDUCTOR TENSILE STRENGTH AND ELONGATION. A sample of wire was measured and cut to 20 inches minimum and all the insulation was removed. (For wire sizes 22 and smaller, the tests were performed on the whole conductor, and for wire sizes 20 and larger, a single strand was removed from the conductor and tested.) Two parallel benchmarks were made on the conductor 10 ±0.031-inches apart. The diameter of the conductor or strand was measured at several places between the marks, and the minimum diameter recorded. The sample was placed around the capstan grips so that the benchmarks were between the grips, but not in contact with them. The elongation and the maximum breaking strength were measured and recorded after rupture of the specimen. The results are invalid if the sample breaks outside the benchmarks.
Figure G-17 shows that although there was a decrease in the conductor tensile strength of PI wire, there were no sharp drops in the values. Also, this test was only performed as a baseline test on the bulk sample and as a final cycle property test.
PI, 300 °C, 0% RH, Dynamic.Static = 10x.Straight
0
50
100
150
200
250
0
100
200
300
400
500
600
700
800
900
Aging Hours
P:
Co
nduc
tor
Tens
ile,
lbs
(group 5, setup 12)
Figure G-17. Conductor Tensile Strength for PI Wire Aged at 300ºC
Figure G-18 shows that there was basically no difference in the elongation of the conductor from the PI wire when comparing the baseline bulk data to the final cycle property test data.
G-16

PI, 300 °C, 0% RH, Dynamic.Static = 10x.Straight
0
2
4
6
8
10
12
14
16
18
0
100
200
300
400
500
600
700
800
900
Aging Hours
P:
Co
nduc
tor
Elo
nga
tion
, %
(group 5, setup 12)
Figure G-18. Conductor Elongation for PI Wire Aged at 300ºC
Figures G-19 and G-20 provide the results from conductor tensile strength and elongation, respectively, on CP wire at 300ºC. As with PI wire, there were no significant changes from the baseline to final cycle results.
CP, 300 °C, 0% RH, Dynamic.Static = 10x.Straight
0.0
20.0
40.0
60.0
80.0
100.0
120.0
140.0
160.0
180.0
200.0
0
200
400
600
800
1000
1200
1400
1600
1800
2000
Aging Hours
P:
Co
nduc
tor
Tens
ile,
lbs
(group 24, setup 12)
Figure G-19. Conductor Tensile Strength for CP Wire Aged at 300ºC
G-17

CP, 300 °C, 0% RH, Dynamic.Static = 10x.Straight
0.0
2.0
4.0
6.0
8.0
10.0
12.0
14.0
16.0
18.0
20.0
0
200
400
600
800
1000
1200
1400
1600
1800
2000
Aging Hours
P:
Co
nduc
tor
Elo
nga
tion
, %
(group 24, setup 12)
Figure G-20. Conductor Elongation for CP Wire Aged at 300ºC
G.9 DIELECTRIC PHASE ANGLE. Dielectric phase angle is normally used as an acceptance test for such items as radio frequency circuitry on printed circuit boards. By detecting the consistency of the phase angle and gain of the circuitry, a go/no-go determination of the circuitry’s compliance to design parameters can be performed quickly and with a high level of repeatability. Therefore, it was reasoned that it could be used successfully as a wire performance test in this program. The phase angle test equipment is shown in figure G-21.
Figure G-21. Phase Angle Test Equipment
G-18

Figure G-22 shows that the phase angle measurements at 2.5 kHz on PI specimens aged at 300°C in the straight condition and when subjected to the 10-times dynamic stressor did not change significantly during the aging process. Data plotted from measurements at 1.0 and 5.0 kHz showed similar results.
PI, 300 °C, 0% RH, Dynamic.Static = 10x.Straight
0.0
2.0
4.0
6.0
8.0
10.0
12.00
100
200
300
400
500
600
700
800
900
Aging H ours
E: P
has
e A
ngle
(2.
5 kH
z)
(group 5, setup 12)
Figure G-22. Phase Angle Measurements at 2.5 kHz for Straight PI Wire Aged at 300ºC
Figure G-23 shows that PV wire aged in the straight condition exhibited a trend of slowly increasing phase angle at 2.5 kHz. Although examining additional data could provide further insight concerning whether significant changes occur to the values, there were several problems that became apparent with the data and its variability within the level of change that occurs.
PV, 130 °C, 0% RH, Dynamic.Static = 10x.Straight
0.0
1.0
2.0
3.0
4.0
5.0
6.0
7.0
8.0
9.0
10.0
0
100
200
300
400
500
600
700
800
900
1000
Aging Hours
E: P
has
e A
ngle
(2.
5 kH
z)
(group 57, setup 11)
Figure G-23. Phase Angle Measurements at 2.5 kHz for Straight PV Wire Aged at 130ºC
G-19

For both PI and PV wire, the measured values from the different specimens at the same hold point were very consistent. To illustrate the problem for straight specimens, consider the set of data shown in table G-1. The table shows phase angle at selected frequencies of 2500 and 5000 Hz for PI specimen number 0336 (Group 4, setup 3). (This sample has WA number 1P1300A.) It was aged in the straight condition at 300ºC and received no stress between aging cycles.
Table G-1. Phase Angle for PI Specimen 0336
Frequency Cycle 0 Cycle 3 Cycle 6 Cycle 9 2500 8.4121 8.8392 8.69301 9.53009 5000 4.1289 4.22303 4.40681 4.47978
Table G-1 shows phase angle variation on the order of 0.5 degree at 5000 Hz and variations on the order of 1 degree at 2500 Hz. Now consider the following independent trials shown in tables G-2 and G-3 for the measurement of phase angle on the straight track. Specimens 0367 and 1646 are both PI specimens similar to specimen 0336. The results in these tables show the same order of magnitude of phase angle variation. Clearly, the test procedure does not record phase angle to the precision required to measure changes in phase angle by thermal aging.
Table G-2. Phase Angle for PI Specimen 0367
Frequency Trial 1 Trial 2 Trial 3 Trial 4
2500 8.98433 9.27556 9.56121 9.73205 5000 4.14901 4.43384 4.58699 4.57077
Table G-3. Phase Angle for PI Specimen 1646
Frequency Trial 1 Trial 2 Trial 3 Trial 4
2500 9.18589 9.76309 9.8182 9.75856 5000 4.46401 4.63749 4.76509 4.54720
Some additional trials were performed using untested PI wire in the straight configuration with foil shielding. Two tests were performed in a manner such that the wires were placed in the foil as close together as possible. From one test to the other, the wires were completely removed and then replaced into the foil covering. As can be seen in table G-4, the phase angle runs were close but still about 8 percent different at 2500 Hz and about 3 percent different at 5000 Hz.
Table G-4. Phase Angle for Unaged PI Specimen
Frequency Trial 1 Trial 2 2500 8.77720 8.40684 5000 4.24353 4.10628
G-20

Measuring phase angle with wrapped specimens is an entirely different problem, which has more promise for obtaining precise data. Wrapping a test specimen around a Teflon® mandrel (and aluminum foil ground plane) with a reference specimen is a repeatable operation. Table G-5 indicates independent trials measuring dielectric phase angle of an unaged cross-linked ethylene tetrafluoroethylene reference specimen wrapped with an unaged PI test specimen. Trials were performed with grounded aluminum foil underneath the wrapped specimens only (none over the top). The anomaly on Trial 4 is curious, but the rest of the data shows good repeatability to within 1 percent.
Table G-5. Phase Angle Measured With PI Specimen
Frequency Trial 1 Trial 2 Trial 3 Trial 4 Trial 5 2500 10.2448 10.21200 10.2455 10.9956 10.2439 5000 5.16272 5.17440 5.13182 5.58 5.19
There is still a problem, however, because independent trials (using the current version of TP-304) will also show that the test setup is capable of generating two stable configurations, which will give two competing sets of data. This data, compiled over three test cycles from Group 4, setup 6 specimens, is shown in table G-6. In one stable state, the gain was recorded at approximately -6.8 dB. In the other stable state, the gain was recorded at approximately -13 dB. Although there is some variation in the data for each stable configuration, this variation can be diminished by careful preparation of the specimens on the Teflon mandrels. Careful preparation of specimens and proper modifications to TP-304 will also ensure that the high gain state, which is the dominant state, will always be recorded.
Table G-6. Gain/Phase Angle Data at 5000 Hz, PI Samples From Group 4, Setup 6
Specimen Cycle Gain Phase Angle 0160 0 4.42206
3 -6.83481 4.85548 6 -12.9362 3.6508 9 -13.9193 3.55584
0751 0 3.95142 3 -8.28928 4.97099 6 -13.045 3.7693 9 -6.92532 4.23051
0910 0 4.32707 3 -6.76621 4.22449 6 -14.5267 3.43779 9 -13.898 3.39227
G.10 TIME DOMAIN REFLECTOMETRY. Time Domain Reflectometry (TDR) is an electronic test method used to determine the electrical condition of various types of transmission lines, though mainly intended for coaxial cable. The sophisticated meter, a TDR, is designed to transmit a fast electrical pulse down a cable and both
G-21

measure and tabulate reflected voltage returning on the cable to the source as a function of time. This information is normally displayed as a graph of characteristic impedance versus distance. To gather TDR data on the entire surface of the specimens, aluminum foil was used as the ground plane. Whereas other techniques that use solid ground planes can only test a small portion of wire at a time. As a check on the resultant traces, an additional measurement was taken of the aged and virgin PI pairs. With the aged pair on the setup and attached to the TDR leads, the vertical scale adjustment was changed to exaggerate the vertical scale. This had the effect of making the aged PI trace appear very inconsistent. Without making any adjustments to the TDR, the aged pair was removed and the virgin pair was positioned and attached to the TDR leads. The expanded vertical trace of the virgin pair looked just as inconsistent as the aged pair at the same settings. This supported the notion that the TDR cannot easily discern between virgin and aged samples. An additional test was performed on a CP virgin pair. To evaluate the ability of TDR to detect mechanical damage, a pair was attached to the TDR and then subjected to a repetitive sandpaper abrasion event along a 20-inch length. After each set of six back and forth manually applied cycles of the sandpaper over the 20-inch section, a TDR plot was printed. This test went on for over 40 sets of abrasion cycles before one of the wire conductors broke. The specifics of the test are described below. • A total of 42 traces were made periodically during this test as the wire was abraded.
• Traces 1 though 26 showed virtually no differences. During this period of abrasion, the Teflon topcoat of the CP wire was severely damaged, and about 80 percent was eliminated. Also during these cycles, the PI tape layer was severely damaged, thinned, and breeched.
• In traces 27 through 29, the TDR display began to show the first signs of a new shape. It is thought that the conductors of the two wires were first coming into contact with each other.
• Traces 30 through 33 saw a new shape of the trace, which remained consistent for these four cycles.
• Traces 34 through 42 introduced a final shape of the trace. Significantly, the trace for number 42, which is identical to the other eight, was recorded after the one conductor broke in two.
G.11 INSULATION TEST AND EVALUATION. The properties were measured using an Instron tensile machine pulling the slug at 2.0 inches per minute. The maximum force applied and the maximum elongation at the point of failure were recorded. Based upon the outer diameter of the specimen and the inner diameter (or conductor outer diameter), the tensile force was calculated. The conductor outer diameters tended to be within a fairly close tolerance. A statistically significant number of specimens for each wire type
G-22

were evaluated; and the conductor diameters of the specimens, unaged and aged, were determined to be statistically similar. The tensile force was calculated using the average dimension for the conductor outer dimension. PI wire began to exhibit stripping problems after only a few cycles. The conductor adhered to the insulation quite strongly. The data did track the aging of the wire quite well. Figure G-24 shows the change in tensile for Group 5 setup 12. Failure of the specimens by DWV occurred, following the inability of the wire insulation to resist yielding by the point required to survive the dynamic wrap around, a 10-times mandrel (equivalent to roughly 50% elongation). Figure G-25 shows how the elongation changed during this same period of aging. Samples that could not be stripped were tested using prestripped slugs, which tracked the results of the regular specimens fairly well.
PI, 300 °C, 0% RH, Dynamic.Static = 10x.Straight
0
5000
10000
15000
20000
25000
30000
0
100
200
300
400
500
600
700
800
900
Aging Hours
P: I
nsul
atio
n Te
nsile
- In
stro
n,
psi
(group 5, setup 12)
Figure G-24. Insulation Tensile Strength for PI Wire Aged at 300ºC
G-23

PI, 300 °C, 0% RH, Dynamic.Static = 10x.Straight
0
20
40
60
80
100
120
140
0
100
200
300
400
500
600
700
800
900
Aging Hours
P: I
nsul
atio
n El
onga
tion
- In
stro
n, %
(group 5, setup 12)
Figure G-25. Insulation Elongation for PI Wire Aged at 300ºC
The data generated using the alternate mandrel method for elongation was fairly consistent with data from other specimens, although these were biased up to some degree. This may be compensated by the assumption regarding the percentage of tensile versus compression on the upper and lower portions of a specimen. A 50%-50% split was assumed for all wire types. The crystallinity would affect the percentage used, and aged PI is quite crystalline. A general progression of decreasing tensile strength and elongation were seen with PV wire. Mandrel bend data could also be used to show the decrease in elongation as the wire aged. Unfortunately, the discrimination of the diameter bend decreases substantially as the sample goes to zero, or more accurately, to the wire diameter. The ability to distinguish values in the midrange of about 20%-40% elongation was not very good, and midterm aging values were difficult to obtain with this method. G.12 INSULATION MODULUS, INDENTER TYPE. Analog Interfaces’ version 3 of their Indenter Polymer Aging Monitor (IPAM 3) was developed as a means to perform nondestructive modulus and relaxation tests on aircraft wiring. Therefore, Indenter testing was incorporated into this study in an effort to gain further insight into the application of Indenter testing on commonly used aircraft wire insulation. The IPAM 3 system consists of a pocket personal computer (PC), which provides control interfacing and data storage, and a data acquisition unit to gather data from the Cable Clamp Assembly (CCA) and control its actions.
G-24

Indenter testing consists of performing a series of ten measurements on each wire test specimen’s insulation to obtain the averaged values of modulus and relaxation relative to the wire's aged condition. Indenter testing consists of, first, entering all pertinent wire data into the Pocket PC. This information is used to identify and track the tested wire specimen’s data that will be generated during the tests. Next the wire under test is positioned and clamped into the Indenter CCA. Care must be taken when positioning the CCA around the wire to ensure that the wire is correctly positioned at the bottom of the v-block clamps, which support the wire during the testing process. If the wire is not properly positioned or is allowed to bow or move away from the supporting v-block, then the readings obtained will not be accurate due to unsupported wire deflections. Once the wire is properly clamped, the operator initiates the testing sequence from the Pocket PC, and then presses the scan button on the CCA as directed by the Pocket PC. A sensitive force-measuring probe automatically extends until it contacts the wire. When the probe contacts the wire insulation, the system automatically notes the position of the Indenter tip. The system continues driving the probe tip into the insulation until a predetermined value of applied force is reached. In this test, the predetermined force was 2.0 pounds. During the time of probe advancement, the system is recording the applied probe force and the amount of probe advancement. This recording continues until the probe force value reaches a predetermined value, at which time the probe stops advancing. The slope of the cross plot of force versus deformation (distance) values is defined as the modulus value for the data values within the limits between 25% and 75% of the applied force. Once the probe stops advancing, an internal timer is started, and the system starts recording the probe tip force values at fixed time intervals. The change in probe force at a fixed extension over the measured time intervals is calculated and called the relaxation value. This provides a relative value of the insulation’s reaction to the application of a fixed depth indention over time. The nuclear energy industry has successfully integrated Indenter testing as an aid in determining when a nuclear reactor’s wiring insulation system is approaching its service limit so that it may be replaced before failure, thus preventing possible accidents involving the control and release of radioactive materials. While the insulation used on aircraft wiring systems is significantly different in material, thickness, and operating environment than the wiring systems used in the nuclear energy industry, the goals are essentially the same, prevention of wiring system failures and improved operating safety. Modulus and relaxation values for PI are shown in figures G-26 and G-27, respectively. Figure G-27 indicates wide variations in relaxation over the aging period. The specific causation of this variance is presently undetermined.
G-25

Hours
Mod
ulus
Ave
rage
9000800070006000500040003000200010000
1100
1000
900
800
700
600
500
400
300
200
Setup Info
PI, 300 °C, 0% RH, Dynamic.Static = 10x.StraightPI, 300 °C, 0% RH, Dynamic.Static = None.StraightPI, 95 °C, 100% RH, Dynamic.Static = 10x.10x
PI, 250 °C, 0% RH, Dynamic.Static = 10x.StraightPI, 300 °C, 0% RH, Dynamic.Static = 10x.10x
Indenter, Modulus
Figure G-26. Comparison of Indenter Modulus Results From Five Primary PI Setups
Hours
Rel
axat
ion
Ave
rage
9000800070006000500040003000200010000
240
220
200
180
160
140
120
100
Setup Info
PI, 300 °C, 0% RH, Dynamic.Static = 10x.StraightPI, 300 °C, 0% RH, Dynamic.Static = None.StraightPI, 95 °C, 100% RH, Dynamic.Static = 10x.10x
PI, 250 °C, 0% RH, Dynamic.Static = 10x.StraightPI, 300 °C, 0% RH, Dynamic.Static = 10x.10x
Indenter, Relaxation
Figure G-27. Comparison of Indenter Relaxation Results From Five Primary PI Setups Figures G-28 and G-29 show modulus and relaxation results, respectively, for PV wire aged at 130ºC. At first look with this limited data set, it appears that a modulus trend analysis may be possible. Relaxation values for PV may also be indicative of a trend, but more testing would be required to confirm this.
G-26

PV, 130 °C, 0% RH, Dynamic.Static = 10x.Straight
0.0
100.0
200.0
300.0
400.0
500.0
600.0
700.0
800.0
0
100
200
300
400
500
600
700
800
900
1000
Aging Hours
P: I
nden
ter,
Mod
ulus
(group 57, setup 11)
Figure G-28. Indenter Modulus for PV Wire Aged at 130ºC
PV, 130 °C, 0% RH, Dynamic.Static = 10x.Straight
0.0
5.0
10.0
15.0
20.0
25.0
30.0
35.0
0
100
200
300
400
500
600
700
800
900
1000
Aging Hours
P: I
nden
ter,
Rel
axat
ion
(group 57, setup 11)
Figure G-29. Indenter Relaxation for PV Wire Aged at 130ºC
G.13 INSULATION MODULUS, PROFILING. Modulus profiling is a technique developed at Sandia National Laboratories as a method to examine the inverse tensile compliance (referred to as the modulus) as a function of distance across a cross-sectional area of a given material. It has proven to be useful in yielding information about the aging characteristics of wire insulation and other materials, as well as the homo- or heterogeneity of these samples. This method has been well documented in the literature [G-1 through G-5] and is an excellent means to identify when diffusion-limited oxidation (DLO) conditions exist.
G-27
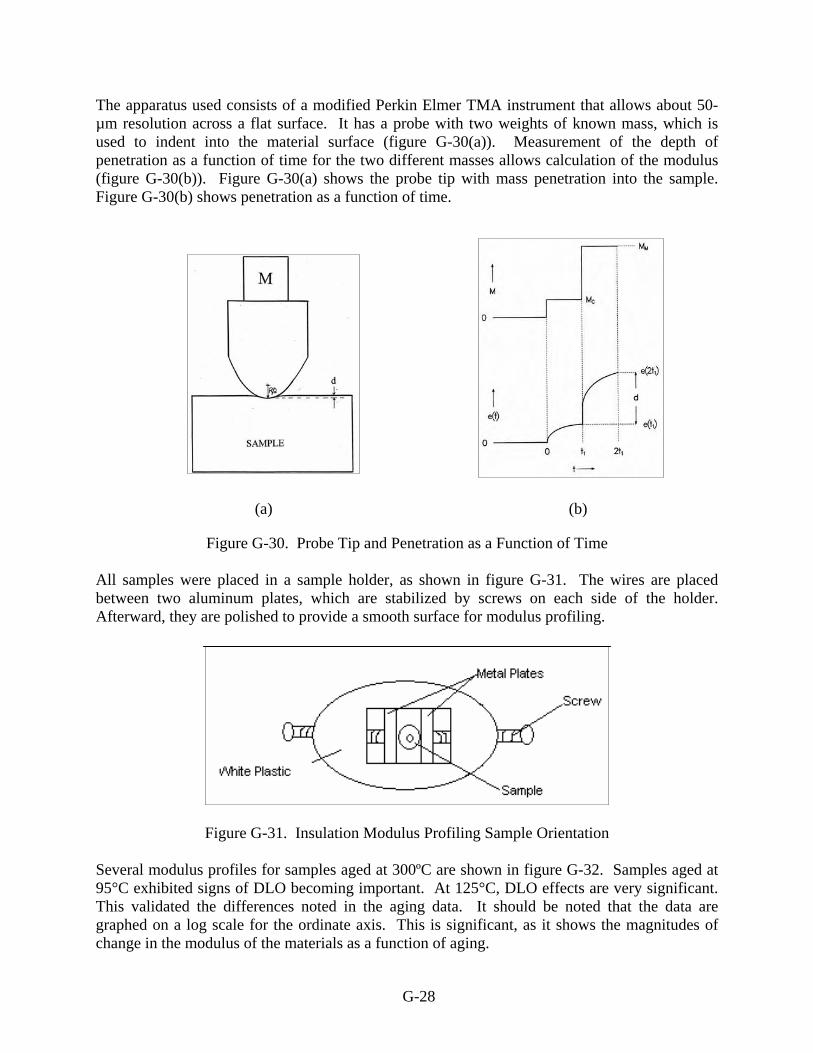
The apparatus used consists of a modified Perkin Elmer TMA instrument that allows about 50-µm resolution across a flat surface. It has a probe with two weights of known mass, which is used to indent into the material surface (figure G-30(a)). Measurement of the depth of penetration as a function of time for the two different masses allows calculation of the modulus (figure G-30(b)). Figure G-30(a) shows the probe tip with mass penetration into the sample. Figure G-30(b) shows penetration as a function of time.
(a) (b)
Figure G-30. Probe Tip and Penetration as a Function of Time All samples were placed in a sample holder, as shown in figure G-31. The wires are placed between two aluminum plates, which are stabilized by screws on each side of the holder. Afterward, they are polished to provide a smooth surface for modulus profiling.
Figure G-31. Insulation Modulus Profiling Sample Orientation Several modulus profiles for samples aged at 300ºC are shown in figure G-32. Samples aged at 95°C exhibited signs of DLO becoming important. At 125°C, DLO effects are very significant. This validated the differences noted in the aging data. It should be noted that the data are graphed on a log scale for the ordinate axis. This is significant, as it shows the magnitudes of change in the modulus of the materials as a function of aging.
G-28

Modulus Measurements: Unaged Yellow PI vs. 2PI300A PI-1165-6 TP-212 (PI)
1
10
100
1000
10000
100000
0 10 20 30 40 50 60 70 80 90 100
Position, %
Mod
ulus
D-1
(MPa
)
Unaged Yellow PI Cross SectionUnaged Yellow PI Along Crease2PI300A PI-1165-6 TP-212 (PI) Stripped2PI300A PI-1165-6 TP-212 (PI) Unstripped
Modulus Measurements: Unaged Yellow PI vs. 2PI300B PI-1229-6 TP-212 (PI)
1
10
100
1000
10000
100000
1000000
0 10 20 30 40 50 60 70 80 90 100
Position, %
Mod
ulus
D-1
(MPa
)
Unaged Yellow PI Cross SectionUnaged Yellow PI Along Crease2PI300B PI-1229-6 TP-212 Unstripped
Modulus Measurements: Unaged Yellow PI vs. 2PI300B TP-212-1231-14 (PI)
1
10
100
1000
10000
0 10 20 30 40 50 60 70 80 90 100
Position, %
Mod
ulus
D-1
(MPa
)
Unaged Yellow PI Cross SectionUnaged Yellow PI Along Crease2PI300B TP-212-1231-14 Unstripped
Modulus Measurements: Unaged Yellow PI vs. TP-212-1PI300A-1678-12 (PI)
1
10
100
1000
10000
100000
0 10 20 30 40 50 60 70 80 90 100
Position, %
Mod
ulus
D-1
(MPa
)
Unaged Yellow PI Cross SectionUnaged Yellow PI Along CreaseTP-212-1PI300A-1678-12 StrippedTP-212-1PI300A-1678-12 Unstripped
Modulus Measurements: Unaged Yellow PI vs. 1PI300A TP-212 SP#1677-6 (PI)
1
10
100
1000
10000
100000
0 10 20 30 40 50 60 70 80 90 100
Position, %
Mod
ulus
D-1
(MPa
)
Unaged Yellow PI Cross SectionUnaged Yellow PI Along Crease1PI300A TP-212 SP#1677-6 Stripped1PI300A TP-212 SP#1677-6 Unstripped
Modulus Measurements: Unaged Yellow PI vs. 2PI300B-1 TP-212-1229-0 (PI)
1
10
100
1000
10000
0 10 20 30 40 50 60 70 80 90 100
Position, %
Mod
ulus
D-1
(MPa
)
Unaged Yellow PI Cross SectionUnaged Yellow PI Along Crease2PI300B-1 TP-212-1229-0 Stripped2PI300B-1 TP-212-1229-0 Unstripped
Modulus Measurements: Unaged Yellow PI vs. 2PI300A-1 TP-212 1165-0 (PI)
0.1
1
10
100
1000
10000
100000
1000000
10000000
0 10 20 30 40 50 60 70 80 90 100
Position, %
Mod
ulus
D-1
(MPa
)
Unaged Yellow PI Cross SectionUnaged Yellow PI Along Crease2PI300A-1 TP-212 1165-0 (PI) Stripped2PI300A-1 TP-212 1165-0 (PI) Unstripped
Figure G-32. Modulus Profile Graphs for PI
Inherent viscosity-polyimide is a widely used polymer for wire insulation in aircraft, is a material derived from the reaction between pyromellitic dianhydride (PMDA) and 4,4’-diamino-diphenyl ether (ODA), and is an aromatic polyimide. It often is abbreviated PMDA-ODA, and the structural formula is shown in figure G-33. This polymer was synthesized by duPont in the 1960s and has the trade name Kapton®. The weight average molecular weight (WAMW) of a polymer is a very important property, and there are many analytical techniques to measure WAMW. For PMDA-ODA, inherent viscosity is used to determine its WAMW. This technique has been employed for over half a century by polymer chemists to determine WAMW. There are no other procedures at this time to determine the WAMW for PMDA-ODA due to its inertness.
I
Figure G-33. Polyimide Structural Formula
G-29

The top coat is removed from the wire, and the polyimide insulation tape unwrapped from the conductor. The polyimide insulation tape is cut into small sections and weighed. An appropriate amount of H2SO4 is added to make a solution of the proper concentration (c), in which the tape is dissolved. The undissolved pieces of nonpolyimide material (fluorocarbon) are separated by standard methods. The concentration of the polyimide is approximately 0.5 g/dl and the dissolution usually takes a few hours. The weight of the film has to be measured to ±0.2 mg and the volume of acid to ±0.05 ml. The viscosity of neat H2SO4 is measured by determining the time (to) for the solution to pass between the fiducial marks on a viscometer. After the dissolution of the film, measure the time (t) of the H2SO4-polymer solution to pass between the fiducial marks on a viscometer. The fluorocarbon residue from the insulation tape is weighed using standard analytical chemistry methods. The inherent viscosity is computed from the formula ηinh = (1/c) ln (η/ηo) where ηinh is the inherent viscosity, c is the concentration of the polymer, η is the viscosity of the dissolved polymer solution, and ηo is the viscosity of the solvent. Use average values for η and ηo. The viscosity measurement is made with a Cannon-Fenske viscometer where the flow times, t and to, are directly proportional to η and ηo, respectively. This does not apply to PV wire. G.14 DYNAMIC CUT-THROUGH. This test is based upon the standard ASTM D 3032 test method. The blade is pushed into the sample using a compression machine at a constant speed of 0.2 inch per minute. A blade with a cutting radius of 0.005 inch was used for this test program. The cut-off circuit stops the crosshead at the moment the blade makes contact with the conductor. G.15 STATIC CUT-THROUGH. This test has a similar purpose to the dynamic cut-through test but is based on the ASTM D 3032 procedure. This simulates a wire being subjected to cutting from a sharp edge. A static weight is placed on an assembly with a cutting edge (usually 0.02 in. (0.51 mm)). With properly chosen values of weight, the insulation on a wire will be cut-through in a time range of a few to a few hundred seconds. Comparisons can be made between unaged and aged wire. The apparatus consists of a rigid base plate with a clamp that holds the wire specimen perpendicular to the cutting edge, figure G-34. The cutting edge/carriage assembly rides on rails that allow it to move up and down freely. The cutting edge/carriage can be loaded with weight to change the downward force, and the time for the blade to penetrate to the conductor is measured. A 0.020-inch-diameter blade edge was used, and the weight was varied to achieve reasonable failure times in the second to minute range.
G-30

Figure G-34. The Static Cut-Through Apparatus Used to Test PI, CP, and PV Wire The unloaded cutting edge/carriage is allowed to rest on the wire, and the depth gauge reading is noted. Using the screw depth adjustment, the cutting edge/carriage is lifted off the wire approximately 10 mil, and the specified weight is loaded onto the carriage. Using the screw depth adjustment, the cutting edge is lowered to the previously noted depth gauge reading, and the timer is reset. A carriage release allows the carriage to fall past the carriage stop, which starts the timer. When the cutting edge touches the conductor of the specimen, a circuit is closed that controls and automatically shuts off the timer. The final depth gauge reading is recorded with a depth gauge to 0.001 inch. If the cut-through did not occur within 300 seconds, the time was recorded as 300 seconds. Usually eight tests were performed on each wire specimen. In some instances, the wire was severed at cut-through. The time to cut through the insulation varied greatly, even on test runs performed on the same wire length at a given hold point. G.16 WEIGHT LOSS. Figures G-35 and G-36 show examples of variability in sample weight at each hold point for PI and CP wire types, respectively. There was more variation as the aging continued, possibly due to a different degree of flaking from one PI sample to another, or it could indicate that lugs were lost, as in the case of CP wire.
G-31

(group 5, setup 12)
L: W
eigh
t ret
aine
d, (%
)
Aging Hours
100090
0
800
700
600
500
400
300
200
100
1.200
1.000
0.800
0.600
0.400
0.200
0.000
0
PI, 300 °C, 0% RH, Dynamic.Static = 10x.Straight
Figure G-35. Weight Loss Variability for PI Wire Aged at 300ºC
Figure G-36. Weight Loss Variability for CP Wire Aged at 300ºC
G-32

G.17 DENSITY. The density measurements were performed using the Archimedes approach. This involves obtaining the mass of the polymer in air while suspended in a solvent. The density of each sample was calculated by the following formula:
(average density of solvent from standards) x (sample mass in air) (sample mass in air – sample mass in isopropanol)
Each density measurement reported was based on the average of three samples. Isopropanol was the chosen solvent due to its low biohazard, ease of handling, relative immiscibly with most polymers, and inexpensive cost. This procedure does not apply to PI or CP wire. G.18 OXIDATION INDUCTION TIME. This test measures the oxidation induction time (OIT) of the insulating material from a wire test specimen. The OIT is trended with simulated age to determine if a correlation exists that can be used to monitor wire condition in service. This test requires less than a 10-mg sample of the insulation from the test specimen. The prepared test material is loaded into a specimen pan and placed in the Thermogravimetric Analysis chamber. Heating of the sample is initiated while under a nitrogen purge. Once the test temperature is reached, the purge is switched to oxygen, and the test is initiated, and then record the time to initiate oxidation. G.19 WIRE INSULATION DETERIORATION ANALYSIS SYSTEM. The purpose of this test is to determine the aging of PI insulated wire specimens subjected to thermal, mechanical, and humidity stresses. This test does not apply to CP or PV wire. The wire from which the specimens are cut is placed in a water bath, and an IR procedure check is performed. Sections where faults are detected are cut out of the wire, and the remaining segments are rechecked. Ring terminals are attached to both ends of the specimens, which are carefully wound on a mandrel, without twisting, by placing the ring terminals on the tensioned jig hook. The ring terminal on the free end is then placed on the same hook as the first ring terminal. Specimens are placed on the same mandrel until it is full. The jig is placed in a Pyrex® jar, and distilled water is added to the jar until the mandrel is submerged. The jar is placed in a heating mantle, and the water replacement reservoir and condenser columns and thermocouples are placed in/on the jars. (The specimens remain submerged during the test.) At a prescheduled elapsed time from the start of the test, each of the specimens automatically undergoes a high-voltage proof test, and the results are recorded.
G-33

Once all of the specimens in a jar have failed, the heating mantle is turned off and the specimens are removed when the water has cooled. G.20 FOURIER TRANSFORM INFRARED SPECTROSCOPY. A variety of materials analysis, aging, and characterization problems can be assessed with sophisticated multivariate calibration and classification methods. • Split the wire specimen into two samples using an appropriate method. One sample will
remain intact, and the other will be prepared for photoacoustic and infrared imaging. Cleaning of the infrared sample, if needed, will be performed.
• The subsection of sample to be prepared for infrared imaging will be placed in the
photoacoustic sample chamber, and a photoacoustic spectrum recorded, using the appropriate settings to achieve a relevant depth profile. More than one spectrum may be recorded per sample in an electronic format.
• The subsection of sample subjected to photoacoustic testing will be prepared for infrared
imaging. The cladding on the wire sample will be sectioned to an appropriate thickness in subsequent layers using a microtome. Each layer was identified, the top layer as –IRI-1, with subsequent layers identified as –IRI-2, IRI-3, etc. Each layer was then potted in an appropriate material to maintain sample integrity during and after microtoming.
• IR images shall be collected using settings appropriate to further data analysis. Repeat
images will also be collected at a given setting. More than once spectral image may be collected using alternate instrument parameters. Data collected was analyzed by visually observing spectral changes between aged and unaged samples and by using appropriate data analysis methods to further delineate spectral differences. The infrared data collected was then assessed for characteristics associated with aging.
G.21 ULTRAVIOLET-VISIBLE SPECTROSCOPY. This procedure does not apply to PI or CP wire. It is well known that, as PVC ages, it darkens in color. This could be attributed to the loss of HCl and the formation of an alkene. Conjugation of a number of these unsaturated units could be the source of the chromophore. As a result, ultraviolet-visible (UV-Vis) studies were suggested to monitor and provide quantification of the color change as a function of aging. No valid data was derived from this test since the PVC could not be physically separated from the conductor or the nylon jacket. The UV-Vis spectra obtained showed no radical differences in the visible region, 400-700 nm, as shown in figure G-37.
G-34
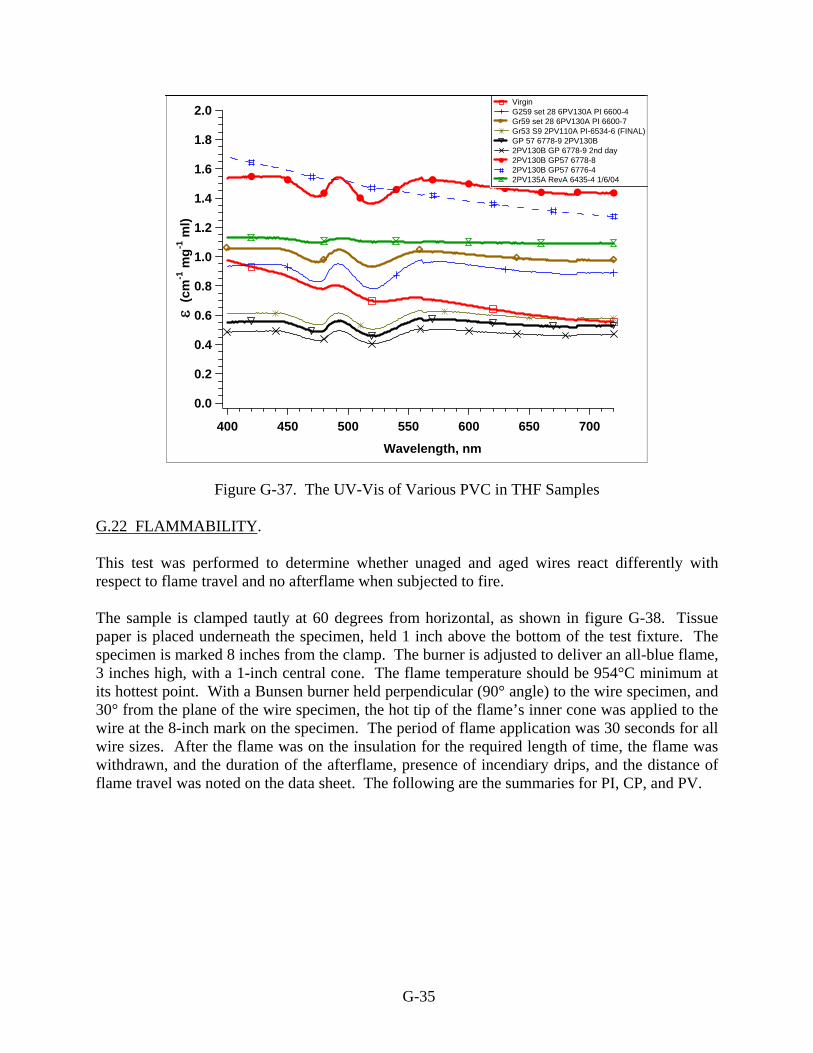
2.0
1.8
1.6
1.4
1.2
1.0
0.8
0.6
0.4
0.2
0.0
ε (c
m-1
mg-1
ml)
700650600550500450400
Wavelength, nm
Virgin G259 set 28 6PV130A PI 6600-4 Gr59 set 28 6PV130A PI 6600-7 Gr53 S9 2PV110A PI-6534-6 (FINAL) GP 57 6778-9 2PV130B 2PV130B GP 6778-9 2nd day 2PV130B GP57 6778-8 2PV130B GP57 6776-4 2PV135A RevA 6435-4 1/6/04
Figure G-37. The UV-Vis of Various PVC in THF Samples G.22 FLAMMABILITY. This test was performed to determine whether unaged and aged wires react differently with respect to flame travel and no afterflame when subjected to fire. The sample is clamped tautly at 60 degrees from horizontal, as shown in figure G-38. Tissue paper is placed underneath the specimen, held 1 inch above the bottom of the test fixture. The specimen is marked 8 inches from the clamp. The burner is adjusted to deliver an all-blue flame, 3 inches high, with a 1-inch central cone. The flame temperature should be 954°C minimum at its hottest point. With a Bunsen burner held perpendicular (90° angle) to the wire specimen, and 30° from the plane of the wire specimen, the hot tip of the flame’s inner cone was applied to the wire at the 8-inch mark on the specimen. The period of flame application was 30 seconds for all wire sizes. After the flame was on the insulation for the required length of time, the flame was withdrawn, and the duration of the afterflame, presence of incendiary drips, and the distance of flame travel was noted on the data sheet. The following are the summaries for PI, CP, and PV.
G-35

Figure G-38. Flammability Test Setup
• PI Flammability Samples: The time and distance the flame travels for new PI wire versus aged wire is not significantly different. All PI samples tested averaged 0.6 second duration and 1.46 inches of travel down the property test samples. Aging of the PI wire does not show any significant differences in the flammability results.
• CP Flammability Samples: The time and distance the flame travels for CP new wire
versus aged wire is not significantly different. All CP samples tested averaged 0.75 second duration and 2.09 inches of travel down the property test samples. Aging of the CP wire does not show any significant differences in the flammability results.
• PV Flammability Samples: Figure G-39 shows the flammability results for PV, Group 61
setup 30, samples. The time and distance the flame travels for PV new wire versus aged wire is not significantly different. All PV samples tested averaged 19.5 seconds duration and 3.02 inches of travel down the property test samples. The PV samples burned longer and had a longer distance of travel than the PI and CP samples. Aging of the PV wire does not show any significant differences in the flammability results.
G-36
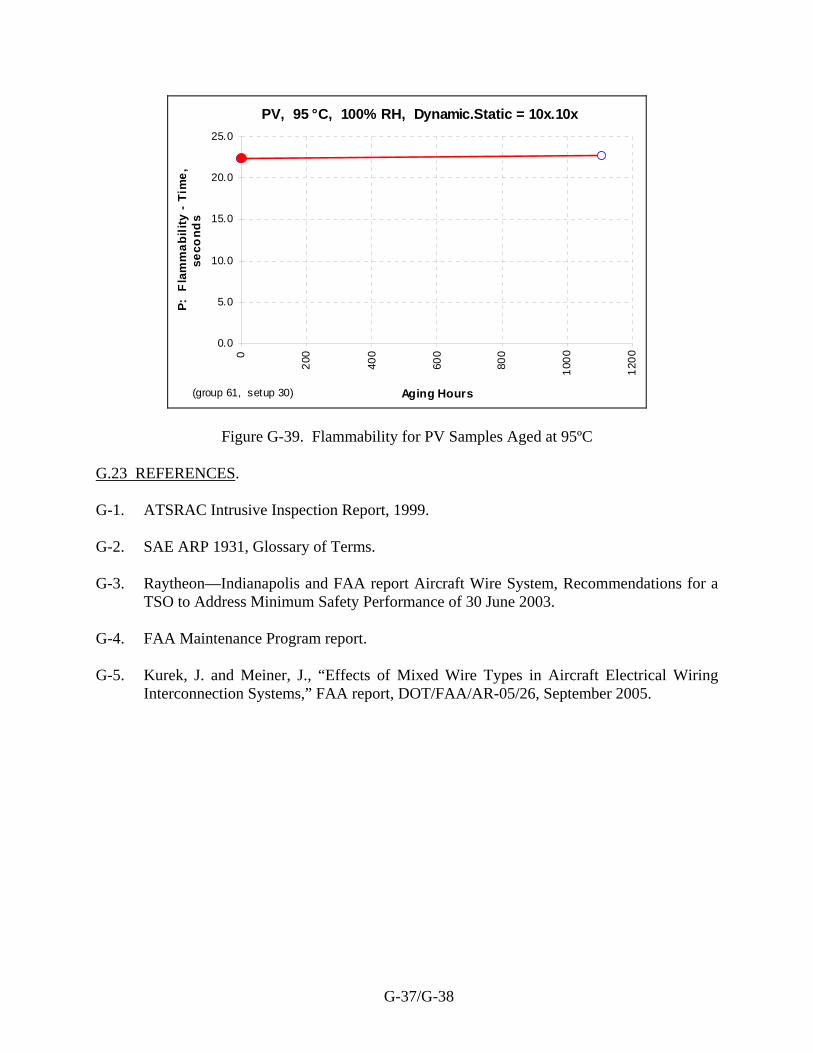
PV, 95 °C, 100% RH, Dynamic.Static = 10x.10x
0.0
5.0
10.0
15.0
20.0
25.0
0
200
400
600
800
1000
1200
Aging Hours
P: F
lam
mab
ility
- Ti
me,
seco
nds
(group 61, setup 30)
Figure G-39. Flammability for PV Samples Aged at 95ºC
G.23 REFERENCES. G-1. ATSRAC Intrusive Inspection Report, 1999. G-2. SAE ARP 1931, Glossary of Terms. G-3. Raytheon—Indianapolis and FAA report Aircraft Wire System, Recommendations for a
TSO to Address Minimum Safety Performance of 30 June 2003. G-4. FAA Maintenance Program report. G-5. Kurek, J. and Meiner, J., “Effects of Mixed Wire Types in Aircraft Electrical Wiring
Interconnection Systems,” FAA report, DOT/FAA/AR-05/26, September 2005.
G-37/G-38

APPENDIX H—MODEL DEVELOPMENT
H.1 EXAMINING STRESSOR RELATIONSHIPS. Plots were developed to look at the interactions that different stressors had with each other. The aging of polyimide (PI) in humidity has been found to be a multiorder reaction [H-1]. Figure H-1 shows how humidity interplayed with the dynamic stressors. Note, data was not available for all combinations. With no humidity, dynamic stresses 1 (none) and 2 (10 times) are nearly equivalent, but with humidity, dynamic stress 2 lasted much longer than 1, which was counter-intuitive.
Humidity
Mea
n
10
4.00
3.75
3.50
3.25
3.00
2.75
2.50
Dyn
346
12
Interaction Plot (data means) for Log(Hr)
Humidity (0 not present, 1 present)
Figure H-1. Interaction of Humidity With Dynamic Stressors
Figure H-2 shows how humidity interplayed with the static stressors. With no humidity, static stressor 1 (straight) and 2 (10 times) are approximately equivalent, but with humidity, static stressor 1 lived much longer than 2. The analysis suggested that this humidity (0, 1) times static stressor (1, 2) interaction was the largest. Using this relationship data, the humidity setups also seem to have a quadratic fit with temperature. Although the case has been made that the hydrolysis is reversible [H-1], this was only found to be partially the case, with the forward reaction occurring at a much greater rate than the reverse reaction. Nonannealed wire is affected more so by hydrolysis and other reactions, since the strain has not been relieved [H-2].
H-1

Humidity
Mea
n
10
3.6
3.5
3.4
3.3
3.2
3.1
3.0
2.9
Sta
34
12
Interaction Plot (data means) for Log(Hr)
Figure H-2. Interaction of Humidity With Static Stressors Figure H-3 presents the interactions between the dynamic and static stressors. The change (slopes) from static stressor 1 to static stressor 2 is comparable for three dynamic stressors (1, 2, and 3), but when the dynamic stressor is fluid exposure, the static stressors (1 versus 2) has much less effect (flatter slope). A total of four interaction terms and some temperature/humidity slope adjustments for the humidity setups were added to the simple additive model. While more complex, the final model fit the failure data much better than the initial simple additive model. The final model is more precise, reducing the predictive uncertainty by more than half (S = 0.1084 versus 0.2544). The final model explained 96.1% of the total variation in the actual adjusted Log(Life) results (versus 77.9% for the simple additive model).
H-2

Sta
Mea
n
4321
4.00
3.75
3.50
3.25
3.00
2.75
2.50
Dyn
346
12
Interaction Plot (data means) for Log(Hr)
Figure H-3. Interaction of Dynamic Stressors With Static Stressors Increasing temperature leads to a corresponding decrease in the average life of the wire. Data from this test program validated the temperature dependence of the wire degradation as following a general Arrhenius relationship, but some curvature existed. Although many researchers have previously identified aging in linear terms, based upon the Arrhenius relationship [H-3 and H-4], it became apparent that trends in the stressor degradation versus temperature were nonlinear with similarly shaped curves. For example, although the Arrhenius graph of the data shown in figure H-4 is graphed as linear on a log basis, a much better fit is seen using a quadratic curve. The uncertainty of the fit (S) improved from 0.075 to 0.045. Curvature of published data was often seen, even though the Arrhenius relationship was used as the approximation of the mechanistic model.
Temp
Log(
Hrs
)
300290280270260250
4.2
4.0
3.8
3.6
3.4
3.2
3.0
2.8
2.6
S 0.0745515R-Sq 96.5%R-Sq(adj) 96.4%
Regression99.7% PI
PI: DS=21, RH=0%Log(Hrs) = 8.492 - 0.01839 Temp
Temp
Log(
Hrs
)
300290280270260250
4.0
3.8
3.6
3.4
3.2
3.0
2.8
S 0.0445318R-Sq 98.8%R-Sq(adj) 98.7%
Regression99.7% PI
PI: DS=21, RH=0%Log(Hrs) = - 7.065 + 0.09573 Temp
- 0.000208 Temp**2
Figure H-4. Time-to-Failure PI Wire DS (2.1) Linear Fit on the Left,
Quadratic Fit on the Right
H-3

Each of the stressor combinations was graphed similarly. Plots of time-to-failure gave similar curve linear relationships across temperature, with the dynamic stressor (DS) (1,2), DS (2,2), DS (2,1), and DS (3,1) dynamic-static stressor combinations at 0% relative humidity (RH). All these dynamic-static stressor combinations followed the same curve linear form, with the curvature concave down. The concave down curvature suggests that the 0% RH activation energy may gradually increase at higher temperatures; the slope is steeper as the temperature increases. When humidity was included in the physical setups, only three DS (2,2) setups crossed at least two temperatures. The DS (2,2) setups at 70% and 85% RH only crossed two temperatures, thus the curvature could not be assessed, while the DS (2,2) setup at 100% RH crossed three temperatures, and the curvature was apparent and concave up, as shown in figure H-5. The concave up curvature suggests that the 100% RH activation energy may gradually decrease at higher temperatures; the slope is flatter as the temperature increases. It is also possible that the DS (2,2) curve at 70% RH is misleading, because only two points were available. If one end were higher or lower, the line would change dramatically. Three or more data points would improve the statistical confidence of the slope and presence of curvature.
Temp
Log(
Hrs
)
959085807570
3.8
3.6
3.4
3.2
3.0
2.8
2.6
2.4
2.2
2.0
S 0.143145R-Sq 80.9%R-Sq(adj) 79.8%
Regression99.7% PI
PI: DS=22, RH=85%Log(Hrs) = 4.810 - 0.02232 Temp
Temp
Log(
Hrs
)
100908070605040
3.6
3.2
2.8
2.4
2.0
S 0.104496R-Sq 95.8%R-Sq(adj) 95.5%
Regression99.7% PI
PI: DS=22, RH=100%Log(Hrs) = 5.437 - 0.05977 Temp
+ 0.000263 Temp**2
Figure H-5. Log of Time-to-Fail are PI Wire DS (2.2) Aged at 85% RH on the Left, Aged at 100% RH on the Right
The above interaction and humidity quadratic curvature terms were not incorporated into the final model, since the fit only improved slightly, and the algorithm became much more complex. A disadvantage to this is a more specific model with an error will result in estimates with a magnified error, producing more illogical estimations than a simplified model. A histogram of the residuals of the final model [actual Log(Life) - predicted Log(Life)] is provided in figure H-6. Note that these log-residuals are approximately normally distributed, with some slight skew to the left (toward early failures).
H-4

Residual
Freq
uenc
y
0.30.20.10.0-0.1-0.2-0.3
60
50
40
30
20
10
0
Histogram of the Residuals - PI Model(response is Log(Hrs))
Figure H-6. Histogram of the Failure Residuals Model 1
H.2 INCORPORATING STRESSOR RELATIONSHIPS INTO THE MODEL. The final model incorporated various interactions between the different stressors of the test program. Additional curvature was not added for the humidity setups. The general form of the model could be expected to change with other wire types and materials, but with the same material and other differences, (such as processors or lots of material), the general form should hold with a general shift in the model. Different models could be developed to predict first failure results rather than log average failures. Campbell and Bruning [H-5] made a case to treat wire failure end of life based upon the first failure; however, in this paper, the log average is used, since not all insulation failure will lead to an immediate electrical failure, even though the potential may be present. A wire design and installation should be able to absorb a certain amount of failure risk. The lognormal probability plot could be used to estimate the 10th percentile of the failure distribution for each setup (instead of the median, or 50th percentile). An alternate model was developed that included a curve-linear term for the average number of cycles within each setup. Expected Log(Life) decreased as the average number of test cycles increased and with a curvature that was concave up. With average cycles added to the model, the quadratic humidity terms were no longer needed. This suggests that the number of cycles and humidity curvature terms are confounded, and they provide similar information to the model’s fit. It is not clear which terms are more appropriate for the model. Both models have comparable fit qualities.
H-5

The uncertainty of the final log model fit is represented by a standard deviation of S = 0.1084 and a degree of error (expressed as the square of the residuals between the results and the algorithms—R2 percentage values) of 96%. This suggests that the Log(Life) predictions of the model should be accurate to within ±2S (to include approximately 95% of the failures), or that the actual Log(Life) results for a setup are expected to be within ±0.2168 log hours of the predicted value. By untransforming these log hour prediction intervals, the uncertainty band gets wider as the predicted life is higher. For example, the model’s prediction interval might range from 2.0000 to 2.2168 log hours. Taking the anti-log, the prediction interval for actual failures would range from 100 to 165 hours. Instead, let the model prediction interval be 3.0000 to 3.2168 log hours. Here, the actual failures would range between 1000 to 1647 hours (which is 10 times wider than the previous interval (even though the log hour intervals are the same width). Degradation of PI wire is dependent on the RH present. Increased humidity corresponds to a decrease in the average life of the wire. The effect of humidity on the degradation of PI wire also follows an Arrhenius relationship. One setup included an aging environment that cycled the wire between 85% and 25% RH with equal residence time at each level. The results indicated that this was equivalent to aging at 72.8% RH. Increased humidity, in addition to increased temperature, plays a dramatic role in the degradation mechanisms. This relationship is shown by the degradation algorithm that was developed based on the tests performed in this program. H.3 POLYIMIDE AGING ALGORITHM. The oxidation and hydrolysis of these materials were the significant chemical factors that affected the degradation of the wire. The model that was developed shows that mechanical stressor terms are mainly additive, although there are some interactions that take place, as seen through the multiplied terms. The resulting degradation algorithm follows:
H-6

Model 1 L = 9.2794 - 0.01995*T - 0.04110*RH +D+S+ 0.89141*H - 0.0022992*H*T - 0.020248*RH*G + 0.12481*J – 0.10783*K – 0.60627*L – 0.84442*M Where: L = Life (hrs, mean to fail) T = Temperature (°C) RH = Relative humidity (%) H = Humidity (0 no, or 1 yes) D = one of the dynamic coefficients below based upon the environment of aging. S = one of the static coefficients below based upon the environment of aging. G = 1 if the dynamic – humidity stressor combination was 11, otherwise 0. J = 1 if the dynamic – static stressor combination was 11, 22 or 51, otherwise 0. K = 1 if the dynamic – static stressor combination was 31 or 62, otherwise 0. L = 1 if the static stressor – humidity combination was 10, 21, 31 or 41, otherwise 0. M = 1 if the dynamic stressor – humidity combination was 10 or 21, 31, or 50 otherwise 0. Note: Values can be interpolated for stresses between those listed. Dynamic stressor Static stressor Coefficients (D) Coefficients (S) No Wrap 0.87564 Straight 0.51061 10-times - 0.28817 10-times -0.23652 three-times -0.50837 six-times -0.35522 Temp Cycling 0.08959 1x 0.08112 Vibration* 0.87564 Fluid -0.16869 *Note: wires subjected to vibration did not change the effective degradation model from those samples that were not wrapped.
The algorithm above tracks the actual aging very well, as it should, considering the model is based on the empirical data. The square of the residuals, R2, is 96.1%, indicating a decent correlation across the board with the various environmental stressors that were evaluated. The fit can be improved somewhat by modeling the humidity and temperature mechanisms separately. This is due to the magnitude of the impact the hydrolysis plays with the degradation and the fact that the overlap of the two mechanisms within this accelerated aging program was so small. Conditions above about 100°C will actually result in very low humidity in the test setups, due to the vapor pressure of water. Table H-1 presents the estimated failure data, based on the model above, along with the actual log average failure times of each setup. As seen by the comparisons of the setups with a variety of stressors, the failure time can be dramatically altered by the presence of certain stressors and stressor combinations. The Arrhenius-based model was not designed to accommodate these various stressors. With the additional analysis of the data and further model development, the fit was improved greatly using Model 1.
H-7

Table H-1. Comparison of Actual Failure Data to Predicted Failure Data by the Algorithm
Group Setup Temp.(°C)
Humidity (% RH)
Dynamic Stressor
Static Stressor
Actual Median Failure Time (hr)
Predicted Median Failure Time (hr)
Percent Difference
1 9 250 0 10-times Straight 7276 8,079 11 1 13 250 0 10-times 10-times 7695 7,786 1 1 16 250 0 3-times Straight 3485 3,796 9 2 4 260 0 None 10-times 7732 7,698 0 2 21 260 0 Temp 10-times 8805 8,805 0 3 5 280 0 None 10-times 3291 3,071 -7 3 11 280 0 10-times Straight 2662 2,036 -24 3 14 280 0 10-times 10-times 2245 1,962 -13 3 17 280 0 3-times Straight 970 957 -1 4 3 300 0 None Straight 2977 2,259 -24 4 6 300 0 None 10-times 932 1,225 32 4 7 300 0 None 6-times 932 932 0 4 8 300 0 None 1 time 2546 2,546 0 5 12 300 0 10-times Straight 843 812 -4 5 15 300 0 10-times 10-times 564 783 39 5 18 300 0 3-times Straight 335 382 14 5 19 300 0 3-times 10-times 441 354 -20 7 28 300 0 Fluid Straight 875 1,070 22 7 29 300 0 Fluid 10-times 752 603 -20 8 34 70 70 10-times 10-times 7456 8,226 3 9 30 95 70 None 10-times 6239 6,239 0 9 35 95 70 10-times 10-times 4274 2,932 -50
10 38 70 85 10-times 10-times 1766 1,491 5 11 41 45 100 10-times 10-times 1908 1,908 -15 12 42 70 100 10-times 10-times 349 379 29 13 33 95 100 None 10-times 90 90 0 14 40 95 100 10-times Straight 2316 2,150 -9 15 43 95 100 10-times 10-times 136 135 -9 16 36 70 85-25 10-times 10-times 5755 5,829 2 17 37 95 85 10-times Straight 7371 8,448 18 17 39 95 85 10-times 10-times 488 531 6 2 1 260 0 None Straight >10150 * ** 14,192 2 24 260 0 Vibration Straight >10150 * 14,192 3 2 280 0 None Straight >4444 * 5,662 9 31 95 70 None 6-times >2864 * 4,747 9 32 95 70 None 1time >3537 * 12,964
18 10 270 0 10x10-times Straight >800 * 3,223
*Setup stopped prior to failure of specimens. Actual hours of aging when stopped. **Setup failed (9 of 11 specimens) when excess handling (mechanical) stress placed on the wires outside the
prescribed protocol. The algorithm defines how the wire is degraded by the stressors examined in this test program. Model 1 takes into account the temperature, humidity, and each of the dynamic-static stressors,
H-8

and the interactions between the stressors. These are expressed in linear slopes as well as quadratic terms in the model. Two possible explanations might account for the longer failure times observed in the present study compared to the Elliot study [H-3]: 1. The Elliot study was conducted over 30 years ago, using specimens cut from a particular
(different) spool of wire. Different decades, manufacturers, production batches, and processes may account for the observed bias.
2. The air-exchange rates in the aging chambers may have been different in the two studies. The typical setup in the current study used approximately 2-5 air exchanges per hour during aging. If the Elliot study was conducted at a higher airflow, the oxidation rates may have been faster, resulting in earlier failure times.
The second explanation was tested by running two extra PI setups at 300°C (at 61 and 125 air exchanges per hour). The test results supported the theory: PI failure times were lower at the highest airflow. This suggests it is important to maintain a consistent airflow while conducting any comparative tests using PI wire. The results show that the difference in oxidation is fairly small for short-term testing. This indicates that the aging is probably not diffusion-limited. For longer-term aging at lower temperatures, this effect may be more pronounced and would be more similar to the differences seen on aircraft inspections between wire that was in the interior or exterior of large bundles. It is postulated that the diffusion of oxygen is less toward the interior of large bundles. The intrusive inspection noted that the wire on the interior of large bundles was often in better shape (more flexible, less discoloration, and fewer cracks) than wire that was more exposed. Since the limit of oxygen availability appeared to have little effect on the sample failure, the difference could be related to the exposure of the wire to ultraviolet light. The aging of PI in humidity was determined to be a multiorder reaction. Dupont [H-2] had suggested a 5th order reaction that was reversible. The testing in this test program did not find that to be the case. The setup run at a cycled 25%-85% RH at 70°C provided a data point that showed the reaction is somewhat reversible, but at a much smaller rate than with the forward reaction. This may depend on the temperatures; however, a steady-state operating condition of the wire will be at a single elevated temperature rather than cycling through very high temperatures. There may be a specific RH that allows reverse reaction to occur. This value is expected to vary based on temperature (Le Chatelier’s principle). This data does show that at low RH, there is a slowing effect.
Polyimide + OH- -imide
Based on the data from DuPont, if the reaction with humidity was a 5th order reaction, there would be several relative maximums and minimums. The graph in the DuPont paper shows that below ~40% RH, there is little to no hydrolysis occurring. Humidity cycles were weighted towards the high end, indicating that the part did not return to the unhydrolyzed state at 70°C. It is possible that at elevated temperature, the wire may return to the unhydrolyzed state; however,
H-9

at higher temperatures, the wire would not be subjected to the amount of humidity as at lower temperatures. The time-to-failure at very high temperature is not indicative of most aircraft conditions. Correlation to more typical aircraft operating conditions, temperature = 71°C and RH = 33%, (see table H-1) shows the estimated hours to be approximately 240,000 hours to the median failure when a dynamic bend of 10 times is present. For wire that is not mechanically disturbed, the time increases dramatically to 4 x 10⁶ hours, provided no nonaging unpredictable event takes place to severely damage the wire. It is estimated that over long periods, the effects of vibration and general surface wear will increase the aging somewhat faster than no stress at all. Conditions that approach ambient should actually estimate life based on total hours since installation, rather than operating hours. The predicted values are very close to the original estimates for the setups that were aged with the standard ASTM International baseline conditions. The large difference of the failure times for other stressors compared to the ASTM baseline shows how important taking these other stressors into account can be. Based on table H-1, the model results in predicted values that are very close to the values actually determined based on the test results. The model validates some of the engineering judgment regarding the effects of various stressors on the life of the wire. Not all the data points match the predicted values. Although the model is based on the empirical data from the test program, the model was designed to be flexible in order to add terms that may be determined in the future. The model is very specific to the setups for which data were collected. The model is very close in all these areas, however, as evidenced by the setups that have not resulted in dielectric withstand voltage (DWV) failures, there was no data to fit the model in those specific areas. One drawback to a tight model is that the error in a specific setup would be incorporated into the model, unless multiple runs were performed. The model is much better at defining the effect of common stressors on the estimated life of the wire to the point that the potential for DWV failures increases dramatically. This model differs from many that have been developed in the past that were based on theoretical rates of reactions. The number of actual mechanistic reactions that could be degrading the wire is endless. Instead of slowly developing a model based on each reaction, the data from many aged specimens exposed to common multiple stressors was used to rapidly build a degradation model that can be further developed in the future. The data from dynamic stressor 4, temperature cycling, showed that the mean life actually increased compared to the nonstressed setups. The reason for this is not known; however, it is possible that the gentle working of the wire may keep the wire somewhat flexible, lessening the effect of the mechanical strain. No data were available from aging stressor 5, vibration causing surface abrasion. For PI, samples aged under this group did not fail within the time allowed. Samples aged with this stressor were stopped after 10,150 hours, with the mean average already being greater than samples subjected to stressor 4. Increasing the stress levels of these setups could increase the aging. Vibration of aircraft should not have too great of an affect, provided the elongation of the wire insulation is sufficient to withstand other stressors. When aged
H-10

sufficiently, as seen by testing with no external physical stressors, the slightest physical movement can cause disintegration of the insulation. When no stressor was applied, even careful handling in the laboratory was enough to cause the specimens to fail. Dynamic bending was a high-level stress, and the 3-times bend was significantly more stressful than the 10-times bend. Thermal shock and vibration were lower-level stresses. Fluid contamination, when present, can significantly increase the rate of degradation. Static strain can cause significant changes in the aging; however, it, in itself, only played a part in the increased aging. The geometry of the specimens, and how they had to be handled and bent, played the most significant role in the aging process. Single-event perturbations to the aging process are expected to have the greatest role in the failure of the wire, since they usually become the initiation of the failure. H.4 REFERENCES. H-1. NTSB TWA Flight 800 Investigation. H-2. Gillen, K.T., Celina, M., Clough, R.L., and Wise, J., “Extrapolation of Accelerated Aging
Data—Arrhenius or Erroneous?,” Trends in Polymer Science, Cambridge, United Kingdom, Vol. 5, 1997, pp. 250-257.
H-3. Elliot, D., “A Standardized Procedure for Evaluating the Relative Thermal Life and
Temperature Rating of Thin-Wall Airframe Wire Insulation,” IEEE, March 1972. H-4. Toop, D.J., “Theory of Life Testing and Use of Thermogravimetric Analysis to Predict
the Thermal Life of Wire Enamel,” IEEE, Vol. E1-6, No. 1, 1974. H-5. Dakin, T.W., “Electrical Insulation Deterioration Treated as a Chemical Rate
Phenomenon,” AIEE Trans., Vol. 67, Pt. 1, 1948.
H-11/H-12