aircraft performance - university of...
TRANSCRIPT

AIRCRAFT PERFORMANCE
4/3/2012 ME 471 - Aerodynamics
Compiled by Rajat Chakravarty

AIRCRAFT PERFORMANCE
Page 1
AIRCRAFT PERFORMANCE M E 4 7 1 - A E R O D Y N A M I C S
1 INTRODUCTION
During its normal operation an airplane takes off, climbs to the cruising altitude, cruises at almost constant
altitude, descends and lands. It may also fly along curved paths like turns, loops etc. The flights along curved
paths are also called maneuvers.
1.1 Subdivisions of performance analysis
Performance analysis covers the following aspects:
I) Unaccelerated flights
a) In a steady level flight an airplane moves with constant velocity at a constant altitude. This analysis
would give information on the maximum level speed and minimum level speed at different altitudes.
b) In a steady climb an airplane climbs at constant velocity. This analysis would provide information on
the maximum rate of climb, maximum angle of climb and maximum attainable altitude (ceiling).
c) In a steady descent an airplane descends with constant velocity. A glide is a descent with zero thrust.
This analysis would give the minimum rate of sink and time to descend from an altitude.
d) Range is the horizontal distance covered, with respect to a given point on the ground, with a given
amount of fuel. Endurance is the time for which an airplane can remain in air with a given amount of
fuel.
II) Accelerated flights:
a) In an accelerated level flight an airplane moves along a straight line at constant altitude and
undergoes change in flight speed. This analysis provides information about the time required and
distance covered during acceleration over a specified velocity range.
b) In an accelerated climb, an airplane climbs along a straight line accompanied by a change in flight
speed. This analysis gives information about the change in the rate of climb in an accelerated flight as
compared to that in a steady climb.
c) Loop is a flight along a curved path in a vertical plane whereas a turn is a flight along a curved path
in a horizontal plane. This analysis would give information about the maximum rate of turn and
minimum radius of turn. These items indicate the maneuverability of an airplane.
d) During a take-off flight an airplane starts from rest and attains a specified height above the ground.
This analysis would give information about the take-off distance required.
e) During a landing operation the airplane descends from a specified height above the airport, lands
and comes to rest. This analysis would provide information about the distance required for landing.

AIRCRAFT PERFORMANCE
Page 2
1.2 Impor tance of performance analysis
Performance analysis is important to assess the capabilities of an airplane. Moreover, from the point of view
of an airplane designer, this analysis would give the thrust or power required, maximum lift coefficient
required etc. to achieve a desired performance. This analysis would also point out the new developments
required, in airplane aerodynamics and engine performance, to achieve better airplane performance.
1.3 Approach in performance analysis
The approach here is to apply the Newton’s laws and arrive at the equations of motion. The analysis of these
equations would give the performance.
A ‘Flight path’ is the line along which the center of gravity (c.g.) of the airplane moves. Tangent to the flight
path gives the direction of the ‘Flight velocity’ (see Fig. 1.1).
Fig. 1.1 Flight path
The external forces acting on a rigid airplane are:
a) Aerodynamic forces (lift and drag)
b) Gravitational force
c) Propulsive force (thrust)
The forces produced due to control deflection, needed to balance the moments, are assumed to be small as
compared to the other forces. With this assumption all the forces acting on the airplane are located at the
center of gravity (c.g.) of the airplane (Fig. 1.2) and its motion is simplified to that of a point mass moving
under the influence of aerodynamic, propulsive and gravitational forces.

AIRCRAFT PERFORMANCE
Page 3
Fig. 1.2 Steady level flight
2 STEADY LEVEL FLIGHT
2.1 Equations of Motion for Steady Flight
In this flight, the c.g. of the airplane moves along a straight line at a constant velocity and at a given altitude.
The flight path, in this case, is a horizontal line. The forces acting on the airplane are shown in Fig. 1.2. 𝑇 is
Thrust, 𝐷 is Drag, 𝐿 is lift and 𝑊 is the weight of the airplane. The equations of motion are obtained by
resolving forces along and perpendicular to the flight direction on the airplane. In the present case, the
following equations are obtained.
𝑇 − 𝐷 = 𝑚𝑎𝑥
𝐿 − 𝑊 = 𝑚𝑎𝑧
where, 𝑚 is the mass of airplane and 𝑎𝑥 , and 𝑎𝑧, are the components of the acceleration along and
perpendicular to the flight path respectively. As the flight is steady i.e. no acceleration along the tangent to
the flight path, implies that 𝑎𝑥 = 0. Further, the flight is straight and at constant altitude, hence, 𝑎𝑧 = 0.
Consequently, the equations of motion reduce to:
𝑇 – 𝐷 = 0
𝐿 – 𝑊 = 0
Noting that, 𝐿 = 1
2𝜌𝑉2𝑆𝐶𝐿 and 𝐿 = 𝑊 in level flight, gives:
𝑊 = 1
2𝜌𝑉2𝑆𝐶𝐿
𝑉 = √2𝑊
𝜌𝑆𝐶𝐿

AIRCRAFT PERFORMANCE
Page 4
Further,
1
2𝜌𝑉2𝑆 =
𝑊
𝐶𝐿
Noting that, 𝐷 = 1
2𝜌𝑉2𝑆𝐶𝐷 and 𝑇 = 𝐷 in level flight, gives the thrust required (𝑇𝑟) as:
𝑇𝑟 = 𝐷 = 1
2𝜌𝑉2𝑆𝐶𝐷
Substituting for 1
2𝜌𝑉2𝑆 =
𝑊
𝐶𝐿, yields:
𝑇𝑟 = 𝑊𝐶𝐷
𝐶𝐿
The power required (𝑃𝑟) is given by:
𝑃𝑟 = 𝑇𝑟𝑉
Substituting for 𝑉 and 𝑇𝑟 yields:
𝑃𝑟 = 𝑊𝐶𝐷
𝐶𝐿
√2𝑊
𝜌𝑆𝐶𝐿
𝑃𝑟 = √2𝑊3
𝜌𝑆
𝐶𝐷
𝐶𝐿3/2
These are the basic equations for steady level flight and would be used in subsequent analysis of this flight.
To fly in a steady level flight at chosen values of h and V, the pilot should adjust the following settings:
a) The angle of attack of the airplane to get the desired lift coefficient so that the lift equals the weight.
b) The throttle setting of the engine, so that thrust equals drag at the desired angle of attack. The pilot
will also have to adjust the elevator so that the airplane is held in equilibrium and the pitching moment
about c.g. is zero at the required angle of attack. As noted earlier, the forces (lift and drag)
produced due to the elevator deflection are neglected.
2.2 Stalling speed
Consider that an airplane which has weight 𝑊 and wing area 𝑆, is flying at an altitude ℎ. It is thus observed
that, the flight velocity 𝑉 is proportional to 1
√𝐶𝐿. Thus, the value of 𝐶𝐿 required would increase as the flight
speed decreases. Since 𝐶𝐿 cannot exceed 𝐶𝐿𝑚𝑎𝑥, there is a flight speed below which level flight is not
possible. The flight speed at which 𝐶𝐿 equals 𝐶𝐿𝑚𝑎𝑥 is called ‘Stalling speed’ and is denoted by 𝑉𝑠𝑡𝑎𝑙𝑙.
𝑉𝑠𝑡𝑎𝑙𝑙 = √2𝑊
𝜌𝑆𝐶𝐿𝑚𝑎𝑥

AIRCRAFT PERFORMANCE
Page 5
2.3 Thrust and power required in steady level flight – general case
The drag coefficient 𝐶𝐷 depends on the lift coefficient 𝐶𝐿 and the Mach number. The relationship between 𝐶𝐷
and 𝐶𝐿 , the drag polar, is already known from the estimation of the aerodynamic characteristics of the
airplane. Thus, when the drag polar, the weight of the airplane and the wing area are prescribed, the thrust
required and the power required in steady level flight at various speeds and altitudes can be calculated for
any airplane using the above equations. The steps are as follows:
a) Choose an altitude ℎ.
b) Choose a flight velocity 𝑉.
c) For chosen values of 𝑉 and ℎ, and given values of weight of airplane 𝑊 and wing area 𝑆 calculate
𝐶𝐿 as:
𝐶𝐿 = 2𝑊
𝜌𝑉2𝑆
where 𝜌 corresponds to the density at the chosen ℎ.
d) Calculate Mach number from 𝑀 = 𝑉/𝑎; 𝑎 is the speed of sound at the chosen altitude.
e) For the values of 𝐶𝐿 and 𝑀, calculated in steps (iii) and (iv), obtain 𝐶𝐷 from the drag polar.
f) Knowing 𝐶𝐷, the thrust required 𝑇𝑟 and power required 𝑃𝑟 can now be calculated.
2.4 Thrust and power required – when drag polar is independent of 𝑴
When the Mach number is less than about 0.7, the drag polar is generally independent of Mach number. In
this case, 𝐶𝐷
𝐶𝐿 and
𝐶𝐷
𝐶𝐿3/2 can be calculated for different values of 𝐶𝐿 . The curves shown in Figs. 2.1a and b are
obtained by plotting 𝐶𝐷
𝐶𝐿 and
𝐶𝐷
𝐶𝐿3/2 as functions of 𝐶𝐿 . From these curves it is observed that
𝐶𝐷
𝐶𝐿 is minimum at a
certain value of 𝐶𝐿 . This 𝐶𝐿 is denoted by 𝐶𝐿𝑚𝑑 as the drag is minimum at this 𝐶𝐿 . The power required is
minimum when 𝐶𝐷
𝐶𝐿3/2
is minimum. The 𝐶𝐿 at which this occurs is denoted by 𝐶𝐿𝑚𝑝. Thus in steady level flight:
𝑇𝑟𝑚𝑖𝑛= 𝑊 (
𝐶𝐷
𝐶𝐿)
𝑚𝑖𝑛
𝑃𝑟𝑚𝑖𝑛= √
2𝑊3
𝜌𝑆(
𝐶𝐷
𝐶𝐿3/2
)𝑚𝑖𝑛

AIRCRAFT PERFORMANCE
Page 6
Fig. 2.1a Variation of 𝐶𝐷
𝐶𝐿 with 𝐶𝐿
Fig. 2.1b Variation of 𝐶𝐷
𝐶𝐿3/2 with 𝐶𝐿

AIRCRAFT PERFORMANCE
Page 7
The speeds, at which the drag and the power required are minimum are denoted by 𝑉𝑚𝑑 and 𝑉𝑚𝑝
respectively. The expressions for 𝑉𝑚𝑑 and 𝑉𝑚𝑝 are:
𝑉𝑚𝑑 = √2𝑊
𝜌𝑆𝐶𝐿𝑚𝑑
𝑉𝑚𝑝 = √2𝑊
𝜌𝑆𝐶𝐿𝑚𝑝
𝐶𝐿𝑚𝑑 and 𝐶𝐿𝑚𝑝
are not equal and the corresponding speeds are different. As the density occurs in the
denominator, it implies that 𝑉𝑚𝑑 and 𝑉𝑚𝑝 increase with altitude. Since for Mach number is lower than about
0.7, the drag polar is assumed to be independent of Mach number, the values of 𝐶𝐿𝑚𝑑, 𝐶𝐿𝑚𝑝
, (𝐶𝐷
𝐶𝐿)
𝑚𝑖𝑛 and
(𝐶𝐷
𝐶𝐿3/2)
𝑚𝑖𝑛 are also independent of Mach number. It can thus be seen that 𝑇𝑟𝑚𝑖𝑛
is independent of altitude
whereas 𝑃𝑟𝑚𝑖𝑛 increases with altitude in proportion to
1
√𝜌.
It is also observed in Fig. 2.1a that a line drawn parallel to the X-axis cuts the curve at two points 𝐴 and 𝐵.
This shows that for the same value of 𝐶𝐷
𝐶𝐿 or the thrust 𝑇𝑟 = 𝑊
𝐶𝐷
𝐶𝐿, an airplane can have steady level flight at
two values of lift coefficients viz. 𝐶𝐿𝐴 and 𝐶𝐿𝐵
. From Eq. (5.2) each value of 𝐶𝐿 corresponds to a velocity.
Hence for the same amount of thrust, in general, flight is possible at two speeds (𝑉𝐴 and 𝑉𝐵). These speeds
are:
𝑉𝐴 = √2𝑊
𝜌𝑆𝐶𝐿𝐴
𝑉𝐵 = √2𝑊
𝜌𝑆𝐶𝐿𝐵
Similarly, from Fig. 2.1b it is observed that with the same power, in general, level flight is possible at two
values of lift coefficient viz. 𝐶𝐿𝐴 and 𝐶𝐿𝐵
and correspondingly at two flight speeds viz. 𝑉𝐴 and 𝑉𝐵.
Typical variations of thrust required with flight speed and altitude are shown in Fig. 2.2. Following interesting
observations are made in this case where the drag polar is independent of Mach number. The minimum drag
depends only on 𝑊 and (𝐶𝐷
𝐶𝐿)
𝑚𝑖𝑛 and hence is independent of altitude. However, the speed corresponding to
minimum drag 𝑉𝑚𝑑 increases with altitude. Hence, the thrust required curves at various altitudes have the
same minimum thrust at all altitudes and the curves have a horizontal line, corresponding to 𝑇 = 𝑇𝑟𝑚𝑖𝑛, as a
common tangent (see Fig. 2.2). This feature should be kept in mind when thrust required curves for subsonic
airplanes are plotted.

AIRCRAFT PERFORMANCE
Page 8
Fig. 2.2 Thrust required and thrust available for subsonic jet airplane
Typical variations of power required with flight speed are shown in Fig. 2.3a. Interesting observations are
made in this case also. The minimum power required 𝑃𝑟𝑚𝑖𝑛 depends on 𝑊3/2, (
𝐶𝐷
𝐶𝐿3/2)
𝑚𝑖𝑛 and
1
√𝜌. Noting that
for airplanes with piston engines or turboprop engines, the flight Mach number is less than 0.7, the drag polar
is independent of Mach number. However, due to dependence on 1
√𝜌, the 𝑃𝑟𝑚𝑖𝑛
and 𝑉𝑚𝑝 increase with
altitude. It may be added that the slope of a line, joining a point on the 𝑃𝑟 vs 𝑉 curve and the origin, is 𝑃𝑟
𝑉 or
𝑇𝑟. However, as pointed out earlier, 𝑇𝑟 has a minimum value 𝑇𝑟𝑚𝑖𝑛 which is independent of altitude. Hence, all
𝑃𝑟 vs 𝑉 curves have a common tangent passing through the origin. Such a tangent is shown in Fig. 2.3a. This
feature should be pointed out when 𝑃𝑟 vs 𝑉 curves are plotted at different altitudes. Note that the common
tangent to 𝑃𝑟 vs 𝑉 curves does not touch at 𝑉𝑚𝑝 but at 𝑉𝑚𝑑.

AIRCRAFT PERFORMANCE
Page 9
Fig. 2.3a Power required and power available curves
Fig. 2.3b Power required and power available at an altitude near ceiling
3 STEADY CLIMB, DESCENT AND GLIDE
3.1 Equations of motion in a steady climb
During a steady climb the center of gravity of the airplane moves at a constant velocity along a straight line
inclined to the horizontal at an angle 𝛾 (Fig. 3.1). The forces acting on the airplane are shown in Fig. 3.1.

AIRCRAFT PERFORMANCE
Page 10
Fig. 3.1 Steady climb
Since the flight is steady, the acceleration is zero and the equations of motion in climb can be obtained by
resolving the forces along and perpendicular to the flight path and equating their sum to zero i.e.
𝑇 − 𝐷 − 𝑊 sin 𝛾 = 0
𝐿 − 𝑊 cos 𝛾 = 0
sin 𝛾 = (𝑇 − 𝐷
𝑊)
From the velocity diagram in Fig. 3.1, the vertical component of the flight velocity 𝑉𝑐 is given by:
𝑉𝑐 = 𝑉 sin 𝛾 = 𝑉(𝑇 − 𝐷
𝑊)
The vertical component of the velocity 𝑉𝑐 is called rate of climb and also denoted by 𝑅/𝐶. It is also the rate
of change of height and denoted by 𝑑ℎ/𝑑𝑡. Hence,
𝑉𝑐 =𝑅
𝐶=
𝑑ℎ
𝑑𝑡= 𝑉 sin 𝛾 = 𝑉(
𝑇 − 𝐷
𝑊)
Multiplying by flight velocity 𝑉, gives:
𝑇𝑉 = 𝐷𝑉 + 𝑊𝑉 sin 𝛾 = 𝐷𝑉 + 𝑚𝑔𝑑ℎ
𝑑𝑡= 𝐷𝑉 +
𝑑(𝑚𝑔ℎ)
𝑑𝑡
The terms 𝑇𝑉, 𝐷𝑉 and 𝑑(𝑚𝑔ℎ)
𝑑𝑡 represent respectively, the power available, the energy dissipated in
overcoming the drag and the rate of increase of potential energy. Thus, when the airplane climbs, its potential
energy increases and a part of the engine output is utilized for this gain of potential energy.
Two facts may be pointed out at this juncture: (a) Energy supply to the airplane comes from the work done by
the engine which is represented by the term 𝑇𝑉 (b) The drag acts in a direction opposite to that of the flight
direction. Hence, energy has to be spent on overcoming the drag which is represented by the term 𝐷𝑉. This
energy 𝐷𝑉 is ultimately lost in the form of heat and is appropriately termed as ’Dissipated’. Continuous
supply of energy is needed to overcome the drag. Thus, a climb is possible only when the engine output is
more than the energy required for overcoming the drag.
It may be recalled that in level flight, at speeds equal to 𝑉𝑚𝑎𝑥 and (𝑉𝑚𝑖𝑛)𝑒, the power (or thrust) available is
equal to the power (or thrust) required to overcome the drag. Hence, the rate of climb will be zero at these

AIRCRAFT PERFORMANCE
Page 11
speeds. The climb is possible only at flight speeds in between these two speeds viz. 𝑉𝑚𝑎𝑥 and (𝑉𝑚𝑖𝑛)𝑒. It is
expected that there will be a speed at which the rate of climb is maximum. This flight speed is denoted by
𝑉(𝑅/𝐶)𝑚𝑎𝑥 and the maximum rate of climb is denoted by (𝑅/𝐶)𝑚𝑎𝑥. The flight speed at which the angle of
climb 𝛾 is maximum is denoted by 𝑉𝛾𝑚𝑎𝑥.
In a steady level flight, the lift is equal to weight but in a climb, the lift is less than weight as cos 𝛾 is less than
one, when 𝛾 is not zero. Note that when an airplane climbs vertically, its attitude is as shown in Fig. 3.2. It is
observed that in this flight, the resolution of forces along and perpendicular flight direction gives:
𝐿 = 0
𝑇 = 𝐷 + 𝑊
These expressions are consistent when 𝛾 = 90 is substituted in them. Note that in this flight the thrust is more
than the weight.
Fig. 3.2 Airplane in vertical climb
3.2 Thrust and power required for a given R/C at a given flight speed
Here it is assumed that the weight of the airplane 𝑊, the wing area 𝑆 and the drag polar are given. The
thrust required and power required for a chosen rate of climb 𝑉𝑐 at a given altitude ℎ and flight speed 𝑉 can
be obtained, for a general case, by following the steps given below. It may be pointed out that the lift and
drag in climb are different from those in level flight. Hence, the quantities involved in the analysis of climb
performance are, hereafter indicated by the suffix ‘𝑐’ i.e. lift in climb is denoted by 𝐿𝑐.
Since 𝑉𝑐 and 𝑉 are prescribed, calculate the angle of climb 𝛾 from:

AIRCRAFT PERFORMANCE
Page 12
𝛾 = sin−1 (𝑉𝑐
𝑉)
The lift required in climb 𝐿𝑐 is:
𝐿𝑐 = 𝑊 cos 𝛾
Calculate the lift coefficient in climb (𝐶𝐿𝑐) as:
𝐶𝐿𝑐=
𝐿𝑐
12
𝜌𝑉2𝑆=
𝑊 cos 𝛾
12
𝜌𝑉2𝑆
Obtain the flight Mach number; 𝑀 = 𝑉/𝑎; 𝑎 = speed of sound at the chosen altitude.
Corresponding to the values of 𝐶𝐿𝑐 and 𝑀, obtain the drag coefficient in climb 𝐶𝐷𝐶 from the drag polar.
Hence, drag in climb 𝐷𝑐 is given by:
𝐷𝑐 = 1
2𝜌𝑉2𝑆𝐶𝐷𝐶
The thrust required in climb 𝑇𝑟𝑐 is then given by:
𝑇𝑟𝑐= 𝑊 sin 𝛾 + 𝐷𝑐
and the power required in climb 𝑃𝑟𝑐 is:
𝑃𝑟𝑐= 𝑇𝑟𝑐
𝑉
3.3 Climb hodograph
In a climb, the vertical velocity is the rate of climb 𝑉𝑐 and the horizontal velocity is 𝑉ℎ. It is observed that for a
chosen altitude, the vertical velocity 𝑉𝑐 and the horizontal velocity 𝑉ℎ change with the flight speed 𝑉. A plot of
the values of 𝑉𝑐 and 𝑉ℎ at a particular altitude, in which 𝑉𝑐 is plotted on y-axis and 𝑉ℎ is plotted on the x-axis
is called ‘Climb hodograph’. Fig. 3.3 shows a hodograph, based on the sea level climb performance of a jet
airplane.

AIRCRAFT PERFORMANCE
Page 13
Fig. 3.3 Climb hodograph
In a hodograph the line, joining the origin to a point on the curve, has the length proportional to the flight
velocity 𝑉 and the angle this line makes to the horizontal axis (𝑉ℎ-axis) is the angle of climb 𝛾. This becomes
evident when it is noted that 𝑉𝑐 and 𝑉ℎ are the components of the flight velocity 𝑉 (see Fig. 3.3).
A line from the origin which is tangent to the hodograph gives the value of 𝛾𝑚𝑎𝑥 and also the velocity
corresponding to it. Actually, a climb hodograph gives complete information about the climb performance at
the chosen altitude especially 𝛾𝑚𝑎𝑥, 𝑉𝑚𝑎𝑥, 𝑅/𝐶𝑚𝑎𝑥 , 𝑅/𝐶𝛾𝑚𝑎𝑥, 𝛾𝑅/𝐶𝑚𝑎𝑥
and 𝑉𝑚𝑎𝑥.
3.4 Absolute ceiling and service ceiling
It is observed that 𝑅/𝐶𝑚𝑎𝑥 decreases as the altitude increases. The altitude at which 𝑅/𝐶𝑚𝑎𝑥 is zero is called
‘Absolute ceiling’. At this altitude level flight is possible only at one speed.
Near absolute ceiling, the rate of climb is very small and the time to climb becomes very large. It is thus not
possible to reach the absolute ceiling and for practical purposes an altitude at which the maximum rate of
climb is 100 ft /min(30.5 m/min) is used as ‘Service ceiling’.
3.5 Time to climb
From the knowledge of the variation of rate of climb with altitude, the time required 𝑡 to climb from an
altitude ℎ1 to ℎ2 can be calculated as follows:
𝑣𝑐 = 𝑑ℎ
𝑑𝑡
𝑡 = ∫ 𝑑𝑡 = ∫𝑑ℎ
𝑣𝑐
ℎ2
ℎ1
The rate of climb 𝑣𝑐 depends on the speed and altitude at which the climb takes place. It may be noted that
in a climb which attempts to fly at 𝑅/𝐶𝑚𝑎𝑥 at each altitude, the flight velocity, 𝑉𝑅/𝐶𝑚𝑎𝑥 increases with altitude.
AIRCRAFT PERFORMANCE
Page 14
Consequently, such a flight is an accelerated climb and the values of 𝑣𝑐 obtained using steady climb analysis
will need to be appropriately corrected for the acceleration.
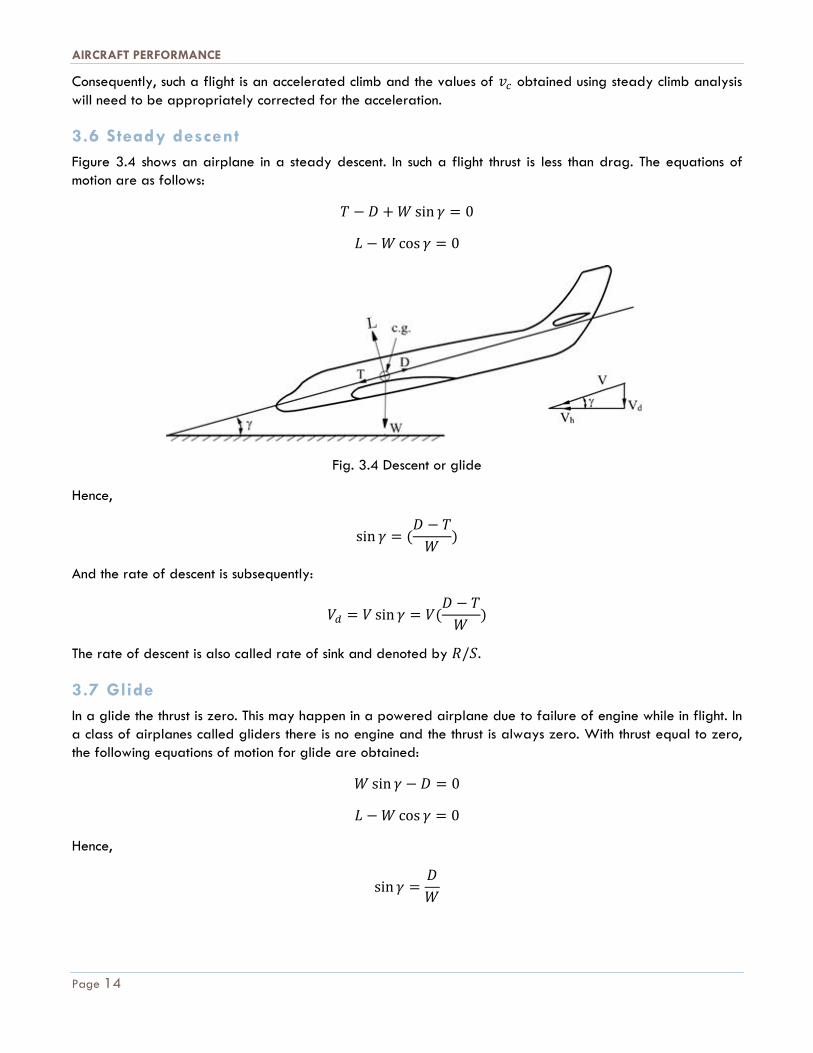
3.6 Steady descent
Figure 3.4 shows an airplane in a steady descent. In such a flight thrust is less than drag. The equations of
motion are as follows:
𝑇 − 𝐷 + 𝑊 sin 𝛾 = 0
𝐿 − 𝑊 cos 𝛾 = 0
Fig. 3.4 Descent or glide
Hence,
sin 𝛾 = (𝐷 − 𝑇
𝑊)
And the rate of descent is subsequently:
𝑉𝑑 = 𝑉 sin 𝛾 = 𝑉(𝐷 − 𝑇
𝑊)
The rate of descent is also called rate of sink and denoted by 𝑅/𝑆.
3.7 Glide
In a glide the thrust is zero. This may happen in a powered airplane due to failure of engine while in flight. In
a class of airplanes called gliders there is no engine and the thrust is always zero. With thrust equal to zero,
the following equations of motion for glide are obtained:
𝑊 sin 𝛾 − 𝐷 = 0
𝐿 − 𝑊 cos 𝛾 = 0
Hence,
sin 𝛾 =𝐷
𝑊

AIRCRAFT PERFORMANCE
Page 15
𝑉𝑑 = 𝑉 sin 𝛾 = 𝑉𝐷
𝑊
The angle of glide, 𝛾, is generally small. Hence, 𝐿 ≈ 𝑊 and one can write,
sin 𝛾 ≈ 𝛾 ≈ 𝐷
𝑊 ≈
𝐷
𝐿 ≈
𝐶𝐷
𝐶𝐿
𝑉 ≈ √2𝐿
𝜌𝑆𝐶𝐿
≈ √2𝑊
𝜌𝑆𝐶𝐿
𝑉𝑑 = √2𝑊
𝜌𝑆
𝐶𝐷
𝐶𝐿3/2
The potential energy of the glider decreases with time. This loss of potential energy is utilized to provide for
the energy required to overcome the drag. Hence, for a glider to stay aloft, it must be brought to a certain
height and speed before it can carry out the glide. This is done by launching the glider by a winch or by
towing the glider by another powered airplane.
Glide performance – minimum angle of glide and minimum rate of sink and maximum range
and endurance in glide
The performance in a glide is stated in terms of the following four quantities:
a) Minimum angle of glide 𝛾𝑚𝑖𝑛
b) Minimum rate of climb (𝑅/𝑆)𝑚𝑖𝑛 or 𝑉𝑑𝑚𝑖𝑛.
c) The distance covered in glide from a certain height or ’range in glide’ – 𝑅𝑔𝑙𝑖𝑑𝑒
d) The time elapsed in descending from a given height or ‘Endurance in glide’ – 𝐸𝑔𝑙𝑖𝑑𝑒.
The minimum angle of glide 𝛾𝑚𝑖𝑛, occurs when 𝐶𝐷
𝐶𝐿 is minimum or at 𝐶𝐿 = 𝐶𝐿𝑚𝑑
. The minimum rate of sink
(𝑅/𝑆)𝑚𝑖𝑛 or 𝑉𝑑𝑚𝑖𝑛 occurs when
𝐶𝐷
𝐶𝐿3/2 is minimum or at 𝐶𝐿 = 𝐶𝐿𝑚𝑝
. This can be understood from the following
alternate explanation. When a glider sinks, it is expending energy to overcome the drag, which comes from
the potential energy initially imparted to it. Thus, the rate of sink would be minimum when the rate of power
consumption is minimum and this occurs when 𝑉 equals 𝑉𝑚𝑝.
Gliders with very low rate of sink (around 0.5 m/s) are called ‘Sail planes’. It is observed that a low rate of
sink is achieved by (a) low wing loading (b) low 𝐶𝐷0 with smooth surface finish and (c) large aspect ratio.
If a glider is left at a height ‘h’ above the ground, then the horizontal distance covered in descending to the
ground is called ‘Range in glide’ and denoted by 𝑅𝑔𝑙𝑖𝑑𝑒. Assuming 𝛾 to be constant during the glide, the
range in glide can be expressed as:
𝑅𝑔𝑙𝑖𝑑𝑒 = ℎ
tan 𝛾 ≈
ℎ
𝛾 ≈ ℎ
𝐶𝐿
𝐶𝐷
Thus, the range in glide would be maximum when the flight is at 𝐶𝐿 corresponding to 𝐶𝐿𝑚𝑑 or at 𝑉 = 𝑉𝑚𝑑.

AIRCRAFT PERFORMANCE
Page 16
The time to descend from a height h is called 𝐸𝑔𝑙𝑖𝑑𝑒. Assuming 𝑉𝑑 to be constant, 𝐸𝑔𝑙𝑖𝑑𝑒 equals ℎ
𝑉𝑑. The
quantity 𝐸𝑔𝑙𝑖𝑑𝑒 would be maximum when descent takes place at 𝐶𝐿 = 𝐶𝐿𝑚𝑝 or 𝑉 = 𝑉𝑚𝑝. It is evident from the
above discussion that the flight speeds for 𝛾𝑚𝑖𝑛 and (𝑅/𝑆)𝑚𝑖𝑛 are different.
3.8 Glide hodograph
A glide hodograph is obtained when horizontal velocity 𝑉ℎ is plotted on the x-axis and the rate of sink 𝑉𝑑 is
plotted on the y-axis. Such a diagram gives complete information about glide performance at an altitude
especially 𝛾𝑚𝑖𝑛, 𝑉𝛾𝑚𝑖𝑛, 𝑅/𝑆𝑚𝑖𝑛, 𝑉𝑅/𝑆𝑚𝑖𝑛
and 𝛾𝑅/𝑆𝑚𝑖𝑛
Fig. 3.5 Glide hodograph
If the glide takes place from a sufficiently high altitude (as may happen for an airplane having an engine
failure in cruise), the rate of sink (𝑅/𝑆) cannot be taken as constant during the descent.