airborne digital frame camera imaging for elevation ... · airborne digital frame camera imaging...
TRANSCRIPT
PEER·REVIEWED ARTICLE I
Airborne Digital Frame Camera Imaging for Elevation Determination
Doug King, Pat Walsh, and Frank Cluffreda
Abstract A high resolution digital CCD frame camera was flown over a test site in Toronto, Ontario to acquire overlapping images for elevation determination. A selected pair of 1320 by 1035 images covering a total of 0.91- by 1.04-km area with 0.69-m square pixels were analyzed. Twenty-four points within the images were field surveyed and a bundle adjustment algorithm was applied to perform relative and absolute orientations of the images using only three control points. The weighted average RMS errors of the residuals were 1.13Bm (x), 1.390m (y}, and 0.927m (z) within a total elevation variation of 40m. This level of accuracy was obtained despite several limitations such as Jack of camera calibration, difficulties in image point selection, and image motion. These results have encouraged further research to improve the technique and apply it in the development of large-scale elevation models.
Introduction An emerging solid-state imaging technology which has not yet been extensively tested in airborne imaging is the digital frame camera (OFC). It is a relatively low cost technology which has several advantages over current video sensors, line scanners and photography. In relation to standard videography, OFCs are not confined by National Television Standards Committee (NTSC) or other television scanning specifications. Consequently, sensors have been developed which contain many more photosites per unit sensor dimension and their resolution has the potential to reach that of 35-mm or 70-mm photography (current sensors typically have more than 1024 by 1024 photosites while near-future sensors will contain up to 4000 by 4000 photosites). In relation to line scanning, OFCs have the capability for acquisition of instantaneous two-dimensional raster exposures of the Earth's surface which do not suffer from the line-to-line geometric variability which is typical of airborne line scanner imagery. Photogrammetric analysis and geometric transformations are therefore much simpler, being for the most part analogous to procedures used with photography. In relation to standard aerial photography, OFCs have better geometric stability (no film warping), better radiometric image quality (linear response, greater dynamic range, greater quantum efficiency, and wider spectral sensitivity range), and capability for real time in-flight viewing of acquired images. The digital image format is also more suited to image processing for im-
.D. King is with the Department of Geography, Carleton University, Ottawa, Ontario K1S 5B6, Canada. P. Walsh is with the Department of Geomatics Engineering, University of Calgary, Calgary, Alberta T2N 1N4, Canada. F. Ciuffreda is with Phototech Mapping Services, 108 Senti! nel Road, Downsview, Ontario M3J 1S9, Canada.
PE&RS
provement of radiometric characteristics (e.g., noise reduction, reduction of brightness variations with view angle), and to quantitative image analysis. To-date, two such cameras have been tested in airborne data acquisition by the principal author: (1) the Kodak DCS camera, a 1280- by 1024-CCO frame sensor housed in a Nikon F-3 body, was compared to simultaneously acquired 70-mm photography and standard video (reported in Mausel et al. (1992)); and (2) the Kodak MEGAPLUS 1.4 camera was flown to acquire data for this research. The cost of OFCs varies between $10,000 and $25,000 depending on the sensor quality, class, and design. As costs continue to decrease, this sensor format will compete andreplace standard airborne videography and small format photography. Great potential exists for their use as multi-purpose sensors in photogrammetric and multispectral applications. King (1992) is currently developing a multispectral OFC system for natural resource and environmental evaluation, elevation modeling, and close-range scanning.
Image readout from a ceo sensor chip is analog and must be converted to either NTSC analog video for storage on VCR tape and viewing on a standard television monitor (resulting in a significant resolution loss), or converted to digital in order to write to a digital storage medium and display on a computer monitor. Presently, the major limitations of high resolution OFCs in digital mode are data transfer and storage rates. Each image consists of over 1 Mbyte of information, so data transfer to an inexpensive tape drive or disk is slow. This does not permit large image overlap as in NTSC video where a complete image is acquired every 1/30 s. Consequently, remote sensing applications of these sens.ors are currently limited to non-continuous data acquisition with some capability for image overlap. .
One application which is well suited to monochrome stereo imaging is elevation determination using photogrammetric methods. Digital elevation models (OEMs) represent important information layers in geographic information systems. Advances are currently being made toward production of small scale OEMS using stereo satellite-based imaging such as SPOT (e.g., Chapman et al., 1991). The difficulties which have been encountered in these studies are primarily related to the line scanning technique employed by pushbroom scanners. Because each line of data has a different imaging geometry, the photogramrnetric procedures for determining exposure station locations and relating them to ground survey data are more cumbersome than for the two-dimensional exposures provided by frame cameras. In addition, the large
Photogrammetric Engineering & Remote Sensing, Vol. 60, No. 11, November 1994, pp. 1321-1326.
0099-1112/94/6011-1321$3.00/0 © 1994 American Society for Photogrammetry
and Remote Sensing
1321
PEER · REVIEWED ARTICLE
ground pixel size of satellite images limits the precision of elevation determination.
The aim of this research is to use frame camera imagery in the development of large-scale digital elevation models. The project described in this paper was a feasibility study to assess whether elevations could be determined with sufficient accuracy to warrant continued research into large-scale elevation modeling using this imaging technique. The objectives were to (1) adapt a DFC to airborne imaging, (2) acquire overlapping digital imagery over a test site with suitable survey Control and elevation variations, (3) perform relative and absolute orientation of the imagery using selected ground control points, and (4) determine the accuracy of elevations of other points within the imagery. The remainder of this paper provides a brief description of the methods and results obtained.
Methodology Data Acquisition Airborne image data were acquired on 29 October 1990. An area in the east end of Toronto, Canada was selected as a test site because it provided an elevation variation of approximately 50 m on former shorelines of Lake Ontario. The site consisted mostly of residential and small commercial land uses so there were abundant municipal horizontal and vertical survey control points. The frame camera imagery was acquired using the Kodak MEGAPLUS 1.4 camera. It is a black-and-white CCD sensor which incorporates an 8.98 mm by 7.04 mm chip with 1340 (H- horizontal) by 1037 (V vertical) photosites, each being 6.8 J..lm square. Twenty columns and one row at the top and bottom of the sensor are shielded to serve as a dark current reference so the actual number of active photosites is 1320 (H) by 1035 (V). A Nikon 15-mm focal length lens was used which provided a view angle of 33.3° (H) by 26.4° (V). A lens f-stop of between 8 and 11 was required for adequate exposure. The camera shutter was set at its maximum speed, 10 ms, to minimize image motion effects at low altitude, although it was recognized that some image motion would be inevitable with such a slow shutter. Images were acquired at three altitudes to evaluate the sensor's resolution capabilities in relation to varied ground coverage and pixel size. Two flight lines were flown from south to north at each altitude to provide evenly illuminated imagery with 15 percent sidelap. Table 1 lists the flight parameters for data acquisition. Analysis of the low altitude data for elevation determination is reported here.
Images acquired by the sensor in analog form were digitized by an 8-bit (256 grey level) AID converter within the camera. Read-out was routed through an Imagraph HI*DEF 1280 by 1024 frame buffer (reducing the image size slightly but not the resolution) to a 100 Mbyte hard drive installed in a standard microcomputer. A hard drive was selected as the storage medium because the data writing speed was higher than for low cost tape media. Storage times were approximately 3.5 seconds per 1.3 Mbyte image. A program was written which permitted the capture and storage of images at user specified time intervals (P. Curran, personal communication, 1990). The appropriate intervals (Table 1) were calculated based on aircraft altitude and a velocity of 210 km/hr, given a requirement of 60 percent forward image overlap. The commands for image capture were entered in-flight using a standard microcomputer monitor and each captured image was viewed on a separate 1280 by 1024 monitor. The
1322
TABLE 1. fLIGHT PARAMETERS FOR IMAGERY ACQUIRED AT THREE ALTITUDES.
Acquisi-Ground Coverage (m) Pixel Size (m) tion
Altitude (m) (Hby V) (Hby V) Interval (s)
1524 910 by 720 0.69 by 0.69 4.9 3048 1820 by 1430 1.38 by 1.38 9.8 4572 2730 by 2150 2.08 by 2.08 14.7
camera, CPU, two monitors, and the camera power supply were mounted in a Piper Navaho aircraft (operated by the Ontario Ministry of Natural Resources, Provincial Remote Sensing Office). For the total set of six flight lines, 59 images were acquired (approximately 78 Mbytes) and stored on the hard disk.
Data Processing and Analysis For the objective of evaluation of the sensor's potential in elevation determination, one pair of overlapping images from the 1524-m (5000-foot) flight line was selected. The data were viewed and manipulated using USGS MIPS image display and processing software. The two images were edge enhanced using a 3 by 3 Laplacian filter in order to improve pixel identification of suitable control and test points. Thirty image points dispersed as evenly as possible inside and outside the overlap region were visually selected for evaluation. They were typically located at intersections of sidewalks or roads and were distributed as uniformly as possible throughout the scene. Through a zoom function to enlarge the scale, the row and column pixel coordinates for each image point were determined. A field reconnaissance was conducted to identify the points as best as possible on the ground. Horizontal and vertical surveys were then carried out using standard leveling and traversing techniques to tie the ground points in with nearby Metropolitan Toronto horizontal and vertical control points. .
To determine elevations in the overlapping DFC images, a bundle adjustment program (M. Chapman, personal communication, 1991) was used. It imposes the collinearity condition to perform a three-dimensional conformal coordinate transformation from the image space to the corresponding ground space. This is a common procedure in analytical photogrammetry, so it is not discussed in detail (e.g., see Moffitt and Mikhail (1980) or Ghosh (1987) for a complete derivation). Of the 30 image points, three were selected as control points and given a weight 1000 times the weight of the remaining points in the adjustment. This small number of control points was used in order to simulate an operational situation where only a few control points can be measured because of cost or difficulty in identification. Because ground survey data were available for all the points, approximately 20 combinations of control points which were easily identified in the images were tested in repeated program runs to determine the best solution. Lens focal length and principal point position were also required as inputs. At this time, a sensor calibration had not yet been performed (the sensor was on loan) so a focal length of 15.000 mm and a principal point location at the center of the sensor were assumed. The effects on the solution of varying these values by small amounts were evaluated to ensure that they were not grossly in error.
Evaluation of the accuracy of the bundle adjustment was straightforward; the survey data and adjusted position for each point were compared to determine residuals or error
PE&RS
, PEER · REVIEWED ARTICLE
(a)
(b)
(c)
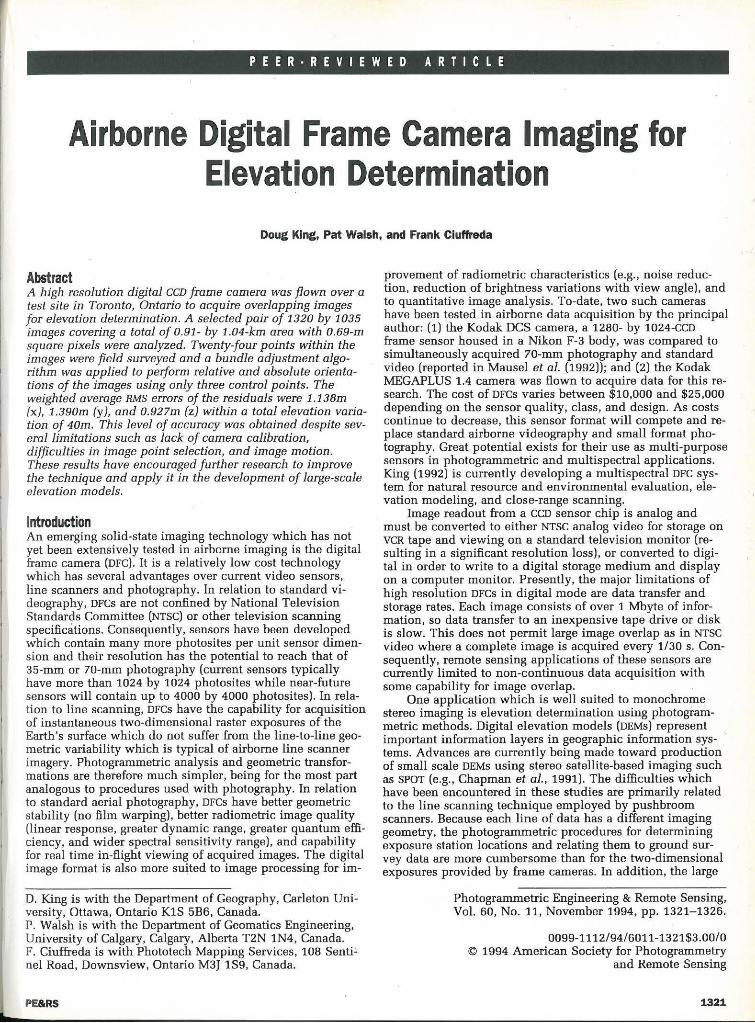
Figure 1. Frame camera images of the Toronto Shoreline corresponding to the altitudes given in Table 1.
PE&RS
measurements. The optimum combination of control points was taken as that which produced the minimum root-meansquare (RMS) error for the elevations of all the points. In addition, repeated testing with various groups of control points allowed detection and removal of single points with consistently large residual values (outliers). Such points may have been incorrectly identified in the images and/or on the ground, or they may have been surveyed incorrectly.
Results As an example of the image quality attainable with the MEGAPLUS camera at three scales (see Table 1), Figures 1a to 1c show images of the Toronto shoreline taken from the low to high altitudes, respectively. The high altitude image is visibly affected by atmospheric haze which was quite strong. In addition, all the images are slightly degraded through reproduction using a laser printer and subsequent photographing. However, they illustrate the great potential of high resolution DFCs for detailed imaging while maintaining good ground coverage. For the purposes of elevation modeling, identification of ground points such as sidewalk intersections becomes difficult in the higher altitude imagery, but many other features are present which can easily be identified (road intersections, large building corners, etc.). With larger coverage, the probability of occurrence of such points is greater, so control and test point selection should not be more difficult at smaller scales in an urban area such as this (the precision of their measurement will of course be lower).
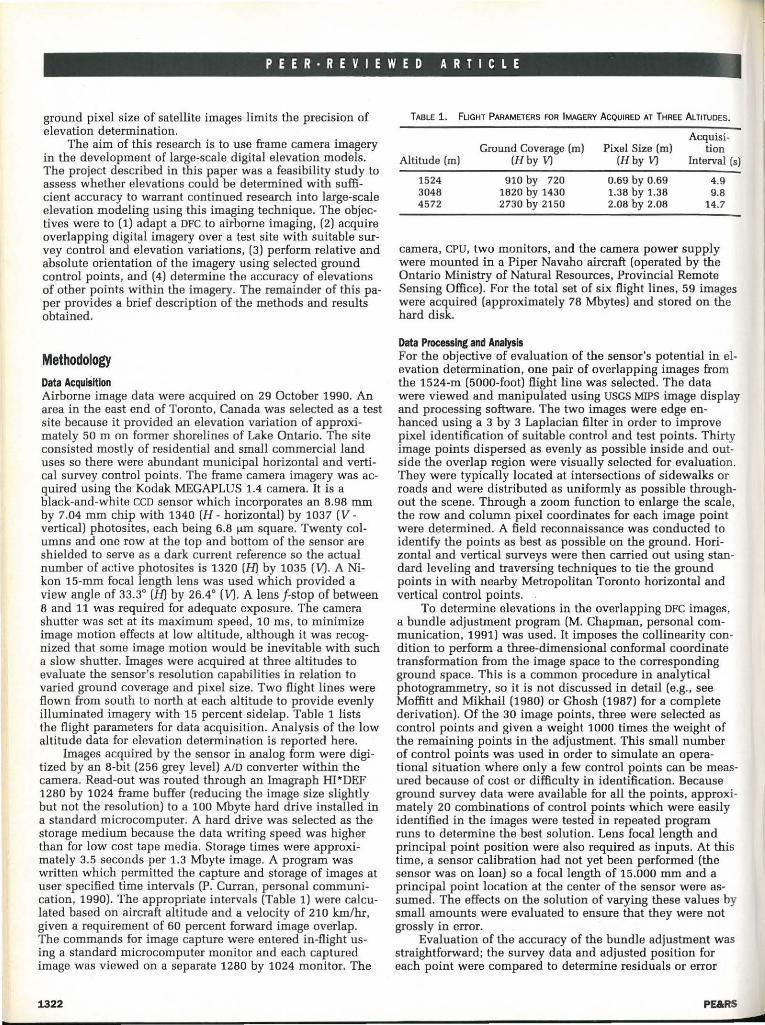
Figure 2 shows the overlapping images used for elevation determination. They are located just north of Figures 1a and 1b and they are included in the coverage of Figure 1c. Image motion of just less than one pixel (0.58 m at 210 km/ hr aircraft velocity) resulted in slight blurring of detail but its
Figure 2. Overlapping images of the test area (altitude = 1524 m).
1323

,I
PEER·REVIEWED ARTICLE
4837900 Northing
2 4837800
4837700 ·9
.• 11 12
14 4837600
. 1'8 . 20
4837500 ·3 . 17
4837400
4837300 •33 .50 - 34 . '51 ~ 53
4837200 . . 1
52 ·4 46
4837100 48 "44 4837000 f · 4i .5
'5 4836900
3 3 3 3 3 3 3 3 3 3 1 1 2 2 2 2 2 2 2 :2 9 9 0 0 0 0 0 0 0 0 8 9 0 1 2 3 4 5 6 7 0 0 0 0 0 0 0 0 0 0 0 0 0 0 0 0 0 0 0 0
Easting
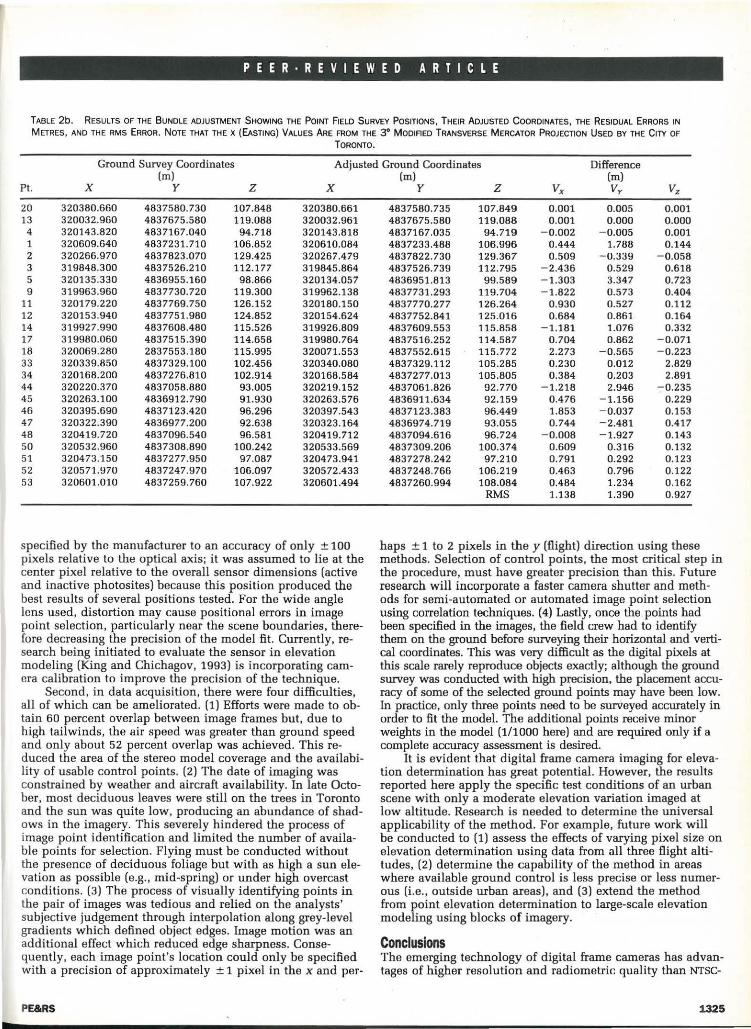
Figure 3. Locations of the ground survey points used in the bundle block adjustment.
effects were reduced through the edge enhancement procedure. The best bundle adjustment solution. was obtained using point #s 20, 13, and 4 as control and eliminating six points which consistently had large residuals, indicating either ground survey or image location errors. The locations of the remaining points are shown in Figure 3. Table 2a gives the image point row-column coordinates (transformed to the right-hand coordinate system with center origin for use by the bundle adjustment algorithm) and their adjusted position while Table 2b gives the corresponding ground survey and adjusted positions. The projection used by the city of Toronto was a Modified Transverse Mercator (MTM) with 3° easting zones, Toronto being in zone 10, and a center meridian of one million feet. The x (easting) values in Table 2b have been converted to metres for consistency. The northings of the MTM projection as given in Table 2b are the same as UTM northings. The differences in the survey and adjusted data are listed as residuals in metres for the ground data and in 1/1000 of the pixel size for the image data. The RMS of the residuals is given in the bottom right of each table. For the ground coordinates, the control point residuals have been excluded from the RMS calculation because they were essentially fixed by their large relative weights.
The residuals show that the method has good potential for elevation determination and modeling. Elevation RMS was about 2.3 percent of the total variation in topography within the scene and is similar in dimension to the pixel size. The individual point residuals vary significantly, however, indicating a need for improvement in image point selection, ground point identification, and imaging conditions. The larger y residuals may have resulted from less precise image coordinate specification in the y direction due to the small amount of image motion which was present.
1324
Using other combinations of widely spaced control points, particularly ones which included corner points, resulted in higher residuals. Corner points were usually difficult to identify in the images or on the ground and were more likely to be affected by camera/lens distortions. Also, increasing the number of control points to five reduced the ground position residuals significantly but increased the image position residuals. This is because the ground model became more fixed so the image model had to be adjusted more in order to relate the two.
Discussion Several points of discussion can be made regarding both the methodology and results achieved in this study. First, results were hindered by an absence of calibrated focal length, principal point location, and lens distortions. An inaccurate focal length deteriorates the collinearity of the rays for each image and produces inaccurate object space intersections of the rays from the two exposure stations (Moffitt and Mikhail, 1980). It was assumed to be 15.000 mm although this value is unlikely. An inaccurate principal point position causes relative tran.slations between the image and object space (Moffitt and Mikhail, 1980). The center of the CCD chip is
TABLE 2a. RESULTS OF THE BUNDLE ADJUSTMENT SHOWING SELECTED IMAGE
POINT COORDINATES, THEIR ADJUSTED COORDINATES, THE RESIDUAL ERRORS IN
1/000 PIXEL, AND THE RMS ERROR.
Image Coor- Adjusted Image dinates Coordinates Difference
Image 1 (pixels) (pixels) (1/1000 pixel) Point X y X y v. vy
1 517 - 354 516.992 - 354.008 - 8.4 -8.0 4 -157 -45 -155.468 - 44.636 1532.2 364.2 5 -351 -318 -350.981 - 317.987 18.8 13.3
20 502 299 501.514 298.608 - 486.5 - 391.6 33 238 3 236.987 3.131 - 1012.5 130 .6 34 -32 79 -31.982 78.898 18.7 - 101.7 44 - 146 - 245 - 146.044 -246.020 -3.7 -20.1 45 - 215 - 480 - 214.999 -479.992 1.5 7.8 46 139 - 316 138.990 - 315.993 - 9.8 6.5 47 -84 -448 -83.995 - 447.984 4.5 15.9 48 144 -373 144.007 - 372.990 6.7 10.3 50 476 - 187 475.996 -187.000 -4.3 0 .4 51 370 - 177 369.995 -176.999 - 5.3 1.1 52 479 - 301 478.995 -301.003 -5.2 - 2.7 53 529 -310 528.993 - 310.005 -6.8 -5.0
RMS 490.6 144.8
Image Coor- Adjusted Image dinates Coordinates Difference
Image 2 (pixels) (pixels) (1/1000 pixel) Point X y X y v. vy
2 426 265 426.998 265.001 -1.6 3.5 3 - 384 223 - 383.989 222.989 11.4 -11.4 4 - 295 - 507 - 295.297 -506.604 - 297.5 396.4 9 - 59 396 - 58.992 395.991 7.9 -9.5
11 264 268 263.993 268.000 -6.8 0.3 12 215 266 214.993 265.998 - 6.6 - 2.3 13 -12 264 -12.316 264.181 -316.2 181.4 14 -208 265 -207.997 264.990 2.7 - 10.0 17 -216 97 -216.007 96.998 -6.7 - 2.2 18 -65 69 -65.010 69.011 -10.3 10.8 20 371 - 155 370.641 -155.531 -359.1 -531.3 33 103 - 459 403.996 -459.123 995.6 - 123.1 34 - 170 - 382 - 1 70.021 - 381.901 - 21.1 98.7
RMS 317.4 195.6
PE&RS
PEER·REVIEWED ARTICLE
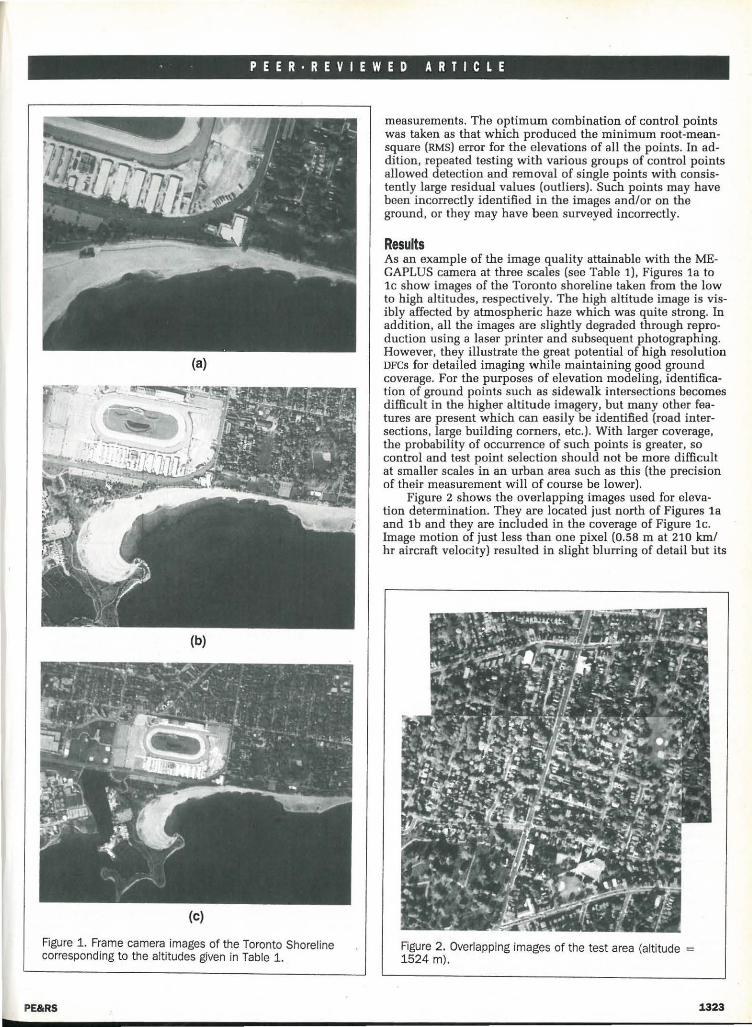
TABLE 2b. RESULTS OF THE BUNDLE ADJUSTMENT SHOWING THE POINT FIELD SURVEY POSITIONS, THEIR ADJUSTED COORDINATES, THE RESIDUAL ERRORS IN
METRES, AND THE RMS ERROR. NOTE THAT THE X (EASTING) VALUES ARE FROM THE 3° MODIAED TRANSVERSE MERCATOR PROJECTION USED BY THE C ITY OF
TORONTO.
Ground Survey Coordinates Adjusted Ground Coordinates Difference (m)
Pt. X y z X
20 320380.660 4837580.730 107.848 320380.661 13 320032.960 4837675.580 119.088 320032.961 4 320143.820 4837167.040 94.718 320143.818 1 320609.640 4837231.710 106.852 320610.084 2 320266.970 4837823.070 129.425 320267.479 3 319848.300 4837526.210 112.177 319845.864 5 320135.330 4836955.160 98.866 320134.057 9 319963.960 4837730.720 119.300 319962.138
11 320179.220 4837769.750 126.152 320180.150 12 320153.940 4837751.980 124.852 320154.624 14 319927.990 4837608.480 115.526 319926.809 17 319980.060 4837515.390 114.658 319980.764 18 320069.280 2837553.180 115.995 320071.553 33 320339.850 4837329.100 102.456 320340.080 34 320168.200 4837276.810 102.914 320168.584 44 320220.370 4837058.880 93.005 320219.152 45 320263.100 4836912.790 91.930 320263.576 46 320395.690 4837123.420 96.296 320397.543 47 320322.390 4836977.200 92.638 320323.164 48 320419.720 4837096.540 96.581 320419.712 50 320532.960 4837308.890 100.242 320533.569 51 320473.150 4837277.950 97.087 320473.941 52 320571.970 4837247.970 106.097 320572.433 53 320601.010 4837259.760 107.922 320601.494
specified by the manufacturer to an accuracy of only ± 100 pixels relative to the optical axis; it was assumed to lie at the center pixel relative to the overall sensor dimensions (active and inactive photosites) because this position produced the best results of several positions tested. For the wide angle lens used, distortion may cause positional errors in image point selection, particularly near the scene boundaries, therefore decreasing the precision of the model fit. Currently, research being initiated to evaluate the sensor in elevation modeling (King and Chichagov, 1993) is incorporating camera calibration to improve the precision of the technique.
Second, in data acquisition, there were four difficulties, all of which can be ameliorated. (1) Efforts were made to obtain 60 percent overlap between image frames but, due to high tailwinds, the air speed was greater than ground speed and only about 52 percent overlap was achieved. This reduced the area of the stereo model coverage and the availability of usable control points. (2) The date of imaging was constrained by weather and aircraft availability. In late October, most deciduous leaves were still on the trees in Toronto and the sun was quite low, producing an abundance of shadows in the imagery. This severely hindered the process of image point identification and limited the number of available points for selection. Flying must be conducted without the presence of deciduous foliage but with as high a sun elevation as possible (e.g. , mid-spring) or under high overcast conditions. (3) The process of visually identifying points in the pair of images was tedious and relied on the analysts' subjective judgement through interpolation along grey-level gradients which defined object edges. Image motion was an additional effect which reduced edge sharpness. Consequently, each image point's location could only be specified with a precision of approximately ± 1 pixel in the x and per-
PE&RS
(m) (m) y z Vx Vy Vz
4837580.735 107.849 0.001 0.005 0.001 4837675.580 119.088 0.001 0 .000 0.000 4837167.035 94.719 - 0.002 -0.005 0.001 4837233.488 106.996 0.444 1.788 0.144 4837822.730 129.367 0.509 -0.339 -0.058 4837526.739 112.795 -2.436 0.529 0.618 4836951.813 99.589 -1.303 3.347 0.723 4837731.293 119.704 -1.822 0.573 0.404 4837770.277 126.264 0.930 0.527 0.112 4837752.841 125.016 0.684 0.861 0.164 4837609.553 115.858 -1.181 1.076 0.332 4837516.252 114.587 0.704 0.862 -0.071 4837552.615 115.772 2.273 -0.565 -0.223 4837329.112 105.285 0.230 0.012 2.829 4837277.013 105.805 0.384 0.203 2.891 4837061.826 92.770 - 1.218 2.946 - 0.235 4836911.634 92.159 0.476 -1.156 0.229 4837123.383 96.449 1.853 -0.037 0.153 4836974.719 93.055 0.744 -2.481 0.417 4837094.616 96.724 - 0.008 -1.927 0.143 4837309.206 100.374 0.609 0.316 0.132 4837278.242 97.210 0.791 0.292 0.123 4837248.766 106.219 0.463 0.796 0 .122 4837260.994 108.084 0.484 1.234 0.162
RMS 1.138 1.390 0 .927
haps ± 1 to 2 pixels in the y (flight) direction using these methods. Selection of control points, the most critical step in the procedure, must have greater precision than this. Future research will incorporate a faster camera shutter and methods for semi-automated or automated image point selection using correlation techniques. (4) Lastly, once the points had been specified in the images, the field crew had to identify them on the ground before surveying their horizontal and vertical coordinates. This was very difficult as the digital pixels at this scale rarely reproduce objects exactly; although the ground survey was conducted with high precision, the placement accuracy of some of the selected ground points may have been low. In practice, only three points need to be surVeyed accurately in order to fit the model. The additional points receive minor weights in the model (1/1000 here) and are required only if a complete accuracy assessment is desired.
It is evident that digital frame camera imaging for elevation determination has great potential. However, the results reported here apply the specific test conditions of an urban scene with only a moderate elevation variation imaged at low altitude. Research is needed to determine the universal applicability of the method. For example, future work will be conducted to (1) assess the effects of varying pixel size on elevation determination using data from all three flight altitudes, (2) determine the capability of the method in areas where available ground control is less precise or less numerous (i.e. , outside urban areas), and (3) extend the method from point elevation determination to large-scale elevation modeling using blocks of imagery.
Conclusions The emerging technology of digital frame cameras has advantages of higher resolution and radiometric quality than NTSC-
1325
, I
PEER·REVIEWED ARTICLE
based video systems and of better geometric quality than line scanners. It is well suited to both photogrammetric applications and multispectral imaging. Digital frame camera technology combined with analytical photogrammetric techniques has potential in the determination of spot terrain elevations and as a data source for digital elevation models. The results reported here accompanied by the outlined improvements suggest that determination of elevation using DFC imaging and analytical photogrammetric techniques should attain accuracies suitable for many municipal and rural mapping applications. With continued research, such methodology can be used to produce large-scale digital elevation models for integration with other data in a GIS framework.
Acknowledgments The authors gratefully acknowledge the support of the National Research Council of Canada, Cadix Inc. of Toronto (Canadian distributors of the Kodak MEGAPLUS camera), and the Ontario Ministry of Natural Resources, Provincial Remote Sensing Office. We would also like to thank Dr. M. Chapman, Department of Geomatics Engineering, University of Calgary, for advice on the use of his bundle block adjustment program, and Gladwin Henry of Ryerson Polytechnical Institute in Toronto for additional contributions to this project.
R~ferences
Chapman, M., A. Tam, and T. Yasui, 1991. A rigorous approach for the estimation of terrestrial coordinates from digital stereo SPOT imagery. Proceedings 14th Canadian Symposium on Remote Sensing, Calgary, Alberta, 6-10 May, 7 p .
Ghosh, S. K. , 1987. Analytical Photogrammetry, Second Edition, Pergamon Press, New York. p . 82, pp. 142-150.
King, D. J., 1992. Development and application of an airborne multispectral digital frame camera sensor. Proc. XVII Congress ISPRS, Commission I, Washington, D.C., 3-14 August, pp. 190-192.
King, D. J., and A. Chichagov, 1993. The potential of airborne digital frame camera imaging in digital elevation modelling. Proc. 5th Canadian Conference on GIS, Ottawa, Canada, 20-26 March, pp. 758-766.
King, D., and J. Vlcek, 1991. Development of a multispectral video system and its application in forestry. Canadian Journal of Remote Sensing 16(1):15-22.
Mausel, P., J. Everitt, D. Escobar, and D. King, 1992. Videography: Current status and future perspectives. Photogrammetric Engineering & Remote Sensing 58(8):1189-1195.
Moffitt, F. , and E. Mikhail, 1980. Photogrammetry, Third Edition, Harper and Row, New York, 648 p.
(Received 17 March 1992; revised and accepted 2 February 1993; revised 24 March 1993)
Introduction to the PHYSICS AND TECHNIQUES OF REMOTE SENSING
by: Charles Elachi
Introduction to Physics and Techniques of Remote Sensing is a comprehensive overview of the basics behind remotesensing physics, techniques, and technology. Applications of remote sensing are described for a wide spectrum of earth and planetary atmosphere and surface sciences, including geology, resource observation and atmospheric sciences, and ionospheric studies.
This book provides the basic scientific and engineering background for students and researchers interested in remote sensing and its applications. Chapters include:
• introduction • Solid-Surface Sensing: • Atmospheric Remote Sen&ing in
• Nature and Properties of Microwave and Radio the Microwave Region Electromagnetic Waves Frequencies • Millimeter and Submillimeter
• Solid-Surfaces Sensing in the • Ocean Surface Sensing Sensing of Atmospheres Visible and Near Infr;tred • Basic Principles of • Atmospheric Remote Sensing in
• Solid-Surfaces Sensing: Atmospheric Sensing and the Visible and Infrared Thermal Infrared Radiative Transfer • Ionospheric Sensing
• Solid-Surface Sensing: Microwave Emission
1987. 413 pp. 17 colorp/ates. $75 (hardcover); ASPRS Members $57. Stock# 4529.
For ordering information, see the ASPRS Store.
1326 PE&RS