air traffic flow analysis - boem.gov
TRANSCRIPT

Capitol Airspace Group capitolairspace.com
(703) 256 - 2485
Revolution Wind Project DWW Rev I, LLCOffshore Rhode Island & Massachusetts
Air Traffic Flow Analysis
March 2020

This page intentionally left blank.

1
Summary
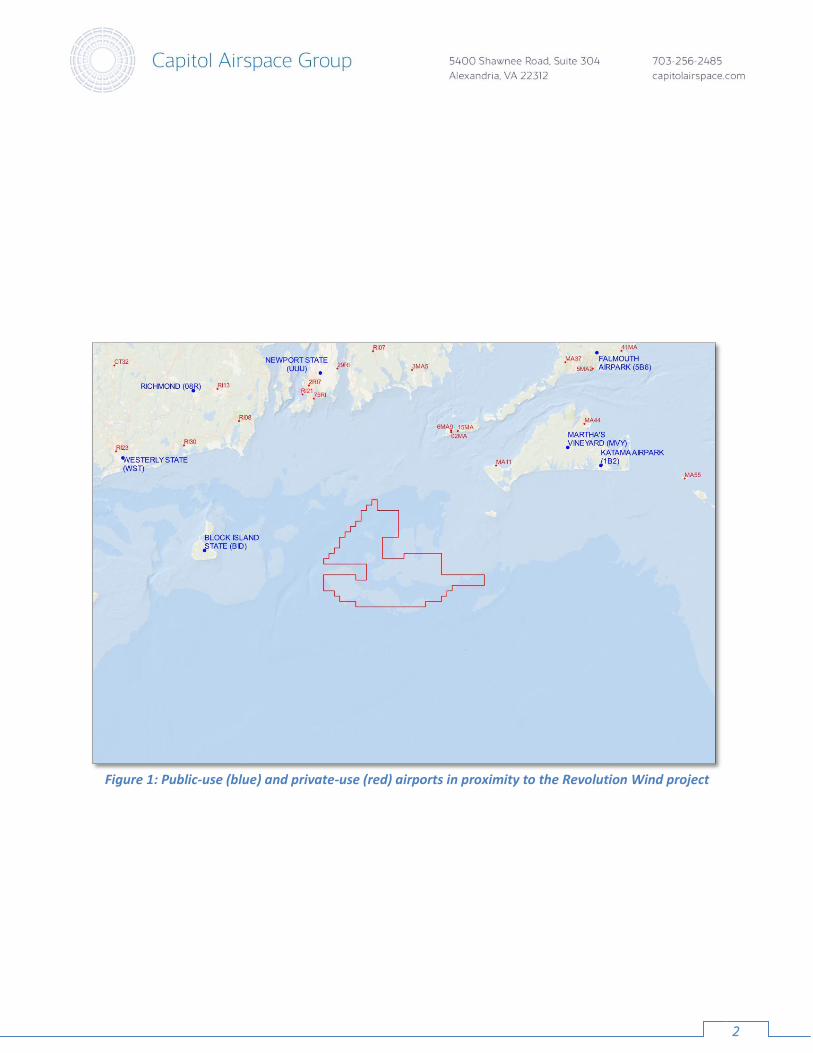
Capitol Airspace conducted an air traffic flow analysis for the Revolution Wind project (red outline, Figure 1) located off the Rhode Island and Massachusetts coasts. At the time of this analysis, individual wind turbine locations had not been identified. However, at 873 feet above sea level (ASL), proposed wind turbines could impact Visual Flight Rules (VFR) routes. Additionally, at 873 feet ASL, proposed wind turbines throughout the study area would require an increase to a Block Island State Airport (BID) instrument approach procedure minimum altitude, Boston Consolidated (A90) Terminal Radar Approach Control (TRACON) minimum vectoring altitudes (MVA), and Providence (PVD) TRACON MVAs. The purpose for this analysis was to assess the likelihood that proposed wind turbines could have a substantial adverse effect on aircraft operating along potential VFR routes, as well as to determine the number of operations potentially affected by the airspace changes required to accommodate wind development up to 873 feet ASL.
The Federal Aviation Administration (FAA) conducts aeronautical studies to ensure that proposed structures do not have an effect on the safety of air navigation and the efficient utilization of navigable airspace by aircraft. Proposed structures undergoing aeronautical study that exceed obstacle clearance surfaces will be identified as having an adverse effect. If the FAA determines that the adverse effect would impact a significant volume of operations it could be used as the basis for determinations of hazard. For instrument flight rules (IFR) operations the significant volume threshold is one per week; for visual flight rules (VFR) operations the threshold is one per day.
Historical air traffic data indicates that 873-foot ASL wind turbines would not affect any regularly-used VFR routes. Additionally, historical air traffic data indicates that the required changes to the Block Island State Airport (BID) instrument approach procedure, Boston Consolidated (A90) TRACON MVA sectors, and Providence (PVD) TRACON MVA sectors should not affect a significant volume of operations. As a result of these findings, it possible that the FAA would be willing to increase the affected altitudes in order to accommodate wind development up to 873 feet ASL. These mitigation options are available and subject to FAA approval.
2
Figure 1: Public-use (blue) and private-use (red) airports in proximity to the Revolution Wind project

3
Methodology
Capitol Airspace evaluated FAA National Offload Program (NOP) radar returns in proximity to the Revolution Wind project for the period between July 1, 2018 and June 30, 2019. The FAA NOP data contained 306,972,208 radar returns associated with 1,556,765 flights receiving air traffic control services.1 Radar tracks were created for each flight that had at least one radar return within the affected airspace and at the affected altitudes. In order to understand the nature of flight operations in and around the affected airspace, Capitol Airspace analyzed each track for altitude and direction trends. Historical flights that operated along low-altitude enroute airways, utilized instrument approach procedures, or possibly received radar vectoring services within the affected airspace are an indicator that the required airspace changes could affect future VFR and IFR operations.
Visual Flight Rules (VFR) Routes
During periods of marginal weather – low cloud ceilings and visibility – pilots often operate below the floor of controlled airspace. According to FAA Order 7400.2M 6-3-8(b)(8), operating during these weather conditions requires pilots to remain within one statute mile of recognizable landmarks such as roads, rivers, transmission lines, railroad tracks, and low-altitude enroute airways. The FAA protects for known and regularly used VFR routes by limiting structure heights within two statute miles of these routes (hatched orange, Figure 2) to no greater than 499 feet ASL. Since there is no dataset that identifies unpublished VFR routes, historical usage becomes the defining factor in protecting these routes.
Figure 2: Potential VFR Routes in proximity to Revolution Wind
1 NOP data excludes certain military flights due to the sensitive nature of some operations.

4
Instrument Approach Procedures
The FAA publishes instrument approach procedures that provide course guidance to on-board avionics that aid the pilot in locating the runway during periods of reduced visibility and low cloud ceilings. Proposed wind turbines that exceed instrument approach procedure obstacle clearance surfaces would require an increase to their minimum altitudes. Increases to these altitudes, especially critical decision altitudes (DA) and minimum descent altitudes (MDA), can directly impact the efficiency of instrument approach procedures.
At 873 feet ASL, proposed wind turbines in the western section of the study area (red area, Figure 3) would require and an increase to the Block Island State Airport (BID) VOR Approach to Runway 28 procedure turn completion altitude from 1,500 to 1,900 feet AMSL.
Figure 3: Block Island State Airport (BID) VOR Approach to Runway 28

5
Minimum Vectoring Altitudes
The FAA publishes MVA charts that define sectors with the lowest altitudes at which air traffic controllers can issue radar vectors to aircraft. Proposed structures that exceed MVA sector obstacle clearance surfaces would require an increase to the altitudes usable by air traffic control for vectoring aircraft. At 873 feet ASL, proposed wind turbines throughout the Revolution Wind project (red areas, Figure 4) would require an increase to Boston Consolidated (A90) TRACON and Providence (PVD) TRACON MVAs.
In order to accommodate wind development up to 873 feet ASL, the FAA must establish isolation areas with an increased MVA. Depending on the chart affected, the isolation area would implement either a three or five nautical mile (NM) buffer around wind turbines in excess of the obstacle clearance surface. If the FAA determines that this impact would affect as few as one flight per week, it could result in determinations of hazard.
Figure 4: Providence (PVD) TRACON FUSION 5 MVA sectors (black) with
Sector C obstacle evaluation area (hatched purple)
6
Findings
Visual Flight Rules (VFR) Routes
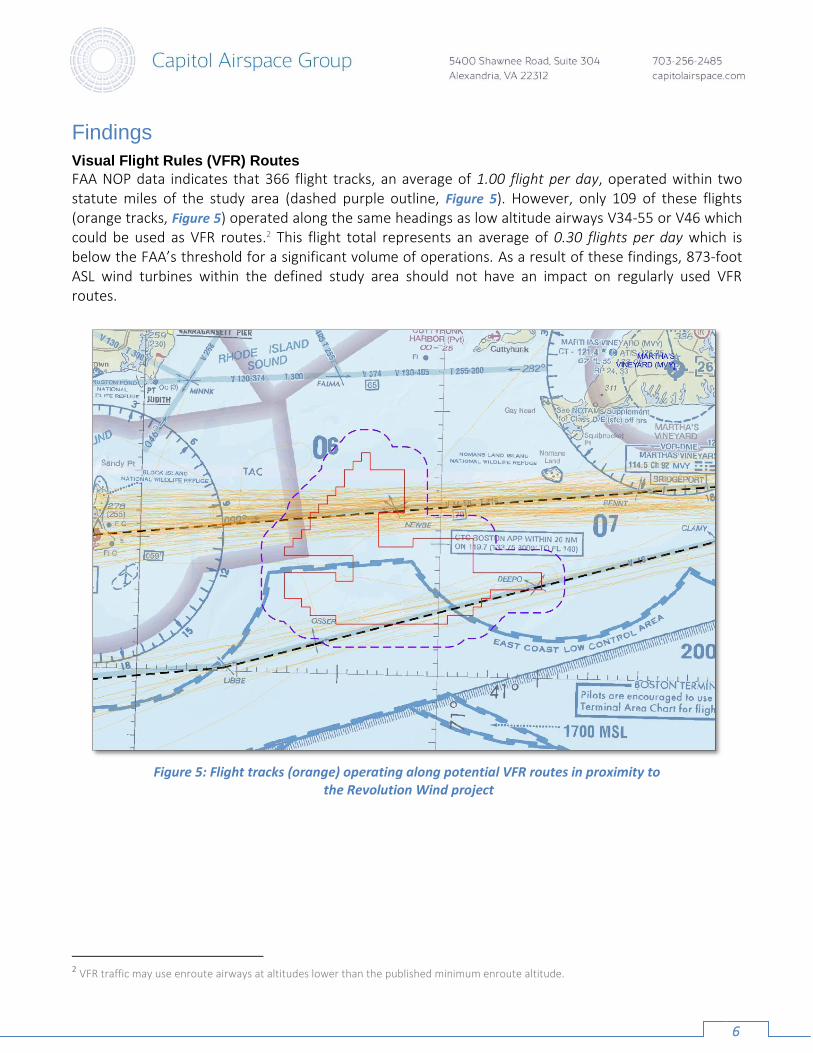
FAA NOP data indicates that 366 flight tracks, an average of 1.00 flight per day, operated within two statute miles of the study area (dashed purple outline, Figure 5). However, only 109 of these flights (orange tracks, Figure 5) operated along the same headings as low altitude airways V34-55 or V46 which could be used as VFR routes.2 This flight total represents an average of 0.30 flights per day which is below the FAA’s threshold for a significant volume of operations. As a result of these findings, 873-foot ASL wind turbines within the defined study area should not have an impact on regularly used VFR routes.
Figure 5: Flight tracks (orange) operating along potential VFR routes in proximity to
the Revolution Wind project
2 VFR traffic may use enroute airways at altitudes lower than the published minimum enroute altitude.
7
Instrument Approach Procedures
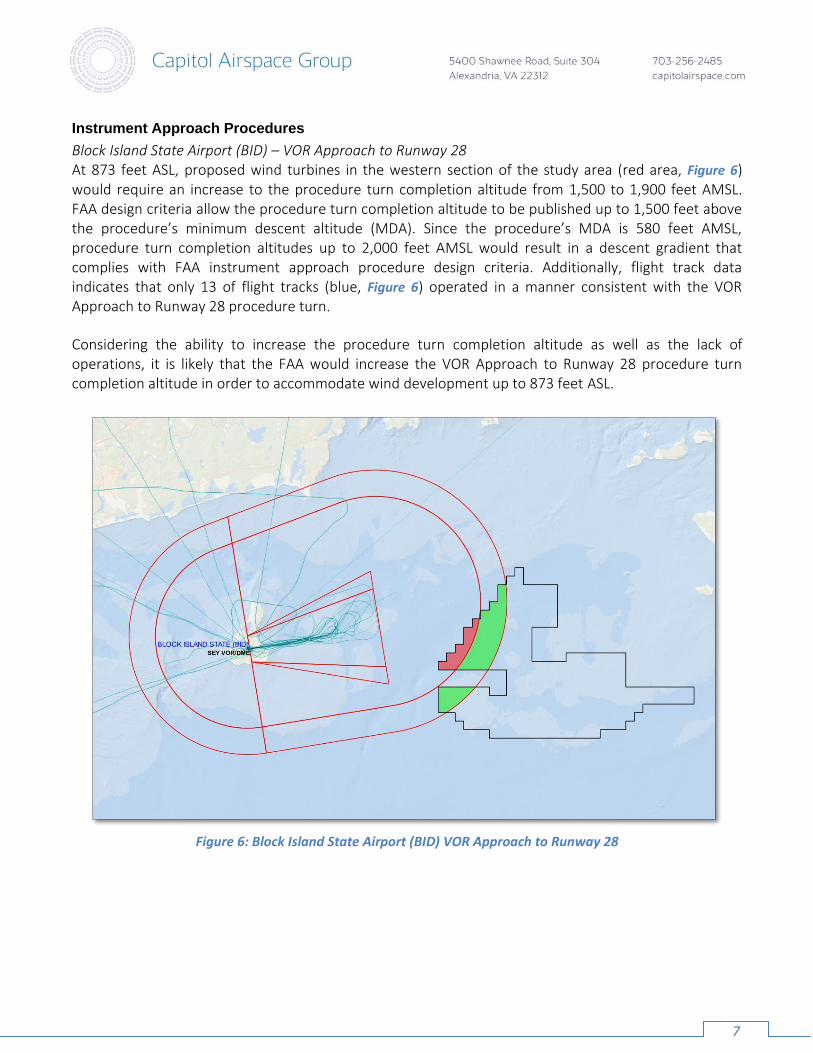
Block Island State Airport (BID) – VOR Approach to Runway 28 At 873 feet ASL, proposed wind turbines in the western section of the study area (red area, Figure 6) would require an increase to the procedure turn completion altitude from 1,500 to 1,900 feet AMSL. FAA design criteria allow the procedure turn completion altitude to be published up to 1,500 feet above the procedure’s minimum descent altitude (MDA). Since the procedure’s MDA is 580 feet AMSL, procedure turn completion altitudes up to 2,000 feet AMSL would result in a descent gradient that complies with FAA instrument approach procedure design criteria. Additionally, flight track data indicates that only 13 of flight tracks (blue, Figure 6) operated in a manner consistent with the VOR Approach to Runway 28 procedure turn.
Considering the ability to increase the procedure turn completion altitude as well as the lack of operations, it is likely that the FAA would increase the VOR Approach to Runway 28 procedure turn completion altitude in order to accommodate wind development up to 873 feet ASL.
Figure 6: Block Island State Airport (BID) VOR Approach to Runway 28
8
Boston Consolidated (A90) TRACON
Sector II (FUSION 3) & FF (FUSION 5) At 873 feet ASL, proposed wind turbines throughout the study area would exceed this surface and require an increase to the MVA from 1,500 to 1,900 feet AMSL.
3 NM Charts Flight track data indicates that 59 flights operated at the affected altitudes within the potential isolation area (dashed green outline, Figure 7). 38 of these flights were operations at or between nearby airports, or transiting the area. It is likely these flights were on their own navigation and not receiving radar vectoring services.
The remaining 21 flights (purple tracks, Figure 7) maintained an affected altitude through part of the isolation area and could have been receiving radar vectoring services. This flight total represents an average of 0.40 flights per week which is below the FAA’s threshold for a significant volume of operations.
5 NM Charts Flight track data indicates that 110 flights operated at the affected altitudes within the potential isolation area (dashed blue outline, Figure 8). 78 of these flights were operations at or between nearby airports, or transiting the area. It is likely these flights were on their own navigation and not receiving radar vectoring services.
The remaining 32 flights (orange tracks, Figure 8) maintained an affected altitude through part of the isolation area and could have been receiving radar vectoring services. This flight total represents an average of 0.62 flights per week which is below the FAA’s threshold for a significant volume of operations.
As a result of these findings, it is possible that Boston Consolidated (A90) TRACON would not object to modifying Sector II and Sector FF in order to accommodate 873-foot ASL wind turbines.

9
Figure 7: Historical flight tracks (purple) that potentially received radar vectoring services
within the required 3 NM isolation area (dashed green)
Figure 8: Historical flight tracks (orange) that potentially received radar vectoring services
within the required 5 NM isolation area (dashed blue)

10
Providence (PVD) TRACON
Sector C (Multiple Charts) At 873 feet ASL, proposed wind turbines throughout the study area would exceed this surface and require an increase to the MVA from 1,500 to 1,900 feet AMSL.
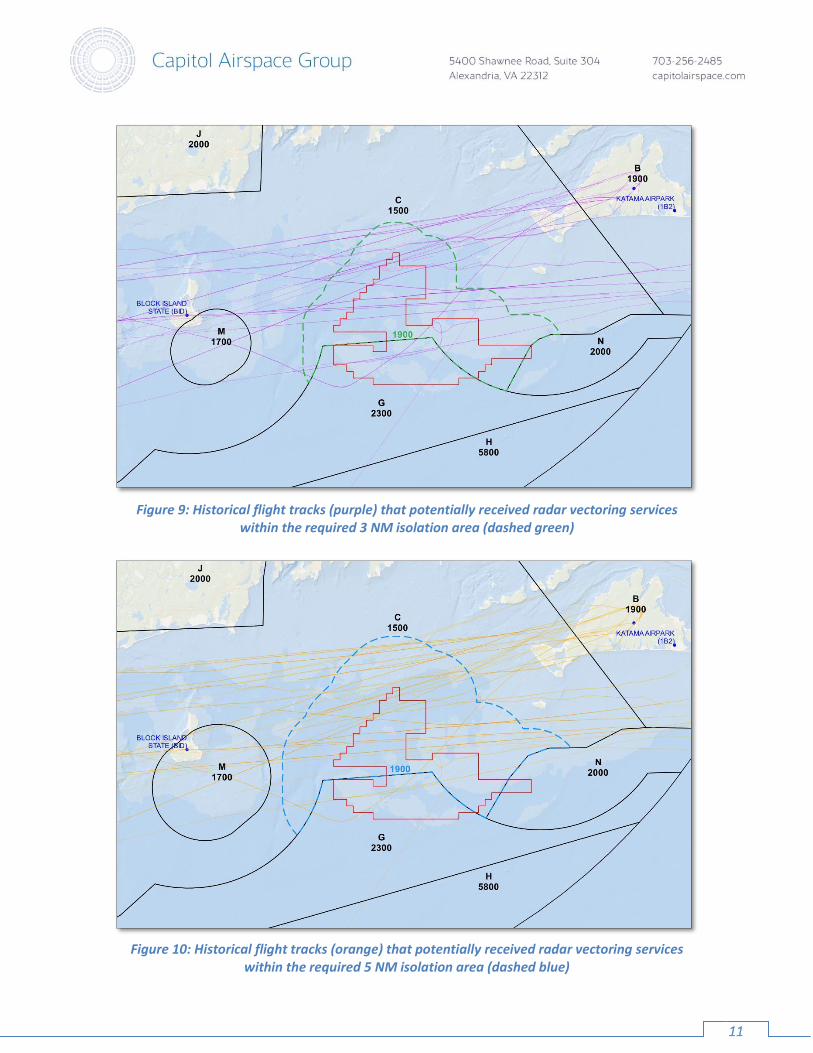
3 NM Charts Flight track data indicates that 59 flights operated at the affected altitudes within the potential isolation area (dashed green outline, Figure 9). 38 of these flights were operations at or between nearby airports, or transiting the area. It is likely these flights were on their own navigation and not receiving radar vectoring services.
The remaining 21 flights (purple tracks, Figure 9) maintained an affected altitude through part of the isolation area and could have been receiving radar vectoring services. This flight total represents an average of 0.40 flights per week which is below the FAA’s threshold for a significant volume of operations.
5 NM Charts Flight track data indicates that 110 flights operated at the affected altitudes within the potential isolation area (dashed blue outline, Figure 10). 78 of these flights were operations at or between nearby airports, or transiting the area. It is likely these flights were on their own navigation and not receiving radar vectoring services.
The remaining 32 flights (orange tracks, Figure 10) maintained an affected altitude through part of the isolation area and could have been receiving radar vectoring services. This flight total represents an average of 0.62 flights per week which is below the FAA’s threshold for a significant volume of operations.
As a result of these findings, it is possible that Providence (PVD) TRACON would not object to modifying Sector C in order to accommodate 873-foot ASL wind turbines.
11
Figure 9: Historical flight tracks (purple) that potentially received radar vectoring services
within the required 3 NM isolation area (dashed green)
Figure 10: Historical flight tracks (orange) that potentially received radar vectoring services
within the required 5 NM isolation area (dashed blue)

12
Conclusion
Capitol Airspace assessed FAA NOP data covering the period of one year to determine the likelihood of proposed 873-foot ASL wind turbines affecting a significant volume of VFR or IFR operations:
VFR Routes
Impact: At 873 feet ASL, proposed wind turbines within two statute miles of low-altitude airways V34-55 and V46 could have an impact on enroute VFR operations.
Findings: 109 flights (0.30 flights per day) operated along the same headings as low altitude airways V34-55 or V46. This flight total represents an average utilization which is below the threshold for a significant volume of VFR operations (one per day).
Block Island State Airport (BID) – VOR Approach to Runway 28
Impact: At 873 feet ASL, proposed wind turbines would require an increase to the procedure turn completion altitude from 1,500 to 1,900 feet AMSL.
Findings: The procedure turn completion altitude could be increased to 2,000 feet AMSL while still complying with FAA instrument approach procedure design criteria. Additionally, only 13 flights (0.25 flights per week) operated in a manner consistent with the procedure turn. This flight total represents an average utilization which is below the threshold for a significant volume of IFR operations (one per week).
Boston Consolidated (A90) TRACON and Providence (PVD) TRACON MVAs
Impact: At 873 feet ASL, proposed wind turbines throughout the study area would require an increase to MVAs from 1,500 to 1,900 feet AMSL.
Findings: As many as 21 flights (3 NM charts) or 32 flights (5 NM charts) could have been receiving radar vectoring services within the potential isolation areas. These flight totals represent an average of 0.40 flights per week (3 NM charts) or 0.62 flights per week (5 NM charts) which are below the threshold for a significant volume of IFR operations (one per week).
As a result of these findings, it is possible that the FAA would not object to increasing the affected altitudes in order to accommodate 873-foot ASL wind turbines. These mitigation options are available and are subject to FAA approval.
Please contact Dan Underwood or Candace Childress at (703) 256-2485 with any questions regarding the findings of this analysis.