air-temperature variations and enso … variations and enso effects in indonesia, the philippines...
TRANSCRIPT

Pergamon Atmospheric Env;ronment Vol 29, No 16, pp 1919-1942, 1995 Copynght © 1995 Ellewer Science Ltd
Printed m Great Bntam All rights reserved 1352-2310/95 $9.50 + 000
1352--2310(95) 00017-8
AIR-TEMPERATURE VARIATIONS AND ENSO EFFECTS IN INDONESIA, THE PHILIPPINES AND EL SALVADOR. ENSO
PATTERNS AND CHANGES FROM 1866-1993
J. R. E. HARGER UNESCO/ROSTSEA, Jln. M. H. Thamrin 14, Jakarta, Indonesia
Almtract--The major features m development of the "El Nine-Southern Oscillation" (ENSO) involve oscillation of the Pacific ocean-atmosphere in an essentially unpredictable (chaotic) fashion. The system moves between extremes of the so-called "warm events" lasting one or two years and involving movement of warm sea 'water from the western Pacific along the equator to impact on the west coast of the American continent and "cold-events" associated with easterly trade-wind-induced flows of colder water from the eastern Pacific towards the west. Historical data indicate that ENSO years as experienced by the Island of Java are either much warmer than non-ENSO years or only slightly, if at all, warmer than normal (non-ENSO) years. Hot-dry years within the ENSO warm event cycle are almost always followed by cooler wet years and vice versa. This pattern also extends to include the year immediately following the terminal year of an ENSO warm event set. The initial year of an ENSO warm event set may be either hot with a long dry season oF relatively cool (nearer to the temperature of a non-ENSO year) and having a short dry season. In recent years, since 1950, of the 9 ENSO warm events, the initial year tends to have been hot and dry for 6 (1951,1957.. 1963,1972,1982,1991) and neutral or cool and wet for 3 (1968,1976,1986).
An area of 88,000 ha burned in 1991 (Jakarta Post 30 November 1991) largely in Kalimantan in association vdth the 1991-1992 ENSO event, an extensive pall of smoke developed over Kalimantan, Singapore and Malaysia during September-October of 1991. Surface vegetation-based fires continued to burn in East Kalimantan as of 29 April 1992 and extended into the 1992 dry season, m response to the ENSO conditions carrying forward from 1991.
The increasing annual trend in air-temperature exhibited by the mean monthly values over the period 1866-1993, for the Jakarta and the Semarang data taken together is 1.64°C (0.0132°C per year from 25.771 to 27.409°C). The major industrial development in infrastructure for Jakarta has been significant only since 1980 or so and was not apparent before 1970 when the city had the aspect of an extended village with few large buildings (greater than 3-4 stories) and no extensive highways. The 1.65 ° difference between 1866 and 1991 can presumably be partitioned into: (1) urban heat-isiand effect, (2) effect of deforestation, (3) effect of secular micro-climate shift, (4) influence of general global warming voth partacular reference to the tropics.
When the blocks of non-ENSO years in themselves are considered, the deviations from the secular trend for warmest month mean temperatures in successive years are correlated with that of the next immediate year deviation so that either continual warming or cooling appears to take place from the termination of one ENSO to the initiation of the next. When the deviations around the secular trend shown by the warmest month average temperatures are summed for the inter-ENSO intervals (the separate non-ENSO years) the resultant "heat-loading" index is positively correlated with the following (initial) ENSO warmest month deviation from the overall ENSO warmest month secular trend. This provides an immediate predictive mechanism for the likely strength of an ENSO, m terms of the dry season impact to the Island of Java, should one occur in the next year to break a non-ENSO sequence. The length of the build-up and the build-up achieved seems not to be related. The relationship does not in itself however, predict the occurrence of the "next" ENSO.
The data show that a consistent structure underlies ENSO events for the last century and a quarter. However, as a process momtored by mean monthly air-temperature measurements at Jakarta-Semarang, the system is changmg in character with time in association with an overall atmospheric temperature increase in a way that involves increased intra-annual temperature fluctuations. In general ENSO years are associated with higher temperatures than non-ENSO years, with a significant negative correlation between subsequent years which are thereafter systematically cooler. This may be because the ENSO event actively mixes excess heat energy into the ocean-sink to an extent that is in direct proportion to the outstanding positive temperature deviaUon. A weak ENSO, preceded by a relatively modest temperature build-up in the lead-up non-ENSO years, then results in limited mixing which leads to a relatively warm subsequent year while a strong event leads to extensive mixing and so generally results in a following very much cooler year. Atmospheric IIemperature build-up possibly associated with the greenhouse effect may be coupled to an increasingly wider temperature swing in west and central Java associated with the warm pool influence but anchored by the ocean-sink.
Key word index: El Nine, southeast Asia, drought, global change, warm events.
1919

1920 J . R . E . HARGER
INTRODUCTION
The major features in development of the "El Nino- Southern Oscillation" (ENSO) are discussed by Wyrkti (1982) and later by Enfield (1988). In brief, the system oscillates in an essentially unpredictable (chaotic) fashion between extremes of the so-called "warm events" involving movement of warm sea water from the western Pacific along the equator to impact on the west coast of the American continent and "cold-events" associated with easterly trade- wind-induced flows of colder water from the eastern Pacific towards the west. An atmospheric pressure relationship described by the difference in sea-level air pressure between Tahiti and Darwin, reverses as the two extremes are approached. This pressure difference is termed the "Tahiti-Darwin Index" (T-D Index) or "Southern Oscillation Index" (SO1). A strong down- ward trend with a consequent low index value takes place with progressive development of a "high" over Darwin and a "low" over Tahiti indicating develop- ment of an ENSO warm event condition. This condi- tion coincides with the release of pooled warm water in the region of the western Pacific around eastern Papua New Guinea and the subsequent west to east transmission in the form of a "Kelvin Wave" chan- neled along the equator, and often with the establish- ment of drought conditions over much of Indonesia. Wyrkti (1982) and Enfield (1988) provide detailed explanations of Kelvin wave formation together with the related Rossby wave responses.
INII~NESIA AND SOUTHEAST ASIA
Indonesia lies on the western margin of the ENSO interaction and for the most part enjoys a humid tropical climate except in the eastern most regions. Indonesia presently supports extensive tracts of tropi- cal rain forest apparently amounting to some 117.9 million ha in 1990 which accounts for some 6.4% of the global total estimated as 1838 million ha in 1982 (Brown and Lugo, 1982). For Indonesia, the ENSO- associated warm event drought of 1991 led to the failure of 190,000ha in paddy with an overall 843,000 ha affected. This event caused unprecedented losses in rice production to Indonesia resulting in 600,000 tons being imported to the previously self- sufficient archipelago. In 1982-1983 the ENSO-asso. dated drought of that time, resulted in 420,000 ha of paddy being affected and failure of 158,000 ha and was also accompanied by forest fires which burned 3.7 million ha of generally second-growth timber, mainly in Kalimantan (Borneo), Murdiyarso (1993). An area of 88,000 ha burned in 1991 (Jakarta Post 30 Novem- ber 1991) largely in Kalimantan in association with the 1991-1992 ENSO event. An extensive pall of smoke developed over Kalimantan, Singapore and Malaysia during September-October of 1991 and in 1994. The maximum mean monthly air temperature
for data obtained from the cities of Jakarta and Semarang (Java, Indonesia) in 1991 was 29.1°C.
AIR TEMPERATURE
Air-temperature records from Jakarta (Pusat) 06 ° 11 min south, 106 ° 50 min east, population 8.8 million in 1991, exist since 1866 with missing years confined to 1943,1946,1947 and 1958. These have been com- bined, "pooled" with records from Semarang 07 ° 00 min south, 110 ° 25 min east, a smaller city (popula- tion 1.1 million in 1989) 450 km to the east, from the year 1982-1991 inclusive. Figure 1 shows the secular trend of the mean annual temperature (degrees Centi- grade) together with regression lines representing the mean temperatures for the warmest and coldest months for ENSO and non-ENSO years, respectively. The slopes of the regression lines representing the coldest and the warmest months differ significantly from each other. When the Jakarta-Semarang tem- perature records for ENSO warm event years (Kiladis and Diaz, 1989; Brookfield and Allen, 1991; Wang, 1991) are separated from "non-ENSO years", that is all other years, the former are significantly warmer. than the latter on average by 0.16°C throughout the time covered by the data, but the trend towards in- creasing temperature is consistent for both groups so that each appears to increase in temperature at the same rate. The relationship between temperature of warmest months for ENSO and non-ENSO years is shown in Fig. 2.
The secular change in the mean temperature of the warmest month in the year throughout the record is also shown in Fig. 3 which uses different symbol-sets to depict succeeding ENSO-blocks. An ENSO-block is defined as starting immediately after the last year of an ENSO (warm) event running through to include the next year or years involving a warm event. Warm events thus terminate ENSO-blocks.
In Fig. 3 the ENSO years are represented by the last one or two positions for each ENSO-block. Double ENSO-years are: 1877-78, 1880-81, 1899- 1900, 1904-05,1913-14, 1918-19, 1925-26,1940-41, 1944--45, 1957-58,1968-69,1982-83,1986-87,1991- 92-93. As previously mentioned, a progressive in- crease is recorded in the warmest month temperature for both ENSO and non-ENSO years with the former being approximately 0.45 ° warmer than the latter with no significant difference in the rate of increase between the two as estimated by the slopes of the regression lines relating temperature to time. The slopes of the regression lines relating the warmest month means on an annual basis in relation to time differ significantly for both ENSO and non-ENSO years to those of similar lines describing the mean temperature of the coldest months (p < 0.001) with the former being steeper than the latter (Fig. 1). When examined in detail, the Jakarta/Semarang data indi- cate that as warming has proceeded, the behavior of

29
Z8
z7
Z5
Air-temperature variations and ENSO effects
Jakart~ a i r t m l g r a ~ r e
Degrees Centigrade. I I i
-+- ~ m ~ c s t month man
nonD~O ~ r n e s t ~ n t 5 -~
• - ~ e m ~ l d ~ i .o, ,u, . - - ' , \ \ ...,, x~ nonEHSl) coldest nont5
\
\
I , I , I J ] ,
11)55 1091 1917 1943
Time (Hears)
Fig. 1. Jakarta air temperature (°C).
I
i , I
1959 1995
1921
3e
Z9
i zo e~
£
25
Jakarta a i r temperature, nonthly neans, Degrees Centigrade.
- , - [1~0 warmest north -+- nonEHSO u a ~ e s t month - , .
kgression i ' ~ -0- Regression J1%~. a hot zsso'~ea~,,]
/
1865
• ~ ,~. , jp jp~.- ,J ~ k' ~
~ a coo l D I ~ 9e.ar,[ iSt ion -8.9S c~=9, C.
1091 191? 1943 1959 TIMe (pears)
F i g . 2. J a k a r t a a i r t e m p e r a t u r e , m o n t h l y m e a n s ( °C) .
1995

1922
3O ~3
z8
g t l I--
Z6
J. R. E. HARGER
Warmes t month t e m u e r a t u r e , J a k a r t a u e r s u s t - l ~ - ( g e a r s )
I 1 I I I I
J a k a r t a , Indonesia
g=-R.S4+O.BXS~, P=8.83, n=124, p¢,0.08881 ~ ~ mm
• " ~ ,
s t s r e O-blocksJ !
, . . . . T l a e , ( g e # . r s ) ~ , , , , , i -1
1860 1887 1914 19't I 1968 1995
$umbols a r e : 1 . Z . 3 . ' 1 . S . 6 . 7 . 8 . 9 . O . + . * . ' . # . S . o . x . > . < . ] . [ . { . } . ) . (.@ Fig. 3. Warmest month temperature, Jakarta versus time (yr).
both the ENSO and non-ENSO years has apparently changed in a systematic manner over 127 yr in a way that involves an increase in annual fluctuations in mean monthly air temperature with the non-ENSO years now showing a marginally smaller range than the ENSO group. The coldest month temperatures for ENSO years are now slightly lower than for non- ENSO years and the difference was not apparent at the beginning of the record. Overall, the warmest month temperature for all years has increased at a rate of 1.5°C per 100 yr.
The air-temperature records from (port area) Ma- nila (120 ° 59 rain east, 14 ° 35 min north, elevation 15 m, population 7.9 million, 1992) and from Davao (125 ° 39 rain east, 07 ° 07 min north, elevation 18 m, population 843,000, 1990), in the Philippines show the same upward trend as for the Jakarta/Semarang set with annual mean warming of 2.2°C and 1.7°C, re- spectively, per 100 yr. In addition, the annual devi- ations from the overall secular trend are relatively strongly correlated among all three (r > 0.4, p ~< 0.0001) showing that at least southeast Asia tends to behave as a sympathetic unit as far as temperature variations as well as increases are concerned. The towns of Baguio, 16 ° 25 min north, 120 ° 36 min east, elevation 1500m and Maktan Airport, Cebu 10 ° 18 min north, 123 ° 58 min east, elevation 13 m also show upward temperature trends from 1920 and 1950,
respectively, with the warmest months growing at 3.5°C and 3.0°C per 100 years. The warmest month deviations for ENSO years are positively correlated for Jakarta and Baguio (r = 0.69,n = 16, p = 0.0026) and for all years (r = 0.31, n = 61, p = 0.012). It may also be noted that neither Davao nor Manila show a significant difference between the temperatures of the wannest months for ENSO and non-ENSO years and there is likewise no difference in the slopes of regression lines describing changes in the warmest and coldest months with time.
PATTERNS IN TEMPERATURE DEVIATION
If the secular changes shown by the mean temper- ature of the warmest months in both ENSO and non-ENSO years are considered separately for the Jakarta/Semarang data, the deviation from the trend shown by the maximum of the mean monthly ENSO temperature values plotted against the deviation of the maximum mean monthly temperature in the fol- lowing non-ENSO year shows a consistent pattern, r - - - 0 .64 , n = 2 5 , p=0.0004. In brief, if the ENSO year deviation is high and positive the follow- Lug non-ENSO year deviation will be high and nega- tive. A negative ENSO year warm deviation means a following positive non-ENSO year deviation and so

Air-temperature variations and ENSO effects 1923
14az.nes4k m o n t h dev la4kes f't-om s e c u l a r t a m m l rot- ~ 9 e a z . s v e r ~ e s d e v i a t e in s u c c e e d i n g year . , p e w i o d 1866 - 1 9 9 3
d 0 . 9 ~ . . . . . ' . . ' . . . . . ' . . ! . . . ' . . . 7 . . . - . . . . . I . . ; . . . . . : . . . . : . . . . ~ ' , , I ' ' . '113"~'_1
F, i / I - " . . :: - - . . _ . l g e Z ' 4
. / , ~ , 1 9 8 6 "- ~ ~ /
g ~- - ~ ; ."i.~11 1913 J • n / ~ 1880 '-- ' .18118.19,10 . |
"-- 1866 llPJ6 1
L i - " 1
- ° ' ? F ; , , ; i , . , i ' , ; ; ; , , ; ; , , ; . - ] . - 0 . 6 - 0 . Z 0 . Z 0 . 6 1
ENSO vear, waPmes't montkh d e v l a ~ . l o n fr.om s e c u l a x , 4:r~nd, Degx ,ees C.
Fig. 4. Warmest month deviates from secular trend for ENSO years versus deviate in succeeding year, period 1866-1993.
forth. This pattern also holds throughout both years of a double ENSO cycle as well as for the next non- ENSO year (Fig. 4).
The data indicate that ENSO years as experienced by the Island of Java are either much warmer than non-ENSO years or only slightly, if at all, warmer than normal (non-ENSO) years (Fig. 2). Hot-dry years initiating ENSO warm events which are also "double-year" activities are almost always followed by cooler wet years and vice versa. As indicated pre- viously, this pattern also extends to include the year immediately following the terminal year of an ENSO warm event set. The initial year of an ENSO warm event set may be either hot with a long dry season or relatively cool (nearer to the temperature of a non- ENSO year) and having a short dry season. In recent years, since 1950, of the 9 ENSO warm events, the initial year tends to have been hot and dry for 6 (1951, 1957, 1963, 1972, 1982, 1991) and neutral or cool and wet for 3 (1968, 1976, 1986).
When the blocks of non-ENSO years in themselves are considered, the deviations from the secular trend for warmest month mean temperatures in successive years are positively correlated with that of the next immediate year deviation so that continual warm- ing appears to take place from the termination of one ENSO to the initiation of the next (r = 0.304, p = 0.027, n = 52, y = - 0.065 + 0.2637x, where y is
the following non-ENSO deviation of the warmest month and x is the preceding non-ENSO year warm- est month deviation). The relationship is strongest for the year after an ENSO and the succeeding year (r = 0.485, p = 0.035, n = 18).
If the deviations around the secular trend shown by the warmest month average temperatures are sum- med for the inter-ENSO intervals (the separate non- ENSO years) the resultant "heat-loading" index is positively correlated with the following (initial) ENSO warmest month deviation from the overall ENSO warmest month secular trend (r = 0.432, p = 0.027, n = 25, (one point, 1951, is uncertain since it is miss- ing from the original data and estimated by use of the "southern oscillation index" or SO1) y = -0 .0346 + 0.347x where y is the next ENSO year warmest month deviation and x is the sum of the successive yearly warmest month deviations since the last ENSO). This provides an immediate predictive mechanism for the likely strength of an ENSO should one occur in the next year to break a non-ENSO sequence. The length of the build-up and the build-up achieved seems not to be related. The relationship does not in itself predict the occurrence of the "next" ENSO, merely its likely "strength" should one occur.
The relationship involved with the "heat-loading" index is also preserved throughout the whole of an ENSO-block starting with the year following the last
A£ Zg-16-D

1924 J.R.E. HARGER
identified ENSO year and running through to include the subsequent one or two ENSO years which termin- ate the sequence. Where the annual deviations of the warmest months recorded from an overall secular trend for both ENSO and non-ENSO years are used to construct the accumulated heat-loading index, the relationship between the successive accumulated de- viations and that of the following year is pos- itive, r = 0.851, p < 0.00001, n = 89, y = 0.0299 + 1.0737x, where y = the subsequent year heat-loading index accumulation and x the preceding year heat- loading index accumulation. The slope in excess of 1.0 shows that negative trending accumulations tend to remain negative or become more so and the positive accumulating trends tend to become self-reinforcing. The cross-over point for positive reinforcement is a deviation of /> -0.0278°C. A positive-starting warm series build-up is almost always followed by a very warm ENSO (1876, 1890, 1912, 1962, 1967, 1971, 1981, 1991). Note that the 1876 series started with a slight positive deviation from the secular trend, then became slightly negative before delivering two very hot ENSO years. In addition, negative-starting and negative-tending series (such as those terminated by the years 1883, 1895, 1910, 1917, 1924, 1929, 1939, 1943--has a critical missing observation, negative by estimation from the SOI, 1950-- two initial years are
missing from this unit plus the last (1951) which are all negative by estimation from the SOI, 1975, 1985) never result m very warm subsequent ENSOs. The "neutral-trending" multi-year series (having more than 1 inter-ENSO year) not mentioned above (1887, 1898, 1956) do not end in very warm ENSOs and show no apparent trend. The initial years of the block terminating in 1876 with the "hot" 1877-1878 ENSO can be considered as "neutral trending".
As a rule the developing individual year-blocks trace out differing histories and show less variation around the overall trend than the data indicate as a whole. This means that the temperature of the warmest month of succeeding years within an ENSO block (including the actual ENSO year deviations), can be predicted to an extent if the "heat-loading" index build-up is known. However, the identification of a succeeding year (ENSO or non-ENSO) cannot be assumed. If a subsequent ENSO year is postulated then a reasonably accurate estimate of its likely im- pact can be deduced. The cumulative ENSO-block traces around the secular trend, for the warmest month temperatures depicted in Fig. 3, are illustrated in Fig. 5.
For Indonesia and presumably for much of south- east Asia the ENSO events are variable in expression. As a generality, they are part of successions which
C u m u l a t i v e t e m p e r a t u P e d e v i a i i o n ~ from s e c u l a r t r e n d ( d e g C)
o
4#
|0
o
o
,N
E ~-2 18fi0
I | l I I |
18"~ Symbol = e t s a ~ e D I S O - b l o c k s
18fi8
1983
I I 1
Jakarta, I n d o n e s i a
1911 1976 I , , I , , I , , i , , I
1887 1914 1941 19fi8 T imo Q~ears)
Symbol sets : 1,2,3,4,5,6,7,8,9,8,+,*,^,¢,~,o,x,>,<,=,-,],[, { ,} ,),(,~
;3
1995
( t o t a 1=28)
Fig. 5. Cumulative temperature deviations from secular trend (°C).

Air-temperature variations and ENSO effects 1925
commence as soon as a warm event is over. The succession involved tracks progressively warmer on a cumulative basis or progressively cooler than the secular warming trend. Cool sequences tend to end with relatively cool initial-year ENSOs with no drought in central Java. Warming sequences end with very hot ENSOs and severe drought. This has been the case since the temperature record was initiated in 1866. There were more warm trending sequences in the beginning (1866-1900 or so), more cold in the middle (1901-1945), and now more warm again (1946-1992).
A further indication of the direct relationship be- tween ENSO and air temperature in west and central Java is shown by the relationship between the deviate from the secular temperature trend for the warmest months of ENSO years which is inversely related to the mean height of the sea-level in the Sunda Straits measured at the Panjang tide gauge over the period 1977-1989, (r = - 0.58, n = 14, p = 0.022). This re- lationship probably arises as the result of the tendency for the ENSO event to be associated with movement of water from the western Pacific across to the east.
MR-TEMPERATURE RECORDS FROM INDONESIA
The earliest systematic record of air temperature from Indonesia appears to be that associated with the observatory set up by the Dutch administration in the City of Jakarta (Batavia), dating from 1866 and conti- nuing m an almost unbroken sequence through to the present with the exception of the years 1943,1947 and 1958. A number of other stations were however, estab- lished throughout the archipelago around 1912-1913 and later. Records from these locations were main- tained without moving the original recording sites until at least 1938. lVlany of these stations were reac- tivated in 1949 anti the early 1950s however, only a few of these locations were used continuously. For the most part, the actual recording sites were shifted over relatively short distances ranging from 1 to 25 km or so to coincide with more convenient loca- tions such as new airports, research stations and so forth. Many new lo(:ations were added to the overall national monitoring, effort although at the same time measurements at a significant number of older sites were discontinued. Between the early 1950s to the present, as many as 5-6 minor adjustments were made to monitoring locations in particular instances.
To initiate an assessment of air-temperature trends in Indonesia, an effort has been made to examine records from a broad array of stations throughout the archipelago. The summary disposition of the informa- tion examined is shown in Table 1. With the exception of the temperature records from 1986 to 1938 which were drawn from Boerema (1940), all remaining data for Indonesia were extracted by hand from the in- formation-sets held by Badan Meterologie dan Geafisika (Indonesian Meteorological and Geophysi-
cal Organization) and the Indonesian Ministry of Agriculture in non-computerized formats.
In view of the preceding discussion, the available station records were divided into three groups. Group 1 consisting of 14 stations consists only of continuous monthly records generated by the Dutch administra- tion over periods not less than 10 yr between 1866 and 1944 (Boerema, 1940), Table 2. Group 2 consists of all stations which were continued by the new republic either at the original monitoring site or close by. This comprises a set of 16 stations, Table 3. A third set of "modern" observations has also been defined as the last apparently "coherent" array of measurements from active or recently active stations, Table 4. A total of 33 record-sets are involved here.
The three groups are not mutually independent and only group 1 consists exclusively of stations which were never moved throughout the period of record. Station movement may obviously effect the temper- ature record either by forcing a step-wise upshift or downshift. A record from any of the "moving stations" was judged to be "coherent" if no simple "step" was observed in association with a location change and if the general range of associated variation did not ap- parently exceed that displayed by the comprehensive Jakarta Pusat data set. This judgment was performed visually rather than statistically.
Group 2 consists of 12/16 locations with measure- ments obtained at 2 or more sites (small altitude changes were not classified as site-shifts) and group 3 contains 17/33 such locations. Measurements re- corded in group 2, long-term, are also reflected in the information exhibited by groups 1 (early) and 2 (late or "modern"). The station at Padang (Sumatra) for instance shows a continuous early record from 1913 to 1938 and again later from 1971 to 1989. The tem- perature trend in each of the two sectors is positive and significant. The early series showing an increase of 1.3°C per 100 yr and the later also 1.3°C per 100 yr (see Table 1). There is a marked temperature down- shift between the two associated with the change in recording site so that the overall trend is negative with a decrease of 0.7°C per 100 yr. No overt adjustment is made to account for this effect when all the stations in group 2 are considered so that the overall trend is considered to be negative but the data set is not classified as "coherent". Group 1 and group 3 subsets (early and late, see above) are each considered separ- ately to be coherent for the Padang station. Full details of the data sets considered are given in Table 1. There are overall 7 station locations from Sumatra, and adjacent islands, 13 from Java, 5 from Kaliman- tan, 3 from Sulawesi and 8 from east Indonesia to make a total of 36 in all.
Temperatures increased for all 14 stations exam- ined in group 1 for the period 1866-1944. The major- ity of the data were from the period 1912-1938. The reason for considering these stations was that they were mainly associated with records continuing into post-colonial times. The sole exception being

Tab
le 1
. S
tati
ons
cons
ider
ed fr
om
th
rou
gh
ou
t th
e In
done
sian
arc
hipe
lego
Sta
tion
S
pan
year
s T
ime
fram
e Si
onif
lcan
ce
Slo
pe
Sam
ple
size
Si
tes
Coh
eren
ce
Lat
itud
e L
ongi
tude
H
t (m
) D
urat
ion
Sum
atra
O~
Sab
ang
4 76
-79
NS
0.
0070
16
2 2
Y
06 0
9N
095
08E
40
76
-77
05 5
2N
095
19E
12
6 78
-79
Med
an
76
14-8
9 <
0.0
005
0.01
63
6 5
Y
03 3
5N
098
41E
25
14
-50
03 3
4N
098
40E
31
51
-63
03 3
4N
098
41E
?
71-7
5 03
32N
09
8 39
E
? 76
-79
03 3
4N
098
41E
27
80
-89
Med
an
25
14-3
8 <
0.0
005
0.02
28
9 1
Y
03 3
5N
098
41E
25
14
-50
Med
an
41
49-8
9 <
0.0
005
0.01
49
346
5 Y
03
35N
09
8 41
E
25
49
-50
03
34N
09
8 40
E
31
51-6
3 03
34N
09
8 41
E
7 71
-75
03 3
2N
098
39E
?
76-7
9 03
34N
09
8 41
E
27
80-8
9 P
adan
8 77
13
-89
< 0
.000
5 -0
.00
7
527
2 N
00
53S
10
0 21
E
2 13
-38
00 5
6S
100
22E
7
71-8
9 P
adan
g 26
13
-38
< 0
.000
5 0.
013
307
1 Y
00
56S
I0
0 22
E
7 13
-38
Pad
ang
19
71
-89
< 0
.000
5 0.
013
219
1 Y
00
53S
10
0 21
E
2 71
-89
Ban
dar
Ace
h 16
73
-88
NS
0.
01
125
1 Y
05
31N
09
5 25
E
19
73-8
8 Ja
mbi
27
53
-79
< 0
.000
5 0.
009
387
4 ?
01 3
5S
103
38E
10
53
-60
01 3
5S
103
36E
10
61
-69
01 3
8S
103
39E
10
/26
71
-74
01
35S
10
3 38
E
10
65
-79
K
ijan
8 26
63
-88
NS
-
0.00
3 18
6 5
Y
00 5
6N
104
32E
17
80
-89
00 5
5N
104
32E
18
7
1-7
5
00 3
2N
104
27E
27
7
6-7
7
05 5
5N
104
32E
17
7
8-7
9
05 5
4N
104
22E
2
63
-65
L
ampu
ng
17
73-8
9 <
0.0
005
0.05
2 18
2 3
Y
05 1
5S
105
llE
96
73
-74
05 1
5S
105
I1E
10
7
5-7
6
05 1
5S
105
liE
85
7
7-8
9
Java
Ja
kart
a P
usat
12
7 18
66
< 0
.000
5 0.
0134
14
68
2 Y
06
11S
10
6 50
E
8 18
66-1
960
1992
06
10S
10
6 49
E
8 6
1-9
2
Jaka
rta
Pus
at
79
1866
<
0.0
005
0.01
44
935
1 Y
06
11S
10
6 50
E
8 18
66-1
960
1944
Ja
kart
a P
nsa
t 32
61
-92
< 0
.000
5 0.
0121
38
1 1
Y
06 1
0S
106
49E
8
61-9
2 T
anju
ng P
riok
40
51
-90
< 0
.000
5 0.
0097
32
4 2
Y
06 0
5S
106
53E
3
51-6
0 06
06S
10
6 54
E
2 71
-91
Hal
im
29
63-9
1 <
0.0
005
0.02
9 23
5 2
Y
06 1
6S
106
53E
26
79
Y
06
16S
10
6 54
E
31
63
-64
Y
06
16S
10
6 54
E
31
75
-77
Y
06
16S
10
6 54
E
30
74
~n

Ser
ang
Bor
obud
ur
Jog j
akar
ta
Ngi
piks
ar
Ban
dung
Ban
dun8
B
andu
n8
Sur
abay
a
Sur
abay
a S
urab
aya
Pas
urua
n P
asur
uan
Pm
un
mn
D
jem
ber
Dje
mbe
r K
aran
ganj
ar
~S
(an)
Sem
aran
g (a
ll)
Kal
iman
tan
Tar
akan
21
19
39
19
59
27
19
72
20
39
57
25
22
39
27
17
74
22
22
52
49-6
9 71
-89
51-8
9
71-8
9
12-7
0
12-3
8 52
-70
19-9
0
19-3
8 52
-90
14--
70
14-3
8 4
9-7
0
12-5
0 12
-38
17-3
3 19
-92
71,-
92
71-9
2
14-6
5
NS
<
0.0
05
< 0
.01
< 0
.000
5
< 0
.000
5
< 0
.000
5 N
S
< 0
.005
< O
.O5
< 0
.000
5
<0.
0005
<
0.0
005
< 0
.000
5 N
S
< 0
.005
<
0.0
005
< 0
.000
5
NS
< 0
.005
< 0
.000
5
0.01
2 0.
022
0.08
7
0.09
3
0.00
7
O.O
2 -
0.01
0.01
4
0.01
4 0.
023
0.01
0.
024
0.02
8 0.
006
0.00
6 0.
032
0.00
99
- 0.
0056
- 0.
024
0.01
8
167
220
331
193
550
311
239
6O6
223
38O
542
297
244
332
311
2O3
479
397
2OO
443
1 Y
06
07S
10
6 08
E
40
1 Y
07
37S
11
0 01
E
270
2 Y
07
47S
11
0 26
E
122
07 4
7S
110
24E
12
2 1
Y
07 3
7S
110
26E
77
5 07
37S
11
0 26
E
766
5 Y
06
56S
10
7 36
E
730
06 1
6S
105
54E
74
3 06
54S
10
7 35
E
743
06 5
4S
107
36E
74
3 06
54S
10
7 36
E
772
06 1
6S
106
54E
74
3 1
Y
06 5
5S
107
36E
73
0 4
Y
06 1
6S
105
54E
74
3 06
54S
10
7 35
E
743
06 5
4S
107
36E
77
2 06
16S
10
6 54
E
743
2 Y
07
16S
11
2 54
E
7 07
13S
11
2 45
E
7 1
Y
07 1
7S
112
45E
7
3 Y
07
16S
11
2 43
E
3 07
13S
11
2 45
E
7 07
13S
11
2 46
E
7 1
Y
07 3
85
112
55E
5
1 Y
07
38,
$ 11
2 55
E
5 1
Y
07 3
8S
112
55E
5
1 Y
08
09S
11
3 44
E
13
1 Y
06
09S
11
3 44
E
13
1 Y
07
34S
10
9 34
E
13
6 Y
07
00S
11
0 25
E
10
0659
S
110
22E
3
06 5
8S
110
25E
1
070G
6 II
00
4E
06
595
110
22E
1
06 5
7S
110
25E
1
3 Y
06
58S
11
0 25
E
1 07
005
lI0
04
E
?
4 Y
06
598
110
22E
1
06 5
8S
110
25E
1
0700
S
llO
04
E
06 5
7S
110
25E
1
49 -6
9
71 -
89
51-6
5 71
-79
81-8
9 12
-38
52-5
3 p~
P~
3z-33
54-6
0 61
-65
61-70
12-3
8 52
-53
54-60
61
-65
6
1-7
0
19-3
8 52
-79
19
-38
61-6
5 7
2-7
9
80
14-7
0 14
-70
14-7
0 12
-50
12-5
0 17
-33
19-2
3 4
9-5
0
71
-89
76
51
-88
78-7
9, 8
1-8
9
71
-89
76
51
-88
71
-89
76
78
-79,
81-
89
Y
03 1
9N
ll6
36E
12
14
-38
03 1
9N
117
36E
12
50
03
20N
11
7 34
E
1 51
-65
? 1 [ t~

Tab
le 1
. (C
ontin
ued)
Sta
tion
S
pan
year
s T
ime
fram
e S
igm
flca
nce
Slo
pe
Sam
ple
size
S
ites
C
oher
ence
L
atit
ude
Lo
ng
itu
de
Ht
(m)
Du
rati
on
Tar
akan
25
14
-38
< ~
0005
~
031
292
1 Y
03
19N
11
6 36
E
12
14
-38
T
arak
an
16
50-6
5 <
0.0
005
0.12
1 14
9 2
Y
03 1
9N
117
36E
12
50
03
20N
11
7 34
E
1 5
1-6
5
Bal
ikpa
pan
76
13-8
8 <
~0
00
5
0.01
2 40
8 3
Y
01 1
7S
116
51E
3
13
-62
01
13S
11
6 13
E
3 6
7-6
9
O1
16S
11
65
4E
3
71
-88
B
ahk
pap
an
50
13-6
2 <
0.0
00
5
0.01
8 17
9 1
Y
01 1
7S
116
51E
3
13
-62
B
afik
papa
n 23
7
0-9
2
NS
-.
00
4
206
1 Y
01
16S
11
6 54
E
3 7
1-8
8
Po
nfi
anak
80
13
-92
<0
.00
05
-.
00
8
631
4 N
0
00
1S
1
09
20
E
3 13
-61
00
01
S
10
92
3E
3
71
-73
0
00
1S
1
09
20
E
3 74
0
00
1E
1
09
23
E
3 7
5-9
2
Po
nti
anak
26
13
-38
< 0
.000
5 0.
047
281
1 Y
00
01S
10
9 20
E
3 13
-61
Po
nfi
anak
22
7
1-9
2
< ~
00
5
~0
15
23
8 3
Y
00 0
IS
109
23E
3
71
-73
00
0IS
10
9 20
E
3 74
0
00
1E
1
09
23
E
3 7
5-9
2
Po
nti
anak
10
52
-61
< 0
.000
5 -
.087
11
0 1
Y
00 0
IS
109
20E
3
52
-61
P
aner
un
g
12
78
-89
<
~0
5
- .0
27
118
1 Y
02
15S
11
3 55
E
1 7
8-8
9
Ban
jarm
asin
38
5
2-9
2
< ~
00
05
-
.013
41
6 3
N
02 2
7S
114
45E
11
5
6-7
9
03
27
S
114
45E
20
8
0-9
2
03 2
7S
11
45
0E
12
7
5-8
9
Ban
jarm
asin
15
75
-89
< 0
.005
0.
017
318
3 Y
0
32
7S
11
450E
12
7
5-8
9
03
27
S
114
45E
20
8
0-9
2
03 2
7S
114
45E
11
7
3-7
9
Sam
ann
da
15
78
-92
<
0.0
005
-.1
06
13
3 1
Y
00
28
S
l17
00
E
10
78
-79
0
02
8S
lI
70
0E
5
81
-92
S
ulaw
esi
Map
ang
et
20
31
-50
<
0.0
005
0.07
9 11
5 1
Y
01 3
2N
124
55E
86
3
1-5
0
Uju
ng
Pan
dan
g
68
22
-89
N
S
0.00
1 45
3 3
? 05
08S
11
9 28
E
2 2
2-3
2
Uju
ng
Pan
dan
g
11
22
-32
<
0.0
005
0.09
6 12
5 1
Y
Uju
ng
Pan
dan
g
39
51
-89
<
0.0
00
5
-0.0
11
32
7 2
N
Uju
ng
Pan
dan
g
19
71
-89
<
0.0
005
~0
34
22
1 1
Y
Man
ado
58
12
-69
<0
.05
-.
00
27
41
2 4
N
Man
ado
22
12
-33
< 0
.025
0
01
3
245
1 Y
M
anad
o
17
53
-69
<
0.0
005
0.03
3 16
6 3
Y
05 0
4S
119
32E
14
2
2-3
2
04
04
S
119
33E
14
7
1-8
9
05 0
8S
119
28E
2
22
-32
05
04S
11
9 32
E
14
51
-56
0
40
4S
11
9 33
E
14
71
-89
0
40
4S
11
9 33
E
14
71
-89
01
32N
12
4 51
E
8 12
-33
01 3
0N
124
55E
86
53
01
30N
12
4 59
E
3 5
4-6
0
01 3
0N
124
356
3 6
1-6
9
01 3
0N
124
55E
86
53
01
32N
12
4 59
E
3 5
4-6
0
01 3
0N
124
59E
3
54
-60
01
30N
12
4 56
E
3 61
-69
['rJ
>
rn

Eas
t In
done
sia
Am
bon
Am
bon
Tua
l (K
a0
Den
Pas
ar (
Bal
i)
lr'~
~_
1"
1 ...
. ir
t ~
t:~
JL
.~q~
|l fd
~K
I, I
[D
dll
)
Bes
akih
(B
ali)
S
umba
wa
Bes
ar
Kai
man
a (I
rian
Jay
a)
Kup
ung
Kup
ung
Kup
ung
Dili
Jaka
rta,
hm
lted
dat
a
(oth
er s
tati
ons)
Cur
ung
Keb
ayor
an B
aru
Sja
h B
anda
r
Kuy
per
Kem
ayor
an
Cen
kara
ng
Hal
im
Jaka
rta
Pus
at
Tanj
ung Pr
iok
Jakart
a Pu
sat on
ly
39
27
15
36
to
to 16
19
12
76
26
18
13
Yrs
5 4 7 8 8 5 5 5 5
12-5
0 N
S
0.00
9 22
2 1
Y
03 4
2S
120
10E
4
12-5
0 12
-38
< 0
.000
5 0.
034
315
1 Y
03
42S
12
0 10
E
4 12
-50
76-9
0 N
S
0.02
15
6 1
Y
05 4
1S
132
46E
3
73-8
9 53
-88
< 0
.000
5 -.
02
34
0 3
N
08 4
5S
115
13E
1
56-6
0 08
4OS
113
13E
1
62
-66
08
45S
11
5 10
E
1 71
-88
~1
o
o
~T
O
~ 1
NC
~
O
AG
O
IIC
IA
~
~1
Q
O
74-8
9 N
S
0.00
3 15
9 1
Y
08 2
2S
115
28E
90
0 74
-89
71-8
9 0.
0005
0.
027
222
3 Y
08
26S
11
7 25
E
3 71
-74
08 1
2S
117
25E
3
75-7
9 08
26S
11
7 26
E
3 80
-89
77-8
8 N
S
0.02
5 11
0 2
Y
03 4
5S
133
10E
3
77-7
9 03
38S
13
3 43
E
3 80
-88
13-8
8 <
0.01
0.
0038
50
0 2
Y
10 1
0S
123
34E
45
13
-52
13-3
8 <
0.0
005
0.04
5 30
9 1
Y
10 1
0S
123
34E
45
13
-38
71-8
8 N
S
-0.0
00
2
174
1 Y
10
10S
12
34O
E
102
71-8
8 77
-89
NS
-
0.02
14
9 1
Y
08 3
4S
124
34E
4
Spa
n
64-6
8 54
-57
54-6
0
534-
60
63-7
0
85-8
9 85
-89
85-8
9
85-8
9
64-6
8 54
-57
54-5
7 5
3-6
0
63
-70
85
-89
St
Dv
0.69
9 0.
525
0.72
7
0.56
4 1.
948
0.51
9 0.
504
0.60
7
0.57
1
~59
2 0.
745
0.69
8 0.
675
0.61
3 0.
643
Mea
n
26.0
01
26.7
17
27.4
54
27.7
84
27.6
94
26.6
00
26.7
8
27.4
5
27.7
4
27.0
85
27.0
25
27.0
44
27.0
72
27.1
40
27.3
96
# O
bs
53
39
62
53
38
40
45
48
45
60
48
72
84
96
60
Sit
es
1 1 2 Y 1 1 1 1 1 1
Coh
eren
t
Y
Y
Y
Y
Y
Y
Y
Y
Y
Y
Y
Y
Y
Y
Y
Y
Lat
0615
S
0614
S
0638
S
0605
S
0602
S
0608
S
Lon
g
106
34E
10
6 41
E
107
41E
10
6 44
E
106
44E
10
6 51
E
Ht 3
26 8 2
Per
iod
64-6
8 54
-57
57,
54
-60
54
-60
53-5
6, 6
0 63
, 64,
66,
67,
69
,70
83, 8
6, 8
8, 8
9 83
, 86,
88,
0198
9
83, 8
6, 8
8,01
98
9 83
, 86,
88,
0198
9
7 g~
e~
O
[a. Z
O
I,o

1930 J R. E. HARGER
Table 2. Stations with continuous records obtained dunng Dutch admmlstraUon
Deg C Span Number Station Trend Significant 9 change/100 yr years Time frame Coherent9 sites involved
Medan + ve Yes 2 0 20 14-38 Yes 1 Padang + ve Yes 1 3 26 13-38 Yes 1 Jakarta Pusat + ve Yes 1.44 79 1866/1944 Yes 1 Bandung + ve Yes 2.0 27 12-38 Yes 1 Surabaya + ve Yes 1.4 20 19-38 Yes 1 Pasuruan + ve Yes 2 4 25 14-38 Yes 1 Djember + ve Yes 0.6 27 12-38 Yes 1 Karanganjar* + ve Yes 3.2 17 17-33 Yes 1-1933 Tarakan + ve Yes 3.1 25 14-38 Yes 1 Pontianak + ve Yes 4.7 26 13-38 Yes 1 Ujung Pandang + ve Yes 9 6 I 1 22-32 Yes 1 Manado + ve Yes 1.3 22 12-33 Yes 1 Ambon + ve Yes 3.4 27 12-38 Yes 1 Kupung + ve Yes 4.5 26 13-38 Yes 1
Total number of stations = 14. Average temperature change/100 yr = + 2.92°C.
Table 3. Stations (16) with records obtained during Dutch admlmstrataon and extended by the Republic of Indonesia
Deg. C Span Number Station Trend Significant change/100 yr years Time frame Coherent9 sites involved
Medan + ve Yes 1.0 76 14-89 Yes 5 Padang - ve Yes - 0.7 77 13-89 No 2 Jakarta Pusat + ve Yes 1.34 127 1866/1992 Yes 2 Bandung + ve Yes 0.7 59 12-70 Yes 5 Surabaya + ve Yes 1.4 72 19-90 Yes 2 Pasuruan + ve Yes 1.0 57 14-70 Yes 1 Djember + ve No 0.6 39 12-50 Yes 1 Semarang (all) + ve Yes 0.99 74 19-92 Yes 6 Tarakan + ve Yes 1.8 52 14-65 Yes 3 Balikpapan + ve Yes 1.2 76 13-88 Yes 3 Pontlanak - ve Yes - 0.8 80 13-92 No 4 Mapanget + ve Yes 7.9 20 31-50 Yes 1 Ujung Pandang + ve No 0.1 68 22-89 ? 3 Manado - ve Yes - 0.27 58 12-69 No 4 Ambon + ve No 0.9 39 12-50 Yes 1 Kupang + ve Yes 0.38 76 13-88 Yes 2
Overall estimated temperature change/100 yr = + 1.08°C. Est. temp change/100 yr, significant trends only = + 1.23°C.
Karang ja r in Java. The mean stat ion-wise unweighed tempera ture increase pro- ra ted to 100 yr was 2.92°C.
In g roup 2, the long- term set, when only s ta t ions exhibi t ing a significant t rend were considered 10 + ve, 3 - v e ) , the overall warming t rend was 1.23°C per 100 yr. The m ax i m um t ime-span in the group of 16 s ta t ions was 127 yr ( Jakar ta Pusat). The m e a n t ime-span was 66.12 yr. I t is wor th emphasiz ing tha t individual t empera ture pa t te rns ob ta ined from each s ta t ion have no t been weighted by ei ther the n u m b e r of observat ions involved nor by the n u m b e r of years spanned by the individual s ta t ion da ta sets. In spite of this it is somewhat surpris ing to note tha t the mean value of 1.23°C is very d o s e to the long- te rm rate for J aka r t a which is 1.34°C per 100 yr. W h e n all records are so considered regardless of whether their
indicated t rends are statistically significant or no t then the overall warming is set at 1.08°C per 100 yr.
D a t a from the s tat ions assembled into g roup 3 (modern, 1948-1992) is more varied and covers the widest geographic area. The set includes 16/33 where the recording site was apparent ly not shifted within the per iod examined. Fo r the g roup as a whole 18 s ta t ions exhibi t a significant posit ive t rend and 3 are significantly negative giving an overall warming rate of 1.64°C per 100 yr. If all s ta t ions are assessed with- out regard to whether or no t they exhibi ted significant t rends in themselves, the overall warming is set a t 1.35°C per 100 yr. F o u r s ta t ions were judged to ex- hibi t extreme values with changes exceeding 5.0°C per 100 yr. W h e n these are disregarded, the remain ing s tat ions with significant t rends warm at 1.35°C per
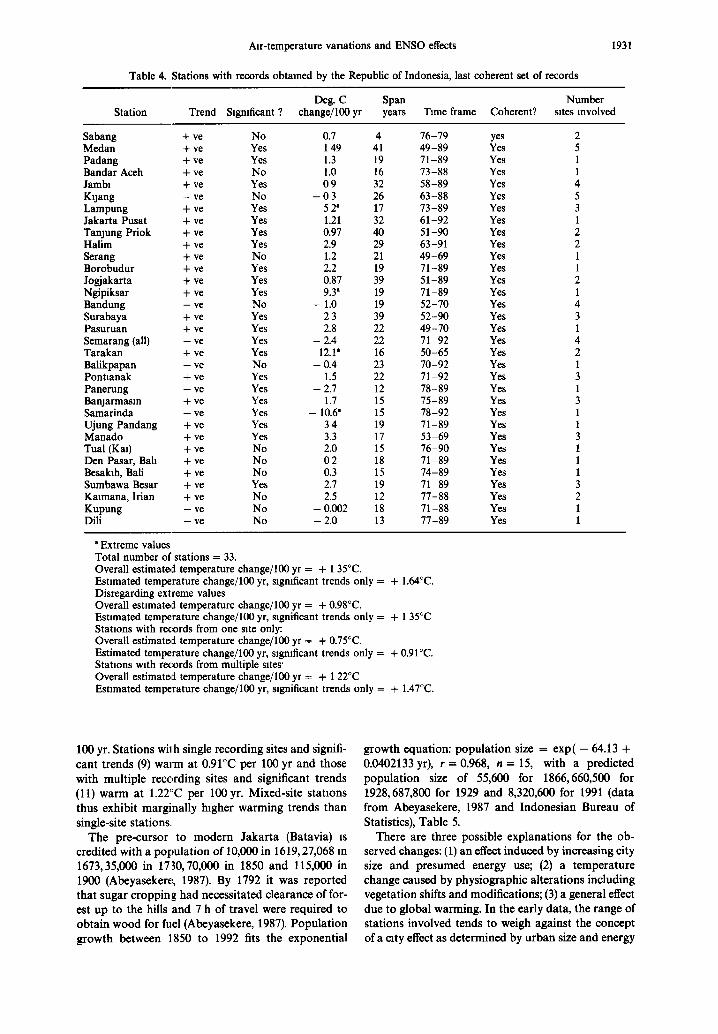
Air-temperature vanations and ENSO effects
Table 4. Stations with records obtmned by the Republic of Indonesia, last coherent set of records
1931
Deg. C Span Number Station Trend Slgmficant ? change/100 yr years Time frame Coherent? sites revolved
Sabang + ve No 0.7 4 76-79 yes 2 Medan + ve Yes 1 49 41 49-89 Yes 5 Padang + ve Yes 1.3 19 71-89 Yes 1 Bandar Aceh + ve No 1.0 16 73-88 Yes 1 Jamb1 + ve Yes 0 9 32 58-89 Yes 4 Kijang - ve No - 0 3 26 63-88 Yes 5 Lampung + ve Yes 5 2" 17 73-89 Yes 3 Jakarta Pusat + ve Yes 1.21 32 61-92 Yes 1 Tanjung Priok + ve Yes 0.97 40 51-90 Yes 2 Halim + ve Yes 2.9 29 63-91 Yes 2 Serang + ve No 1.2 21 49-69 Yes 1 Borobudur + ve Yes 2.2 19 71-89 Yes 1 Jogiakarta + ve Yes 0.87 39 51-89 Yes 2 Ngipiksar + ve Yes 9.3 a 19 71-89 Yes 1 Bandung - ve No - 1.0 19 52-70 Yes 4 Surabaya + ve Yes 2 3 39 52-90 Yes 3 Pasuruan + ve Yes 2.8 22 49-70 Yes 1 Semarang (all) - ve Yes - 2.4 22 71-92 Yes 4 Tarakan + ve Yes 12.1 a 16 50-65 Yes 2 Balikpapan - ve No - 0.4 23 70-92 Yes 1 Pontmnak + ve Yes 1.5 22 71-92 Yes 3 Panerung - ve Yes - 2.7 12 78-89 Yes 1 Banjannasm + ve Yes 1.7 15 75-89 Yes 3 Samarinda - ve Yes - 10.6 a 15 78-92 Yes 1 Ujung Pandang + ve Yes 3 4 19 71-89 Yes 1 Manado + ve Yes 3.3 17 53-69 Yes 3 Tual (Ka0 + ve No 2.0 15 76-90 Yes 1 Den Pasar, Bah + ve No 0 2 18 71-89 Yes 1 Besaklh, Bali + ve No 0.3 15 74-89 Yes 1 Sumbawa Besar + ve Yes 2.7 19 71-89 Yes 3 Kmmana, Irian + ve No 2.5 12 77-88 Yes 2 Kupung - ve No - 0.002 18 71-88 Yes 1 Dili - ve No - 2.0 13 77-89 Yes 1
"Extreme values Total number of stations = 33. Overall estimated temperature change/100 yr = + 1 35°C. Estimated temperature change/100 yr, significant trends only = + 1.64°C. Disregarding extreme values Overall estimated temperature change/100 yr = + 0.98°C. Estimated temperature change/100 yr, significant trends only = + 1 35°C Stations with records from one site only: Overall estimated temperature change/100 yr = + 0.75°C. Estimated temperature change/100 yr, slgmficant trends only = + 0.91°C. Stations with records from multiple sites' Overall estimated temperature change/100 yr = + 1 22°C Estimated temperature change/100 yr, s~gnificant trends only = + 1.47°C.
100 yr. Stations wi! h single recording sites and signifi-
cant trends (9) warm at 0.91°C per 100 yr and those with multiple recording sites and significant trends (11) warm at 1.22°C per 100 yr. Mixed-site stations thus exhibit marginally higher warming trends than
single-site stations. The pre-cursor to modern Jakarta (Batavia) is
credited with a populat ion of 10,000 in 1619, 27,068 in 1673,35,000 in 1730,70,000 in 1850 and 115,000 in 1900 (Abeyasekere, 1987). By 1792 it was reported that sugar cropping had necessitated clearance of for- est up to the hills and 7 h of travel were required to obtain wood for fuel (Abeyasekere, 1987). Popula t ion growth between 1850 to 1992 fits the exponential
growth equation: populat ion size = exp( - 64.13 + 0.0402133 yr), r = 0.968, n = 15, with a predicted populat ion size of 55,600 for 1866,660,500 for 1928, 687,800 for 1929 and 8,320,600 for 1991 (data from Abeyasekere, 1987 and Indonesian Bureau of
Statistics), Table 5. There are three possible explanations for the ob-
served changes: (1) an effect induced by increasing city size and presumed energy use; (2) a temperature change caused by physiographic alterations including vegetation shifts and modifications; (3) a general effect due to global warming. In the early data, the range of stations involved tends to weigh against the concept of a caty effect as determined by urban size and energy

1932 J.R.E. HARGER
Table 5. Current and previous number of inhabitants of major cities in Indonesia (sources Bureau of stausucs data 1961-1992; National Library data 1920, 1930)
Inhabitants
Town 1920 1930 1961 1971 1980 1990 1992
Sumatra Sabang Banda Aceh Medan Padang Jambi Bandar Lampung Java Jakarta Bandung Semarang Yogyakarta Surabaya Kalimantan Pontianak Banjarmasin Balikpapan Samarinda Sulawesi Ujung Pandang Bitung Manado Maluku Ambon Nusa Tenggara Denpasar Sumbawa Besar Kupang Dili
17,600 23,821 24,416 24,500 40,100 53,700 171,868 184 ,699 222,900
76,585 4 7 9 , 1 0 0 637 ,600 1,373,747 1,730,750 1,807,700 52~54 143,700 196 ,300 480 ,607 631 ,543 669,800 22~71 113,100 158 ,600 230 ,046 339 ,944 368,800
133,900 199 ,000 284 ,167 636 ,706 740,000
253,818 435,184 9~800 166,815
217,796 136,649 341,675
2,906,500 4,567,000 6,503,449 8,254,035 8,632,500 972,600 1,201,700 1,461,407 2,058,649 2,159,000 503,200 6 4 6 , 6 0 0 673 ,518 1,250,971 1,297,100 312,700 342 ,300 398 ,192 412 ,392 412,200
1,007,900 1,556,300 2,017,527 2,483,871 2,592,100
45,196 150,200 217 ,600 304 ,490 397 ,343 420,500 65,698 2 1 4 , 1 0 0 2 8 1 , 7 0 0 380 ,884 481 ,371 505,300 29,843 91,700 137,300 2 7 9 , 8 5 2 344 ,405 358,600 11,086 69,700 137,500 264 ,012 407 ,339 443,800
84,855 384,800 4 3 7 , 8 0 0 708 ,465 944 ,685 1,007,400 105,638
27,544 129,900 169 ,700 217 ,091 320 ,990 346,400
56,000 79,600 2 0 7 , 7 0 2 276 ,955 293,000
16,693 504,300 699,600 7171 304,134 387,300
403,110 554,700 67,039 138,200
Jakarta: 1619 10,000; 1673 27,068; 1730 35,000; 1850 70,000; 1900 115,000; 1930 435,000; 1948 823,000 1,050,000 a, 1952 1,782,000; 1966 3,600,000;, 1965 3,813,000;, 1976 5,700,000.
Surabaya: 1815 24,500, 1900 147,000. Source: Abeyasekere, Susan; "Jakarta, a history". Oxford University Press, Singapore, Oxford, NewYork, 1987 280 pp "The larger figure is an estimate, the smaller is the official census.
use. This does not preclude effects due to initial de- forestation or changing microclimate associated with physiographic alterations. Temperature shifts ob- served in the later data sets might well be associated with increasing city size yet the rates of change in the latter sets either do not differ from those in earlier years or are if anything, somewhat lower. Nor is direct forest clearance likely to provide the answer since the majority of sites are now associated with relatively stable vegetation patterns even if these now differ from the situation which may have prevailed had the locations in question not been subject to "human development". For Jakarta in particular, timber clear- ance was apparently widespread by 1792. All the mountain sites examined in Java likewise show warm- ing trends (Table 1).
The data from edge-stations around Jakarta do not wholly clarify this issue. The port, Tanjung Priok, adjacent to the Java Sea on the northern edge, tends to exhibit higher temperatures than Jakarta Pusat. Halim airport on the southern edge is slightly (0.67°C) but overall not significantly lower than the center (Jakarta Pnsat) but the new airport at Cengkareng,
40 km to the east of the city edge is 0.85°C lower than the city center data for some limited observations (Table 1). If the global trend is taken at approximately 0.5°C per 100 yr and 0.6°C is marked offthe currently considered data set as being due to microclimate shifts (including city effects) a difference of 2.1 - 1.1 = 1.0°C might be considered as unique to the region as a max- imum.
Population records were located for 23 of the cities and towns associated with the meteorological stations indicated in Table 4. Available information covered census records from 1961,1971,1980,1990 and 1992 and the data are shown in Table 5 for the cities of Saban~, Banda Aceh, Medan, Padang, Jambi, Bandar Lampung, Jakarta, Bandung~ Semarang, Yogyakarta, Surabaya, Pontianak, Banjarmasin, Balikpapan, Sa- marinda, Ujung Pandang, Bitung, Manado, Ambon, Denpasar, Sumbawa Besar, Kupang and Dili. Of the larger population centers, data were not available for Pasaruan, Tarakan, Tual, and Kaimana only. Other stations such as Kijang, Serang~ Borobudur, Ngipik- sar, Djember, Karanganjar, Panerung, Mapanget and Besakih (mountain site) were defined as too small to

/ur-temperature variations and ENSO effects 1933
qualify as population centers and can thus be re- garded as essentially undisturbed or "rural" in nature.
An attempt was made to determine systematic in- fluences arising from "city or geographical effects" on the expression of the temperature trends shown by the 23 stations indicated above. Comparisons were made between the arithmetic slope of the secular temper- ature trend and each of the following factors: city population size in 1L992; the exponential growth coef- ficient for a regression line fitted to the available data; the population doubling time on the basis of an ex- ponential growth curve (a variant of the proceeding factor); the yearly arithmetic population increase for the available data t straight-line fit); the height of the station above sea level; station latitude; station longi- tude. No significant association was detected for any of the listed comparisons.
The air temperature record from Manila and from Davao also both somewhat north of the equator in the Philippines show the same upward trend as for the Jakarta/Semarang set. In addition, the annual devi- ations from the overall secular trend are relatively strongly correlated among all three ( r>0 .4 , p ~< 0.0001) showing that at least southeast Asia tends to behave as a sympathetic unit as far as temperature increase is concerned. Major stations considered from southeast Asia are shown in Map 1.
The extent to w]aich the secular trend in temper- ature increase shown by these southeast Asian tropi- cal cities reflects a general climatic wanning trend rather than a secondary effect due primarily to the combined influences of urbanization may be open to question. That they form part of the influence promo- ting such a trend, summarized by Jones and Briffa (1992) as 0.5°C (over the last 140 yr) is clear. The extent to which these data reflect the overall trend as manifest in the global tropical belt is at question. Widespread regional warming for Indonesia over the past 80-120 yr or so, in excess of the global trend by around 0.5-I.0°C per 100 yr cannot be excluded. From around 1912-1938 a regular warming trend of around 2.9°C per 100 yr was experienced by the in- dicated stations in lowland Indonesia. The long-term warming (1866-1992) is somewhat lower at 1.23°C per 100 yr. The trend iw recent years (1949-1992) appears to be around 1.35-1.64°C per 100 yr. An overall aver- age estimate might be around 2.1°C for the last 100 yr. Map 2 indicates the relative temperature changes for major stations considered in southeast Asia.
EL SALVADOR
Wasser, personal communicauon (1992), also in- dicates temperature increases similar to those in southeast Asia are shown by small-town and isolated stations in western El Salvador (between 13 ° 52' to 14 ° 01' N). The station at Los Andes, 13 ° 51' N, 89 ° 38' W and approximately 1800 m above mean sea level, on top of the Santa Ana volcano, shows a mean
temperature increase of 3.0°C per 100yr for 1961-1990, from 16.1 to 16.97°C. Map 3 indicates the relative position of stations in El Salvador as opposed to those in southeast Asia. The combined station records of Santa Ana, El Palmar, 13 ° 59' N, 89 ° 39' E (10km from city population 208,000, altitude 750 m) plus Ahuachapan, 14 ° 02' N, 89 ° 50' west (14 km from town population 63,500, altitude around 600 m) show an annual increase in the mean temper- ature of 4.3°C per 100 yr for 1958-1990, from 22.4 to 23.74°C. The relative temperature changes exhibited by major stations considered in E1 Salvador as op- posed to southeast Asia are shown in Map 4.
The warmest month temperature deviates (all years) from the secular trend shown by the Los Andes record are positively correlated with those of the Jakarta record in the same form (r=0.345, n = 28, p = 0.07), with Baguio (r = 0.569, n = 28, p = 0.0015), with Manila (r = 0.606, n = 25, p=0.0013). For ENSO years only, with Jakarta(r = 0.629, n = 10, p - 0.051), with Davao, (r = 0.72, n = 10, p = 0.018), with Manila, (r = 0.612, n = 9, p = 0.079).
CITY EFFECTS
Air temperatures for Jakarta over the period 1866-1945 have been calculated on the basis of obser- vations made at two-hourly intervals and the monthly means used herein are thus based on 24 h records (Boerema, 1940). Subsequent measurements from 1947-1991 have been calculated on the basis of hourly readings over 24 h intervals. The recording site was a park in Menteng Prapatan (Jakarta) until 1980 and was thereafter shifted a short distance to the present location in front of the meteorological office, Badan Meterologi dan Geofisika, Jakarta, Indonesia (Winasso, personal communication).
The major industrial development in infrastructure for Jakarta has been significant only since 1980 or so and was not apparent before 1970 when the city had the aspect of an extended village with few large buildings (greater than 3-4 stories) and no extensive highways. Unlike the bulk of work which has been undertaken to examine heat-island effects outside the equatorial region (Karl et al., 1988; Wang et al., 1990), the analysis herein is concerned with a climate where no artificial heating is required and where moreover the wide-spread use of air conditioners did not come into effect much before the late 1960s and in most places not before the mid-1970s.
Sham Sani 1986, noted when comparing temper- atures between microchmates in shaded urban parks as opposed to those m the open city (no shade), that urban heat-island effects have been capable of raising temperatures "in excess of 2-3°C " in the case of Kuala Lumpur during day-light hours in November 1985. Temperature differences at night were much lower ranging from 0.1°C. The warming trend from

1934 J R E H A R G E R
125 • 13Q ! 135 • 14g
, i ~ J t
a Ua.O
g, i ° ~z p a n g - - '- i- . . . . . . -'~ . . . . . . . .
" I I
M a p 1. M a j o r s t a t ions cons idered in sou theas t Asia
M a p 2. Rela t ive t empera tu re changes for sou theas t As ian s tat ions.

Air-temperature variations and ENSO effects 1935
: Us i iza
' ~B.g.i£
I.+ + ~1 i ~c~ Dauao
t
,,-~,- J |a l i]~an- .... . . . . . . . . . . . . . . . . . . . . . .
I0 ~)'' ' " ! ,
, t l~J ng-ranaar
'~//xup..£ ~ \ :
L l a u E lhs~ i - , su i . j as i l2o ~o~,~, o : " : ,
15 N. , - - . . . . . . . . . . ' - - - !S 'an-T ,E
:L~rmae~ ~ l / ) ( Ahuac .bapan ~
! z ... )
) ) )
t ) )
i i i I
I tfeteorological stations considex, ed )
!
i ) i : ~ z
Map 3. Location of stations in southeast Asia as opposed to those in E1 Salvador.
c i r c l e s , increase
"~, J Relat ive aiz" temperatur~ chang~ , " pez, 400 9 e a x ~
~ t "\' ') for a l l s~a~ctons con~Ider-ed.
c i r e l e s , d e c r e a s e
Map 4. Relalzve temperature changes per 100 years for stations considered both in south cast Asia and E1 Salvador.

1936 J R E. HARGER
1866-1928 is slightly higher but similar to that from 1929-1991. There is no significant difference in the regression line slopes relating temperature to time for these two segments of the data set taken independent- ly meaning that the earlier and smaller (simpler) city warmed at the same rate as the later, larger and more complex city
Among those factors to be considered when look- ing at historical urban/rural temperature shifts in southeast Asia and in addition to the presumed posit- ive effects of mcreasing population and energy use densities on the promotion of secular temperature change within and adjacent to urban centers, there is also expected to be a shift m rural temperatures due to changing environmental factors. Thus, in undisturbed peat-forests in South Sumatra (Padang Island) the midday maximum surface temperature was measured by Brady (personal communication) as 34.5°C (dry) and 34.0°C (wet) with a nighttime minimum of 22.0°C (wet and dry) during 1989-1990. The average daily temperature fluctuated between 27.0 and 28.0°C with a 12.0°C maximum fluctuation. In forest gaps of greater than 250 m 2, the maximum daytime temper- ature was 42°C and the nighttime maximum was 22°C with a maximum daily range of 20.0°C. In adjacent cleared agricultural areas the same 60-day record showed a daily maximum of 42°C (dry) and 37°C (wet) with a range of 20.0°C and a mghttlme maximum of 22.0°C. Bouman and Drissen (1985) indicate that the surface temperature of exposed peat may reach as high as 70.0°C.
The early segments of the Jakarta and the Manila records, obtained when neither city was industrialized to any great extent, increase at a rate that is not statistically different from the most recent segments. Some support for the notion that urbanization in- fluences in western USSR, eastern China and eastern Australia are not significant temperature determi- nants is provided by Jones et al. (1990). Their study showed that comparisons between grid-derived inter- polated data reflecting on the one hand urban sta- tions, and on the other rural temperature measure- ments, showed no significant difference between the two. Earlier work (Jones et al., 1986) however, showed that similar comparisons between urban and rural stations from the contiguous United States revealed significant differences with urban values tending to be higher by 0.15°C over the period 1901-1984. This situation is taken as presumably reflecting "a typical" urban growth compared with many other parts of the world (Jones et al., 1990) and with the other less- industrialized regions of the world likely to be less affected. Some indication that this might indeed be the case is provided by the analysis of Chinese data by Wang et al. (1990) which shows rural and urban temperature differences converged between 1954 and 1966 and then diverged after 1966-1983 The period before 1966 is associated with the "great leap forward" and that after with the "cultural revolution". As late as 1982 shops and businesses were unheated during the
wmter m Beomg and m Qingdao this was also the case up to 1988.
GLOBAL TEMPERATURE RECORD
The general warming trend shown by the global temperature anomalies over the same period closely parallels the pattern shown by the Jakarta/Semarang data set. Figure 6 shows the course of global warming in relation to the ENSO-blocks for the period 1868-1990. ENSO-block symbols are the same as those used in Figs 3 and 4. The global temperature anomalies (Boden et al., 1992) are strongly correlated with the warmest month temperatures of the Jakarta/Semarang data set (r = 0.84, n = 121, p <0.00001), for the period of available data, 1958-1990 with Ahuachapan ( r=0.81 , n = 2 0 , - p < 0.0001) and with Los Andes (r = 0.73, n = 28, p < 0.0001). When the secular trends are removed the residual deviations shown by the Jakarta/Semarang warmest month data are correlated with the devi- ations shown by the annual global anomahes (r = 0.53, n = 121, p < 0.00001). This is of some in- terest since the Jakarta/Semarang warmest month indications are obtained usually by May or June (10/35 ENSO-years) or at least by October (31/35) of any one year. The Jakarta/Semarang warmest month temperatures are also closely related to the warmest month temperature deviations m say Manila, the Phi- lippines which develop by Aprd-May.
The cumulative ENSO-block temperature devi- ations around the secular trend indicated by the global temperature anomalies are shown in Fig. 7. Note the overall similarity of this diagram with that shown in Fig. 5 (Jakarta/Semarang). The temperature deviation of the warmest month in the Jakarta/Semarang data set can perhaps be used as a harbinger for estimating global warmth for the year as a whole This in turn may suggest that what hap- pens in the equatorial region of the western Pacific in terms of heat budd-up and ENSO activity slgmfi- cantly determines a global response. The admittedly restricted data set from E1 Salvador also suggests a wider equatorial association may exist. The devi- ations from the global temperature trend are corre- lated with the warmest month temperature deviates from the secular trend (all years) for the Manila record (r = 0.23, n = 80, p = 0.04), Baguio (r = 0.38, n = 63, p=0.002), Davao ( r=0.51, n = 4 4 , p=00005) , Los Andes (r = 0.57, n = 28, p = 0.001). In the case of ENSO years only: for Jakarta (r = 0.54, n = 40, p=0.003), Davao, ( r=0 .7 , n = 14, p=0.005), Baguio, (r = 0.83, n = 17, p < 0.0001), and for Los Andes, (r = 0.71, n = 10, p = 0.02).
Figure 8 illustrates the relationship between the temperature deviations shown by the warmest months in the Jakarta/Semarang record and the secular deviations exhibited in the record of global temperature anomalies for all years.

Air-temperature variations and ENSO effects 1937
0 . 5
d
~ 0 .3
, m
~ 0 .1
~ - 0 . 1
~ - 0 . 3
- 0 . 5
0.9
~ 0.6
I1
eL E
"~ 0 .0 o a
I o - 0 . 3
-0.6
£
~ - 0 . 9
Ilean annua I 9 loba I "l:emper.a'ku~-,., anomo 1 t e s ( r e l a t i v e 4:o 1958-1979 t e f e t e n c e )
I I f I
59mbo l - s e g s a r e EM$O-b locks
Y=-8.73+4.46X, n=124, r=8.78, p< .88881
18rio 1887 1914 1941 1968
Time (geal-s)
Fig 6. Mean annual global temperature anomalies (relative to 1950-1979 reference).
!
1998
j 1976
I
1991
Cumu la~ ire temperature deo ial io~ rtem secu la~ trend (de9 C)
I I I I I
1878
i,n 0"~
Sgmbo I se t :s a t e ENSO-b locks
- 1945 ~
1963
il 1926
1976
Global temperature 1911
1860 1887 1914 1941 1968
T imo ( w a r s )
Fig. 7. Cumulative temperature deviations from secular trend (°C).
I
m
i
1995

1938 J R E HARGER
6
¢ .o
=,
0 £ 0 ¢ f~
0
0 . 4 8
O .Z8
0 . 0 8
-0. lZ
-0.37.
dRpsi~ual deviqtion~.f~om.spcqlar tr~d ~ K ~ P ~ a W d P M e S I M o n z n ~ g l O O a l ~ O m O l l C S
i I i i
S y m b o l s f o r i n d i u i d u a l y e a r s a r e :
0 = nonEMSO, 1 = 1 s t ENS0 9ear, Z = Znd. Z 1878
1
0 1990 ' ~
0 1988 z 1987 1983 jrle? . . . . 019a a1896izi ff. "
- ( o o - u j 1"-"o
0 1984~1 ,, 0^ / 0 0 ,,,, Gl~60-'3;t';'~" n . , a?.l 01198Z
19Z0 ~ ~ ^ ~ 1 " 1 1 ~1~ 11B91
1 ~ 0 0 0 _ ~ ' - ~ ~ 1 1 1 , 0 ; 1 1 9 ~ 6 5 ^ ~ o . 0 F 1 9 1 8
157409041 ° 0 1 0 1 0 1956 0 1908
Y=.OOO?+l .569X, n=120 , r = 0 . 5 3 , p< .O0001 1917
I I i I I i t i L i i t I i i i I i i i I
- 0 . 8 - 0 . 4 0 0 . 4 0 .B 1 .Z Warmest month J a k a r t a , d e v i a t i o n s , d e y . C.
Fig 8. Residual deviations from secular trend Jakarta warmest month & global anomalies.
The relationship is positive (r = 0.53, n = 120, p < 0.00001). Since the Jakarta/Semarang data set represents a very limited area compared with the globe as a whole, this high association rather suggests that events on the equator play a significant role m determining a global response.
S I G N I F I C A N T E N S O E V E N T S
Kiladis and Diaz (1986), investigated some of the conditions relating the 1877-1878 ENSO event to that of 1982-1983. The analysis reported herein for the Jakarta and Semarang air-temperature data shows that in absolute terms the mean annual temper- atures of the four years concerned were 26.27, 26.66, 27.37 and 27.58°C making the former event cooler. Table 6 however, shows that the relatzve deviations of the maximum of the mean monthly temperatures of the four years from the overall secular trend was 0.86, 0.64, 0.33 and 0.41°C making the former event rela- tively more extreme than the latter. However, the difference m temperature between the warmest and coolest months for each of the years was 2.7, 1.8, 3.1 and 2.7 making the scope of the latter event somewhat more "sweeping". This in turn is a consequence of the secular increase which has taken place between the maximum and minimum temperatures m the interval between the two events. The ENSO years having the
warmest temperature devzations from the secular trend can be identified from Table 6. The warmest month temperature deviations from the secular for 1991 and 1993 (for the ENSO set 1991-1993) are 0.49 and 0.26°C with respectwe maximum temperatures of 29.1 and 28.9°C. The deviation of the warmest month temperature from the secular trend in the Jakarta air-temperature record may thus serve as a measure of the intensity of an E1 Nine event (Quinn et al., 1987), at least on the edge of the western Pacific.
No particular patterns of significance could be de- tected associated with ENSO cool event years (Kiladis and Dlaz, 1989; Brookfield and Allen, 1991), which are regarded here as a subset of non-ENSO years.
D I S C U S S I O N
The data show that a consistent structure underlies ENSO events for the last century and a quarter. However, as a process monitored by mean monthly air-temperature measurements at Jakarta-Semarang, the system is changing in character with time in asso- ciation with an overall atmospheric temperature in- crease in a way that involves increased intra-annual temperature fluctuations. In general ENSO years are associated with higher temperatures than non-ENSO years, with a significant negative correlation between

Tab
le 6
. In
ten
sity
of
EN
SO
eve
nts
as i
ndic
ated
by
the
dev
iati
on o
f th
e re
cord
ed m
ean
mo
nth
ly t
emp
erat
ure
fro
m t
he s
ecu
lar
tren
d m
the
Jak
arta
/Sem
aran
g d
ata
set
fro
m
1886
-199
3.
Res
idua
l de
viat
ion
fro
m s
ecul
ar t
rend
: m
on
thly
mea
n a
ir t
emp
erat
ure
s °C
Jak
arta
/Sem
aran
g
EN
SO
-yea
r A
ll ye
ars
EN
SO
-yea
r A
ll y
ears
w
arm
est
mo
nth
w
arm
est
mo
nth
0
= n
on
-EN
SO
w
arm
est
mo
nth
w
arm
est
mo
nth
0
= n
on
-EN
SO
R
ow
Y
ear
devi
atio
n de
viat
ion
1 =
EN
SO
R
ow
Y
ear
devi
atio
n d
evia
tio
n
1 =
EN
SO
1 18
66
--0
.16
16
40
0.
0799
06
1 56
19
21
--0
.26
27
56
0
2 18
67
0.26
4585
0
57
1922
--
0.4
78
07
8
0 3
1868
0.
4072
69
0.64
9264
1
58
1923
0.
2066
01
0 4
1869
0.
0339
43
0 59
19
24
0.09
1280
0
5 18
70
--0.
0813
78
0 60
19
25
--0
.17
88
20
0.
0759
59
1 6
1871
-
0.19
6699
0
61
1926
0.
0056
34
0.26
0638
1
7 18
72
0.08
7980
0
62
1927
--
0.15
4683
0
8 18
73
-0.0
27
34
2
0 63
19
28
--0
.27
00
04
0
9 18
74
-- 0
.242
663
0 64
19
29
-- 0
.085
326
0 10
18
75
0.14
2016
0
65
1930
--
0.25
6548
--
0.00
0647
1
11
1876
0.
0266
95
0 66
19
31
0.08
4032
0
12
1877
0.
8673
60
1.11
1370
1
67
1932
--
0.03
1228
9 0
13
1878
06
5181
5 0.
8960
53
1 68
19
33
-0.4
46
61
0
0 14
18
79
-0.3
19
26
8
0 69
19
34
-0.1
61
93
1
0 15
18
80
- 0.
5792
76
-~3
34
59
0
1 70
19
35
-0.2
77
25
2
0 16
18
81
0.10
5178
~
3500
89
1 71
19
36
0.00
7426
0
17
1882
-0
.36
52
32
0
72
1937
-0
.10
78
95
0
18
1883
-0
.18
05
53
0
73
1938
-0
.12
32
16
0
19
1884
-
0.44
1458
-
0.19
5874
1
74
1939
-0
.33
85
37
0
20
1885
0.
4888
05
0 75
19
40
0.28
7998
0.
5461
42
1 21
18
86
-0.1
26
51
6
0 76
19
41
0.07
2453
0.
3308
21
1 22
18
87
-0.6
41
83
8
0 77
19
42
0.11
5500
0
23
1888
00
9636
0 0.
3428
41
1 78
19
43
0 24
18
89
0.32
7520
0
79
1944
-
0.17
4184
0.
0848
57
1 25
18
90
-0.2
87
80
1
0 80
19
45
-0.4
89
72
9
-0.2
30
46
4
1 26
18
91
0.44
9724
~
6968
78
1 81
19
46
0 27
18
92
- ~
3184
43
0 82
19
47
0 28
18
93
- ~
5337
64
0 83
19
48
0.42
3573
0
29
1894
-
0.34
9086
0
84
1949
-
0.19
1748
0
30
1895
0.
1355
93
0 85
19
50
-0.5
07
07
0
0 31
18
96
0.17
1997
0.
4202
72
1 86
19
51
0.21
6998
0.
4776
09
1 32
18
97
0.30
4951
0
87
1952
-0
.03
77
12
0
33
1898
-0
.11
03
70
0
88
1953
0.
3859
08
0.64
6967
1
34
1899
-
0.47
4639
-
~22
5691
1
89
1954
-
0.16
8354
0
35
1900
-0
.19
01
85
~
0589
87
1 90
19
55
-0.1
83
67
5
-0.1
83
67
5
0 36
19
01
0.14
3666
0
91
1956
-
~59
8996
0
37
1902
-
0.02
1276
0.
2283
45
1 92
19
57
0.72
3726
0.
9856
82
1 38
19
03
- 0.
2868
76
0 93
19
58
(0.0
26 e
st~
1
39
1904
-
~95
2366
-
~70
2297
1
94
1959
0.
1550
40
0
? ta 2.
e~
r~
O
o m
tat
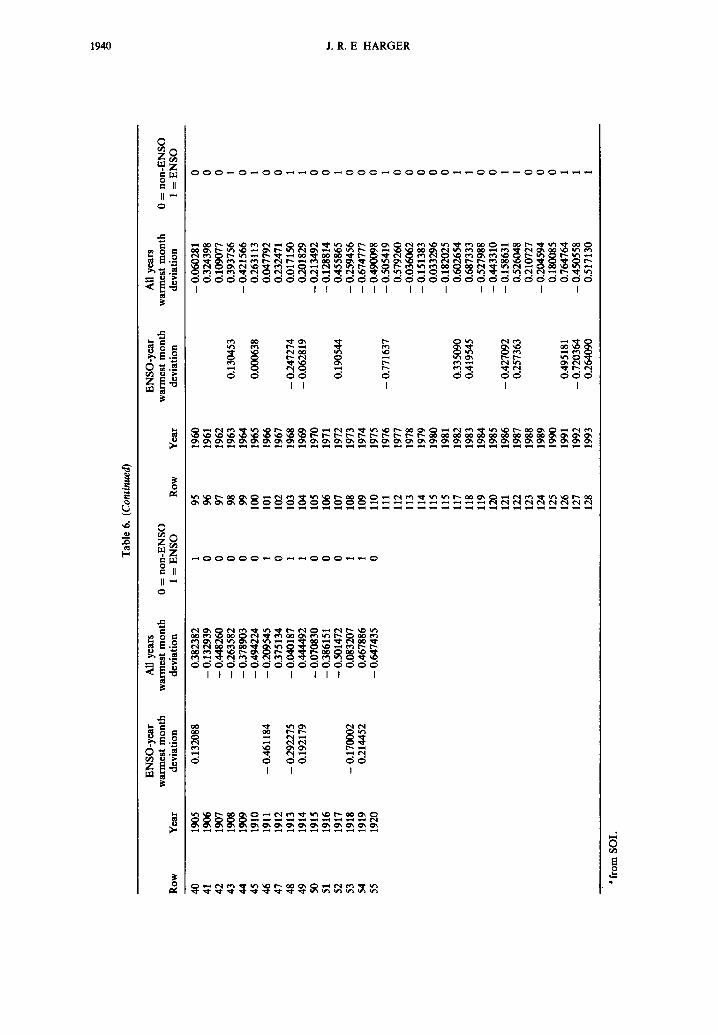
Tab
le 6
. (C
ontin
ued)
Ro
w
Yea
r
EN
SO
-yea
r w
arm
est
mo
nth
de
viat
ion
All
yea
rs
war
mes
t m
on
th
dev
iati
on
0
=
no
n-E
NS
O
1 =
EN
SO
R
ow
Y
ear
EN
SO
-yea
r w
arm
est
mo
nth
de
viat
ion
All
yea
rs
war
mes
t m
on
th
dev
iati
on
0
= n
on
-EN
SO
1
= E
NS
O
40
41
42
43
44
45
46
47
48
49
50
51
52
53
54
55
1905
0.
1320
88
0.38
2382
19
06
-0.1
32
93
9
1907
-
0.44
8260
19
08
- 0.
2635
82
1909
-
0.37
8903
19
10
--0
.49
42
24
1
91
1
-0.4
61
18
4
- 0.
2095
45
1912
0.
3751
34
1913
-0
.29
22
75
-0
.04
01
87
19
14
0.19
2179
0
.~9
2
1915
-0
.07
08
30
19
16
-0.3
86
15
1
1917
-0
.50
14
72
19
18
- 0.
1700
02
0.08
3207
19
19
0.21
4452
0.
4678
86
1920
-
0.64
7435
95
96
97
98
99
100
101
102
103
104
105
106
107
108
109
110
111
112
113
114
115
115
117
118
119
120
121
122
123
124
125
126
127
128
1960
19
61
1962
19
63
1964
19
65
1966
19
67
1968
19
69
1970
19
71
1972
19
73
1974
19
75
1976
19
77
1978
19
79
1980
19
81
1982
19
83
1984
19
85
1986
19
87
1988
19
89
1990
19
91
1992
19
93
0.13
0453
0.00
0638
-- 0.2
4727
4 -
- 0.
0628
19
0.19
0544
- 0.
7716
37
0,33
5090
0.
4195
45
- 0.
4270
92
0.25
7363
0.49
5181
-
0.72
0364
0.
2640
90
- 0.
0602
81
0.32
4398
0.
1090
77
0.39
3756
-
0.42
1566
0.
2631
13
0.04
7792
0.
2324
71
0.01
7150
0.
2018
29
- 0.
2134
92
- 0.
1288
14
0.45
5865
-
0.25
9456
-
0.67
4777
-
0.49
0098
-
0.50
5419
0.
5792
60
- 0.
0360
62
--
0.
1513
83
0.03
3296
-
0.18
2025
O
.602
654
0.68
7333
-
0.52
7988
-
0.44
3310
-
0.15
8631
0.
5260
48
0.21
0727
-
0.20
4594
0.
1800
85
0.76
4764
-
-
0.45
0558
0.
5171
30
m
>
"fro
m S
O1.

Air-temperature variations and ENSO effects 1941
subsequent years which are thereafter systematically cooler.
The warm month Jakarta/Semarang deviates them- selves may be direcdy related to the size and relative movement of the western Pacific warm pool, parti- cularly in the ENSO warm-event years. The most obvious time periods to seek temperature induced changes in biomass burning of southeast Asia would undoubtedly correspond with ENSO warm-event years and particularly those in which marked positive deviations from the overall secular trend are apparent. In recent years these are: 1991, 1987, 1983, 1982, 1972, 1963, 1958(?), 1957, 1953 and 1951 (Table 6). The heat build-up in southeast Asia and the western Pacific presumably commences before the Kelvin wave resur- gence from the western to the eastern Pacific which seems to have started in October to mid-December in recent years although in 1993 a Kelvin wave was also detected in August and then in late October (Kousky, 1993). The warmest month of the first ENSO year usually takes place in either September (3 times in the record), October (18) or November (4) and can also show up in May (7) and June (2) as well. In itself, a significant warm deviation above the secular trend in average monthly temperature for any of these months signals an upcoming warmer-than-average ENSO with a hit-ratio of 21:6.
CONCLUSION
Atmospheric temperature build-up possibly asso- ciated with the greenhouse effect may be coupled to an increasingly wider temperature swing in west and central Java associated with the warm pool influence but anchored by the ocean-sink. In southeast Asia, longer dry periods coupled with increased temper- atures may thus result from an ENSO-driven mecha- nism which may force increased equatorial aridity as global carbon dioxide concentrations increase result- ing in a change from "ever-wet" conditions. Forest fires have become a persistent problem in Kaliman- tan, Indonesia in the ENSO-associated droughts of recent years. The warm event years seem to provide the driving mechanism. The temperature record shown by the southeast Asian cities studied to data indicate a progressive annual warming for the region of around 0.013°C over the last century. This is almost an order of magnitude greater than the global mean cited above.
ENSO year warm events vary in their effects as estimated by devia(ion of warmest month mean air temperature from t~he secular trend exhibited by the Jakarta/Semarang data set and perhaps more widely throughout southeast Asia. The strength of this tem- perature deviation from the secular trend for ENSO year may provide a quantitative key to understanding the form of the teleconnections passed outwards from the region of southeast Asia and the associated "warm
pool" of surface sea water that accumulates against the western margin of the equatorial Pacific.
In general, ENSO years are associated with higher temperatures than non-ENSO years, with a signifi- cant negative correlation between subsequent years which are thereafter systematically cooler. This may be because the ENSO event acts as a heat-pump and actively mixes excess heat energy into the ocean-sink to an extent that is in direct proportion to the out- standing positive temperature deviation. A weak ENSO, preceded by a relatively modest temperature build-up in the lead-up non-ENSO years, then results in limited mixing which leads to a relatively warm subsequent year while a strong event leads to exten- sive mixing and so generally results in a following very much cooler year. The differentiation between non- ENSO/ENSO blocks showing trends of positive "heat-loading" indices as opposed to those showing decreasing trends suggests that heat build-up alone may not be the only critical variable but that perhaps two subcategories of ENSO initiating mechanisms may be involved. Those dominated by heat forcing, and those by water-mass forcing. Both however, generating heat re-distribution into the Pacific Ocean.
On the basis of the evidence assembled herein, the warming-pulse effect of the ENSO warm-events ob- served recently are probably not quantitatively differ- ent from the "great dry event" of 1877-1878 however, the overall global temperature is now around 0.5°C higher and perhaps as much as 1.5-2.0 ° in the region of the equator. The Jakarta air-temperature data, near the equator, show a clear change in amphtude and degree over the 127 yr record. It is of course relatively easy to dismiss these changes in a superficial way by attributing them to a "city effect". Similar changes overall throughout the Indonesian and Philippines archipelagos together with those from El Salvador are less easily dismissed. The fact is however, that ecologi- cal conditions and vegetation cover have probably also been changed markedly in the same interval making it difficult to ascribe such observed effects entirely to secular responses of a global nature. It is certain that if the instrumental record of the 1877-1878 ENSO event did not exist, the events ob- served in 1982-1983 and 1991-1992-1993 would ap- pear to be quite extra-ordinarily severe in relation to all activity from 1879 forward.
Acknowledgements Agencies and individuals contributing data:
Meteorological data for the Phihppines: Ada M. Jose, Chmf, Climatology Branch, Department of Soence and Technology, Philippine Atmospheric, Geophysical and As- tronomical Services Admimstration, Republic of the Phdip- pines.
Meteorological data from E1 Salvador. (m part) - Lopez Vega C. A. (no date) Balance hutrico superficial de la cuenca del Rio Pampe. Universidad Technologma Salvador, E1 Sal- vador, Centre America. Undated Document, UNESCO.
Meteorological data for Indonesia: courtesy Badan Me- teroiogi dan Geofisika, Jakarta, Indonesia and Indonesian Ministry of Agriculture.

1942 J R E HARGER
Oceanographic data from Indonesia: P30-LIPI, In- donesian Institute of Sciences Mr H. J. Wasser, Assocmte Expert in Hydrology, UNESCO/ROSTSEA assisted in gathenng and interpreting data from both Indonesia and El Salvador.
REFERENCES
Abeyasekere S. (1987) Jakarta, a H,story. Oxford University Press, Singapore, Oxford, New York
Boerema J. (1940) Royal magneucal and meteorological ob- servatory at Batavia, observations made at secondary stations in the Netherlands Indies. Chmatological tables, results of observations of air pressure, air temperature, relative humidity, rainfall and wind velocity. XIX A.
Boden T. A., Sepanskl R. J and Stoss F. W. (eds). (1992) Trends '91, A compen&am of data on global change, highlights. Carbon Dioxide Information Analysis Center. Oak Ridge National Laboratory, Oak Ridge, Tennessee 37831-6335, U.S.A. Publication # ORNL/CDIAC-49 ESD pubhcatlon # 3797
Bradey M. A. (1993) Personal communication Enwron- mental Superintendent. LASMO Oil Ltd, P.O. Box 3415/JKT, Jakarta, Indonesia.
Brookfield H. and Allen B. (1991) Environmental and human responses to chmatic variability m the west Pacific Mari- time Continent Region. In South Pacific Environments, Interactions wlth Weather and Chmate. University of Auckland, Auckland New Zealand 2-7 September 1991, Proc. ISSN-0114-590 Enwronmental Science Occasional Pubhcatlon, 6.
Bouman S. A. M. and Dnssen P. (1985) Physical properties of peat soils affecting rice-based cropping system. So,l Phys. Rice 71-83. IRRI, Los Banyos, Phlhppmes
Brown S. and Lugo A. E. (1982) The storage and producUon of orgamc matter in tropical forests and their role m the global carbon cycle. Biotroplca V 14, 161-187.
Central Bureau of Statistics (1989) Statistical Year Book Indonesia 1988. ROI Pubhcauon No. 03300 8913, Jakarta, Indonesm.
Central Bureau of Statistics (1991) Statlst,cal Year Book Indonesia 1990 ROI Pubhcatlon No. 03300.9113, Jakarta, Indonesm.
Enfield D B. (1988) E1 Nlno, Past and Present. Rev of Geophysics 27.
Jones P. D., Raper S. C. B., Bradley R. S., Dmz H. F., Kelly P. M and Wlgley T. M. (1986) Northern hemisphere surface temperature variaUons, 1851-1984. J Clim. Appl Met. 25, 2.
Jones P. D, Grolsman P. Y., Coughlan M., Plummer N., Wang W-C. and Karl T R. (1990) Assessment of urban- ~zation effects in time series of surface air temperature over land. Nature 347, 169-172.
Jones P. D. and Brlffa K R (1992) Global surface mr temperature variations during the twentieth century: Part 1, spatial, temporal and seasonal detmls. The Holo- cene 2, 165-179
Karl T R., Dlaz H. F. and Kulka G. (1988) UrbamzaUon. its detection and effect in the United States chmate record. J Chm 1, 1099-1123
Klladls G N and Dlaz H. F. (1986) An analysis of the 1877-78 ENSO episode and companson with 1982-83. Mon Wea. Rev. 114, 1035-1047.
Klladls, G N and Dlaz H. F. (1989) Global chmatlc anomalies associated with extremes in the southern oscil- lation J Chin 2, 1069-1090.
Kousky V. E. (ed) (1993) Clim. Dzag. Bull. U.S. Dept. of Commerce, NOAA, National Weather Service, National Meteorological Center, World Weather Building, 5200 Auth Rd., Washington D.C.
Mur&yarso D (1993) Policy options to reduce CO2 releases resulting from deforestatmn and blomass burmng in In- donesia. Chemosphere 27, 1109-1120.
Qulnn W H, Neal V T. and Antumz de Mayolo S. (1987) El Nlno occurrences over the past four and a half centu- ries. J. geophys. Res. 92, 14,449-14,461.
Republic of Indonesia (1989) 5th Five Year Development Plan 1989/1990-1993/1994 o f Central Java Province (Rencana Pembangunan Lima Tahun ke V Daerah 1989/1990-1993/1994 Proplnsl Tmgkat I Jawa Tengah).
RePPProT (Regional planning program for transmigration) (1990) A natzonal overview. Land Resources Development Center, Overseas Development Administration, Foreign and Commonwealth Office, London, England and Direc- torate Bina Program, Direktorat Jendral Penympan Pemuklman, Department Transmlgrasl, Jakarta, Republic of Indonesia.
Sam S (1986) Moderating urban temperatures through tree planting m the Kuala Lumpur--Petahng Jaya area, Malaysia. Tech report work. grp. urban ecosystems. Malaysian National MAB committee, (UNESCO) 135-152.
Wang W C., Zeng Z. and Karl T. R. (1990) Urban heat islands m China. Geophys Res. Lett. 17, 2377-2380.
Wang S. (1991) El Nlno events, 1470-1989. Unpublished presentation to the UNEP-Earth-watch Global Envir- onmental Monitoring System workshop on ENSO and Climate Change. Bangkok, Thailand.
Wasser H J. (1993) Personal commumcation. UNESCO, P.O. Box 873372, Panama 7, Repubhc of Panama and UNESCO Oficina Regional de Ciencia y Tecnologia para merlca Latlna y el Carlbe ORCYT Casflla 850, 11000 Montevideo, Uruguay.
Winasso P A. (1990) Personal communication. Badan Me- terologi dan Geofisika, Jakarta, Indonesia.
Wyrktl K. (1982) The southern oscillation, ocean-atmo- sphere Interaction and El Nino. Mar Tech Soc J. 6, 3-10.