air surveillance monitoring - lawrence livermore … · 2007-11-07 · lawrence livermore national...
TRANSCRIPT

5
LLNL Environmental Report for 1999 5-1
Air SurveillanceMonitoring
Paris E. AlthousePaula J. Tate
Introduction
Lawrence Livermore National Laboratory performs air surveillance monitoring toevaluate its compliance with local, state, and federal laws and regulations and to ensurethat human health and the environment are protected from hazardous and radioactiveair emissions. Federal environmental air quality laws and U.S. Department of Energy(DOE) regulations include Title 40 of the Code of Federal Regulations (CFR) Part 61; theNational Emissions Standards for Hazardous Air Pollutants (NESHAPs) section of theClean Air Act; DOE Order 5400.1, General Environmental Protection Program Chapter IV,paragraph 1.a. and paragraph 5; and DOE Order 5400.5, Radiation Protection of the Publicand the Environment, Change 2, Chapter II, Paragraph 1 (except 1.a.3.c. and 1.c), andChapter III. The Environmental Regulatory Guide for Radiological Effluent Monitoring andEnvironmental Surveillance (U.S. Department of Energy 1991) provides the guidance forimplementing DOE Orders 5400.1 and 5400.5. In general, the constituents for whichLLNL monitors are at levels far below the regulatory standards.
LLNL conducts surveillance monitoring of ambient air to determine if airborne radionu-clides or hazardous materials are being released by Laboratory operations, what theconcentrations are, and what the trends are in the LLNL environs. In the air monitoringprogram, LLNL collects particles on filters and chemically traps vapors on a collectionmedium. Concentrations of various airborne radionuclides (including particles andtritiated water vapor) and beryllium are measured at the Livermore site, Site 300, and atoff-site locations throughout the Livermore Valley and in the City of Tracy. In addition,some point sources and diffuse, or nonpoint sources, are monitored to fulfill NESHAPsrequirements (Gallegos et al. 2000).
Methods
Several monitoring networks were established for surveillance of air particulates andtritium in the environs of LLNL and Site 300, as well as in the surrounding LivermoreValley and in the City of Tracy. The sampling locations for each monitoring network arelisted in Table 5-1 and shown on Figures 5-1, 5-2, and 5-3. All monitoring networks use

5 Air Surveillance Monitoring
5-2 LLNL Environmental Report for 1999
continuously operating samplers. The radiological high-volume sampling networks useglass-fiber filters; the beryllium high-volume networks use cellulose filters; and the low-volume network uses Millipore AW-19 filters. The collection medium for tritium issilica gel.
Table 5-1. Air sampling locations listed by monitoring network.
High-volumeradiological
(glass fiber filters)
High-volumeberyllium
(cellulose filters)
Low-volume grossalpha and beta
(millipore filters)
Tritium(silica gel)
Livermore site sampling locations
B531(a) CAFE B292(a)
CAFE COW B331(a)
COW MESQ B514(a)
CRED(a) MET B624(a)
MESQ SALV CAFEMET VIS COWSALV MESQVIS MET
POOLSALVVIS
Livermore Valley sampling locations
AMON FCC AMONCHUR HOSP FIREFCC HOSPFIRE VETHOSP XRDSLWRP ZON7PATTTANKZON7
Site 300 sampling locations
801E 801EECP EOBSEOBS GOLFGOLFNPSWCPWOBS
Site 300 off-site sampling locations
PRIM TFIR PRIMTFIR
a These locations are in areas of diffuse sources and are monitored to fulfill NESHAPs requirements.
Air Surveillance Monitoring 5
LLNL Environmental Report for 1999 5-3
Patterson Pass Road
Gre
envi
lle R
oad
Vas
co R
oad
East Avenue
N
5000
Scale: Meters
LLNL perimeter
Sampling locations
Radiological particulate
Beryllium particulate
Tritium
MESQ
COW
VIS
SALV
CRED
B514B624
B331B531
B292
POOL
CAFE
MET
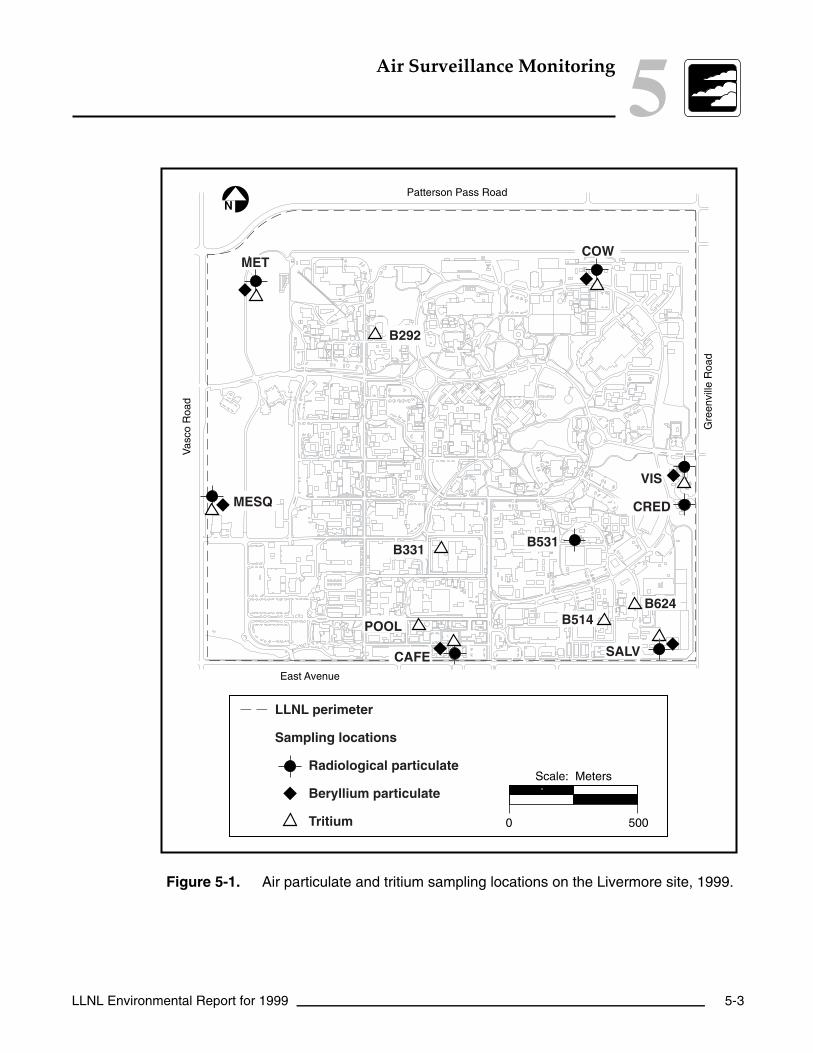
Figure 5-1. Air particulate and tritium sampling locations on the Livermore site, 1999.

5 Air Surveillance Monitoring
5-4 LLNL Environmental Report for 1999
daoRssaPtnomatl
A
Nor
thLi
verm
ore
Ave
nue
Livermore
PattersonPass Road
Lake Del Valle
Valle
citos
Roa
d
Stanley Boulevard
Vas
co R
oad
Tesla Road
Gre
envi
lle R
oad
Mines Road
East Avenue
Shadow Cliffs
Cross
Road
Arr
oyo
Roa
d
South Livermore
Avenue
HOSP
XRDS
FIRE
LWRP PATT
ZON7
FCC
VET TANK
580
84
580CHUR
2 4
Scale: Kilometers
0
LLNL perimeter
Sampling locations
Radiological particulate
Tritium
AMONN
Figure 5-2. Air particulate and tritium sampling locations in the Livermore Valley, 1999.

Air Surveillance Monitoring 5
LLNL Environmental Report for 1999 5-5
Livermore
N
Bunker 801
Bunker 851
Bunker 850
NPSEOBS
801E
ECP
TFIR(in City of Tracy)
GOLF
PRIM
WOBS
WCP
Corral Hollow Road
0 1600
Scale: Meters
800
Sampling locationsRadiological particulateBeryllium particulateTritium
Site 300 perimeter
Bunkers
Figure 5-3. Air particulate and tritium sampling locations at Site 300 and off site, 1999.
All air samplers are positioned to provide reasonable probability that, if there were anysignificant concentration of radioactive or beryllium effluents from LLNL operations, itwould be detected. The geographical details of the particulate sampling locations aredescribed in the Environmental Protection Department’s location database. Details foraccessing the database are available in the Locations Database SOP Supplement EMP-QA-DM, Sample and Data Management.
Particulate filters are changed each week at all locations, and tritium samples arechanged every two weeks. Duplicate quality control samplers are operated for twomonths each year in parallel with the permanent sampler at a given site, and thesesamples are analyzed to confirm results.

5 Air Surveillance Monitoring
5-6 LLNL Environmental Report for 1999
Air Particulate Sampling Locations
The Livermore site radiological air surveillance sampling network consists of sixsamplers at the perimeter; in addition, two areas of special interest (B531 and CREDshown in Figure 5-1) are monitored for plutonium only. These two locations in thesoutheast quadrant are areas of known plutonium contamination attributed to historicoperations, which included the operation of solar evaporators for plutonium-containingliquid waste.
The Livermore Valley network (Figure 5-2) consists of air particulate samplers located inall compass directions from the Livermore site. For the purposes of data analysis, foursamplers (FCC, FIRE, HOSP, and CHUR) located in the least prevalent wind directionsare considered to be upwind or representative of background locations, and foursamplers (PATT, ZON7, TANK, and AMON) located in the most prevalent downwinddirections are considered most likely to be affected by Laboratory operations. Anadditional sampler is located in another area of special interest, the Livermore WaterReclamation Plant (LWRP), because of a 1967 and earlier plutonium releases to thesanitary sewer system with subsequent soil contamination and potential resuspension(see Chapter 10, Results, for a discussion of this).
Livermore site beryllium monitoring continued in 1999 at the six perimeter locations.To satisfy beryllium reporting requirements and determine the effects of the Labor-atory’s beryllium operations, LLNL conducted a technical assessment of the berylliummonitoring locations at Site 300 in 1997. Although there is no requirement to samplefor beryllium at Site 300, as a best management practice, LLNL has decided to continueberyllium monitoring at three locations on site and at one location in the City of Tracy(TFIR).
Two sampling systems were added in July 1997 as part of the new low-volumeradiological air surveillance sampling network. The samplers are situated at the FCCand HOSP locations, sites that are generally upwind of the Livermore site. The resultsare used to establish background levels of gross alpha and beta activity for directcomparison to results from the air effluent samplers (see Chapter 4). The samplingsystems are very similar to the air-effluent samplers used in facilities, includingsampling system design, sampler operation, filter media, sample tracking, sampleanalysis, and processing of results.

Air Surveillance Monitoring 5
LLNL Environmental Report for 1999 5-7
Tritium Sampling Locations
LLNL also maintains 11 continuously operating, airborne tritium samplers on theLivermore site (Figure 5-1), six samplers in the Livermore Valley (Figure 5-2), andone sampler near Site 300 (Figure 5-3) to assess historical and current activities thatinfluence environmental impacts. Four of the Livermore site locations (B331, B292,B514, and B624) monitor diffuse tritium emissions.
Radiological Analysis
As outlined in Environmental Regulatory Guide for Radiological Effluent Monitoring andEnvironmental Surveillance (U.S. Department of Energy 1991), gross alpha and gross betaair filter results are used as trend indicators; specific radionuclide analysis is done forplutonium, uranium, and gamma emitters. Radiological analytical results are reportedas a measured concentration per volume of air, or as less than the minimum detectionconcentration (MDC) when no activity is detected. In all cases, the MDC is adequate fordemonstrating compliance with the pertinent regulatory requirements for radionuclidesthat may be or are present in the air sample and for evaluating LLNL-induced environ-mental impacts. Particle size distributions are not determined because the estimatedeffective dose equivalent to the maximally exposed individual is well below the0.01-mSv (1-mrem) allowable limit as discussed in the above-mentioned environmentalregulatory guide.
Gross alpha and gross beta activities are determined by gas-flow proportional counting,plutonium by alpha spectrometry, uranium by mass spectrometry, gamma emitters bygamma spectroscopy, and tritium by liquid scintillation. Further details of the surveil-lance monitoring methods are included in Chapter 5, Data Supplement.
Results
This section discusses the air monitoring results from all air surveillance locations atthe Livermore site, Site 300, and all off-site surveillance locations.
In April 1997, the radiological air particulate sampling filter media were changed fromcellulose to glass fiber; however, blank glass-fiber filters contain detectable amounts ofsome naturally occurring radiological isotopes (Althouse 1998) including uranium-235,uranium-238, potassium-40, radium-226, radium-228 and thorium-228. LLNL adjusts

5 Air Surveillance Monitoring
5-8 LLNL Environmental Report for 1999
the measured concentrations of these isotopes according to U.S. EnvironmentalProtection Agency (EPA) procedures (Eadie and Bernhardt 1976) and subtracts theappropriate blank filter content from the gross analytical result to obtain a corrected netresult.
Livermore Site
Airborne Radioactivity
Table 5-2 summarizes the monthly gross alpha and gross beta results for the LLNLperimeter, Livermore Valley, Site 300, and Site 300 off-site sampling locations. Detectionfrequencies, median concentrations, interquartile ranges (IQR), and maximum concen-tration values for each network are included. (See Data Supplement Tables 5-1, 5-2, and5-3 for detailed location results for all high-volume networks for gross alpha and grossbeta concentrations.)
Typical gross alpha activity (median value) for the LLNL perimeter is 4.5 × 10⁻⁵ Bq/m3
(1.2 × 10⁻¹⁵ Ci/m 3); for the upwind Livermore Valley stations, the value is
3.8 × 10⁻⁵ Bq/m3 (1.0 × 10⁻¹⁵ Ci/m 3); and for the downwind Livermore Valley stations,
the value is 5.0 × 10⁻⁵ Bq/m3 (1.3 × 10⁻¹⁵ Ci/m 3). Negative values occur when the
activity of the analytical background filters is higher than the activity on the filters beinganalyzed. Typical gross beta activity (median value) for the LLNL perimeter is3.2 × 10−4 Bq/m3 (8.7 × 10⁻¹⁵ Ci/m
3); for the upwind Livermore Valley stations, thevalue is 3.0 × 10⁻⁴ Bq/m3 (8.1 × 10⁻¹⁵ Ci/m
3); and for the downwind Livermore stations,the value is 3.4 × 10⁻⁴ Bq/m3 (9.1 × 10⁻¹⁵ Ci/m
3). The primary sources of the alpha andbeta activities are the naturally occurring radioisotopes of uranium and thorium, andany residual fallout from atmospheric weapons testing and the 1986 Chernobyl reactoraccident. The values are slightly higher than those obtained from previous monitoringdata during the past several years and are likely caused by a change in March in theanalytical laboratory used to perform the gross alpha and gross beta analysis. Data werealso elevated when the analytical laboratory was changed in 1993.
The monthly median gross alpha and gross beta concentrations are plotted inFigures 5-4 and 5-5, respectively. The gross beta results followed a pattern similar toprevious years’ data. The gradual increase in beta activity throughout the summer wasmost likely caused by an increase in resuspension of soils that occurs during the dryseason.

Air Surveillance Monitoring 5
LLNL Environmental Report for 1999 5-9
Table 5-2. Gross alpha and gross beta concentration in air particulate samples summarized bymonth, 1999.
Gross alpha (10–6 Bq/m3) Gross beta (10–6 Bq/m3)
Detection Detection
Month frequency(a)Median IQR(b) Maximum frequency Median IQR Maximum
LLNL perimeter locations
Jan 4/30 28.0 59.3 85.1 30/30 712 680 1460
Feb 1/24 9.78 21.8 68.0 20/24 203 100 478
Mar 21/24 45.9 20.9 72.9 24/24 230 72.8 327
Apr 22/29 50.3 49.3 98.8 29/29 269 148 844
May 7/24 18.6 18.1 74.4 24/24 315 90.1 394
Jun 11/23 27.3 37.0 130 23/23 185 116 525
Jul 22/30 43.1 39.9 125 30/30 245 108 659
Aug 13/24 35.1 64.6 96.9 24/24 331 357 696
Sep 23/23 71.4 36.4 120 23/23 648 179 932
Oct 28/30 228 168 385 30/30 1300 607 2660
Nov 20/24 115 77.2 214 24/24 882 276 1070
Dec 24/24 86.6 94.1 277 24/24 696 778 2530
Livermore Valley upwind locations
Jan 2/20 16.1 64.8 84.6 20/20 651 822 1460
Feb 1/16 8.0 42.7 64.1 16/16 196 100 443
Mar 10/16 44.8 32.4 76.2 16/16 235 38.9 310
Apr 12/20 37.1 35.7 106 20/20 258 83.9 666
May 6/16 16.3 20.4 61.8 16/16 275 84.6 442
Jun 4/15 21.0 11.9 54.4 15/15 203 109 444
Jul 13/20 38.5 38.5 104 20/20 247 84.4 736
Aug 11/16 35.1 34.5 98.8 16/16 325 379 655
Sep 16/16 70.1 18.2 98.8 16/16 670 198 892
Oct 19/20 252 179 414 20/20 1270 566 2350
Nov 13/16 115 116 212 16/16 812 283 1120
Dec 15/16 90.8 87.0 259 16/16 605 832 2500

5 Air Surveillance Monitoring
5-10 LLNL Environmental Report for 1999
Table 5-2. Gross alpha and gross beta concentration in air particulate samples summarized bymonth, 1999 (concluded).
Gross alpha (10–6 Bq/m3) Gross beta (10–6 Bq/m3)
Detection Detection
Month frequency(a)Median IQR(b) Maximum frequency Median IQR Maximum
Livermore Valley downwind locations
Jan 3/25 11.3 50.9 101 25/25 717 696 1480
Feb 1/20 14.4 33.5 64.0 20/20 198 129 376
Mar 17/20 53.7 32.4 85.5 20/20 248 47.2 349
Apr 20/25 51.4 45.5 128 25/25 302 84.4 725
May 7/20 15.7 28.7 102 20/20 268 52.1 472
Jun 12/20 30.2 26.9 62.5 20/20 201 80.4 403
Jul 12/25 24.7 48.6 104 25/25 253 75.9 740
Aug 18/20 48.1 35.0 102 20/20 375 447 673
Sep 20/20 70.7 38.9 120 20/20 710 130 903
Oct 22/25 231 180 492 25/25 1210 648 2680
Nov 19/20 119 89.7 182 20/20 821 353 1080
Dec 18/20 92.9 129 302 20/20 677 895 2450
Site 300(c) sampling locations
Jan 2/35 20.8 42.2 110 34/35 551 651 1320
Feb 3/28 7.70 36.5 79.5 26/28 189 122 497
Mar 21/28 49.4 44.0 89.9 28/28 247 80 367
Apr 29/35 50.3 32.6 134 35/35 344 133 803
May 18/28 33.3 25.4 70.7 28/28 376 109 466
Jun 20/28 35.3 31.4 86.2 28/28 320 161 488
Jul 27/35 63.3 50.7 143 35/35 301 155 873
Aug 20/22 49.4 50.9 128 22/22 463 426 818
Sep 28/28 96.8 41.1 142 28/28 984 257 1210
Oct 32/35 221 152 352 35/35 1200 509 2330
Nov 26/28 116 93.8 214 28/28 849 369 1240
Dec 28/28 91.6 110 302 28/28 644 833 2510
a Detection frequency is the number of samples with results above the detection limit divided by the number of samples.
b IQR = Interquartile range.
c Results for Site 300 off-site locations TFIR and PRIM are given in the Data Supplement Table 5-15.

Air Surveillance Monitoring 5
LLNL Environmental Report for 1999 5-11
Co
nce
ntr
atio
n (
10–6
Bq
/m3 )
Co
nce
ntr
atio
n (
10–1
6 C
i/m3 )
MonthJan Feb Mar Apr May Jun Jul Aug Sep Oct Nov DecDec
0
81
68
54
41
27
14
0
300
250
200
150
100
50
Jan
LLNL perimeterLivermore Valley, upwindLivermore Valley, downwindSite 300
Figure 5-4. Monthly median gross alpha concentrations in particulate air samplesfrom the LLNL perimeter, Livermore Valley, and Site 300 samplinglocations, 1999.
Gamma-emitting radionuclide concentrations in air that contribute to the activity in theLivermore site perimeter samples are summarized in Table 5-3. (See Data SupplementTable 5-4 for monthly gamma activity data.) Of the nuclides identified, all werenaturally occurring, with the exception of cesium-137. The primary source of cesium-137 is long-term global fallout and fallout resuspension.
By analyzing air samples for gamma-emitting radionuclides, LLNL verifies that there isno evidence of a release of the small inventories of mixed fission products and radio-chemical tracers used at LLNL and also obtains baseline data on global fallout. TheDerived Concentration Guides (DCGs) for these radionuclides are shown in Table 5-3.For air, DCGs specify the concentrations of radionuclides that could be inhaled continu-ously 365 days a year without exceeding the DOE primary radiation protection standardfor the public, which is 1 mSv/y (100 mrem/y) effective dose equivalent (DOEOrder 5400.5). (Chapter 13, Radiological Dose Assessment, provides an explanation of

5 Air Surveillance Monitoring
5-12 LLNL Environmental Report for 1999
Co
nce
ntr
atio
n (
10–6
Bq
/m3 )
Co
nce
ntr
atio
n (
10–1
6 C
i/m3 )
1400
1200
1000
800
600
400
200
0
LLNL perimeterLivermore Valley, upwindLivermore Valley, downwindSite 300
JanDec Feb Mar Apr May JunMonth
Jul Aug Sep Oct Nov Dec Jan0
54
110
380
320
270
220
160
Figure 5-5. Monthly median gross beta concentrations in particulate air samplesfrom the LLNL perimeter, Livermore Valley, and Site 300 samplinglocations, 1999.
this and other units of dose.) Table 5-3 also presents the percent of the DCGs, whichdemonstrates that the level of gamma activity present in air at the Livermore siteperimeter was far below the DCGs.
Table 5-4 shows the concentrations of airborne plutonium-239+240 on air filters fromthe LLNL perimeter locations. (See Data Supplement Table 5-5 for the monthly databy location.) The highest concentration was registered at location VIS in May 1999; theconcentration value is reported as 3.9 × 10⁻⁸ Bq/m3 (1.1 × 10⁻¹⁸ Ci/m3), which repre-sents 0.005% of the DCG. The median concentration at location VIS is 1.3 × 10⁻⁸ Bq/m3
(3.5 × 10⁻¹⁹ Ci/m3), which is slightly lower than that for the previous year.
Table 5-4 also shows the detection frequency, median concentration, IQR, maximumconcentration, and percent of DCG for the concentration of plutonium on air filtersamples collected in the Livermore Valley. (See Data Supplement Table 5-6 for monthlydata.) The highest off-site concentration of plutonium-239+240 occurred at PATT duringOctober, which had a median observed value of 0.0004% of the DCG.

Air Surveillance Monitoring 5
LLNL Environmental Report for 1999 5-13
Table 5-3. Gamma activity in air particulate samples, Livermore site perimeter and Site 300, 1999.
7Be 40K 137Cs 22Na 226Ra 228Ra 228Th
(10–3 Bq/m3) (10–6 Bq/m3)
Livermore perimeter locations
Median 3.4 12 0.21 0.24 –0.011 0.33 0.29
Interquartile range 0.85 20 —(a) —(a) 0.95 0.98 0.72
Maximum 7.8 40 0.57 0.57 0.96 3.7 1.8
Percent of DCG(b) 2.3 × 10⁻⁴ 3.7 × 10⁻⁵ 1.4 × 10⁻⁶ 6.4 × 10⁻⁷ 2.6 × 10⁻³(c) 3.0 × 10⁻⁴ 0.019
Site 300 locations
Median 3.8 13 0.20 0.43 0.17 0.36 –0.31
Interquartile range 2.3 41 —(a) —(a) 2.0 1.5 1.2
Maximum 7.2 61 0.62 0.71 1.8 5.4 3.3
Percent of DCG 2.5 × 10⁻⁴ 3.8 × 10⁻⁵ 1.3 × 10⁻⁶ 1.1 × 10⁻⁶ 4.6 × 10⁻⁴ 3.2 × 10⁻⁴ 0.22(c)
DCG (Bq/m3) 1.5 × 10³ 33 15 37 0.037 0.11 1.5 × 10⁻³
a No measure of dispersion calculated; see Chapter 14, Quality Assurance.
b Derived Concentration Guide. Percent calculated from the median concentration.
c Percent of DCG calculated with maximum value because the median is negative.
Table 5-4 shows the median concentrations of airborne plutonium-239+240 at the twodiffuse source locations (B531 and CRED). (See Data Supplement Table 5-7 for monthlydata.) The median concentration of 2.7 × 10⁻⁸ Bq/m3 (7.3 × 10⁻¹⁹ Ci/m3) at locationB531 is higher than the median concentration for any of the other air particulatesampling locations, but it is still only 0.004% of the DCG. The higher concentrations areattributed to historic waste management operations, which included the operation ofsolar evaporators for plutonium-containing liquid waste (Silver et al. 1974).
In October, the plutonium concentrations reported were above the minimum detectiblelevel for all locations. While this is unusual, none of these values exceeded the actionlevels identified in the Environmental Monitoring Plan (Tate et al. 1999). However,because the concentrations were unusual, they were investigated at the analyticallaboratory. The analytical laboratory found no source of error or contamination. Asimilar increase was detected in nearly all other particulate surveillance data (includinglow-volume data) in October. This increase is likely the result of increased particulateresuspension and subsequent filter loading that occurs during dry months. Thisanomaly did not occur in any other months in 1999.

5 Air Surveillance Monitoring
5-14 LLNL Environmental Report for 1999
Table 5-4. Plutonium-239+240 activity in air particulate samples (10–9 Bq/m3), 1999.
Sampling Detection Interquartile Percent
location(a) frequency(b) Median range Maximum of DCG(c)
Livermore Valley downwind locations
AMON 4/12 3.58 4.16 16.1 4.84 × 10⁻⁴
PATT 4/12 2.68 4.57 25.2 3.62 × 10⁻⁴
TANK 2/12 2.01 1.99 8.66 2.71 × 10⁻⁴
ZON7 2/12 1.87 2.65 23.1 2.52 × 10⁻⁴
Livermore Valley upwind locations
CHUR 3/12 1.37 5.78 23.8 1.84 × 10⁻⁴
FCC 1/12 0.103 2.85 11.1 1.39 × 10⁻⁵
FIRE 2/12 2.10 3.12 11.1 2.84 × 10⁻⁴
HOSP 1/12 0.264 1.52 6.40 3.56 × 10⁻⁵
LLNL perimeter locations
CAFE 8/12 5.51 7.01 25.1 7.45 × 10⁻⁴
COW 3/12 4.64 2.22 28.7 6.28 × 10⁻⁴
MESQ 1/12 3.85 3.19 22.0 5.21 × 10⁻⁴
MET 2/12 2.52 2.83 7.99 3.41 × 10⁻⁴
SALV 3/12 3.88 2.43 18.0 5.25 × 10⁻⁴
VIS 7/12 13.0 20.1 38.9 1.76 × 10⁻³
Diffuse on-site sources locations
B531 12/12 26.9 50.2 94.0 3.64 × 10⁻³
CRED 7/12 6.05 4.29 33.5 8.18 × 10⁻⁴
Special interest location
LWRP 5/12 5.06 3.24 21.1 6.83 × 10⁻⁴
Site 300 on-site locations
S300composite
4/12 1.79 2.52 8.7 2.41 × 10⁻⁴
Site 300 off-site locations
PRIM 2/12 1.91 3.78 11.3 2.58 × 10⁻⁴
TFIR 3/11 2.43 5.67 12.6 3.29 × 10⁻⁴
a See Figures 5-1, 5-2, and 5-3 for sampling locations.
b Detection frequency is the number of samples with results above the detection limit divided by the number of samples.
c DCG = Derived Concentration Guide of 7.4 × 10⁻⁴ Bq/m3 (2 × 10⁻⁸ µCi/m3) for 239Pu activity in air. Percentcalculated from the median concentration.

Air Surveillance Monitoring 5
LLNL Environmental Report for 1999 5-15
Figure 5-6 shows the annual median concentrations of plutonium-239+240 for locationsSALV (on site) and FCC (off site) from 1982 to 1999. Location FCC represents a typicalupwind background location, and SALV represents a typical perimeter location. Theannual median concentration for FCC was 1.0 × 10⁻¹⁰ Bq/m3 (2.7 × 10⁻²¹ Ci/m3).
Figure 5-6 uses a log scale and, for the years in which a negative median concentrationwas calculated, the positive value closest to the median was plotted. The higher values inthe past at SALV may be attributed to historical activities at LLNL. In 1993, clean top soilwas laid over much of the area, reducing the potential for increased levels from soil resus-pension. The sampler at SALV was moved to a nearby grassy knoll, possibly resulting ina decrease in the plutonium median for 1999. The downward trend at location FCC is theresult of decreasing residual global fallout.
10–11
10–10
10–9
10–8
10–7
10–6
10–5
10–4
10–3
10–2
1980 1982 1984 1986 1988Year
Co
nce
ntr
atio
n (
Bq
/m3 )
Co
nce
ntr
atio
n (
Ci/m
3 )
1990 1992 1994 1996 1998 2000
10–21
10–20
10–19
10–18
10–17
10–16
10–15
10–14
10–13
2.7×10⁻²²
SALVFCC
DCG = 7.4 × 10⁻⁴ Bq/m3
2.7×10⁻¹³
Figure 5-6. Annual median plutonium concentrations in air particulate samples at twolocations, SALV and FCC, 1982–1999.

5 Air Surveillance Monitoring
5-16 LLNL Environmental Report for 1999
The ratio of uranium-235 to uranium-238 can be used to identify the source of theuranium. Both uranium-235 and uranium-238 occur naturally in the area, but only 0.7%of the naturally occurring uranium is uranium-235, and the remainder is almost entirelyuranium-238. The median uranium-235 and uranium-238 mass concentrations in airsamples from the Livermore site perimeter are shown in Table 5-5. (See Data Supple-ment Table 5-8 for monthly data.) The maximum measured concentration of uranium-238 (at location SALV during October) is less than 0.2% of the DCG. All uranium-235/uranium-238 median ratios are generally as expected for naturally occurring uranium;however, September monthly data in the Data Supplement show some unexpecteduranium-235/uranium-238 ratios. The cause for these anomalous data is unknown;however, these ratios may be the result of increased variability in measured concen-trations near the detection limit. No significant environmental impact stems from theobserved ratios.
The low-volume radiological air sampling locations HOSP and FCC have typicalgross alpha and gross beta activity of 4.7 × 10⁻⁵ Bq/m3 (1.3 × 10⁻¹⁵ Ci/m3) and4.8 × 10−4 Bq/m3 (1.3 × 10⁻¹⁴ Ci/m3), respectively. (See Data Supplement Tables 5-9 and5-10 for monthly median data.) These gross alpha values are slightly higher than thosereported from the high-volume sampling systems at the same locations. The differenceis probably caused by differences in the filter type. LLNL is conducting a study todetermine the cause of the differences.
Table 5-6 shows the median concentrations of tritiated water vapor for the LivermoreValley sampling locations. (See Data Supplement Table 5-11 for biweekly data foreach location.) The highest annual median concentration was observed at locationZON7. At approximately 3.9 × 10⁻² Bq/m3 (1.1 × 10⁻¹² Ci/m3), this concentrationrepresents 0.001% of the DCG. The highest biweekly concentration was observedin February at ZON7. If it were a yearly average, this concentration, 0.27 Bq/m3
(7.3 × 10⁻¹² Ci/m3), would be 0.007% of the DCG. The 1999 tritium values were slightlyhigher than those reported last year because of slightly elevated emissions from theTritium Facility (Building 331) during January, February, and March.
Table 5-6 also shows the median concentrations of tritiated water vapor that wereobserved at the Livermore site perimeter sampling locations. (See Data SupplementTable 5-12 for biweekly data.) The highest annual median concentration was observedat location POOL, which was 0.14 Bq/m3 (3.8 × 10⁻¹² Ci/m3), or 0.004% of the DCG.

Air Surveillance Monitoring 5
LLNL Environmental Report for 1999 5-17
Table 5-5. Uranium mass concentration in air particulate samples, 1999.
Samplinglocation(a)
235U(b)
(10–7 µg/m3)
238U(c)
(10–5 µg/m3)
235U/238U (d)
(10–3)
LLNL perimeter locations
CAFE
Median 4.29 6.57 6.70
Interquartile range 2.54 5.32 0.335
Maximum 11.3 17.9 NA(e)
Percent of DCG(f) 9.13 × 10⁻⁴ 2.19 × 10⁻² NA
COW
Median 4.96 7.13 6.88
Interquartile range 3.74 5.96 0.363
Maximum 10.9 15.7 NA
Percent of DCG 1.05 × 10⁻³ 2.38 × 10⁻² NA
MESQ
Median 3.90 6.43 6.97
Interquartile range 3.07 4.41 0.549
Maximum 8.88 12.4 NA
Percent of DCG 8.30 × 10⁻⁴ 2.14 × 10⁻² NA
MET
Median 2.66 3.80 6.85
Interquartile range 1.26 2.09 0.419
Maximum 9.32 13.5 NA
Percent of DCG 5.67 × 10⁻⁴ 1.27 × 10⁻² NA
SALV
Median 2.34 3.77 6.88
Interquartile range 1.62 2.39 0.931
Maximum 10.3 14.8 NA
Percent of DCG 4.97 × 10⁻⁴ 1.26 × 10⁻² NA
VIS
Median 3.25 4.76 6.85
Interquartile range 2.72 5.3 0.410
Maximum 11.4 17.1 NA
Percent of DCG 6.92 × 10⁻⁴ 1.59 × 10⁻² NA

5 Air Surveillance Monitoring
5-18 LLNL Environmental Report for 1999
Table 5-5. Uranium mass concentration in air particulate samples, 1999 (concluded).
Samplinglocation(a)
235U(b)
(10–7 µg/m3)
238U(c)
(10–5 µg/m3)
235U/238U (d)
(10–3)
Site 300 on-site locations
Site 300 composite
Median 2.91 4.55 6.29
Interquartile range 3.73 6.16 0.919
Maximum 9.06 18.6 NA
Percent of DCG 6.20 1.52 NA
Site 300 off-site location
PRIM
Median 4.01 5.70 6.98
Interquartile range 4.01 5.56 0.604
Maximum 14.7 18.2 NA
Percent of DCG 8.53 1.90 NA
a See Figures 5-1 and 5-3 for sampling locations.
b Derived Concentration Guide = 0.047 µg/m3 for uranium-235 activity in air. Uranium-235 activities in Bq/m3 can bedetermined by dividing the weight in µg/m3 by 12.5, and pCi m3 can be determined by dividing by 0.463.
c Derived Concentration Guide = 0.3 µg/m3 for uranium-238 activity in air. Uranium-238 activities in Bq/m3 can bedetermined by dividing the weight in µg/m3 by 80.3, and pCi m3 can be determined by dividing by 2.97.
d Naturally occurring uranium has a uranium-235/uranium-238 ratio of 7.1 × 10⁻³.
e NA = Not applicable.
f DCG = Derived Concentration Guide. Percent calculated from the median concentration.
Diffuse sources of tritium on the Livermore site are monitored at air tritium samplinglocations B292, B331, B514, and B624. Table 5-6 shows the median concentrationsof tritiated water vapor for these sampling locations. (See Data Supplement Table 5-13for biweekly data.) The highest median concentration was observed at location B624.This concentration was 4.5 Bq/m3 (1.2 × 10⁻¹⁰ Ci/m3) and represents 0.1% of the DCG.The highest biweekly tritium concentration, 13.8 Bq/m3 (3.7 × 10⁻¹⁰ Ci/m3), wasobserved in April at location B331. If it were a yearly average, this concentration wouldrepresent 0.4% of the DCG.
The B331 location is near the Tritium Facility (Building 331), where LLNL personnelhave reduced operations in recent years and performed significant inventory reductionand cleanup activities. During this process, tritium-contaminated equipment slated fordisposal is stored in an area outside B331 before being sent to Hazardous WasteManagement facilities. During 1999, outgassing from such waste processing released anestimated 2.7 × 10¹¹ Bq (7.3 Ci) of tritium to the atmosphere outside Building 331.

Air Surveillance Monitoring 5
LLNL Environmental Report for 1999 5-19
Table 5-6. Tritium in air samples (10–3 Bq/m3), 1999.
Samplinglocation(a)
Detectionfrequency(b) Median IQR(c) Maximum
Percent ofDCG(d)
Mediandose
(mSv)(e)
Livermore Valley locations
AMON 13/25 20.0 25.6 175 5.4 × 10⁻⁴ 4.2 × 10⁻⁶
FIRE 10/24 13.7 24.2 147 3.7 × 10⁻⁴ 2.8 × 10⁻⁶
HOSP 5/23 3.27 10.7 87.0 8.8 × 10⁻⁵ 6.8 × 10⁻⁷
VET 10/24 15.3 34.2 242 4.1 × 10⁻⁴ 3.2 × 10⁻⁶
XRDS 9/25 10.2 24.9 93.2 2.8 × 10⁻⁴ 2.1 × 10⁻⁶
ZON7 19/25 39.2 44.4 268 1.1 × 10⁻³ 8.1 × 10⁻⁶
Livermore perimeter locations
CAFE 23/26 65.0 85.5 1,890 1.8 × 10⁻³ 1.3 × 10⁻⁵
COW 25/25 52.5 95.8 688 1.4 × 10⁻³ 1.1 × 10⁻⁵
MESQ 16/25 45.9 68.1 357 1.2 × 10⁻³ 9.5 × 10⁻⁶
MET 19/26 35.8 48.6 236 9.7 × 10⁻⁴ 7.4 × 10⁻⁶
POOL 25/26 139 269 1,400 3.8 × 10⁻³ 2.9 × 10⁻⁵
SALV 20/25 50.7 71.3 485 1.4 × 10⁻³ 1.1 × 10⁻⁵
VIS 25/25 89.9 84.3 622 2.4 × 10⁻³ 1.9 × 10⁻⁵
Diffuse on-site sources locations
B292 26/26 182 228 540 4.9 × 10⁻³ 3.8 × 10⁻⁵
B331 22/22 2,530 7,930 13,800 6.8 × 10⁻² 5.2 × 10⁻⁴
B514 26/26 1,650 1,230 2,950 4.5 × 10⁻² 3.4 × 10⁻⁴
B624 26/26 4,520 2,410 9,180 1.2 × 10⁻¹ 9.4 × 10⁻⁴
Site 300 off site location
PRIM 2/25 4.11 15.0 27.4 1.1 × 10⁻⁴ 8.5 × 10⁻⁷
a See Figures 5-1, 5-2, and 5-3 for sample locations.
b Detection frequency is the number of samples with results above the detection limit divided by the number ofsamples.
c IQR = Interquartile range.
d DCG = Derived Concentration Guide of 3.7 × 10³ Bq/m3. Percent calculated from the median concentration.
e 1 mSv = 100 mrem.
The B624 location is situated in the Building 612 yard, which is dedicated to hazardouswaste, radioactive waste, and mixed-waste management activities. The yard has severalareas where waste containers that are outgassing tritium are stored outdoors.

5 Air Surveillance Monitoring
5-20 LLNL Environmental Report for 1999
The B514 sampling location is in a hazardous waste management area where tritium-contaminated waste is treated, and the B292 location is near an underground retentiontank that had previously leaked. The concentrations in air at the B514 sampling locationare variable because of the changing concentrations of tritium in the waste stream. The1999 median concentrations at B292 and B514 are similar to the median concentrationsin 1998.
Beryllium in Air
The median concentrations of airborne beryllium for the Livermore site perimetersampling locations are shown in Table 5-7. (See Data Supplement Table 5-14 formonthly data.) The highest value of 37.8 pg/m3 was found in the October compositeat location COW and was most likely attributed to resuspension and mass loading ofparticulates containing naturally occurring beryllium from construction activities anda lack of rainfall. The median concentration for this location is 0.11% of the monthlyambient concentration limit (ACL) of 10,000 pg/m3 established by the Bay Area AirQuality Management District (BAAQMD) and the EPA.
Table 5-7. Beryllium(a) in air particulate samples (pg/m3), Livermore site perimeterand Site 300 locations, 1999.
Samplinglocation(b)
Detectionfrequency(c) Median Interquartile
rangeMaximum
Livermore perimeter locations
CAFE 11/12 11.1 7.40 23.8
COW 12/12 10.8 9.10 37.8
MESQ 11/12 11.0 7.50 36.4
MET 11/12 7.83 4.28 23.9
SALV 10/12 7.47 6.31 25.7
VIS 12/12 10.3 8.02 33.2
Site 300 locations
801E 12/12 11.8 9.32 30.9
EOBS 10/12 5.53 4.77 18.2
GOLF 12/12 10.2 14.3 26.4
TFIR 11/11 13.4 6.24 32.3
a The state ambient concentration limit is 10,000 pg/m3.
b See Figures 5-1 and 5-3 for sampling locations.
c Detection frequency is the number of samples with results above the detection limit divided by the number of samples.

Air Surveillance Monitoring 5
LLNL Environmental Report for 1999 5-21
Figure 5-7 is a plot of the median beryllium concentration at the Livermore siteperimeter from 1974 through 1999. The decrease in median concentration in 1993 andthe increase in 1999 were the result of a change in the analytical laboratory used toperform the analysis. The overall median concentration from 1974 through 1999 wascalculated to be 0.2% of the ACL. Unless there is a change in LLNL’s operations, theberyllium levels are expected to remain unchanged.
19741972 1976 1978 1980 1982 1984Year
Co
nce
ntr
atio
n (
pg
/m3 )
1986 1988 1990 1992 1994 1996 1998 2000
1
10
102
103
104
105
BAAQMD ambient concentration limit (ACL)
ACL = 1.0 × 10⁴ pg/m3
Median
Figure 5-7. Median concentration of beryllium in air particulate samples taken at theLivermore site perimeter, 1974–1999.
Site 300
Airborne Radioactivity
Table 5-2 shows the detection frequency and the monthly gross alpha and gross betamedian, IQR, and maximum for sampling locations at Site 300. (See Data SupplementTable 5-15 for monthly data.) The monthly median gross alpha and gross betaconcentrations are shown in Figures 5-4 and 5-5. The Site 300 gross alpha and grossbeta results show a similar pattern to those found at the Livermore site. Typical grossalpha activity is 5.0 × 10⁻⁵ Bq/m3 (1.3 × 10⁻¹⁵ Ci/m3). Typical gross beta activity is

5 Air Surveillance Monitoring
5-22 LLNL Environmental Report for 1999
4.2 × 10⁻⁴ Bq/m3 (1.1 × 10⁻¹⁴ Ci/m3). These values are slightly higher than thoseobtained from previous monitoring data during the past several years and were likelycaused by the variations in how the different analytical laboratories performed theanalyses. (As mentioned above, LLNL selected a new analytical laboratory to performgross alpha and gross beta analysis in March 1999).
The primary sources of observed gross alpha and gross beta activity are naturallyoccurring radioisotopes of uranium and thorium, their decay products, and any residualfallout from atmospheric weapons testing and the 1986 Chernobyl reactor accident.
Table 5-3 lists the annual median activities, detection frequencies, IQR, maximum, thepercent of the DCG, as well as the DCG, of gamma-emitting radionuclides in samplesfrom Site 300. (See Data Supplement Table 5-16 for monthly data.) All theseradionuclides were measured at concentrations significantly below the DCGs. Of thenuclides identified, all are naturally occurring, with the exception of cesium-137. Theprimary source of 137Cs normally is long-term global fallout and resuspension.
Table 5-4 shows the median concentration of plutonium-239+240 on air-filter samplescollected from Site 300. (See Data Supplement Table 5-17 for monthly data.) The highestconcentration of plutonium-239 was recorded in the September composite at a level of8.7 × 10−9 Bq/m3 (2.3 × 10⁻¹⁹ Ci/m3), or 0.001% of the DCG.
Table 5-5 shows the median concentration of uranium-235, uranium-238, and theuranium-235/uranium-238 ratio on air samples from Site 300 and vicinity. (See DataSupplement Table 5-18 for monthly data.) The highest concentration of uranium-238was observed in the September composite at a level of 1.9 × 10⁻⁴ µg/m3. The highesturanium-235 concentration was recorded at PRIM during March at a level of1.5 × 10−6 µg/m3.
As previously discussed in the Livermore Site Results section, the ratio of uranium-235to uranium-238 is used to identify the source of the uranium. Because Site 300operations use depleted uranium that contains very little uranium-235, it follows that ifthe ratio remains constant and near 0.7% (within the limit of sampling and analyticalerror), then the uranium-238 measured is from natural sources. The uranium-235/uranium-238 ratios in the September and October Site 300 composite (and in Augustand September at location PRIM) are less than expected for natural sources, whichindicates some impact from operations at Site 300. These data are supported by Site300 activities from B851 published in the NESHAPs Report (Gallegos et al. 2000). Themedian concentration of uranium-238 for 1999, however, is only 0.02% of the DCG.
Air Surveillance Monitoring 5
LLNL Environmental Report for 1999 5-23
The uranium-235/uranium-238 median ratios for PRIM (off site) are generally asexpected for naturally occurring uranium; however, because of the higher valuerecorded for the uranium-235 during March, this ratio of 2.21 × 10⁻² indicates other thannatural uranium at this site. This sample was recounted at the analytical laboratory, andthe values were consistent with the original sample. While no significant environmentalimpact stems from the observed uranium-235 value (0.003% of the DCG), it is highlyunusual and is not corroborated with the Site 300 composite sample or seen in othermonths. Its cause is unknown; however, similar anomalous data have appeared in thepast. The overall levels were essentially the same as those reported in previous years.
Table 5-6 shows the median concentration of tritiated water vapor that was observedat the new sampling location (PRIM) near Site 300. (See Data Supplement Table 5-19for biweekly data.) The annual median concentration is 4.1 × 10⁻³ Bq/m3
(1.1 × 10⁻¹³ Ci/m3), or 0.0001% of the DCG.
Beryllium in Air
The detection frequency, median concentration, IQR, and maximum concentrations ofairborne beryllium for the Site 300 sampling locations are shown in Table 5-7. (See DataSupplement Table 5-20 for monthly data.) The highest beryllium concentration of 32.3pg/m3 occurred in October at location TFIR. The median concentration for this locationis 0.13% of the federal and state ambient concentration limit, which is 10,000 pg/m3.
Environmental Impact
The environmental impacts from both radioactive and nonradioactive effluents aredescribed in this section.
Radioactive Materials
LLNL operations involving radioactive materials had little impact on radionuclideconcentrations in ambient air during 1999. Radionuclide concentrations in air at theLivermore site and in the Livermore Valley were well below the levels that would causeconcern to the environment or public health according to existing regulatory standards.

5 Air Surveillance Monitoring
5-24 LLNL Environmental Report for 1999
The diffuse tritium sources at B292, B331, B514, and B624 had a localized effect;typically, tritium concentrations detected at the site perimeter or off site were not fromdiffuse sources.
The concentrations of radionuclides measured around Site 300 and in the City of Tracywere well below all standards and, except for uranium isotopes, reflected background ornaturally occurring levels of these materials. (See Chapter 13, Radiological DoseAssessment, for a discussion of estimated dose from these data.) The uranium-235/uranium-238 ratios in August and September were less than the ratio of naturallyoccurring concentrations of these isotopes, which suggested the presence of depleteduranium in those Site 300 air samples. This depleted uranium resulted from currenttesting as substantiated by Site 300 explosive experiments during those months(Gallegos et al. 2000). Nevertheless, the detected levels remain far below regulatorystandards.
Nonradioactive Materials
The concentrations of beryllium at both sites can be attributed to resuspension of surfacesoil containing naturally occurring beryllium. Local soils contain approximately 1 ppmof beryllium, and the air of the Livermore area and the Central Valley typically contains10 to 100 µg/m3 of particulates. Using a value of 50 µg/m3 for an average dust load and1 ppm for beryllium content of dust, a conservative airborne beryllium concentrationof 50 pg/m3 can be predicted. The overall annual medians for the Livermore siteand Site 300 are 9.3 pg/m3 and 8.6 pg/m3, respectively. These data are lower thanpredicted, well below standards, and do not indicate the presence of a threat to theenvironment or public health.