air quality selma disposal and recycling and transfer station
DESCRIPTION
mmnnnnnTRANSCRIPT

Air Quality Impact Analysis Report
Selma Disposal and Recycling and Transfer Station
Fresno County, California
Prepared for:
Selma Disposal an d Recycling Incorporated P.O. Box 708
Selma, CA 93662 559.891.7694
Contact: Larry Johnson, Owner/Operator
Prepared by:
Michael Brandman Associates 2444 Main Street, Suite 150
Fresno, CA 93721 559.497.0310
Contact: Dave Mitchell, Project Manager
Elena Nuno, Air Quality Analyst
11111111 11111111 .\li(h~.cl Brnll(lnull .\ssociart"s
May 13, 2009

This page intentionally left blank

Selma Disposal and Recycling and Transfer Station - Selma, California Air Quality Impact Analysis Report Table of Contents
TABLE OF CONT ENTS
Acronyms and Abbreviations v Section 1: Introduction 1
1.1 - Purpose and Methods of Analysis 1 1.2 - Executive Summary 1
1.2.1 - Findings 1 1.2.2 - Project Design Features that Reduce Em issions 1 1.2.3 - Mitigation Measures Designed to Reduce Ai r Impacts 2
1.3 - Project Description 2 Section 2: Setting 12
2.1 - Regulatory Setting 12 2.1.1 - Federal and State 12 2.1.2 - Local and Regional 14 2.1.3 - Climate Change/Greenhouse Gas Regulati on 20
2.2 - Air Quality Setting 30 2.2.1 - San Joaquin Valley Air Basin (SJVAB) 30 2.2.2 - Regional Air Quality 31 2.2.3 - Local Air Quality 36
2.3 - Pollutants of Concern 38 2.3.1 - Ozone 38 2.3.2 - Particulate Matter (PM10 and PM2.5) .40 2.3.3 - Carbon Monoxi de 40 2.3.4 - Toxic Air Contaminants 41 2.3.5 - Greenhouse Gases 42
Section 3: Thresholds 45 3.1 - Regional A ir Pollutants 45 3.2 - Local Air Pollutants 46
3.2.1 - Criteria Poll utants Thresholds 46 3.2.2 - Health Risk 47 3.2.3 - CO Hotspot 48 3.2.4 - Nuisance 48
3.3 - Greenhouse Gas/Climate Change 49 3.4 - Conformance with AQPs 51 3.5 - Cumulative Impacts 51
3.5.1 - Consistency with Existing Air Quality Plans 52 3.5.2 - Cum ulative Health Effects 52
Section 4: Impact Analysis 53 4.1 - Emissions Calculation Methodology 53
4.1.1 - Project Impacts and Mitigation Measures 57 Section 5: References 77
Appendix A: Table of Assumptions. Emission Spreadsheets, URBEMIS 2007 Model Output, Greenhous e Gas Spreadsheets
Appendix B: Health Risk Assessment
Michael Brandman Associates S:\C1ient PN-JN\3633 Selma DRTS\Final Air Study\3633000 I_AirQualityReport.doc
iii

Selma Disposal and Recycling and Transfer Station - Selma, CalifornIa Air Quality Impact Analys" Report Table of Contents
LIST OF TABLES
Table 1: SORTS Hours of Operation 10
Table 2: Ambient Air Quality Standards 13
Table 3: SJVAPCD Attainment Status 15
Table 4: Fresno County 2006 Estimated Annual Emissions in Tons per Day 33
Table 5: Air Quality Monitoring Summary 36
Table 6: SJVAPCD Regional Thresholds .46
Table 7: Criteria Pollutant Threshold Summary 47
Table 8: Estimated Construction Equipment.. 53
Table 9: Annual Mileage Summary Waste Collection and Recycling Haul Trips 54
Table 10: Modeling Assumptions with Project 55
Table 11: Modeling Assumptions without Project 56
Table 12: Est imated Construction Em issions 61
Table 13: Operational Em issions (tons per year) 62
Table 14: Forecasted Number of Delivery Trucks 63
Table 15: Em ission Factors for Operational DP M Emissions 64
Table 16: Offroad Equipment Emissions 64
Table 17: Annual Total DPM Emissions 65
Table 18: Summary of Cancer Risks at Sensitive Receptors - Project Year 2009 66
Table 19: Construction Exhaust Carbon Dioxide Emissions (Unmitigated) 72
Table 20: Project Operational Greenhouse Gas Emissions (Unmitigated) 73
Table 21: California Greenhouse Gas E mission Reduction Strategies 74
LIST OF EXHIBITS
Exhibit 1: Regional Location Map 3
Exhibit 2: Project Vicinity 4
Exhibit 3: Site Plan 6
Michael Brandman Associates S:\Clienl PN·JNI3633 Selma DRTSIFinal Air StudyI36330001_AiIQualityReport.doc
iv

Selma Disposal and Recycling and Transfer Station - Selma, California Air Quality Impact Analysis Report Acronyms and Abbreviations
ACRONYMS AND ABBREVIATIONS
J.lg
AQP
CAA
CAAQS
CARB
CCAA
CEQA
CIWMB
co
DPM
EMFAC
EPA
GHG
HHW
HRA
LOS
MSW
NAAQS
NESHAPs
OEHHA
PM
ppm
micrograms
Air Quality Attainment Plan
Federal Clean Air Act
California Ambient Air Quality Standards
California Air Resources Board
California Clean Air Act
California Environmental Quality Act
California Integrated Waste Management Board
carbon monoxide
diesel particulate matter
Emission Factor
Environmental Protection Agency
Greenhouse Gas
Household Hazard Waste
Health Risk Assessment
Level of Service
Municipal Solid Waste
National Ambient Air Quality Standards
National Emission Standards for Hazardous Air Pollutants
oxides of nitrogen
California Office of Environmental Health Hazard Assessment
particulate matter
parts per million
Michael Brandman Associates S:\Clienl PN-JN\3633 Selma DRTS\Final Air Study\36330001_AirQualityReport.doc
v

Selma Disposal and Recycling and Transfer Station - Selma, California Air Quality Impact Analysis Report Acronyms and Abbreviations
ROG
RTP
SDRTS
SIP
SJVAB
SJVAPCD
TAC
URBEMIS
VMT
reactive organic gases
Regional Transportation Plans
Selma Disposal and Recycling and Transfer Station
State Implementation Plans
San Joaquin Valley Air Basin
San Joaquin Valley Air Pollution Control District
Toxic Air Contaminant
Urban Emissions Model
vehicle miles traveled
Michael Brandman Associates S:\Clienl PN-JNI3633 Selma DRTSlFinal Air Studyl36330001_AirQualityReport.doc
vi

Selma Disposal and Recycling and Transfer Station - Selma. California Air Quality Impact Analysis Report Introduction
SECTION 1: INTRODUCTION
1.1 • Purpose an d Methods of Analysis
The following air quality analysis was prepared to evaluate whether the expected criteria air
pollutant emissions and greenhouse gas emissions (GHG) generated from the proposed project
would cause significant impacts to air resources in the project area. This assessment was
conducted within the context of the California Environmental Quality Act (CEQA, California
Public Resources Code Sections 21000, et seq.).
1.2 • Executive Sum mary
1.2.1 - Findings
• The project would not conflict with or obstruct implementation of the applicable air quality
plan.
• The project would not significantly contribute to a carbon monoxide hotspot that would
exceed federal or state air quality standards.
• The project would not exceed the San Joaquin Valley Air Pollution Control District's
(SJVAPCD) Thesholds of Significance.
• The maximum predicted cancer risks associated with the Diesel Particulate Matter (DPM)
toxic air contaminant emissions from the project would not exceed the cancer risk
threshold at any nearby sensitive receptor, worker receptor, or student receptor.
• The maximum predicted cancer risks associated with the DPM toxic air contaminant
emissions from the project would not exceed the non-cancer risk threshold established at
any nearby sensitive receptor, worker receptor, or student receptor.
• The localized, project-specific health risk impacts from toxic air contaminant emissions
based on air dispersion modeling are considered less than significant at any sensitive
receptor.
• After mitigation, the project would not create objectionable odors affecting a substantial
number of people.
• The project would not result in a cumulatively considerable net increase ofany criteria
pollutant for which the project region is nonattainment under an applicable federal or state
ambient air quality standard.
• The project would not significantly hinder or delay California's ability to meet the
reduction targets contained in AB 32.
1.2.2· Project Design Features that Reduce Emissions
The objectives of the project are to provide the City of Selma with a full range of solid waste
management services that will allow the City to meet its solid waste service needs and to increase
the City's diversion of recyclable materials, in order to achieve state mandated goals.
Michael Brandman Associates S:\C1ient PN-JN\3633 Selma DRTS\Final Air SlUdy\36330001_AirQualityReport,doc
1
Selma Disposal and Recycling and Transfer Station - Selma, California Air Quality Impact Analysis Report Introduction
Additionally, the Selma Disposal and Recycling and Transfer Station (SDRTS) will provide the
region with services that can reduce operating expenses and air quality impacts for smaller
community service providers through the use of the transfer and recycling operations. Emissions
from solid waste disposal and recycling operations are presently occurring as the City of Selma
and other communities transport their municipal solid waste (MS W) and recyclables to pennitted
facilities. The establishment of the SDRTS provides a means of reducing the number of vehicles
travelling to pennitted facilities through the use of the transfer trailers and the baling and storage
of recyclables and greenwaste until the transfer vehicles are at sufficient capacity.
1.2.3 - Mitigation Measures Designed to Reduce Air Impacts
MM-AQ-1 Loaded transfer vehicles shall be covered and properly maintained to ensure that
solid waste materials are contained entirely within the vehicle for the duration of
its transport;
MM-AQ-2 Odor complaints received by the City or the SJVAPCD shall be responded to
within 24 hours. This response shall include an inquiry into the source of the
odor and identification of the measures necessary to eliminate the odor source. If
excessive complaints are received, as defined by the City, additional measures
shall be implemented to control odors. Additional measures may include, but are
not limited to: (a) install plastic curtains on entrances and exits to contain odors
when doors are opened to allow vehicles to enter and exit and (b) use of
deodorants to mask or neutralize odors as needed.
1.3 • Project Description
Project Location
The Project site is located within the City of Selma in Fresno County (see Exhibit I-Regional
Location). The property is located on Assessor Parcel Number 390-011-64 adjacent to Highway
99 between Golden State Boulevard and Dockery Avenue (see Exhibit 2 - Project Vicinity). The
project site is designated Heavy Industrial and is zoned M-2, Manufacturing and Industrial. The
project is located within the jurisdiction of the San Joaquin Valley Air Pollution Control District.
Surrounding Land Uses
Surrounding land uses include residential to the east, vacant industrial uses to the north, a
construction company demolition processing facility to the south and west. The residential
properties adjacent to the project site are legal, non-confonning, uninhabited residential
properties in the M-2 zoning. There are two residences located on the west side of Dockery
Avenue. The first residence is approximately 100 feet north of the Office/Shop Building and is
not suitable for occupancy (condemned). The second residence is approximately 560 feet south
Michael Brandman Associates S:\Clienl PN·JN\3633 Selma DRTS\Final Air Srudy\36330001_AirQualilyReport.doc
2

Big Dry Creek Reservoir
Sierra N Pine Flat Reservoir
Sequoia NF
: I
-'::~~'~?nger , -:'~l-.L_.
r L_ .j. -/.
NOT TO SCALE I _1
Tularfl Co~nfy
~.-
!-~;~6inuba----. --PT ~,\ ----.--..-.-----, . ,
,
.- '---.--.--_..J. -
.1,
.__.__..
J
---------------+---~ i
Fresno County
Kings County .._-)_ ..
r----------.-J
I I ,
. t ---'--.__ I : I .
J I C.;:..~IH";,a:::n.:.:",;;;o:.:rd~ __""'i 4"" iiliJ.---~...;.- --..:.I_:::_:';~;~is-~a~lia:!.'';;'-::-J-----·r--·---- ------0-- ----,----t-Lj--- '. ~'! l
/lemoore 1.I i • __ ....•_.-_.=1=:. ::,-'-.__ I U__'-'--==--j-..... ------ L..L___ '-.-. __---.__ . - ~--
,,
Source: Census 2000 Dala, The CaSIL, MBA GIS 2009.
Exhibit 1tD~E1 ~~ 2_5_0~__5 Miles5_..Regional Location Map
~£ichael Bmunm,m .\ssoci.1ff's 36330001 ·04l2oo911_regional.mxd SELMA DISPOSAL AND RECYCLING AND TRANSFER STATION
AIR QUALITY IMPACT ANALYSIS REPORT

- -_-._.-.
8',~r~'~~ .:..::
,,.
i• ~ c o•a. E o F I#)
,, i i.. ~
•JC ~ o Q en
Source: ESRI World Street Map. MBA GIS Data 2009.
Exhibit 2tII~tJ ~~ 2,000 1,000 0 2'~et :\lich,l('l Br:m<11lllUl.\ssoci:ltes ---.__r----- Project Vicinity Map 36330001 ·04120091 2_proJecCvicinity.mxd SELMA DISPOSAL AND RECYCLING AND TRANSFER STATION
AIR QUALITY IMPACT ANALYSIS REPORT

Selma Disposal and Recycling and Transfer Station - Selma, Callfomla Air Quality Impact Analys" Report Introduction
of the Office/Shop Building and is owned by Selma Disposal and Recycling Incorporated and is
used as an office annex. There are three residences on the east side of Dockery Avenue. The first
is 170 feet east of the Office/Shop Building. The second residence is 300 feet south of the
Office/Shop Building and the third residence is 480 feet south of the Office/Shop Building.
Project Description
The SDRTS will provide the City of Selma with the full range of solid waste management
services to achieve two principal goals: I) Provide solid waste handling services that meet and
exceed all state and local regulations for protection of public health, employee safety and the
environment; and 2) Increase diversion of recyclable materials to achieve state-mandated
recycling goals. Exhibit 3 shows the proposed site plan.
The SDRTS will receive, process, and transfer MSW from the City of Selma collected by the
franchise service provider, Selma Disposal Company. The SDRTS will also accept MSW from
the County areas within the City of Selma Sphere ofInfluence (currently 100 individual
accounts).. The following recyclables will also be received and processed at the facility:
corrugated paperboard, newsprint, mixed grade papers, aluminum, ferrous metals, glass, plastics,
wood wastes, "Type A" inert materials, greenwaste materials and other marketable materials.
The facility will also accept whitegoods, commercial wastes, and waste tires in designated areas
and containers. Electronic wastes (e-wastes) will be accepted on periodically scheduled
community collection events, in accordance with established e-waste collection practices. E
wastes illegally disposed in the municipal and commercial waste stream will be manually
segregated from other wastes and deposited into lockable storage containers until transferred to a
certified e-waste processing location. Non-recyclable solid waste collected from the community
will be transferred to Kettleman Landfill, Avenal Landfill, Orange Avenue Landfill in Fresno,
American Avenue Landfill in Kerman or other fully permitted solid waste landfill. Recyclables
will be segregated and baled or otherwise processed for shipment as marketable commodities.
The green materials and wood waste will be chipped and transported off-site. Collected solid
wastes will be immediately sorted and then loaded into transfer trailers for delivery to off-site
disposal facilities. No disposal of solid waste will occur on the property. Facility and vehicle
maintenance activities will also be conducted on the site. Operation of the SDRTS will be subject
to regulatory standards and ordinances promulgated and administered by the City of Selma, the
County of Fresno, the California Integrated Waste Management Board (CIWMB), the State
Water Resources Board and other appropriate state and local agencies.
The facility will be permitted for a maximum of 800 tons per day of all permitted material types,
based on average daily tonnage received over a 30 day period. Peak tonnage for a single day's
operation will be 800 tons per day for special events, such as amnesty day collection events,
neighborhood waste collection events and events that generate waste beyond the control of
humans, such as floods, fires, earthquakes and other acts of God. The site will not be accessible
Michael Brandman Associates S:IClienl PN-JN\3633 Selma DRTSlFinal Air SlUdyI36330001_AirQualityReport.doc
5

......:..-=""---=-....:...."'=:.-:...:...'"=:.=.=-=-~=:.:..:.:..:::==:.....:..,.
"'.., ,rZl&=/
""- !'1"Sl
...~'''',''' ....., I ///. I L v --- , r // - N'
~ i!ia i.. iL-r~f .=sill;
~[r li:-§: -=. ; if=-
~
a+-...-.$'~
=:-=--=-=----- --_
1.£_1 __
;'-~:-:1 _
El --............ ---
---===
'1 i1•~ - ~1
.. -
......__.....aa.i:_""'iiiiiiIii'"_~
~. 1~-:=::Ir=~.=::."'="1 1~!I'i JI '",,- ~ 1111~ ----., I -
r==/ ::1' ~ "" ..~I , , I. I ' r~i I ""'", " , ' , ·.11 '\
:~11 i '\---~ '",,-, Ef'" -iJ."'--" ==111 Source: Michael Suther1and and Associates. 2009.
1IIil~~~ ~lAJ.·· 250 125 0 250 Exhibit 3 ~~~~~C~ ~ Site Plan Michael Brandman Associales
SELMA DISPOSAL AND RECYCLING AND TRANSFER STATION AIR QUALITY IMPACT ANALYSIS REPORT
36330001 ·04/200913_sit8J1lan.cdr

Selma Disposal and Recycling and Transfer Station - Selma, California Air Quality Impact Analysis Report Introduction
to the general public, except for specified collection events, such as e-waste and household
hazardous waste events. Certain private companies, such as construction companies, yard service
companies and cleaning service companies may have access based upon negotiated agreements.
Local agency vehicles, such as City of Selma Public Works Department vehicles, may deliver
materials such as brush trimmings and green waste to the facility in accordance with negotiated
agreements
Solid Waste Handling Activities and Operating Schedule
The SORTS will consist of five distinct solid waste handling activities:
1. A recycling processing area
2. A solid waste direct transfer area
3. A green material and wood waste processing area
4. A "Type A" inert debris processing area/construction/demolition debris area.
5. A "whitegoods", e-waste, Household Hazardous Waste (HHW), used oil and waste tire
storage area
All incoming loads of municipal solid waste, commercial waste, green and wood wastes, and
inerts will be weighed on scales and recorded for disposal and recycling reporting requirements.
Waste tires arriving as part of a mixed load will be segregated from other wastes and stored in the
waste tire storage area. E-wastes will be stored in the same manner. All recyclable materials,
green and wood waste, electronic waste, tires and solid wastes will be weighed on the facility
scale before transfer, shipping or disposal.
A brief description of the solid waste handling activities and their hours of operation are provided
below.
Recycling Process Area
Single stream and segregated recyclable materials delivered to the facility will be unloaded in the
recycling tipping area located adjacent to the process line. Recyclables will be processed on an
elevated sort line (conveyor belt) and deposited into bunker areas for movement ofrecyclables
(except glass) to a horizontal baler located within the recycling building. Glass cullets will be
stored in roll-off bins. The north and west walls of the processing baling building are fully
covered to block prevailing northwesterly winds. The Recycling Process Area is in a fully roofed
building that will prevent the collection of rain water in the baler recycling pit. Surface water
gradients will preclude the flow of surface water into the recycling area and recycling pit. The
recycling area will be cleaned daily by manual sweeping. High pressure, low volume washers
using minimal amounts of water will be utilized for periodic cleaning on an as needed basis.
Accumulated water will be collected by vacuum hoses and disposed with liquids collected by the
Michael Brandman Associates S:\Client PN·JN\3633 Selma DRTS\Final Air SlUdy\36330001_AirQualityReport.doc
7

Selma Disposal and Recycling and Transfer Station - Selma. Callfomla Air Quality Impact Analysis Report Introduction
portable toilet operations. A surface water drain system will direct surface waters to the surface
water retention pond.
Operation of the recycling sort conveyor line may occur from 5:00 AM to 8:00 PM, Monday
through Saturday. Movement ofrecyclables from the recycling area tip floor and baled
recyclables area to storage or containers may occur from 5:00 AM to 10:00 PM, Monday through
Saturday. Maintenance of recycling equipment, including, but not limited to the sort line
conveyor, vehicles, electrical supply circuits and storage equipment may occur 24 hours per day,
seven days per week.
Solid Waste Transfer Area
Solid wastes will be transferred from compactor route trucks directly into a concrete lined
unloading dock. The material would then be immediately loaded on a conveyor for sorting in the
recycling building. The sorted non-recyclable material would then be loaded into transfer trailers
on a continuous basis during hours ofoperations. Transfer trailers will transport solid waste to
permitted landfills daily, with a maximum on-site residency of solid waste of not to exceed 48
hours. No disposal or discharge to land will result from any of these potential activities. Litter
fencing and daily litter cleanup sweeps will control blowing litter. Street sweepings will be
directly loaded into storage bins and transferred into direct transfer vehicles for transport to a
fully permitted landfill.
Fleet trucks servicing municipal and commercial collection accounts may operate from 3:00 AM
to 10:00 PM, Monday through Friday and 3:00 AM to 8:00 PM on Saturday. Direct transfer solid
waste will occur from 5:00 AM until 8:00 PM, Monday through Saturday. Vehicle maintenance
may occur 24 hours per day, seven days per week.
Green Material, Wood Waste Processing Area
Green material and wood wastes will be shredded with mobile processing equipment for transport
offsite on a frequency of not less than 48 hours. No composting activities are proposed at the
facility.
Acceptance of greenwaste and woodwaste debris loads and grinding operations will be limited to
5:00 AM to 8:00 PM, Monday through Saturday. Greenwaste or woodwaste processing will be
restricted on any days where wind direction or speed, climatological conditions, or other factors
would cause greenwaste or woodwaste processing to exceed any environmental or public
nuisance thresholds.
Inet1 Type UA" Debris and Construction/Demolition Debris Processing Area
The type of inert debris defined in California Code of Regulations, Title 24, Chapter 3, Article
5.95, Section 17388, (k), (1), will be processed at the facility. These types of inert debris have no
putrescible wastes or wastes that require special handling as a hazardous material, special waste
Michael Srandman Associates S;\Client PN-JN\3633 Selma DRTSlFinal Air Study\36330001_AirQualityReport.doc
8

Selma Disposal and Recycling and Transfer Station - Selma, Callfomla Air Quality Impact Analysis Report Introduction
A surface water collection basin is located on the southwest side and serves to retain surface run
off from the site.
Proposed Improvements
The following improvements are proposed for the operation of the SDRTS:
• A concrete surface will be constructed for all waste transfer and recycling operations,
vehicle transportation routes and materials processing.
• A recycled materials dumping pit and conveyor and elevated manual sort line will be build
adjacent to the existing recycling building.
• A certified scale will be added to the facility.
• An employee parking area located between the office and the Dockery Avenue property
line will be paved with an asphalt surface.
• An elevated concrete waste transfer dock will be installed east of the recycling operation
for direct transfer of solid wastes.
• A greenwaste concrete pad and a woodwaste concrete pad will be constructed.
• A Type A inert waste storage pad and concrete waste and metallics storage pad will be
constructed.
• A storage concrete pad for whitegoods, e-waste, HHW and waste tire storage will be
constructed.
• A proposed Used OiVHHW facility on Dockery Avenue (pending CIWMB grant) will be
constructed.
• Water service, fire hydrants and sewer service for the facility will be added.
• A landscaped earthen berm will be constructed along the State Route 99 corridor.
• Grading and landscaping will be performed.
• Lighting and signage will be installed in accordance with City of Selma lighting standards.
• Certified vehicle scales will be installed.
• Chain link security fencing and cinder block wall on Dockery Avenue will be constructed.
Michael Brandman Associates S:\Clienl PN-JNI3633 Selma DRTSIFinal Air Study136330001_AirQualityReport.doc
11

Selma Disposal and Recycling and Transfer Station - Selma, California Air Quality Impact Analysis Report Introduction
or characteristic waste. Inert Type A concrete debris will be stored in roll off containers until a
sufficient supply for processing is accrued. SDRTS will contract with a local processor, such as
Kroeker, Inc. of Fresno to remove concrete debris from the site for further processing. These
materials have a market value as road base, engineered fill and other structural building purposes.
Construction and demolition debris, such as dimensional lumber, gypsum sheetrock, roofing
shingles will also be recycled.
Acceptance ofInert Type A debris loads will be limited to 5:00 AM to 8:00 PM, Monday through
Saturday.
·Whitegoods" and Waste Tire Storage Area
"Whitegoods" are defined as various large metallic appliances with porcelain coatings, such as
refrigerators, stoves, and freezers. These wastes pose special waste management problems due to
stored Freon in refrigeration units, mercury switches and waste oil in gear boxes. Refrigerator
doors will be removed, as they may close with airtight seals that pose a threat to children. Waste
tires are also a challenge as they may harbor vermin and provide breeding areas for mosquitoes
and insects. Whole tires are prohibited from disposal in landfills and will be stored in 40 yard
bins for removal by a permitted waste tire hauler.
Whitegoods, e-waste and waste tire storage operations will be limited to 5:00 AM to 8:00 PM,
Monday through Saturday.
Residual Materials
All residual materials from all recycling operations will be transferred to the direct transfer
facility on a daily basis. No residuals will be stored for more than a 48 hour period.
Additional Operations
Vehicle maintenance, facility maintenance and administrative activities will also occur at the
project site in a two-bay steel building located at the entrance on Dockery Avenue. Additional
activities at the project site will include employee parking and storage of portable toilets and
toilet pumping vehicles. Appropriate business permits and business licenses have been obtained
for these business activities.
The SDRTS also proposes special operations such as HHW collection through the establishment
ofa permanent HHWfused oil collection site and periodic community collection events.
Michael Brandman Associates S:\Clienl PN-JN\3633 Selma DRTSIFinal Air Sludy\36330001_AirQualityReport.doc
9

Selma Disposal and Recycling and Transfer Station - Selma, California Air Quality Impact Analysis Report Introduction
Table I provides a summary of the hours of operation for the various activities at SORTS.
Table 1: SORTS Hours of Operation
Facility Activity Operating Days Operating Hours
Recycling Sort Line Monday - Saturday 5:00 AM 8:00 PM
Baled, Loose Recyclables Movement Monday - Saturday 5:00 AM - 10:00 PM (Front Loader)
Recycling Equipment Maintenance Monday - Sunday 24 hours
Solid Waste Collection Monday - Friday 3:00 AM 10:00 PM Saturday 3:00 AM 8:00 PM
Solid Waste Direct Transfer Monday - Saturday 5:00 AM 8:00 PM
Vehicle Maintenance Monday - Sunday 24 hours
Greenwaste and Woodwaste Acceptance Monday - Saturday 5:00 AM 8:00 PM and Processing
Greenwaste and Woodwaste Grinding Monday - Saturday 5:00 AM 8:00 PM
Inert Type A Debris Acceptance Monday - Saturday 5:00 AM 8:00 PM
Whitegoods/Waste Tire Acceptance Monday - Saturday 5:00 AM 8:00 PM
Special Operations
• HHW Collection Event One day a month 8:00 AM - 4:00 PM
• Used Oil Collection (drop oft) Monday - Saturday 8:00 AM -4:00 PM
.E-Waste (drop oft) Monday - Saturday 8:00 AM - 4:00 PM -- ._.. .- ._._-..
• Community Cleanup Events Thursday - Sunday 8:00 AM - 4:00 PM (§pring and FaiL F()ur Days) (Dates to ~~ determined)
• Emergency Operations As Required 8:00 AM - 4:00 PM
Source: George H. Larson & Associates Inc. and International Engineering Services,lnc., January 2009
Existing Facilities
The proposed site is currently operating as a recycling facility that periodically accepts limited
volumes of recyclable materials and MSW (County of Fresno, Community Health Department,
2004). The facility processes segregated recyclables and transfer ofMSW. The current volume
ofMSW is not to exceed 15 tons per day, in accordance with requirements specified in CCR
Section 17403.3 for Limited Volume Transfer Operations. Typical operations include periodic
community wide clean up and collection programs. MSW is disposed of at the American Avenue
Landfill or other permitted facility. Recyclables are processed and transferred to end use markets
as appropriate. No hazardous waste is accepted at the facility. Current hours of operation are
7:00 AM to 5:00 PM, Monday through Saturday.
The 1,000 square foot Office/Shop is located in a sixty (60) by eighty (80) foot building located
near the entrance.
A sixty (60) by eighty (80) foot steel building houses the current recycling facilities.
Michael Brandman Associates S,IClienl PN-JN\3633 Selma DRTS\Final Air Sludy\36330001_AirQualityReport.doc
10

Selma Disposal and Recycling and Transfer Station - Selma, California Air Quality Impact Analysis Report Setting
SECTION 2: SETTING
2.1 • Regu latory Setting
Air pollutants are regulated at the national, state, and air basin level; each agency has a different
degree of control. The United States Environmental Protection Agency (EPA) regulates at the
national level. The California Air Resources Board (ARB) regulates at the state level and
TCAPCD regulates at the county level.
2.1.1 - Federal and State
EPA handles global, international, national, and interstate air pollution issues and policies. EPA
sets national vehicle and stationary source emission standards, oversees approval of all State
Implementation Plans (SIPs), provides research and guidance in air pollution programs, and sets
National Ambient Air Quality Standards (NAAQS), also known as federal standards. There are
NAAQS for six common air pollutants, called criteria air pollutants, which were identified
resulting from provisions of the Clean Air Act (CAA) of 1970. The six criteria pollutants are:
• Ozone • Carbon monoxide (CO)
• Particulate matter (PMIO and PM2.5) • Lead
• Nitrogen dioxide • Sulfur dioxide
The NAAQS were set to protect public health, including that of sensitive individuals; thus, the
standards continue to change as more medical research is available regarding the health effects of
the criteria pollutants.
The SIP for the State of California is administered by ARB, which has overall responsibility for
statewide air quality maintenance and air pollution prevention. A SIP is prepared by each state
describing existing air quality conditions and measures that will be followed to attain and
maintain NAAQS. The SIP incorporates individual federal attainment plans for regional air
districts. Federal attainment plans prepared by each air district are sent to ARB to be approved
and incorporated into the California SIP. Federal attainment plans include the technical
foundation for understanding air quality (e.g., emission inventories and air quality monitoring)
control measures and strategies and enforcement mechanisms.
ARB also administers California Ambient Air Quality Standards (CAAQS) for the ten air
pollutants designated in the California Clean Air Act (CCAA). The ten state air pollutants are the
six criteria pollutants listed above as well as visibility reducing particulates, hydrogen sulfide,
sulfates, and vinyl chloride.
Michael Brandman Associates S:\Client PN-JN\3633 Selma DRTS\FinaJ Air Srudy\36330001_AirQuaJilyReport.doc
12

Selma Disposal and Recycling and Transfer Station - Selma, California Air Quality Impact Analysis Report Setting
Federal and state ambient air quality standards and the most relevant effects are summarized in
Table 2.
Table 2: Ambient Air Quality Standards
Air Pollutant
Averaging Time
California Standard
National Standard Most Relevant Effects
Ozone I-hour 0.09 ppm (a) Decrease of pulmonary function and localized
8-hour 0.070 ppm 0.075 ppm lung edema in humans and animals; (b) risk to public health implied by alterations in pulmonary morphology and host defense in animals; (c) increased mortality risk; (d) risk to public health implied by altered connective tissue metabolism and altered pulmonary morphology in animals after long-term exposures and pulmonary function decrements in chronically exposed humans; (e) vegetation damage; (f) property damage.
Carbon I-hour 20 ppm 35 ppm (a) Aggravation of angina pectoris (chest pain or monoxide (CO) 8-hour 9.0 ppm 9 ppm
discomfort) and other aspects of coronary heart disease; (b) decreased exercise tolerance in persons with peripheral vascular disease and lung disease; (c) impairment of central nervous system functions; (d) possible increased risk to fetuses.
Nitrogen I-hour 0.18 ppm (a) Potential to aggravate chronic respiratory dioxide (N02)
Mean 0.030 ppm 0.053 ppm disease and respiratory symptoms in sensitive groups; (b) risk to public health implied by pulmonary and extra-pulmonary biochemical and cellular changes and pulmonary structural changes; (c) contribution to atmospheric discoloration.
Sulfur I-hour 0.25 ppm Bronchoconstriction accompanied by symptoms dioxide (S02)
24-hour 0.04 ppm 0.14 ppm which may include wheezing, shortness of breath and chest tightness, during exercise or physical
Mean 0.030 ppm activity in persons with asthma.
Particulate 24-hour 50 Jlg/m3 150 Jlg/m3 (a) Exacerbation of symptoms in sensitive patients matter (PMIO)
Mean 20 Jlg/m3 with respiratory or cardiovascular disease; (b) declines in pulmonary function growth in
Particulate matter (PM2.s)
24-hour
Mean 12 Jlg/m3
35 Jlg/m3
15.0 Jlg/m3
children; (c) increased risk of premature death from heart or lung diseases in the elderly.
Sulfates 24-hour 25 Jlg/m3 (a) Decrease in ventilatory function; (b) aggravation of asthmatic symptoms; (c) aggravation of cardio-pulmonary disease; (d)
, vegetation damage; (e) degradation of visibility; (f) property damage.
Lead 30-day 1.5 Jlg/m3 (a) Learning disabilities; (b) impairment of blood
Quarter 1.5 Jlg/m3 formation and nerve conduction.
Abbreviations:
Michael Brandman Associates S:\Clienl PN-JN\3633 Selma DRTS\Final Air Study\36330001_AirQualityReport.doc
13

Selma Disposal and Recycling and Transfer Station - Selma, California Air Quality Impact Analysis Report Setting
Air Averaging California National Most Relevant Effects Pollutant Time Standard Standard
ppm = parts per million (concentration) Ilg/m3 = micrograms per cubic meter Mean = Annual Arithmetic Mean 30-day = 30-day average Quarter = Calendar year quarter Sources: CARB 2oo8a
Recent Air Quality Standard Actions
In 2006, EPA changed the 24-hour PM2.S standard from 65 micrograms per cubic meter (~g/m3)
to 35 ~g/m3 and retained the existing annual standard of 15.0 ~g/m3. EPA promulgated a new 8
hour standard for ozone on March 12, 2008, effective March 27, 2008.
In February 2007, ARB established a new annual average nitrogen dioxide standard of 0.030
parts per million (ppm) and lowered the I-hour nitrogen dioxide standard to 0.18 ppm. These
changes became effective March 20,2008.
On October 15, 2008, EPA reduced the federal lead standard from 1.5 ~g/m3 to 0.15 ~g/m3. In
addition, EPA revised the averaging time and form of the lead standard. EPA will retain the
existing 1978 lead standard until one year after designations for the new 2008 standard. ARB is
required to make recommendations for areas to be designated attainment, nonattainment, or
unclassifiable by October 2009. Final designations will be effective no later than 2012.
Applicable Toxic Air Contaminant Regulation
ARB approved a regulatory measure to reduce emissions oftoxics and criteria pollutants by
limiting idling of heavy-duty diesel vehicles (CARB 2005a). The driver of any vehicle subject to
this section (I) shall not idle the vehicle's primary diesel engine for greater than 5 minutes at any
location and (2) shall not idle a diesel-fueled auxiliary power system for more than 5 minutes to
power a heater, air conditioner, or any ancillary equipment on the vehicle if it has a sleeper berth
and the truck is located within 100 feet of a restricted area (homes and schools).
ARB's Land Use Hand book
ARB adopted the Air Quality and Land Use Handbook: A Community Health Perspective (Land
Use Handbook) in 2005. The Land Use Handbook provides information and guidance on siting
sensitive receptors in relation to sources of toxic air contaminants (TACs). The sources ofTACs
identified in the Land Use Handbook are high-traffic freeways and roads, distribution centers, rail
yards, ports, refineries, chrome plating facilities, dry cleaners, and large gasoline dispensing
facilities. If the project involves siting a sensitive receptor or source ofTAC discussed in the
Land Use Handbook, siting mitigation may be added to avoid potential land use conflicts, thereby
reducing the potential for health impacts to the sensitive receptors (CARB 2005b).
2.1.2 - Local and Reg ional
San Joaquin Valley Air Pollution Control District
The air pollution control agency for the San Joaquin Valley Air Basin (SJVAB) is the SJVAPCD.
The SJVAPCD is responsible for controlling emissions primarily from stationary sources. The
Michael Brandman Associates S:\Clienl PN-JNI3633 Selma DRTS\Final Air SlUdy\36330001_AirQualilyReporl.doc
14

Selma Disposal and Recycling and Transfer Station - Selma, California Air Quality Impact Analysis Report Setting
SJVAPCD maintains air quality monitoring stations throughout the basin. The SNAPCD, in
coordination with the eight countywide transportation agencies, is also responsible for
developing, updating, and implementing the Air Quality Plans (AQPs) for the SNAB. In
addition, the SJVAPCD has prepared the GAMAQI, which sets forth recommended thresholds of
significance, analysis methodologies, and provides guidance on mitigating significant impacts.
Attainment Status There are three terms used to describe if an air basin is exceeding or meeting federal and state
standards: Attainment, Nonattainment, and Unclassified. Air basins are assessed for each
applicable standard, and receive a designation for each standard based on that assessment. If an
ambient air quality standard is exceeded, the air basin is designated as "nonattainment" for that
standard. An air basin is designated as "attainment" for standards that are met. If there is
inadequate or inconclusive data to make a definitive attainment designation for an air quality
standard, the air basin is considered "unclassified." The current attainment designations for the
project area are shown in Table 3.
Federal nonattainment areas are further divided into c1assifications--dassified as severe, serious,
or moderate as a function of deviation from standards. As of June 15,2005, the EPA revoked the
I-hour ozone standard in all areas except the 8-hour ozone nonattainment Early Action Compact
(EAC) Areas. The SJVAPCD is not listed as an EAC area; therefore, the federal I-hour ozone
standard does not apply to the project area. However, the SJVAPCD is still subject to anti
backsliding requirements such as continuation of I-hour ozone control strategies
Table 3: SJVAPCD Attainment Status
Designation/ClassificationPollutant _. -
Federal State
, Ozone (I-hour) No Federal Standard' NonattainmentiSevere
Ozone (8-hour) , NonattainmentiSerious2 Nonattainment
PMIO i NonattainmentiSeriousJ . Nonattainment
PM2.s Nonattainment4 Nonattainment
Carbon Monoxide AttainmentlUnclassified Attainment
, Nitrogen Dioxide AttainmentlUnclassified Attainment i
Sulfur Dioxide : AttainmentlUnclassified Attainment
I The federal one-hour ozone standard was revoked on June 15,2005.
2 On April 30, 2007, the Governing Board of the SJVAPCD voted to request EPA to reclassify the SJVAB as extreme nonattainment for the federal 8-hour ozone standards. The CARB, on June 14,2007, approved this request. This request must be forwarded to EPA by the CARB and would become effective upon EPA final rulemaking after a notice and comment process; it is not yet in effect.
3 Although EPA has determined that the SJVAB has attained the federal PM IO standards, their determination does not
Michael Brandman Associates S:\Clienl PN-JNI3633 Selma DRTSlFinai Air Study136330001_AirQuaiityReport.doc
15

Selma Disposal and Recycling and Transfer Station - Selma, California Air Quality Impact Analysis Report Setting
constitute a redesignation to attainment in accordance with Section 107(d)(3) of the Federal Clean Air Act. The SlVAB will continue to be designated nonattainment until all of the Section 107(d)(3) requirements are met.
4 The SNAB is designated nonattainment for the 1997 PM2.5 federal standards. EPA designations for the 2006 PM 2.5 standards will be finalized in December 2009.
Source: SlVAPCD, 2008.
As described above under Federal and State Regulatory Agencies, an SIP is a federal
requirement; each state prepares an SIP to describe existing air quality conditions and measures
that will be followed to attain and maintain the NAAQS. In addition, state ozone standards have
planning requirements. However, state PM 10 standards have no attainment planning
requirements, but air districts must demonstrate that all measures feasible for the area have been
adopted.
Ozone Plans
The SNAB is designated nonattainment of state and federal health-based air quality standards for
ozone. To meet CAA requirements for the one-hour ozone standard, the SJYAPCD has adopted
an Extreme Ozone Attainment Demonstration Plan (2004), which has an attainment date of201O.
However, the federal one-hour ozone standard has been revoked by EPA and replaced with an 8
hour standard. The planning requirements for the one-hour plan remain in effect until replaced by
a federal 8-hour ozone attainment plan.
The SJYAB is classified as serious nonattainment for the federal 8-hour ozone standard with an
attainment date of2013. On April 30, 2007, the SJYAPCD's Governing Board adopted the 2007
Ozone Plan, which contained analysis showing a 2013 attainment target to be unfeasible. The
2007 Ozone Plan details the plan for achieving attainment on schedule with an "extreme
nonattainment" deadline of2026. At adoption of the 2007 Ozone Plan, the SJYAPCD also
requested a reclassification to extreme nonattainment.
State ozone standards do not have an attainment deadline but require implementation of all
feasible measures to achieve attainment at the earliest date possible.
PM Plans
The SJYAB is designated nonattainment of state and federal health-based air quality standards for
respirable particulate matter (PM). Under the federal classification scheme, the SJYAB is
classified serious nonattainment for the PM IO (particulate matter less than 10 micrometers in
diameter) standard. To meet CAA requirements for the PM IO standard, the SJYAPCD has
adopted a PM IO Attainment Demonstration Plan (Amended 2003 PM IO Plan and 2006 PM IO Plan),
which has an attainment date of 20 1O.
EPA revoked the annual PM IO standard effective December 18,2006. The SJYAB air monitors
showed that the SJYAB had not exceeded the 24-hour federal PM IO standard from 2003 to 2005
Michael Brandman Associafes S:\Client PN-JNI3633 Selma DRTSlFinal Air Study13633000 1_AirQualityReport.doc
16

Selma Disposal and Recycling and Transfer Station - Selma, California Air Quality Impact Analysis Report Setting
(a 3-year period). The SJYAPCD submitted a request to be designated attainment for the federal
PM 10 standard. The SJYAPCD adopted the 2007 PM10 Maintenance Plan and Request for
Redesignation (2007 PM10 Plan) on September 20,2007. The 2007 PM IO Plan contains modeling
demonstrations that show the SJYAB will not exc~ed the federal PM10 standard for 10 years after
the expected EPA redesignation, monitoring, and verification measures, and a contingency plan.
Even though EPA revoked the federal annual PM IO standard, the 2007 PM IO Maintenance Plan
addresses both the annual and 24-hour standards because both standards were included in the
EPA-approved SIP. EPA finalized the determination that the SJYAB has attained the PM IO
standards on October 17,2007, effective October 30,2007. On September 25,2008, EPA
redesignated the San Joaquin Yalley to attainment for the PMIO National Ambient Air Quality
Standard (NAAQS) and approved the PM I0 Maintenance Plan.
The SJYAB is also designated nonattainment for the new federal PM2.S (particulate matter less
than 2.5 micrometers in diameter) annual standard. The SJYAPCD adopted the 2008 PM2.S Plan
on April 30, 2008. The PM2.S plan that demonstrates the air basin will attain the 1997 federal
standard by 2014 and makes progress toward attaining the 2006 federal 24-hour standard.
Barring delays due to legal challenges, the SJYAPCD estimates that attainment plans for the 2006
standard will be required by 2012 or 2013 with an attainment deadline of 2020. Measures
contained in the 2003 PM IO Plan will also help reduce PM2.S levels and will provide progress
toward attainment untit new measures are implemented for the PM2.S Plan, if needed.
State PM IO standards have no attainment planning requirements, but air districts must demonstrate
that all measures feasible for the area have been adopted.
Rules Applicable to the Project
The SJYAPCD rules and regulations that apply to this project include but are not limited to the
following:
• SJYAPCD 20 I0 - Permits Required- The purpose of this rule is to require any person
constructing, altering, replacing or operating any source operation which emits, may emit,
or may reduce emissions to obtain an Authority to Construct or a Permit to Operate.
• SJYAPCD Rule 2201 - New and Modified Stationary Source Review. The purpose of this
rule is to provide for the review of new and modified Stationary Sources of air pollution
and to provide mechanisms including emission trade-offs by which Authorities to
Construct such sources may be granted, without interfering with the attainment or
maintenance of Ambient Air Quality Standards; and ensure no net increase in emissions
above specified thresholds from new and modified Stationary Sources of all nonattainment
pollutants and their precursors.
Michael Brandman Associates S:\Clienl PN-JN\3633 Selma DRTSIFinal Air StudyI36330001_AirQualityReport.doc
17

Selma Disposal and Recycling and Transfer Station - Selma, California Air Quality Impact Analysis Report Setting
• SlVAPCD Rule 4102 - Nuisance. The purpose of this rule is to protect the health and
safety of the public, and applies to any source operation that emits or may emit air
contaminants or other materials. Odor emissions are subject to the rule.
• SlVAPCD Rule 4105 Commercial Offsite Multiuser Hazardous Waste and Nonhazardous
Waste Disposal Facilities. This rule requires the submittal of a permit to operate and plans
to ensure the facility complies with applicable rules and avoids the creation of nuisance
odors.
• SlVAPCD Rule 4641 - Cutback, Slow Cure, and Emulsified Asphalt, Paving and
Maintenance Operations. The purpose of this rule is to limit VOC emissions from asphalt
paving and maintenance operations. If asphalt paving wiU be used, then the paving
operations will be subject to Rule 4641.
• SlVAPCD Regulation VIII - Fugitive PM IO Prohibitions. Rule 8011-8081 are designed to
reduce PM IO emissions (predominantly dust/dirt) generated by human activity, including
construction and demolition activities, road construction, bulk materials storage, paved and
unpaved roads, carryout and trackout, etc. Among the Regulation VIII Rules applicable to
the project are the foUowing:
- Rule 8011 - General Requirements
- Rule 8021 - Construction, Demolition, Excavation, Extraction and Other
Earthmoving Activities. The purpose of this rule is to limit fugitive dust emissions
from earthmoving activities through a combination of opacity limits, equipment and
activity prohibitions, and dust-suppressing requirements. A Dust Control Plan will
be required for this project.
- Rule 8031 - Bulk Materials
- Rule 8041 - Carryout and Trackout
- Rule 8051 - Open Areas
- Rule 8061 - Paved and Unpaved Roads
- Rule 8071 - Unpaved Vehicle/Equipment Traffic Areas. The purpose of this rule is
to limit dust emissions from travel on unpaved parking areas. If the project exceeds
the applicability threshold of25 daily vehicle trips by vehicles with three or more
axles, control requirements listed in the rule must be met.
City of Selma
The City of Selma is the local government with the authority over land use decisions for this
project. The project is covered by the City of Selma General Plan, which is currently being
updated. The updated Selma General Plan will cover a 31 square mile Planning Area which
encompasses the City of Selma, the Sphere ofInfluence (SOl) and unincorporated land outside
the SOl within Fresno County (Selma 2008). All lands outside of the City's boundary are
regulated by the Fresno County General Plan and zoning designations. The updated General Plan
Michael Brandman Associates S:\Clienl PN-JN\3633 Se1ma DRTS\Final Air Study\3633000I_AirQualityReport.doc
18

Selma Disposal and Recycling and Transfer Station - Selma, California Air Quality Impact Analysis Report Setting
will include the goal to protect the health and welfare of Selma residents by promoting
development that is compatible with air quality standards. Several objectives will be included in
the updated General Plan to accomplish the above-stated goal, including: 1) ensuring consistent
and accurate procedures for evaluating the air quality impacts of new project, 2) developing
mitigation measures to minimize stationary and area source emissions, 3) developing
transportation systems that minimize vehicle delay and air pollution, 4) developing consistent and
accurate procedures for mitigating transportation emissions from new and existing projects, 5)
encouraging alternative modes of transportation including pedestrian, bicycle, and transit usage
and 6) encouraging energy efficient building designs and transportation systems to conserve
energy and reduce air emissions. Additionally, the updated General Plan will include the
following policies and standards that may be applicable to the project (Selma 2008):
Policy 5.19 Coordinate with other local and regional jurisdictions, including the SJVAPCD
and the CARB, in the development of regional and county clean air plans and
incorporate the relevant provisions of those plans into City planning and project
review procedures. Also coordinate with the SJVAPCD and ARB in:
• Enforcing the provisions of the California and Federal Clean Air Acts, State
and regional policies, and established standards for air quality;
• Developing consistent procedures for evaluating project-specific and
cumulative air quality impacts of projects.
Policy 5.20 Require area and stationary source projects that generate significant amounts of
air pollutants to incorporate air quality mitigation in their design, including:
• The use of best available and economically feasible control technology for
stationary industrial sources
Policy 5.23 Encourage land use development to be located and designed to conserve air
quality and minimize direct and indirect emissions of air contaminants by doing
the following where feasible:
• Locate air pollution point sources, such as manufacturing and extracting
facilities in areas designated for industrial development and separated from
residential areas and sensitive receptors (e.g., homes, schools, and hospitals);
establish buffer zones (e.g., setbacks, landscaping) within residential and
other sensitive receptor uses to separate those uses from highways, arterials,
hazardous material locations and other sources of air pollution or odor.
Michael Brandman AssocIates S:lelienl PN-JN\3633 Selma DRTSlFinal Air StudyI36330001_AirQualiryReport.doc
19

Selma Disposal and Recycling and Transfer Station - Selma. California Air Quality Impact Analysis Report Setting
City of Selma Air Quality Element
Air quality is an optional General Plan element in most of California, except in the San Joaquin
Valley where Assembly Bill (AB) 170 requires amendments to address air quality by June 30,
2009 in Fresno and Kern Counties, and June 30, 2010 in the other Valley counties. The bill
requires cities and counties to amend appropriate elements of the General Plan to include data and
analysis, goals, policies, and feasible implementation strategies to improve air quality. The City
of Selma is required to submit the air quality amendments to the SJVAPCD at least 45 days prior
to the adoption of those amendments, and the SJVAPCD then has 30 days to return comments
and advice. The SJVAPCD found that many Valley general plans already contain goals and
policies that support improved air quality. As documented above, the City of Selma will
incorporate policies in its updated General Plan that are intended to improve air quality.
2.1.3· Climate Change/Greenhouse Gas Regulation
International and Federal
International and federal agreements have been enacted to deal with global climate change issues.
In 1988, the United Nations and the World Meteorological Organization established the
Intergovernmental Panel on Climate Change to assess "the scientific, technical and
socio-economic information relevant to understanding the scientific basis of risk of human
induced climate change, its potential impacts, and options for adaptation and mitigation" (IPCC
2004).
On March 21, 1994, the U.S. joined a number of countries around the world in signing the United
Nations Framework Convention on Climate Change. Under the Convention, governments do the
following: gather and share information on greenhouse gas emissions, national policies, and best
practices; launch national strategies for addressing greenhouse gas emissions and adapting to
expected impacts, including the provision of financial and technological support to developing
countries; and cooperate in preparing for adaptation to the impacts ofclimate change (UNFCCC
2007).
A particularly notable result of the United Nations Framework Convention on Climate Change
efforts is a treaty known as the Kyoto Protocol, which went into effect on February 16,2005.
When countries sign the treaty, they demonstrate their commitment to reduce their emissions of
greenhouse gases or engage in emissions trading. More than 170 countries are currently
participating in the Protocol. Industrialized countries are required to reduce their greenhouse gas
emissions by an average of5 percent below their 1990 levels by 2012.
The reduction targets established in the Kyoto Protocol can be met by reducing domestic
greenhouse gas emissions, or by utilizing three mechanisms allowed under the Kyoto Protocol:
Emissions Trading, Joint Implementation, and the Clean Development Mechanism. Joint
Michael Brandman Associates S:IClienl PN-JN\3633 Selma DRTSlFinal Air Sludy\3633000 I_AitQualityRcport.doc
20
Selma Disposal and Recycling and Transfer Station - Selma, California Air Quality Impact Analysis Report Setting
Implementation is a mechanism for transfer ofemissions permits from one Annex B country to
another. The Clean Development Mechanism allows project-based emission reduction activities
in developing countries. Certificates are generated through this mechanism from projects that
lead to certifiable emissions reductions that would otherwise not occur.
In 1998, U.S. Vice President Al Gore symbolically signed the Protocol; however, in order for the
Protocol to be formally ratified, the U.S. Congress must approve it. Congress did not approve the
Protocol during the Clinton Administration, and the past US President, George W. Bush, did not
submit the treaty for ratification; it is unknown whether President Obama will submit the treaty
for ratification.
In October 1993, President Clinton announced his Climate Change Action Plan, which had a goal
to return greenhouse gas emissions to 1990 levels by the year 2000. This was to be accomplished
through 50 initiatives that relied on innovative voluntary partnerships between the private sector
and government aimed at producing cost-effective reductions in greenhouse gas emissions.
The U.S. EPA currently does not regulate greenhouse gas emissions from motor vehicles.
Massachusetts v. EPA (Supreme Court Case 05-1120) was argued before the U.S. Supreme Court
on November 29,2006, in which it was petitioned that EPA regulate four greenhouse gases,
including carbon dioxide, under Section 202(a)(l) of the Clean Air Act. A decision was made on
April 2, 2007, in which the Supreme Court held that petitioners have a standing to challenge the
EPA and that the EPA has statutory authority to regulate emissions of greenhouse gases from new
motor vehicles.
President Bush joined the Group of Eight (G8) 2008 Summit, which is an annual meeting
attended by the leaders of eight countries, Canada, France, Germany, Italy, Japan, Russia, the
United Kingdom, and the U.S. ofAmerica, and the President of the European Commission. The
summit resolved with a broad pledge to work toward cutting greenhouse gas emissions by 50%
by 2050. However, five developing nations at the meeting - China, India, Brazil, Mexico, and
South Africa - issued their own statement rejecting this pledge.
G-8 Leaders agreed that actions by all major economies are essential for tackling climate change
while also doing the following (WH 2008):
• Looking forward to and endorsing the positive contribution of the Major Economies
Leaders Meeting to the UN Framework Convention on Climate Change process;
• Seeking to share with all parties of the UN Framework Convention on Climate Change the
vision of moving to a low-carbon society, and together consider and adopt the goal of
achieving at least a 50 percent reduction of global emissions by 2050, recognizing the need
for contributions by all major economies;
Michael Brandman Associates S:\Clienl PN-JN\3633 Selma DRTSIFinal Air Studyl36330001_AirQualilyReport.doc
21
Selma Disposal and Recycling and Transfer Station - Selma, California Air Quality Impact Analysis Report Setting
• Recognizing that an effective post-2012 climate change regime will require all major
economies, developed and developing, to commit to meaningful mitigation actions bound
in a new international agreement;
• Welcoming the establishment of the Clean Technology Fund proposed by President Bush
in September 2007, towards which the U.S. is pledging $2 billion over 3 years;
• Committing to increasing investment in clean energy technology research and
development, with G-8 members so far pledging over $10 billion annually in direct
government-funded research and development;
• Calling for enhanced efforts in the WTO Doha Round to eliminate tariff and non-tariff
barriers to environmental goods and services with a view to significantly expanding
dissemination of clean technology and services; and
• Agreeing to maximize implementation in each country of the International Energy Agency
25 recommendations on energy efficiency and supporting the new International Partnership
for Energy Efficiency Cooperation
California
There has been significant legislative activity regarding global climate change and GHGs in
California. California Assembly Bill 1493 (Pavley), enacted on July 22, 2002, required ARB to
develop and adopt regulations that reduce GHGs emitted by passenger vehicles and light-duty
trucks. Regulations adopted by ARB would apply to 2009 and later-modeI-year vehicles. ARB
estimates that the regulation would reduce climate change emissions from the light-duty
passenger vehicle fleet by an estimated 18 percent in 2020 and by 27 percent in 2030.
California Governor Arnold Schwarzenegger announced on June I, 2005, through Executive
Order S-3-05, the following GHG emission reduction targets:
I) by 2010, reduce greenhouse gas emissions to 2000 levels;
2) by 2020, reduce greenhouse gas emissions to 1990 levels; and
3) by 2050, reduce greenhouse gas emissions to 80 percent below 1990 levels.
Climate Action Team
To meet these targets, the Governor directed the Secretary of the Cal EPA to lead a Climate
Action Team (CAT) made up of representatives from the Business, Transportation and Housing
Agency; the Department of Food and Agriculture; the Resources Agency; the Air Resources
Board; the Energy Commission; and the Public Utilities Commission.
The CAT's Report to the Governor in 2006 (2006 CAT Report) contains recommendations and
strategies to help ensure the targets in Executive Order S-3-05 are met. The 2006 CAT Report
contains existing bills, regulations, and standards that help reduce California's GHG emissions,
Michael Srandman Associates S:\C1ienl PN-JNI3633 Selma DRTSIFinal Air Study13633000 1_AirQualityReport.doc
22

Selma DIsposal and Recycling and Transfer StatIon - Selma, Callfomla Air Quality Impact Analysis Report Setting
including new strategies that can be implemented by ARB and other California agencies to help
reduce California's emissions to 1990 levels in 2020. The 2006 CAT Report lists the
recommendation for emission reduction strategies to be implemented in the "next two years" for
the public agencies involved in the CAT. As an example, the 2006 CAT Report contains the
following possible measure: ARB could ban the retail sale of hydrofluorocarbons in small cans.
It is important to understand that compliance with all applicable state standards and regulations is
a requirement. As such, this Project would comply with all applicable laws and standards as they
are adopted.
The majority of measures identified in the 2006 CAT Report are directed at the major sources of
operational emissions for typical development projects, such as building efficiency, Smart Land
Use, and Intelligent Transportation Systems. Additionally, measures such as improvements to
cement manufacturing and manure management do not apply to the Project. None of the
measures identified in the 2006 CAT report apply to the construction of the Project.
A832
Also in 2006, the California State Legislature adopted AB 32, the California Global Warming
Solutions Act of 2006, which charged ARB to develop regulations on how the State would
address global climate change. AB 32 focuses on reducing GHG emissions in California.
Greenhouse gases, as defined under AB 32, include carbon dioxide, methane, nitrous oxide,
HFCs, PFCs, and SF6. AB 32 requires that GHGs emitted in California be reduced to 1990 levels
by the year 2020.
Under AB 32, ARB is the state agency charged with monitoring and regulating sources of
emissions of GHGs that cause global wanning in order to reduce emissions of GHGs. AB 32
requires that by January I, 2008, ARB must detennine what the statewide GHG emissions level
was in 1990, and it must approve a statewide GHG emissions limit so it may be applied to the
2020 benchmark. On December 6,2007, ARB adopted the 1990 greenhouse gas emission
inventory/2020 emissions limit of 427 million metric tons of carbon dioxide equivalent
(MMTC02e).
The 2006 CAT Report contains baseline emissions as estimated by ARB and the California
Energy Commission. The emission reduction strategies reduce GHG emissions to the targets
contained in AB 32; the 2006 CAT Report is consistent with AB 32.
S897
SB 97 was passed in August 2007. SB 97 indicates that Section 21083.05 will be added to the
Public Resources Code, "(a) On or before July 1,2009, the Office of Planning and Research shall
prepare, develop, and transmit to the Resources Agency guidelines for the mitigation of
greenhouse gas emissions or the effects of greenhouse gas emissions as required by this division,
including, but not limited to, effects associated with transportation or energy consumption. (b)
Michael Brandman Associates S:\Clienl PN-JN\36JJ Selma DRTSIFinal Air Study\J6JJOO01_AiJQualityReport.doc
23

Selma Disposal and Recycling and Transfer Station - Selma, California Air Quality Impact Analysis Report Setting
On or before January 1,20 I0, the Resources Agency shall certify and adopt guidelines prepared
and developed by the Office of Planning and Research pursuant to subdivision (a)." Section
21097 is also added to the Public Resources Code and indicates that the failure to analyze
adequately the effects of GHGs in a document related to the environmental review of a
transportation project funded under the Highway Safety, Traffic Reduction, Air Quality, and Port
Security Bond Act of 2006 does not create a cause of action for a violation. However, SB 97
does not safeguard non-transportation-funded projects from being challenged in court for
omitting a global climate change analysis.
Governor's Office of Planning and Research
The Governor's Office of Planning and Research (OPR) published a technical advisory on CEQA
and Climate Change, as required under SB 97, on June 19,2008. The guidance did not include a
suggested threshold, but stated that the OPR has asked ARB to "recommend a method for setting
thresholds which will encourage consistency and uniformity in the CEQA analysis of greenhouse
gas emissions throughout the state." The OPR does recommend that CEQA analyses include the
following components:
• Identify greenhouse gas emissions
• Determine significance
• Mitigate impacts
The OPR has also started tracking environmental documents that contain GHG analysis and
mitigation measures. The website ..www.ceqamap.com.. contains the list of documents in
electronic form and is maintained by CEQAdocs.com.
In accordance with its charge under Public Resource Code section 21083.05 (added to CEQA by
SB 97), the OPR released its "Preliminary Draft CEQA Guideline Amendments for Greenhouse
Gas Emssions" on January 8, 2009. The Draft GHG Guidelines fit within the existing CEQA
framework by amending existing Guidelines to reference climate change.
On April 13, 2009, OPR submitted to the Secretary for Natural Resources its proposed
amendments to the state CEQA Guidelines for greenhouse gas emissions, as required by Senate
Bill 97 (Chapter 185,2007). These proposed CEQA Guideline amendments would provide
guidance to public agencies regarding the analysis and mitigation of the effects of greenhouse gas
emissions in draft CEQA documents. The Natural Resources Agency will conduct formal
rulemaking in 2009, prior to certifying and adopting the amendments, as required by Senate Bill
97.
The Draft GHG Guidelines fit within the existing CEQA framework by amending existing
Guidelines to reference climate change. Following are points of note about the Draft GHG
Guidelines:
Michael Brandman Associates S:\Clienl PN-JN\3633 Selma DRTSlFinal Air StudyI36330001_AirQualityReport.doc
24

Selma Disposal and Recycling and Transfer Station - Selma, Callfomla Air Quality Impact Analysis Report Setting
• Significance determination. Although the new language is an improvement compared to
the prior version, anyone hoping for real clarity on how to assess whether a project's
climate change impact is "significant" will be disappointed. The Draft GHG Guidelines
discuss vague qualitative standards for determining significance, such as (i) the extent to
which the project may increase or reduce GHG emissions when compared to the existing
setting, (ii) whether the emissions exceed a threshold of significance that the lead agency
determines applies to the project, or (iii) the extent to which the project complies with
adopted regulations or requirements adopted to implement a plan to mitigate or reduce
GHG emissions. Current CEQA documents frequently utilize similar standards, but
consistently applying them in practice has proved elusive.
• Quantifying emissions. The Draft GHG Guidelines clarify that the lead agency must make
a "good-faith effort" to "describe, calculate or estimate" the amount ofGHG emissions
resulting from a project. The Draft GHG Guidelines recognize that no established
methodologies for quantifying climate change emissions exist and, as a consequence, lead
agencies have the discretion to choose among methodologies, including choosing between
quantifying a project's GHG emissions or taking a more qualitative approach. This
language is an improvement to the prior version of the Draft GHG Guidelines, which,
perhaps more broadly, required a lead agency to describe the GHG emissions "associated
with" a project.
• Wide-ranging mitigation measures. The Draft GHG Guidelines suggest that lead agencies
consider a range of feasible measures to mitigate GHG emissions, including measures that
are within an existing plan or GHG mitigation program, green building features and design,
sequestering carbon, off-site mitigation, or the purchase of offsets.
• Cumulative impacts. The Draft GHG Guidelines suggest that the traditional cumulative
impacts analysis applies to climate change. Practitioners have struggled to fit global
climate change within the traditional cumulative impacts analysis because this requires that
the scope of the other "cumulative" projects encompass those contributing to the same
problem (e.g., other local projects for traffic impacts, projects in the same air basin for air
impacts). In the global climate change context, a cumulative impacts analysis could
conceivably include every other project in the world. The Draft GHG Guidelines clarify
that the climate change cumulative impacts analysis need only include a summary of
projections of other projects contained in an adopted local, regional, or statewide plan,
including a general plan, regional transportation plan, or greenhouse gas reduction plan.
• Tiering and Greenhouse Gas Reduction Plans. The Draft GHG Guidelines, as well as
OPR's letter to the Resources Agency transmitting the guidelines, clearly endorse the
practice of tiering CEQA documents when analyzing GHG emissions. While they
recognize that tiering off programmatic documents may generally be useful for the analysis
of GHG emissions, the Draft GHG Guidelines specifically focus on tiering off an EIR
Michael Brandman Associates S:\Clienl PN·JN\3633 Selma DRTS\Final Air Study\3633000 I_AirQualityReport.doc
25

ARB
Under AB 32, ARB published its Final Expanded List of Early Action Measures to Reduce
Greenhouse Gas Emissions in California. Discrete early action measures are currently underway
or are enforceable by January I, 20 IO. Early action measures are regulatory or non-regulatory
and are currently underway or to be initiated by ARB in the 2007 to 2012 timeframe. ARB has
44 early action measures that apply to the transportation, commercial, forestry, agriculture,
cement, oil and gas, fire suppression, fuels, education, energy efficiency, electricity, and waste
sectors. Of the 44 early action measures, nine are considered discrete early action measures, as
they are regulatory and enforceable by January I, 20 IO. ARB estimates that implementation of
alI 44 recommendations will result in reductions of at least 42 MMTC02e by 2020, representing
approximately 25 percent of the 2020 target. Note that ARB currently defers measures involving
general plans and CEQA. A review of ARB's reduction measures that are underway, or to be
initiated by ARB in the 2007 to 2012 timeframe, indicates that none of the measures would be
applicable to the Project.
California is also exploring the possibility of cap and trade systems for GHGs. The Market
Advisory Committee to ARB published draft recommendations for designing a GHG cap and
trade system for California.
The ARB released a Climate Change Proposed Scoping Plan in October 2008. The Plan
"proposes a comprehensive set of actions designed to reduce overall greenhouse gas emissions in
California, improve our environment, reduce our dependence on oil, diversify our energy sources,
save energy, create new jobs, and enhance public health" (ARB 2008). The Plan was presented
to the ARB Board and approved at its meeting in December 2008. The measures in the Scoping
Plan approved by the ARB Board will be developed over the next two years and be in place by
2012.
Attorney General Mitigation
The Office of the Cali fornia Attorney General maintains a list of CEQA Mitigations for Global
Warming Impacts on its website. The Attorney General's Office has listed some examples of
types of mitigations that local agencies may consider to offset or reduce global warming impacts
from a project. The Attorney General's Office states that the lists are examples and not intended
to be exhaustive but instead are provided as measures and policies that could be undertaken.
Moreover, the measures cited may not be appropriate for every project, so the Attorney General
suggests that the lead agency should use its own informed judgment in deciding which measures
it would analyze, and which measures it would require, for a given project. The mitigation
Michael Brandman Associates S:lelienl PN-JN\3633 Selma DRTSIFinaJ Air SludyI36330001_AirQuaJilyReport.doc
26

Selma Disposal and Recycling and Transfer Station - Selma, California Air Quality Impact Analysis Report Setting
measures are divided into two groups: general1y applicable measures and general plan measures.
The Attorney General presents "general1y applicable" measures in the fol1owing areas:
• Energy efficiency
• Renewable energy
• Water conservation and efficiency
• Solid waste measures
• Land use measures
• Transportation and motor vehicles
• Carbon offsets
This project does not involve the development of a general plan, nor does it contain the land uses
targeted by the Attorney General's measures.
Executive Order 5-01-07
Executive Order S-01-07 was enacted by the Governor on January 18,2007. The order mandates
that a statewide goal shall be established to reduce the carbon intensity of California's
transportation fuels by at least 10 percent by 2020. It also requires that a Low Carbon Fuel
Standard for transportation fuels be established for California.
SB 375 passed the Senate on August 30, 2008 and was signed by the Governor on September 30,
2008. According to SB 375, the transportation sector is the largest contributor ofgreenhouse gas
emissions and contributes over 40 percent of the greenhouse gas emissions in California and
automobiles and light trucks alone contribute almost 30 percent. SB 375 indicates that
greenhouse gases from automobiles and light trucks can be reduced by new vehicle technology
but significant reductions from changed land use patterns and improved transportation are
necessary.
SB 375 states, "Without improved land use and transportation policy, California wil1 not be able
to achieve the goals of AB 32". SB 375 does the fol1owing: I) requires metropolitan planning
organizations to include sustainable community strategies in their regional transportation plans
for reducing greenhouse gas emissions, 2) aligns planning for transportation and housing, and 3)
creates specified incentives for the implementation ofthe strategies. Concerning CEQA, SB 375,
section 21159.28 states the fol1owing:
(a) If a residential or mixed-use residential project is consistent with the use designation,
density, building intensity, and applicable policies specified for the project area in either
a sustainable communities strategy or an alternative planning strategy, for which the State
ARB pursuant to subparagraph (I) of paragraph (2) of subdivision (b) of Section 65080 of
the Government Code has accepted the metropolitan planning organization's
detennination that the sustainable communities strategy or the alternative planning
Michael Brandman Associates S:lelienl PN·JNI3633 Selma DRTSlFinal Air Studyl36330001_AirQualityRcport.doc
27

sualegy WOUIO, II lmplt:mt:llU;;U, etl.:lJJt:vt: U1t: ~rt:t:lJJJuu:;t: get:; t:UJJ:;:;JUIJ rt:UU~LJuJJ lClfgt:l:;
and if the project incorporates the mitigation measures required by an applicable prior
environmental document, then any findings or other detenninations for an exemption, a
negative declaration, a mitigated negative declaration, a sustainable communities
environmental assessment, an environmental impact report, or addenda prepared or
adopted for the project pursuant to this division shall not be required to reference,
describe, or discuss (I) growth inducing impacts; or (2) any project specific or
cumulative impacts from cars and light-duty truck trips generated by the project on global
wanning or the regional transportation network.
(b) Any environmental impact report prepared for a project described in subdivision (a) shall
not be required to reference, describe, or discuss a reduced residential density alternative
to address the effects of car and light-duty truck trips generated by the project.
(c) "Regional transportation network," for purposes of this section, means all existing and
proposed transportation system improvements, including the state transportation system,
that were included in the transportation and air quality confonnity modeling, including
congestion modeling, for the final regional transportation plan adopted by the
metropolitan planning organization, but shall not include local streets and roads. Nothing
in the foregoing relieves any project from a requirement to comply with any conditions,
exactions, or fees for the mitigation of the project's impacts on the structure, safety, or
operations of the regional transportation network or local streets and roads.
(d) A residential or mixed-use residential project is a project where at least 75 percent of the
total building square footage of the project consists of residential use or a project that is a
transit priority project as defined in Section 21155.
California Air Pollution Control Officers Association White Paper
The California Air Pollution Control Officers Association has released a white paper entitled
"CEQA & Climate Change," which discussed three alternative thresholds, including a no
significance threshold, a zero increase threshold, and a non-zero threshold, as well as multiple
analysis options. The white paper is a resource guide developed to support local governments,
and details tools for GHG assessment, emission models, and mitigation strategies to reduce
potentially significant GHG emissions from a project.
Michael Brandman Associates S;\Clienl PN-JN\3633 Selma DRTSlFinal Air StudyI36330001_AirQualityReport.doc
28

Selma Disposal and Recycling and Transfer Station - Selma, Callfomla Air Quality Impact Analysis Report Setting
Local Public Agencies
The City of Selma and Fresno County do not currently have formal greenhouse gas emissions
reduction plans or recommended emission threshold for determining significance associated with
greenhouse gas emissions from development projects.
SJVAPCD Climate Action Plan
On August 21, 2008, the SJVAPCD Governing Board approved the District's Climate Change
Action Plan with the following goals and actions:
Goals:
1. Assist local land-use agencies with California Environmental Quality Act (CEQA) issues
relative to projects with Greenhouse Gas (GHG) emissions increases.
2. Assist Valley businesses in complying with mandates of AB 32 (Global Warming
Solutions Act of 2006).
3. Ensure that climate protection measures do not cause increase in toxic or criteria
pollutants that adversely impact public health or environmental justice communities.
Actions:
1. Authorize the Air Pollution Control Officer to develop GHG significance threshold(s) or
other mechanisms to address CEQA projects with GHG emissions increases. Begin the
requisite public process, including public workshops, and develop recommendations for
Governing Board consideration in the spring of2009.
2. Authorize the Air Pollution Control Officer to develop necessary regulations and
instruments for establishment and administration of the San Joaquin Valley Carbon
Exchange Bank for voluntary GHG reductions created in the Valley. Begin the requisite
public process, including public workshops, and develop recommendations for
Governing Board consideration in spring 2009.
3. Authorize the Air Pollution Control Officer to enhance the District's existing criteria
pollutant emissions inventory reporting system to allow businesses subject to AB32
emission reporting requirements to submit simultaneous streamlined reports to the
District and the state of California with minimal duplication.
4. Authorize the Air Pollution Control Officer to develop and administer voluntary GHG
emission reduction agreements to mitigate proposed GHG increases from new projects.
5. Direct the Air Pollution Control Officer to support climate protection measures that
reduce GHG emissions as well as toxic and criteria pollutants. Oppose measures that
Michael Brandman Associates S:\Client PN-JN\3633 Selma DRTSlFinal Air SludyI36330001_AirQualityReport.doc
29

Selma Disposal and Recycling and Transfer Station - Selma, Callfomla Air Quality Impact Analysis Report Setting
result in a significant increase in toxic or criteria pollutant emissions in already impacted
area.
San Joaqu in Valley Carbon Exchang e
The SJVAPCD has initiated work on the San Joaquin Valley Carbon Exchange, which will be
designed to quantify, verify, and track voluntary GHG emissions reductions generated within the
San Joaquin Valley. The public process will begin in the fourth quarter of2008 that will include
a scoping meeting and public workshops, and it will culminate with a public hearing before the
SJVAPCD Governing Board in the summer of2009. At that time, the District staffwill present
recommendations to the Governing Board on all necessary components, including applicable
regulations for administering the Carbon Exchange Bank. The SJVAPCD's Carbon Exchange
Bank will be a voluntary program allowing Valley businesses and entities to obtain carbon credits
for voluntary projects that generate early reductions in greenhouse gas emissions in advance of
regulatory requirements. The program will be designed to promote and facilitate early local
reductions in the San Joaquin Valley, thereby minimizing disparate impact on environmental
justice areas in the region. These credits could then be used by Valley businesses to provide
CEQA mitigation for future growth, comply with AB 32 requirements (pending state regulations),
or sold as a commodity to others needing such credits.
2.2 - Air Quality Setting
2.2.1 - San Joaq uin Valley Air Basin (SJVAB)
The project site is located in Fresno County, which is located in the San Joaquin Valley Air Basin
(SJVAB). Regional and local air quality is impacted by topography, dominant airflows,
atmospheric inversions, location, and season. The combination of topography and inversion
layers generally prevents dispersion of air pollutants.
The SJVAB has an "inland Mediterranean" climate and is characterized by long, hot, dry
summers and short, foggy winters. Sunlight can be a catalyst in the formation of some air
pollutants (such as ozone); the SJVAB averages over 260 sunny days per year. At the Yosemite
International Airport, the closest meteorological station located approximately 3 miles southeast
of the project, the maximum daily average temperatures (approximately 98.6 degrees Fahrenheit
[OF]) occur in July. The range of daily temperature in the summer can vary as much as 30°F. The
lowest average high temperatures (approximately 54.4°F) occur in January.
The majority of rainfall in the SJVAB occurs between November and April. The Fresno
Yosemite National Airport received an average of 10.90 inches of precipitation per year during
1948 to 2007.
Topography
Michael Brandman Associates S:\Client PN-JNI3633 Selma DRTSlFinai Air StudyI36330001_AirQuaiityRepol1.doc
30

Selma Disposal and Recycling and Transfer Station - Selma, California Air Quality Impact Analysis Report Setting
The SNAB is generally shaped like a bowl. It is open in the north and is surrounded by
mountain ranges on all other sides. The Sierra Nevada mountains are along the eastern boundary
(8,000 to 14,000 feet in elevation), the Coast Ranges are along the western boundary (3,000 feet
in elevation), and the Tehachapi Mountains are along the southern boundary (6,000 to 8,000 feet
in elevation) (SJVAPCD 2002).
Dominant Airflow
Dominant airflows provide the driving mechanism for transport and dispersion of air pollution.
The mountains surrounding the SJVAB form natural horizontal barriers to the dispersion of air
contaminants. The wind generally flows south-southeast through the valley, through the
Tehachapi Pass and into the Southeast Desert Air Basin portion of Kern County (SJVAPCD
2006). As the wind moves through the SJVAB, it mixes with the air pollution generated locally,
generally transporting air pollutants from the north to the south in the summer and in a reverse
flow in the winter (SJVAPCD 2006a).
Inversions
Generally, the temperature of air decreases with height, creating a gradient from warmer air near
the ground to cooler air at elevation. This gradient of cooler air over warm air is known as the
environmental lapse rate. Inversions occur when warm air sits over cooler air, trapping the cooler
air near the ground. These inversions trap pollutants from dispersing vertically and the mountains
surrounding the San Joaquin Valley trap the pollutants from dispersing horizontally. Strong
temperature inversions occur throughout the SJVAB in the summer, fall, and winter (SJVAPCD
2006a). Daytime temperature inversions occur at elevations of2,000 to 2,500 feet above the San
Joaquin Valley floor during the summer and at 500 to 1,000 feet during the winter. The result is a
relatively high concentration of air pollution in the valley during inversion episodes. These
inversions cause haziness, which in addition to moisture may include suspended dust, a variety of
chemical aerosols emitted from vehicles, particulates from wood stoves, and other pollutants.
Location and Season
Because of the prevailing daytime winds and time-delayed nature of ozone, concentrations are
highest in the southern portion of the SJVAB, such as around Bakersfield. Summers are often
periods of hazy visibility and occasionally unhealthful air, while winter air quality impacts tend to
be localized and can consist of (but are not exclusive to) odors from agricultural operations; soot
or smoke around residential, agricultural, and hazard-reduction woodburning; or dust near
mineral resource recovery operations.
2.2.2 • Regional Air Quality
Background
Michael Brandman Associates S:\Client PN-JN\3633 Selma DRTSIFinal Air Study136330001_AirQualityReport.doc
31

Selma Disposal and Recycling and Transfer Station - Selma, California Air Quality Impact Analysis Report Setting
An emissions inventory is an account of the amount of air pollution generated by various
emissions sources and is organized by source categories: mobile, stationary, areawide, and natural
sources.
Mobile sources include on-road sources and off-road mobile sources. The on-road emissions
inventory, which includes automobiles, motorcycles, and trucks, is an estimation of population,
activity, and emissions of the on-road motor vehicles used in California. The off-road emissions
inventory is an estimate of the population, activity, and emissions of various off-road equipment,
including recreational vehicles, farm and construction equipment, lawn and garden equipment,
forklifts, locomotives, and commercial marine and marine pleasure craft.
Stationary sources are large, fixed sources of air pollution, such as power plants, refineries, and
manufacturing facilities. Stationary sources also include aggregated point sources. These include
many small point sources, or facilities, that are not inventoried individually but are estimated as a
group and reported as a single-source category. Examples include gas stations and dry cleaners.
Each of the local air districts estimates the emissions for the majority ofstationary sources within
its jurisdiction.
Areawide sources include source categories associated with human activity, and these emissions
take place over a wide geographic area. Consumer products, fireplaces, farming operations (such
as tilling), and unpaved road dust are examples of areawide sources.
Natural, or non-anthropogenic, sources include source categories with naturally occurring
emissions such as wildfires and biogenic emissions from plants.
Fresno County Emissions Inventory
CARB publishes emissions inventory data for air districts and counties. Table 5 provides a
summary of emissions for Fresno County. According to the 2006 data (the most recent year
available) for Fresno County, stationary sources contributed only minimal amounts of ROG, CO,
NOx and both PMIO and PM2.5. Over 40 percent of the ROG emissions came from natural
(non-anthropogenic) sources such as wildfires and biogenic emissions (including agricultural,
natural, and urban sources). The majority ofthe remaining ROG inventory was distributed
between areawide and mobile sources, accounting for approximately 24 percent and 23 percent,
respectively. Within the areawide category, most of the ROG emissions were generated by
farming operations.
For the CO inventory, mobiles sources accounted for approximately 66 percent of emissions, area
sources approximately 28 percent of the inventory, and natural sources for 6 percent. The 2006
NOx inventory is dominated by mobile sources (approximately 79 percent) and stationary sources
(approximately 15 percent), with natural sources and areawide sources contributing minor
amounts ofNOx.
Michael Srandman Associates S:\Clienl PN-JNI3633 Selma DRTS\Final Air StudyI36330001_AirQualityReport.doc
32
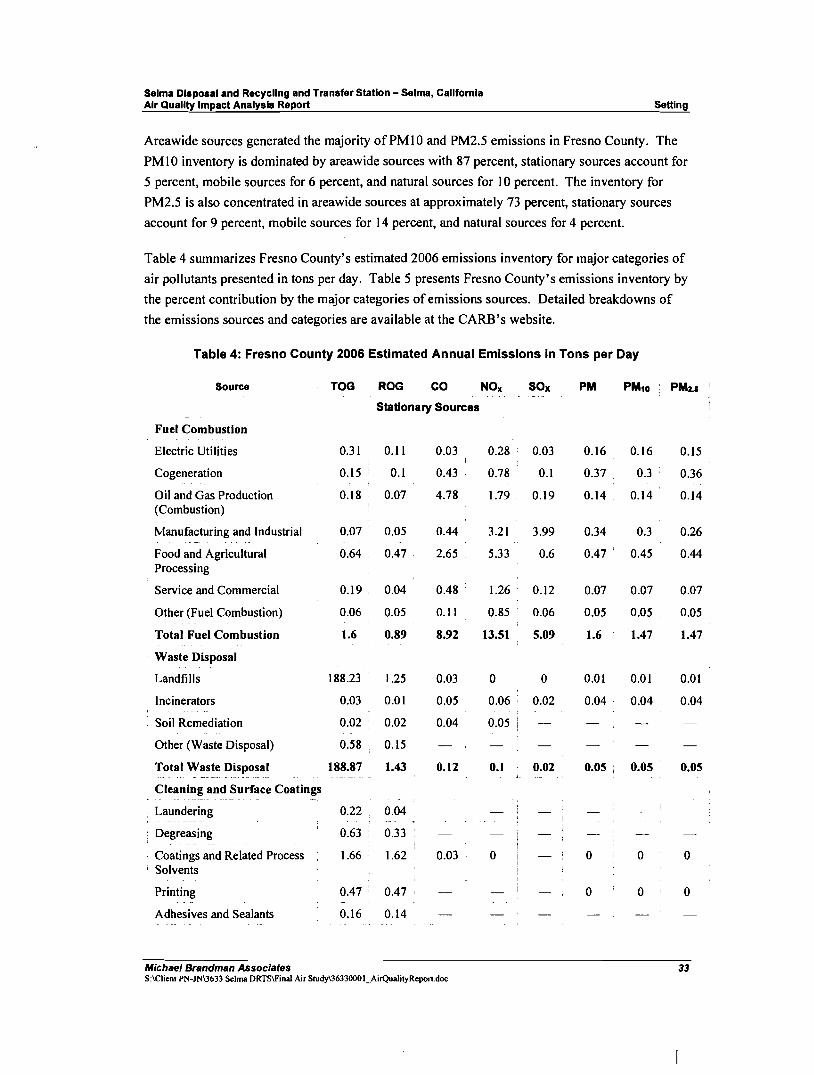
Selma Disposal and Recycling and Transfer Station - Selma, California Air Quality Impact Analysis Report Setting
Areawide sources generated the majority of PM 10 and PM2.5 emissions in Fresno County. The
PM 10 inventory is dominated by areawide sources with 87 percent, stationary sources account for
5 percent, mobile sources for 6 percent, and natural sources for 10 percent. The inventory for
PM2.5 is also concentrated in areawide sources at approximately 73 percent, stationary sources
account for 9 percent, mobile sources for 14 percent, and natural sources for 4 percent.
Table 4 summarizes Fresno County's estimated 2006 emissions inventory for major categories of
air pollutants presented in tons per day. Table 5 presents Fresno County's emissions inventory by
the percent contribution by the major categories of emissions sources. Detailed breakdowns of
the emissions sources and categories are available at the CARB's website.
Table 4: Fresno County 2006 Estimated Annual Emissions in Tons per Day
Source TOG RaG CO HOx sax PM
Stationary Sources
Fuel Combustion
Electric Utilities 0.31 0.11 0.03 0.28 0.03 0.16 0.16 0.15
Cogeneration 0.15 0.1 0.43 0.78 0.1 0.37 0.3 0.36
Oil and Gas Production 0.18 0.07 4.78 1.79; 0.19 0.14. 0.14 0.14 (Combustion)
Manufacturing and Industrial 0.07 0.05 0.44 3.21' 3.99 0.34 0.3 0.26
Food and Agricultural 0.64 0.47 2.65 5.33 0.6 0.47 0.45 0.44 Processing
Service and Commercial 0.19. 0.04 0.48 1.26 0.12 0.07 0.07 0.07
Other (Fuel Combustion) 0.06 0.05 0.11 0.85 0.06 0.05 0.05 0.05
Total Fuel Combustion 1.6 0.89 8.92 13.51 5.09 1.6 1.47 1.47
Waste Disposal
Landfills 188.23 1.25 0.Q3 o o 0.01 0.01 0.01
Incinerators 0.03 0.01 0.05 0.06 0.02 0.04 0.04 0.04
Soil Remediation 0.02 0.02 0.04 0.05
Other (Waste Disposal) 0.58! 0.15 - !
Total Waste Disposal - ._- _. _ ... _... -._".
188.87 i 1.43 0.12 0.1 0.02 0.05 i 0.05 0.05
Cleaning and Surface Coatings
Laundering 0.22 0.04
Degreasing 0.63 0.33
Coatings and Related Process 1.66 1.62 0.03 o o o o ; Solvents
Printing 0.47 0.47 o o o Adhesives and Sealants 0.16 0.14
Michael Srandman Associates S:\Clienl PN-JN\3633 Selma DRTS\Finai Air Sludy\3633000l_AirQualiIyReport.doc
33
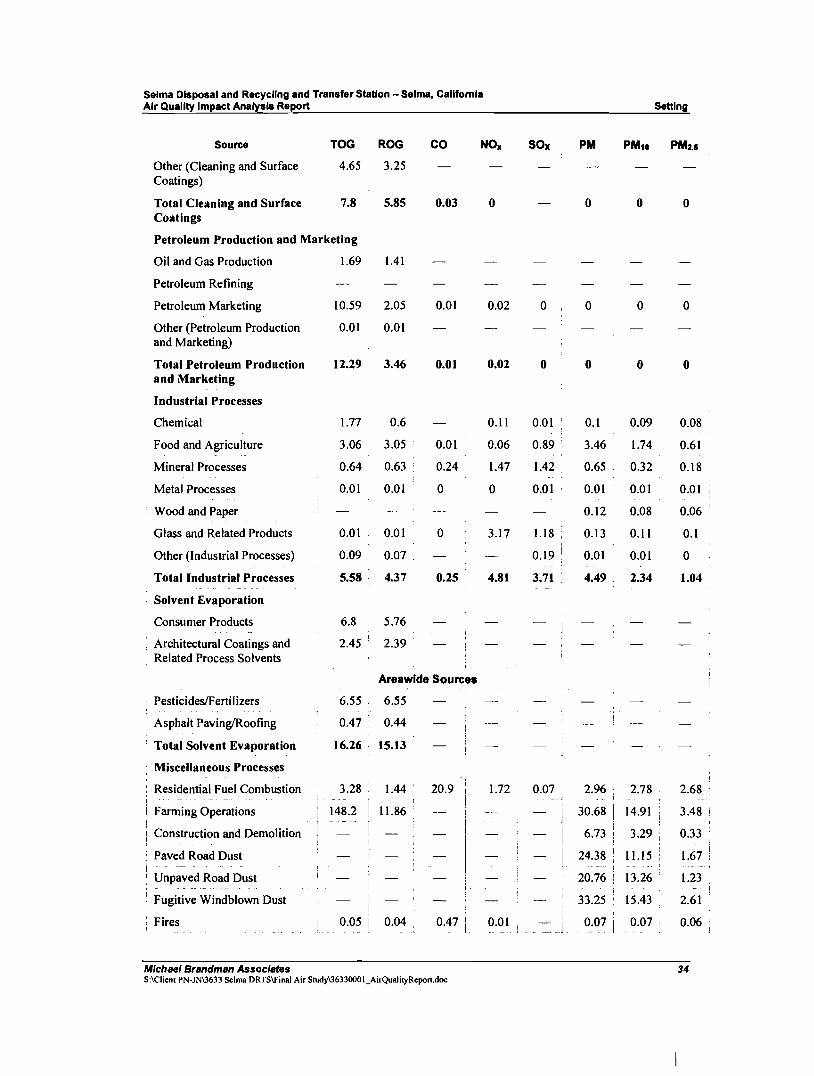
Selma Disposal and Recycling and Transfer Station - Selma, California Air Quality Impact Analysis Report
Source TOG ROG CO NOll
Other (Cleaning and Surface 4.65 3.25 Coatings)
Total Cleaning and Surface 7.8 5.85 0.03 0 Coatings
Petroleum Production and Marketing
Oil and Gas Production 1.69 1.41
Petroleum Refining
Petroleum Marketing 10.59 2.05 0.01 0.02
Other (Petroleum Production 0.01 0.01 and Marketing)
Total Petroleum Production 12.29 3.46 0.01 0.02 and Marketing
Industrial Processes
Chemical 1.77 0.6 0.11
Food and Agriculture 3.06 3.05 0.01 0.06
Mineral Processes 0.64 0.63 0.24 1.47
Metal Processes 0.01 0.01 0 0
Wood and Paper
Glass and Related Products 0.01 0.01 0 3.17
Other (Industrial Processes) 0.09 0.07
Total Industrial Processes 5.58 4.37 0.25 • 4.81
Solvent Evaporation
Consumer Products 6.8 5.76
Architectural Coatings and 2.45 2.39 Related Process Solvents
Areawide Sources
PesticideslFertilizers 6.55 6.55
Asphalt Paving/Roofing 0.47 0.44
• Total Solvent Evaporation 16.26 15.13
Miscellaneous Processes
Residential Fuel Combustion 3.28 1.44 20.9 1.72 .
Farming Operations : 148.2 I
I 11.86 -- .- . - r---~, 1
Construction and Demolition I
I
Paved Road Dust
Unpaved Road Dust
Fugitive Windblown Dust
Fires 0.05 0.04 0.47 0.01 - 1
Michael S,andman Associates S:\Clienl PN-JN\3633 Selma DRTS\FinaJ Air Study\36330001_AirQuaJilyRepon.doc
SOx
0
0
0.01
0.89
1.42 i i
0.01 i
1.18
0.19 i
3.71
0.07
_J_
Setting
PM PM10 PMu
0 0 0
0 0 0
0 0 0
0.1 0.09 0.08
3.46 1.74 0.61
0.65 0.32 0.18
0.01 0.01 0.01
0.12 0.08 0.06
0.13 0.11 0.1
0.01 0.01 0
4.49 2.34 1.04
2.96 2.78 2.68
30.68 14.91 3.48 !
3.29 . 0.336.73
24.38 ,I 11.15 1.67 - -- 1 - - -- \
20.76 i 13.26 1.23 , - !
33.25 ' 15.43 2.61
0.07 i 0.07 0.06
34

Selma Disposal and Recycling and Transfer Station - Selma, California Air Quality Impact Analysis Report Setting
Source TOG ROG CO NOx SOx PM PM,o PMu
Managed Burning and Disposal
12.86 7.51 89.24 5.25 0.45 11.24 9.98 9.12
· Cooking 0.17 0.12 1.57 l.l 0.66
Total Miscellaneous Processes
164.57 20.96 110.6 6.97 0.53 131.63 71.96 21.84
Mobile Sources
On-Road Motor Vehicles
Light Duty Passenger (LDA) 6.38 5.86 55.43 4.76 0.04 0.33 0.32 0.18
Light Duty Trucks - I (LDTI) 2.1 1.95 19.67 1.74 0.02 0.09 0.09 0.05
Light Duty Trucks - 2 (LDT2) 3.43 3.14 34.11 4.21 0.02 0.22 0.22 0.15
Medium Duty Trucks (MDV) 1.97 1.77 21.91 2.82 0.02 0.12 0.12 0.08
Light Heavy Duty Gas Trucks - I (LHDVI)
1.15 1.09 9.14 0.98 0 0.02 0.02 0.01
Light Heavy Duty Gas Trucks - 2 (LHDV2)
0.27 0.25 2.04 0.22 0 0 0 0
Medium Heavy Duty Gas Trucks (MHDV)
-
Heavy Heavy Duty Gas Trucks (HHDV)
0.67
0.2
0.64
0.19
5.37
2.82
0.44
0.41
0
0
0
0
0
0
0
0
Light Heavy Duty Diesel · Trucks - I (LHDVI)
0.03 0.03 0.16 0.78 0.01 0.01 0.01 0.01
Light Heavy Duty Diesel , Trucks - 2 (Lhdv2)
0.03 0.03 0.13 0.67 0.01 0.01 0.01 0.01
, Medium Heavy Duty Diesel • Trucks (MHDV)
0.12 0.11 0.99 4.53 0.05 0.15 0.15 0.13
Heavy Heavy Duty Diesel Trucks (HHDV)
3.91 3.43 14.1 48.41 0.4 2.19 2.19 1.92
Motorcycles (MCY) l.l8 l.ll 11.12 0.28 0 0.01 0.01 0.01
Heavy Duty Diesel Urban Buses (UB)
0.02 0.02 0.09 . 0.49 0.01 0.01 0.01 0.01
Heavy Duty Gas Urban Buses (UB)
0.02 ' 0.02 0.18 . 0.04 0 0 0 0
: School Buses (SB) 0.05 0.05 0.61 0.5 0 0.02 0.02 i 0.02
[ Other Buses (OB) I - - -
• Motor Homes (MH)
Total On-Road Motor Vehicles
i ! Other Mobile Sources !
i Aircraft
0.07
0.07
21.67
1.25
'
'
0.06 , 0.67 ;
0.06 ! 1.61 i - ,
19.8 • 180.13 !
1.11 21.2
0.26
0.2
71.73
0.42
0
0
0.57 :
0.15
0.01
0
3.2
0.05
0.01
0
3.18 •
0.05
0
0
2.59
0.04
, Trains 0.31 0.26 , 0.72 3.5~ ! O.ll 0.1 0.1 0.09
Michael Brandman Associates 35 S:\Client PN·JN\3633 Selma DRTSlFinaJ Air SlUdyI36330001_AirQuaJilyReport.doc

Selma Disposal and Recycling and Transfer Station - Selma, California Air Quality Impact Analysis Report Setting
Source TOG ROG CO NO. SOx PM PM10 PMu
Recreational Boats 2.3 2.18 7.48 0.35 0 0.14 0.13 0.09
OtT-Road RV 3.07 2.87 6.38 0.06 0.03 0.04 0.03 0.02
OtT-Road Equipment 4.78 4.28 28.84 9.99 0.07 0.68 0.67 0.6
Farm Equipment 3.17 2.74 13.1 13.37 0.11 0.83 0.83 0.76
Fuel Storage And Handling 0.82 0.82
Total Other Mobile Sources 15.7 14.26 77.73 27.77 0.48 1.83 1.8 1.62
Natural (Non-Anthropogenic) Sources
Natural Sources
Biogenic Sources 67.28 62.88
Geogenic Sources 0.05 0.05
Wildfires 1.61 1.01 14.63 0.46 0.14 . 1.55 1.49 1.26
Total Stationary Sources 216.15 16 9.33 18.45 8.82 6.15 3.86 2.56
Total Areawide Sources 180.83 36.1 i 110.6 6.97 0.53 131.63 71.96 21.84
Total Mobile Sources 37.37 . 34.06 257.86 99.5 1.05 5.03 4.98 4.21
Total Natural Sources 68.94 63.94 • 14.63 0.46 0.14 1.55 1.49 1.26
Grand Total For Fresno 503.3 150.1 392.43 125.37 10.54 144.35 82.29 29.87 i County
Source: CARB 2007a
2.2.3 - Local Air Quality
The SJVAPCD operates monitoring stations throughout the SJVAB. Existing levels of ambient
air quality and historical trends and projections ofair quality in the project area are best
documented from measurements made near the project site. The SJVAPCD operates an ambient
air monitoring station near the corner of South Riverbend and Manning Avenues in Parlier,
California, approximately 8.3 miles northeast of the project site. The Parlier ambient air
monitoring station measures 8-hour ozone, and hourly N02. Table 5 summarizes 2005 through
2008 published monitoring data. The closest PM 10 and carbon monoxide ambient air monitoring
station is located in Fresno on Drummond Avenue near the intersection of Maple and Jensen
Avenues, approximately 12.9 miles from the project site. The closest PM2.5 ambient air
monitoring station with available data is located in Fresno on Hamilton Avenue near the
intersection of Hamilton and Winery Avenue, approXimately, 19.5 miles from the project site.
Table 5: Air Quality Monitoring Summary
Air Pollutant, Averaging Time (Units) 2006 2006 2007 2008
Ozone - Paller
Max 1 Hour (ppm) 0.125 0.131 0.113 0.137
Michael Brandman Associates S:\Client PN-JN\3633 Selma DRTS\Final Air Srudy\J6330001_AirQualityReport.doc
38
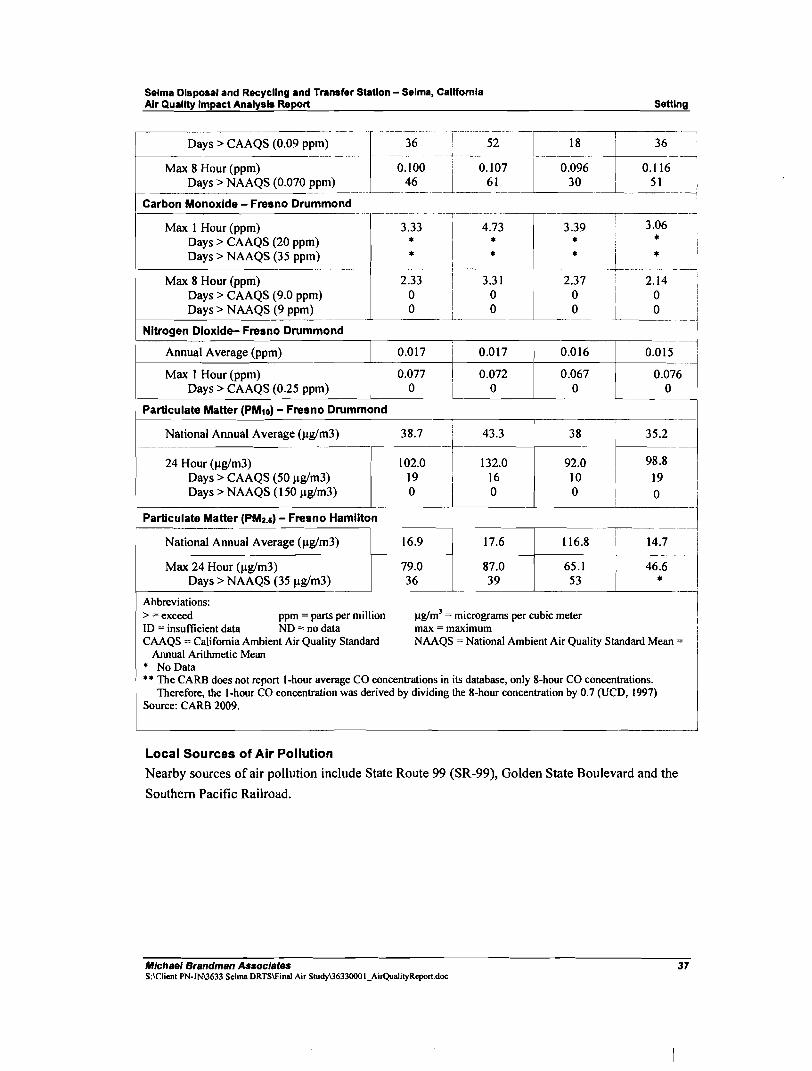
Max 8 Hour (ppm) .7 i 2.1 Ii
Days> CAAQS (9.0 ppm) 0 I
0 o i 0 i
-~--~-~Days> NAAQS (9 ppm) 0 I 0 0 ! ______L
Selma Disposal and Recycling and Transfer Station - Selma, California Air Quality Impact Analysis Report Setting
!
Nitrogen Dioxide- Fresno Drummond ! D.Ol6TQ----i
Annual Average (ppm) 0.017 0.017 0.016 0.DI5 ~i 0.077 0.072 0.067 0.076Max 1 Hour (ppm)
Days> CAAQS (0.25 ppm) 0 0 o 0 ~i
l II
16.9 17.6 116.8National Annual Average (llg/m3) 14.7
79.0 65.1 46.687.0Max 24 Hour (llg/m3) Days> NAAQS (35Ilg/m3) 36 39 53 • --,
IAbbreviations: > =exceed ppm = parts per million I-lglmJ = micrograms per cubic meter I
I ID = insufficient data ND = no data max = maximum iCAAQS =California Ambient Air Quality Standard NAAQS = National Ambient Air Quality Standard Mean = i
Annual Arithmetic Mean • No Data •• The CARB does not report I-hour average CO concentrations in its database, only 8-hour CO concentrations. I
Therefore, the I-hour CO concentration was derived by dividing the 8-hour concentration by 0.7 (UCD, 1997) Source: CARB 2009.
I !
Local Sources of Air Pollution
Nearby sources of air pollution include State Route 99 (SR-99), Golden State Boulevard and the
Southern Pacific Railroad.
Particulate Matter (PM10) - Fresno Drummond ~-
i 38.7 I 43.3National Annual Average (llg/m3)
I-------~ 102.0 132.024 Hour (llg/m3)
JI
19 16 Days> NAAQS (150 Ilg/m3) Days> CAAQS (50 Ilg/m3)
0 0 -
Particulate Matter (PMu) - Fresno Hamilton
I I
38 I 35.2
98.8 10 I 19 I
92.0~ ~ I0 I 0
I
J I
Michael Brandman Associates S:\Clienl PN-JN\3633 Selma DRTSIFinaJ Air Study\3633000 1_AiJQuaJityReporl.doc
37

Selma Disposal and Recycling and Transfer Station - Selma. California Air Quality Impact Analysis Report Setting
Sensitive Receptors Individuals who are more sensitive to toxic exposures than the general population are considered
sensitive receptors. Sensitive receptors may include young children and chronically ill
individuals. Such receptors may also reside at residences and medical care facilities such as
nursing homes and residential care facilities. The nearest sensitive receptors to the project are the
residences 0.03 mile east of the project. Other sensitive receptors include:
• Early Childhood Discovery Center, 0.80 mile northwest of the project site
• Eric White Elementary School and Washington Elementary School, 1.25 miles and 1.00
mile northwest of the project site
• Residences, 0.10 mile south and east of the project site
• Selfs Grocery Store, 0.50 mile northwest of the project site
• Office building, 0.13 mile south of the project site
2.3 • Pollutants of Concern
The criteria pollutants ofgreatest concern for the SNAB are ozone, PM I0 PM2.5. In addition,
CO is a criteria pollutant of concern in the SlYAB, due to the potential for CO hotspots on
congested roadways and at congested intersections. Also, toxic air contaminants (TACs)
constitute a category of pollutants that cause adverse health effects.
2.3.1 • Ozone
Ozone is not emitted directly into the air, but is formed by a photochemical reaction in the
atmosphere. Ozone precursors, which include ROG and NOx, react in the atmosphere in the
presence of sunlight to form ozone. Because photochemical reaction rates depend on the
intensity of ultraviolet light and air temperature, ozone is primarily a summer air pollution
problem. Often, the effects of emitted ROG and NOx are felt a distance downwind of the
emission sources. Ozone is subsequently considered a regional pollutant. Ground-level ozone is
a respiratory irritant and an oxidant that increases susceptibility to respiratory infections and can
cause substantial damage to vegetation and other materials.
Ozone can irritate lung airways and cause inflammation much like a sunburn. Other symptoms
include wheezing, coughing, pain when taking a deep breath, and breathing difficulties during
exercise or outdoor activities. People with respiratory problems are most vulnerable, but even
healthy people who are active outdoors can be affected when ozone levels are high. Chronic
ozone exposure can induce morphological (tissue) changes throughout the respiratory tract,
particularly at the junction of the conducting airways and the gas exchange zone in the deep lung.
Anyone who spends time outdoors in the summer is at risk, particularly children and other people
who are more active outdoors. Even at very low levels, ground-level ozone triggers a variety of
Michael Brandman Associates S:\Clienl PN-JN\3633 Selma DRTS\Finai Air Study\36330001_AirQuaiityReport.doc
38

Selma Disposal and Recycling and Transfer Station - Selma, California Air Quality Impact Analysis Report Setting
health problems, including aggravated asthma, reduced lung capacity, and increased susceptibility
to respiratory illnesses like pneumonia and bronchitis.
Ozone also damages vegetation and ecosystems. It leads to reduced agricultural crop and
commercial forest yields; reduced growth and survivability of tree seedlings; and increased
susceptibility to diseases, pests, and other stresses such as harsh weather. In the United States
alone, ozone is responsible for an estimated $500 million in reduced crop production each year.
Ozone also damages the foliage of trees and other plants, affecting the landscape of cities,
national parks and forests, and recreation areas. In addition, ozone causes damage to buildings,
rubber, and some plastics.
Ozone is a regional pollutant, as the reactions forming it take place over time, and it materializes
downwind from the sources of the emissions. As a photochemical pollutant, ozone is formed
only during daylight hours under appropriate conditions, but it is destroyed throughout the day
and night. Thus, ozone concentrations vary, depending upon both the time of day and the
location. Even in pristine areas, some ambient ozone forms from natural emissions that are not
controllable. This is termed background ozone. The average background ozone concentrations
near sea level are in the range of 0.015 to 0.035 parts per million (ppm), with a maximum of
about 0.04 ppm.
Reactive Organic Gases (ROG)
ROG, also known as volatile organic compounds (VOCs), are defined as any compound of
carbon, excluding carbon monoxide, carbon dioxide, carbonic acid, metallic carbides or
carbonates, and ammonium carbonate, which participate in atmospheric photochemical reactions.
ROG consist of nonmethane hydrocarbons and oxygenated hydrocarbons. Hydrocarbons are
organic compounds that contain only hydrogen and carbon atoms. Nonmethane hydrocarbons are
hydrocarbons that do not contain the unreactive hydrocarbon methane. Oxygenated hydrocarbons
are hydrocarbons with oxygenated functional groups attached.
It should be noted that there are no state or national ambient air quality standards for ROG
because they are not classified as criteria pollutants. They are regulated, however, because a
reduction in ROG emissions reduces certain chemical reactions that contribute to the formulation
of ozone. ROG is also transformed into organic aerosols in the atmosphere, which contribute to
higher PMlO levels and lower visibility.
Nitrogen Oxides (NOx)
During combustion of fossil fuels, oxygen reacts with nitrogen to produce nitrogen oxides or
NOx. This occurs primarily in motor vehicle internal combustion engines and fossil fuel-fired
electric utility facilities and industrial boilers. The pollutant NOx is a concern because it is an
ozone precursor, which means that it helps form ozone. When NOx and ROG are released in the
Michael Brandman Associates S:\Clienl PN-JN\3633 Selma DRTSIFinal Air SlUdyI36330001_AirQuaiityRepon.doc
39

Selma Disposal and Recycling and Transfer Station - Selma, California Air Quality Impact Analysis Report Setting
atmosphere, they can chemically react with one another in the presence of sunlight and heat to
form ozone. NOx can also be a precursor to PMw and PM2.S•
Because NOx and ROG are ozone precursors, the health effects associated with ozone (as
discussed above) are also indirect health effects associated with significant levels of NOx and
ROG emissions.
2.3.2 - Particulate Matter (PM10 and PM2.5)
Particulate matter (PM) is the term for a mixture of solid particles and liquid droplets found in the
air. Some particles, such as dust, dirt, soot, or smoke, are large or dark enough to be seen with
the naked eye. Others are so small they can only be detected using an electron microscope.
Particle pollution includes "inhalable coarse particles," with diameters larger than 2.5
micrometers and smaller than I0 micrometers and "fine particles," with diameters that are 2.5
micrometers and smaller. For reference, PM2.5 is approximately one-thirtieth the size of the
average human hair.
These particles come in many sizes and shapes and can be made up of hundreds of different
chemicals. Some particles, known as primary particles, are emitted directly from a source, such
as construction sites, unpaved roads, fields, smokestacks, or fires. Others form in complicated
reactions in the atmosphere from chemicals such as sulfur dioxides and nitrogen oxides that are
emitted from power plants, industrial activity, and automobiles. These particles, known as
secondary particles, make up most of the fine particle pollution in the United States.
Particle exposure can lead to a variety of health effects. For example, numerous studies link
particle levels to increased hospital admissions and emergency room visits-and even to death
from heart or lung diseases. Both long- and short-term particle exposures have been linked to
health problems. Long-term exposures, such as those experienced by people living for many
years in areas with high particle levels, have been associated with problems such as reduced lung
function, the development of chronic bronchitis, and even premature death. Short-term exposures
to particles (hours or days) can aggravate lung disease, causing asthma attacks and acute
bronchitis, and may increase susceptibility to respiratory infections. In people with heart disease,
short-term exposures have been linked to heart attacks and arrhythmias. Healthy children and
adults have not been reported to suffer serious effects from short-term exposures, although they
may experience temporary minor irritation when particle levels are elevated.
2.3.3 - Carbon Monoxide
CO is a colorless, odorless gas that is formed when carbon in fuel is not burned completely. It is
a component of motor vehicle exhaust, which contributes about 56 percent of all CO emissions
nationwide. Other non-road engines and vehicles (such as construction equipment and boats)
Michael Brandman Associates S:\C1ienl PN-JN\3633 Selma DRTS\Final Air Study136330001_AirQualityReport.doc
40

Selma Disposal and Recycling and Transfer Station - Selma, California Air Quality Impact Analysis Report Setting
contribute about 22 percent of all CO emissions nationwide. Higher levels of CO generally occur
in areas with heavy traffic congestion. In cities, 85 to 95 percent of all CO emissions may come
from motor vehicle exhaust. Other sources of CO emissions include industrial processes (such as
metals processing and chemical manufacturing), residential woodburning, and natural sources
such as forest fires. Woodstoves, gas stoves, cigarette smoke, and unvented gas and kerosene
space heaters are sources of CO indoors.
CO is a public health concern because it combines readily with hemoglobin, reducing the amount
of oxygen transported in the bloodstream. The health threat from lower levels of CO is most
serious for those who suffer from such heart-related diseases as angina, clogged arteries, or
congestive heart failure. For a person with heart disease, a single exposure to CO at low levels
may cause chest pain and reduce that person's ability to exercise; repeated exposures may
contribute to other cardiovascular effects. High levels of CO can affect even healthy people.
People who breathe high levels ofCO can develop vision problems, reduced ability to work or
learn, reduced manual dexterity, and difficulty performing complex tasks. At extremely high
levels, CO is poisonous and can cause death.
Motor vehicles are the dominant source of CO emissions in most areas. CO is described as
having only a local influence because it dissipates quickly. High CO levels develop primarily
during winter, when periods of light winds combine with the formation of ground-level
temperature inversions (typically from the evening through early morning). These conditions
result in reduced dispersion of vehicle emissions. Because CO is a product of incomplete
combustion, motor vehicles exhibit increased CO emission rates at low air temperatures. High
CO concentrations occur in areas of limited geographic size, sometimes referred to as hot spots.
Since CO concentrations are strongly associated with motor vehicle emissions, high CO
concentrations generally occur in the immediate vicinity of roadways with high traffic volumes
and traffic congestion, active parking lots, and in automobile tunnels. Areas adjacent to heavily
traveled and congested intersections are particularly susceptible to high CO concentrations.
2.3.4· Toxic Air Contaminants
A TAC is defined as an air pollutant that may cause or contribute to an increase in mortality or
serious illness, or that may pose a hazard to human health. TACs are usually present in minute
quantities in the ambient air; however, their high toxicity or health risk may pose a threat to
public health even at low concentrations. According to the California Almanac of Emissions and
Air Quality (CARB 2007), the majority of the estimated health risk from TACs can be attributed
to relatively few compounds, the most important of which is particulate matter from diesel-fueled
engines (DPM). DPM differs from other TACs in that it is not a single substance but a complex
mixture of hundreds of substances. Although DPM is emitted by diesel-fueled, internal
combustion engines, the composition of the emissions varies, depending on engine type,
operating conditions, fuel composition, lubricating oil, and whether an emission control system is
Michael Brandman Associates S:\C1ienl PN-JNU633 Selma DRTSIFinal Air Study13633000I_AiIQualityReport.doc
41

Selma Disposal and Recycling and Transfer Station - Selma, California Air Quality Impact Analysis Report Setting
present. Unlike the other TACs, no ambient monitoring data are available for DPM because no
routine measurement method currently exists. However, the CARB has made preliminary
concentration estimates based on a DPM exposure method. This method uses the CARB
emissions inventory's PM10 database, ambient PMlO monitoring data, and the results from
several studies to estimate concentrations of DPM. In addition to DPM, benzene, 1,3-butadiene,
acetaldehyde, carbon tetrachloride, hexavalent chromium, para dichlorobenzene, fonnaldehyde,
methylene chloride, and perchloroethylene pose the greatest existing ambient risk, for which data
are available, in California.
DPM poses the greatest health risk among the 10 TACs listed above. The State of California,
after a 10-year research program, detennined in 1998 (CARB 1998) that DPM from diesel-fueled
engines is a human carcinogen and that chronic (long-term) inhalation exposure to DPM poses a
chronic health risk. In addition to increasing the risk oflung cancer, exposure to diesel exhaust
can have other health effects. Diesel exhaust can irritate the eyes, nose, throat, and lungs, and it
can cause coughs, headaches, lightheadedness, and nausea. Diesel exhaust is a major source of
fine particulate pollution as well, and studies have linked elevated particle levels in the air to
increased hospital admissions, emergency room visits, asthma attacks, and premature deaths
among those suffering from respiratory problems..
2.3.5 - Greenho use Gases
Gases that trap heat in the atmosphere are greenhouse gases, analogous to the way a greenhouse
retains heat. The accumulation of greenhouse gases in the atmosphere regulates the earth's
temperature to be suitable for life. However, human activities have increased the amount of
greenhouse gases in the atmosphere. Some greenhouse gases can remain in the atmosphere for
hundreds of years. The following is a brief description of the most common greenhouse gases.
Water Vapor
Water vapor is the most abundant, important, and variable greenhouse gas. It is not considered a
pollutant; in the atmosphere, it maintains a climate necessary for life.
Ozone
Ozone is known as a photochemical pollutant and is a greenhouse gas; however, unlike other
greenhouse gases, ozone in the troposphere is relatively short-lived and, therefore, is not global in
nature. Ozone is not emitted directly into the atmosphere but is fonned by a complex series of
chemical reactions between volatile organic compounds, nitrogen oxides, and sunlight.
Aerosols
Aerosols are suspensions of particulate matter in a gas emitted into the air through burning
biomass (plant material) and fossil fuels. Aerosols can wann the atmosphere by absorbing and
emitting heat and can cool the atmosphere by reflecting light.
Michael Brandman Associates S:\Clienl PN·JN\3633 Selma DRTS\FinaJ Air Study\3633000I_AirQuaJityRepon.doc
42

Selma Disposal and Recycling and Transfer Station - Selma, California Air Quality Impact Analysis Report Setting
Carbon Dioxide
Carbon dioxide (C02) is an odorless, colorless natural greenhouse gas. C02 is emitted from
natural and anthropogenic sources. Natural sources include the following: decomposition of
dead organic matter; respiration of bacteria, plants, animals, and fungus; evaporation from
oceans; and volcanic outgassing. Anthropogenic sources are from burning coal, oil, natural gas,
and wood.
Methane
Methane is a flammable greenhouse gas. A natural source of methane is from the anaerobic
decay oforganic matter. Geological deposits, known as natural gas fields, also contain methane,
which is extracted for fuel. Other sources are from landfills, fermentation of manure, and
ruminants such as cattle.
Nitrous Oxide
Nitrous oxide, also known as laughing gas, is a colorless greenhouse gas. Nitrous oxide is
produced by microbial processes in soil and water, including those reactions that occur in
fertilizer containing nitrogen. In addition to agricultural sources, some industrial processes (fossil
fuel-fired power plants, nylon production, nitric acid production, and vehicle emissions) also
contribute to its atmospheric load.
Chlorofluorocarbons
Chlorofluorocarbons (CFCs) are nontoxic, nonflammable, insoluble, and chemically unreactive in
the troposphere (the level of air at the earth's surface). CFCs were first synthesized in 1928 for
use as refrigerants, aerosol propellants, and cleaning solvents. CFCs destroy stratospheric ozone;
therefore, their production was stopped as required by the Montreal Protocol in 1987. The project
would not emit CFCs.
Hydrofluorocarbons
Hydrofluorocarbons (HFCs) are synthetic chemicals that are used as a substitute for CFCs. Of all
the greenhouse gases, HFCs are one of three groups (the other two are perfluorocarbons and
sulfur hexafluoride) with the highest global warming potential. The global warming potential is
the potential of a gas to contribute to global warming; it is based on a reference scale with carbon
dioxide at one. HFCs are human-made for applications such as air conditioners and refrigerants.
Perfluorocarbons
Perfluorocarbons (PFCs) have stable molecular structures and do not break down through the
chemical processes in the lower atmosphere; therefore, PFCs have long atmospheric lifetimes,
between 10,000 and 50,000 years. The two main sources ofPFCs are primary aluminum
production and semiconductor manufacture. It is not anticipated that the project would emit
PFCs.
Michael Brandman Associates S:\C1ient PN-JN\3633 Selma DRTSIFinal Air Study136330001_AirQualityRepol1.doc
43

Selma Disposal and Recycling and Transfer Station - Selma, California Air Quality Analysis Report Thresholds
SECTION 3: THRESHOLDS
While the final determination of whether or not a project is significant is within the purview of
the lead agency pursuant to Section 15064(b) of the CEQA Guidelines, the SJVAPCD has
recommended air pollution thresholds to used by the lead agencies in determining whether the
proposed project could result in a significant impact. Appendix G of the CEQA Guidelines
presents recommended impact questions to assist lead agencies in evaluating environmental
impacts. Appendix G is only a suggested form, and lead agencies are free to use different
formats. The SJVAPCD thresholds will be used to assess potential air quality impacts from the
proposed project. In addition to the SJVAPCD thresholds, this document proposes a Global
Climate Change qualitative threshold. The following questions are analyzed and evaluated in this
report:
a.) Conflict with or obstruct implementation of the applicable air quality plan;
b.) Violate any air quality standard or contribute substantially to an existing or projected air
quality violation.
c.) Result in a cumulatively considerable net increase ofany criteria pollutant for which the
project region is non attainment under an applicable Federal or state ambient air quality
standard (including releasing emissions which exceed quantitative thresholds for ozone
precursors);
d.) Expose sensitive receptors to substantial pollutant concentrations or toxic air
contaminants; or
e.) Create objectionable odors affecting a substantial number of people.
If the lead agency finds that the proposed project has the potential to exceed any of the following
air pollution thresholds, the project should be considered significant.
3.1 - Regional Air Pollutants
Ozone is a regional pollutant that is not emitted directly, but forms from of a chemical reaction
between the ozone precursors NOx and ROG in the presence of sunlight. Therefore, the
SJVAPCD has set operational significance thresholds on the precursors ofozone.
According to its GAMAQI, the SJVAPCD based the ozone precursor thresholds' "significant
contribution" definition on the California Clean Air Act's offset requirements for NOx and ROG.
The ROG and NOx offset thresholds are described in SJVAPCD Rule 2201 (New and Modified
Stationary Source Review). In addition, this analysis will use a PMI0 threshold based on the
SJVAPCD's offset thresholds for PMI0 in Rule 2201.
Michael Brandman Associates S;\Clienl PN-JN\3633 Selma DRTSIFinai Air Study\36330001_AirQuaiityReport.doc
45
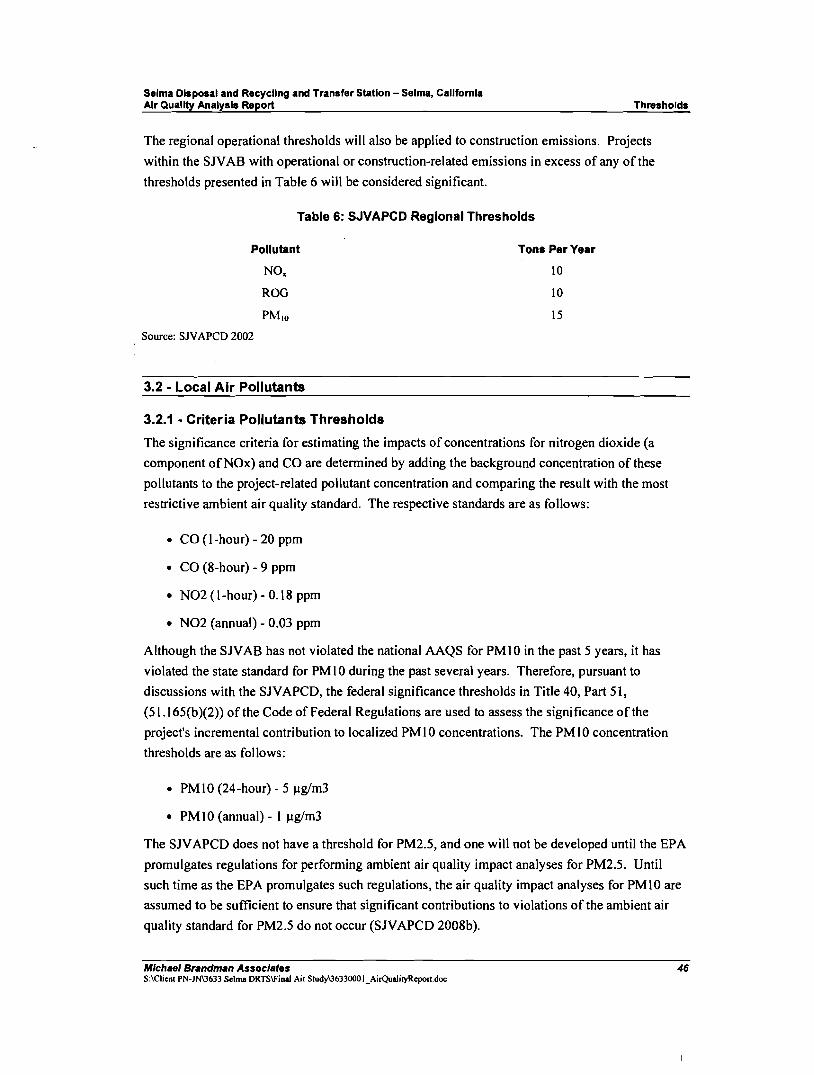
Selma Disposal and Recycling and Transfer Station - Selma, California Air Quality Analysis Report Thresholds
The regional operational thresholds will also be applied to construction emissions. Projects
within the SlVAB with operational or construction-related emissions in excess of any of the
thresholds presented in Table 6 will be considered significant.
Table 6: SJVAPCD Regional Thresholds
Pollutant Tons Per Year
NO. 10
ROO 10
PM10 15
Source: SlVAPeD 2002
3.2 • Local Air Pollutants
3.2.1 • Criteria Pollutants Thresholds
The significance criteria for estimating the impacts of concentrations for nitrogen dioxide (a
component of NOx) and CO are determined by adding the background concentration of these
pollutants to the project-related pollutant concentration and comparing the result with the most
restrictive ambient air quality standard. The respective standards are as follows:
• CO (I-hour) - 20 ppm
• CO (8-hour) - 9 ppm
• N02 (I-hour) - 0.18 ppm
• N02 (annual) - 0.03 ppm
Although the SlVAB has not violated the national AAQS for PM 10 in the past 5 years, it has
violated the state standard for PMIO during the past several years. Therefore, pursuant to
discussions with the SlVAPCD, the federal significance thresholds in Title 40, Part 51,
(51. I65(b)(2)) of the Code of Federal Regulations are used to assess the significance of the
project's incremental contribution to localized PM10 concentrations. The PM10 concentration
thresholds are as follows:
• PM I0 (24-hour) - 5 J.1g/m3
• PMIO (annual) - I J.1g/m3
The SlVAPCD does not have a threshold for PM2.5, and one will not be developed until the EPA
promulgates regulations for performing ambient air quality impact analyses for PM2.5. Until
such time as the EPA promulgates such regulations, the air quality impact analyses for PMIO are
assumed to be sufficient to ensure that significant contributions to violations of the ambient air
quality standard for PM2.5 do not occur (SlVAPCD 2008b).
Michael Brandman Associates S:\Client PN-JN\3633 Selma DRTS\Final Air Study\36330001_AirQualityReport.doc
46
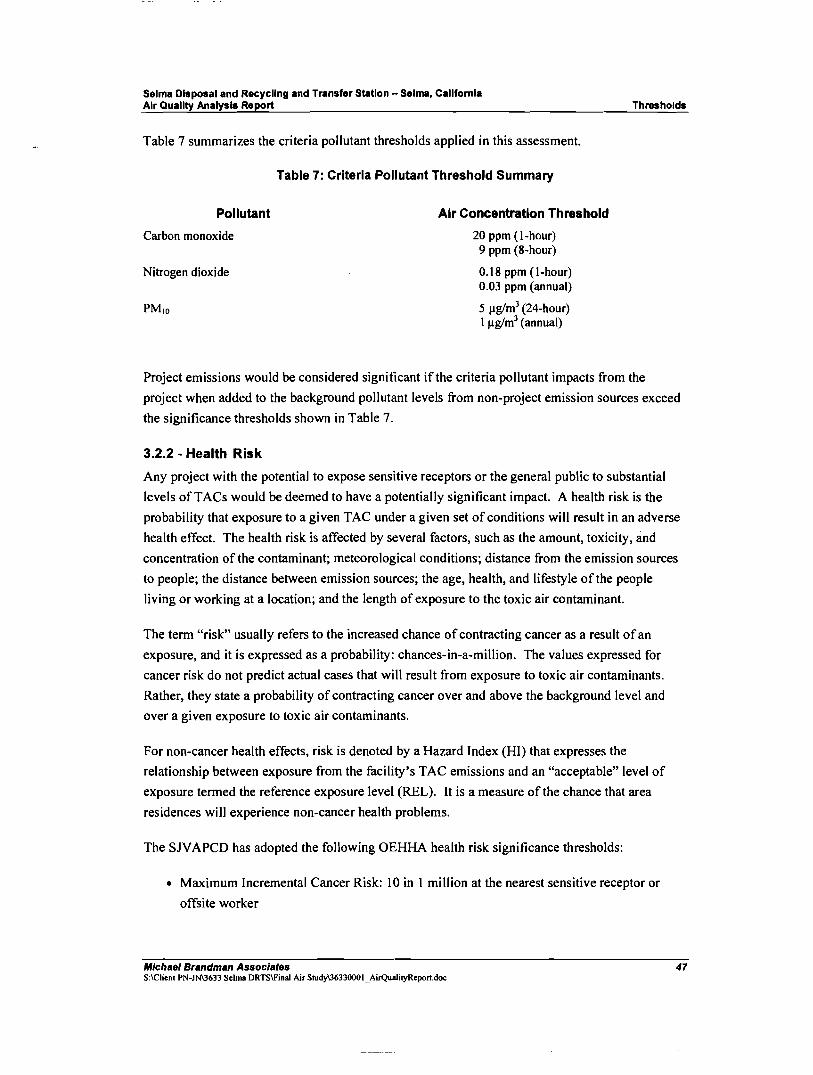
Selma Disposal and Recycling and Transfer Station - Selma, Callfomla Air Quality Analysis Report Thresholds
Table 7 summarizes the criteria pollutant thresholds applied in this assessment.
Table 7: Criteria Pollutant Threshold Summary
Pollutant Air Concentration Threshold
Carbon monoxide 20 ppm (I-hour) 9 ppm (8-hour)
Nitrogen dioxide 0.18 ppm (I-hour) 0.03 ppm (annual)
PM10 5 Ilg/mJ (24-hour) I Ilg/mJ (annual)
Project emissions would be considered significant if the criteria pollutant impacts from the
project when added to the background pollutant levels from non-project emission sources exceed
the significance thresholds shown in Table 7.
3.2.2 - Health Risk
Any project with the potential to expose sensitive receptors or the general public to substantial
levels ofTACs would be deemed to have a potentially significant impact. A health risk is the
probability that exposure to a given TAC under a given set of conditions will result in an adverse
health effect. The health risk is affected by several factors, such as the amount, toxicity, and
concentration of the contaminant; meteorological conditions; distance from the emission sources
to people; the distance between emission sources; the age, health, and lifestyle of the people
living or working at a location; and the length of exposure to the toxic air contaminant.
The term "risk" usually refers to the increased chance ofcontracting cancer as a result ofan
exposure, and it is expressed as a probability: chances-in-a-million. The values expressed for
cancer risk do not predict actual cases that will result from exposure to toxic air contaminants.
Rather, they state a probability of contracting cancer over and above the background level and
over a given exposure to toxic air contaminants.
For non-cancer health effects, risk is denoted by a Hazard Index (HI) that expresses the
relationship between exposure from the facility's TAC emissions and an "acceptable" level of
exposure termed the reference exposure level (REL). It is a measure of the chance that area
residences will experience non-cancer health problems.
The SJVAPCD has adopted the following OEHHA health risk significance thresholds:
• Maximum Incremental Cancer Risk: 10 in I million at the nearest sensitive receptor or
offsite worker
Michael Brandman Associates S:\Client PN-JN\36JJ Selma DRTS\Finai Air Studyl36JJOOOI_AirQuaiityReport.doc
47

Selma DIsposal and Recycling and Transfer Station - Selma, California Air Quality Analysis Report Thresholds
• Non-cancer Hazard Index (project increment): 1.0 or greater
The incremental cancer risk significance threshold above represents the increase in the probability
(in tenns of risk per million individuals) that an individual will contract cancer resulting from
exposure to TACs from a project over a period of 70 years for residential receptors, a 40-year
exposure for worker receptors, and a 9-year exposure for students. Thus, for example, a
residence located in an area with a cancer risk of one in one million will experience a chance of
one in one million of contracting cancer over a 70-year period from exposure to an emission
source's TAC emissions, assuming that individual lives in that area for the entire 70-year time
period.
3.2.3 - CO Hotsp ot
Project emissions may be considered significant if a CO hotspot intersection analysis detennines
that project-generated emissions cause a localized violation of the state CO I-hour standard of20
ppm, the state CO 8-hour standard of9.0 ppm, the federal CO I-hour standard of35 ppm, or the
federal CO 8 hour standard of9 ppm.
Because increased CO concentrations usually are associated with roadways that are congested
and with heavy traffic volume, the SNAPCD has established that preliminary screening can be
used to detennine with fair certainty that the effect a project has on any given intersection would
not cause a potential CO hotspot. Therefore, the SlVAPCD has established that if all project
affected intersections are negative for both of the following criteria, then the project can be said
to have no potential to create a violation of the CO standard.
• A traffic study for the project indicates that the Level of Service (LOS) on one or more
streets or at one or more intersections in the project vicinity will be reduced to LOS E or F;
or
• A traffic study indicates that the project will substantially worsen an already existing LOS
F on one or more streets or at one or more intersections in the project vicinity.
If either criterion can be associated with any intersection affected by the project, a CO Protocol
Analysis would need to be prepared to detennine significance.
3.2.4 - Nuisan ce
Any project with the potential to frequently expose members of the public to objectionable odors
will be deemed to have a significant impact. The SlVAPCD has a regulation that governs the
discharge from any source such quantities of air contaminants, which cause a nuisance or
annoyance to any considerable number of persons or to the pUblic. Creating t~e potential for a
violation of the SlVAPCD' s Nuisance Rule (Rule 4102) would create a potentially significant
impact.
Michael Brandman Associates 4B S;\Clienl PN-JN\3633 Selma DRTSIFinai Air Study\3633000I_AiIQuaiityReport.doc

Selma Disposal and Recycling and Transfer Station - Selma, California Air Quality Analysl8 Report Thresholds
While offensive odors rarely cause any physical harm, they can be very unpleasant, leading to
considerable distress among the public and often generating citizen complaints to local
governments and the SJVAPCD. Odor impacts on residential areas and other sensitive receptors
such as hospitals, day-care centers, and schools warrant the closest scrutiny, but consideration
should also be given to other land uses where people may congregate, such as recreational
facilities, worksites, and commercial areas.
3.3· Greenhouse Gas/Climate Change
There are currently no published thresholds of significance established by any state or regional
regulatory agency for measuring the impact of climate change on or from a project. CEQA
Guidelines Section 15064.7 indicates "each public agency is encouraged to develop and publish
thresholds of significance that the agency uses in the determination of the significance of
environmental effects."
On January 8, 2008, the California Air Pollution Control Officers Association (CAPCOA)
released a paper to provide a common platform of information and tools for public agencies. The
disclaimer is that it is not a guidance document but a resource to enable local decision makers to
make the best decisions they can in the face of incomplete information during a period of change.
The paper indicates that it is an interim resource and does not endorse any particular approach. It
discusses three groups of potential thresholds, including a no significance threshold, a threshold
of zero, and a non-zero threshold (CAPCOA 2008). The non-zero quantitative thresholds as
identified in the paper range from 900 to 50,000 metric tons per year.
On April 13,2009, the Governor's Office of Planning and Research (OPR) submitted to the
California Secretary for Natural Resources proposed amendments to the CEQA Guidelines for
greenhouse gas (GHG) emissions. The proposed amendments seek to address GHG emissions on
a small and large scale. Pursuant to SB97, the Resources Agency must certify and adopt the
GHG guidelines on or before January 1,2010 in a formal rulemaking procedure. After the new
Guidelines are adopted, they will affect how lead and responsible agencies analyze proposed
development in California.
OPR proposes adding a new section, CEQA Guidelines § 15064.4, to assist agencies in
determining the significance ofGHG emissions. As proposed, the new Guideline section would
allow agencies the discretion to determine whether a quantitative or qualitative analysis is best for
a particular project. Importantly, however, little guidance is offered on the crucial next step in
this assessment process - how to determine whether the project's estimated GHG emissions are
significant or cumulatively considerable.
The proposed guidelines also amend CEQA Guidelines §§ 15126.4 and 15130, which address
mitigation measures and cumulative impacts respectively. In the proposed revision, GHG
Michael Brandman Associates S:\Clienl PN-JN\3633 Selma DRTS\Final Air Study\36330001_AirQualityReport.doc
49

Selma Disposal and Recycling and Transfer Station - Selma, California Air Quality Analysis Report Thresholds
mitigation measures are referenced in general terms, but no specific measures are championed by
aPR. The proposed revision to the cumulative impact discussion requirement (§ 15130) simply
directs agencies to analyze GHG emissions in an EIR when a project's incremental contribution
of emissions may be cumulatively considerable, however it does not answer the question of when
emissions are cumulatively considerable.
aPR also proposes a Guideline section that would encourage agencies to tier and streamline the
GHG emissions analysis in certain cases. Section 15183.5 permits programmatic GHG analysis
and later project-specific tiering, as well as the preparation ofGHG Reduction Plans.
Compliance with such plans can support a determination that a project's cumulative effect is not
cumulatively considerable, according to proposed § 15183.5(b).
In addition, the amendments propose revisions to Appendix F of the CEQA Guidelines, which
focuses on Energy Conservation, and Appendix G, which includes the sample Environmental
Checklist Form. aPR would amend the Checklist to include the following questions: Would the
project generate GHG emissions, either directly or indirectly, that may have a significant impact
on the environment? And, would the project conflict with any applicable plan, policy or
regulation of an agency adopted for the purpose of reducing the emissions of GHG?
As stated previously, there are currently no published thresholds of significance established by
any State or regional regulatory agency for measuring the impact of climate change on or from a
project. CARB has proposed a draft greenhouse gas threshold for industrial projects and
commercial/residential projects in its "Recommended Approaches for Setting Interim
Significance Thresholds for Greenhouse Gases under the California Environmental Quality Act"
(CARB 2008b). CARB staff is taking the first step toward developing recommended statewide
interim thresholds of significance for GHGs that may be adopted by local agencies for their own
use.
CEQA guidelines provide that thresholds of significance can be qualitative, quantitative, or in the
form of performance standards. CARB staff's objective is to develop a threshold of significance
that will result in the vast majority (-90% statewide) of the greenhouse gas (GHG) emissions
from new industrial projects being subject to CEQA's requirement to impose feasible mitigation.
CARB staff believes this can be accomplished with a threshold that allows small projects to be
considered insignificant. CARB staff used existing data for the industrial sector to derive a
proposed hybrid threshold. The threshold consists ofa quantitative threshold of7,000 metric tons
of C02 equivalent per year (MTC02e/year) for operational emissions (excluding transportation),
and performance standards for construction and transportation emissions.
The performance standards are largely self explanatory and similar to the approaches proposed
for residential and commercial projects. These performance standards include:
Michael Brandman Associates S:\Clienl PN-JN\3633 Selma DRTS\FinaJ Air Study\36330001_AirQuaJiryReport.doc
50

Selma Disposal and Recycling and Transfer Station - Selma, California Air Quality Analysis Report Thresholds
• Construction: meets an interim ARB performance standard for construction-related
emissions.
• Operations: meets an energy use performance standard defined as California Energy
Commissions (CECs) Tier II Energy Efficiency goal; meets an interim ARB performance
standard for water use; meets an interim ARB performance standard for waste; meets an
interim ARB performance standard for transportation.
Considering the uncertainty regarding the proper threshold to use for assessing climate change in
CEQA documents, the following threshold is used for this analysis:
Does the project comply with the provisions of an adopted Greenhouse Gas Reduction Plan or
Strategy? If no such Plan or Strategy is applicable, would the project significantly hinder or
delay California's ability to meet the reduction targets contained in AB 32?
The thresholds and the analyses contained in this report may not be relevant to other projects.
Therefore, this analysis does not establish thresholds in the City of Selma or set precedents for the
type of assessment to be used in a climate change analysis.
3.4 - Conformance with AQPs
The CEQA Guidelines indicate that a significant impact would occur if the proposed project
would conflict with or obstruct implementation of the applicable air quality plan. The GAMAQI
does not provide specific guidance on analyzing conformity with the AQP. Therefore, this
document proposes the following criteria for determining project consistency with the current
AQPs:
1. Will the project result in an increase in the frequency or severity of existing air quality
violations or cause or contribute to new violations, or delay timely attainment of air
quality standards or the interim emission reductions specified in the AQPs? This
measure is determined by comparison to the regional and localized thresholds identified
above.
2. Will the project conform to the assumptions in the AQPs?
3. Will the project comply with applicable control measures in the AQPs?
3.5 • Cumulative Impacts
Section l5130(b) of the CEQA Guidelines states the following:
The following elements are necessary to an adequate discussion of significant cumulative impacts
use either: (A) A list of past, present, and probable future projects producing related or
cumulative impacts, including, if necessary, those projects outside the control of the agency, or
Michael Brandman Associates S:\Clienl PN-JN\3633 Selma DRTSlFinal Air SludyI36330001_Ai~a1ityReport.doc
51
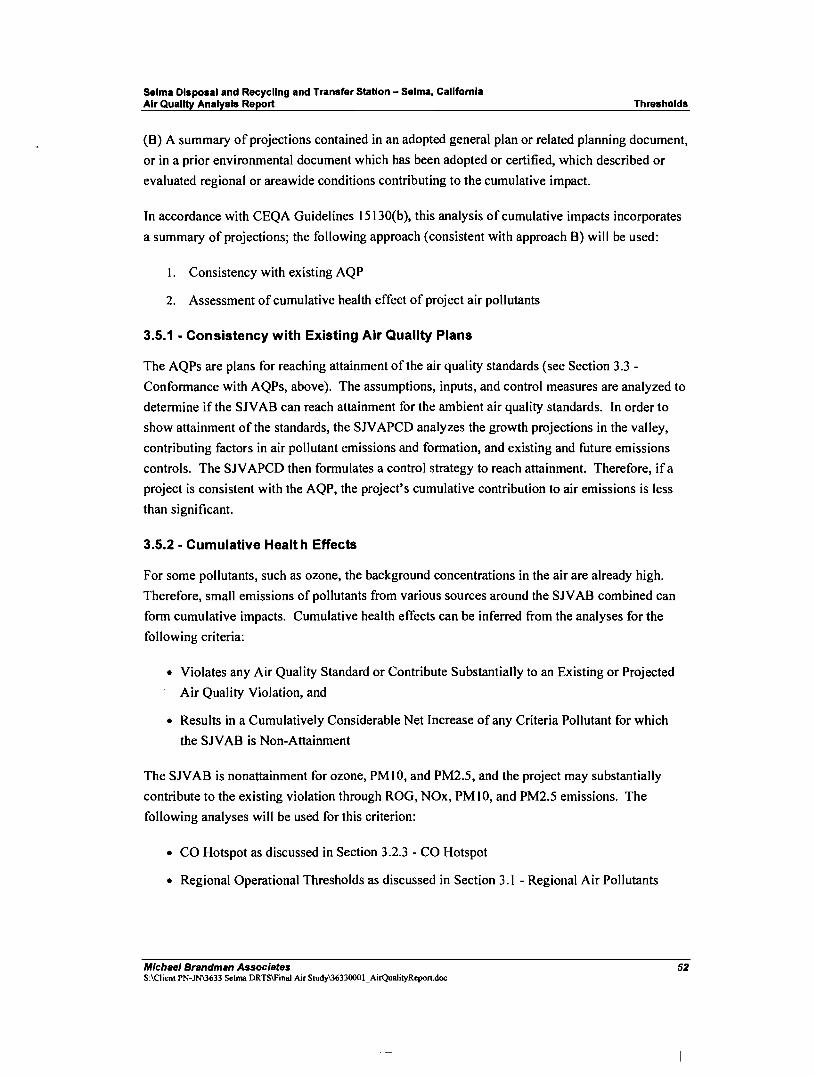
Selma Disposal and Recycling and Transfer Station - Selma, California Air Quality Analysis Report Thresholds
(B) A summary of projections contained in an adopted general plan or related planning document,
or in a prior environmental document which has been adopted or certified, which described or
evaluated regional or areawide conditions contributing to the cumulative impact.
In accordance with CEQA Guidelines 15130(b), this analysis of cumulative impacts incorporates
a summary of projections; the following approach (consistent with approach B) will be used:
1. Consistency with existing AQP
2. Assessment of cumulative health effect of project air pollutants
3.5.1 • Consistency with Existing Air Quality Plans
The AQPs are plans for reaching attainment of the air quality standards (see Section 3.3
Conformance with AQPs, above). The assumptions, inputs, and control measures are analyzed to
determine if the SlVAB can reach attainment for the ambient air quality standards. In order to
show attainment of the standards, the SlVAPCD analyzes the growth projections in the valley,
contributing factors in air pollutant emissions and formation, and existing and future emissions
controls. The SlVAPCD then formulates a control strategy to reach attainment. Therefore, if a
project is consistent with the AQP, the project's cumulative contribution to air emissions is less
than significant.
3.5.2 • Cumulative Healt h Effects
For some pollutants, such as ozone, the background concentrations in the air are already high.
Therefore, small emissions of pollutants from various sources around the SlVAB combined can
form cumulative impacts. Cumulative health effects can be inferred from the analyses for the
following criteria:
• Violates any Air Quality Standard or Contribute Substantially to an Existing or Projected
Air Quality Violation, and
• Results in a Cumulatively Considerable Net Increase of any Criteria Pollutant for which
the SlVAB is Non-Attainment
The SlVAB is nonattainment for ozone, PMIO, and PM2.5, and the project may substantially
contribute to the existing violation through ROG, NOx, PM I0, and PM2.5 emissions. The
following analyses will be used for this criterion:
• CO Hotspot as discussed in Section 3.2.3 - CO Hotspot
• Regional Operational Thresholds as discussed in Section 3.1 - Regional Air Pollutants
Michael Brandman Associates S:\Clienl PN-1NI3633 Selma DRTSlFinal Air SlUdyI36330001_AirQualiIyReport.doc
52

Selma Disposal and Recycling and Transfer Station - Selma, California Air Quality Impact Analysis Report Impact Analysis
SECTION 4: IMPACT ANALYSIS
This section calculates the expected emissions from the construction and operation of the Project
as a necessary pre-requisite for assessing the regulatory significance of Project emissions on a
regional level.
4.1 - Emissions Calculation Methodology
Short·term Impacts
Short-term impacts refer to emissions generated during construction because they occur on a
short-term basis. Construction emissions can vary substantially from day to day, depending on
the level of activity, the specific type of operation, and prevailing weather conditions.
Construction emissions result from onsite and otTsite activities. Onsite emissions principally
consist of exhaust emissions (NOx, SOx, CO, VOC, PM I0, and PM2.5) from heavy-duty
construction equipment, motor vehicle operation, and fugitive dust (mainly PM 10) from disturbed
soil. Offsite emissions are caused by motor vehicle exhaust from delivery vehicles and worker
traffic.
URBEMIS 2007 version 9.2.4 was used to quantitatively analyze the construction impacts. The
analysis was based on grading 7.8 acres and paving 1.95 acres. URBEMIS default values for the
estimated number of construction equipment based on the acreage was used for the analysis. The
URBEMIS estimated construction equipment is shown below.
Table 8: Estimated Construction Equipment
Number of Equipment
Type of Equipment Hours per day Number of Days
1 174 hp Grader 6 30
1 357 hp Rubber Tired Dozer 6 30
1 108 hp TractorlLoaderlBackhoe 7 30
1 189 hp Water Truck 8 30 Source: URBEMIS 2007
Long-tenn Impacts
Long-term emissions are caused by new stationary and mobile sources. The greatest of these
emission impacts emanate from the collection trucks and transfer vehicles. The second largest
source of emissions comes from the additional hours of operation of the otT-road mobile
equipment.
The nature of the project as a transfer and recycling station will reduce vehicle miles travelled
(VMT) by collection trucks and VMT from other waste/recycling operators that will use the
facility, this will presumably reduce long term emissions. The project is not generating new
Michael Brandman Associates S:\Client PN-JN\3633 Selma DRTS\Finai Air Study\36330001_AirQuaiityReport.doc
53

Selma Disposal and Recycling and Transfer Station - Selma, California Air Quality Impact Analysis Report Impact Analysis
vehicle trips, but redirecting the existing travel to a new location. As the City of Selma grows,
additional waste will be generated that would also require transport direct to the landfills if the
transfer station were not constructed. Therefore, the project provides immediate benefits from
existing solid waste stream and long term benefits from minimizing VMT related to growth in the
waste stream.
Currently, waste generated and collected in the City of Selma is hauled to Kettleman Landfill (67
miles), Avenal Landfill (77 miles), Orange Avenue Landfill in Fresno (13 miles), or American
Avenue Landfill in Kerman (31 miles) an average of 47 miles.
Through the use of the transfer station, the number of City of Selma MSW trucks travelling to the
landfills will be reduced and the distance travelled by the regional on-road waste and
recycle/greenwaste trucks that would have normally traveled out the landfill is reduced. For self
haul trips, most local residents currently utilize the existing landfills or rely on a local community
cleanup event. As a result, changes in vehicle miles traveled for self-haul trips are anticipated to
be negligible. The estimated reductions in annual truck miles traveled associated with the project
is summarized in Table 9, below. The vehicle miles traveled in Table 9 is based on the maximum
volume of solid waste that would be permitted for this facility.
Table 9: Annual Mileage Summary Waste Collection and Recycling Haul Trips
Description Vehicle Miles Traveled
SelmaDRTS 552,448
No Project 1,836,640
VMT -1,284,192
In order to quantify air quality impacts, several assumptions were made. Table 10 provides a list
of assumptions used in estimating the potential long-term impacts from the project operation.
The applicant provided an estimate of the maximum number of vehicle traffic anticipated for the
project. As stated previously, the project does not promote growth in vehicle trips, rather
redirects where those vehicles travel to.
Table II provides a list of assumptions used in estimating the long-term impacts of not operating
the project. The No Project emissions include business as usual operations of the Selma
Collection Vehicles traveIling to the local landfills and the regional collection vehicles travelling
out to the local landfills. Not operating the project will not eliminate vehicle trips as these trips
are part of the existing baseline for handling solid waste in the region.
Michael Brandman Associates S:\Clienl PN·JN\3633 Selma DRTSlFinal Air Studyl36330001_AirQualityReport.doc
54
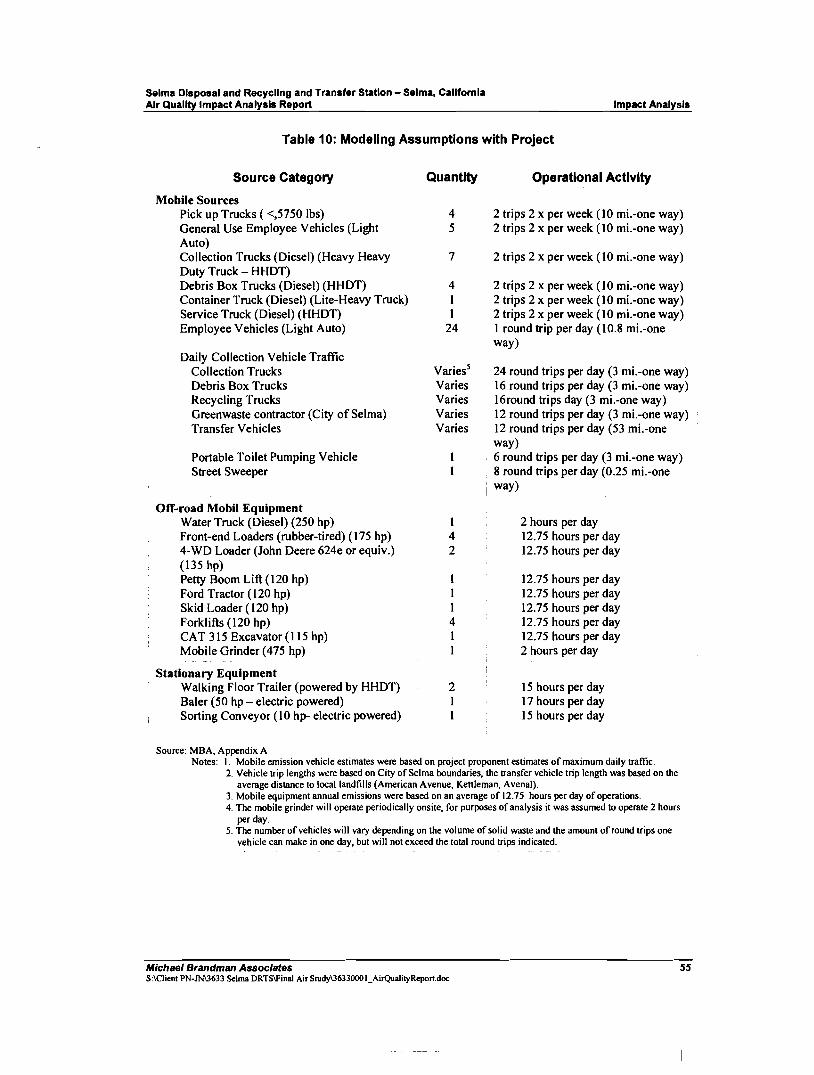
Selma Disposal and Recycling and Transfer Station - Selma, California Air Quality Impact Analysis Report Impact Analysis
Table 10: Modeling Assumptions with Project
Source Category
Mobile Sources Pick up Trucks ( <,5750 Ibs) General Use Employee Vehicles (Light Auto) Collection Trucks (Diesel) (Heavy Heavy Duty Truck - HHDT) Debris Box Trucks (Diesel) (HHDT) Container Truck (Diesel) (Lite-Heavy Truck) Service Truck (Diesel) (HHDT) Employee Vehicles (Light Auto)
Daily Collection Vehicle Traffic Collection Trucks Debris Box Trucks Recycling Trucks Greenwaste contractor (City of Selma) Transfer Vehicles
Portable Toilet Pumping Vehicle Street Sweeper
Off-road Mobil Equipment Water Truck (Diesel) (250 hp) Front-end Loaders (rubber-tired) (175 hp) 4-WD Loader (John Deere 624e or equiv.) (135 hp) Petty Boom Lift (120 hp) Ford Tractor (120 hp) Skid Loader (120 hp) Forklifts (120 hp) CAT 315 Excavator (115 hp) Mobile Grinder (475 hp)
Stationary Equipment Walking Floor Trailer (powered by HHDT) Baler (50 hp - electric powered) Sorting Conveyor (10 hp- electric powered)
Source: MBA, Appendix A
Quantity
4 5
7
4 1 1
24
Variess
Varies Varies Varies Varies
1 4 2
1 1 1 4 1 I
2 I 1
Operational Activity
2 trips 2 x per week (10 mi.-one way) 2 trips 2 x per week (10 mi.-one way)
2 trips 2 x per week (10 mi.-one way)
2 trips 2 x per week (10 mi.-one way) 2 trips 2 x per week (10 mi.-one way) 2 trips 2 x per week (10 mi.-one way) 1 round trip per day (10.8 mi.-one way)
24 round trips per day (3 mi.-one way) 16 round trips per day (3 mi.-one way) 16round trips day (3 mi.-one way) 12 round trips per day (3 mi.-one way) 12 round trips per day (53 mi.-one way) 6 round trips per day (3 mi.-one way) 8 round trips per day (0.25 mi.-one
i way)
2 hours per day 12.75 hours per day 12.75 hours per day
12.75 hours per day 12.75 hours per day 12.75 hours per day 12.75 hours per day 12.75 hours per day 2 hours per day
15 hours per day 17 hours per day 15 hours per day
Notes: I. Mobile emission vehicle estimates were based on project proponent estimates of maximum daily traffic. 2. Vehicle trip lengths were based on City of Selma boundaries, the transfer vehicle trip length was based on the
average.distance to local landfills (American Avenue, Kenleman, Avenal). 3. Mobile equipment annual emissions were based on an average of 12.75 hours per day of operations. 4. The mobile grinder will operate periodically onsite, for purposes of analysis it was assumed to operate 2 hours
per day. 5. The number of vehicles will vary depending on the volume of solid waste and the amount of round trips one
vehicle can make in one day, but will not exceed the total round trips indicated.
Michael Brandman Associates ss S:\Clienl PN-JN\3633 Selma DRTS\Final Air Srudy\3633000I_AirQualiIyReport.doc

Selma Disposal and Recycling and Transfer Station - Selma, California Air Quality Impact Analysis Report Impact Analysis
Table 11: Modeling Assumptions without Project
Source Category Quantity Operational Activity
Mobile Sources Pick up Trucks ( <,5750 Ibs) 4 2 trips 2 x per week (10 mi.-one way) General Use Employee Vehicles (Light 5 2 trips 2 x per week (10 mi.-one way) Auto) Collection Trucks (Diesel) (Heavy Heavy 7 2 trips 2 x per week (10 mi.-one way) Duty Truck - HHDT) Debris Box Trucks (Diesel) (HHDT) 4 2 trips 2 x per week (10 mi.-one way) Container Truck (Diesel) (Lite-Heavy Truck) I 2 trips 2 x per week (10 mi.-one way) Service Truck (Diesel) (HHDT) I 2 trips 2 x per week (10 mi.-one way) Employee Vehicles (Light Auto) 24 I round trip per day (10.8 mi.-one
way) Daily Collection Vehicle Traffic
Collection Trucks 12 24 round trips per day (53 mi.-one way)
Debris Box Trucks 2 16 round trips per day (3 mi.-one way) Recycling Trucks 8 16 round trips per day (53 mi.-one
way) Greenwaste contractor (City of Selma) 6 12 round trips per day (53 mi.-one
way)
Off-road Mobil Equipment Water Truck (Diesel) (250 hp) I 2 hours per day Front-end Loaders (rubber-tired) (175 hp) 4 7.5 hours per day 4-WD Loader (John Deere 624e or equiv.) 2 7.5 hours per day (135hp) Petty Boom Lift (120 hp) I 7.5 hours per day Ford Tractor (120 hp) I 7.5 hours per day Skid Loader (120 hp) I 7.5 hours per day Forklifts (120 hp) 4 7.5 hours per day CAT 315 Excavator (115 hp) I 7.5 hours per day Mobile Grinder (475 hp) I 2 hours per day
Source: MBA, Appendix A Notes: I. Mobile emission vehicle estimates were based on project proponent estimates of maximum daily traffic.
2. Vehicle trip lengths were based on the average distance to local landfills (American Avenue, Kettleman, Avenal and City of Selma boundaries.
3. Mobile equipment annual emissions were based on an average of existing 7.5 hours per day of operations. 4. The mobile grinder will operate periodically onsite, for purposes of analysis it was assumed to operate 2 hours
per day. 5. Numbers of trucks based on assumption that each collection and recycling truck would make two runs per day
and debris box trucks could make 8 trips per day.
Equipment Emissions and Worker Vehicle Exhaust
Exhaust emissions from this project include emissions associated with the transport of
waste/recycling material to and from the project site, emissions produced from recycling
processing equipment, emissions from various work-related and delivery trucks as well as
emissions from employees traveling to and from the site. Emitted pollutants include CO, ROG,
NOx, SOx, and PM IO.
Michael Srandman Associates S:\Client PN-JN\3633 Selma DRTS\Final Air Study\3633000 I_AirQualityReport.doc
56

Selma Disposal and Recycling and Transfer Station - Selma, California Air Quality Impact Analysis Report Impact Analysis
Exhaust emissions will vary substantially from day to day. The numerous variables factored into
estimating total project emissions include: level of activity, number of pieces and types of
equipment in use, site characteristics, weather conditions, number of employees, and the amounts
of materials to be transported on/off site.
In order to provide emissions estimates for the proposed project it was determined that CARB' s
EMFAC 2007 model would provide the most accurate depiction of predicted emissions impacts
from on-road mobile sources. The SlVAB emission factors were estimated for the various
vehicle classes were estimated using the following inputs:
• Season: Annual
• Vehicle model years: 1966 - 20 10
• Temperature and Humidity: 85 degrees Fahrenheit and 40 percent relative humidity
• Average Speed: 35 miles per hour
Emissions for the project's dedicated offroad mobile equipment were determined using
appropriate emissions factors from the construction module within the URBEMIS modeling
program. The 20 10 emission factors were used.
4.1.1 - Project Impacts and Mitigation Measures
This section discusses potential impacts associated with the development of the project and
provides mitigation measures where appropriate.
Air Quality Attainment Plan Consistency
Impact AQ·1: The project would not conflict with or obstruct Implementation of the applicable air quality plan.
Impact Analysis
Air Quality Plans (AQPs) are plans for reaching attainment of air quality standards. The
assumptions, inputs, and control measures are analyzed to determine if the SlVAB can reach
attainment for the ambient air quality standards. In order to show attainment of the standards, the
SlVAPCD analyzes the growth projections in the valley, contributing factors in air pollutant
emissions and formations and existing and future emissions controls. The SlVAPCD then
formulates a control strategy to reach attainment.
The CEQA Guidelines indicate that a significant impact would occur if the proposed project
would conflict with or obstruct implementation of the applicable air quality plan. The GAMAQI
does not provide specific guidance on analyzing conformity with the AQP. As discussed earlier,
this assessment will use the criteria under Conformance with Air Quality Plans:
Michael Brandman Associates S:IClienl PN-JN\3633 Selma DRTSIFinal Air Srudy\36330001_AirQualityRepon.doc
57

Selma Disposal and Recycling and Transfer Station - Selma, California Air Quality Impact Analysis Report Impact Analysis
I. Will the project result in an increase in the frequency or severity ofexisting air quality
violations or cause or contribute to new violations, or delay timely attainment of air
quality standards or the interim emission reductions specified in the AQPs? This
measure is determined by comparison to the regional and localized thresholds identified
above in Regional Air Pollutants and Local Air Pollutants.
2. Will the project conform to the assumptions in the AQPs?
3. Will the project comply with applicable control measures in the AQPs?
Project's Contribution to Air Quality Violations
A measure ofdetermining if the project is consistent with the AQP is if the project will not result
in an increase in the frequency or severity ofexisting air quality violations or cause or contribute
to new violations, or delay timely attainment of air quality standards or the interim emission
reductions specified in the AQPs. As shown in Impact AQ-2, the project would not cause a CO
violation. As shown in Impact AQ-3, the project would not exceed SlVAPCD thresholds of
significance for the construction phase, nor, as shown in Impact AQ-4, would the project exceed
SlVAPCD thresholds of significance for the operational phase.
Consistency with Assumptions in AQPs
The primary way of determining consistency with the AQP's assumptions is determining
consistency with the applicable General Plan to ensure that the project's population density and
land use are consistent with the growth assumptions used in the AQPs for the air basin.
As required by California law, city and county General Plans contain a Land Use Element that
details the types and quantities of land uses that the city or county estimates will be needed for
future growth, and that designates locations for land uses to regulate growth. Growth estimates
used in a General Plan often come from the State of California's Department of Finance. The
Fresno Council of Governments (Fresno COG) uses the growth projections and land use
information in adopted general plans to estimate future average daily trips (ADT) and then
vehicle miles traveled (VMT), which are then provided to the SlVAPCD to estimate future
emissions in the AQPs. It is assumed that the existing and future pollutant emissions computed in
the AQP were based on land uses from area general plans. AQPs detail the plan and calculations
for reaching attainment of the air standards.
The proposed project is consistent with the current general plan and will not require a General
Plan Amendment. The project will not result in a substantial increase in project intensity over the
current land use designations that would increase air quality impacts. This is a less than
significant impact.
Michae' Brandman Associates S:\Clienl PN-JN\3633 Selma DRTSIFinal Air Study\36330001_AirQualityReport.doc
58

Selma Disposal and Recycling and Transfer Station - Selma, California Air Quality Impact Analysis Report Impact Analysis
Control Measures
The AQPs contains a number of control measures, including the rules outlined by the San Joaquin
Valley Air Pollution Control District. The control measures in the AQPs are enforceable
requirements. The project will comply with all of the SNAPCD's applicable rules and
regulations. Therefore, the project complies with this criterion.
The subject property and all of the parcels located immediately adjacent to the parcel are zoned
M-2 (Manufacturing and Industrial) by the City of Selma.
Level of Significance Before Mitigation
Less than significant impact.
Mitigation Measures
None required.
Level of Significance After Mitigation
Less than significant impact.
Carbon Monoxide Hot Spot
Impact AQ-2: The project would not significantly contribute to a carbon monoxide hotspot that would exceed federal or state air quality standards.
Impact Analysis
Because increased CO concentrations usually are associated with roadways that are congested
and with heavy traffic volume, the SJVAPCD has established that preliminary screening can be
used to determine with fair certainty that the effect a project has on any given intersection would
not cause a potential CO hotspot. Therefore, the SJVAPCD has established that if all project
affected intersections are negative for both of the following criteria, then the project can be said
to have no potential to create a violation of the CO standard.
• A traffic study for the project indicates that the Level of Service (LOS) on one or more
streets or at one or more intersections in the project vicinity will be reduced to LOS E or F;
or
• A traffic study indicates that the project will substantially worsen an already existing LOS
F on one or more streets or at one or more intersections in the project vicinity.
The project estimates a maximum of24 workers, but does not indicate if the workers will be split
into shifts. Assuming one single shift of 24 employees would add a maximum of 24 vehicles to
the existing roadways at in the morning and evening hours. Additionally, collection vehicles,
recycling trucks, and greenwaste truck would make trips to and from the site.
Michael Brandman Associates S:\Client PN-JN\3633 Selma DRTSIFinal Air Sludy\36330001_AirQualityReport.doc
59

Selma Disposal and Recycling and Transfer Station - Selma, California Air Quality Impact Analysis Report Impact Analysis
The traffic in the vicinity of the site is currently very limited. The level of congestion anticipated
with the addition of project traffic does not exceed SlVAPCD screening thresholds contained in
the Guide for Assessing and Mitigating Air Quality Impacts. Therefore, no CO hotspots are
anticipated as a result of traffic-generated emissions by the proposed project.
Level of Significance Before Mitigation
Less than significant impact.
Mitigation Measures
No mitigation is required.
Level of Significance After Mitigation
Less than significant impact.
Construction Emissions - Criteria Pollutants
Impact AQ-3: The proposed projects would not result in significant emissions of criteria pollutants during project construction.
Impact Analysis
Construction impacts include fugitive dust and other particulate matter, as well as exhaust
emissions generated by earthmoving activities and operation ofgrading equipment during site
preparation. Construction emissions are caused by onsite or offsite activities. Onsite emissions
principally consist of exhaust emissions from heavy-duty construction equipment, motor vehicle
operation, and fugitive dust from disturbed soil. Offsite emissions are caused by motor vehicle
exhaust from delivery vehicles, as well as worker traffic, but also include road dust.
The unmitigated analyses include compliance with SlVAPCD Regulation VIII (Fugitive PM 10
Prohibitions). Compliance with Regulation VIII is required. When reviewing the URBEMIS
printouts in Appendix B, please note that the URBEMIS program lists any measure that reduces
emissions to be "mitigation," regardless if the measure fulfills a requirement or is truly
considered mitigation by CEQA standards. The following measures were included in the
analyses:
• Apply soil stabilizers to inactive areas.
• Replace ground cover in disturbed areas quickly.
• Water exposed surfaces twice daily.
• Stabilize soil in equipment loading/unloading areas.
• Reduce speed on unpaved roads to less than 15 mph.
• Manage haul road dust by watering twice daily.
Michael Brandman Associates S:\Clienl PN-JN\3633 Selma DRTS\Final Air Study\36330001_AirQualityReport.doc
60

Selma Disposal and Recycling and Transfer Station - Selma, Callfomla Air Quality Impact Analysis Report Impact Analysis
As discussed previously, construction emissions were estimated using URBEMIS 2007 and were
based on the grading of 7.8 acres and paving 1.95 acres for the facilities. The project construction
durations was estimated to last a total of3 months and begin and end in 2009.
Table 12 shows the emissions associated with construction after compliance with SlVAPCD
Regulation VIII.
Table 12: Estimated Construction Emissions
Year ROG NOx CO PM1~ PM2.1 (tonslyear) (tonslyear) (tonslyear) (tonslyear) (tonslyear) .
2009 0.07 0.56 0.33 0.04 0.03
Source: URBEMIS 2007
As shown above, construction emissions of ROO, NOx, CO and PM IO do not exceed the regional
significance thresholds and therefore result in a less than significant impact.
Level of Significance Before Mitigation
Less than significant.
Mitigation Measures
None are required.
Level of Significance After Mitigation
Less than significant.
Operational Emissions - Criteria Pollutants
Impact AQ-4: The project would not result in significant emissions of criteria pollutants during project operations.
Impact Analysis
Operational, or long-term, emissions occur over the life of the proposed projects. Operational
emissions include onroad and offroad mobile and stationary source emissions. The net long-term
operational emissions are characterized by looking at the project emissions and the emissions that
would occur without the project. The project will involve having collection vehicles, recycling
vehicles, and greenwaste vehicles transport their materials to the site for processing with residual
materials sent out to the landfills via the transfer vehicles. The use of transfer vehicles reduces
VMT because fewer trucks have to travel out to the landfill. A transfer vehicle can hold between
two to four loads from a collection vehicle. The 48 collection vehicle trips that would be made
directly to the landfills could reduce their VMT by at least 50 percent by bringing their loads to
the SORTS and utilizing transfer vehicles. Assuming two loads per transfer vehicle would reduce
the VMT by having only 24 transfer vehicles trips travel to the landfill and substantially reduce
Michael Brandman Associates S:ICHen! PN-JN\3633 Selma DRTSlFinal Air Study\36330001_AirQualityReport.doc
61

Selma Disposal and Recycling and Transfer Station - Selma, California Air Quality Impact Analys" Report Impact Analysis
VMT compared to the amount that would occur with the SORTS. The combined air quality
impact from the various emission sources identified in Table 10 and II are summarized below:
Table 13: Operational Emissions (tons per year)
Source Category . ROG CO NOX PM10 Onsite Mobile Sources 0.03 0.22 0.40 0.02
Daily Incoming/Outgoing
Project Vehicle Trips 0.48 2.73 7.58 0.31 Offroad Mobile
EquiPment 2.01 9.30 14.16 0.98 TOTAL -. -
2.52 12.25 .-. - 22.14 1.31
. , ..-.------ -._--. - . - . .._. -
Onsite Mobile Sources : 0.03 0.22 ..
i -_._-
0.40 0.02 I
Daily Incoming/Outgoing
, No Project Vehicle Trips 1.51 9.01 23.36 0.93 Offroad Mobile
Equipment 1.28 - . 6.24 9.04 0.62
TOTAL 2.82 15.47 32.80 1.57
Net Emissions -0.30 -3.22 -10.66 -0.26
Significance Threshold 10 N/A 10 15
Significant? No No No No -
As shown above, the project results in a net air quality benefit, net operational emissions for the
project will not exceed the SJVAPeD's regional thresholds of significance and would result in a
less than significant impact.
Level of Significance Before Mitigation
Less than significant impact.
Mitigation Measures
None required.
Level of Significance After Mitigation
Less than significant impact.
Michael Brandman Associates S:\Client PN-JN\3633 Selma DRTS\FinaJ Air SlUdy\36330001_AirQuaJityRepon.doc
62

Selma Disposal and Recycling and Transfer Station - Selma, California Air Quality Impact Analysis Report Impact Analysis
Toxics Air Contaminants
Impact AQ-6: The project would not expose sensitive receptors to substantial pollutant concentrations.
Impact Analysis
The proposed project would be a source ofTACs as offroad mobile equipment and the collection
vehicles and transfer vehicles would run on diesel and gasoline. Activities associated with the
project operations that require the use of diesel-fueled vehicles for extended periods, such as
forklifts, front loaders, and delivery vehicles to and from the Transfer Station, would generate
DPM emissions that could expose sensitive receptors to DPM. The DPM emissions generated by
these uses would be produced within the project (Le., travel route within the project to various
unloading and transfer points) on a regular basis. The existing residences to the east and schools
to the northwest of the project site may be exposed to elevated levels of DPM emissions on a
recurring basis.
A health risk assessment (HRA) technical report was prepared to assess the potential health risk
impacts on local air quality associated with the operation of the Selma Transfer Station Project.
The health risk assessment report is included in its entirety in Appendix B.
Project Generated TAe Emissions
DPM emissions from the various sources were calculated using information derived from the
project description, delivery truck information, mobile source emission factors from the CARB
EMFAC2007 emissions factor model, the CARB Off-road Model, and the URBEMIS Model.
Diesel Truck Operations
Table 14 provides an inventory of the diesel trucks accessing the project. Trucks will access the
facility from Dockery Road.
Table 14: Forecasted Number of Delivery Trucks
Truck Type Trucks per Day EMFAC Truck Class
Collection Trucks
Debris Box Trucks
Recycling Trucks
Green Waste Trucks
, Transfer Vehicles
Notes: , All trucks assumed to be diesel trucks.
6 i Heavy Heavy Duty (HHDT) ;. . - - - ". - -- _._-_._.'~_.~--_._- --
4 I Heavy Heavy Duty (HHDT)1--.0..•
6 : Heavy Heavy Duty (HHDT) - . _.. ,._..
6 Medium Heavy Duty (MHO)
6 Heavy Heavy Duty (HHDT)
Michael Brandman Associates S:\Client PN-JN\3633 Selma DRTSlFinal Air StudyI36330001_AirQualityReport.doc
i
63

Selma Disposal and Recycling and Transfer Station - Selma, California Air Quality Impact Analysis Report Impact Analysis
Table 15 provides the DPM emission factors for the mobile source diesel PM 10 emission sources
as derived from the CARB EMFAC2007 emission factors specifically for Fresno County.
Onsite emissions were calculated for vehicle exhaust and idling. Likely onsite travel links were
defined from the project entrance to the unloading locations for each class of solid waste material,
including solid waste, green waste, and recycling. Delivery vehicles were assumed to idle for a
maximum of 5 minutes per vehicle per day during unloading, in keeping with the CARB Air
Toxic Control Measure (ATCM), which regulates truck idling time (CARB 2005).
Table 15: Emission Factors for Operational DPM Emissions
Emission Source Emission Factors - 2011 t'.~,4J
Exhaust Emission
HHDT (g/mi) (2) 1.8
MHD(g/mi) 0.647
Idling Emissions (3)
HHDT (g/hr) 2.356
MHD(g/hr) 1.l02
Notes: . (I) All motor vehicle emission factors were derived from Ihe EMFAC2007 model for Fresno County as diesel PM 10
exhaust (2) Exhaust emissions for Ihe HHD DSL trucks assumed a travel speed of 10 mph; air temperature of 40 degrees
Fahrenheit and a relative humidity of 50% were assumed as representative of average winter wealher conditions. (3) The idling emission factors assumed a speed of 0 mph. (4) Emission factor units: g1mi (grams per mile); gIhr (grams per idle-hour) g/hp-hr (grams per brake horsepower-hour).
Diesel Transfer Equipment Operations
Processing the waste material as it arrives at the transfer station requires several pieces ofdiesel
powered equipment. Table 16 lists the type of equipment, the size of the engine, load factors and
emission factors. Table 16 also shows the emission factors for the various pieces of off road
equipment. (Please refer to the Health Risk Assessment Report Appendix A for a detailed
calculation of emissions)
Table 16: Offroad Equipment Emissions
IEmission Facto~Equipment Horsepower' Load Factor I(g/bhp-hr) . - -I
Front End Loaders (rubber 157 0.241 0.54 tired)
Four-wheel-drive Loader 135 0.419 0.55
Petty Boom Lift 1I5 0.29 0.50
Michael Brandman Associates S:\Client PN-JN\3633 Selma DRTS\Final Air Study\3633000t_AiIQualityReport.doc
64

Selma Disposal and Recycling and Transfer Station - Selma, California Air Quality Impact Analysis Report Impact Analysis
Ford Tractor 83 0.419 0.70
Skid Loader 62 0.367 0.55
Forklift 83 0.253 0.30
Grinder 600 0.12 0.73
Excavator 103 0.46 0.57
Water Truck 250 0.154 0.17
Notes: I Average horsepower 2 URBEMIS User's Guide Appendix I Source: CARB 2000, SCAQMD 2007
Table 17 summarizes the total DPM emissions from the project assuming operations begin in
2009.
Table 17: Annual Total DPM Emissions
Annual DPM EmissionsEmission Source (tonslyear) - ---- -->- -
Exhaust Emissions from Truck Travel 0.0153
: idling Emissions 0.00193
Onsite transfer vehicles 0.0606
Total 0.07783
Source: See Appendix A ofHealth Risk Assessment Report
Each of the emission source types identified in Tables 14 and 16 were characterized with
geometrical and emission release specifications for use in the air dispersion model. More detailed
infonnation is provided in the HRA.
Receptor Locations
Nearby ground-level receptor locations were identified. Receptors were assumed to be located
along the entire project boundary spaced at an interval of 50 meters. Additional receptors were
assumed to be placed at 25-meter intervals from the project out to 100 meters and at 50-meter
intervals from 100 to 300 meters from the project. The locations of nearby sensitive receptors
included the residences to the east. This extent of receptors was sufficient to capture the
maximum health risk impacts from the operation of the project.
Air Dispersion Modeling
The health risk assessment ofDPM emissions from this project applied the USEPA AERMOD
Model. The AERMOD model is a methodology accepted by the SJVAPCD and the CARB for
use in perfonning health risk assessments involving DPM.
Michael Brandman Associates S:\Clienl PN-JN\3633 Selma DRTS\Final Air Study\36330001_AirQualilyReport.doc
65

e
Selma Disposal and Recycling and Transfer Station - Selma, California Air Quality Impact Analysis Report Impact Analysis
Modeling Results
The total individual excess cancer risk as detennined by this health risk assessment is
summarized in Table 18 assuming the transfer station goes into full operation in 2009. the
analysis showed an exceedance of the cancer risk significance threshold. Table 18 shows that
unmitigated operations would pose a cancer risk to nearby residential sensitive receptors and that
the maximum far exceeds the threshold. However, in 2003 CARB adopted a waste collection
vehicle rule which is designed to achieve PM reductions of 85% by 20 IO. Assuming compliance
with regulation, further analysis shows the cancer risk reduced to below the threshold for all but
the point of maximum impact. Even then the point of maximum impact slightly exceeds the
threshold, II compared to 10, in an area that is presently uninhabited and is unlikely to be
developed.
Table 18: Summary of Cancer Risks at Sensitive Receptors - Project Year 2009
Transfer Station Operations ._,._----~~.,-- --... -----.---------.----------]---- --T---
SlgnlflcanceUnmitigated Cancer i Mitigated Cancer I Location I
i Risk Threshold
--~ -~
st of
on)I I (risk per mllli I Risk i (risk per million)
-
IM.,dmum E.pored R"Men';xl 26.7 4.0 10 Receptor( I),
Maximum Exposed Worker 1.2 0.19 10 Receptor(2)
Maximum Exposed Student <0.1 <0.1 10 Receptor(3)
--
Point of Maximum Impad4 ) 73.5 11.0 10
---"--
Notes: Transfer Station Operations (I) The location of the maximum exposed cancer risk at a residential receptor occurs at a residence located 170 ft ea
the project site. (2) The location of the maximum exposed worker occurs at the office building 0.1 mile south of the project site. (3) The location of the maximum impacted student is at the Early Childhood Development Center 0.8 mile southeas t of
the project site. (4) The PMI or Point of Maximum Impact is a location without people present at which the total cancer risk has the
highest numerical value. Risks at the PMI are calculated using residential exposure assumptions. Location ofth PMI for the Transfer Station operation is on the project boundary approximately 100 meters west ofthe northeas comer of the project boundary. There are no sensitive receptors at that location. It is highly unlikely there will any sensitive receptors at that location in the future.
Source: See HRA Appendix B for the health risk assessment modeling results.
As shown above, the excess cancer risks associated with the operation of the project with
mitigation are not expected to exceed the cancer risk significance level of 10 in a million at any
nearby sensitive, worker, or student receptor.
The non-cancer impact was also calculated for the project. The highest chronic non-cancer
Hazard Index was calculated to be 0.04 without compliance to CARB's waste vehicle collection
Michael Brandman Associates S:IClient PN-JN\3633 Selma DRTSIFinal Air StudyI36330001.AirQualityReport.doc
66

Selma Disposal and Recycling and Transfer Station - Selma, California Air Quality Impact Analysis Report Impact Analysis
regulation and 0.007 with compliance to the regulation. In either case the estimated Hazard Index
is two or three orders of magnitude less than the significance threshold of 1.
Risk Assessment Uncertainty
There are substantial uncertainties involved in assessing the health risk of air pollutants. There
are uncertainties in dispersion modeling, toxicological factors, and exposure assessment. The
methodology for assessing health risks involving emission estimations, dispersion modeling, and
toxicity risk factors have been developed to provide conservative results (in terms of over
predicting impacts).
The California Office of Environmental Health Hazard Assessment (OEHHA) recommends using
the 70-year exposure duration for determining residential cancer risks. Although it is unlikely
that people will reside at a single residence for 70 years, it is common that people will spend their
entire lives in a major urban area. While residing in urban areas, it is very possible to be exposed
to the emissions of other facilities. In order to help ensure that people do not accumulate an
excess unacceptable cancer risk from cumulative exposure to stationary facilities at multiple
residences, OEHHA recommends the 70 year exposure duration for risk management decisions.
However, it is important to note that a person who has resided in his or her current residence for
less than 70 years will have a cancer risk less than what is calculated for a 70-year risk.
Nonetheless, this assessment attempts to be conservative and provide a worst-case scenario for
exposure.
Further, the factors used to calculate emissions reference a particular fleet year: 2009. The cancer
risk projected for 2009 is assumed to apply over the next 9, 40, or 70-years, depending on the
type of receptor analyzed. However, emission projections using the CARB EMFAC mobile
source emission model indicate that mobile source diesel emission factors will decline
substantially over the next 30 years, particularly for the heavy heavy-duty truck vehicles, with the
result that the cancer risks predicted for the year 2009 will also decline in future years. For
example, the DPM exhaust emission rate for heavy heavy-duty diesel trucks is expected to
decrease from 2.356 grams/mile in 2009 to 0.10 gram/mile in 2030, a decrease of95 percent.
Thus, using the cancer risk predictions for 2009 as representative of the cancer risk from the fully
operational project over the next 9, 40, or 70 years provides a conservative cancer risk estimate.
Level of Significance Before Mitigation
Less than significant impact.
Mitigation Measures
None required
Level of Significance After Mitigatio.n
Michael Brandman Associates S:\Client PN-JN\3633 Selma DRTS\FinaJ Air Studyl36330001_AirQuaJityReport.doc
67

Selma Disposal and Recycling and Transfer Station - Selma, California Air Quality Impact Analysis Report Impact Analysis
Less than significant impact.
Objection able Odors
Impact AQ-6: The project would not create objectionable odors affecting a substantial number of people.
Impact Analysis
There are two situations that have the potential to cause odor impacts:
1. A source of odors is proposed to be located near existing or planned sensitive receptors
2. A sensitive receptor land use is proposed near an existing or planned source of odor
Land uses typically associated with odors include wastewater treatment facilities, waste-disposal
facilities, or agricultural operations.
Odors associated with the proposed recycling and transfer station would be primarily associated
with the decomposition of wastes. Municipal solid waste, food waste, and certain yard wastes
such as grass have a high potential for odor generation. The odor generation potential increases
during warm or wet weather conditions. If not properly cleaned and maintained, surfaces within
the proposed project facility that come in contact with waste materials, such as the tipping floor,
processing equipment, haul trucks can also be sources of odors.
The occurrence and severity of odor impacts depend on numerous factors, including the nature,
frequency, and intensity of the source; wind speed and direction; and the presence of sensitive
receptors. While offensive odors rarely cause any physical harm, they still can be unpleasant and
often generate citizen complaints to local governments and regulatory agencies.
Odor impacts associated with recycling and transfer stations typically occur as a result of poor
management, if waste is maintained onsite for extended periods of time (Le., greater than 48
hours), or if waste is processed in exterior areas. Compliance with existing regulatory
requirements (Le., 14 CCR §17408.5) would require maintenance and operational practices that
would ensure that the proposed facility would not have a nuisance odor-related impact to nearby
receptors.
SORTS has proposed operational practices that will minimize odor impacts. The practices
include load checking of recycle trucks to minimize putrescible and unacceptable wastes. Any
putrescible material detected in the recycling processing area will be separated and directed to the
solid transfer area. The greenwaste processing and storage will be conducted in a manner to
prevent natural composting, aerobic or anaerobic to occur, thereby reducing potential odors.
Michael Brandman Associates S:\Client PN·JNI3633 Selma DRTSlFinal Air SludyI36330001_AirQualityReport.doc
68

from the solid waste stream in the recycling building and would then immediately load the
remaining solid waste into transfer trailers. Although not currently anticipated by the project
proponent, the project's operational statement allows for the possible use of a direct transfer
operation. The design of the direct transfer operation reduces odor impacts through the use of
walking floor transfer trailers, which minimizes the handling of solid waste. No disposal of solid
waste or tipping of solid waste 011 native ground will occur at the facility. The direct transfer
operation occurs when the route compactor collection vehicle backs up to the transfer dock and
transfer trailer. The trailer rear walls expand to allow the collection vehicle to discharge directly
into the trailer. Regulatory requirements for this type of handling require that the solid waste not
be placed on the ground or outside of the vehicle during transfer (14 CCRR § 17402(a)(3). Solid
waste can be transferred only once and all of the contents of the original transferring container or
vehicle must be emptied during a single transfer. Any waste that may unintentionally fall outside
of the vehicles is promptly cleaned up and placed within the transfer vehicle by site personnel.
Once the transfer operations are completed and the transfer trailer is full, the trailer is sealed and
hauled to an approved solid waste facility for disposal. No solid waste transferred into transfer
vehicles will remain on the SDRTS site for a period of more than 48 hours, pursuant to CCR §
17410.1.
Another source of odor emissions is from diesel exhaust, which would be emitted during
construction and operation of the project.
The project will be subject to SlVAPCD Rule 4102 - Nuisance. If the project generates
confirmed odor complaints, the SlVAPCD would initiate enforcement action that would require
the operator to correct any problems that are creating the excessive odors. Typically, the
SlVAPCD works with the operator to identify the source of the odor and helps identify measures
or practices that reduce the odors.
Routine cleaning of floors, walls, and equipment shall be conducted per the requirements ofCCR
Title 27. Compliance with the practices required by this regulation is expected to prevent
significant odor issues from occurring. However, on occasion weather conditions, equipment
failures, and unforeseen problems could result in objectionable odors.
As discussed previously, the nearest sensitive receptor are located on the east side of Dockery
Avenue 170 feet from the project site and may detect the odor sources at the facility. Therefore,
odor impacts would be potentially significant.
Level of Significance Before Mitigation
Potentially significant impact.
Mitigation Measures
Michael Brandman Associates S:\Clienl PN-JN\3633 Selma DRTSlFinal Air StudyI36330001_AirQualityReport.doc
69

Selma Disposal and Recycling and Transfer Station - Selma, California Air Quality Impact Analysis Report Impact Analysis
MM-AQ-1 Loaded transfer vehicles shall be covered and properly maintained to ensure that
solid waste materials are contained entirely within the vehicle for the duration of
its transport;
MM·AQ·2 Odor complaints received by the City or the SlVAPCD shall be responded to
within 24 hours. This response shall include an inquiry into the source of the
odor and identification of the measures necessary to eliminate the odor source. If
excessive complaints are received, as defined by the City, additional measures
shall be implemented to control odors. Additional measures may include, but are
not limited to: (a) install plastic curtains on entrances and exits to contain odors
when doors are opened to allow vehicles to enter and exit and (b) use of
deodorants to mask or neutralize odors as needed.
Level of Significance After Mitigation
Less than significant impact.
Cumulative A ir Quality
Impact AQ·7: The project would not result In a cumulatively considerable net Increase of any criteria pollutant for which the project region Is nonattalnment under an applicable federal or state ambient air quality standard.
Impact Analysis
The analysis for cumulative air quality impacts includes the following: regional thresholds
analysis (Impact AQ-3 and Impact AQ 4), CO hotspot (Impact AQ-2), and consistency with the
existing AQAP (Impact AQ- I), which are found in impacts discussed above.
The project would not exceed the SlVAPCD's regional significance thresholds during
construction or operation. The project is consistent with the AQAP. Because the project does not
exceed SlVAPCD's thresholds of significance it would not result in a cumulatively considerable
air quality impact and is expected to provide a net benefit to regional air quality.
Level of Significance Before Mitigation
Less than significant impact.
Mitigation Measures
No mitigation is required.
Level of Significance After Mitigation
Less than significant impact.
Michael Brandman Associates S:\Client PN·JN\3633 Selma DRTSIFinaJ Air SlUdy\36330001_AirQuaJiryReport.doc
70

Impact AQ·8: The project would not significantly hinder or delay California's ability to meet the reduction targets contained in AB 32.
Impact Analysis
This report does not just analyze whether the Project would result in an increase in GHG
emissions, but also assesses whether the Project would result in an increase in GHGs that would
significantly hinder or delay the State's ability to meet the reduction targets contained in AB 32.
This analysis contains two components. One component consists of the Project's GHG emissions
inventory. The emissions inventory describes the sources of emissions, the emissions without
incorporation of mitigation measures, and the emissions after the incorporation of mitigation
measures, if required. The second component consists of the measures used to compare the
Project with the applicable state and local strategies and known mitigation measures to reduce
GHGs. In the discussion below, the unmitigated emissions inventory are provided before the state
and local strategies.
Inventory of Greenhouse Gases during Construction
The project would emit greenhouse gases from upstream emission sources (the manufacture of
building materials such as cement) and direct sources (combustion of fuels from worker vehicles
and construction equipment).
An upstream emission source (also known as life cycle emissions) refers to emissions that were
generated during the manufacture of products to be used for construction of the project.
Upstream emission sources for the project include but are not limited to the following: emissions
from the manufacture of cement; emissions from the manufacture of steel; and/or emissions from
the transportation of building materials in other countries. The upstream emissions were not
estimated because they are not within the control of the project and to do so would be speculative
at this time. Additionally, the CAPCOA White Paper on CEQA & Climate Change supports this
conclusion by stating, "The full life-cycle ofGHG emissions from construction activities is not
accounted for ...and the information needed to characterize [life-cycle emissions] would be
speculative at the CEQA analysis level" (CAPCOA 2008). Therefore, pursuant to CEQA
Guidelines Section 15144 and 15145, upstream /life cycle, emissions are speculative and no
further discussion is necessary.
Emissions from the combustion of fuel from construction equipment and associated worker
vehicles were estimated using URBEMIS2007.
The emissions of carbon dioxide from project construction equipment and worker vehicles are
shown in Table 19 below. Emissions of nitrous oxide and methane are negligible.
Michael Brandman Associates S:\Clienl PN·JNI3633 Selma DRTSIFinal Air StudyI36330001_AirQualityReport.doc
11

Selma Disposal and Recycling and Transfer Station - Selma, California Air Quality Impact Analysis Report Impact Analysis
Table 19: Construction Exhaust Carbon Dioxide Emissions (Unmitigated)
Carbon Dioxide EmissionsYear Emissions (tons) (MTCOze)
2009 64.37 58.40
MfCo,e = metric tons ofcarbon dioxide equivalen~ converted from Ions by multiplying by 0.9072 and lbe global warming potential of I.
Source of carbon dioxide emissions: URBEMIS2007 output in Appendix A.
Inventory of Greenhouse Gas Emissions during Operation
Operational emissions are emissions that would occur over the life of the project and include
emissions from motor vehicles, natural gas combustion, indirect emissions from electricity
generation, indirect emissions from transporting water to the project, aerosols (from the exhaust
of diesel vehicles) and refrigerants (air conditioning and refrigerators).
The processing water requirements for the project operations will be obtained from Cal Water's
Selma District. Water use was estimated using an employee factor of200 gallons per person per
day (the USGS estimates U.S. per capita water use of200-275 gallons per day). Additionally, the
facility will periodically clean recycling operation areas with low water volume, high pressure
washers. An II HP electric-powered pressure washer with a 5 gallon per minute rating was
assumed to estimate annual water use of31,200 gallons (twice weekly cleanings with 300 gallons
per use). The California Energy Commission developed an estimate of electricity used to convey
water in Northern California of approximately 3,950 kWh per million gallons of water
transported (CEC 2005). The total amount of water used was estimated at 4,900 gallons per day.
The project includes steel buildings and may require the cooling of buildings. In order to provide
a conservative estimate of possible refrigerant use, it was assumed for this analysis that a total of
2 air conditioning units would for the office/shop space and the recycling processing area.
The emissions from the vehicles were estimated based on the anticipated activity of employees,
collection vehicles, recycling and greenwaste vehicles, and miscellaneous maintenance vehicles
on the project site. EMFAC 2007 was used to provide the C02 emission estimates based on
vehicle miles traveled.
The operational emissions are shown in Table 20. As shown, the main source of emissions is
from otT-road mobile sources. The increase in offroad mobile source emissions are mitigated by
the decrease in mobile source emissions, particularly the collection trucks.
Michael Brandman Associates S:\Client PN·JN\3633 Selma DRTS\Final Air Study\3633000I_AiJQualityRcpon.doc
72
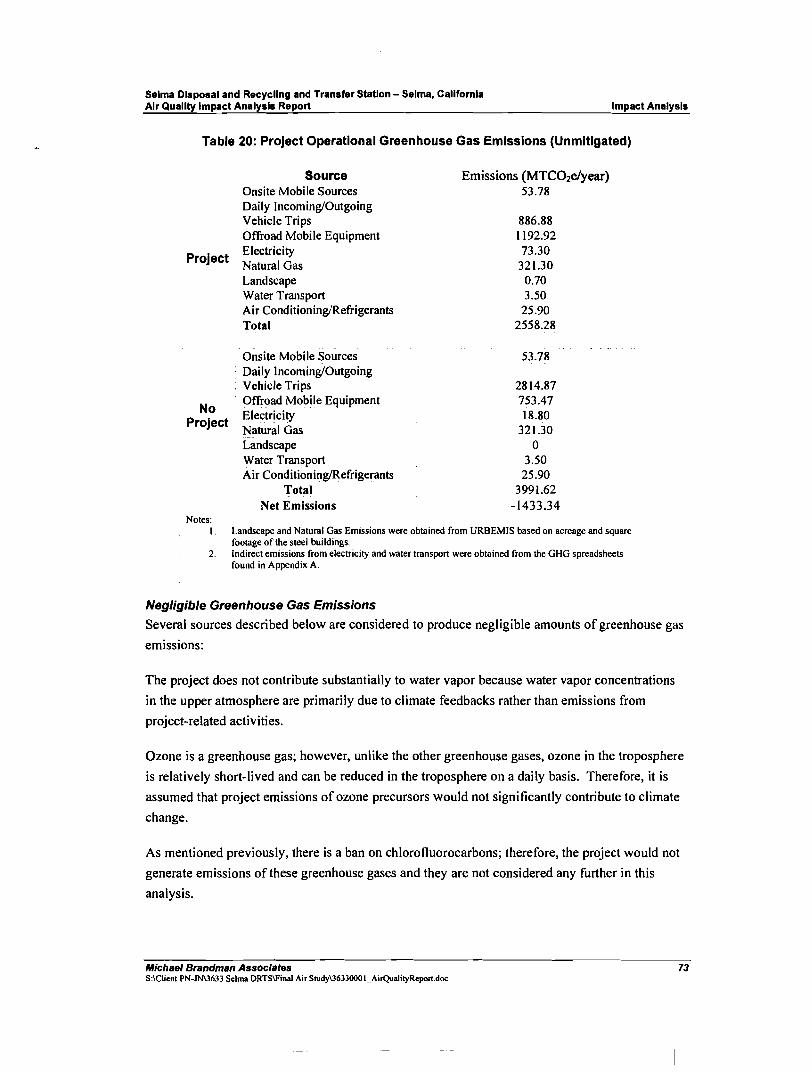
Selma Disposal and Recycling and Transfer Station - Selma, California Air Quality Impact Analysis Report Impact Analysis
Table 20: Project OperatIonal Greenhouse Gas Emissions (Unmitigated)
Source Emissions (MTC02e1year) Onsite Mobile Sources 53.78 Daily Incoming/Outgoing Vehicle Trips 886.88 OfTroad Mobile Equipment 1192.92 Electricity 73.30
Project Natural Gas 321.30 Landscape 0.70 Water Transport 3.50 Air Conditioning,Refrigerants 25.90 Total 2558.28
Onsite Mobile Sources 53.78 Daily Incoming/Outgoing Vehicle Trips 2814.87
No Project
OfTroad Mobile Equipment Electricity Natural Gas
753.47 18.80
321.30 Landscape o Water Transport 3.50 Air ConditioningiRefrigerants 25.90
Total 3991.62 Net Emissions -1433.34
Notes: I. Landscape and Natural Gas Emissions were obtained from URBEMIS based on acreage and square
footage of the steel buildings. 2. Indirect emissions from electricity and water transport were obtained from the GHG spreadsheets
found in Appendix A.
Negligible Greenhouse Gas Emissions
Several sources described below are considered to produce negligible amounts of greenhouse gas
emissions:
The project does not contribute substantially to water vapor because water vapor concentrations
in the upper atmosphere are primarily due to climate feedbacks rather than emissions from
project-related activities.
Ozone is a greenhouse gas; however, unlike the other greenhouse gases, ozone in the troposphere
is relatively short-lived and can be reduced in the troposphere on a daily basis. Therefore, it is
assumed that project emissions of ozone precursors would not significantly contribute to climate
change.
As mentioned previously, there is a ban on chlorofluorocarbons; therefore, the project would not
generate emissions of these greenhouse gases and they are not considered any further in this
analysis.
Michael Brandman Associates S:\Clienl PN-JN\3633 Selma DRTSlFinaJ Air Study13633000 1_AirQuaJilyReport.doc
73

Selma Disposal and Recycling and Transfer Station - Selma, California AIr Quality Impact Analysis Report Impact Analysis
Perfluorocarbons and sulfur hexafluoride are typically used in industrial applications, none of
which would be used by the project. Therefore, it is not anticipated that the project would emit
any of these greenhouse gases
Project Design Features that Reduce GHG Emissions
As stated in the Executive Summary, one the objectives of the project are to provide the City of
Selma with a full range of solid waste management services that will allow the City to meet its
solid waste service needs and to increase the City's diversion of recyclable materials, in order to
achieve state mandated goals. Additionally, the Selma Disposal and Recycling and Transfer
Station (SORTS) will provide the region with services that can reduce operating expenses and air
quality impacts for smaller community service providers through the use of the transfer and
recycling operations.
Applicable State and Local Strategies, Known Mitigation
Under AB 32, ARB has the primary responsibility for reducing GHG emissions. However, the
many public agencies involved in land use decisions, energy use, waste streams, construction, and
other areas also are involved in the creation and implementation of strategies to reduce GHG
emissions in California. The CAT addresses strategies for certain California public agencies. In
addition, the California Attorney General's office has been active in advising public agencies on
reducing GHG emissions. Therefore, this analysis focuses on the Project's early implementation
of applicable state strategies. State strategies include measures in the 2006 CAT Report and
ARB's Early Action Measures. This analysis also focuses on the Project's implementation of the
applicable California Attorney General's Office suggested mitigation strategies for reducing
GHG emissions. To assess significance, the following documents were used.
• The 2006 CAT Report to Governor Schwarzenegger (CAT 2006).
• ARB's Expanded List of Early Action Measures to Reduce Greenhouse Gas Emissions in
California (CARB 2007b).
• California Attorney General's Office Mitigation Letter (AG 2008).
Project consistency or applicability with those measures is assessed below.
Table 21: California Greenhouse Gas Emission Reduction Strategies
Project DeslgnlMltlgatlon Strategy to Comply with Strategy
Apply advanced technology systems and management Consistent. The project is using transfer strategies to improve operational efficiency of trailers to reduce the number of collection transportation systems and movement of people, goods and . vehicles transporting MSW to landfills.
iservices. !
Limit idling time for commercial vehicles, including Consistent with California Air Resources delivery and construction vehicles. Board regulatory measure, which reduces
Michae' Brandman Associates S:\Oient PN-JN\3633 Selma DRTSlFinaJ Air SludyI36330001_AirQuaJityReport.doc
74

Selma Disposal and Recycling and Transfer Station - Selma, California Air Quality Impact Analysis Report Impact Analysts
emissions by limiting idling of heavy-duty diesel vehicles (ARB 2005).
Alternative Fuels - Biodiesel Blends: CARB would Not consistent. The measure is presently not develop regulations to require the use of I to 4 percent feasible due to limited availability ofbiodiesel biodiesel displacement of California diesel fuel. fuels and certified equipment and remoteness
of the project site. Additionally, there is a great deal of uncertainty of the effects of biodiesel on NOx emissions. The use of biodiesel has been shown to either keep NOx emissions the same or slightly increase them. (NREL 2005).
Water Use Efficiency: Approximately 19 percent of all Consistent. The project is planning on using electricity, 30 percent of all natural gas, and 88 million low water volume, high pressure washers and galIons of diesel are used to convey, treat, distribute and implementing standard water conservation use water and wastewater. Increasing the efficiency of measures. water transport and reducing water use would reduce greenhouse gas emissions.
Recycling and Waste: Increase waste diversion, Consistent. The project will assist the City of composting and commercial recycling and move toward Selma in meeting its mandated waste zero-waste. diversion goals and will also assist smaller
community service providers with recycling services.
Source for Measures: California Attorney General 2008; CAT 2006, CARB 2007b
The project would generate a minor amount of construction-related carbon dioxide, with most of
the emissions generated by off-road construction equipment and construction worker trips. Long
term operational GHG would decrease as result of the project.
Level ofSignificance Before Mitigation
Less than significant impact.
The nature of the project as a transfer station that reduces the VMT ofcollection vehicles reduces
the project's overall GHG emissions, additionally, the project is consistent with applicable
feasible mitigation measures, which reduce the project's emissions of greenhouse gas.
Additionally, even if the project's GHG emissions were all new they would fall below the draft
threshold developed by CARB of7,000 MTC02e/year from non-transportation related GHG
sources.
Mitigation Measures
No mitigation is required.
Level of Significance After Mitigation
Less than significant impact.
Cumulative Level-Analysis
Michael Brandman Associates S:\Client PN·JN\3633 Selma DRTS\Final Air Study\36330001_AiIQualilyReport.doc
75

Selma Disposal and Recycling and Transfer Station - Selma, California Air Quality Impact Analysis Report Impact Analysis
The project would provide a net reduction ofgreenhouse gas emissions of 1,433 metric tons per
year. Therefore, the project would not result in a contribution to cumulative greenhouse gas
impacts. In fact, the project would provide a cumulative benefit that would help reduce
greenhouse gas emissions and climate change impacts.
Michael Brandman Associates S:\Clienl PN-JNI3633 Selma DRTSlFinai Air SludyI36330001_AirQualityReport.doc
76

Selma Disposal and Recycling and Transfer Station - Selma, California Air Quality Impact Analysis Report References
SECTION 5: REFERENCES
The following references were used in the preparation of this analysis and are referenced in the
text and/or were used to provide the author with background infonnation necessary for the
preparation of thresholds and content.
AG 2008 California Attorney General's Office. January 7, 2008. The California Environmental Quality Act Mitigation for Global Wanning Impacts.
CA 2006 State of California. August 31,2006. Assembly Bill No. 32. www.arb.ca.gov/cc/docs/ab32text.pdf. Accessed April 8, 2008.
CAPCOA 2008 California Air Pollution Control Officers Association. January 2008. CEQA & Climate Change, Evaluating and Addressing Greenhouse Gas Emissions from Projects Subject to the California Environmental Quality Act. www.capcoa.org/, Accessed April 8, 2008.
CARB 2009 California Air Resources Board. Historical Air Quality, Website: http://www.arb.ca.gov/adam/welcome.html. Accessed April 6, 2009.
CARB 2008a California Air Resources Board. November 17, 2008. Ambient Air Quality Standards. Website: www.arb.ca.gov/research/aaqs/aaqs2.pdf. Accessed April 6, 2009.
CARB 2008b
CARB 2007a
California Air Resources Board. Preliminary Draft Staff Proposal Recommended Approaches for Setting Interim Significance Thresholds for Greenhouse Gases under the California Environmental Quality Act. www.arb.ca.gov/cc/localgov/ceqalmeetings/102708/prel imdraftproposall 02408. pdf California Air Resources Board. The California Almanac ofEmissions and Air Quality. 2006 Edition. Website http://www.arb.ca.gov/aqd/almanac/almanac.htm
CARB 2007b California Air Resources Board. Proposed Early Actions to Mitigate Climate Change in California. April 20, 2007. www.climatechange.ca.gov/climate_action_team/reports/index.html. Accessed April 16, 2009.
CARB 2005a California Air Resources Board. 2005. Reducing Idling Emissions From New and In-use Heavy-duty Trucks. October 25.
CARB 2005b
CAT 2006
California Environmental Protection Agency. California Air Resources Board. Air Quality and Land Use Handbook: A Community Health Perspective. April 2005. Website: www.arb.ca.gov/ch/landuse.htm. Accessed January 2009. State of California, Environmental Protection Agency, Climate Action Team. March 2006. Climate Action Team Report to Governor Schwarzenegger and the California Legislature. Website: www.climatechange.ca.gov/climate_action_team/reports/index.html, Accessed April 8, 2008.
Michael Brandman Associates S:\Client PN-JN\3633 Selma DRTS\Final Air Studyl36330001_AirQualityReport.doc
77

Selma Disposal and Recycling and Transfer Station - Selma, California Air Quality Impact Analysis Report References
CEC 2005 California Energy Commission. California's Energy-Water Relationship. Final Staff Report. November 2005. CEC-700-2005-0 II-SF. Website: http://www.energy.ca.gov/2005publications/CEC-700-2005-0 II/CEC-7002005-011-SF.PDF
County of Fresno County of Fresno Community Health Department, Enforcement Agency Notification, SWIS ID # 10-AA-019I, October 8, 2004
EPA 2008a U.S. Environmental Protection Agency. Six Common Air Pollutants. Health and Environmental Impacts ofNOx• Last updated on May 9,2008. Website: http://www.epa.gov/air/urbanair/nox/hlth.html. Accessed December 22, 2008.
EPA 2008b U.S. Environmental Protection Agency. Indoor Air Quality. Sources of Indoor Air Pollution - Organic Gases (Volatile Organic Compounds - VOCs). Last updated on May 9, 2008. Website: http://www.epa.gov/iaq/voc.html. Accessed December 22, 2008.
EPA 2008c U.S. Environmental Protection Agency. Six Common Air Pollutants. Health and Environmental Impacts of Particulate Matter. Last updated on May 9, 2008. Website: http://www.epa.gov/air/particlepollution/ health.html. Accessed December 22, 2008
EPA 2008d U.S. Environmental Protection Agency. Six Common Air Pollutants. Health and Environmental Impacts of Carbon Monoxide. Last updated on May 9,2008. Website: http://www.epa.gov/air/urbanair/co/index.html. Accessed December 22,2008.
EPA 2002 U.S. Environmental Protection Agency. Health Assessment Document for Diesel Engine Exhaust. EPN600/8-90/057F. May 2002. Website: http://cfpub.epa.gov/ncea/cfrn/recordisplay.cfm?deid=29060. Accessed January 11,2007.
EPA 1999a U.S. Environmental Protection Agency. September 15, 1999. "Ozone and Your Health." Website: http://www.epa.gov/airnow/ozone-c.pdf. Accessed December 22,2008.
EPA 1997 U.S. Environmental Protection Agency. Office of Air and Radiation. Nitrogen Oxides: Impact on Public Health and the Environment. 1997. Website: http://www.epa.gov/ttn/oarpg/t I/reports/noxrept.pdf
EPA 1997b U.S. Environmental Protection Agency. Office of Air and Radiation. Emission Factors for Locomotives. Website: http://www.epa.gov/OMS/regs/nonroadllocomotv/frrn/42097051.pdf
Larson & Assoc. George H. Larson & Associates Inc. and International Engineering Services, Inc., "Transfer Processing Report and Operational Statement, Selma Disposal and Recycling and Transfer Station", January 2009.
Michael Brandman AssocIates S:lelien! PN·JNI3633 Selma DRTSIFinal Air StudyI36330001_AirQualilyReport.doc
78

Selma Disposal and Recycling and Transfer Station - Selma, California Air Quality Impact Analysis Report References
IPCC 2004 Intergovernmental Panel on Climate Change. 2004. 16 Years of Scientific Assessment in Support of the Climate Convention. December 2004. www.ipcc.ch/pdf/I Oth-anniversary/anniversary-brochure.pdf Accessed April 8, 2008.
NREL 2005 National Renewable Energy Laboratory. 2005. Effects of Biodiesel on NOx Emissions. ARB Biodiesel Workgroup. NRELJPR-540-38296. June 8, 2005. Website: http://www.nre1.gov/vehic1esandfuels/npbf/pdfs/38296.pdf. Accessed February 20, 2009.
OPR 2008 Governor's Office of Planning and Research. Technical Advisory. CEQA AND CLIMATE CHANGE: Addressing Climate Change Through California Environmental Quality Act (CEQA) Review. June 19,2008. www.opr.ca.gov/index.php?a=ceqa/index.html
OPR 2009
Selma 2008
Governor's Office of Planning and Research. Proposed CEQA Guideline Amendments for Greenhouse Gas Emissions. April 13, 2009. http://www.opr.ca.gov/ceqa/pdfsJPA_CEQA_Guidelines.pdf City of Selma, Draft General Plan Policies Statement, August 2008
SJVAPCD 2002 San Joaquin Valley Air Pollution Control District. 2002. Guide for Assessing and Mitigating Air Quality Impacts. 2002.
SJVAPCD 2008 San Joaquin Valley Air Pollution Control District. Ambient Air Quality Standards and Valley Attainment Status. http://www.valleyair.org/aqinfo/attainment.htm. Accessed April 8, 2009.
SJVAPCD 2008b San Joaquin Valley Air Pollution Control District, Comment Letter received from the SJVAPCD on June 19, 2008 regarding the Draft Environmental Impact Report: Tulare Motor Sports Complex.
SJVAPCD 2006a San Joaquin Valley Air Pollution Control District. 2006. 2006 PM I0 Plan: San
Joaquin Valley Strategy for Meeting Federal Air Quality Requirements for
Particulate Matter 10 Microns and Smaller.
UNFCCC 2007 United Nations Framework Convention on Climate Change. Essential Background. http://unfccc.int/essential_backgroundiconvention/items/2627.php, Accessed April 8, 2008.
WH 2008 White House. G8 Summit 2008. www.whitehouse.gov/g8/2008/
Michael Brandman Associates S:\Client PN-JNI3633 Selma DRTSlFinal Air StudyI36330001_AirQualityReport.doc
79

Selma Disposal and Recycling and Transfer Station - Selma, California Air Quality Impact Analysis Report
This page intentionally left blank
Michael Brandman Associates BO S:\Clienl PN·JN\3633 Selma DRTS\Finai Air Study136330001_AirQuaiityReport.doc

Selma Disposal and Recycling and Transfer Station - Selma, California Air Quality Impact Analysis Report
Appendix A: Table of Assumptions, Emission Spreadsheets, URBEMIS 2007 Model Output,
GHG Spreadsheets
Michael Srandman Associates S:\Clienl PN-JN\3633 Selma DRTS\Final Air Study\36330001_AirQualityReport.doc

Selma Disposal and Recycling and Transfer Station - Selma, California Air Quality Impact Analysis Report
This page intentionally left blank
Michael Brllndman Associates S:\Clienl PN-JN\3633 Selma DRTS\Final Air SlUdy\3633lJOOI_AiIQualilyReport.doc
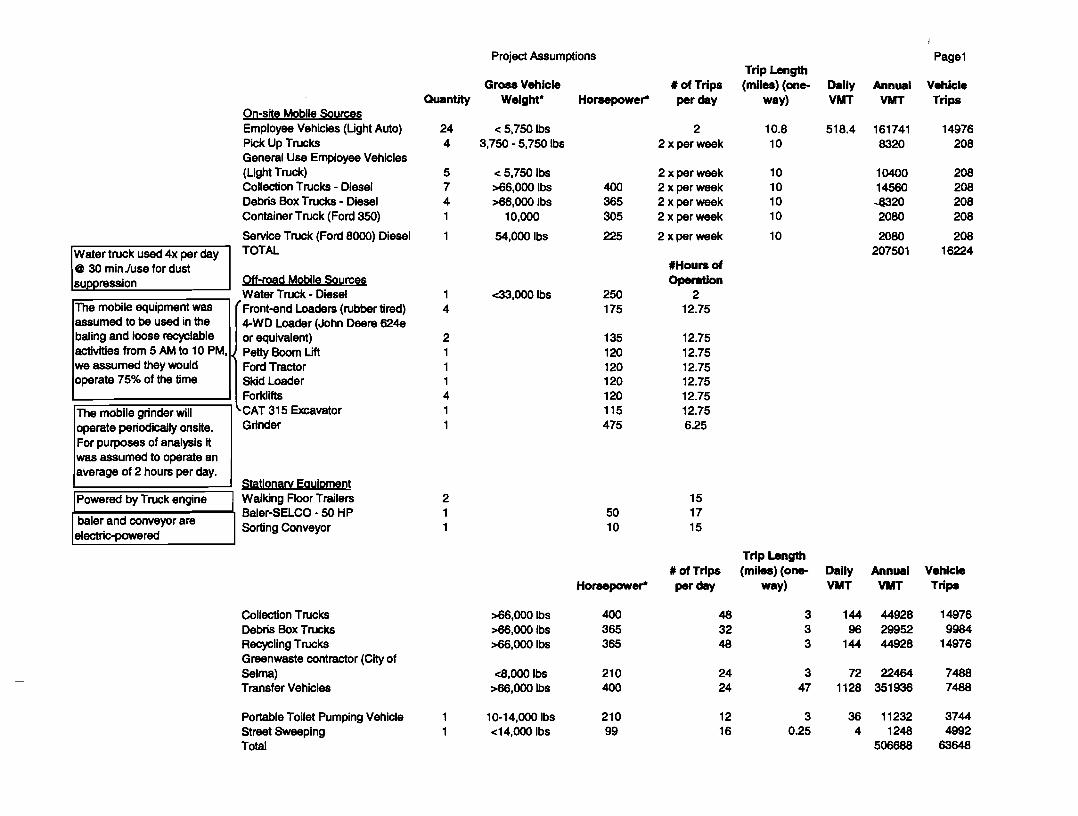
Water truck used 4x per day @ 30 minluse for dust suppression
The mobile equipment was assumed to be used in the baling and loose recyclable activities trom 5 AM to 10 PM, we assumed they would operate 75% of the time
The mobile grinder will operate periodically onslte. For purposes of analysis it was assumed to operate an average of 2 hours per day.
Powered by Truck engine
baler and conveyor are electric-powered
Project Assumptions Page1 Trip Length
Gross Vehicle , of Trips (miles) (one- Dally Annual Vehicle Quantity Weight· Horsepower'" per day way) VMT VMT Trips
On-site Mobile Sources Employee Vehicles (Ught Auto) 24 < 5,750 Ibs 2 10.8 518.4 161741 14976 Pick Up Trucks 4 3,750 - 5,750 Ibs 2 x per week 10 8320 208 General Use Employee Vehicles (Light Truck) 5 < 5,750 Ibs 2 x per week 10 10400 208 Collection Trucks - Diesel 7 >66,000 Ibs 400 2 x per week 10 14560 208 Debris Box Trucks - Diesel 4 >66,OOOlbs 365 2 x per week 10 -&320 208 Container Truck (Ford 350) 1 10,000 305 2 x per week 10 2080 208
Service Truck (Ford 8000) Diesel 1 54,000 Ibs 225 2 x per week 10 2080 208 TOTAL 207501 16224
'Hours of Off-road Mobile Sources Operation Water Truck· Diesel 1 <33,ooOlbs 250 2 Front-end Loaders (rubber tired) 4 175 12.75 4-WD Loader (John Deere 6249 or equivalent) 2 135 12.75 Petty Boom Lift 1 120 12.75 Ford Tractor 1 120 12.75 Skid Loader 1 120 12.75 Forklifts 4 120 12.75 CAT 315 Excavator 1 115 12.75 Grinder 1 475 6.25
Stationarv Equipment Walking Roor Trailers 2 15 Baler-SELCO - 50 HP 1 50 17 Sorting Conveyor 1 10 15
Trip Length , of Trips (miles) (one- Daily Annual Vehicle
Horsepower'" per day way) VMT VMT Trips
Collection Trucks >66,ooOlbs 400 48 3 144 44928 14976 Debris Box Trucks >66,OOOlbs 365 32 3 96 29952 9984 Recycling Trucks >66,000 Ibs 365 48 3 144 44928 14976 Greenwaste contractor (City of selma) <8,000 Ibs 210 24 3 72 22464 7488 Transfer Vehicles >66,OOOlbs 400 24 47 1128 351936 7488
Portable Toilet Pumping Vehicle 1 10-14,000 Ibs 210 12 3 36 11232 3744 Street Sweeping 1 <14,000 Ibs 99 16 0.25 4 1248 4992 Total 506688 63648
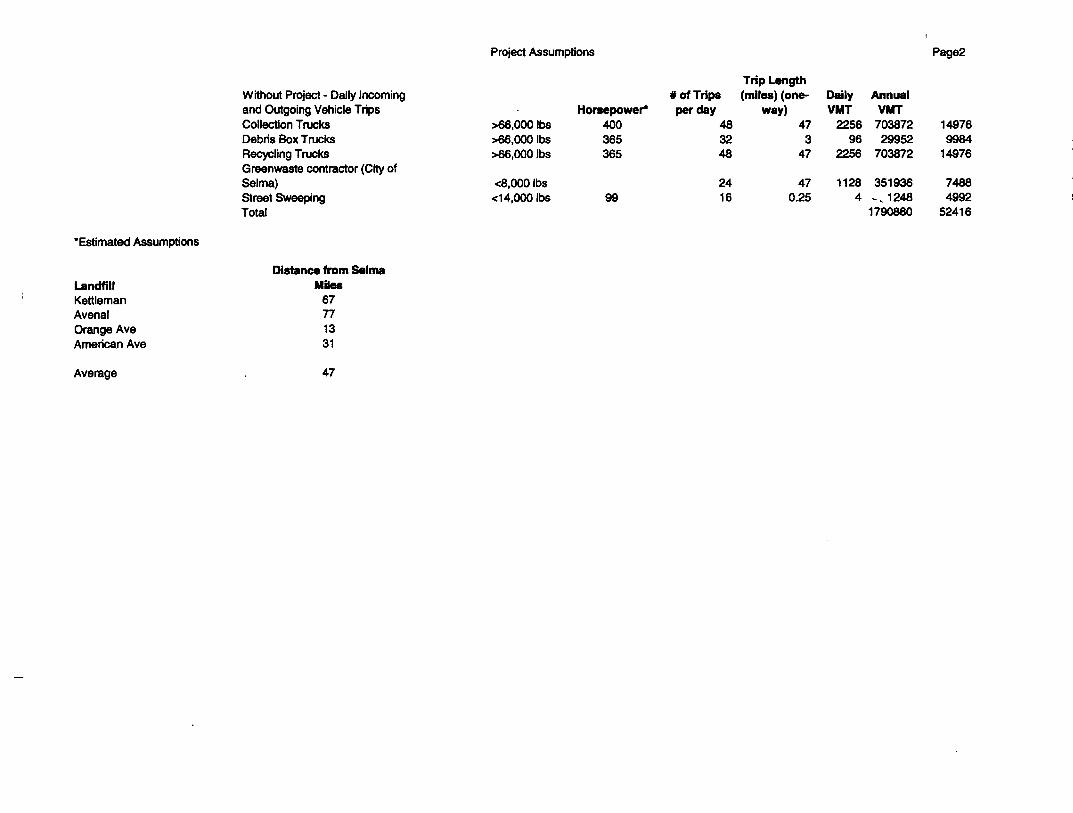
Project Assumptions Page2
Trip Length Without Project· Daily Incoming , ofTripa (miles) (one- Daily Annual and Outgoing Vehicle Trips Horsepower* per day way) VMT VMT Collection Trucks >66,Ooolbs 400 48 47 2256 703872 14976 Debris Box Trucks >66,000 Ibs 365 32 3 96 29952 9984 Recycling Trucks >66,ooOlbs 365 48 47 2256 703872 14976 Greenwaste contractor (City of Selma) <8,ooOlbs 24 47 1128 351936 7488 Street Sweeping <14,000 Ibs 99 16 0.25 4 -,1248 4992 Total 1790880 52416
-Estimated Assumptions
Distance from Selma Landfill Miles Kettleman 67 Avenal n Orange Ave 13 American Ave 31
Average 47

Emissions Summary
Net Emissions .30 -3.22 -10. .80 -1488.53
Significance Threshold 10 N/A 10 15
Significant? No No No No
No 9.01 2814.87Project
753.47
3622.11
No Project
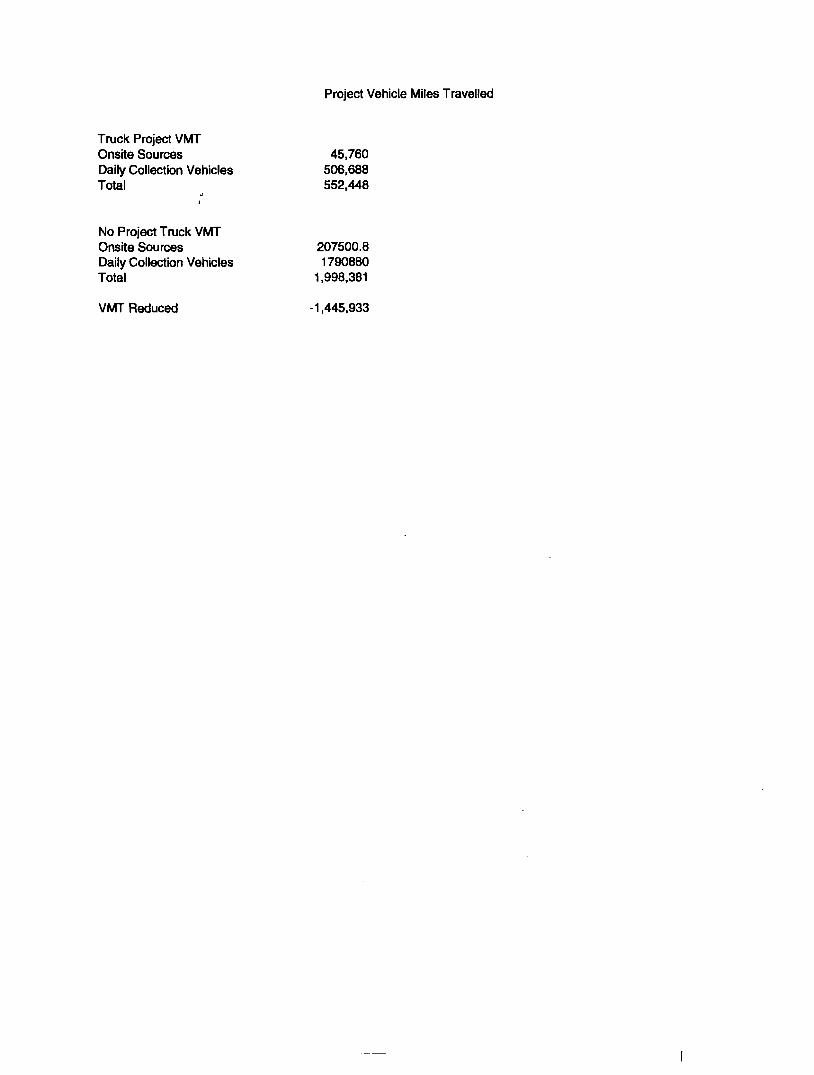
Truck Project VMT Onsite Sources Daily Collection Vehicles Total .
j
No Project Truck VMT Onsite Sources Daily Collection Vehicles Total
VMT Reduced
Project Vehicle Miles Travelled
45,760 506,688 552,448
207500.8 1790880
1,998,381
-1,445,933
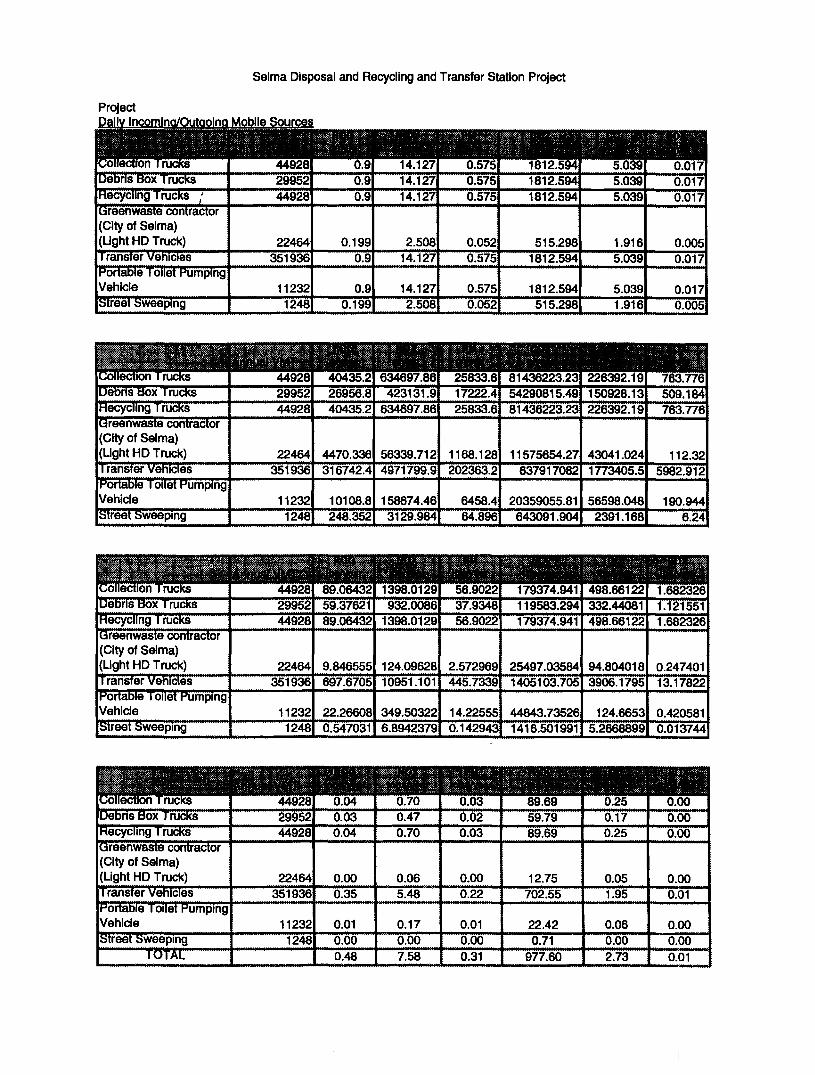
Selma Disposal and Recycling and Transfer Station Project
22464 0.199 2.508 0.052 515.298 1.916 0.005 351936 0.9 14.127 0.575 1812.594 5.039 0.017
11232 0.9 14.127 0.575 1812.594 5.039 0.017 1248 0.199 2.508 0.052 515.298 1.916 0.005
22464 4470.336 56339.712 1168.128 11575654.27 43041.024 112.32 351936 316742.4 4971799.9 202363.2 637917082 1773405.5 5982.912
11232 10108.8 158674.46 6458.4 20359055.81 56598.048 190.944 1248 248.352 3129.984 64.896 643091.904 2391.168 6.24
22464 9.846555 124.09628 2.572969 25497.03584 94.804018 0.247401 351936 697.6705 10951.101 445.7339 1405103.705 3906.1795 13.17822
11232 22.26608 349.50322 14.22555 44843.73526 124.6653 0.420581 1248 0.547031 6.8942379 0.142943 1416.501991 5.2668899 0.013744
22464 0.00 0.06 0.00 12.75 0.05 0.00 351936 0.35 5.48 0.22 702.55 1.95 0.01
11232 0.01 0.17 0.01 22.42 0.06 0.00 1248 0.00 0.00 0.00 0.71 0.00 0.00
0.48 7.58 0.31 977.60 2.73 0.01

No Project
80870.4 703872
29952 703872
351936 1248
0.083 0.9 0.9 0.9
0.199 0.199
0.208 14.127 14.127 14.127
2.508 2.508
0.031 0.575 0.575 0.575
0.052 0.052
363.465 1812.594 1812.594 1812.594
515.298 515.298
3.227 5.039 5.039 5.039
1.916 1.916
0.004 0.017 0.017 0.017
0.005 0.005
80870.4 793728
29952 793728
396864 1248
6712.243 633484.8
26956.8 633484.8
70035.26 248.352
16821.0432 9943599.74 423131.904 9943599.74
882655.488 3129.984
2506.982 404726.4
17222.4 404726.4
18300.67 64.896
29393559.94 1275834164
54290815.49 1275834164
181351916.9 643091.904
260968.78 3546811
150928.13 3546811
674309.38 2391.168
323.4816 11965.82
509.184 11965.82
1759.68 6.24
80870.4 14.78468 37.0507559 5.521988 64743.52409 574.8211 0.712515 793728 1395.341 21902.2021 891.4678 2810207.41 7812.359 26.35644
29952 59.37621 932.008599 37.9348 119583.294 332.44081 1.121551 793728 1395.341 21902.2021 891.4678 2810207.41 7812.359 26.35644
39f?864 154.2627 1944.17508 40.30985 399453.5615 1485.2629 3.875947 1248 0.547031 6.89423789 0.142943 1416.501991 5.2668899 0.013744
80870.4 793728
29952 793728
0.01 0.70 0.03 0.70
0.02 10.95 0.47 10.95
0.00 0.45 0.02 0.45
32.37 1405.10
59.79 1405.10
0.29 3.91 0.17 3.91
0.00 0.01 0.00 0.01
396864 1248
0.08 0.00 1.51
0.97 0.00
23.36
0.02 0.00 0.93
199.73 0.71
3102.81
0.74 0.00 9.01
0.00 0.00 0.03

On-site Mobile Sources
161740.8 0.083 0.208 0.031 363.465 3.227 0.004
10400 0.083 0.208 0.031 363.465 3.227 0.004 8320 0.114 0.404 0.044 448.677 4.372 0.004
14560 0.9 14.127 0.575 1812.594 5.039 0.017
8320 0.9 14.127 0.575 1812.594 5.039 0.017
2080 0.199 2.508 0.052 515.298 1.916 0.005
2080 0.9 14.127 0.575 1812.594 5.039 0.017
161740.8 13424.49 33642.09 5013.96 58787120 521937.56 646.96
10400 8320
863.2 948.48
2163.2 3361.28
322.4 366.08
3780036 3732992.64
33560.8 36375.04
41.6 33.28
14560 13104 205689.12 8372 26391368.6 73367.64 247.52
8320
2080
2080
7488
413.92
1872
117536.64
5216.64
29384.16
4764
108.16
1196
15080782.1
1071819.64
3770195.52
41924.46
3985.26
10481.12
141.44
10.4
35.36
161740.8
10400 8320
14560
8320
2080
2080
29.57
1.90 2.09
28.86
16.49
0.91
4.12
74.10
4.76 7.40
453.06
258.89
11.49
64.72
11.04
0.71 0.81
18.44
10.54
0.24
2.63
129487.05
8326.07 8222.45
58130.77
33217.58
2360.84
8304.40
1149.64 1.43
73.92 80.12
161.60
92.34
8.78
0.09 0.07
0.55
0.31
0.02
23.09 0.08

0.00 161740.8
10400 8320
14560
8320
2080
2080
0.01
0.00 0.00
0.01
0.01
0.00
0.00 0.03
0.04 0.01 64.74 0.57
0.00 0.00
0.23
0.13
0.01
0.03 0.40
0.00 0.00
0.01
0.01
0.00
0.00 0.02
4.16 4.11
29.07
16.61
1.18
4.15 59.28
0.04 0.00 0.04 0.00
0.08 0.00
0.05 0.00
0.00 0.00
0.01 0.00 0.22 0.00

Selma Disposal and Recycling and Transfer Station - Offroad Mobile Equipment
Hours of Horsepower Load Factor
Operation
250 0.50 2.00
175 0.54 12.75 0.426 3.326 0.192 307.158
135 0.55 12.75 0.375 2.977 0.173 312.846 120 0.60 12.75 0.477 3.074 0.246 261.653 120 0.55 12.75 0.55 3.022 0.312 312.846 120 0.55 12.75 0.44 3.022 0.26 312.846 120 0.30 12.75 0.326 1.903 0.186 170.643 115 0.57 12.75 0.616 3.7 0.344 324.222 475 0.65 2.00 0.99 6.9 0.4 521.63
0.319 3.144 0.112 324.222 0.837 0.004
#of Equipment
1
4 'eere I
2 1 1 1 4 1 1
#of Equipment
1
4 eare I
2 1 1 1 4 1 1
1.828
1.815 1.71-5 2.191 2.064 1.224 2.342
8.5
0.003
0.004 0.003 0.004 0.004 0.002 0.004 0.183
I 14.46
7.57 2.75 3.37 3.37 3.67 3.34
113.00
Horsepower Load Factor Hours of Operation
250 0.50 2.00 79.75 786.00 28.00 81055.50 209.25
175 0.54 12.75 2053.11 16029.66 925.34 1480347.98 8810.05
135 12.75 5636.58 327.55 592334.800.55 710.02 3436.48 120 0.60 12.75 437.89 2821.93 225.83 240197.45 1574.37 120 0.55 12.75 462.83 2543.01 262.55 263259.91 1843.73 120 0.55 12.75 370.26 2543.01 218.79 263259.91 1736.86 120 0.30 12.75 598.54 3493.91 341.50 313300.55 2247.26 115 0.57 12.75 514.83 3092.32 287.50 270972.59 1957.36 475 0.65 2.00 611.33 4260.75 247.00 322106.53 5248.75
#of Horsepower Load Factor
Hours of Equipment Operation
250 0.50 2.00
4 175 0.54 12.75 4.52 35.31 I 2.04 I 3260.68 I 19.41 I 0.03 eere I
2 135 0.55 12.75 1.56 12.42 0.72 1304.70 7.57 0.02 1 120 0.60 12.75 0.96 6.22 0.50 529.07 3.47 0.Q1 1 120 0.55 12.75 1.02 5.60 0.58 579.87 4.06 0.01 1 120 0.55 12.75 0.82 5.60 0.48 579.87 3.83 0.01 4 120 0.30 12.75 1.32 7.70 0.75 690.09 4.95 0.01 1 115 0.57 12.75 1.13 6.81 0.63 596.86 4.31 0.01 1 475 0.65 2.00 1.35 9.38 0.54 709.49 11.56 0.25

Selma Disposal and Recycling and Transfer Station - Offroad Mobile Equipment
IHorsepower Load Factor 1~l"\llreo "f
250 0.50
4 I 175 0.54 12.75 0.71 5.51 0.32 508.67 3.03 0.00
2 135 0.55 12.75 0.24 1.94 0.11 203.53 1.18 0.00 1 120 0.60 12.75 0.15 0.97 0.08 82.53 0.54. 0.00 1 120 0.55 12.75 0.16 0.87 0.09 90.46 0.63 0.00 1 120 0.55 12.75 0.13 0.87 0.08 90.46 0.60 0.00 4 120 0.30 12.75 0.21 1.20 0.12 107.65 0.77 0.00 1 115 0.57 12.75 0.18 1.06 0.10 93.11 0.67 0.00 1 475 0.65 2.00 0.21 1.46 0.08 110.68 1.80 0.04
2.01 14.16 0.98 1314.95 9.30 0.05

#of Horsepower Load Factor
Hours of Equipment Operation
250 0.50 2.00 0.18 1.73 0.06 178.54 0.46 0.00
4 175 0.54 7.50 2.66 20.n 1.20 1918.05 11.41 0.02 eere I
2 135 0.55 7.50 0.92 7.30 0.42 767.47 4.45 0.01 1 120 0.60 7.50 0.57 3.66 0.29 311.22 2.04 0.00 1 120 0.55 7.50 0.60 3.29 0.34 341.10 2.39 0.00 1 120 0.55 7.50 0.48 3.29 0.28 341.10 2.25 0.00 4 120 0.30 7.50 0.78 4.53 0.44 405.93 2.91 0.00 1 115 0.57 7.50 0.67 4.01 0.37 351.09 2.54 0.00 1 475 0.65 2.00 1.35 9.38 0.54 709.49 11.56 0.25
No Project - Off-Road Mobile Equipment
#of Hours of Horsepower Load Factor
Equipment Operation
1 250 0.50 2.00
4 175 0.54 7.50 I 0.426 I 3.326 I 0.192 I 307.158 I 1.828 I 0.003 leere I
2 135 0.55 7.50 0.375 2.9n 0.173 312.846 1.815 0.004 1 120 0.60 7.50 O.4n 3.074 0.246 261.653 -1..715 0.003 1 120 0.55 7.50 0.55 3.022 0.312 312.846 2.191 0.004 1 120 0.55 7.50 0.44 3.022 0.26 312.846 2.064 0.004 4 120 0.30 7.50 0.326 1.903 0.186 170.643 1.224 0.002 1 115 0.57 7.50 0.616 3.7 0.344 324.222 2.342 0.004 1 475 0.65 2.00 0.99 6.9 0.4 521.63 8.5 0.183
#of Hours of Horsepower Load Factor
Equipment Operation
1 250 0.50 2.00
4 175 0.54 7.50 1207.71 9429.21 544.32 870792.93 5182.38 I 8.51 'eere I
2 135 0.55 7.50 417.66 3315.63 192.68 348432.23 2021.46 4.46 1 120 0.60 7.50 257.58 1659.96 132.84 141292.62 926.10 1.62 1 120 0.55 7.50 272.25 1495.89 154.44 154858.n 1084.55 1.98 1 120 0.55 7.50 217.80 1495.89 128.70 154858.n 1021.68 1.98 4 120 0.30 7.50 352.08 2055.24 200.88 184294.44 1321.92 2.16 1 115 0.57 7.50 302.84 1819.01 169.12 159395.64 1151.39 1.97 1 475 0.65 2.00 611.33 4260.75 247.00 322106.53 5248.75 113.00

No Project - Off-Road Mobile Equipment
Horsepower Load Factor 1~,...I.Pro ,...f
250 0.50
4 175 0.54 7.50 0.41 3.24 0.19 299.22 1.78 0.00
2 135 0.55 7.50 0.14 1.14 0.07 119.73 0.69 0.00 1 120 0.60 7.50 0.09 0.57 0.05 48.55 0.a2 0.00 1 120 0.55 7.50 0.09 0.51 0.05 53.21 0.37 0.00 1 120 0.55 7.50 0.07 0.51 0.04 53.21 0.35 0.00 4 120 0.30 7.50 0.12 0.71 0.07 63.33 0.45 0.00 1 115 0.57 7.50 0.10 0.63 0.06 54.n 0.40 0.00 1 475 0.65 2.00 0.21 1.46 0.08 110.68 1.80 0.04
1.28 9.04 0.62 830.54 6.24 0.05
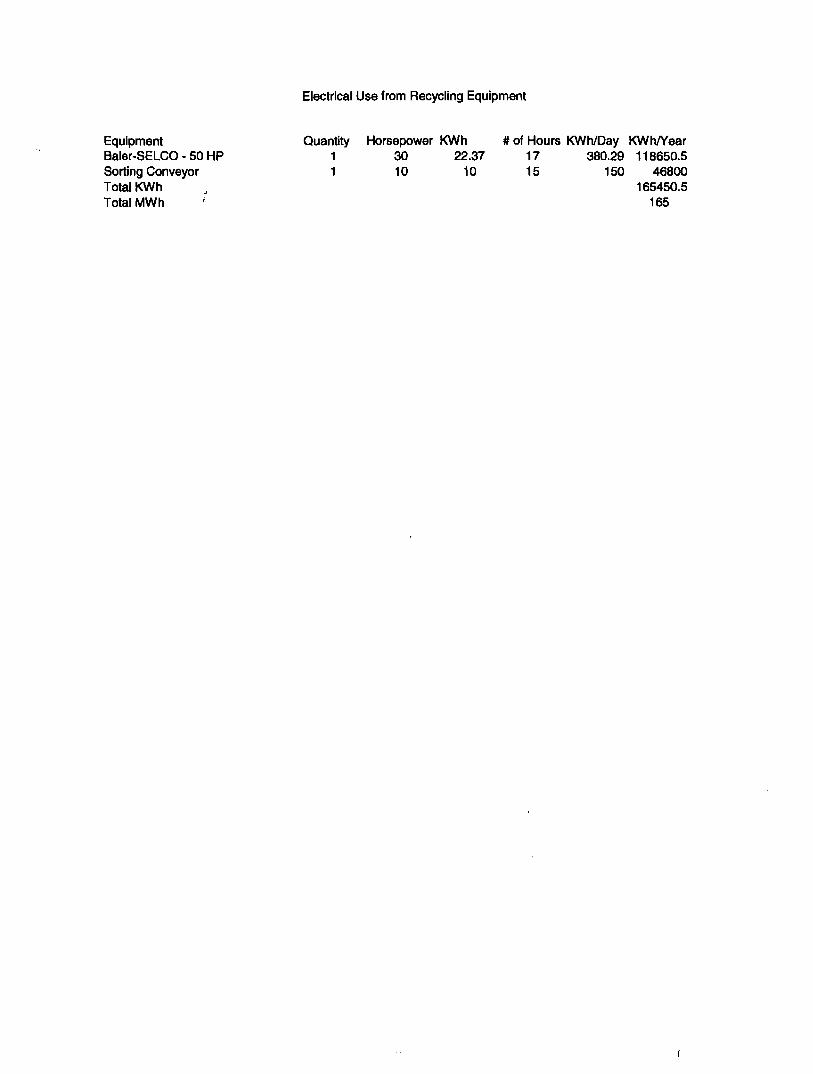
Electrical Use from Recycling Equipment
Equipment Quantity Horsepower KWh # of Hours KWh/Day KWhNear Baler-SELCO - 50 HP 1 30 22.37 17 380.29 118650.5 Sorting Conveyor 1 10 10 15 150 46800 Total KWh , 165450.5 Total MWh I 165

Electricity - Indirect Emissions Project: SORTS Prepared by: Michael Brandman Associates Prepared on: " 4/24/2009
Land Use s9uarefeet (s!l . togqOffice
8h,op 3800 4;45 16910 er~·~~·ing •.f.r'~.· 4800 4.45 21360 6@ffJr/Ponveyor 149111 Total 200481
200 MWhlyear
Emission Factor (pounds per Emissions Emissions
Greenhouse Gas MWhlyear) (poundslyear) (tonslyear) Carbon dioxide 804.54 161,295 81 Methane 0.0067 1 0.00 Nitrous oxide 0.0037 1 0.00
Emission factor source: California Climate Action Registry. General Reporting Protocol. Reporting Entity-Wide Greenhouse Gas Emissions. Version 2.2, March 2007. www.climateregistry.org

Project - Water Use
Electricity Use in Typical Urban Water Systems Project: SORTS Prepared by: Michael Brandman Associates Prepared on: , 4/24/2009
I
kWhlMG Northern California Southern California
Water Supply and Conveyance 2,117 9,727 Water Treatment 111 111 Water Distribution 1,272 1,272 Wastewater Treatment 1,911 1,911
Totals 5,411 13,021 From CEC 2006
Millions Gallons Gallons per day (MG) per year
.. ·.4eQQWater Usage 1.7885
kWh MWh Energy Usage 9,678 10
Indirect Electricity Emission Factor
(pounds per Emissions Emissions Greenhouse Gas MWhlyear) (poundslyear) (tonslyear) Carbon dioxide 804.54 7,786 4 Methane 0.0067 0.06 0.000 Nitrous oxide 0.0037 0.04 0.000
Emission factor for electricity source: Califomia Climate Action Registry. General Reporting Protocol. Reporting Entity-Wide Greenhouse Gas Emissions. Version 2.2, March 2007. www.climateregistry.org
CEC 2006. Navigant ConSUlting, Inc. 2006. Refining Estimates of Water-Related Energy Use in califomia. California Energy Commission, PIER IndustriaVAgricunurallWater End Use Energy Efficiency Program. CEG-50Q-2006-118. www.energy.ca.govlpier/projecUeportslCEC-5002006-118.html

Natural Gas Combustion SORTS Prepared by Michael Brandman Associates
4/2412009
Annual Natural - • Square Gas Uaage Natural Gas Em_Ion Feet or Factor" Uaage for Project Factor Emiasions Emi..ions Emi..ions
Gas Type of LAnd Use Units (kBTUlsf) (MMBTUIyear) (glMMBTU)** (gt'year) (tonelyeer) (poundalday)
Methane~I:Offl~ ..•.. :;:1Q6(i:::':'25.99 26 4.75 123 0.00 0.00 Warehouse 8600 3.4 30 4.75 141 0.00 0.00
o 4.75 0 0.00 0.00
Nitrous Oxide Small Office 1000 25.99 26 0.095 2 0.00 0.00 Warehouse 8600 3.44 30 0.095 3 0.00 0.00
0.00 o 0.095 o 0.00 0.00
Nitrous Units Mathane Oxide
Table E-1: OVerview of Energy Usage in the Statewide 5efvice Areapounds per day 0.00 0.00 tons per year 0 0 GWP 21 310 MTC02 Eqlyear 0.01 0.00
""Table E-1 from C8Jifomia Energy Commission. C8Jifomia Commercial EndUse Survey. Consultant Report. March 2006. CEG-400-2006-005
.. USEPA. 2004: Direct Emissions from Stationary Combulltion Sources. Climate Leaders Greenhouse Inventory Protocol. Core Model Guidance. October 2004
11.!4
1i/l.0IIl<l8 IU122,1J12 I IAIlI14__ ~ 6G,7lI6J 6-741
IUti
Cl.34
D.76 .....53· -, 115.7D
DA:l 42.40 3Z75 1US!
I 11.23 23.34 111817 2S6A1O
I Cl.1l! 17JlO 164Jll 18250
Cl.c3 3.44 eac 22.AD

Project - Refrigerants
Air Conditioning and Refrigeration Fugitive Emissions Project: SORTS Prepared by: Michael Brandman Associates Prepared on: 412412009
-. Annual Leak
Rate in Global Metric Tons Capacity of percent of Emissions Emissions Warming C02
TyPe of Unit Units Unit (kg) capacity (kg/y!ar) (ton!lyear) Potential Equiv./year Domestic Refrigeration 0.5 0.5% 0 0.0001300 0 Commercial Refrigeration 1000 35.0% 0 0.000 . ·1300 0
Residential AlC 50 10% 0 0 .. 1300 0 OfficeAlC 100 10% 10 0.011 ··1300 13 Commercial AlC 100 10% 0.0 0.000 1300 0 Industrial AlC 100 10% 10 0.011 i1300 13
Total 0.022 26
Source: U.S. Environmental Protection Agency. Climate Leaders. May 2008. Direct HFC and PFC Emissions from Use of Refrigeration and Air Conditioning Equipment. EPA430-K-03-004. http://www.epa.gov/stateply/documentsiresourceslmfgrfg.pdf. Accessed in July 2008.

No Project - Electricity
Electricity - Indirect Emissions Project: SDRTS Prepared by: Michael Brandman Associates Prepared on: : 4/2412009
.. EI~lqltylJ" . Electricity Use Land Use s9uare feet (sn .... . (kWtvlf...t)- ••.. (kWhlyear) ()fffqe . 13100 Shop 16910 Processing Area 21360
Total 51370 51 MWhlyear
Emission Factor (pounds per Emissions Emissions
Greenhouse Gas MWh/year) (poundalyear) (tonalyear) Carbon dioxide 804.54 41,329 21 Methane 0.0067 o 0.00 Nitrous oxide 0.0037 o 0.00
Emission factor source: California Climate Action Registry. General Reporting Protocol. Reporting Entity-Wide Greenhouse Gas Emissions. Version 2.2, March 2007. www.climateregistry.org
*

No Project - Water
Electricity Use in Typical Urban Water Systems Project: SORTS Prepared by: Michael Brandman Associates Prepared on: 0 4124/2009
I
Water Supply and Conveyance Water Treatment Water Distribution Wastewater Treatment
Totsls From CEC 2006
kWhlMG Northern California Southern California
2,117 9,727 111 111
1,272 1,272 1,911 1,911 5,411 13,021
Water Usage Gallons per day
···•·•··•·•. 4800
Millions Gallons (MG) per year
1.752
Energy Usage kWh
9,480 MWh
9
Greenhouse Gas Carbon dioxide Methane Nitrous oxide
Indirect Electricity Emission Factor
(pounds per MWhlyear)
804.54 0.0067 0.0037
Emissions (poundslyear)
7,627 0.06 0.04
Emissions (tonslyear)
4 0.000 0.000
Emission factor for electricity source: California Climate Action Registry. General Reporting Protocol. Reporting Entity-Wide Greenhouse Gas Emissions. Version 2.2, March 2007. www.climateregistry.org
CEC 2006. Navigant Consulting, Inc. 2006. Refining Estimates of Water-Related Energy Use in California. California Energy Commission, PIER Industrial/AgriculturallWater End Use Energy Efficiency Program. CEC-500-2006-118. www.energy.ca.gov/pier/projecueportslCEC-5002006-118.html

Natural Gas Combustion SORTS Prepared by Michael Brandman Associates
4/2412009
Gas
Methane~n)aJl
Type of Land Usa
!0ffic8iiij;:Warehouse
Square Feet or Units
'i';l()o8600
Annual Natural Gas Usage
Facto" (kBTUlsf)
(:)ii:~~99 3.4
Natural Gas Usage for Pro;ect
(MMBTUIyear)
26 30 o
Emluion Factor
(glMMBTU)**
4.75 4.75 4.75
Emi..ions (glyear)
123 141
0
Emi..ions (tonslyear)
0.00 0.00 0.00
- <
Emi..ions (pound81day)
0.00 0.00 0.00
Nitrous Oxide Small Office 1000 25.99 26 0.095 2 0.00 0.00 Warehouse 8600 3.44 30 0.095 3 0.00 0.00
0.00 o 0.095 o 0.00 0.00
Nitrous Units Methane Oxide
Table E-1: Overview of Energy Usage in the Statewide seMat Areapounds per day 0.00 0.00 tons per year 0 0 GWP 21 310 MTC02 Eqlyear 0.01 0.00
• ·Table E·1 from Califomia Energy Commission. California Commercial EndUse Survey. Consultant Report. March 2006. CEc-400-2006-005
•• USEPA, 2004: Direct Emissions from Stationary Combustion Sources, Climate Leaders Greenhouse Inventory Protocol, CoI8 Model Guidance. October 2004
Q. til 182.90
Q.Il3 22.AD
-III!l3lI
AI~
-.ant
".
!!!!!!!..!!!!!.
"

Air Conditioning and Refrigeration Fugitive Emissions Project: SORTS Prepared by: Michael Brandman Associates Prepared on: 412412009
Annual Leak Rate in Global Metric Tons
Capacity of percent of Emissions Emissions Warming C02 TyPe of Unit Units Unit (kg) capacity (kgiyear) (tonsiyear) Potential Equiv.!year Domestic Refrigeration 0.5 0.5% 0 0.000 ··;1aQO 0 Commercial Refrigeration 1000 35.0% 0 O.oool~ 0
Residential AlC 50 10% 0 0 4300 0 OfficeAlC 100 10% 10 0.011 ····1:3()Q 13 Commercial AlC 100 10% 0.0 0.000 ··'1'300 0 Industrial AlC 100 10% 10 0.011 1~ 13
Total 0.022 26
Source: U.S. Environmental Protection Agency, Climate Leaders. May 2008. Direct HFC and PFC Emissions from Use of Refrigeration and Air Conditioning Equipment. EPA430-K-Q3-004. http://www.epa.gov/stateply/documentslresourceslmfgrtg.pdf, Accessed in July 2008.

Page: 1
5/1/2009 11 :33:22 AM
Urbemis 2007 Version 9.2.4
Combined Annual Emissions Reports (TonsNear)
File Name: C:\Documents and Settings\ENuno\Application Data\Urbemis\Version9a\Projects\Selma_DRTS.urb924
Project Name: Selma Disposal and Recycling and Transfer Station
Project Location: Fresno County
On-Road Vehicle Emissions Based on: Version : Emfac2007 V2.3 Nov 1 2006
Off-Road Vehicle Emissions Based on: OFFROAD2007
Summary Report:
CONSTRUCTION EMISSION ESTIMATES
2009 TOTALS (tonslyear unmitigated)
2009 TOTALS (tonslyear mitigated)
Percent Reduction
BOO
0.11
0.11
0.00
liQx
0.69
0.69
0.00
~
0.43
0.43
0.00
SQ2.
0.00
0.00
0.00
PM10 Dust PM10 Exhayst
0.43 0.05
0.10 0.05
77.26 0.00
EMm
0.47
0.14
69.86
PM25 Dyst
0.09
0.02
77.22
~ ~
0.04
0.04
0.00
~
0.13
0.06
52.66
.c.Q2.
64.37
64.37
0.00
AREA SOURCE EMISSION ESTIMATES
TOTALS (tons/year, unmitigated)
BOO
0.04
liQx
0.15
~
0.40
SQ2.
0.00
EMm
0.00
~
0.00
.c.Q2.
178.35
SUM OF AREA SOURCE AND OPERATIONAL EMISSION ESTIMATES
TOTALS (tons/year, unmitigated)
BOO
0.04
liQx
0.15
~
0.40
SQ2.
0.00
EMm
0.00
~
0.00
.c.Q2.
178.35
Construction Unmitigated Detail Report:
CONSTRUCTION EMISSION ESTIMATES Annual Tons Per Year, Unmitigated
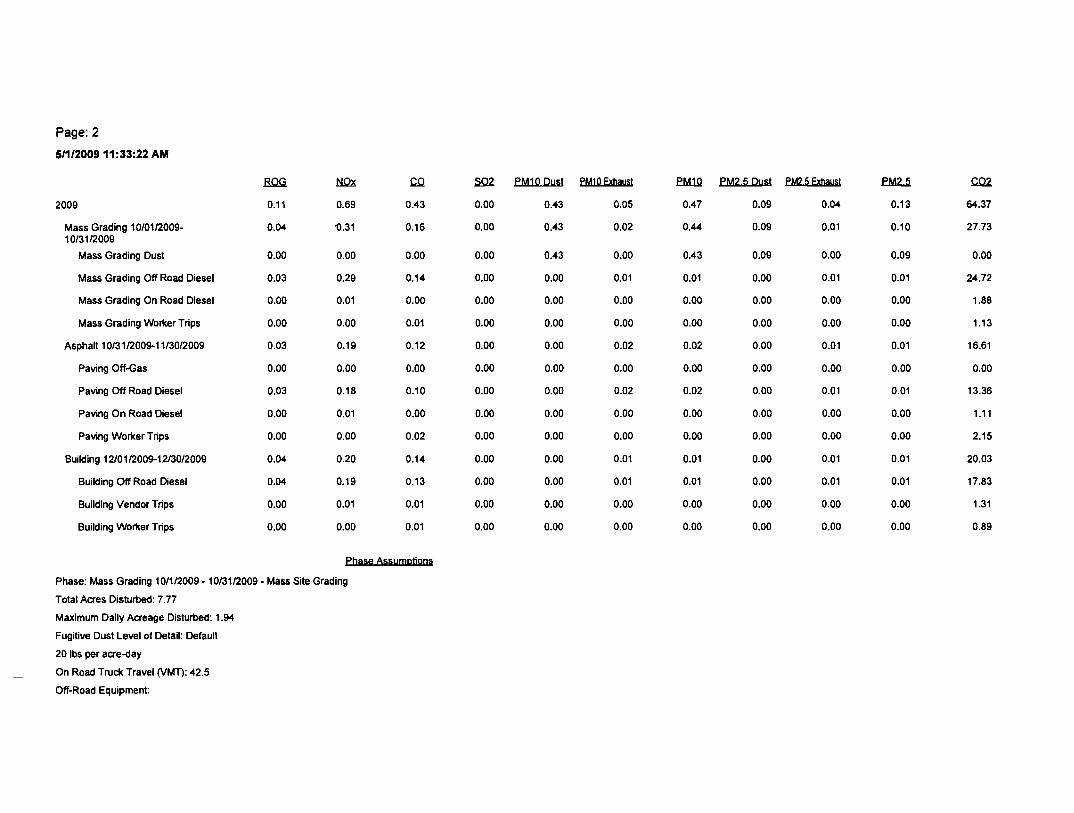
Page: 2
5/1/200911:33:22 AM
.BOO tiQx CQ. SQ2. PM1Q Dust PM10 Exhaust .P.M.1.Q. PM2 5 pys1 PM2 5Exhaust ~ .em 2QQ9 Q.ll Q.69 Q.43 Q.QQ Q.43 Q.Q5 Q.47 Q.Q9 Q.04 Q.13 64.37
Mass Grading lQ/QlI2QQ9 0.04 '0.31 Q.16 Q.QQ Q.43 Q.Q2 Q.44 Q.Q9 O.Ql Q.1Q 27.73 lQ/3112QQ9
Mass Grading Dust Q.QQ 0.00 Q.QQ Q.QQ Q.43 Q.QQ Q.43 Q.Q9 Q.QQ Q.Q9 Q.QQ
Mass Grading Off Road Diesel Q.Q3 Q.29 0.14 Q.QQ Q.QQ Q.Ql Q.Ql Q.QQ Q.Ql O.Ql 24.72
Mass Grading On Road Diesel Q.QQ Q.Ql Q.OO Q.QQ Q.QQ Q.OQ Q.QQ Q.QO Q.QQ Q.QQ 1.88
Mass Grading Wor1(er Trips Q.QQ Q.QQ Q.Ql 0.00 Q.QQ Q.QQ Q.QQ Q.QQ Q.OQ Q.QQ 1.13
Asphalt 1Q/31I2QQ9-11/3Q/2009 Q.Q3 Q.19 Q.12 Q.OO Q.QQ Q.Q2 Q.Q2 Q.QQ Q.Ql Q.Ql 16.61
Paving Off-Gas Q.QQ Q.QQ O.QQ Q.QQ Q.OO Q.QQ Q.QQ Q.QQ Q.QQ Q.QO Q.QQ
Paving Off Road Diesel 0.03 Q.18 Q.1Q Q.QQ Q.OQ 0.Q2 Q.Q2 Q.QQ Q.Ql Q.Ql 13.36
Paving On Road Diesel O.QQ Q.Ql Q.QQ Q.QQ Q.QQ Q.OO Q.QQ Q.QQ Q.QQ Q.QQ 1.11
Paving Wor1(er Trips Q.QQ O.OQ Q.Q2 Q.QQ Q.QQ Q.OQ Q.OO Q.QQ Q.QQ Q.QQ 2.15
Building 12/Q1/2QQ9-1213Q/2QQ9 Q.04 Q.2Q Q.14 Q.QQ Q.QQ Q.Ql Q.Ol Q.QQ Q.Ql Q.Ql 2Q.03
Building Off Road Diesel Q.04 Q.19 0.13 Q.QQ Q.QQ Q.Ql Q.Ol Q.OO Q.Ql Q.Ql 17.83
Building Vendor Trips Q.QQ Q.Ql Q.Ql O.QQ Q.QQ Q.QQ Q.QQ Q.QO Q.QQ Q.QQ 1.31
Building Wor1(er Trips Q.QQ Q.QQ Q.Ql O.OQ Q.QQ Q.QQ Q.QQ Q.QQ Q.QO Q.QQ Q.89
phase Assymptions
Phase: Mass Grading lQ/l/2QQ9 -lQ/31I2QQ9 - Mass Site Grading
Total Acres Disturbed: 7.77
Maximum Daily Acreage Disturbed: 1.94
Fugitive Dust Level of Detail: Default
2Q Ibs per acre-day
On Road Truck Travel (VMT): 42.5
Off-Road Equipment:
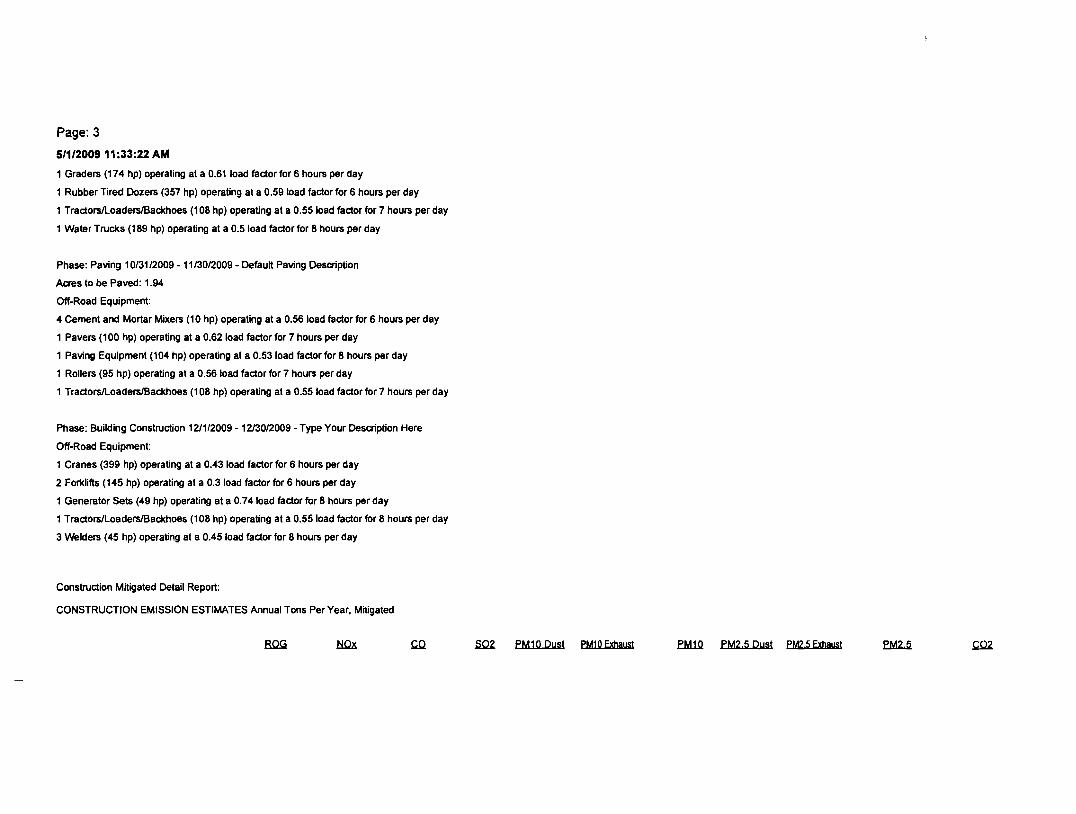
Page: 3
5/1/200911;33:22 AM
1 Graders (174 hpj operating at a 0.61 load factor for 6 hours per day
1 Rubber Tired Dozers (357 hpj operating at a 0.59 load factor for 6 hours per day
1 TractorsJLoaders/Backhoes (108 hpj operating at a 0.55 load factor for 7 hours per day
1 Water Trucks (189 hpj operating at a 0.5 load factor for 8 hours per day
Phase: Paving 10/31/2009 - 1113012009 - Default Paving Description
Aaes to be Paved: 1.94
Off-Road Equipment:
4 cement and Mortar Mixers (10 hpj operating at a 0.56 load factor for 6 hours per day
1 Pavers (100 hpj operating at a 0.62 load factor for 7 hours per day
1 Paving Equipment (104 hpj operating at a 0.53 load factor for 8 hours per day
1 Rollers (95 hpj operating at a 0.56 load factor for 7 hours per day
1 Tractors/Loaders/Backhoes (108 hpj operating at a 0.55 load factor for 7 hours per day
Phase: Building Construction 121112009 - 12130/2009 - Type Your Description Here
Off-Road Equipment:
1 Cranes (399 hpj operating at a 0.43 load factor for 6 hours per day
2 Forklifts (145 hpj operating at a 0.3 load factor for 6 hours per day
1 Generator Sets (49 hpj operating at a 0.74 load factor for 8 hours per day
1 Tractors/Loaders/Backhoes (108 hpj operating at a 0.55 load factor for 8 hours per day
3 Welders (45 hpj operating at a 0.45 load factor for 8 hours per day
Construction Mitigated Detail Report:
CONSTRUCTION EMISSION ESTIMATES Annual Tons Per Year, Mitigated
BOO ~ .c.o SQZ PM10 pust PM10 Exhaust .PM1ll. PM2 5 pyst PM2 5Exhaust ~ ~

Page: 4
5/1/200911:33:22 AM
2009 0.11 0.69 0.43 0.00 0.10 0.05 0.14 0.02 0.04 0.06 64.37
Mass Grading 10/0112009 0.04 0.31 0.16 0.00 0.10 0.02 0.11 0.02 0.01 0.03 27.73 1013112009
Mass Grading Dust 0.00 0.00 0.00 0.00 0.10 0.00 0.10 0.02 0.00 0.02 0.00
Mass Grading Off Road Diesel 0.03 0.29 0.14 0.00 0.00 0.01 0.01 0.00 0.01 0.01 24.72
Mass Grading On Road Diesel 0.00 0.01 0.00 0.00 0.00 0.00 0.00 0.00 0.00 0.00 1.88
Mass Grading Woriter Trips 0.00 0.00 0.01 0.00 0.00 0.00 0.00 0.00 0.00 0.00 1.13
Asphalt 10/3112009-1113012009 0.03 0.19 0.12 0.00 0.00 0.02 0.02 0.00 0.01 0.01 16.61
Paving Off-Gas 0.00 0.00 0.00 0.00 0.00 0.00 0.00 0.00 0.00 0.00 0.00
Paving Off Road Diesel 0.03 0.18 0.10 0.00 0.00 0.02 0.02 0.00 0.01 0.01 13.36
Paving On Road Diesel 0.00 0.01 0.00 0.00 0.00 0.00 0.00 0.00 0.00 0.00 1.11
Paving Woriter Trips 0.00 0.00 0.02 0.00 0.00 0.00 0.00 0.00 0.00 0.00 2.15
Building 12/01/2009-1213012009 0.04 0.20 0.14 0.00 0.00 0.01 0.01 0.00 0.01 0.01 20.03
Building Off Road Diesel 0.04 0.19 0.13 0.00 0.00 0.01 0.01 0.00 0.01 0.01 17.83
Building Vendor Trips 0.00 0.01 0.01 0.00 0.00 0.00 0.00 0.00 0.00 0.00 1.31
Building Woriter Trips 0.00 0.00 0.01 0.00 0.00 0.00 0.00 0.00 0.00 0.00 0.89
Construction Related Mitigation Measyres
The following mitigation measures apply to Phase: Mass Grading 10/112009 -1013112009 - Mass Site Grading
For Soil Stablizing Measures, the Apply soil stabilizers to inactive areas mitigation reduces emissions by:
PM10: 84% PM25: 84%
For Soil Stablizing Measures, the Replace ground cover in disturbed areas quickly mitigation reduces emissions by:
PM10: 5% PM25: 5%
For Soil Stablizing Measures, the Water exposed surfaces 2x daily watering mitigation reduces emissions by:
PM10: 55% PM25: 55%
For Soil Stablizing Measures, the Equipment loading/unloading mitigation reduces emissions by:
PM10: 69% PM25: 69%