air quality monitoring in jersey 2009 - government of jersey...air quality monitoring in jersey 2009...
TRANSCRIPT

Air Quality Monitoring in Jersey 2009
Report to Public Health Services, States of Jersey
Restricted Commercial
ED44958001
AEAT/ENV/R/2966 Issue 1
Mar 2010

Air Quality Monitoring in Jersey 2009 Restricted – Commercial AEAT/ENV/R/2966 Issue 1
ii AEA
Title Air Quality Monitoring in Jersey 2009
Customer States of Jersey
Customer reference
Confidentiality, copyright and reproduction
Copyright AEA Technology plc This report is issued by AEA in connection with work undertaken for the States of Jersey. It may not be used for any other purposes, reproduced in whole or in part, nor passed to any organisation or person without the specific permission in writing of the Commercial Manager, AEA.
File reference ED44958001
Reference number AEAT/ENV/R/2966 – Issue 1
AEA group
551.11 Harwell Business Centre DIDCOT Oxfordshire OX11 0QJ t: 0870 190 6518 f: 0870 190 6377 AEA is a business name of AEA Technology plc AEA is certificated to ISO9001 and ISO14001 Author Name Alison Loader
Approved by Name Brian Stacey
Signature
Date Mar 2010

Restricted – Commercial Air Quality Monitoring in Jersey 2009 AEAT/ENV/R/2966 Issue 1
AEA iii
Executive summary
This report presents the results for 2009 of an ongoing programme of air quality monitoring in Jersey, carried out by AEA on behalf of the Public Health Services and Planning and Environment Department of the States of Jersey. An automatic monitoring station for nitrogen dioxide (NO2) was located in the Central Market, Halkett Place, St Helier. This has been in operation since January 2008, so this is its second full year of monitoring. In addition, non-automatic diffusion tube samplers were used for indicative monitoring of nitrogen dioxide (NO2) at 12 sites, and a suite of four hydrocarbons (benzene, toluene, ethylbenzene and xylenes) at a further six sites. Monitoring sites included areas likely to be affected by specific emission sources (such as petrol stations or the waste incinerator), as well as general background locations. This non-automatic monitoring programme continued a long-term monitoring programme that has operated in Jersey for the past 13 years. NO2 and hydrocarbon diffusion tubes were exposed for twelve periods approximating to calendar months. The tubes were supplied and analysed by Gradko International Ltd, and changed by Technical Officers of Jersey's Environmental Health Section. The automatic monitoring site at Halkett Place met the EC Directive Limit Value (and AQS Objective) for both the 1-hour mean NO2 concentration and the annual mean NO2 concentration. Annual mean concentrations of NO2 at all twelve diffusion tube monitoring sites were within the EC Directive Limit Value, and were generally comparable with the previous year’s results. Data from long-running diffusion tube sites confirm that levels of NO2 at urban roadside and kerbside sites continued to decrease in 2009. NO2 concentrations at residential and rural background sites do not appear to show any upward or downward trend, but are already low. The diurnal pattern in concentrations of oxides of nitrogen at Halkett Place showed a clear peak in the early morning (0600 – 0800). This is thought to reflect the early morning activity of market retailers arriving to set up for the day, and of daily refuse collections. Five of the six hydrocarbon monitoring sites met the EC Directive Limit Value for benzene (5 µg m
-3 as
an annual mean, to be achieved by 2010). The sixth site, Springfield Garage, was located on the forecourt of a petrol station and had no relevant exposure. This site was re-located in June 2009 to Faux Bie Terrace (the nearest housing). The five-month mean for January to May 2009 at Springfield Garage was 5.5 µg m
-3. The seven-month mean for the remainder of the year, measured at Faux Bie,
was 1.3 µg m-3
, well within the EC Limit Value and comparable with other urban benzene monitoring sites. Hydrocarbon concentrations (particularly that of benzene) are typically lower than during the earlier years of the survey.

Air Quality Monitoring in Jersey 2009 Restricted – Commercial AEAT/ENV/R/2966 Issue 1
iv AEA
Table of contents
1 Introduction 1
1.1 Background 1
1.2 Objectives 1
2 Details of Monitoring Programme 2
2.1 Pollutants Monitored 2
2.2 Air Quality Limit Values And Objectives 3
2.3 Methodologies 4
2.4 Monitoring Sites 6
2.5 Calendar of Diffusion Tube Exposure Periods 11
3 Quality Assurance and Data Capture 12
3.1 Quality Assurance And Quality Control 12
3.2 Data Capture 12
4 Results and Discussion 13
4.1 Presentation of Results 13
4.2 Comparison with NO2 Guidelines, Limit Values, and Objectives 18
4.3 Diurnal and Seasonal Variation in NO2 Concentration 19
4.4 Hydrocarbons 23
5 Conclusions 32
6 Acknowledgements 33
7 References 34
Appendices
Appendix 1 Air Quality Limit Values, Objectives and Guidelines
Appendix 2 Calibration Procedures for Automatic Analyser
Appendix 3 Nitrogen Dioxide Diffusion Tubes: Bias Adjustment Factor
Appendix 4 BTEX Diffusion Tubes: Monthly Dataset and Annual Means
Restricted – Commercial Air Quality Monitoring in Jersey 2009 AEAT/ENV/R/2966 Issue 1
AEA 1
1 Introduction
1.1 Background
AEA, on behalf of the States of Jersey Public Health Services, has undertaken a further programme of air quality monitoring on the island of Jersey in 2009. This is the thirteenth in a series of extensive annual monitoring programmes that began in 1997, and has since provided a long-term dataset of pollutant concentrations. The pollutants measured were nitrogen dioxide (NO2), and a range of hydrocarbon species (benzene, toluene, ethyl benzene and three xylene compounds). An automatic monitoring station at Halkett Place was used to monitor NO2. This was supplemented by indicative monitoring of NO2 using low cost passive samplers (Palmes type diffusion tubes) at 12 sites on the island. In addition, the suite of four hydrocarbons was monitored using “BTEX” diffusion tubes at six sites. This report presents the results obtained in the 2009 survey, and compares the data from Jersey with relevant air quality Limit Values, Objectives and guidelines, data from selected UK monitoring stations and previous years' monitoring programmes.
1.2 Objectives
This survey follows on from those in the years 1997 to 20081,2,3,4,5,6,7,8,9,10,11,12
. The objective, as in previous surveys, was to monitor at sites where pollutant concentrations were expected to be high, and compare these with background locations. The monitoring sites consisted of a mixture of urban and rural background sites, together with some locations where higher pollutant concentrations might be expected, such as roadside and kerbside sites, and some close to specific emission sources.

Air Quality Monitoring in Jersey 2009 Restricted – Commercial AEAT/ENV/R/2966 Issue 1
2 AEA
2 Details of Monitoring Programme
2.1 Pollutants Monitored
2.1.1 NO2
A mixture of nitrogen dioxide (NO2) and nitric oxide (NO) is emitted by combustion processes. This mixture of oxides of nitrogen is termed NOX. NO is subsequently oxidised to NO2 in the atmosphere. NO2 is an irritant to the respiratory system, and can affect human health. Ambient concentrations of NO2 are likely to be highest in the most built-up areas, especially where traffic is congested, or where buildings either side of the street create a “canyon” effect, impeding the dispersion of vehicle emissions. The units used for NO2 concentration in this report are microgrammes per cubic metre (µg m
-3). Some earlier reports in this series have used parts per billion (ppb): to convert from µg m
-3 to
ppb for comparison with the earlier reports if required, the following relationship should be used:
1 µg m-3 = 0.523 ppb for nitrogen dioxide at 293K (20C) and 1013mb.
2.1.2 Hydrocarbons
There are many sources of hydrocarbon emissions. Methane, for example, is a naturally occurring gas, while xylene compounds are synthetic and used in many applications, for example as a solvent in paint. A range of hydrocarbons is found in vehicle fuel, and occur in vehicle emissions. In most urban areas, vehicle emissions constitute the major source of hydrocarbons, in particular benzene. Also, there is the potential that they may be released to the air from facilities where fuels are stored or handled (such as petrol stations). A wide range of hydrocarbons is emitted from both fuel storage and handling, and from fuel combustion in vehicles. It is not easy to measure all of these hydrocarbon species (particularly the most volatile) without expensive continuous monitoring systems. However, there are four species associated with fuels and vehicle emissions which, though not the largest constituent of such emissions, are easy to monitor using passive samplers due to their moderate volatility. These are benzene, toluene, ethyl benzene and xylene. Diffusion tubes are available for monitoring this group of organic compounds, and are known as “BTEX” tubes (BTEX being an acronym for the compounds measured). (i) Benzene
Of the organic compounds measured in this study, benzene is the one of most concern, as it is a known human carcinogen; long-term exposure can cause leukaemia. It is found in petrol and other liquid fuels, in small concentrations. In urban areas, the major source is vehicle emissions. In the UK, annual mean benzene concentrations in ambient air are typically less than 3 µg m
-3. In this report,
concentrations of benzene are expressed in microgrammes per cubic metre (µg m-3). Some earlier
reports in the series used parts per billion (ppb): to convert to ppb to if necessary, the following relationship should be used:
1 µg m-3 = 0.307 ppb for benzene at 293K (20C) and 1013mb.
(only applicable to benzene).
(ii) Toluene
Toluene is also found in petrol in small concentrations. Its primary use is as a solvent in paints and inks; it is also a constituent of tobacco smoke. It has been found to adversely affect human health. Typical ambient concentrations range from trace to 3.8 µg m
-3 in rural areas, up to 204 µg m
-3 in
urban areas, and higher near industrial sources. There are no recommended limits for ambient toluene concentrations, although there are occupational limits for workplace exposure
13. The best estimate for
the odour threshold of toluene has been reported as 0.16ppm (613µg m-3
) 14
. In the present report,
Restricted – Commercial Air Quality Monitoring in Jersey 2009 AEAT/ENV/R/2966 Issue 1
AEA 3
concentrations are expressed in microgrammes per cubic metre (µg m-3
). Some earlier reports in the series used parts per billion (ppb): to convert to ppb to if necessary, the following relationship should be used:
1 µg m-3 = 0.261 ppb for toluene at 293K (20C) and 1013mb.
(only applicable to toluene).
(iii)ethyl benzene
Again, there are no limits for ambient concentration of ethyl benzene, and although there are occupational limits relating to workplace exposure
13, as discussed in previous reports in this series,
they are several orders of magnitude higher than typical outdoor ambient concentrations. (iv)xylene
Xylene exists in ortho (o), para (p) and meta (m) isomers. Occupational limits relating to workplace exposure, are 100 ppm over 8 hours, and 150 ppm over 10 minutes. Xylene, like toluene, can cause odour nuisance near processes (such as vehicle paint spraying), which emit it. Its odour threshold varies according to the isomer, but the best estimate for the odour threshold of mixed xylenes is 0.016ppm (16 ppb or 70 µg m
-3)14
. In this report, concentrations of ethylbenzene and xylenes are expressed in microgrammes per cubic metre (µg m
-3). Some earlier reports in this series used parts per billion (ppb): to convert to ppb to if
required, the following relationship should be used:
1 µg m-3 = 0.226 ppb for ethyl benzene or xylenes at 293K (20C) and 1013mb.
(applicable to ethylbenzene, m-, p- and o-xylene).
2.2 Air Quality Limit Values And Objectives
This report compares the results of the monitoring survey with air quality Limit Values and Objectives applicable worldwide, in Europe and the UK. These are summarized in Appendix 1 and below.
2.2.1 World Health Organisation
In 2000, the World Health Organisation published revised air quality guidelines
15 for pollutants
including NO2. These were set using currently available scientific evidence on the effects of air pollutants on health and vegetation. The WHO guidelines are advisory only, and do not carry any mandatory status. They are summarised in Appendix 1. There are WHO guidelines for ambient NO2 concentrations (hourly and annual means) but not benzene. The WHO non-mandatory guideline
14 for
NO2 is that the annual mean should not exceed 40 µg m-3
.
2.2.2 European Community
Throughout Europe, ambient air quality is regulated by the EC Directive on Ambient Air Quality and Cleaner Air for Europe (2008/50/EC)
16. This Directive sets Limit Values, which are mandatory, and
other requirements for the protection of human health and ecosystems. Both NO2 and benzene are covered by this Directive. The States of Jersey have agreed to meet the EU health limits. The EC Directive on Ambient Air Quality and Cleaner Air for Europe
16 contains Limit Values for NO2
as follows:
200 µg m-3
as an hourly mean, not to be exceeded more than 18 times per calendar year. To be achieved by 1
st January 2010.
40 µg m-3
as an annual mean, for protection of human health. To be achieved by 1st January 2010.

Air Quality Monitoring in Jersey 2009 Restricted – Commercial AEAT/ENV/R/2966 Issue 1
4 AEA
There is also a limit for annual mean total oxides of nitrogen (NOX), of 30 µg m-3
, for protection of vegetation (relevant in rural areas).
The EC Directive on Ambient Air Quality and Cleaner Air for Europe
16 sets a limit of 5 µg m
-3 for
annual mean benzene, to be achieved by 2010.
2.2.3 UK Air Quality Strategy
The UK Air Quality Strategy (AQS) contains standards and objectives for a range of pollutants including NO2 and benzene
17. These are also summarised in Appendix 1. Only those Objectives
relating to the whole UK (as opposed to specifically England, Wales, etc.) are applicable to Jersey, and the AQS does not at present have mandatory status in the States of Jersey. The UK Air Quality Strategy’s objectives for NO2 are very similar to the EC Directive limits above: the only difference being that they had to be achieved by 31
st December 2005
The UK Air Quality Strategy
17 sets the following objectives for benzene:
16.25µg m-3
(for the running annual mean), to have been achieved by 31st December 2003
3.25 µg m-3
(for the calendar year mean in Scotland and Northern Ireland), to be achieved by 31
st December 2010.
5 µg m-3
(for the calendar year mean in England and Wales), to be achieved by 31st
December 2010. Both the 2010 benzene objectives apply to specific parts of the UK only, so strictly speaking do not apply in Jersey. However, the objective of 5 µg m
-3 applicable to England and Wales is the same as
the EC Directive Limit Value, which is applicable.
2.3 Methodologies
Oxides of nitrogen were monitored using a chemiluminescent analyser, located at the Central Market, Halkett Place, St Helier. This automatic monitoring site started operation in January 2008. The chemiluminescent NOx analyser provides a continuous output, proportional to the pollutant concentration. This output is recorded and stored every 10 seconds, and averaged to 15-minute average values by internal data loggers. The analysers are connected to a modem and interrogated by telephone to download the data to AEA. Data are downloaded daily and uploaded onto the publicly available website www.jerseymet.gov.je The automatic monitoring site at Halkett Place was supplemented by indicative monitoring, using diffusion tubes, for NO2 and BTEX hydrocarbons. Diffusion tubes are "passive" samplers, i.e. they work by absorbing the pollutants direct from the surrounding air and need no power supply. Palmes-type diffusion tubes were used for NO2. These consist of a small plastic tube, approximately 7 cm long. During sampling, one end is open and the other closed. The closed end contains an absorbent for the gaseous species to be monitored, in this case NO2. The tube is mounted vertically with the open end at the bottom. Ambient NO2 diffuses up the tube during exposure, and is absorbed as nitrite. The average ambient pollutant concentration for the exposure period is calculated from the amount of pollutant absorbed. BTEX diffusion tubes are different in appearance to NO2 tubes. They are longer, thinner, and made of metal rather than plastic. These tubes are fitted at both ends with brass Swagelok fittings. A separate “diffusion cap” is supplied. Immediately before exposure, the Swagelok end fitting is replaced with the diffusion cap. The cap is removed after exposure, and is replaced with the Swagelok fitting. BTEX diffusion tubes are very sensitive to interference by solvents. Diffusion tubes were prepared and analysed by Gradko International Ltd. They were supplied to local Technical Officers of Jersey's Public Health Services, who carried out the tube changing. The tubes

Restricted – Commercial Air Quality Monitoring in Jersey 2009 AEAT/ENV/R/2966 Issue 1
AEA 5
were supplied in sealed condition prior to exposure. The tubes were exposed at the sites for a set period of time. After exposure, the tubes were again sealed and returned to Gradko for analysis. The year was divided into twelve exposure periods approximating to calendar months. The duration of the exposure periods varied between four and five weeks. Diffusion tubes are an indicative technique, and the results therefore have a greater uncertainty than those of more sophisticated automatic methods. The laboratory states that the margins of uncertainty on the diffusion tube analyses are typically + 3.5% for NO2 and + 9% for BTEX hydrocarbons. However, uncertainties arising from the exposure phase also contribute to the overall uncertainty: it is usually estimated that the overall uncertainty on diffusion tube measurements is approximately + 25% for NO2 and + 25% for BTEX hydrocarbons. The limits of detection in ambient air depend on the tube uptake rate and the exposure time, and therefore vary to some extent from month to month. Typically the detection limit for NO2 has been equivalent to 0.4 µg m
-3, and the detection limit for benzene around 0.05 µg m
-3.
It should be noted that tube results that are less than 10 x the limit of detection will have a higher level of uncertainty associated with them. In the case of the NO2 sites, this is rarely a problem as ambient concentrations are above this threshold at all but the most rural locations. However, ambient concentrations of BTEX hydrocarbons are closer to the lower limit of detection using diffusion tubes: the non-urban sites have in the past regularly measured concentrations of 0.5 µg m
-3 and less.
The Local Air Quality Management Technical Guidance LAQM.TG(09)
18 states that when using
diffusion tubes for indicative NO2 monitoring, correction should be made where applicable for any systematic bias (i.e. over-read or under-read compared to the automatic chemiluminescent technique, which is the reference method for NO2). By co-locating diffusion tubes with the automatic monitoring site at Halkett Place, it was possible to calculate a bias adjustment factor, which could then be applied to the annual mean diffusion tube measurements in this survey. The NO2 diffusion tube results in this report are uncorrected except where clearly specified. The BTEX results have not been bias adjusted. Each monthly batch of diffusion tubes was accompanied by a “travel blank” NO2 and BTEX tube. These tubes were taken with the exposure tubes to the site, but were not exposed. They were returned to the site operator’s premises, and were kept in a sealed bag in a cupboard. When the exposed tubes were collected, the “travel blank” tubes were taken by the operator to the site. The travel blanks were sent with the exposed tubes for analysis. The purpose of these tubes was to indicate if any contamination of the tubes had occurred. This was particularly relevant in the case of the BTEX tubes, which can easily be contaminated by exposure to solvents. The travel blank results were not used to apply any correction to the results from the exposed tubes – only to highlight possible contamination issues.
Air Quality Monitoring in Jersey 2009 Restricted – Commercial AEAT/ENV/R/2966 Issue 1
6 AEA
2.4 Monitoring Sites
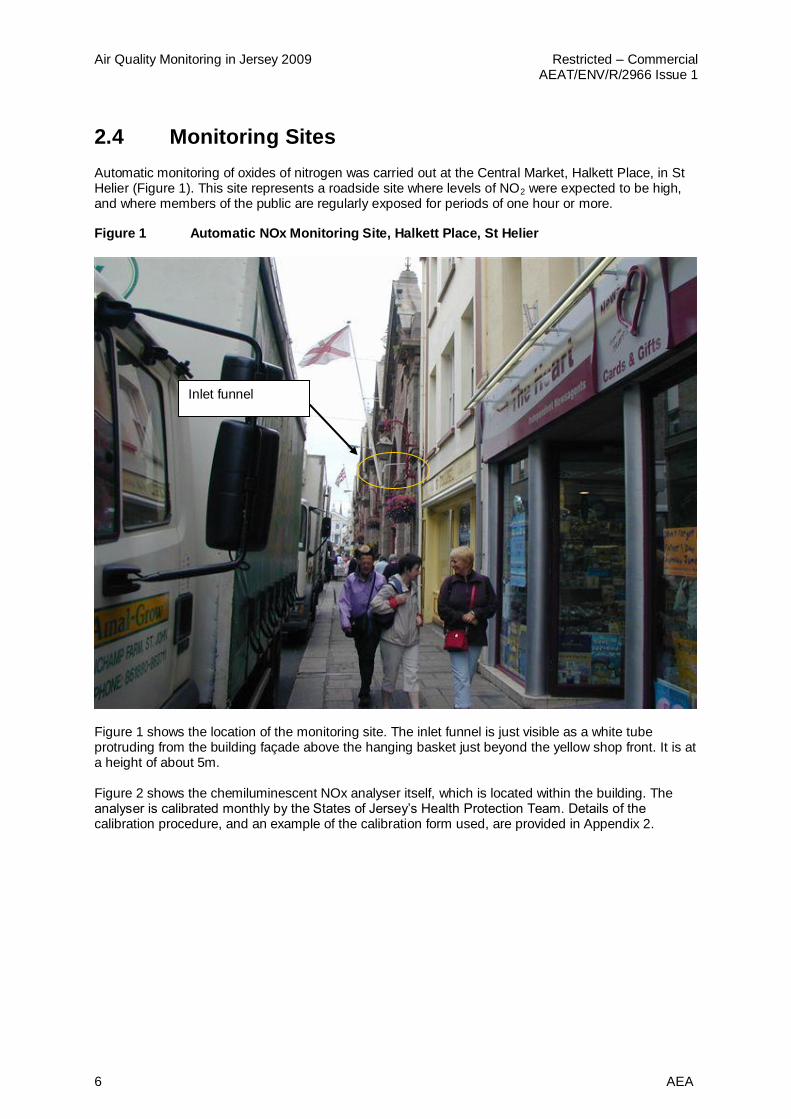
Automatic monitoring of oxides of nitrogen was carried out at the Central Market, Halkett Place, in St Helier (Figure 1). This site represents a roadside site where levels of NO2 were expected to be high, and where members of the public are regularly exposed for periods of one hour or more. Figure 1 Automatic NOx Monitoring Site, Halkett Place, St Helier
Figure 1 shows the location of the monitoring site. The inlet funnel is just visible as a white tube protruding from the building façade above the hanging basket just beyond the yellow shop front. It is at a height of about 5m. Figure 2 shows the chemiluminescent NOx analyser itself, which is located within the building. The analyser is calibrated monthly by the States of Jersey’s Health Protection Team. Details of the calibration procedure, and an example of the calibration form used, are provided in Appendix 2.
Inlet funnel

Restricted – Commercial Air Quality Monitoring in Jersey 2009 AEAT/ENV/R/2966 Issue 1
AEA 7
Figure 2 Automatic NOx Analyser at Halkett Place, St Helier
As explained in section 2.3, diffusion tubes were also used to monitor NO2 at twelve sites in a range of different environments around Jersey. Table 1 lists the NO2 diffusion tube sites, and Figures 3a and 3b show their locations. Diffusion tubes are also co-located with the automatic monitoring site at Halkett Place, and the results of this co-located monitoring are used to assess the precision and accuracy of the diffusion tubes, relative to the automatic chemiluminescent analyser, which is defined within Europe as the reference method for NO2. The tubes at this site are exposed in triplicate, to allow assessment of precision. All other diffusion tube sites are single tube sites.

Air Quality Monitoring in Jersey 2009 Restricted – Commercial AEAT/ENV/R/2966 Issue 1
8 AEA
Table 1 NO2 Monitoring Sites in Jersey
Site Name Grid
Reference Method Description
Central Market, Halkett Place
653 486 Automatic analyser Diffusion tubes in triplicate
Halkett Pl., St Helier – co-located with automatic site.
Le Bas Centre 658 489 Diffusion tube Urban Background
Les Quennevais 579 496 Diffusion tube Residential Background Rue des Raisies 689 529 Diffusion tube Rural Background
Weighbridge 651 483 Diffusion tube Roadside at bus station near centre of St Helier
Georgetown 661 480 Diffusion tube Kerbside on major road
Beaumont 597 516 Diffusion tube Kerbside
The Parade * 648 489 Diffusion tube Roadside site at General Hospital Broad Street 652 486 Diffusion tube Urban background
Union Street 653 486 Diffusion tube Kerbside in St Helier – corner of Union St. & New St.
New Street 653 485 Diffusion tube Kerbside in St Helier
Liberation Station 652 485 Diffusion tube Kerbside opposite entrance to new bus station
*The Parade site was moved to its current roadside location at the end of 2000. Kerbside: less than 1m from kerb of a busy road. Roadside: 1-5m from kerb of a busy road. Background: > 50m from the kerb of any major road. Note: all grid references are from OS 1:25000 Leisure Map of Jersey and are given to the nearest 100m.
Figure 3a Site Locations Outside St Helier

Restricted – Commercial Air Quality Monitoring in Jersey 2009 AEAT/ENV/R/2966 Issue 1
AEA 9
Figure 3b Sites in St Helier town

Air Quality Monitoring in Jersey 2009 Restricted – Commercial AEAT/ENV/R/2966 Issue 1
10 AEA
Key: Name Pollutants
1 Le Bas Centre NO2, BTEX 2 Central Market NO2, (diffusion tube and automatic) 3 Beresford Street NO2, BTEX 4 Union Street NO2 5 New Street NO2 6 Broad Street NO2 7 Weighbridge NO2 8 Liberation Station NO2 9 Georgetown NO2 10 The Parade NO2 11 Faux Bie / Springfields
Garage BTEX
12 Airport BTEX 13 Les Quennevais NO2 14 Beaumont NO2 15 Clos St Andre NO2, BTEX 16 Rue Des Raisies NO2 17 Handsford Lane BTEX BTEX hydrocarbons were monitored at six sites during 2009. These sites are shown in Table 2. The aim was to investigate sites likely to be affected by different emission sources, and compare these with background sites. The sites at Beresford Street and Le Bas Centre are intended to monitor hydrocarbon concentrations at an urban roadside and urban background location respectively. The Handsford Lane site is close to a paint spraying process – a potential source of hydrocarbon emissions, especially toluene and xylenes. This site replaced a similar site in Elizabeth Lane, which ceased operation when the process closed down in October 2003. The Faux Bie site replaced the former Springfield Garage site at the beginning of June 2009. This was located at a fuel filling station, a potential source of hydrocarbon emissions including benzene. The old site was close to the forecourt: the new site is located at a nearby house, and is intended to be more representative of public exposure. As of December 2003, the fuel supplier has used vapour recovery when filling the tanks. The Clos St Andre site is located near the Bellozane Valley waste incinerator, and the Airport site is located at Jersey Airport, overlooking the airfield. Table 2 BTEX Diffusion Tube Monitoring sites
Site Name Grid Reference Description
Beresford Street 653 486 Urban Roadside
Le Bas Centre 658 489 Urban Background
Faux Bie 658 495 Urban background near fuel filling station
Clos St Andre 638 499 Residential area near Bellozanne Valley refuse incinerator.
Airport 587 509 Jersey Airport, on arrivals hall building overlooking car park.
Handsford Lane 633 499 Urban background near a paint spraying process.
Restricted – Commercial Air Quality Monitoring in Jersey 2009 AEAT/ENV/R/2966 Issue 1
AEA 11
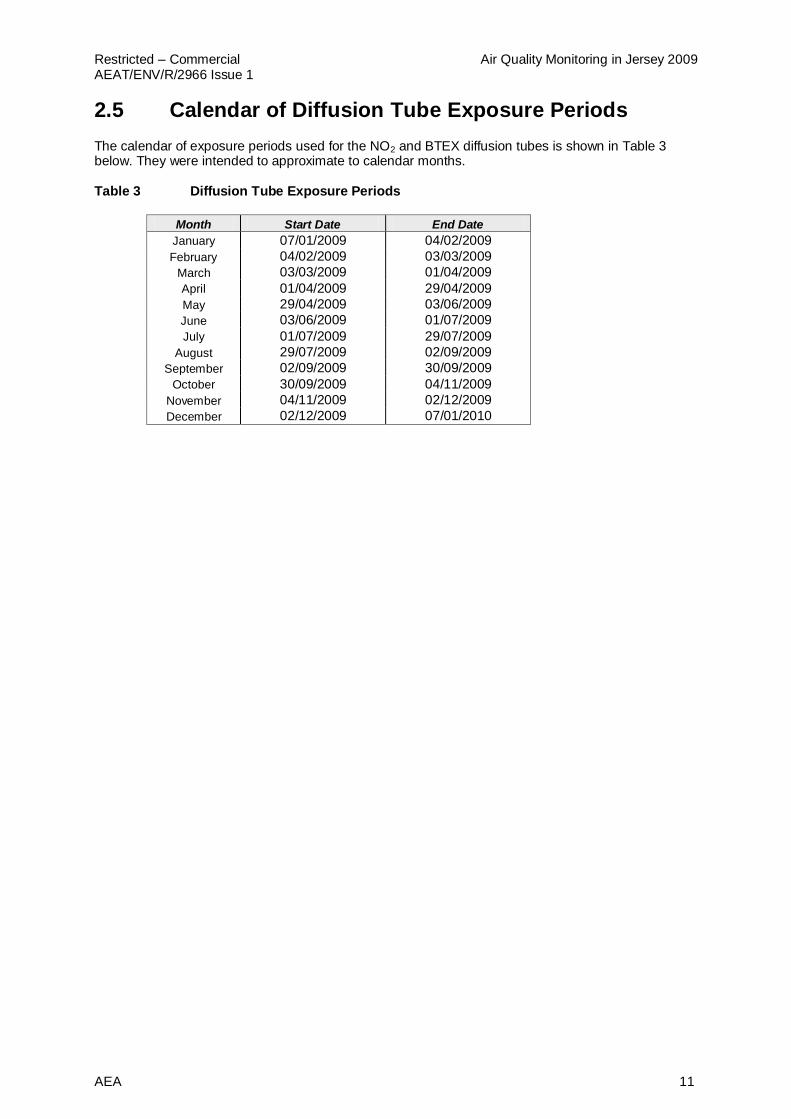
2.5 Calendar of Diffusion Tube Exposure Periods
The calendar of exposure periods used for the NO2 and BTEX diffusion tubes is shown in Table 3 below. They were intended to approximate to calendar months. Table 3 Diffusion Tube Exposure Periods
Month Start Date End Date
January 07/01/2009 04/02/2009
February 04/02/2009 03/03/2009
March 03/03/2009 01/04/2009
April 01/04/2009 29/04/2009
May 29/04/2009 03/06/2009
June 03/06/2009 01/07/2009
July 01/07/2009 29/07/2009
August 29/07/2009 02/09/2009
September 02/09/2009 30/09/2009
October 30/09/2009 04/11/2009
November 04/11/2009 02/12/2009
December 02/12/2009 07/01/2010

Air Quality Monitoring in Jersey 2009 Restricted – Commercial AEAT/ENV/R/2966 Issue 1
12 AEA
3 Quality Assurance and Data Capture
3.1 Quality Assurance And Quality Control
A full intercalibration audit of the Jersey Halkett Place air quality monitoring site takes place annually. In addition to instrument and calibration standard checking, the air intake sampling system is cleaned and all other aspects of site infrastructure are checked. Following the instrument and calibration gas checking, and the subsequent scaling and ratification of the data, the overall accuracy and precision figures for the pollutants monitored at Jersey can be summarised as in Table 4:
Table 4 Estimated Accuracy and Precision of the Data Presented
Pollutant Precision Accuracy %
NO 5 ppb 15%
NO2 5 ppb 15%
3.2 Data Capture
Overall data capture statistics for the monitoring site are given in Table 5. A data capture rate of 90% or greater for ratified data is recommended in the Defra Technical Guidance LAQM.TG(09)
18.
Table 5 Jersey Halkett Place - Data Capture Statistics 2009
Site NO NO2 NOX
Jersey Halkett Place 98.4 % 98.4 % 98.4 %
Data capture of 90% was achieved for NO2: thus the data capture target of LAQM.TG(09) was met. However, the following significant gap in data capture occurred during the year, as shown in Table 6:
Table 6 Data Gaps 2009
Site Pollutant Period No. of Days Reason Jersey Halkett Place All NOx 27
th – 30
th Nov 4 Analyser temporarily re-
located within the market: power interruption.

Restricted – Commercial Air Quality Monitoring in Jersey 2009 AEAT/ENV/R/2966 Issue 1
AEA 13
4 Results and Discussion
4.1 Presentation of Results
4.1.1 Automatic NO2 Monitoring Results
Table 7 shows the key statistics for oxides of nitrogen measured by the automatic analyser at Halkett Place. Figure 4 shows timeseries plots of hourly mean NO, NO2 and NOx concentrations.
Table 7 Oxides of Nitrogen: Air Quality Statistics for 2009
POLLUTANT NO µg m
-3 NO2
µg m-3
NOX
µg m-3
Maximum 15-minute mean 623 441 1247
Maximum hourly mean 334 271 661
Maximum running 8-hour mean 120 82 265
Maximum running 24-hour mean 63 57 145
Maximum daily mean 56 56 140
Average 21 31 62
Data capture 98.4 % 98.4 % 98.4 %
All mass units are at 20 Celsius and 101.3 kPa. Figure 4 Time series plots of hourly mean pollutant concentrations at Halkett Place, 2009
NO
µg
m-3
0
100
200
300
400
National Air Quality Standard
MODERATE
NO2
µg m-3
0
100
200
NOX
µg m-3
0
150
300
450
600
Jan
2009
Feb
2009
Mar
2009
Apr
2009
May
2009
Jun
2009
Jul
2009
Aug
2009
Sep
2009
Oct
2009
Nov
2009
Dec
2009
0
150
300
450
600

Air Quality Monitoring in Jersey 2009 Restricted – Commercial AEAT/ENV/R/2966 Issue 1
14 AEA
4.1.2 NO2 Diffusion Tube Results
NO2 diffusion tube results are presented in Table 8 and Figure 5. Although reported by the analyst to two decimal places, the monthly mean results reported here have been rounded to the nearest integer, in view of the estimated uncertainty of + 25% on diffusion tube measurements. Individual monthly mean NO2 results ranged from 4 µg m
-3 (in August at the rural background Rue de
Raisies site), to 52 µg m-3
(in April at the kerbside Beaumont site). The May result at Rue des Raisies was extremely high at 43 µg m
-3, given the rural location of the site.
It was concluded that this result was very unlikely to be genuine, and it has been rejected. The February results at some, though not all, of the sites were suspiciously low. For example, the Le Bas Centre site usually gives monthly mean concentrations in the range 20 – 30 µg m
-3 but the
February 2009 result was just 6.1 µg m-3. At Halkett Place, where diffusion tubes are co-located in
triplicate with an automatic analyser, the tubes gave a monthly mean of 9 µg m-3
but the automatic method gave a monthly mean of 40 µg m
-3. This was checked with the analyst, who confirmed they
had been correctly calculated. Whilst it is inadvisable to reject any data simply because they are higher or lower than expected, the co-location result casts doubt on the validity of the February diffusion tubes not only at Halkett Place but also at other sites which showed similarly low results. As the results from various sites showed this anomaly to different extents, it was difficult to determine which should be retained and which rejected. Therefore, the decision was taken to reject all the February diffusion tube results. Two tubes went missing from the sites: February’s tube at Les Quennevais and February’s tube at Union Street. Results from the Halkett Place site (where diffusion tubes are co-located with an automatic analyser) were used to calculate a bias adjustment factor of 0.9 - see Appendix 3. Annual mean NO2 concentrations (after application of this bias adjustment factor) ranged from 6 µg m
-3 (at the rural Rue des Raisies site ) to 35 µg m
-3 at the Broad Street site in the centre of St
Helier.

Restricted – Commercial Air Quality Monitoring in Jersey 2009 AEAT/ENV/R/2966 Issue 1
AEA 15
Table 8 NO2 Diffusion Tube Results 2009, Jersey. Concentrations (rounded to nearest integer) in µg m-3
.
Site Jan-09 Feb-09 Mar-09 Apr-09 May-09 Jun-09 Jul-09 Aug-09 Sep-09 Oct-09 Nov-09 Dec-09 Mean
Bias adjusted
Beaumont (K) 38 (29) 39 52 46 45 29 29 46 37 25 31 38 34
Broad Street (K) 43 (40) 37 46 39 33 48 39 30 37 44 31 39 35
Georgetown (K) 38 (23) 39 45 35 39 30 30 34 32 26 32 34 31
The Parade (K) 31 (22) 32 32 26 27 24 27 26 25 24 24 27 24
Weighbridge (K) 39 (18) 39 49 37 34 39 34 32 35 40 30 37 33
Halkett Place tube 1 (R) 35 (9) 42 39 30 31 33 28 33 35 28 31
Halkett Place tube 2 (R) 38 (10) 38 41 30 28 32 30 31 32 28 28
Halkett Place tube 3 (R) 29 (9) 37 40 30 32 33 31 34 35 28 30
Halkett Place mean (R) 36 (9) 39 40 30 30 32 30 33 34 28 30 33 29
Liberation Station (R) 25 (24) 33 40 31 34 31 30 40 33 24 29 32 29
New Street (R) 26 (17) 22 22 17 15 17 18 18 19 24 22 20 18
Union Street (R) 39 * n/a 35 41 30 31 36 30 26 33 36 33 34 30
Le Bas Centre (UB) 30 (6) 26 27 23 20 22 20 19 25 22 21 23 21
Les Quennevais (RB) * n/a (7) 11 10 8 8 4 7 10 13 8 12 9 8
Rue des Raisies (Rural) 11 (6) 8 7 (reject) 6 7 4 6 7 4 6 6 6 K = Kerbside, R = Roadside, UB = Urban Background, RB = Residential Background, Rural = Rural Background. All February data rejected as suspect.

Air Quality Monitoring in Jersey 2009 Restricted – Commercial AEAT/ENV/R/2966 Issue 1
16 AEA
Figure 5 Comparison of Annual Mean Nitrogen Dioxide Concentrations at All Jersey Sites, 2009 (Bias Adjustment Factor Applied)

Restricted – Commercial Air Quality Monitoring in Jersey 2009 AEAT/ENV/R/2966 Issue 1
AEA 17
4.1.3 Precision and Accuracy of NO2 Diffusion Tubes
Diffusion tubes are an indicative monitoring technique: although they are economical and easy to use, they do not give the same level of precision and accuracy as more expensive automatic monitoring methods. For this reason, as explained in section 2.3 above, the Local Air Quality Management Technical Guidance LAQM.TG(09)
18 states that when using diffusion tubes for indicative NO2
monitoring, correction should be made where applicable for any systematic bias (i.e. over-read or under-read) compared to the automatic chemiluminescent technique, which is the reference method for NO2. This is usually done by co-locating diffusion tubes with a chemiluminescent analyser and comparing the results of the two methods. The co-location site in this study was Halkett Place. By exposing diffusion tubes in triplicate at this site, it was possible to compare their precision and accuracy with that of the automatic monitor, and to calculate a “bias adjustment factor” which could be applied to the annual mean NO2 concentrations measured at the other diffusion tube sites, in order to correct for any “bias”. Exposing tubes in triplicate allowed an investigation of diffusion tube precision. Precision may be expressed in terms of the coefficient of variation (CV) of the three replicate measurements. This parameter, also known as the relative standard deviation, is the standard deviation expressed as a percentage of the mean. For diffusion tubes exposed in triplicate, the CV is usually expected to be within 10% on average. This is based purely on experience of what a competent laboratory is typically able to achieve, although it can be affected by conditions at the site. It is not uncommon for diffusion tube precision to occasionally be poor; this is not a cause for concern if the precision over the rest of the year is consistently good. At Central Market, the CV of the monthly tube triplets ranged from 1% to 14%, with a mean of 5%. There was one month when this value was particularly high. In January, the three results were 29 µg m
-3, 35 µg m
-3 and 38 µg m
-3. However, as none of the three values could
clearly be identified as an outlier, none have been rejected from the dataset. The mean NO2 concentration as measured by the diffusion tubes was 33µg m
-3. Although the bias
exhibited by the diffusion tubes varied considerably from month to month, the annual mean concentrations as measured by the automatic analyser and the diffusion tubes were within 1µg m
-3.
The “bias adjustment factor” was 0.9 As highlighted in section 4.1.2, several sites, including Halkett Place, recorded suspiciously low results in February 2009, and it was considered prudent to reject the whole month’s dataset. Figure 6 shows the monthly mean NO2 concentrations, as measured by diffusion tubes and by the automatic analyser, at Halkett Place. Figure 6 shows the rejected February tube results, illustrating that they are clearly much lower than the automatic analyser measurement. In the other months the two methods showed good agreement.

Air Quality Monitoring in Jersey 2009 Restricted – Commercial AEAT/ENV/R/2966 Issue 1
18 AEA
Figure 6 Co-location Results at Halkett Place (including rejected February tube results)
4.2 Comparison with NO2 Guidelines, Limit Values, and Objectives
Limit Values, AQS Objectives and WHO guidelines for NO2 are shown in Appendix 1. These are based on the hourly and annual means. The WHO non-mandatory guideline
15 for NO2 is that the annual mean should not exceed 40 µg m
-3.
The EC Directive on Ambient Air Quality and Cleaner Air for Europe16
contains Limit Values for NO2 as follows:
200 µg m-3
as an hourly mean, not to be exceeded more than 18 times per calendar year. To be achieved by 1
st January 2010.
40 µg m-3
as an annual mean, for protection of human health. To be achieved by 1st January 2010.
There is also a limit for annual mean total oxides of nitrogen (NOX), of 30 µg m-3
, for protection of vegetation (relevant in rural areas).
The UK Air Quality Strategy
17 contains Objectives for NO2, which are very similar to the EC Directive
limits above: the only difference being that they had to be achieved by 31st December 2005.
The 1-hour mean at the Halkett Place automatic monitoring site exceeded 200 µg m
-3 on two
occasions during 2009. This is within the maximum of 18 permitted exceedences, therefore this site has met the hourly mean EC Directive Limit Value and AQS Objective for this parameter, by the due date. The annual mean concentration of 31µg m
-3 as measured by the automatic analyser at Halkett
Place is within the EC Limit Value of 40 µg m-3
. Because of the long sampling period of diffusion tubes, it is only possible to compare the results from the diffusion tube sites in this study against limit values relating to the annual mean. Annual mean NO2

Restricted – Commercial Air Quality Monitoring in Jersey 2009 AEAT/ENV/R/2966 Issue 1
AEA 19
concentrations did not exceed 40µg m-3
at any sites in 2009. The highest annual mean concentration of 35 µg m
-3 (after bias adjustment) was measured at Broad Street. This urban kerbside site in the
centre of St Helier has recorded relatively high annual mean NO2 concentrations throughout previous years of this survey. Therefore, all sites met the Limit Value for annual mean NO2 concentration by the due date. However, as annual mean NO2 concentrations can vary considerably from year to year due to meteorological and other factors, it is possible that exceedences could occur in future years. The 30µg m
-3 limit for protection of vegetation is only applicable at rural sites, and is therefore only
relevant to Rue des Raisies. The annual mean NO2 concentration of 6 µg m-3
at this rural site was well within the Limit Value.
4.3 Diurnal and Seasonal Variation in NO2
Concentration
4.3.1 Diurnal variation in NO2 concentration at Halkett Place
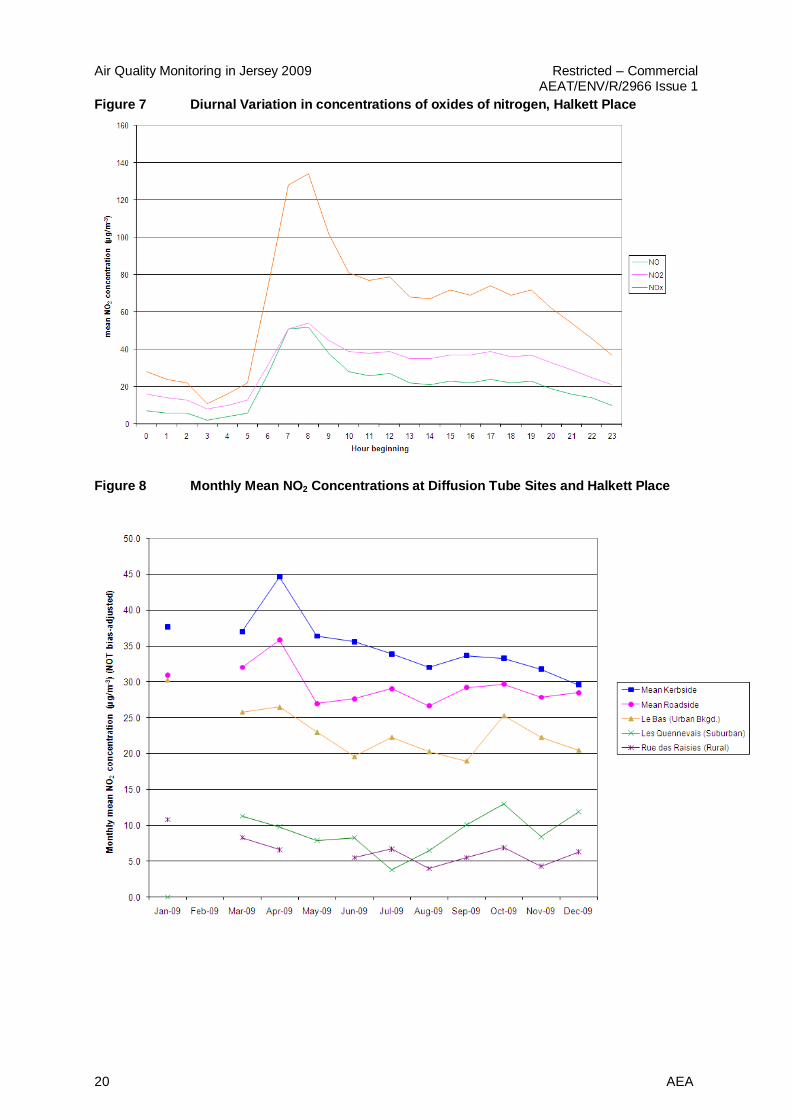
Figure 7 shows how concentrations of nitrous oxide (NO) and nitrogen dioxide (NO2) typically varied over the course of the day, as measured by the automatic monitor at Halkett Place. The curve for NO (which is a primary pollutant, i.e. directly emitted from source, and arises from road vehicles and other combustion sources) shows a very sharp morning peak at 0600 - 0800. Concentrations decrease during the middle of the day, with an afternoon “plateau” before concentrations fall at around 1800. There is barely any afternoon or evening rush-hour peak. For NO2, which has both primary (directly emitted) and secondary (due to oxidation of NO) components, there is again a pronounced morning rush-hour peak, only slightly lower than for NO. There is no real afternoon peak. Based on AEA’s experience with data from the Automatic Urban and Rural Network, the morning peak in NO and NO2 is typical for urban sites, reflecting the increased levels of these pollutants associated with morning rush-hour traffic. However, at Halkett Place it is particularly early and particularly sharp. This may be explained by the fact that there is a market at Halkett Place every day except Sundays: the peak coincides with the time at which the market traders arrive and set up for the day. In addition, a skip lorry arrives at this time to collect the previous day’s refuse. It is believed that vehicle emissions from these activities are responsible for the distinctive morning pattern at Halkett Place. Halkett Place does not exhibit an afternoon or evening rush-hour peak (as observed at many roadside AURN sites). This is unusual for an urban site: in the afternoon, concentrations of oxidising agents, particularly ozone, in the atmosphere tend to increase, leading to enhanced oxidation of NO to NO2. This typically causes the afternoon NO2 peak at many urban sites to be higher than the morning NO2 peak. However, this is not the case at Halkett Place.
4.3.2 Seasonal variation in NO2 concentration
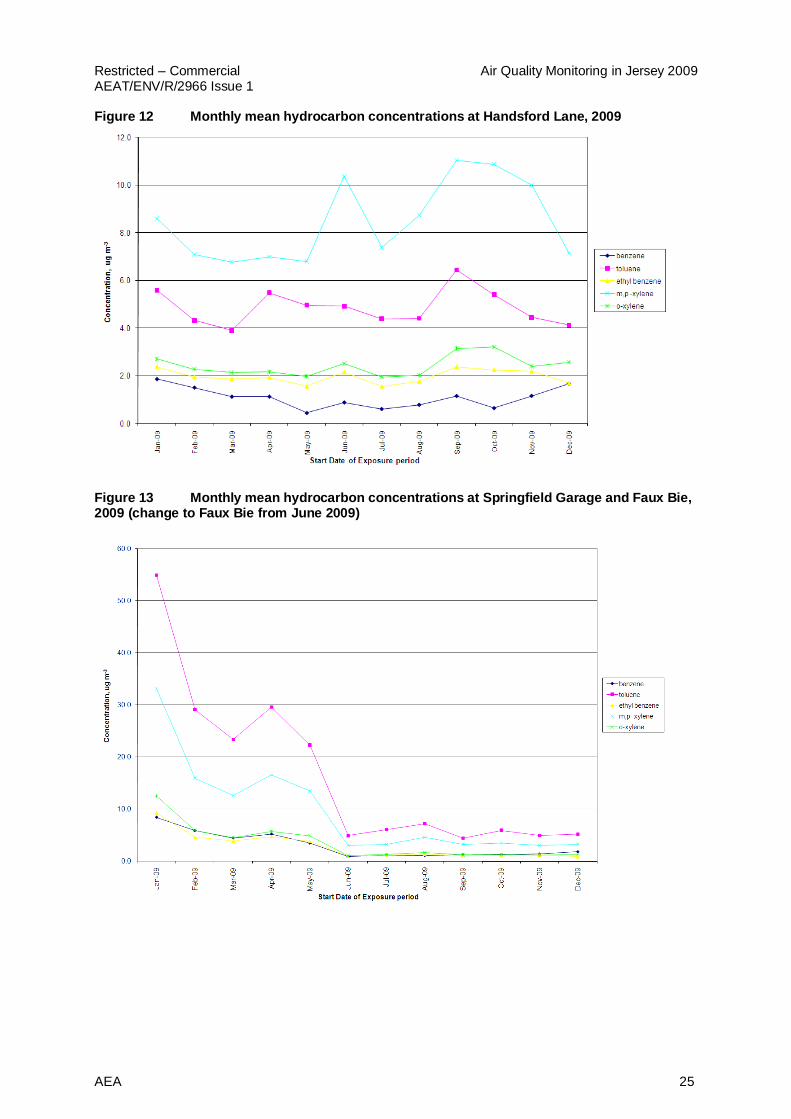
Figure 8 shows the monthly mean NO2 concentrations measured at the diffusion tube sites and at Halkett Place. This shows the means of the five kerbside and four roadside sites, and the monthly means measured at the single urban background site (Le Bas Centre), urban residential site (Les Quennevais) and rural site (Rue des Raisies). Monthly means (based on the same periods as the diffusion tube exposures) are also shown for the Halkett Place automatic site. The typical pattern in urban areas is for NO2 concentrations to be generally higher in the winter and lower in the summer. In 2009, the highest concentrations at the diffusion tube sites were typically measured in March and April. There was no clear seasonal pattern.
Air Quality Monitoring in Jersey 2009 Restricted – Commercial AEAT/ENV/R/2966 Issue 1
20 AEA
Figure 7 Diurnal Variation in concentrations of oxides of nitrogen, Halkett Place
Figure 8 Monthly Mean NO2 Concentrations at Diffusion Tube Sites and Halkett Place

Restricted – Commercial Air Quality Monitoring in Jersey 2009 AEAT/ENV/R/2966 Issue 1
AEA 21
4.3.3 Comparison with UK NO2 data
Table 9 compares the NO2 concentrations measured at Halkett Place with those measured at a selection of UK air quality monitoring stations using automatic (chemiluminescent) NO2 analysers. The automatic data have been fully ratified. The sites used for comparison are as follows:
Exeter Roadside – a roadside site in the centre of Exeter, Devon.
Brighton Roadside – a roadside site in the coastal city of Brighton, Sussex.
Brighton Preston Park – an urban background site in Brighton.
Southend on Sea – an urban background site in the coastal town of Southend, Essex.
Lullington Heath - a rural site on the South Coast of England near the town of Eastbourne.
Harwell - a rural site in the south of England, within 10km of a power station. Table 9 Comparison of NO2 in Jersey with UK Automatic Sites
Site 2009 Annual average NO2, µg m
-3
Exeter Roadside 40
Brighton Roadside 37
Brighton Preston Park 19
Southend on Sea 23
Lullington Heath 10.5
Harwell 10.0
Halkett Place (auto.) 31
The bias adjusted annual mean NO2 concentrations measured at the kerbside and roadside sites in Jersey (rounded to the nearest integer) ranged from 18 to 35 µg m
-3. The annual means at Exeter
Roadside and Brighton Roadside were just above this range, and both were higher than the annual mean at the Halkett Place automatic site (and co-located diffusion tubes). The Jersey urban background site at Le Bas Centre had a (bias adjusted) annual mean NO2 concentration of 21 µg m
-3;
this is comparable to the annual means from the urban background sites in Southend and Brighton Preston Park. The residential background site at Les Quennevais had a bias-adjusted annual mean NO2 concentration of 8 µg m
-3 - more comparable with rural sites such as Lullington Heath and
Harwell. The bias-adjusted annual mean of 6 µg m-3
at the Jersey rural background site, Rue des Raisies, as in previous years, was considerably lower than that measured at either Harwell or Lullington Heath.
4.3.4 Trends in Nitrogen Dioxide at Long-Running Sites
There are eight sites in the survey which have been in operation since 2000. The annual mean NO2 concentrations are shown in Table 10 and illustrated in Figure 9. These data are not adjusted for diffusion tube bias; prior to 2002 there was no reliable information on which to carry out bias adjustment, so for consistency, unadjusted data are used in this section. Annual mean NO2 concentrations at the kerbside, roadside and urban background sites (Weighbridge, Georgetown, Beaumont, the Parade, Broad Street, and Le Bas) gave cause for concern in the early years of the study (2000 to 2003). Many were above the EC Directive Limit Value of 40 µg m
-3, and
there was no sign of concentrations decreasing. However, from 2004 onwards, concentrations began to decrease, and all are now within the Limit Value (although exceedences in future years cannot be ruled out, as NO2 concentrations vary from year to year due to meteorological and other factors). The residential background and rural sites at Les Quennevais and Rue des Raisies do not show any consistent upward or downward trend in NO2 concentration: but levels here are already low so this is not of concern.

Air Quality Monitoring in Jersey 2009 Restricted – Commercial AEAT/ENV/R/2966 Issue 1
22 AEA
Table 10 Annual mean NO2 concentrations, µg m-3
(not bias adjusted)
Site 2000 2001 2002 2003 2004 2005 2006 2007 2008 2009
Weighbridge 49 49 48 50 44 44 48 41 38 34
Georgetown 44 44 41 47 38 37 42 37 33 35
Beaumont 45 45 42 47 39 42 39 40 37 31
The Parade 37 37 37 39 34 31 29 28 26 24
Broad Street 40 39 44 42 44 38 39 35 34 33
Le Bas Centre 31 31 31 31 27 25 26 23 22 18 Les
Quennevais - 11 11 14 12 12 10 10 10 30 Rue Des Raisies 7 7 8 10 6 7 6 7 7 21 Figure 9 Annual Mean NO2 Concentrations (not adjusted for diffusion tube bias).
The New Street site has shown a substantial decrease in 2009 compared to 2008 and earlier years. This is thought to be due to a reduction in traffic flow: New Street is now open to access traffic only. By contrast, Union Street is reported to be carrying a greater quantity of traffic, which may possibly account for the observed increase in NO2 concentration.

Restricted – Commercial Air Quality Monitoring in Jersey 2009 AEAT/ENV/R/2966 Issue 1
AEA 23
4.4 Hydrocarbons
Full monthly results of the hydrocarbon survey for the six sites are shown in Appendix 4, Tables A3.1 to A3.7. Graphical representations are shown in Figures 10 to 15. A summary of annual average hydrocarbon concentrations is shown in Table 11. Table 11 Summary of Average Hydrocarbon Concentrations, Jersey, 2009
Site Benzene,
µg m-3
Toluene, µg m
-3
Ethyl Benzene, µg m
-3
m+p Xylene, µg m
-3
o Xylene, µg m
-3
Beresford Street 1.8 6.9 1.5 5.2 2.0
Le Bas Centre 1.4 5.4 1.4 3.9 1.5
Handsford Lane (paint spraying)
1.1 4.9 2.0 8.5 2.4
Springfield Garage (petrol station) Jan – May only
5.5 31.9 5.3 18.4 6.7
Faux Bie (Houses near petrol
station) Jun – Dec only
1.3 5.5 1.1 3.4 1.3
Clos St Andre 0.8 1.7 0.5 1.4 0.5
Airport 0.6 2.0 0.5 0.9 0.4
Travel Blanks 1.3 5.6 2.8 4.0 6.2
Full data capture was achieved at all sites.
Each batch of tubes is accompanied by a travel blank, whose purpose is explained in section 2.3. These were analysed alongside the exposed tubes, and the results (expressed as equivalent concentrations) have been included in Table 11. Travel blank tubes would normally be expected to give very low results compared with exposed tubes. However, in the 2009 study, the results from the BTEX travel blanks were consistently high. The annual mean blank concentrations (expressed as equivalent ambient concentrations) were comparable to those measured at urban locations such as Beresford Street and Le Bas Centre, and higher than those measured at the Clos St Andre and Airport sites. This indicates that the travel blanks – and possibly all the BTEX tubes – have been exposed to contamination. This called into question the validity of the entire BTEX dataset for 2009. However, as
(i) the results from the exposed tubes were consistent with those seen in previous years, when BTEX blanks were not high, and
(ii) the results from Clos St Andre and the Airport were as low as usual (and on average substantially lower than the travel blanks)
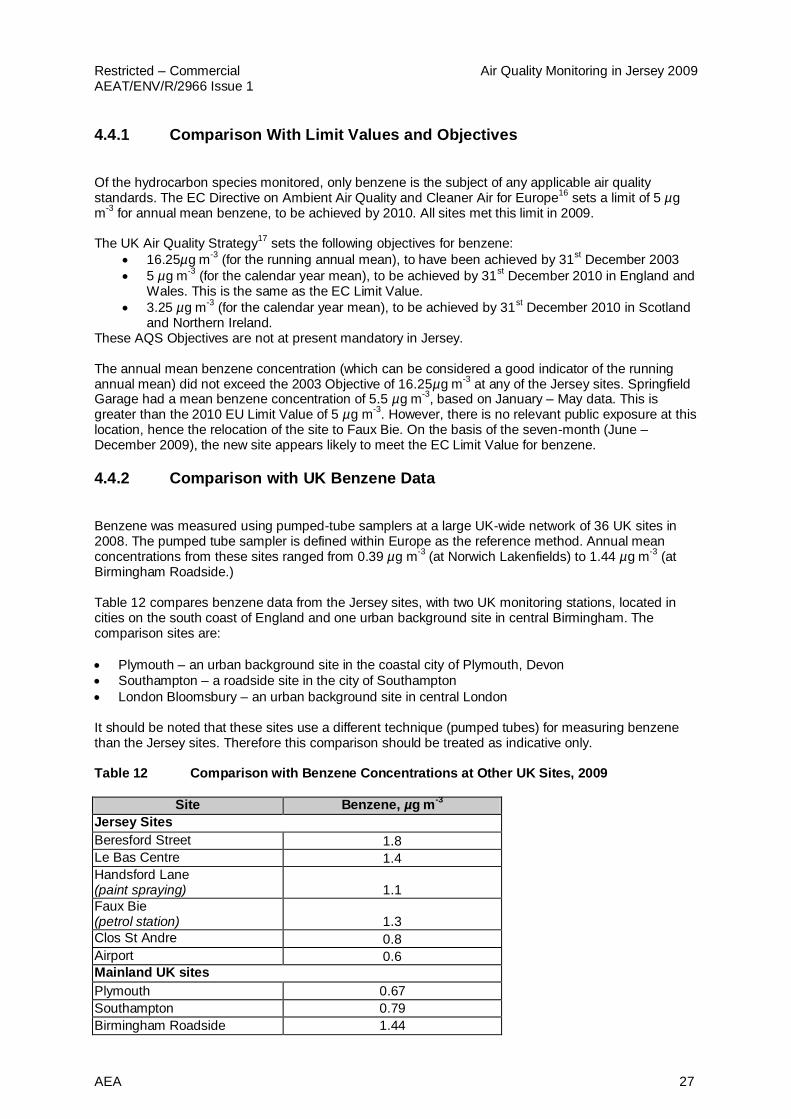
- it has been concluded that the source of contamination has affected the blanks only, and not the exposed tubes. BTEX tubes are very vulnerable to contamination by solvents in common items such as felt-tipped pens. In addition to the sealed bag in which they are supplied, it may be helpful to store them in a sealed container such as a plastic lunchbox. Springfield Garage monitoring site has always recorded the highest annual mean concentrations of all five BTEX compounds. However, it was located on the forecourt of a fuel filling station, and not truly representative of the exposure of the neighbouring residents. Therefore, at the start of June 2009 the site was re-located to Faux Bie Terrace, in order to more accurately reflect population exposure. Based on the 7-month means for June – December 2009, levels of hydrocarbons at Faux Bie are much lower than those on the forecourt, and are consistent with those measured at Beresford Street and Le Bas Centre. The results for Springfield Garage and Faux Bie have been plotted on the same axes to illustrate this: there is a clear step change when the tubes were re-sited.

Air Quality Monitoring in Jersey 2009 Restricted – Commercial AEAT/ENV/R/2966 Issue 1
24 AEA
The Handsford Lane site (near a paint spraying process) measured highest levels of xylenes than all sites except Springfield Garage, as it typically has in previous years. However, benzene and toluene concentrations at Handsford Lane were no higher than those at Beresford Street or Le Bas; the nearby paint spraying process is not a significant source of benzene or toluene. The Airport site, and Clos St Andre, which are in rural surroundings, recorded the lowest annual mean concentrations of all the BTEX hydrocarbons. Figure 10 Monthly mean hydrocarbon concentrations at Beresford Street, 2009
Figure 11 Monthly mean hydrocarbon concentrations at Le Bas Centre, 2009
Restricted – Commercial Air Quality Monitoring in Jersey 2009 AEAT/ENV/R/2966 Issue 1
AEA 25
Figure 12 Monthly mean hydrocarbon concentrations at Handsford Lane, 2009
Figure 13 Monthly mean hydrocarbon concentrations at Springfield Garage and Faux Bie, 2009 (change to Faux Bie from June 2009)

Air Quality Monitoring in Jersey 2009 Restricted – Commercial AEAT/ENV/R/2966 Issue 1
26 AEA
Figure 14 Monthly mean hydrocarbon concentrations at Clos St Andre, 2009
Figure 15 Monthly mean hydrocarbon concentrations at the Airport, 2009
Restricted – Commercial Air Quality Monitoring in Jersey 2009 AEAT/ENV/R/2966 Issue 1
AEA 27
4.4.1 Comparison With Limit Values and Objectives
Of the hydrocarbon species monitored, only benzene is the subject of any applicable air quality standards. The EC Directive on Ambient Air Quality and Cleaner Air for Europe
16 sets a limit of 5 µg
m-3
for annual mean benzene, to be achieved by 2010. All sites met this limit in 2009. The UK Air Quality Strategy
17 sets the following objectives for benzene:
16.25µg m-3
(for the running annual mean), to have been achieved by 31st December 2003
5 µg m-3
(for the calendar year mean), to be achieved by 31st December 2010 in England and
Wales. This is the same as the EC Limit Value.
3.25 µg m-3
(for the calendar year mean), to be achieved by 31st December 2010 in Scotland
and Northern Ireland. These AQS Objectives are not at present mandatory in Jersey. The annual mean benzene concentration (which can be considered a good indicator of the running annual mean) did not exceed the 2003 Objective of 16.25µg m
-3 at any of the Jersey sites. Springfield
Garage had a mean benzene concentration of 5.5 µg m-3
, based on January – May data. This is greater than the 2010 EU Limit Value of 5 µg m
-3. However, there is no relevant public exposure at this
location, hence the relocation of the site to Faux Bie. On the basis of the seven-month (June – December 2009), the new site appears likely to meet the EC Limit Value for benzene.
4.4.2 Comparison with UK Benzene Data
Benzene was measured using pumped-tube samplers at a large UK-wide network of 36 UK sites in 2008. The pumped tube sampler is defined within Europe as the reference method. Annual mean concentrations from these sites ranged from 0.39 µg m
-3 (at Norwich Lakenfields) to 1.44 µg m
-3 (at
Birmingham Roadside.) Table 12 compares benzene data from the Jersey sites, with two UK monitoring stations, located in cities on the south coast of England and one urban background site in central Birmingham. The comparison sites are:
Plymouth – an urban background site in the coastal city of Plymouth, Devon
Southampton – a roadside site in the city of Southampton
London Bloomsbury – an urban background site in central London It should be noted that these sites use a different technique (pumped tubes) for measuring benzene than the Jersey sites. Therefore this comparison should be treated as indicative only. Table 12 Comparison with Benzene Concentrations at Other UK Sites, 2009
Site Benzene, µg m-3
Jersey Sites
Beresford Street 1.8
Le Bas Centre 1.4
Handsford Lane (paint spraying) 1.1
Faux Bie (petrol station) 1.3
Clos St Andre 0.8
Airport 0.6
Mainland UK sites
Plymouth 0.67
Southampton 0.79
Birmingham Roadside 1.44

Air Quality Monitoring in Jersey 2009 Restricted – Commercial AEAT/ENV/R/2966 Issue 1
28 AEA
The annual mean benzene concentration at Jersey’s urban sites was typically higher than the UK Network sites, including the roadside site at Southampton and Plymouth. Prior to 2006 it was reported that benzene levels at Clos St Andre and the Airport were lower than typical UK urban levels; however, UK urban levels have decreased and this is no longer the case.
4.4.3 Comparison with Previous Years' Hydrocarbon Results
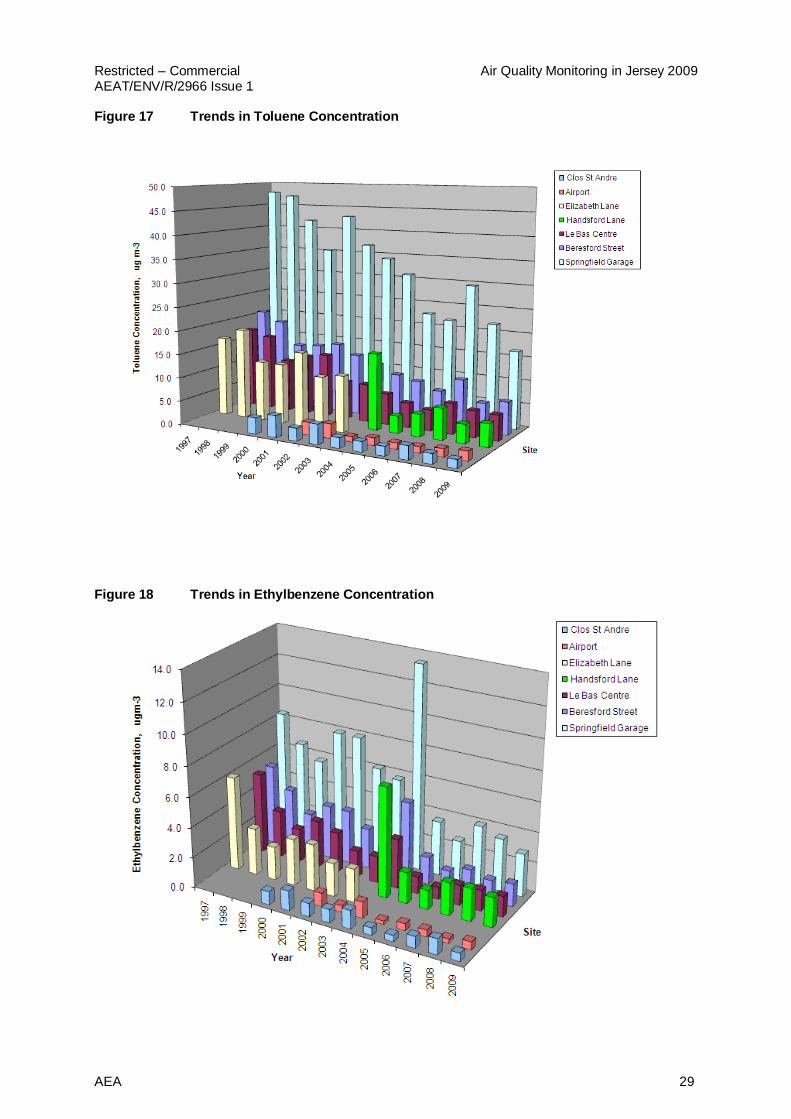
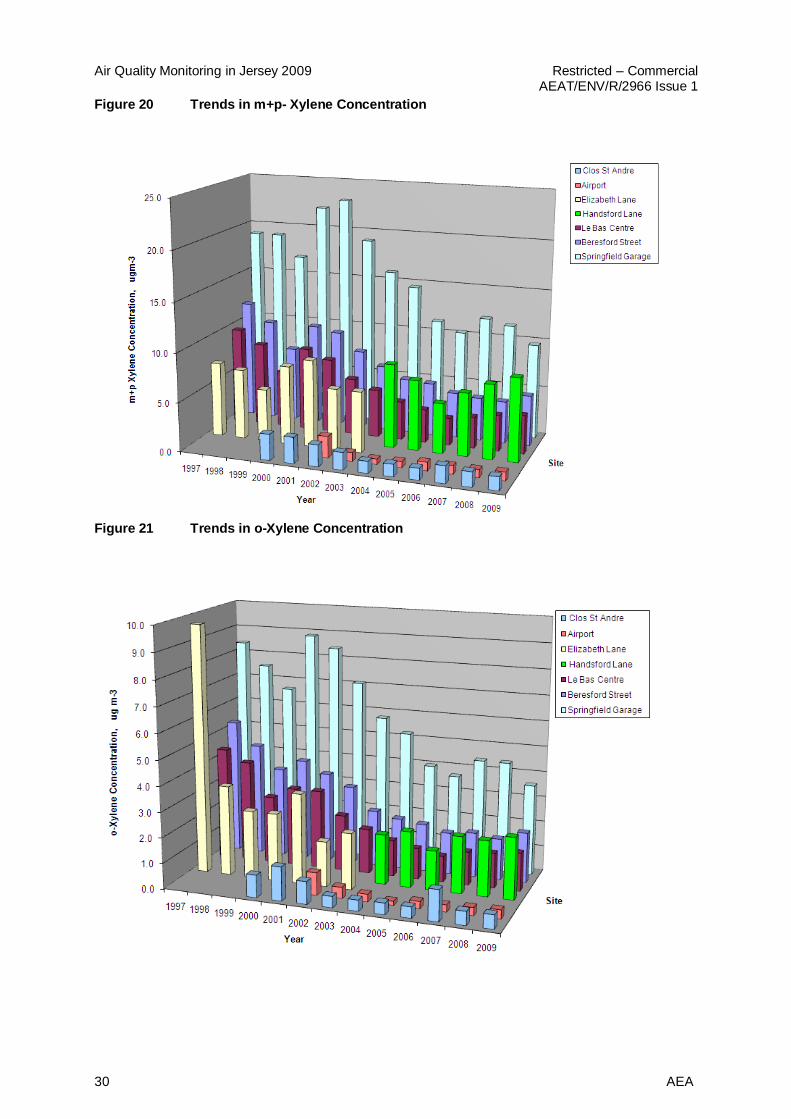
Figures 16 – 21 show how annual mean hydrocarbon concentrations at the six Jersey sites have changed over the years of monitoring. These data are also provided in tabular form in Appendix 4. Annual mean levels of hydrocarbons in 2009 were comparable with those measured in 2008 and recent years. It is important to remember that pollutant concentrations are expected to show considerable year-to-year variation, due to meteorological and other factors. Year-to year changes are therefore of less importance than the observation of long-term trends, which are discussed below. Figure 16 Trends in Benzene Concentration
Restricted – Commercial Air Quality Monitoring in Jersey 2009 AEAT/ENV/R/2966 Issue 1
AEA 29
Figure 17 Trends in Toluene Concentration
Figure 18 Trends in Ethylbenzene Concentration
Air Quality Monitoring in Jersey 2009 Restricted – Commercial AEAT/ENV/R/2966 Issue 1
30 AEA
Figure 20 Trends in m+p- Xylene Concentration
Figure 21 Trends in o-Xylene Concentration

Restricted – Commercial Air Quality Monitoring in Jersey 2009 AEAT/ENV/R/2966 Issue 1
AEA 31
Most hydrocarbon species appear to have decreased over the ten years of monitoring, being in most cases lower now than in the late 1990s. Key observations include:
Benzene showed a marked drop in 2000, especially at Springfield Garage: this is due to the maximum permitted benzene content of petrol sold in the UK being reduced from 2% in unleaded (5% in super unleaded), to 1% as of 1
st January 2000. Concentrations have
remained stable (with small fluctuations) since around 2004. However, there is no relevant public exposure at this site, hence its relocation in 2009.
Toluene concentrations show a downward trend over the earlier years of the survey (1997-2004) but little consistent change thereafter.
Ethylbenzene concentrations have generally decreased, despite an unexplained increase in 2004.
Concentrations of m+p xylene, and of o-xylene, are now generally lower than in the early years of the survey.
At Handsford Lane (near a paint spraying process), concentrations of m+p xylene appear to have risen year-on-year since 2006, after having decreased in the early years of monitoring at this site.
Air Quality Monitoring in Jersey 2009 Restricted – Commercial AEAT/ENV/R/2966 Issue 1
32 AEA
5 Conclusions
AEA has continued the ongoing air quality monitoring programme in Jersey during 2009, on behalf of the States of Jersey Public Health Services. 2009 was the thirteenth year of monitoring. Oxides of nitrogen were monitored at one automatic monitoring station, located in a roadside position at the Central Market, Halkett Place in St Helier, which was supplemented by diffusion tubes for indicative monitoring of NO2 at 12 sites around the island. Diffusion tubes were co-located (in triplicate) with the automatic site at Halkett Place. Hydrocarbons (benzene, toluene, ethyl benzene and xylenes, collectively termed BTEX) were measured at 6 sites, also using diffusion tubes. The sites were located at a range of different locations on the island, many of which have been in operation since 2000, and some since 1997. Conclusions of the monitoring programme were as follows: NO2 results
1. The maximum hourly mean NO2 concentration at the Halkett Place automatic monitoring station was 271 µg m
-3. The site exceeded the EC Directive Limit Value (and AQS Objective)
of 200 µg m-3
for 1-hour mean NO2 concentration on just two occasions in 2009. The maximum permitted number of exceedences is 18 per calendar year, so this site meets the Limit Value and Objective.
2. The annual mean NO2 concentration at Halkett Place was 31 µg m-3
, as measured by the automatic analyser. This is well within the EC Directive Limit Value and AQS Objective of 40 µg m
-3.
3. Diffusion tubes exposed in triplicate alongside the automatic analyser showed good agreement with the reference method, giving an annual mean of 33 µg m
-3.
4. Annual mean NO2 concentrations at all 12 diffusion tube monitoring sites were within the EC Limit Value, and were generally comparable with previous year’s results.
5. Eight diffusion tube sites have been in operation since 2000. These indicate that while in the early years of the survey (2000 – 2004) annual mean NO2 concentrations at kerbside and roadside sites showed little change, they now appear to be decreasing.
6. There does not appear to be any clear trend in NO2 concentrations at the long running urban background site (Le Bas Centre), urban residential site (Les Quennevais) or rural site (Rue des Raisies); these appear to be remaining stable. However, as they are all well below the Limit Value and AQS Objective, this is not a cause for great concern.
Hydrocarbon diffusion tube results
7. No sites had annual mean benzene concentrations greater than the UK Air Quality Strategy Objective of 16.25 µg m
-3, which was to be achieved by the end of 2003.
8. Springfield Garage had a five-month (January to May) mean benzene concentration greater than the EC Directive Limit Value of 5 µg m
-3 (which is to be achieved by 2010). However,
this site has no relevant public exposure and was therefore re-located to Faux Bie in June 2009.
9. Annual mean concentrations of BTEX hydrocarbons were comparable with those measured in recent years.
10. Concentrations of all BTEX hydrocarbons (especially benzene) are considerably lower than in the early years of the survey. However, there has been little consistent change in the most recent years.
11. In 2009, the results of the BTEX travel blank were consistently high. One possible explanation is that they have been contaminated by solvents. Although the BTEX tubes have always been stored in sealed bags, it is suggested these be placed in a sealed container (e.g. a plastic sandwich box) and kept away from items such as felt-tip pens and markers, which contain solvents.

Restricted – Commercial Air Quality Monitoring in Jersey 2009 AEAT/ENV/R/2966 Issue 1
AEA 33
6 Acknowledgements
AEA gratefully acknowledges the help and support of the staff of the States of Jersey Health Protection Services, in the completion of this monitoring study.

Air Quality Monitoring in Jersey 2009 Restricted – Commercial AEAT/ENV/R/2966 Issue 1
34 AEA
7 References
1. Air Quality Monitoring in Jersey; Diffusion Tube Surveys 1997. B Stacey, report no. AEAT-3071, March 1998. 2. Air Quality Monitoring in Jersey; Diffusion Tube Surveys 1998. B Stacey, report no. AEAT-5271, April 1999. 3. Air Quality Monitoring in Jersey; Diffusion Tube Surveys 1999. B Stacey, A Loader, report no. AEAT-EQ0191, March 2000. 4. Air Quality Monitoring in Jersey; Diffusion Tube Surveys 2000. J Lampert, B Stacey, report no. AEAT/ENV/R/0561, March 2001. 5. Air Quality Monitoring in Jersey; Diffusion Tube Surveys 2001. B Stacey, A Loader report no. AEAT/ENV/R/1033, March 2002. 6. Air Quality Monitoring in Jersey; Diffusion Tube Surveys 2002. B Stacey, A Loader report no. AEAT/ENV/R/1411, March 2003. 7. Air Quality Monitoring in Jersey; Diffusion Tube Surveys 2003. B Stacey, A Loader report no. AEAT/ENV/R/1721, March 2004. 8. Air Quality Monitoring in Jersey; Diffusion Tube Surveys 2004. B Stacey, A Loader report no. AEAT/ENV/R/1928, March 2005. 9. Air Quality Monitoring in Jersey; Diffusion Tube Surveys 2005. A Loader, R Goodwin report no. AEAT/ENV/R/2165, March 2006. 10. Air Quality Monitoring in Jersey; Diffusion Tube Surveys 2006. A Loader, B Stacey, report no. AEAT/ENV/R/2457, June 2007. 11. Air Quality Monitoring in Jersey; Diffusion Tube Surveys 2007. A Loader, B Stacey, report no. AEAT/ENV/R/2457, July 2008. 12. Air Quality Monitoring in Jersey; Diffusion Tube Surveys 2008. A Loader, B Stacey, report no. AEAT/ENV/R/2785, May 2009 13. EH40/97. Occupational Exposure Limits 1997. Health & Safety Executive. HMSO, ISBN 0-7176-1315-1. 14. Odour Measurement and Control - an update. Editors M Woodfield & D Hall. AEA Technology report AEA/CS/REMA/-038 ISBN 0 85624 8258. August 1994. 15. Guidelines for Air Quality, WHO, Geneva, 2000, WHO/SDE/OEH/00.02. www.who.int/peh/air/airqualitygd.htm 16. Council Directive 2008/50/EC of the European Parliament and of the Council of 21
st May 2008, on
ambient air quality and cleaner air for Europe. Available from http://ec.europa.eu/environment/air/quality/legislation/directive.htm . 17. The Air Quality Strategy for England, Scotland, Wales and Northern Ireland. July 2007, The Stationery Office, ID 5611194 07/07 18. Part IV of the Environment Act 1995. Local Air Quality Management. Technical Guidance LAQM.TG(09) February 2009. Produced by Defra, available from www.defra.gov.uk/environment/airquality/index.htm

Restricted – Commercial Air Quality Monitoring in Jersey 2009 AEAT/ENV/R/2966 Issue 1
AEA 35
Appendices
Appendix 1: Air Quality Limit Values, Objectives and Guidelines
Appendix 2: Calibration Procedures for Automatic Analyser
Appendix 3: Nitrogen Dioxide Diffusion Tubes: Bias Adjustment Factor
Appendix 4: BTEX Diffusion Tubes: Monthly Dataset

Air Quality Monitoring in Jersey 2009 Restricted – Commercial AEAT/ENV/R/2966 Issue 1
36 AEA
Appendix 1
Air Quality Limit Values, Objectives and
Guidelines

Restricted – Commercial Air Quality Monitoring in Jersey 2009 AEAT/ENV/R/2966 Issue 1
AEA 37
Air Pollution Guidelines Used in this Report.
UK and International Ambient Air Quality Limit Values, Objectives and Guidelines
Nitrogen Dioxide
Guideline Set By
Description
Criteria Based On
Value(1)
/ gm-3
(ppb)
The Air Quality Strategy(2)
Objective for Dec. 31st
2005,
for protection of human health
1-hour mean 200 (105)
Not to be exceeded more than
18 times per calendar year.
Set in regulations(3)
for all
UK:
Objective for Dec. 31st
2005,
for protection of human health
Annual mean 40 (21)
Not intended to be set in
regulations:
Objective for Dec. 31st
2000,
for protection of vegetation.
Annual mean NOx
(NOX as NO2)
30 (16)
European Community 1985 NO2 Directive
(4)
Limit remains in force until fully repealed 01/01/2010.
Limit Value Calendar year of data: 98%ile of hourly means.
200 (105)
ED Directive on Ambient Air
Quality and Cleaner Air for Europe
(5)
Limit Value
for protection of human health. To be achieved by Jan. 1
st
2010
1 hour mean 200 (105)
not to be exceeded more than 18 times per calendar year
Limit Value for protection of human health.
To be achieved by Jan. 1st
2010
Calendar year mean 40 (21)
Limit Value ( total NOX)
for protection of vegetation. To
be achieved by Jul. 19th
2001
Calendar year mean 30 (16)
World Health Organisation(6)
(Non-Mandatory Guidelines)
Health Guideline
1-hour mean 200
Health Guideline
Annual mean 40
(1) Conversions between µg m
-3 and ppb are as used by the EC, i.e. 1ppb NO2 = 1.91 µg m
-3 at 20
oC and 1013 mB.
(2) The Air Quality Strategy for England, Scotland, Wales and Northern Ireland. July 2007, The Stationery
Office, ID 5611194 07/07. (3) Air Quality Regulations 2007 (SI 2007/64), Air Quality Standards (Wales) Regulations 2007 (Welsh SI 2007
717 (W63)), Air Quality Standards (Scotland) Regulations 2007 (SSI 2007 No. 182), Air Quality Standards (Northern Ireland) Regulations 2007 (Statutory Rule 2007 No. 265)
(4) Council Directive 85/203/EEC. (5) Council Directive 2008/50/EC.
(6) WHO Guidelines for Air Quality WHO/SDE/OEH/00.02 (2000).

Air Quality Monitoring in Jersey 2009 Restricted – Commercial AEAT/ENV/R/2966 Issue 1
38 AEA
Benzene
Guideline Set By
Description
Criteria Based On
Value(1)
/ gm-3
(ppb)
The Air Quality Strategy(2,3)
All UK
Objective for Dec. 31st
2003 Running annual mean 16.25 (5)
England(4)
& Wales(5)
only: Objective for Dec. 31st
2010 Annual mean 5 (1.54)
Scotland(6)
& Northern
Ireland
Objective for Dec. 31st
2010 Running annual mean 3.25 (1.0)
ED Directive on Ambient Air Quality and Cleaner Air for
Europe (8)
Limit Value.
To be achieved by Jan 1st
2010
Annual calendar year mean 5 (1.5)
(1) Conversions between µg m
-3 and ppb are those used by the EC, i.e. 1ppb benzene = 3.25 µg m
-3 at 20
oC and 1013 mB.
(2) The Air Quality Strategy for England, Scotland, Wales and Northern Ireland. July 2007, The Stationery
Office, ID 5611194 07/07. (3) Air Quality (England) Regulations 2000 (SI 2000/928), Air Quality (Scotland) Regulations 2000 (SSI 2000/97), Air Quality (Wales) Regulations
2000 (SI 2000/1940 (W138)). (4) Air Quality (Amendment) (England) Regulations 2002 (SI 2002/3043) (5) Air Quality (Amendment) (Wales) Regulations 2002 (SI 2002/3182 (W298))
(6) Air Quality (Amendment) (Scotland) Regulations 2002 (SI 2002/297) (7) Council Directive 2008/50/EC.

Restricted – Commercial Air Quality Monitoring in Jersey 2009 AEAT/ENV/R/2966 Issue 1
AEA 39
Appendix 2
Calibration Procedures for Automatic Analyser

Air Quality Monitoring in Jersey 2009 Restricted – Commercial AEAT/ENV/R/2966 Issue 1
40 AEA
The analyser at Halkett Place is calibrated monthly by the Health Protection team. Standard gas calibration mixtures are used to check the instrument’s span, and chemically scrubbed air is used to check the instrument’s zero. All gas calibration standards used for routine analyser calibration are certified against traceable primary gas calibration standards at the Gas Standards Calibration Laboratory at AEA. The calibration laboratory operates within a specific and documented quality system and has UKAS accreditation for calibration of the gas standards used in this survey. The calibration form used is shown below. Jersey Calibration Form
An important aspect of QA/QC procedures is the 12-monthly intercalibration and audit check undertaken every 12 months. This audit has two principle functions, firstly to check the instrument and the site infrastructure, and secondly to recalibrate the transfer gas standards routinely used on-site, using standards recently checked in the calibration laboratory. AEA’s audit calibration procedures are UKAS accredited to ISO 17025. In line with current operational procedures within the Defra Automatic Urban and Rural Network (AURN), full intercalibration audits take place at the end of winter and summer. At these visits, the essential functional parameters of the monitors, such as noise, linearity and, for the NOX monitor, the efficiency of the NO2 to NO converter are fully tested. In addition, the on-site transfer calibration standards are checked and re-calibrated if necessary, the air intake sampling system is cleaned and checked and all other aspects of site infrastructure are checked.

Restricted – Commercial Air Quality Monitoring in Jersey 2009 AEAT/ENV/R/2966 Issue 1
AEA 41
Appendix 3
Nitrogen Dioxide Diffusion Tubes: Bias
Adjustment Factor
The precision and accuracy of the diffusion tubes in this study were quantified by exposing them in triplicate alongside the automatic NOx analyser at Halkett Place. The percentage by which the diffusion tubes over-or under-estimate with respect to the automatic chemiluminescent analyser (defined within the European Community as the reference method for NO2) is calculated as follows: Percentage bias B = 100 x (D-C)/C
- where D = the average NO2 concentration as measured using diffusion tubes and C is the average NO2 concentration as measured using the automatic analyser.
The diffusion tube annual mean concentrations measured at the other (non-co-located) sites can be adjusted for the diffusion tube over/under-read, by application of a bias adjustment factor, calculated as follows: Bias adjustment factor = C/D (where D and C are the annual mean NO2 concentrations as measured using diffusion tubes and the automatic analyser respectively, as above). These calculations were carried out using a spreadsheet tool developed by AEA: see Figure A3.1 below. This spreadsheet shows the diffusion tube concentrations to 1 decimal place as reported by the analyst – but given the uncertainty on diffusion tube measurements it is only considered valid to report to the nearest integer in the report. (Note – the annual mean calculated by the spreadsheet for the automatic monitor is shown as 30 µg m
-3 rather than 31 µg m
-3: this is because the spreadsheet shows the mean of the 12 monthly
means, rather than the mean of the complete hourly dataset. This is makes a negligible difference to the bias adjustment factor).

Air Quality Monitoring in Jersey 2009 Restricted – Commercial AEAT/ENV/R/2966 Issue 1
42 AEA
Figure A3.1 Precision and Bias Spreadsheet, showing Halkett Place dataset.

Restricted – Commercial Air Quality Monitoring in Jersey 2009 AEAT/ENV/R/2966 Issue 1
AEA 43
Appendix 4
BTEX Diffusion Tubes: Monthly Dataset and
Annual Means 1997-2009
Air Quality Monitoring in Jersey 2009 Restricted – Commercial AEAT/ENV/R/2966 Issue 1
44 AEA
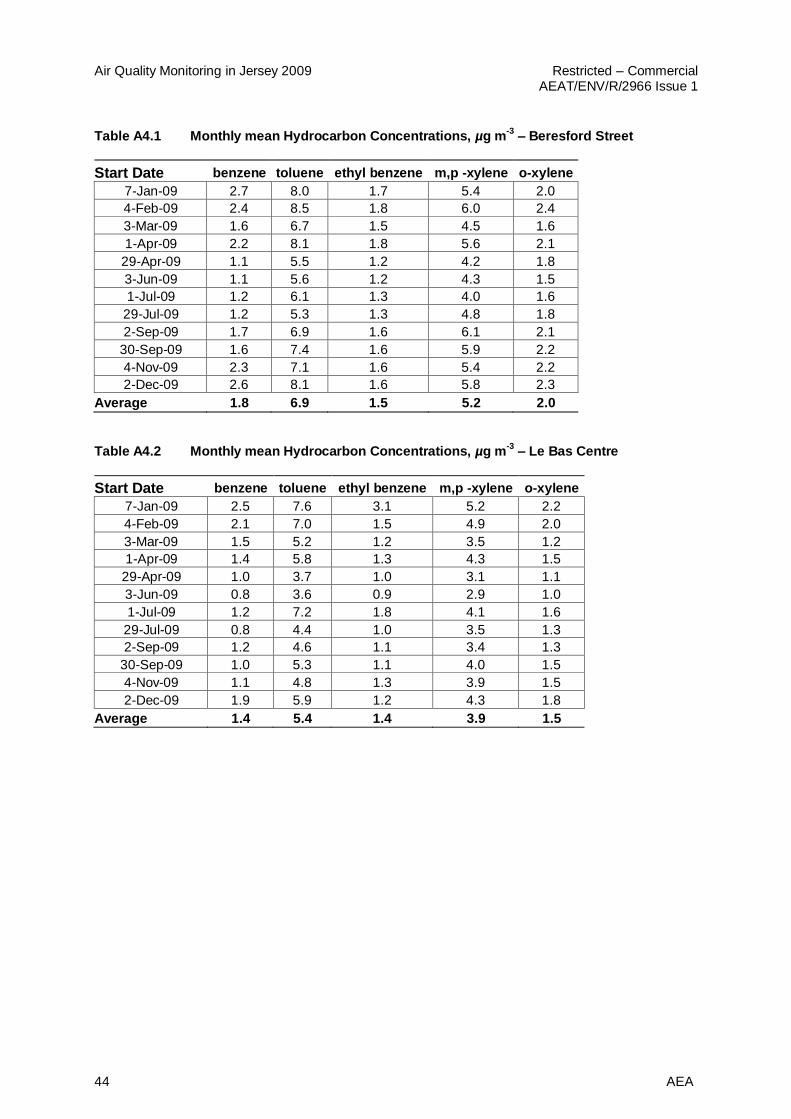
Table A4.1 Monthly mean Hydrocarbon Concentrations, µg m-3
– Beresford Street
Start Date benzene toluene ethyl benzene m,p -xylene o-xylene
7-Jan-09 2.7 8.0 1.7 5.4 2.0
4-Feb-09 2.4 8.5 1.8 6.0 2.4
3-Mar-09 1.6 6.7 1.5 4.5 1.6
1-Apr-09 2.2 8.1 1.8 5.6 2.1
29-Apr-09 1.1 5.5 1.2 4.2 1.8
3-Jun-09 1.1 5.6 1.2 4.3 1.5
1-Jul-09 1.2 6.1 1.3 4.0 1.6
29-Jul-09 1.2 5.3 1.3 4.8 1.8
2-Sep-09 1.7 6.9 1.6 6.1 2.1
30-Sep-09 1.6 7.4 1.6 5.9 2.2
4-Nov-09 2.3 7.1 1.6 5.4 2.2
2-Dec-09 2.6 8.1 1.6 5.8 2.3
Average 1.8 6.9 1.5 5.2 2.0
Table A4.2 Monthly mean Hydrocarbon Concentrations, µg m-3
– Le Bas Centre
Start Date benzene toluene ethyl benzene m,p -xylene o-xylene
7-Jan-09 2.5 7.6 3.1 5.2 2.2
4-Feb-09 2.1 7.0 1.5 4.9 2.0
3-Mar-09 1.5 5.2 1.2 3.5 1.2
1-Apr-09 1.4 5.8 1.3 4.3 1.5
29-Apr-09 1.0 3.7 1.0 3.1 1.1
3-Jun-09 0.8 3.6 0.9 2.9 1.0
1-Jul-09 1.2 7.2 1.8 4.1 1.6
29-Jul-09 0.8 4.4 1.0 3.5 1.3
2-Sep-09 1.2 4.6 1.1 3.4 1.3
30-Sep-09 1.0 5.3 1.1 4.0 1.5
4-Nov-09 1.1 4.8 1.3 3.9 1.5
2-Dec-09 1.9 5.9 1.2 4.3 1.8
Average 1.4 5.4 1.4 3.9 1.5

Restricted – Commercial Air Quality Monitoring in Jersey 2009 AEAT/ENV/R/2966 Issue 1
AEA 45
Table A4.3 Monthly mean Hydrocarbon Concentrations, µg m-3
– Springfield Garage
Start Date benzene toluene ethyl benzene m,p -xylene o-xylene
7-Jan-09 8.4 55.0 9.3 33.1 12.5
4-Feb-09 5.9 29.1 4.6 15.9 5.9
3-Mar-09 4.5 23.4 3.9 12.6 4.6
1-Apr-09 5.2 29.6 4.7 16.6 5.7
29-Apr-09 3.5 22.3 3.8 13.5 4.9
3-Jun-09 Site closed
1-Jul-09
29-Jul-09
2-Sep-09
30-Sep-09
4-Nov-09
2-Dec-09
Average 5.5 31.9 5.3 18.4 6.7
Table A4.4 Monthly mean Hydrocarbon Concentrations, µg m-3
– Faux Bie
Start Date benzene toluene ethyl benzene m,p -xylene o-xylene
7-Jan-09
4-Feb-09
3-Mar-09
1-Apr-09
29-Apr-09
3-Jun-09 0.9 4.9 1.0 3.1 1.0
1-Jul-09 1.1 6.1 1.2 3.2 1.3
29-Jul-09 1.1 7.2 1.4 4.6 1.7
2-Sep-09 1.3 4.4 1.1 3.3 1.2
30-Sep-09 1.2 5.9 1.1 3.5 1.3
4-Nov-09 1.4 5.0 1.2 3.0 1.2
2-Dec-09 1.8 5.2 0.9 3.3 1.3
Average 1.3 5.5 1.1 3.4 1.3

Air Quality Monitoring in Jersey 2009 Restricted – Commercial AEAT/ENV/R/2966 Issue 1
46 AEA
Table A4.5 Monthly mean Hydrocarbon Concentrations, µg m-3
– Clos St Andre
Start Date benzene toluene ethyl benzene m,p -xylene o-xylene
7-Jan-09 1.1 1.8 0.5 1.2 0.5
4-Feb-09 1.0 2.4 0.6 1.9 0.7
3-Mar-09 0.8 1.6 0.5 1.2 0.4
1-Apr-09 0.9 2.3 0.6 1.5 0.6
29-Apr-09 0.5 1.3 0.6 1.3 0.6
3-Jun-09 0.5 1.4 0.5 1.2 0.3
1-Jul-09 0.8 1.4 0.6 1.0 0.5
29-Jul-09 0.4 1.5 0.4 1.3 0.5
2-Sep-09 0.6 1.7 0.6 1.7 0.6
30-Sep-09 0.4 2.1 0.5 1.5 0.6
4-Nov-09 0.9 1.4 0.5 0.9 0.4
2-Dec-09 1.2 2.0 0.4 1.5 0.8
Average 0.8 1.7 0.5 1.4 0.5
Table A4.6 Monthly mean Hydrocarbon Concentrations, µg m-3
– Handsford Lane
Start Date benzene toluene ethyl benzene m,p -xylene o-xylene
7-Jan-09 1.9 5.6 2.4 8.6 2.7
4-Feb-09 1.5 4.3 2.0 7.1 2.3
3-Mar-09 1.1 3.9 1.9 6.8 2.1
1-Apr-09 1.1 5.5 1.9 7.0 2.2
29-Apr-09 0.4 5.0 1.6 6.8 2.0
3-Jun-09 0.9 4.9 2.2 10.4 2.5
1-Jul-09 0.6 4.4 1.6 7.4 2.0
29-Jul-09 0.8 4.4 1.8 8.7 2.0
2-Sep-09 1.2 6.5 2.4 11.0 3.2
30-Sep-09 0.7 5.4 2.3 10.9 3.2
4-Nov-09 1.2 4.4 2.2 10.0 2.4
2-Dec-09 1.7 4.1 1.7 7.1 2.6
Average 1.1 4.9 2.0 8.5 2.4
Table A4.7 Monthly mean Hydrocarbon Concentrations, µg m-3
– Airport
Start Date benzene toluene ethyl benzene m,p -xylene o-xylene
7-Jan-09 1.3 1.3 0.6 1.5 0.4
4-Feb-09 0.8 1.0 0.3 0.8 0.4
3-Mar-09 0.9 3.0 0.5 1.0 0.2
1-Apr-09 0.5 1.2 0.3 0.8 0.2
29-Apr-09 0.3 2.4 0.4 1.3 0.5
3-Jun-09 0.5 2.8 0.4 0.7 0.2
1-Jul-09 0.3 0.9 0.4 0.6 0.3
29-Jul-09 0.5 0.7 0.4 0.6 0.3
2-Sep-09 0.5 3.9 0.3 0.3 0.1
30-Sep-09 0.4 4.4 2.0 2.2 0.9
4-Nov-09 0.4 1.2 0.5 0.6 0.2
2-Dec-09 0.8 1.3 0.2 0.6 0.4
Average 0.6 2.0 0.5 0.9 0.4
Restricted – Commercial Air Quality Monitoring in Jersey 2009 AEAT/ENV/R/2966 Issue 1
AEA 47
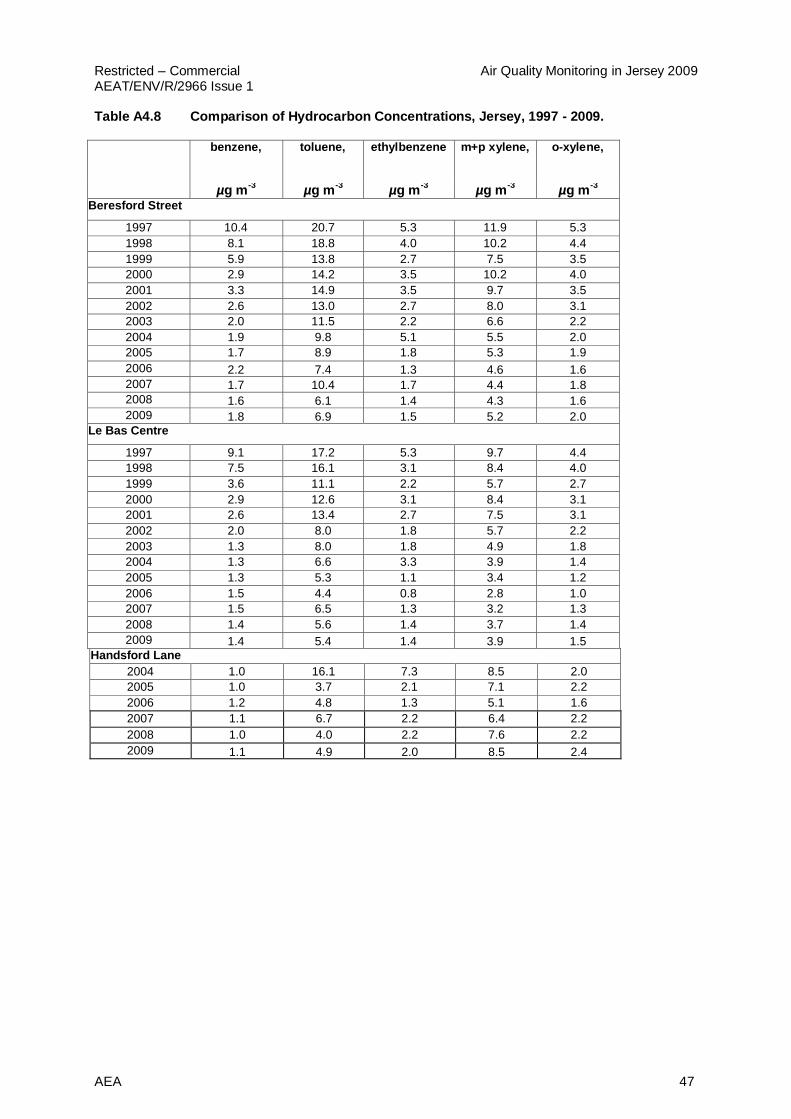
Table A4.8 Comparison of Hydrocarbon Concentrations, Jersey, 1997 - 2009.
benzene, toluene, ethylbenzene m+p xylene, o-xylene,
µg m-3
µg m-3
µg m-3
µg m-3
µg m-3
Beresford Street
1997 10.4 20.7 5.3 11.9 5.3
1998 8.1 18.8 4.0 10.2 4.4
1999 5.9 13.8 2.7 7.5 3.5
2000 2.9 14.2 3.5 10.2 4.0
2001 3.3 14.9 3.5 9.7 3.5
2002 2.6 13.0 2.7 8.0 3.1
2003 2.0 11.5 2.2 6.6 2.2
2004 1.9 9.8 5.1 5.5 2.0
2005 1.7 8.9 1.8 5.3 1.9
2006 2.2 7.4 1.3 4.6 1.6
2007 1.7 10.4 1.7 4.4 1.8
2008 1.6 6.1 1.4 4.3 1.6
2009 1.8 6.9 1.5 5.2 2.0 Le Bas Centre
1997 9.1 17.2 5.3 9.7 4.4
1998 7.5 16.1 3.1 8.4 4.0
1999 3.6 11.1 2.2 5.7 2.7
2000 2.9 12.6 3.1 8.4 3.1
2001 2.6 13.4 2.7 7.5 3.1
2002 2.0 8.0 1.8 5.7 2.2
2003 1.3 8.0 1.8 4.9 1.8
2004 1.3 6.6 3.3 3.9 1.4
2005 1.3 5.3 1.1 3.4 1.2
2006 1.5 4.4 0.8 2.8 1.0
2007 1.5 6.5 1.3 3.2 1.3
2008 1.4 5.6 1.4 3.7 1.4
2009 1.4 5.4 1.4 3.9 1.5 Handsford Lane
2004 1.0 16.1 7.3 8.5 2.0
2005 1.0 3.7 2.1 7.1 2.2
2006 1.2 4.8 1.3 5.1 1.6
2007 1.1 6.7 2.2 6.4 2.2
2008 1.0 4.0 2.2 7.6 2.2
2009 1.1 4.9 2.0 8.5 2.4
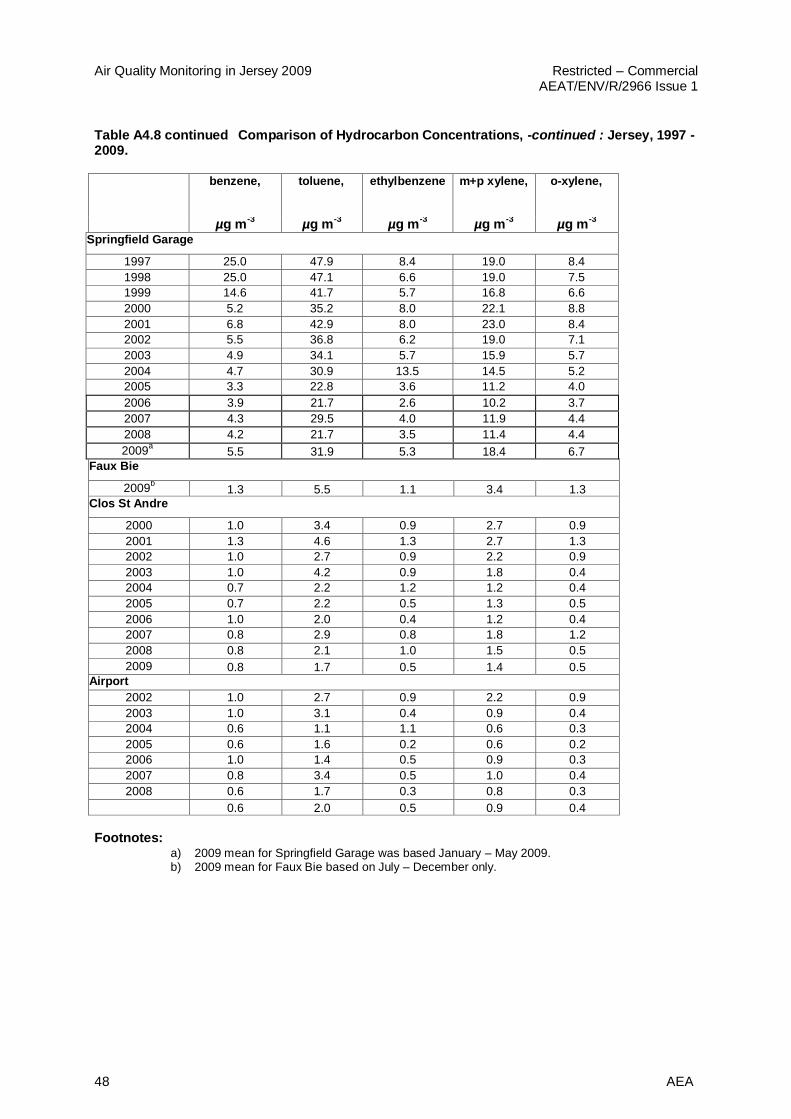
Air Quality Monitoring in Jersey 2009 Restricted – Commercial AEAT/ENV/R/2966 Issue 1
48 AEA
Table A4.8 continued Comparison of Hydrocarbon Concentrations, -continued : Jersey, 1997 - 2009.
benzene, toluene, ethylbenzene m+p xylene, o-xylene,
µg m-3
µg m-3
µg m-3
µg m-3
µg m-3
Springfield Garage
1997 25.0 47.9 8.4 19.0 8.4
1998 25.0 47.1 6.6 19.0 7.5
1999 14.6 41.7 5.7 16.8 6.6
2000 5.2 35.2 8.0 22.1 8.8
2001 6.8 42.9 8.0 23.0 8.4
2002 5.5 36.8 6.2 19.0 7.1
2003 4.9 34.1 5.7 15.9 5.7
2004 4.7 30.9 13.5 14.5 5.2
2005 3.3 22.8 3.6 11.2 4.0
2006 3.9 21.7 2.6 10.2 3.7
2007 4.3 29.5 4.0 11.9 4.4
2008 4.2 21.7 3.5 11.4 4.4
2009a 5.5 31.9 5.3 18.4 6.7
Faux Bie
2009b 1.3 5.5 1.1 3.4 1.3
Clos St Andre
2000 1.0 3.4 0.9 2.7 0.9
2001 1.3 4.6 1.3 2.7 1.3
2002 1.0 2.7 0.9 2.2 0.9
2003 1.0 4.2 0.9 1.8 0.4
2004 0.7 2.2 1.2 1.2 0.4
2005 0.7 2.2 0.5 1.3 0.5
2006 1.0 2.0 0.4 1.2 0.4
2007 0.8 2.9 0.8 1.8 1.2
2008 0.8 2.1 1.0 1.5 0.5
2009 0.8 1.7 0.5 1.4 0.5 Airport
2002 1.0 2.7 0.9 2.2 0.9
2003 1.0 3.1 0.4 0.9 0.4
2004 0.6 1.1 1.1 0.6 0.3
2005 0.6 1.6 0.2 0.6 0.2
2006 1.0 1.4 0.5 0.9 0.3
2007 0.8 3.4 0.5 1.0 0.4
2008 0.6 1.7 0.3 0.8 0.3
0.6 2.0 0.5 0.9 0.4
Footnotes:
a) 2009 mean for Springfield Garage was based January – May 2009. b) 2009 mean for Faux Bie based on July – December only.

Restricted – Commercial Air Quality Monitoring in Jersey 2009 AEAT/ENV/R/2966 Issue 1
AEA 49
AEA group 551.11 Harwell Business Centre Didcot Oxfordshire OX11 0QJ Tel: 0870 190 6518 Fax: 0870 190 6377