air quality in europe - 2012 report (eea report no … · air quality in europe — 2012 report ....
TRANSCRIPT
Air quality in Europe — 2012 report
EEA Report No 4/2012
ISSN 1725-9177

EEA Report No 4/2012
Air quality in Europe — 2012 report

Cover design: EEACover photo © flickr/glamismacLeft photo © flickr/ProblemkindRight photo © flickr/Tim FieldsLayout: EEA/Henriette Nilsson
European Environment AgencyKongens Nytorv 61050 Copenhagen KDenmarkTel.: +45 33 36 71 00Fax: +45 33 36 71 99Web: eea.europa.euEnquiries: eea.europa.eu/enquiries
Legal notice The contents of this publication do not necessarily reflect the official opinions of the European Commission or other institutions of the European Union. Neither the European Environment Agency nor any person or company acting on behalf of the Agency is responsible for the use that may be made of the information contained in this report.
All rights reserved No part of this publication may be reproduced in any form or by any means electronic or mechanical, including photocopying, recording or by any information storage retrieval system, without a prior permission in writing. For permission, translation or reproduction rights please contact EEA (address information below).
Information about the European Union is available on the Internet. It can be accessed through the Europa server (www.europa.eu).
Luxembourg: Office for Official Publications of the European Union, 2012
ISBN 978-92-9213-328-3ISSN 1725-9177doi:10.2800/55823
© EEA, Copenhagen, 2012
Environmental productionThis publication is printed according to high environmental standards.
Printed by Rosendahls-Schultz Grafisk— Environmental Management Certificate: DS/EN ISO 14001: 2004— Quality Certificate: DS/EN ISO 9001: 2008— EMAS Registration. Licence no. DK — 000235— Ecolabelling with the Nordic Swan, licence no. 541 176— FSC Certificate — licence code FSC C0688122
PaperRePrint — FSC Certified 90 gsm. CyclusOffset 250 gsm. Both paper qualities are recycled paper and have obtained the ecolabel Nordic Swan.
Printed in Denmark
REG.NO. DK-000244
3
Contents
Air quality in Europe — 2012 report
Contents
Acknowledgements .................................................................................................... 5
Executive summary .................................................................................................... 6
1 Introduction ........................................................................................................ 151.1 Report objectives and coverage .........................................................................151.2 Relevant policy instruments and legislation ..........................................................171.3 Air quality and climate change ..........................................................................18
2 Particulate matter (PM) ....................................................................................... 232.1 Sources and effects of PM .................................................................................232.2 European air quality standards for PM .................................................................242.3 Europe-wide survey of PM .................................................................................262.4 Exposure to PM pollution in Europe.....................................................................372.5 Responses ......................................................................................................37
3 Ozone (O3) ........................................................................................................... 403.1 Sources and effects of O3 ..................................................................................403.2 European air quality standards for O3 .................................................................413.3 Europe-wide survey of O3 ..................................................................................423.4 Exposure to O3 pollution in Europe .....................................................................483.5 Responses ......................................................................................................51
4 Nitrogen dioxide (NO2) ........................................................................................ 534.1 Sources and effects of NO2 ................................................................................534.2 European air quality standards for NO2 and NOX ...................................................534.3 Europe-wide survey of NO2 and NOX ...................................................................544.4 Exposure to NO2 pollution in Europe ...................................................................614.5 Responses ......................................................................................................62
5 Sulphur dioxide (SO2) .......................................................................................... 635.1 Sources and effects of SO2 ................................................................................635.2 European air quality standards for SO2 ................................................................635.3 Europe-wide survey of SO2 ................................................................................645.4 Exposure to SO2 pollution in Europe ....................................................................675.5 Responses ......................................................................................................68
Contents
4 Air quality in Europe — 2012 report
6 Carbon monoxide (CO) ........................................................................................ 696.1 Sources and effects of CO .................................................................................696.2 European air quality standards for CO .................................................................696.3 Europe-wide survey of CO ................................................................................696.4 Exposure to CO pollution in Europe ....................................................................746.5 Responses ......................................................................................................74
7 Heavy metals ....................................................................................................... 757.1 Sources and effects of heavy metals ...................................................................757.2 European air quality standards for heavy metals ..................................................777.3 Europe-wide survey of heavy metals ..................................................................777.4 Trends in concentrations and emissions of heavy metals........................................787.5 Exposure to heavy metal pollution in Europe .......................................................827.6 Responses ......................................................................................................82
8 Benzene (C6H6) and benzo(a)pyrene (BaP) ................................................................838.1 Sources and effects ..........................................................................................838.2 European air quality standards for C6H6 and BaP ..................................................838.3 Europe-wide survey of C6H6 and BaP ..................................................................848.4 Exposure to C6H6 and BaP pollution in Europe ......................................................898.5 Responses ......................................................................................................89
References ............................................................................................................... 90
Annex 1 AirBase ...................................................................................................... 94
Annex 2 European policies and measures on air pollutant emissions .................... 100

5
Acknowledgements
Air quality in Europe — 2012 report
Acknowledgements
This report was prepared by the European Environment Agency's Topic Centre for Air and Climate Change Mitigation (ETC/ACM). The coordinator of input from the ETC/ACM was Cristina Guerreiro of the Norwegian Institute for Air Research (NILU).
The authors of the report were Cristina Guerreiro (NILU, Norway), Frank de Leeuw (RIVM, the Netherlands) and Valentin Foltescu, Johannes Schilling, John van Aardenne, Anke Lükewille and Martin Adams (EEA). The ETC/ACM reviewer was Xavier Querol (CSIC, Spain). The EEA reviewers were Aphrodite Mourelatou and Paul McAleavey.
Thanks are due to Jean-Paul Hettelingh, Coordination Centre for Effects (CCE at RIVM, the Netherlands), for providing the EEA with the background data for the critical load information presented in this report, and to the European Monitoring and Evaluation Programme (EMEP).
The EEA project manager was Valentin Foltescu. EEA acknowledges comments received on the draft report from the national reference centres of EEA member countries and the European Commission. These comments have been included in the final version of the report as far as possible.
6
Executive summary
Air quality in Europe — 2012 report
Executive summary
'Air pollution is bad for our health. It reduces human life expectancy by more than eight months on average and by more than two years in the most polluted cities and regions. Member States must comply with EU air quality standards quickly and reduce air pollutant emissions,' Janez Potočnik, EU Commissioner for the Environment (EU, 2010a).
Emissions of air pollutants derive from almost all economic and societal activities. In Europe, emissions of many air pollutants have decreased. Much progress has been made in tackling air pollutants such as sulphur dioxide (SO2), carbon monoxide (CO) and benzene (C6H6) while other pollutants still present a serious threat to the health of Europeans and their environment.
Indeed air pollutant concentrations are still too high and harm our health and the ecosystems we depend on. A significant proportion of Europe's population lives in areas, especially cities, where exceedances of air quality standards occur. Particulate matter (PM) and ozone (O3) pollution are particularly associated with serious health risks.
Air pollutants released in one European country may contribute to or result in poor air quality elsewhere. Moreover, important contributions from intercontinental transport influence the O3 and PM concentrations in Europe.
Greater international cooperation, also focusing on links between climate and air pollution policies, is required more than ever to address air pollution. Reducing air pollution and improving air quality therefore remains a key priority.
Purpose and scope of this report
This report presents an overview and analysis of the status and trends of air quality in Europe based on concentration measurements in ambient air and data on anthropogenic emissions and trends from 2001 — when mandatory monitoring of ambient air concentrations of selected pollutants first produced reliable air quality information — to 2010.
This report has been published annually since 2011 and updates regularly the information given in the five yearly report 'the European environment — state and outlook' (SOER) of the European Environment Agency. The analysis covers up to 38 European countries (1), including the EU Member States and the EEA-32 member countries.
According to Directive 2008/50/EC on Ambient Air Quality and Cleaner Air for Europe, the Commission shall review in 2013 the provisions related to certain pollutants. This report aims to inform this review and the review of the European Commission's Thematic Strategy on Air Pollution.
Air pollution in Europe is a local, regional and transboundary problem caused by the emission of specific pollutants, which either directly or through chemical reactions lead to negative impacts. Each pollutant produces a range of effects from mild to severe as concentration or exposure increases. The main effects of air pollution are (see also Table 1.1):
• Damage to human health caused by exposure to air pollutants or intake of pollutants transported through the air, deposited and accumulated in the food chain;
(1) The EEA-38 countries are the EEA-32 member countries (the EU Member States Austria, Belgium, Bulgaria, Cyprus, the Czech Republic, Denmark, Estonia, Finland, France, Germany, Greece, Hungary, Ireland, Italy, Latvia, Lithuania, Luxembourg, Malta, the Netherlands, Poland, Portugal, Romania, Slovakia, Slovenia, Spain, Sweden and the United Kingdom, and the remaining five EEA member countries Iceland, Liechtenstein, Norway, Switzerland and Turkey), as well as six EEA cooperating countries (Albania, Bosnia and Herzegovina, Croatia, the former Yugoslav Republic of Macedonia, Montenegro, and Serbia).

Executive summary
7Air quality in Europe — 2012 report
• Acidification of ecosystems, both terrestrial and aquatic, which leads to loss of flora and fauna;
• Eutrophication in ecosystems on land and in water, which can lead to changes in species diversity;
• Damage and yield losses affecting agricultural crops, forests and other plants due to exposure to ground-level O3;
• Impacts of heavy metals and persistent organic pollutants on ecosystems, due to their environmental toxicity and due to bioaccumulation;
• Contribution to climate forcing;
• Reduction of atmospheric visibility;
• Damage to materials and cultural heritage due to soiling and exposure to acidifying pollutants and O3.
Existing air quality legislation made simple
The Air Quality Directive 2008/50/EC, which replaced nearly all the previous EU air quality legislation — complemented by Directive 2004/107/EC — set legally binding limits for ground-level concentrations of outdoor air pollutants such as PM and nitrogen dioxide (NO2).
Key elements of EU air quality legislation are:
• EU limit values are legally binding concentration thresholds that must not be exceeded. Limit values are set for individual pollutants and are made up of a concentration value. Limit values are accompanied by an averaging period, the number of exceedences allowed per year, if any, as well as a date by which the obligation should be met. Some pollutants have more than one limit value covering different endpoints or averaging times. Limit values are legally binding on EU Member States.
• EU target values — are to be attained where possible by taking all necessary measures not entailing disproportionate costs. Target values are not legally binding.
This report also refers to World Health Organization (WHO) air quality guidelines (AQG), which are often more stringent than current EU target and limit values.
The most problematic pollutants
At present, PM and O3 are Europe's most problematic pollutants in terms of harm to human health. Domestic emissions are the most important contributors to O3 and PM concentrations levels over Europe, but intercontinental transport of pollution also contributes to increased impacts on health, ecosystems and our economy (particularly crop productivity). Further studies are needed to attribute European air quality exceedance to non-European emissions of air pollutants.
Impacts on population
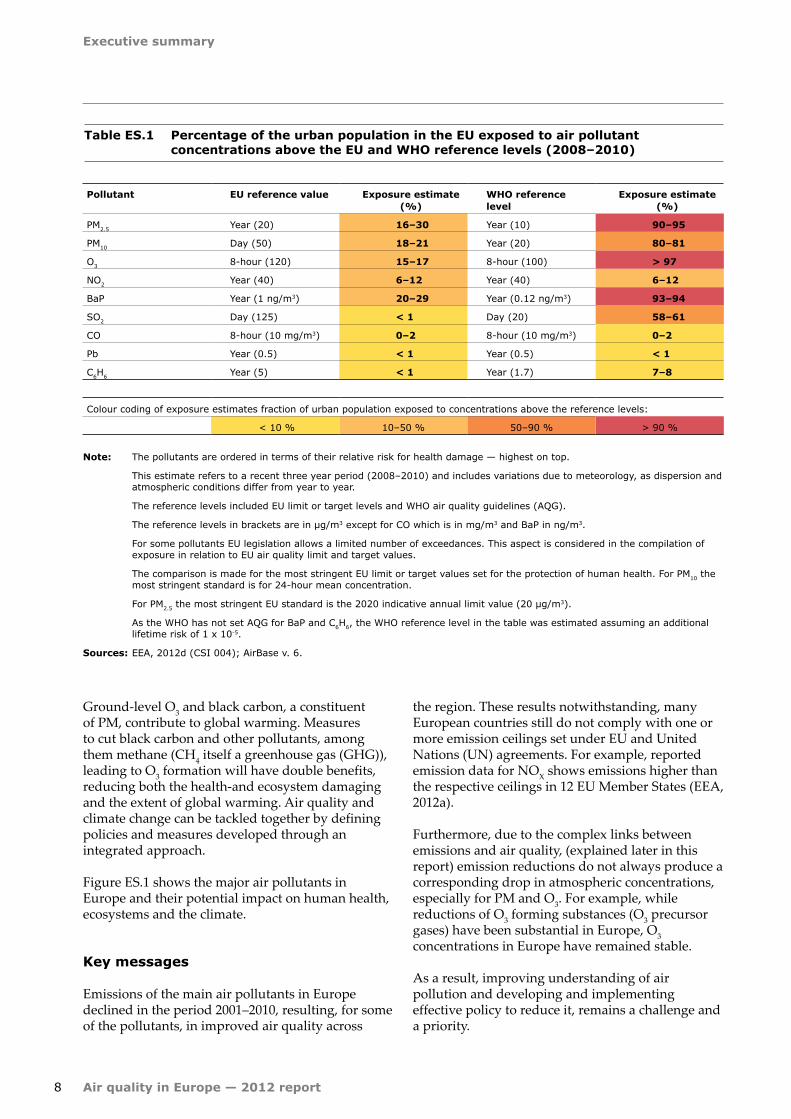
Table ES.1 gives an overview (2) of the proportion of the EU urban population exposed to pollutant concentration levels above the limit and target values set in the EU legislation and the air quality guidelines WHO AQG in recent years (2008–2010).
Current pollution levels, especially of PM and O3, clearly impact on large numbers of the urban population. This is particularly evident in the population exposure estimates based on the WHO AQG.
Impacts on European ecosystems
Air pollution's most important effects on European ecosystems are eutrophication, acidification and damage to vegetation resulting from exposure to O3. As SO2 emissions have fallen, ammonia (NH3) emitted from agricultural activities and nitrogen oxides (NOX) emitted from combustion processes have become the predominant acidifying and eutrophying air pollutants.
Impacts on climate
Several air pollutants are also climate forcers, having a potential impact on the planet's climate and global warming in the short term (decades).
(2) This estimate refers to a recent three-year period (2008–2010) and includes variations due to meteorology, as dispersion and atmospheric conditions differ from year to year.
Executive summary
8 Air quality in Europe — 2012 report
Table ES.1 Percentage of the urban population in the EU exposed to air pollutant concentrations above the EU and WHO reference levels (2008–2010)
Pollutant EU reference value Exposure estimate (%)
WHO reference level
Exposure estimate (%)
PM2.5 Year (20) 16–30 Year (10) 90–95
PM10 Day (50) 18–21 Year (20) 80–81
O3 8-hour (120) 15–17 8-hour (100) > 97
NO2 Year (40) 6–12 Year (40) 6–12
BaP Year (1 ng/m3) 20–29 Year (0.12 ng/m3) 93–94
SO2 Day (125) < 1 Day (20) 58–61
CO 8-hour (10 mg/m3) 0–2 8-hour (10 mg/m3) 0–2
Pb Year (0.5) < 1 Year (0.5) < 1
C6H6 Year (5) < 1 Year (1.7) 7–8
Colour coding of exposure estimates fraction of urban population exposed to concentrations above the reference levels:
< 10 % 10–50 % 50–90 % > 90 %
Note: The pollutants are ordered in terms of their relative risk for health damage — highest on top.
This estimate refers to a recent three year period (2008–2010) and includes variations due to meteorology, as dispersion and atmospheric conditions differ from year to year.
The reference levels included EU limit or target levels and WHO air quality guidelines (AQG).
The reference levels in brackets are in μg/m3 except for CO which is in mg/m3 and BaP in ng/m3.
For some pollutants EU legislation allows a limited number of exceedances. This aspect is considered in the compilation of exposure in relation to EU air quality limit and target values.
The comparison is made for the most stringent EU limit or target values set for the protection of human health. For PM10 the most stringent standard is for 24-hour mean concentration.
For PM2.5 the most stringent EU standard is the 2020 indicative annual limit value (20 μg/m3).
As the WHO has not set AQG for BaP and C6H6, the WHO reference level in the table was estimated assuming an additional lifetime risk of 1 x 10⁻⁵.
Sources: EEA, 2012d (CSI 004); AirBase v. 6.
Ground-level O3 and black carbon, a constituent of PM, contribute to global warming. Measures to cut black carbon and other pollutants, among them methane (CH4 itself a greenhouse gas (GHG)), leading to O3 formation will have double benefits, reducing both the health-and ecosystem damaging and the extent of global warming. Air quality and climate change can be tackled together by defining policies and measures developed through an integrated approach.
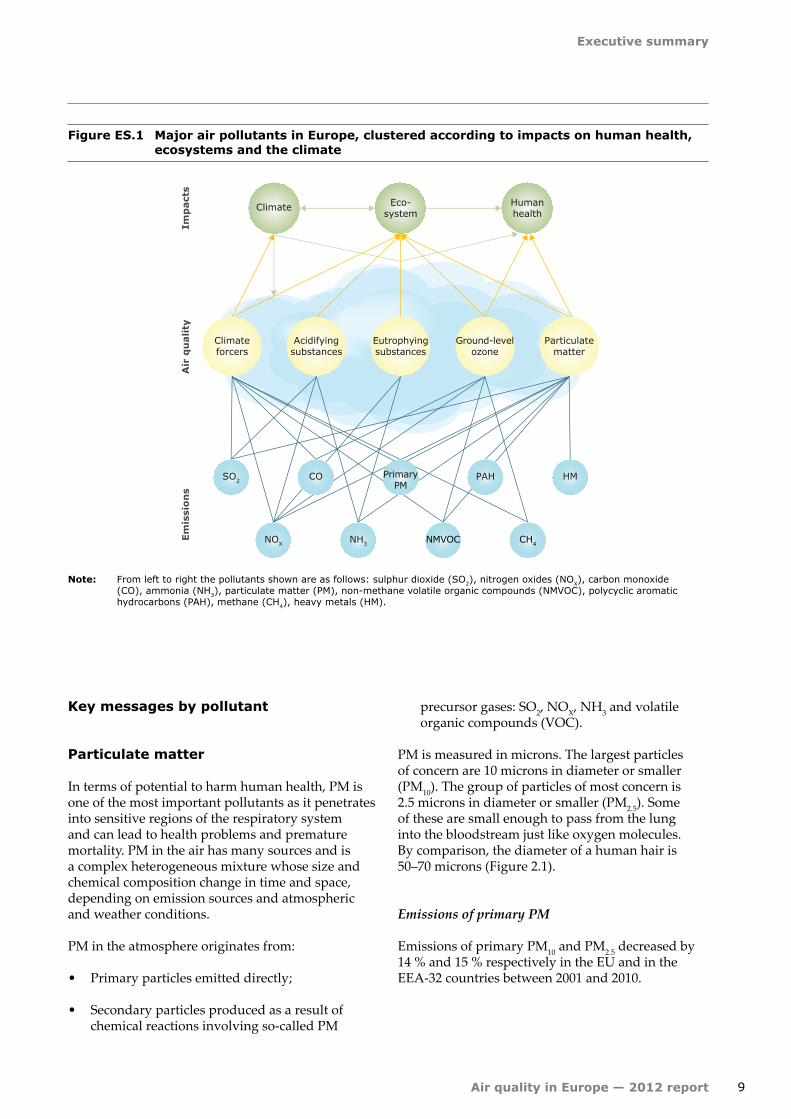
Figure ES.1 shows the major air pollutants in Europe and their potential impact on human health, ecosystems and the climate.
Key messages
Emissions of the main air pollutants in Europe declined in the period 2001–2010, resulting, for some of the pollutants, in improved air quality across
the region. These results notwithstanding, many European countries still do not comply with one or more emission ceilings set under EU and United Nations (UN) agreements. For example, reported emission data for NOX shows emissions higher than the respective ceilings in 12 EU Member States (EEA, 2012a).
Furthermore, due to the complex links between emissions and air quality, (explained later in this report) emission reductions do not always produce a corresponding drop in atmospheric concentrations, especially for PM and O3. For example, while reductions of O3 forming substances (O3 precursor gases) have been substantial in Europe, O3 concentrations in Europe have remained stable.
As a result, improving understanding of air pollution and developing and implementing effective policy to reduce it, remains a challenge and a priority.
Executive summary
9Air quality in Europe — 2012 report
Climateforcers
Eco-system
Climate Humanhealth
NOX NH3 CH4NMVOC
SO2 PAHCO HMPrimaryPM
Air
qu
ality
Imp
act
sEm
issi
on
s
Acidifyingsubstances
Eutrophyingsubstances
Ground-levelozone
Particulatematter
Figure ES.1 Major air pollutants in Europe, clustered according to impacts on human health, ecosystems and the climate
Note: From left to right the pollutants shown are as follows: sulphur dioxide (SO2), nitrogen oxides (NOX), carbon monoxide (CO), ammonia (NH3), particulate matter (PM), non-methane volatile organic compounds (NMVOC), polycyclic aromatic hydrocarbons (PAH), methane (CH4), heavy metals (HM).
Key messages by pollutant
Particulate matter
In terms of potential to harm human health, PM is one of the most important pollutants as it penetrates into sensitive regions of the respiratory system and can lead to health problems and premature mortality. PM in the air has many sources and is a complex heterogeneous mixture whose size and chemical composition change in time and space, depending on emission sources and atmospheric and weather conditions.
PM in the atmosphere originates from:
• Primary particles emitted directly;
• Secondary particles produced as a result of chemical reactions involving so-called PM
precursor gases: SO2, NOX, NH3 and volatile organic compounds (VOC).
PM is measured in microns. The largest particles of concern are 10 microns in diameter or smaller (PM10). The group of particles of most concern is 2.5 microns in diameter or smaller (PM2.5). Some of these are small enough to pass from the lung into the bloodstream just like oxygen molecules. By comparison, the diameter of a human hair is 50–70 microns (Figure 2.1).
Emissions of primary PM
Emissions of primary PM10 and PM2.5 decreased by 14 % and 15 % respectively in the EU and in the EEA-32 countries between 2001 and 2010.
Executive summary
10 Air quality in Europe — 2012 report
Emissions of PM precursor gases
PM precursor emissions, except those of NH3, decreased considerably between 2001 and 2010.
In the EU:
• Sulphur oxides (SOX) emissions fell by 54 %; • NOX emissions fell by 26 %; • NH3 emissions fell by 10 %.
In the EEA-32 countries:
• SOX emissions fell by 44 %;• NOX emissions fell by 23 %;• NH3 emissions fell by 8 % (2001–2009).
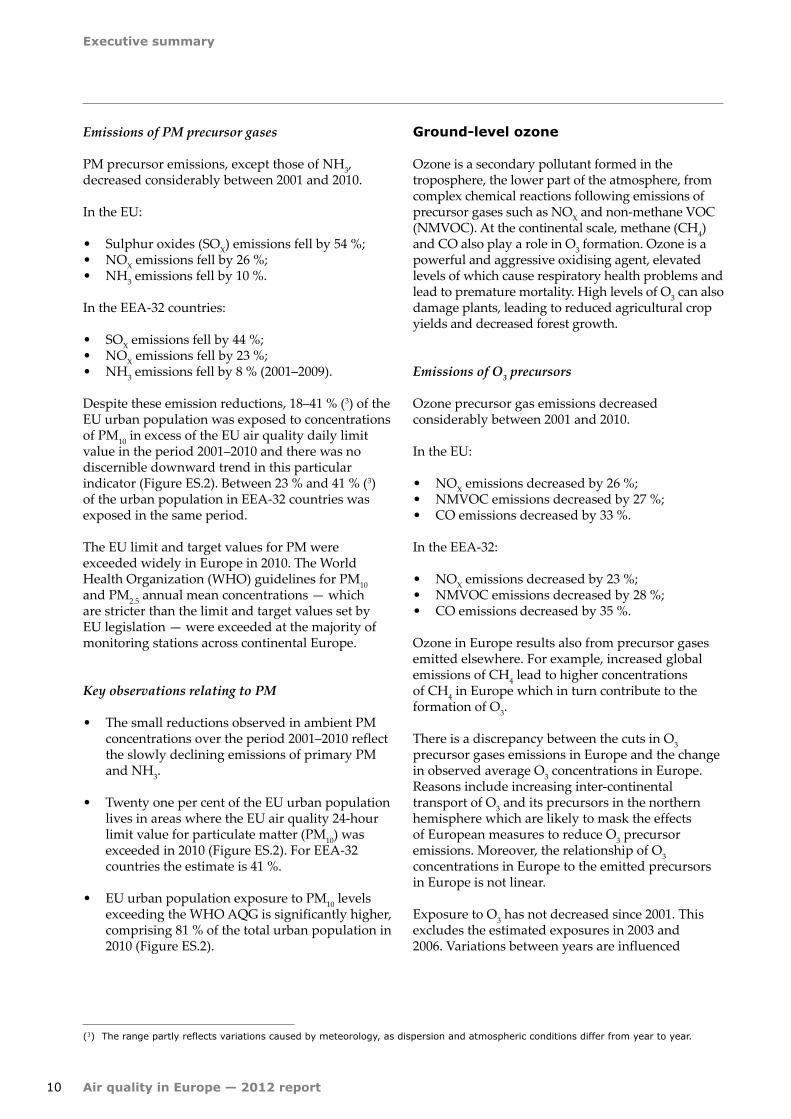
Despite these emission reductions, 18–41 % (3) of the EU urban population was exposed to concentrations of PM10 in excess of the EU air quality daily limit value in the period 2001–2010 and there was no discernible downward trend in this particular indicator (Figure ES.2). Between 23 % and 41 % (3) of the urban population in EEA-32 countries was exposed in the same period.
The EU limit and target values for PM were exceeded widely in Europe in 2010. The World Health Organization (WHO) guidelines for PM10 and PM2.5 annual mean concentrations — which are stricter than the limit and target values set by EU legislation — were exceeded at the majority of monitoring stations across continental Europe.
Key observations relating to PM
• The small reductions observed in ambient PM concentrations over the period 2001–2010 reflect the slowly declining emissions of primary PM and NH3.
• Twenty one per cent of the EU urban population lives in areas where the EU air quality 24-hour limit value for particulate matter (PM10) was exceeded in 2010 (Figure ES.2). For EEA-32 countries the estimate is 41 %.
• EU urban population exposure to PM10 levels exceeding the WHO AQG is significantly higher, comprising 81 % of the total urban population in 2010 (Figure ES.2).
Ground-level ozone
Ozone is a secondary pollutant formed in the troposphere, the lower part of the atmosphere, from complex chemical reactions following emissions of precursor gases such as NOX and non-methane VOC (NMVOC). At the continental scale, methane (CH4) and CO also play a role in O3 formation. Ozone is a powerful and aggressive oxidising agent, elevated levels of which cause respiratory health problems and lead to premature mortality. High levels of O3 can also damage plants, leading to reduced agricultural crop yields and decreased forest growth.
Emissions of O3 precursors
Ozone precursor gas emissions decreased considerably between 2001 and 2010.
In the EU:
• NOX emissions decreased by 26 %; • NMVOC emissions decreased by 27 %; • CO emissions decreased by 33 %.
In the EEA-32:
• NOX emissions decreased by 23 %;• NMVOC emissions decreased by 28 %; • CO emissions decreased by 35 %.
Ozone in Europe results also from precursor gases emitted elsewhere. For example, increased global emissions of CH4 lead to higher concentrations of CH4 in Europe which in turn contribute to the formation of O3.
There is a discrepancy between the cuts in O3 precursor gases emissions in Europe and the change in observed average O3 concentrations in Europe. Reasons include increasing inter-continental transport of O3 and its precursors in the northern hemisphere which are likely to mask the effects of European measures to reduce O3 precursor emissions. Moreover, the relationship of O3 concentrations in Europe to the emitted precursors in Europe is not linear.
Exposure to O3 has not decreased since 2001. This excludes the estimated exposures in 2003 and 2006. Variations between years are influenced
(3) The range partly reflects variations caused by meteorology, as dispersion and atmospheric conditions differ from year to year.
Executive summary
11Air quality in Europe — 2012 report
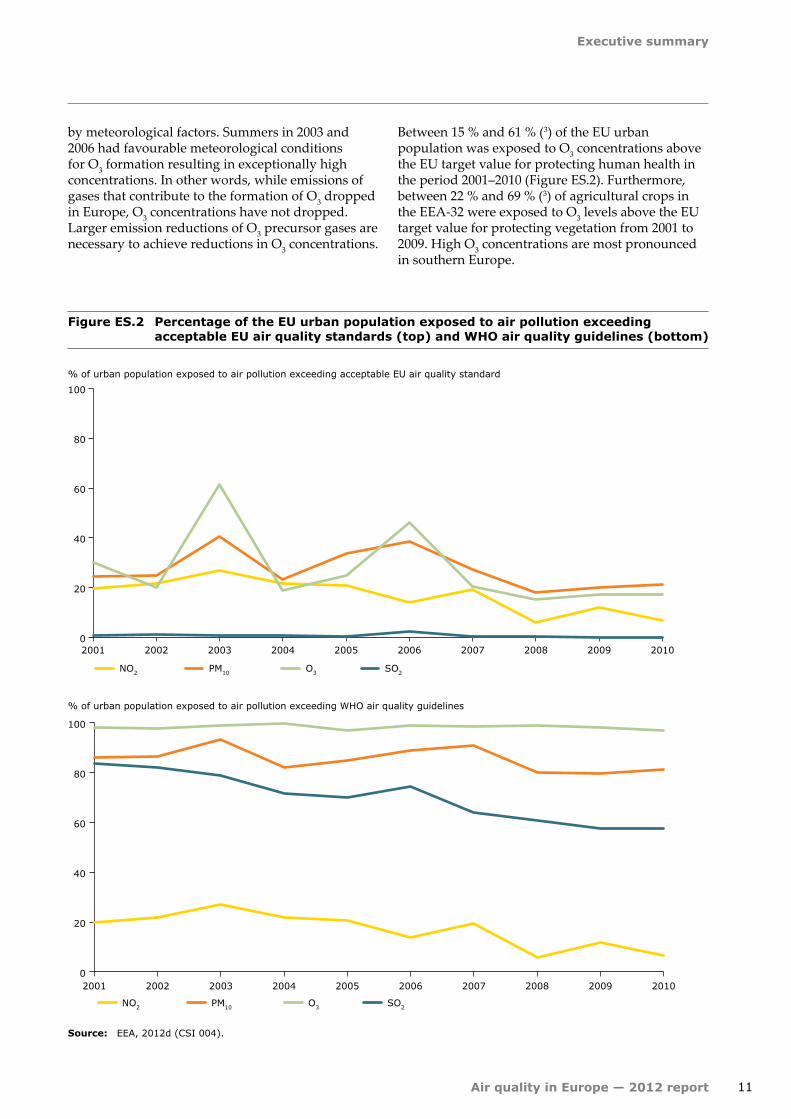
Figure ES.2 Percentage of the EU urban population exposed to air pollution exceeding acceptable EU air quality standards (top) and WHO air quality guidelines (bottom)
Source: EEA, 2012d (CSI 004).
0
20
40
60
80
100
2001 2002 2003 2004 2005 2006 2007 2008 2009 2010
% of urban population exposed to air pollution exceeding acceptable EU air quality standard
NO2 PM10 O3 SO2
0
20
40
60
80
100
2001 2002 2003 2004 2005 2006 2007 2008 2009 2010
% of urban population exposed to air pollution exceeding WHO air quality guidelines
NO2 PM10 O3 SO2
by meteorological factors. Summers in 2003 and 2006 had favourable meteorological conditions for O3 formation resulting in exceptionally high concentrations. In other words, while emissions of gases that contribute to the formation of O3 dropped in Europe, O3 concentrations have not dropped. Larger emission reductions of O3 precursor gases are necessary to achieve reductions in O3 concentrations.
Between 15 % and 61 % (3) of the EU urban population was exposed to O3 concentrations above the EU target value for protecting human health in the period 2001–2010 (Figure ES.2). Furthermore, between 22 % and 69 % (3) of agricultural crops in the EEA-32 were exposed to O3 levels above the EU target value for protecting vegetation from 2001 to 2009. High O3 concentrations are most pronounced in southern Europe.
Executive summary
12 Air quality in Europe — 2012 report
Key observations relating to O3
• At aggregated EU level there is no clear trend for O3 concentrations between 2001 and 2010, neither in the annual average nor in the indicator related to the target value set by legislation. Therefore, it can be concluded that concentrations in the period 2001–2010 do not reflect the European reductions in emissions of O3 precursors in the same period.
• Seventeen per cent of the EU urban population lives in areas where the EU O3 target value for protecting human health was exceeded in 2010 (Figure ES.2).
• The EU urban population exposed to O3 levels exceeding the WHO AQG — which are stricter than EU target value, is significantly higher, comprising more than 97 % of the total urban population (Table ES.1, Figure ES.2).
• Europe's sustained ambient O3 concentrations continue to cause considerable damage to vegetation growth and crop yields resulting in serious costs to Europe's economy.
Nitrogen oxides
Nitrogen oxides are emitted during fuel combustion, such as by road transport and industrial facilities. Of the chemical species that comprise NOX it is NO2 that is associated with adverse effects on health, as high concentrations cause inflammation of the airways and reduced lung function. NOX also contributes to the formation of secondary inorganic PM and O3 with associated effects on health and ecosystems.
Nitrogen (N) reactive compounds, emitted as NOX and NH3, are now the principal acidifying components in our air and cause eutrophication of ecosystems. The sensitive ecosystem area in Europe affected by eutrophication due to excessive atmospheric N has only diminished slightly over the last two decades. On the other hand, the area of sensitive ecosystems affected by excessive acidification from air pollution has fallen considerably in the past two decades (mainly due to the strong reduction in SO2 emissions and partly due to reduction in NOX emissions).
NOX and NH3 emissions continue to cause significant ecosystem impacts in Europe. Estimates calculated for 2010 show that 69 % of the total sensitive ecosystem area in the EU was at risk of eutrophication and 11 % was at risk of acidification (Hettelingh et al., 2008).
Key observations relating to NO2
• Some cities in Europe show an increase in concentrations of NO2 measured close to traffic. This reflects the increasing numbers of newer diesel vehicles. Exhaust emissions from such vehicles are lower for CO, NMVOC and PM but may be higher for NO2.
• The decrease in NOX transport emissions (27 % between 2001 and 2010 in the EU) is considerably greater than the fall in NO2 annual mean concentrations (ca. 8 % measured at stations close to traffic, between 2001 and 2010). This is attributed primarily to the increase in NO2 emitted directly into the air from diesel vehicles.
• Seven per cent of the EU urban population lives in areas where the annual EU limit value and the WHO AQG for NO2 were exceeded in 2010 (Figure ES.2).
Sulphur dioxide
Sulphur dioxide is emitted when fuels containing sulphur are burned. It contributes to acidification, the impacts of which can be significant, including adverse effects on aquatic ecosystems in rivers and lakes, and damage to forests. Sulphur dioxide can affect the respiratory system and reduce lung function. It is also a major precursor to PM which is associated with significant health effects.
Key observations relating to SO2
• SO2 concentrations were halved in the EU, as EU Member States cut their SOX emissions by 54 % in the period 2001–2010. The corresponding emission reduction in the EEA-32 countries was 44 %.
Executive summary
13Air quality in Europe — 2012 report
• Large sensitive ecosystem areas of Europe are no longer exposed to acidification, due mainly to reductions in sulphur emissions.
• 2010 is the first year for which the EU urban population has not been exposed to SO2 concentrations above the EU 24-hour limit value (Figure ES.2). In the EEA-32 countries 1.6 % of the urban population has been exposed to SO2 concentrations above the EU 24-hour limit value in 2010.
• The EU urban population exposed to SO2 levels exceeding the WHO AQG is significantly higher, amounting to 58–61 % of the total urban population between 2008 and 2010 (Table ES.1).
Carbon monoxide
Carbon monoxide is emitted due to incomplete combustion of fossil fuels and biofuels and enters the body through the lungs. Exposure to CO can reduce blood's oxygen-carrying capacity, thereby reducing oxygen delivery to the body's organs and tissues.
The atmospheric lifetime of CO is about three months. The relatively long lifetime allows CO to slowly oxidise into carbon dioxide (CO2), also forming O3 during this process. CO therefore contributes to the atmospheric background concentration of O3, with associated effects on health and ecosystems.
Key observations relating to CO
• The observed reduction in CO concentrations in the EU since 2001 reflect declining CO emissions of 33 % in the EU over the last decade.
• Exposure of the European population to CO concentrations above the EU limit value and WHO AQG is very localised and sporadic (Table ES.1).
Heavy metals
The heavy metals — arsenic (As), cadmium (Cd), lead (Pb), mercury (Hg) and nickel (Ni) — are emitted mainly as a result of various combustion processes and industrial activities. Heavy metals can reside in or be attached to PM. As well as polluting the air, heavy metals can be deposited on terrestrial or water surfaces and subsequently build-up in soils or sediments. Heavy metals are persistent in the environment and may bio-accumulate in food-chains.
Emissions of heavy metals
In the period 2001–2010 emissions of heavy metals in the EU were reduced as follows:
• As reduced by 4 %;• Cd by 30 %;• Hg by 30 %; • Ni by 41 %; • Pb by 36 %.
Key observations relating to heavy metals
• The concentrations of As, Cd, Pb and Ni in air are generally low in Europe with few exceedances of limit or target values. However, these pollutants contribute to the deposition and build-up of heavy metal levels in soils, sediments and organisms.
• Despite cuts in estimated emissions of heavy metals since 2001 in the EU a significant share of the EU ecosystem area was still at risk of heavy metal contamination. Exceedances of Hg critical loads (4) were estimated to occur at 54 % of the sensitive ecosystem area in the EU in 2010, while for Pb the estimated area in exceedance is 12 % (Slootweg et al., 2010).
• A relatively small number of stations measure concentrations in air of As, Cd, Pb and Ni in Europe, since levels are often below the lower assessment threshold set by EU legislation. An even smaller number have been operating for five or more years. In the case of Hg, only a few stations report concentrations in air of different forms of Hg, making an analysis at the European level very difficult.
(4) The general definition of a critical load is 'a quantitative estimate of an exposure to pollutants below which significant harmful effects on specified sensitive elements of the environment do not occur according to present knowledge' (UNECE, 2004).
Executive summary
14 Air quality in Europe — 2012 report
Benzene and benzo(a)pyrene
Benzene is released during incomplete combustion of fuels used by vehicles. Other sources are domestic heating, oil refining and petrol handling, distribution and storage. Inhalation is the dominant pathway for C6H6 exposure in humans. Benzene is a carcinogenic pollutant. The most significant adverse effects from prolonged exposure are damages to a cells' genetic material which can cause cancer.
Benzo(a)pyrene (BaP) is a polycyclic aromatic hydrocarbon (PAH), formed mainly from the burning of organic material such as wood, and from car exhaust fumes especially from diesel vehicles. It is a known cancer-causing agent and for this reason it is being used as an indicator of exposure to harmful PAH.
Emissions of C6H6 and BaP
• Benzene is not included as an individual pollutant in European emissions inventories covering VOC. However, the average C6H6 concentration in 2010 measured at traffic stations
in the EU has declined to less than half since 2001, indicating significant emission reductions.
• Emissions of BaP in the EU have increased by 14 % between 2001 and 2010. In Europe, BaP pollution is a problem in areas where domestic coal and wood burning is common.
Key observations relating to C6H6 and BaP
• Exceedances of the limit value for C6H6 were limited to a few locations in Europe, primarily situated close to industrial sources in 2010.
• Exposure of the European population to BaP concentrations above the target value is significant and widespread in central and eastern Europe. Between 20 % and 29 % of the urban population in the EU was exposed to BaP concentrations above the target value (1 ng/m3 to be met by 2013) in the period 2008 to 2010. The increase in BaP emissions in Europe over the last years is therefore a matter of concern, as it is aggravating the exposure of the European population to BaP concentrations.

15
Introduction
Air quality in Europe — 2012 report
1 Introduction
1.1 Report objectives and coverage
Background
Humans and the environment in Europe are exposed to a complex mixture of many air pollutants emitted from various sources and subject to atmospheric processes which can create new pollutants. Many of these pollutants can cause severe health problems and impact on ecosystems.
Despite successful legislation and some success in dealing with emissions to air, European populations are still breathing air containing dangerous substances. Understanding the 'state' of and key trends influencing air quality in Europe is a critical first step in dealing with the issue.
This is the background to Air quality in Europe — 2012, a European Environment Agency report, the second in a series of annual reports aiming to update information given in the five-yearly report 'The European environment — state and outlook' (SOER) of the European Environment Agency. The report is produced in support of European and national policy development and implementation in the field of air quality. It also supports air quality management and informs the general public on the current status and trends of air quality in Europe.
Objectives and coverage
This report presents an overview and analysis of air quality in Europe from 2001 — when mandatory monitoring of ambient air concentrations of selected pollutants first produced reliable air quality information — to 2010. The evaluation of the status and trends of air quality is based on ambient air measurements, in conjunction with anthropogenic emissions and their trends. An overview of policies and measures at European level is also given for each pollutant.
The links between emissions and ambient concentrations can only become evident and fully
understood by means of air quality modelling. This report does not include analysis of reported modelled data, owing to the scarcity of such data officially made available by European countries through the current reporting and data exchange mechanism. Modelling studies reported elsewhere in the literature are presented, where relevant, to strengthen the analysis.
This report reviews progress towards meeting the requirements of the two air quality directives in force (EU, 2004b; EU, 2008c) and describes the policies and measures introduced at European level to improve air quality and minimise air pollution impacts on public health and ecosystems.
The report analyses each regulated pollutant in turn, following the single-pollutant approach currently adopted by EU air quality legislation and the World Health Organization (WHO) in its air quality guidelines. In reality, air pollution constitutes a complex mixture of pollutants which may interact in terms of their impacts on human health and vegetation. Therefore, exposure to air pollution is largely a multi-pollutant process.
Over the last decade European emission mitigation policies have followed a multi-pollutant approach and will continue to do so. The scientific air quality community still focuses on individual pollutants, although we are exposed to a complex mixture of pollutants. The move towards a multi-pollutant approach is described by this community as challenging. Additional research is needed to understand and quantify the possible additive, synergetic or antagonistic effects between pollutants which are encountered simultaneously in the ambient air.
New exposure-response functions for pollutant combinations are thus required to help us characterize more fully the complexity of the exposure and its impacts. That will be the first step towards resolving the relative impacts of air pollutants and achieving a holistic multi-pollutant approach to air quality decisions.
Introduction
16 Air quality in Europe — 2012 report
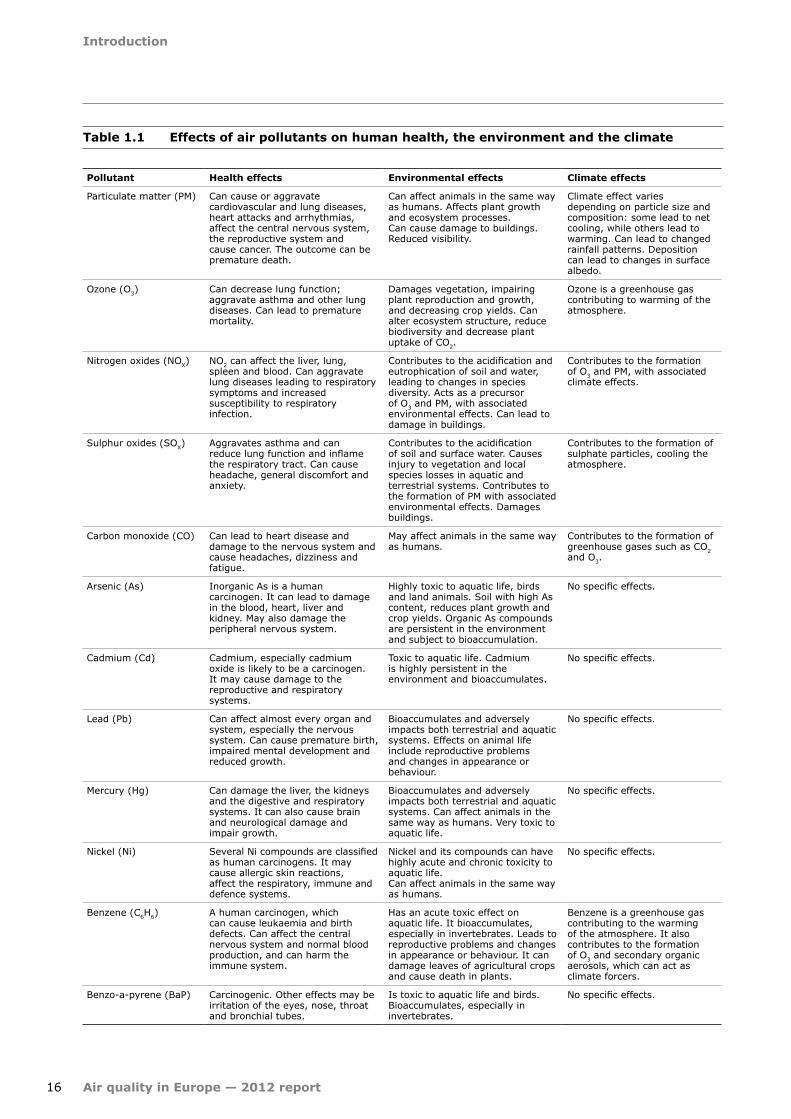
Table 1.1 Effects of air pollutants on human health, the environment and the climate
Pollutant Health effects Environmental effects Climate effects
Particulate matter (PM) Can cause or aggravate cardiovascular and lung diseases, heart attacks and arrhythmias, affect the central nervous system, the reproductive system and cause cancer. The outcome can be premature death.
Can affect animals in the same way as humans. Affects plant growth and ecosystem processes. Can cause damage to buildings.Reduced visibility.
Climate effect varies depending on particle size and composition: some lead to net cooling, while others lead to warming. Can lead to changed rainfall patterns. Deposition can lead to changes in surface albedo.
Ozone (O3) Can decrease lung function; aggravate asthma and other lung diseases. Can lead to premature mortality.
Damages vegetation, impairing plant reproduction and growth, and decreasing crop yields. Can alter ecosystem structure, reduce biodiversity and decrease plant uptake of CO2.
Ozone is a greenhouse gas contributing to warming of the atmosphere.
Nitrogen oxides (NOX) NO2 can affect the liver, lung, spleen and blood. Can aggravate lung diseases leading to respiratory symptoms and increased susceptibility to respiratory infection.
Contributes to the acidification and eutrophication of soil and water, leading to changes in species diversity. Acts as a precursor of O3 and PM, with associated environmental effects. Can lead to damage in buildings.
Contributes to the formation of O3 and PM, with associated climate effects.
Sulphur oxides (SOX) Aggravates asthma and can reduce lung function and inflame the respiratory tract. Can cause headache, general discomfort and anxiety.
Contributes to the acidification of soil and surface water. Causes injury to vegetation and local species losses in aquatic and terrestrial systems. Contributes to the formation of PM with associated environmental effects. Damages buildings.
Contributes to the formation of sulphate particles, cooling the atmosphere.
Carbon monoxide (CO) Can lead to heart disease and damage to the nervous system and cause headaches, dizziness and fatigue.
May affect animals in the same way as humans.
Contributes to the formation of greenhouse gases such as CO2 and O3.
Arsenic (As) Inorganic As is a human carcinogen. It can lead to damage in the blood, heart, liver and kidney. May also damage the peripheral nervous system.
Highly toxic to aquatic life, birds and land animals. Soil with high As content, reduces plant growth and crop yields. Organic As compounds are persistent in the environment and subject to bioaccumulation.
No specific effects.
Cadmium (Cd) Cadmium, especially cadmium oxide is likely to be a carcinogen. It may cause damage to the reproductive and respiratory systems.
Toxic to aquatic life. Cadmium is highly persistent in the environment and bioaccumulates.
No specific effects.
Lead (Pb) Can affect almost every organ and system, especially the nervous system. Can cause premature birth, impaired mental development and reduced growth.
Bioaccumulates and adversely impacts both terrestrial and aquatic systems. Effects on animal life include reproductive problems and changes in appearance or behaviour.
No specific effects.
Mercury (Hg) Can damage the liver, the kidneys and the digestive and respiratory systems. It can also cause brain and neurological damage and impair growth.
Bioaccumulates and adversely impacts both terrestrial and aquatic systems. Can affect animals in the same way as humans. Very toxic to aquatic life.
No specific effects.
Nickel (Ni) Several Ni compounds are classified as human carcinogens. It may cause allergic skin reactions, affect the respiratory, immune and defence systems.
Nickel and its compounds can have highly acute and chronic toxicity to aquatic life.Can affect animals in the same way as humans.
No specific effects.
Benzene (C6H6) A human carcinogen, which can cause leukaemia and birth defects. Can affect the central nervous system and normal blood production, and can harm the immune system.
Has an acute toxic effect on aquatic life. It bioaccumulates, especially in invertebrates. Leads to reproductive problems and changes in appearance or behaviour. It can damage leaves of agricultural crops and cause death in plants.
Benzene is a greenhouse gas contributing to the warming of the atmosphere. It also contributes to the formation of O3 and secondary organic aerosols, which can act as climate forcers.
Benzo-a-pyrene (BaP) Carcinogenic. Other effects may be irritation of the eyes, nose, throat and bronchial tubes.
Is toxic to aquatic life and birds. Bioaccumulates, especially in invertebrates.
No specific effects.

Introduction
17Air quality in Europe — 2012 report
1.2 Relevant policy instruments and legislation
Thematic strategy on air pollution
Within the European Union, the Sixth Environment Action Programme (EU, 2002) called for the development of a thematic strategy on air pollution with the objective of achieving levels of air quality that do not result in unacceptable impacts on, and risks to, human health and the environment. Formulated in 2005, the thematic strategy (EC, 2005b) sets specific long-term objectives for improvements in 2020 relative to the situation in 2000, specifically (EC, 2005c):
• a 47 % reduction in loss of life expectancy as a result of exposure to PM;
• a 10 % reduction in acute mortalities from exposure to O3;
• a 74 % reduction in excess acid deposition in forest areas and a 39 % reduction in surface freshwater areas;
• a 43 % reduction in areas or ecosystems exposed to eutrophication.
To achieve these objectives, it was estimated that key emissions would have to fall significantly in the period 2000–2020, specifically:
• SO2 emissions to decrease by 82 %;
• NOX emissions by 60 %;
• VOC by 51 %;
• NH3 by 27 %;
• Primary PM2.5 (fine particles emitted directly into the air) by 59 %.
In the 'Roadmap to a Resource Efficient Europe' the European Commission has proposed the following milestone for the policy: 'By 2020, the EU's interim air quality standards will have been met, including in urban hot spots, and those standards will have been updated and additional measures defined to further close the gap to the ultimate goal of achieving levels of air quality that do not cause significant impacts on health and the environment' (EC, 2011a).
Legal instruments
In recent decades, the EU has introduced and implemented various legal instruments to improve air quality. The different legal mechanisms for air quality management comprise limits or targets for ambient concentrations; limits on total emissions (e.g. national totals); and regulating emissions from specific sources or sectors either by setting emission limits (for e.g. vehicle emissions) or by setting requirements on product quality (e.g. sulphur (S) and C6H6 in fuel). The European directives currently regulating ambient air concentrations of main pollutants are designed to avoid, prevent or reduce harmful effects of air pollutants on human health and the environment. They comprise:
• Directive 2008/50/EC on ambient air quality and cleaner air for Europe, which regulates ambient air concentrations of SO2, NO2 and NOX, PM10 and PM2.5, Pb, C6H6, CO and O3 (EU, 2008c);
• Directive 2004/107/EC relating to As, Cd, Hg, Ni and PAH (including BaP) in ambient air (EU, 2004b).
In the case of non-compliance with the air quality limit and target values stipulated in European legislation, air quality management plans must be developed and implemented in the areas where exceedances occur. The plans aim to bring concentrations of air pollutants to levels below the limit and target values.
Several EU directives regulate anthropogenic emissions of pollutants to air, including precursors of key air pollutants such as O3 and PM. The National Emission Ceilings Directive (EU, 2001b) and the Gothenburg Protocol (UNECE, 1999) to the UN Convention on Long-range Transboundary Air Pollution (LRTAP), which has been recently revised (UNECE, 2012), set national emission limits for SO2, NOX, NMVOC and NH3 in order to abate acidification, eutrophication and ground-level O3.
Likewise, several directives and international conventions regulate emissions of the main air pollutants from specific sources and sectors, either by setting emission limits, by requiring the use of the best available technology, or by setting requirements on fuel composition. These include:
• Directive 2010/75/EU on industrial emissions (integrated pollution prevention and control) (EU, 2010b), targets certain industrial,
Introduction
18 Air quality in Europe — 2012 report
agriculture and waste treatment installations. The directive regulates emissions to air of SO2 and other sulphur compounds, NOX and other nitrogen compounds, CO, VOC, metals and their compounds, dust, asbestos, chlorine (Cl) and its compounds, fluoride (F) and its compounds, As and its compounds, cyanides, other carcinogenic and mutagenic compounds, and polychlorinated dibenzodioxins and polychlorinated dibenzofurans.
• The 'Euro standards' for road vehicle emissions set emission limits for NOX, hydrocarbons (HC), CO and PM for most vehicle types. The Euro 4 limits are addressed in Directive 98/70/EC (EU, 1998a, 1998b) and Directive 2005/55/EC (EU, 2005). The Euro 5 and 6 limits are covered in Regulation (EC) No 692/2008 (EU, 2008a) and Regulation (EC) No 595/2009 (EU, 2009b).
• Directive 94/63/EC on the control of VOC emissions resulting from the storage of petrol and its distribution from terminals to service stations (EU, 1994) and Directive 2009/126/EC on Stage II petrol vapour recovery during refuelling of motor vehicles at service stations (EU, 2009a).
• Directive 1999/13/EC on the limitation of emissions of VOC due to the use of organic solvents in certain activities and installations (EU, 1999a).
• Directive 91/676/EEC concerning the protection of waters against pollution caused by nitrates from agricultural sources (EU, 1991).
• Directive 1999/32/EC on reduction of sulphur content of certain liquid fuels (EU, 1999b) and Directive 2003/17/EC (amending Directive 98/70/EC) relating to the quality of petrol and diesel fuels (EU, 2003).
• The Marine Pollution Convention, MARPOL 73/78 (IMO, 1973), which is the main international convention on preventing pollution by ships from operational or accidental causes. Annex VI sets limits on air pollution from ships for SOX, NOX, VOC and PM from ship exhausts and prohibits deliberate emissions of ozone-depleting substances.
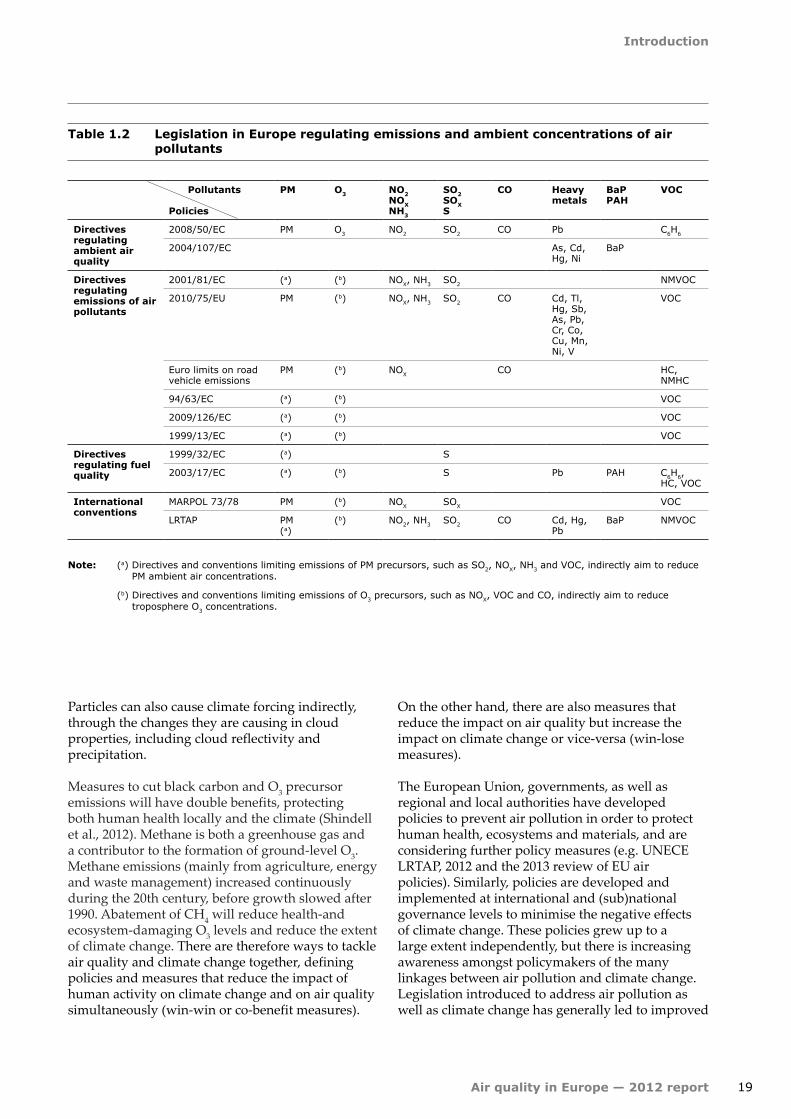
Table 1.2 summarises the coverage of the European directives and international conventions regulating air pollutant emissions (either directly or indirectly by regulating precursors emissions). The list is not exhaustive. Annex 2 provides a more detailed
description of the directives regulating emissions to air and fuel quality.
The 2004 and 2008 air quality directives do not specify an air quality objective for NH3. The Gothenburg Protocol (UNECE, 1999) under the LRTAP convention and the National Emission Ceilings Directive (EU, 2001b) set emission reduction targets for NH3 with the aim of reducing the acidification and eutrophication. Reporting of NH3 emissions is also required under the Integrated Pollution Prevention and Control (IPPC) Directive (EU, 2008b), now replaced by Directive 2010/75/EU on industrial emissions (EU, 2010).
1.3 Air quality and climate change
1.3.1 Air quality and climate change — policy interactions
Human activity and natural processes lead to emissions of several gaseous and particulate compounds into the atmosphere affecting both air quality and climate. Carbon dioxide is the largest driver of global warming and climate change. In addition, non-CO2 'climate forcers' (defined as any gaseous or particulate compound that contributes to climate change including O3, CH4, nitrous oxide, F-gases (gases containing fluorine) as well as PM) exert influence on the Earth's energy balance and on climate.
As many of the non-CO2 climate forcers are common air pollutants, air pollution has an important influence on the regional and global climate. Suspended PM (aerosols) and its chemical constituents influence the Earth's energy balance directly, through reflection and absorption of solar and infrared radiation in the atmosphere. In general, absorption of radiation leads to a positive forcing (increase in temperature), whereas reflection leads to a negative forcing (cooling of the atmosphere).
Figure ES.1 illustrates the linkages between emitted pollutants and impacts on air quality and climate. Ground-level O3 contributes to global warming. It is also one of the two major air pollutants that severely impact public health and ecosystems and is formed in the atmosphere from several precursor gases. Fine PM, the other major air pollutant, has also important climate impacts. One of the constituents of fine PM, black carbon has a warming effect, while other constituents, for instance sulphates and nitrates, may cool the climate.
Introduction
19Air quality in Europe — 2012 report
Table 1.2 Legislation in Europe regulating emissions and ambient concentrations of air pollutants
Note: (a) Directives and conventions limiting emissions of PM precursors, such as SO2, NOX, NH3 and VOC, indirectly aim to reduce PM ambient air concentrations.
(b) Directives and conventions limiting emissions of O3 precursors, such as NOX, VOC and CO, indirectly aim to reduce troposphere O3 concentrations.
Pollutants
Policies
PM O3 NO2NOXNH3
SO2SOXS
CO Heavy metals
BaPPAH
VOC
Directives regulating ambient air quality
2008/50/EC PM O3 NO2 SO2 CO Pb C6H6
2004/107/EC As, Cd, Hg, Ni
BaP
Directives regulating emissions of air pollutants
2001/81/EC (a) (b) NOX, NH3 SO2 NMVOC
2010/75/EU PM (b) NOX, NH3 SO2 CO Cd, Tl, Hg, Sb, As, Pb, Cr, Co, Cu, Mn, Ni, V
VOC
Euro limits on road vehicle emissions
PM (b) NOX CO HC, NMHC
94/63/EC (a) (b) VOC
2009/126/EC (a) (b) VOC
1999/13/EC (a) (b) VOC
Directives regulating fuel quality
1999/32/EC (a) S
2003/17/EC (a) (b) S Pb PAH C6H6, HC, VOC
International conventions
MARPOL 73/78 PM (b) NOX SOX VOC
LRTAP PM(a)
(b) NO2, NH3 SO2 CO Cd, Hg, Pb
BaP NMVOC
Particles can also cause climate forcing indirectly, through the changes they are causing in cloud properties, including cloud reflectivity and precipitation.
Measures to cut black carbon and O3 precursor emissions will have double benefits, protecting both human health locally and the climate (Shindell et al., 2012). Methane is both a greenhouse gas and a contributor to the formation of ground-level O3. Methane emissions (mainly from agriculture, energy and waste management) increased continuously during the 20th century, before growth slowed after 1990. Abatement of CH4 will reduce health-and ecosystem-damaging O3 levels and reduce the extent of climate change. There are therefore ways to tackle air quality and climate change together, defining policies and measures that reduce the impact of human activity on climate change and on air quality simultaneously (win-win or co-benefit measures).
On the other hand, there are also measures that reduce the impact on air quality but increase the impact on climate change or vice-versa (win-lose measures).
The European Union, governments, as well as regional and local authorities have developed policies to prevent air pollution in order to protect human health, ecosystems and materials, and are considering further policy measures (e.g. UNECE LRTAP, 2012 and the 2013 review of EU air policies). Similarly, policies are developed and implemented at international and (sub)national governance levels to minimise the negative effects of climate change. These policies grew up to a large extent independently, but there is increasing awareness amongst policymakers of the many linkages between air pollution and climate change. Legislation introduced to address air pollution as well as climate change has generally led to improved
Introduction
20 Air quality in Europe — 2012 report
technology and subsequent pollution abatement by emission reductions. Examples of such technological improvements are the introduction of three-way catalysts to petrol vehicles, low nitrogen burners in power plants and efficiency improvements in energy and production processes, as well as in household products and vehicle engines. Nevertheless, more can be done to reduce emissions of both air pollutants and climate forcers, e.g. by reducing the combustion of fossil fuels and other resources, such as improving resource efficiency, switching energy sources, energy conservation and initiatives to induce behavioural change leading to lower environmental pressure.
1.3.2 Impacts on European air quality from the adoption of European climate change policies
In the EU roadmap for moving to a competitive low carbon economy in 2050 (EC, 2011b), the European Commission lays down the ambition to reduce domestic GHG emissions by 80 % in 2050 compared to 1990, thereby setting a long term perspective. In December 2011, the Commission also adopted an energy roadmap for 2050 (EC, 2011c), which is tightly linked to the low carbon economy roadmap, as GHG emissions result to a large extent from energy use.
Important elements of the transition to a low carbon economy include: reduction of final energy demand; increased use of bio-fuels to replace fossil fuels; application of carbon capture and storage (CCS) in industry and the power sector; and increase in share of wind, solar, hydro, geothermal, as well as nuclear energy in electricity production, together with an increased share of electricity in final energy consumption.
The effect of climate policies on air pollution depends on the nature and ambition level of climate measures being taken. It is widely recognized that measures to abate air pollution and GHG often target the same emission sources — combustion facilities, vehicle exhausts, and the management of manure and that control of one GHG can have co-benefits or trade-offs for air pollutant emissions and vice-versa (EEA, 2006; EEA, 2010a). However, several studies have highlighted potential co-benefits on air pollution from future climate policies with or without additional tailor-made
air pollution abatement measures. For example, the European Commission's Joint Research Centre demonstrated substantial potential co-benefits in terms of reduced air pollutants emissions following an effective global climate policy by 2030 and 2050 that would keep global mean temperature increase less than two degrees compared to pre-industrial values (van Aardenne et al., 2010).
A recent study by UNEP/WMO (2011) showed that fast implementation of existing emission controls on black carbon and methane will be a cost-effective way in reducing global warming and protection human health and ecosystems from climate change and air pollution. This is especially true for non-European regions, in particular Asia. To analyse the co-benefits in Europe, Colette et al. (2012) quantified co-benefits of climate mitigation scenarios on air pollutants using the GEA (Global Energy Assessment) and two of the IPCC (Intergovernmental Panel on Climate Change)RCPs (Representative Concentration Pathways) mitigation scenarios: RCP4.5 and RCP2.6. Two GEA scenarios (HIGH_CLE and LOW_CLE (5)) were applied in the atmospheric chemistry transport model CHIMERE to evaluate such potential impacts and co-benefits in 2030. The results indicate that surface NO2 concentrations might decrease significantly by 2030 in Europe, so that in the most optimistic scenario the current hotspots of pollution would be barely above the background levels. Ozone formation would also decrease over most of Europe, although some increases would be observed in certain areas. For PM, the expected decrease by 2030 would make natural sources (mineral dust resuspension and sea salt) the dominating contributor to PM10 concentrations in Europe.
However, the effect of some climate policies on emissions of air pollutants depends on the technology used, and can be different for the various air pollutants. According to EEA (2011a), while some variants of CCS are clearly good for air pollutant emissions (implying low emissions), the application of other technologies might lead to increased air pollutant emissions (e.g. NH3 and NOX). Similarly, large scale introduction of biomass combustion as part of a climate change policy may lead to substantially higher emissions of PM2.5 and carcinogenic substances — such as BaP unless abatement measures are taken. Consequently, depending on the climate measures taken, effects on air pollutant emissions can be either beneficial or detrimental.
(5) HIGH_CLE: Full implementation of all current and planned air pollution legislation worldwide; no specific policies on climate change and energy access. LOW_CLE: Full implementation of all current and planned air pollution legislation worldwide; stringent climate policy, complying approximately with the 2-degree global temperature increase limit by 2100.
Introduction
21Air quality in Europe — 2012 report
The increased international recognition of the importance of addressing air pollution and climate change simultaneously is reflected for example in the Climate and Clean Air Coalition to Reduce Short-Lived Climate Pollutants (http://www.unep.org/ccac) and the announcement of the Air Pollution & Climate Initiative from the International Geosphere-Biosphere Programme (IGBP) and the International Global Atmospheric Chemistry (IGAC) (IGBP/IGAC, 2012). The concept of air pollution and climate has been introduced in the long-term strategy of LRTAP which for example identified the assessment of 'the feasibility of incorporating short-lived climate forcers (SLCFs) into instruments such as the revised Gothenburg Protocol. Initial efforts should focus on measures targeting black carbon as a component of PM and on the development of guidelines for black carbon emission inventories (LRTAP EB Decision 2011/14, UNECE 2012).
However, many challenges remain in translating this knowledge to action and more studies are needed to better understand and quantify the impacts on European air quality following the adoption of European climate change policies.
1.3.3 Particulate matter, both air pollutant and climate forcer
As mentioned in Section 1.3.1, atmospheric particles are both an important air pollutant and a climate forcer. Particles may either increase or decrease global warming, depending on their characteristics and optical properties. 'White' particles with high capacity to reflect sunlight, act mainly as a cooling agent, while 'black' or 'brown' particles absorb sunlight and act as a warming agent. On the other hand, particles may also have indirect effects on the climate, as they play an important role in the formation, characteristics and duration of clouds, and influence the radiation properties of clouds and precipitation patterns. In addition, deposition of black carbon particles on snow and ice can contribute to raising temperatures locally, and an increased melting rate of the ice. The disappearance of snow or ice from the earth or sea surface will exacerbate global warming, as the property of reflecting sunlight (albedo) of the surface changes dramatically.
The complexity of particles characteristics and their uneven distribution and transformation in the atmosphere makes it very difficult to predict their direct and indirect role in the climate system. Current atmospheric models still lack a complete and detailed process description of the behaviour
and effects of particles on the atmosphere, especially concerning aerosol-cloud interactions. Furthermore, and despite considerable advances since the IPCC's Third Assessment Report, the complex relations and feedback mechanisms between particles, climate and ecosystems (which also emit particles, depending on external conditions such as climate and atmospheric composition) are not fully understood nor fully described in the models (Solomon et al., 2007).
Particles mainly contribute to cooling the climate, even if some contribute to warming (such as black carbon and minerals containing specific copper and iron compounds). IPCC (Solomon et al., 2007) estimated the total direct effect of particles on climate to be – 0.5 ± 0.4 W/m2, including both cooling effects and heating effects (the latter estimated to be 0.2 ± 0.15 W/m2 for black carbon). The total indirect effect of particles on climate forcing was estimated to be between – 0.3 and – 1.8 W/m2. Ramanathan and Carmichael (2008) estimated considerably higher heating effects, due to black carbon particles. As indicated by UNEP/WMO (2011) and other studies some win-win strategies have been identified where reduction of certain emissions like those of black carbon does not lead to increase of air pollution problems whereas the success of mitigation of climate change remains in the reduction of CO2 emissions.
1.3.4 Importance of intercontinental transport of air pollutants
Although the influence of emission sources on atmospheric concentration is generally greatest near the sources, intercontinental transport of O3 and PM and their precursors contribute to serious public health problems and damage to natural and agricultural ecosystems in many parts of the world (UN, 2010b).
Current and past observations provide a wealth of evidence that concentrations and deposition of O3 and PM are influenced by atmospheric transport between continents and in some cases around the globe (UN, 2010b).
Concerning PM, long-term trends in observations of surface concentration and wet deposition (through precipitation) of PM at remote locations, as well as model simulation studies on source and receptor regions provide clear evidence of intercontinental transport. Further, measurements have also shown the importance of secondary particle formation from precursor gases transported from other regions. In-situ measurements and satellite observations
Introduction
22 Air quality in Europe — 2012 report
have established the importance of intercontinental transport of PM from arid regions, forest fires, and anthropogenic sources. Studies have shown that due to atmospheric transport and chemistry processes, particle formation can take place at long distances from the sources of precursor gases. However, gaps remain in the knowledge and understanding of aerosol particle properties and fluxes (pollution, dust, biomass-burning emissions) between continents (UN, 2010a).
Concerning O3, evidence of its intercontinental transport is provided by direct O3 measurements, as well as measurements of precursor gases and model simulation studies on source and receptor regions. Plumes of O3 have been observed in the free troposphere and at high altitude sites. Most importantly, an increasing trend in concentrations in air masses without the contribution from local anthropogenic emissions has been measured consistently at a number of remote sites across the Northern hemisphere (UN, 2010a). Measurements on the western coasts of Europe and North America show that trans-oceanic air flows can carry high enough O3 concentrations that can contribute substantially to the exceedance of air quality targets for O3 concentrations. Complex topography may enhance the mixing of O3 transported at high altitudes with surface air.
Further, multi-model experiments done by the Task Force on Hemispheric Transport of Air Pollution (HTAP), evaluated the theoretical contribution of intercontinental transport to ground level O3 and PM concentrations (UN, 2010a) by quantifying the relative importance of emissions changes outside a specific region (e.g. Europe) compared to emissions changes within region. The model runs assumed a 20 % reduction in emissions change and the analysis used the concept of RAIR (6). For ground level O3, the study indicated that at least 30 % of the change in the modeled ground-level O3 concentration changes could be attributed to intercontinental transport. The impact was largest for the case where North American emissions influence European surface O3 levels, followed by the impact of European emissions on South and East Asia surface O3 levels. For PM, the HTAP model study found lower contributions from intercontinental transport, with for example 5 % of the modeled European surface level PM concentration changes resulting from intercontinental transport. It is important to emphasize that these model studies are associated with significant uncertainties and should only be used as an indicator of the importance and impact of intercontinental transport on air quality. Further studies are needed to attribute European air quality exceedance to non-European emissions of air pollutants.
(6) The Relative Annual Intercontinental Response metric is defined as the sum of changes in the annual regionally-averaged concentration within a region due to a 20 % decrease in emissions in other world regions divided by the sum of the changes in concentration within a region due to a 20 % decrease in both the receptor and other world regions. A value of 100 % indicates that air quality is 100 % dominated by emissions from other world regions. World regions are (North America, Europe, East Asia and South Asia).