air quality in a warming world modelling impacts of
TRANSCRIPT

The Centre for Australian Weather and Climate ResearchA partnership between CSIRO and the Bureau of Meteorology
AIR QUALITY IN A WARMING WORLD
Modelling Impacts of Different Technologies
Martin Cope
CLEAN AIR forum 2010
www.cawcr.gov.au

The Centre for Australian Weather and Climate ResearchA partnership between CSIRO and the Bureau of Meteorology
Air Quality- Australian Coastal Airsheds
Ozone
Particles
320 250

The Centre for Australian Weather and Climate ResearchA partnership between CSIRO and the Bureau of Meteorology
Ozone
Europe- ozone contributes to 21 thousand
premature deaths/yr
(http://royalsociety.org/document.asp?tip=0&id=8039 )
(Fig 2 of http://www.ipcc.ch/pdf/assessment-report/ar4/wg1/
ar4-wg1-chapter2.pdf
Time series plot of 1-h ozone is from
http://www.environment.gov.au/soe/2006/publications/drs/pubs/287/atm/a_18_urban
_air_o3_daily_1_hour_dl.xls

The Centre for Australian Weather and Climate ResearchA partnership between CSIRO and the Bureau of Meteorology
Projected Global Trends in Ozone
Wu et al. 2008.
A1B emissions only
Climate change only
Combined
A1B
Anthropogenic
emission scenario
NOx +41%
CO +21%
VOC +54%
“The future climate
is expected to be
more stagnant with
higher temperatures,
promoting additional
ozone formation
(1-10 ppb) due to climate
change alone”
Jacob et al. 20082000

The Centre for Australian Weather and Climate ResearchA partnership between CSIRO and the Bureau of Meteorology
Ozone
• Decreases in peak O3 due to NOx and VOC
emission controls
• Increase in lower percentiles due to
1/ NOx controls in urban areas
2/ increases in background O3
Urban
(Background ozone
concentrations are increasing
~6% per decade at Cape Grim.)
(Royal Society 2008) • The threshold for O3 health effects may be at
around background concentrations and thus
much lower than current air quality standards
(Bell et al. 2006)

The Centre for Australian Weather and Climate ResearchA partnership between CSIRO and the Bureau of Meteorology
Local climate and
air chemistry1996 -> 2005 etc.
SYDNEY
NEWCASTLE
PICTON
WOLLONGONG
PENRITH
LITHGOWTASMAN SEA
60 km grid 3 km grid
Topography
SYDNEY
NEWCASTLE
PICTON
WOLLONGONG
PENRITH
LITHGOWTASMAN SEA
Global ClimateOcean-Land-Atmosphere
1870 -> 2100
Regional climateLand-Atmosphere
1960 -> 2100
Urban climate
and chemistryDecadal runs
180 km grid
Sydney Ozone Projections
A2 emissions scenario

The Centre for Australian Weather and Climate ResearchA partnership between CSIRO and the Bureau of Meteorology
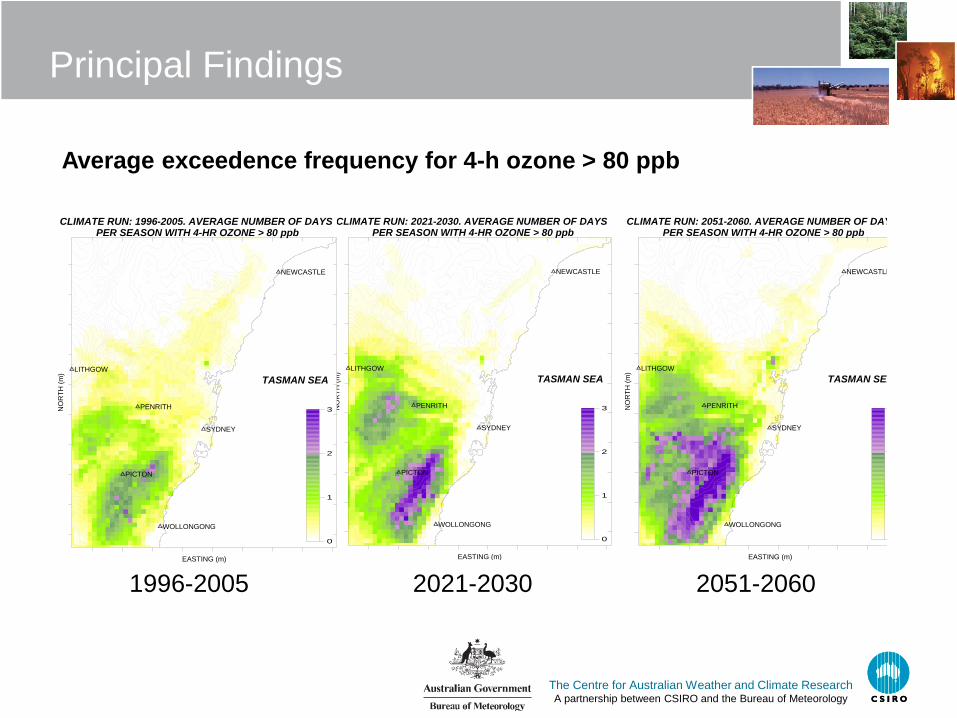
Principal Findings
Ozone projections were modelled for 2021-2030 and 2051-2060
• Anthropogenic emissions were held fixed at 2003 levels (except for temperature dependent emissions) to look at the ‘climate penalty’
• Exceedences of the NEPM AAQS for ozone were projected to increase by 27-30% and 45-92% respectively
• Hospital admissions due to ozone exposure were projected to increase by 40% and 200% respectively
• Cause- warmer temperatures-> more emissions and faster chemistry
The Centre for Australian Weather and Climate ResearchA partnership between CSIRO and the Bureau of Meteorology
Principal Findings
1996-2005 2021-2030 2051-2060
EASTING (m)
NO
RT
H (
m)
SYDNEY
NEWCASTLE
PICTON
WOLLONGONG
PENRITH
LITHGOW
CLIMATE RUN: 2021-2030. AVERAGE NUMBER OF DAYS PER SEASON WITH 4-HR OZONE > 80 ppb
0
1
2
3
TASMAN SEA
EASTING (m)
NO
RT
H (
m)
SYDNEY
NEWCASTLE
PICTON
WOLLONGONG
PENRITH
LITHGOW
CLIMATE RUN: 1996-2005. AVERAGE NUMBER OF DAYS PER SEASON WITH 4-HR OZONE > 80 ppb
0
1
2
3
TASMAN SEA
EASTING (m)
NO
RT
H (
m)
SYDNEY
NEWCASTLE
PICTON
WOLLONGONG
PENRITH
LITHGOW
CLIMATE RUN: 2051-2060. AVERAGE NUMBER OF DAYS PER SEASON WITH 4-HR OZONE > 80 ppb
0
1
2
3
TASMAN SEA
Average exceedence frequency for 4-h ozone > 80 ppb

The Centre for Australian Weather and Climate ResearchA partnership between CSIRO and the Bureau of Meteorology
• National emission trading target to 20% below 1990 levels
by 2020 and 60% below 2000 levels by 2050.
• Moderately increasing oil prices + EIA high oil price
extrapolated to $US 133 /bbl by 2050.
Future Fuels Forum, Graham et al. 2008
Controlling GHG’s and Air Pollution
Black coal carbon sto.
Gas carbon storage
Hot fractured rocks
Solar thermal
Wind
Biomass
Gas peak
DG
Gas combined cycle
Black coal pf
Petrol
Aviation fuelYear
Electricity generation by technology
0
50
100
150
200
250
300
350
400
450
500
2006 2010 2014 2018 2022 2026 2030 2034 2038 2042 2046 2050
TW
h
Nuclear
DG
Hot fracturedrocksSolar thermal
Wind
Biomass
Gas peak
Gas CCS
Gas combinedcycleBrown coalpartial CCSBlack coalpartial CCSBlack coal CCS
Black coal pf
Brown coal CCS
Brown coal pf
Hydro
Nuclear

The Centre for Australian Weather and Climate ResearchA partnership between CSIRO and the Bureau of Meteorology
Projection of fuel consumption 2006 – 2050
100% biodiesel (B100)
0
200
400
600
800
1000
1200
1400
1600
1800
2000
2006 2010 2014 2018 2022 2026 2030 2034 2038 2042 2046 2050
PJ
Electricity
LPG
Natural gas
GTL
CTL
B100
B20
Diesel
E85
E10
Petrol
Aviation fuel
20% biodiesel (B20)
LPG
Natural gas
Gas to Liquid (GTL)
Coal to Liquid
Electricity
Diesel
85% ethanol (E85)
10% ethanol (E10)
Petrol
Aviation fuelYear
Transport sector fuel consumption
Future Fuels Forum, Graham et al. 2008

Electric Vehicles and Ozone
The Centre for Australian Weather and Climate ResearchA partnership between CSIRO and the Bureau of Meteorology
Dr. P. Paevere & T. Jones, CSIRO
100%
100%
Coal

Electric vehicles and ozone
The Centre for Australian Weather and Climate ResearchA partnership between CSIRO and the Bureau of Meteorology
Dr. P. Paevere & T. Jones, CSIRO
Uncontrolled charging scenario- NSW summer peak

Electric Vehicles and Air Quality
The Centre for Australian Weather and Climate ResearchA partnership between CSIRO and the Bureau of Meteorology
260000 280000 300000 320000 340000 360000 380000 400000 420000
EASTING (m)
6180000
6200000
6220000
6240000
6260000
6280000
6300000
6320000
6340000
6360000
NO
RT
H (
m)
SYDNEY
NEWCASTLE
PICTON
WOLLONGONG
PENRITH
LITHGOW
CLIMATE RUN: 2051-2060. AVERAGE NUMBER OF DAYS PER SEASON WITH 1-HR OZONE > 100 ppb. EV+RENEWABLES
0
1
2
3
TASMAN SEA
260000 280000 300000 320000 340000 360000 380000 400000 420000
EASTING (m)
6180000
6200000
6220000
6240000
6260000
6280000
6300000
6320000
6340000
6360000
NO
RT
H (
m)
SYDNEY
NEWCASTLE
PICTON
WOLLONGONG
PENRITH
LITHGOW
CLIMATE RUN: 2051-2060. AVERAGE NUMBER OF DAYS PER SEASON WITH 1-HR OZONE > 100 ppb
0
1
2
3
TASMAN SEA
260000 280000 300000 320000 340000 360000 380000 400000 420000
EASTING (m)
6180000
6200000
6220000
6240000
6260000
6280000
6300000
6320000
6340000
6360000
NO
RT
H (
m)
SYDNEY
NEWCASTLE
PICTON
WOLLONGONG
PENRITH
LITHGOW
CLIMATE RUN: 2051-2060. AVERAGE NUMBER OF DAYS PER SEASON WITH 1-HR OZONE > 100 ppb. EV+ COAL
0
1
2
3
TASMAN SEA
2050 Base case EV + ren EV + coal
1112
16
21
788
10
0
5
10
15
20
25
30
1-h > 100ppb 4-h > 80ppb
Nu
mb
er
of
Ex
ce
ed
en
ce
s
THRESHOLD
SEASONAL-AVERAGE OZONE EXCEEDENCES
1996-2005
2051-2060: Base
2051-2060: EV + Renewables
2051-2060: EV + Coal
Frequency of 4-h O3 > 80 ppb

The Centre for Australian Weather and Climate ResearchA partnership between CSIRO and the Bureau of Meteorology
Average number of days per season with T > 30 C
EASTING (m)
NO
RT
H (
m)
SYDNEY
NEWCASTLE
PICTON
WOLLONGONG
PENRITH
LITHGOW
BGO
BER
BRICHU
EAR
KEM
LIN
LIV
MAC
NEW
OAK
RAN
RIC
ROZ
STM
VIN
WAL
WAR
WOL
CLIMATE RUN: 1996-2005Average number of days per year > 30degC
10
20
30
40
50
TASMAN SEA
1996-20052021-2030 -
1996-2005
2051-2060 -
1996-2005
Difference DifferenceReference
EASTING (m)
NO
RT
H (
m)
SYDNEY
NEWCASTLE
PICTON
WOLLONGONG
PENRITH
LITHGOW
CLIMATE RUN: 2021-2030 minus 1996-2005Average number of days per year > 30degC
-2
0
2
4
6
8
10
TASMAN SEA
EASTING (m)
NO
RT
H (
m)
SYDNEY
NEWCASTLE
PICTON
WOLLONGONG
PENRITH
LITHGOW
CLIMATE RUN: 2051-2060 minus 1996-2005Average number of days per year > 30degC
-2
0
2
4
6
8
10
TASMAN SEA
Heat Stress and Air Pollution Exposure

The Centre for Australian Weather and Climate ResearchA partnership between CSIRO and the Bureau of Meteorology
Heat Stress
MORTALITY ESTIMATES FOR HEAT STRESS
Relative risk factor RR= 1.03 C-1 (for Tmax > 28 C) increase in all-
causes mortality for the 65+ age group.
248317
950
176239
749
438
1312
0
400
800
1200
1600
Current decade 2050 2050 + ageing population
AN
NU
AL
MO
RT
AL
ITY
This study
McMichael et al (min)
McMichael et al (max)
Ageing population- assume a doubling of the proportion in 65+ age group
in the Sydney by 2050-2060
McMichael et al. 2002. Human Health and Climate Change in Oceania: A Risk Assessment

The Centre for Australian Weather and Climate ResearchA partnership between CSIRO and the Bureau of Meteorology
Heat and Air Pollution Exposure
.
Scatter plots of daily ozone and heat stress exposure for Sydney 1996-2005
HEAT EXPOSURE vs OZONE EXPOSURE
0.0
0.5
1.0
0 5 10 15 20 25
DAILY MORTALITY- HEAT STRESS
HO
SP
ITA
L A
DM
ISS
ION
S-
OZ
ON
E
HEAT EXPOSURE vs OZONE EXPOSURE
0
5
10
15
0 5 10 15 20 25
DAILY MORTALITY- HEAT STRESS
HO
SP
ITA
L A
DM
ISS
ION
S-
OZ
ON
EHEAT EXPOSURE vs OZONE EXPOSURE
0
5
10
15
20
25
0 5 10 15 20 25
DAILY MORTALITY- HEAT STRESS
HO
SP
ITA
L A
DM
ISS
ION
S-
OZ
ON
E
O3 thres = 60 ppb O3 thres = 40 ppb O3 thres = 20 ppb
Does the joint presence of high temperatures and high ozone lead
to increased vulnerability to either driver of mortality/morbidity?
(A study of the excess mortality observed during the August 2003 heat wave
in Europe found that the relationship varied by city; [Filleul et al. 2006] )
The Centre for Australian Weather and Climate ResearchA partnership between CSIRO and the Bureau of Meteorology
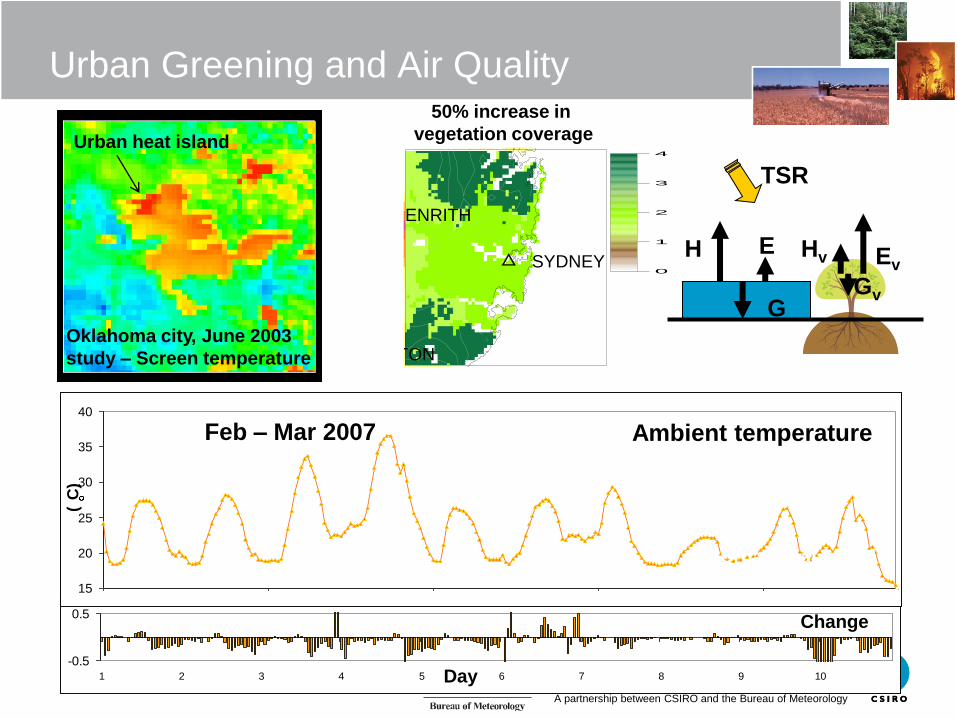
Urban Greening and Air Quality
SYDNEY
PICTON
WOLLONGONG
PENRITH
LITHGOW
60
70
80
90
100
110
120
130
140
PEAK 4-h OZONE: Base Case
0
1
2
3
4
50% increase in
vegetation coverage
G
H E Hv Ev
Gv
TSR
-0.5
0.5
1 2 3 4 5 6 7 8 9 10
15
20
25
30
35
40
Day
Ambient temperature
Change
(C
)
Oklahoma city, June 2003
study – Screen temperature
Urban heat island
Urban heat island
Feb – Mar 2007

The Centre for Australian Weather and Climate ResearchA partnership between CSIRO and the Bureau of Meteorology
Diurnal variation (temperature driven) of isoprene and isoprene
oxidation products, E. Zardin et al., Poster 50, Greenhouse 2009
Fig. 4 Diurnal cycle of biogenic emissions during Jan '08
0
2
4
6
8
10
12
3/1/08 7/1/08 11/1/08 16/1/08 21/1/08 26/1/08 30/1/08
Date
ppb
m/z 69 Isoprene m/z 71 MVK+MACR
Diurnal variation (temperature driven) of isoprene and isoprene
oxidation products, E. Zardin et al., Poster 50, Greenhouse 2009
Perth, Western Australia

The Centre for Australian Weather and Climate ResearchA partnership between CSIRO and the Bureau of Meteorology
Urban Greening and Air Quality
SYDNEY
PICTON
WOLLONGONG
PENRITH
LITHGOW
60
70
80
90
100
110
120
130
140
PEAK 4-h OZONE: Base Case
0
1
2
3
4
Increase urban
leaf area by 50%
G
H E Hv Ev
Gv
TSRIsoprene
0
2
4
6
0
1
2
3
1 2 3 4 5 6 7 8 9 10
Concentration of isoprene + monoterpene
(pp
b)
Day
Change
0
20
40
60
80
100
120
-10
0
10
38 39 40 41 42 43 44 45 46 47 48 49Day
(pp
b)
Ozone concentration
Change
Feb – Mar 2007

Urban Greening and Air Quality
The Centre for Australian Weather and Climate ResearchA partnership between CSIRO and the Bureau of Meteorology
SYDNEY
PICTON
WOLLONGONG
PENRITH
LITHGOW
60
70
80
90
100
110
120
130
140
PEAK 4-h OZONE: Base Case
SYDNEY
PICTON
WOLLONGONG
PENRITH
LITHGOW
5
10
15
20
+50% Vegetation - Base Case
Base Difference
Feb – Mar 2007

The Centre for Australian Weather and Climate ResearchA partnership between CSIRO and the Bureau of Meteorology
Aerosols
700 deaths per year attributable to PM2.5 in
Australia (Ethanol and Health Study)
“Particulate matter (PM) correlates with
meteorology much weaker than ozone.
Rain and mixing depth strongly
effect PM and could either increase
or decrease regionally. Wild fires could
become a major PM source”
Jacob et al. 2008
320 250

The Centre for Australian Weather and Climate ResearchA partnership between CSIRO and the Bureau of Meteorology
Bushfire smoke
• Global amount of biomass burned in the year 2000 was 5.6 Pg,
releasing 38.3 Tg of PM2.5 ( Ito and Penner 2004).
• Biomass burning aerosols influence the radiative balance of the earth-
atmosphere system directly through the scattering and absorption of
radiation, and indirectly through their influence on cloud microphysical
processes, and therefore constitute an important forcing in climate
models (e.g., Penner, 2001).
• Biomass burning aerosols reduce visibility, influence atmospheric
photochemistry and can be inhaled into the deepest parts of the lungs,
so that they can have a significant effect on human health.

The Centre for Australian Weather and Climate ResearchA partnership between CSIRO and the Bureau of Meteorology
Observed changes in FFDI
• South-east Australia has become hotter and drier
since 1950.
• The annual cumulative FFDI displays a rapid increase
in the late-90s to early-00s at many locations.
• Increases of 10-40% between 1980-2000 and 2001-
2007 are evident at most sites.
• The strongest rises are seen in the interior portions of
NSW, and they are associated with a jump in the
number of very high and extreme fire danger days.
Forest Fire Danger Index
Derived by McArthur
Rate of spread (chains/hr) of a fire normalised to flat terrain and a fuel load of 12 t/ha
FFDI = f (fuel moisture, wind speed)
Fuel moisture = f(T, RH, soil moisture, WS), asymptotes at a min= ~2-3%
Year
1970 1980 1990 2000 2010 2020
Cum
ula
tive F
FD
I
0
1000
2000
3000
4000
5000
Are
a (
kha)
0
200
400
600
800
1000
1200
1400
Bendigo FFDI
Melbourne airport FFDI
Fire Area (kha)
FFDI courtesy of Chris Lucas

The Centre for Australian Weather and Climate ResearchA partnership between CSIRO and the Bureau of Meteorology
Summer 2006/2007 Alpine Fire
• During December 2006 –February 2007, the state of Victoria was ravaged by ~600 separate bushfires, that formed the Great Divide fire complex.
• More than 1.2 Mha was burned over ~60 days.
Smoke from fires in northern Victoria on 12
December 2006 (from
http://www.esands.com/news/061207
Bushfires/BushfireImages.htm)
Alpine fires – smoke plume
Ozone production - Alpine fires
Melbourne

Modelled fire impacts for December 2006
The Centre for Australian Weather and Climate ResearchA partnership between CSIRO and the Bureau of Meteorology

Modelled fire impacts for December 2006
The Centre for Australian Weather and Climate ResearchA partnership between CSIRO and the Bureau of Meteorology
25
35
45
55
65
75
85
95
1
2
3
4
5
Frequency of days when
24-h PM2.5 > 25 g m-3Peak 24-h PM2.5

The Centre for Australian Weather and Climate ResearchA partnership between CSIRO and the Bureau of Meteorology
Ovens Valley – Daily PM2.5 and Hourly O3
16/12/06 23/12/06 30/12/06 6/01/07 13/01/07
Ozo
ne c
on
cen
trati
on
[p
pb
]
0
20
40
60
80
100
120
140
160
180
PM
2.5 c
on
cen
trati
on
[g
/m3
]
0
20
40
60
100
200
300
400
500
600
700
Ozone
PM2.5
16/04/07 23/04/07 30/04/07 7/05/07 14/05/07
Ozo
ne c
on
cen
trati
on
[p
pb
]
0
20
40
60
80
100
PM
2.5 c
on
cen
trati
on
[g
/m3
]
0
20
40
60
80
100
120
• Bushfire are a major pollution source in Australia during drought years
• Projections are for a 10-50% (low warming) to 100-300% (high warming)
increase in extreme fire weather by 2050
• Victorian Royal Commission recommended prescribed burning based on
an annual rolling target of 5 per cent minimum of public land
• There will be a increased need to balance the health impacts of prescribed
burns vs. the reduction in bushfire risk
Bushfires 2006/2007
AQ objectives exceeded on 13 days
Prescribed burning
Objectives exceeded on 7 days
Meyer et al. Greenhouse 2009
The Centre for Australian Weather and Climate ResearchA partnership between CSIRO and the Bureau of Meteorology
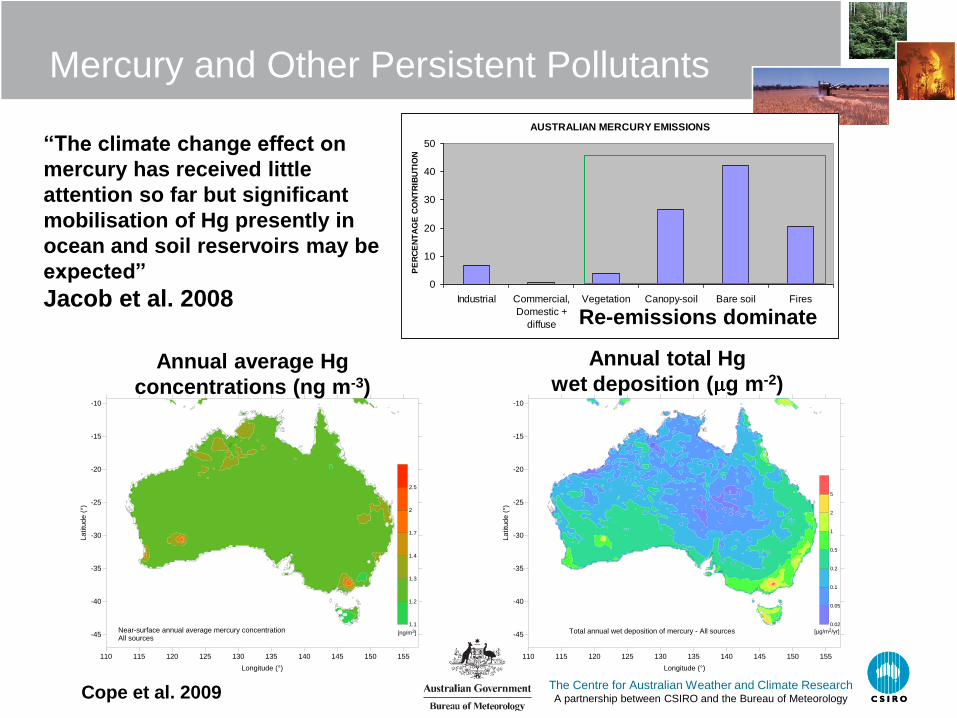
Mercury and Other Persistent Pollutants
110 115 120 125 130 135 140 145 150 155
Longitude (°)
-45
-40
-35
-30
-25
-20
-15
-10
La
titu
de
(°)
1.1
1.2
1.3
1.4
1.7
2
2.5
[ng/m3]Near-surface annual average mercury concentrationAll sources
110 115 120 125 130 135 140 145 150 155
Longitude (°)
-45
-40
-35
-30
-25
-20
-15
-10
La
titu
de
(°)
0.02
0.05
0.1
0.2
0.5
1
2
5
Total annual wet deposition of mercury - All sources [µg/m2/yr]
Annual average Hg
concentrations (ng m-3)
Annual total Hg
wet deposition ( g m-2)
AUSTRALIAN MERCURY EMISSIONS
0
10
20
30
40
50
Industrial Commercial,
Domestic +
diffuse
Vegetation Canopy-soil Bare soil Fires
PE
RC
EN
TA
GE
CO
NT
RIB
UT
ION
Cope et al. 2009
“The climate change effect on
mercury has received little
attention so far but significant
mobilisation of Hg presently in
ocean and soil reservoirs may be
expected”
Jacob et al. 2008Re-emissions dominate

The Centre for Australian Weather and Climate ResearchA partnership between CSIRO and the Bureau of Meteorology
Climate change and mercury?
Temperature
Precipitation
1960 20902006
+3.8 C
- 4%
SE AUSTRALIA
77% increase in Hg emissions from the soil.
This gives a 50% increase in the total
emissions of Hg (fire sources not changed).
A2 emissions scenario. CSIRO Mk3.5 GCM.
Downscaled to a 20 km grid over Australia.
Select 2090 for large T, small precip.
NATURAL EMISSIONS OF MERCURY FOR 2006 AND 2090
0
50
100
150
200
250
Plants Covered soil Bare soil
ton
ne
s
2050
2090
MERCURY WET AND DRY DEPOSITION- 2009 AND 2090
0
5
10
15
20
25
dry wet total
ton
nes
2006
2090
8% increase in dry deposition mass
60% increase in wet deposition mass
12% increase in total deposited mass
Of the additional 108 tonnes of Hg
emitted from soils, 98% is transported
away from the Australian land surface
(a short term outcome!)
Thank you
The Centre for Australian Weather and Climate ResearchA partnership between CSIRO and the Bureau of Meteorology
Martin Cope
Principal Research Scientist
Phone: 03 9239 4647
Email: [email protected]
Web: www.cawcr.gov.au
Thank youwww.cawcr.gov.au