air quality impact assessment report compiled by …€¦ · air quality impact assessment report...
TRANSCRIPT
Annex 5B
Air Quality Impact Assessment Report compiled by Airshed Planning Professionals, July 2015

Environmental Impact Assessment Report for the Kangra Coal (Pty) Ltd Kusipongo Resource Project:
I, Didintle Modisamongwe, declare that-
General declaration:
•
•
•
•
•
•
•
•
• •
I act as the independent air quality specialist in the application for a Section 102 amendment application in terms of the National Mineral and Petroleum Resources Development Act (Act No. 28 of 2002,) as amended I do not have and will not have any vested interest (either business, financial, personal or other) in the undertaking of the proposed activity, other than remuneration for work performed in terms of the Environmental Impact Assessment Regulations, 2014; I have performed the work relating to the application in an objective manner, even if this results in views and findings that are not favourable to the applicant; I declare that there are no circumstances that may compromise my objectivity in performing such work; I have expertise in conducting the specialist report relevant to this application, including knowledge of the Act, regulations and any guidelines that have relevance to the proposed activity; I have complied with the Act, regulations and all other applicable legislation; I have no, and will not engage in, conflicting interests in the undertaking of the activity; I undertake to disclose to the applicant and the competent authority all material information in my possession that reasonably has or may have the potential of influencing - any decision to be taken with respect to the application by the competent authority; and- the objectivity of any report, plan or document to be prepared by myself for submission to the competent authority; All the particulars furnished by me in this form are true and correct; and I realise that a false declaration is an offence .
1,~~ n(o4-(e,orc; Signed Date

Environmental Impact Assessment Report for the Kangra Coal (Pty) Ltd Kusipongo Resource Project:
I, Lucian Burger, declare that-
General declaration:
•
•
•
•
•
•
•
•
• •
I act as the independent air quality specialist in the application for a Section 102 amendment application in terms of the National Mineral and Petroleum Resources Development Act (Act No. 28 of 2002,) as amended I do not have and will not have any vested interest (either business, financial, personal or other) in the undertaking of the proposed activity, other than remuneration for work performed in terms of the Environmental Impact Assessment Regulations, 2014; I have performed the work relating to the application in an objective manner, even if this results in views and findings that are not favourable to the applicant; I declare that there are no circumstances that may compromise my objectivity in performing such work; I have expertise in conducting the specialist report relevant to this application, including knowledge of the Act, regulations and any guidelines that have relevance to the proposed activity; I have complied with the Act, regulations and all other applicable legislation; I have no, and will not engage in, conflicting interests in the undertaking of the activity; I undertake to disclose to the applicant and the competent authority all material information in my possession that reasonably has or may have the potential of influencing - any decision to be taken with respect to the application by the competent authority; and- the objectivity of any report, plan or document to be prepared by myself for submission to the competent authority; All the particulars furnished by me in this form are true and correct; and I realise that a false declaration is an offence .

Environmental Impact Assessment Report for the Kangra Coal (Pty) Ltd Kusipongo Resource Project:
I, Gillian Petzer, declare that-
General declaration:
• I act as the independent air quality specialist in the application for a Section 102 amendment application in terms of the National Mineral and Petroleum Resources Development Act (Act No. 28 of 2002,) as amended
• I do not have and will not have any vested interest (either business, financial, personal or other) in the undertaking of the proposed activity, other than remuneration for work performed in terms of the Environmental Impact Assessment Regulations, 2014;
• I have performed the work relating to the application in an objective manner, even if this results in views and findings that are not favourable to the applicant;
• I declare that there are no circumstances that may compromise my objectivity in performing such work;
• I have expertise in conducting the specialist report relevant to this application, including knowledge of the Act, regulations and any guidelines that have relevance to the proposed activity;
• I have complied with the Act, regulations and all other applicable legislation;
• I have no, and will not engage in, conflicting interests in the undertaking of the activity;
• I undertake to disclose to the applicant and the competent authority all material information in my possession that reasonably has or may have the potential of influencing - any decision to be taken with respect to the application by the competent authority; and- the objectivity of any report, plan or document to be prepared by myself for submission to the competent authority;
• All the particulars furnished by me in this form are true and correct; and • I realise that a false declaration is an offence.
ao(oi.flo.o '~ Signed Date
Address: 480 Smuts Drive, Halfway Gardens | Postal: P O Box 5260, Halfway House, 1685 Tel: +27 (0)11 805 1940 | Fax: +27 (0)11 805 7010
www.airshed.co.za
Air Quality Impact Assessment for the Development and Operation of a Conveyor Belt, Adit and Associated Infrastructure at the Kangra Coal Kusipongo Coal Reserve, Maquasa West Extension Mining
Right Area
Project done on behalf of ERM Southern Africa (Pty) Ltd
Project Compiled by:
D Modisamongwe
Project Manager
G Petzer
Report No:14ERM15 | Date: April 2015
Project Reviewer
L W Burger

Air Quality Impact Assessment for the Development and Operation of a Conveyor Belt, Adit and Associated Infrastructure at the Kangra Coal Kusipongo Coal Reserve, Maquasa West Extension Mining Right Area
Report No.14ERM15 i
Report Details
Reference 14ERM15
Status Draft
Report Title
Air Quality Impact Assessment for the Development and Operation of a Conveyor Belt, Adit and
Associated Infrastructure at the Kangra Coal Kusipongo Coal Reserve, Maquasa West Extension Mining
Right Area
Date April 2015
Client ERM Southern Africa (Pty) Ltd
Prepared by Didintle Modisamongwe B-Tech (Tshwane University of Technology)
Reviewed by
Gillian Petzer BEng (Chem.) (University of Pretoria)
Lucian Burger, PhD (University of Natal)
Notice
Airshed Planning Professionals (Pty) Ltd is a consulting company located in Midrand, South Africa,
specialising in all aspects of air quality, ranging from nearby neighbourhood concerns to regional air
pollution impacts as well as noise impact assessments. The company originated in 1990 as
Environmental Management Services, which amalgamated with its sister company, Matrix Environmental
Consultants, in 2003.
Declaration
Airshed is an independent consulting firm with no interest in the project other than to fulfil the contract
between the client and the consultant for delivery of specialised services as stipulated in the terms of
reference.
Copyright Warning
Unless otherwise noted, the copyright in all text and other matter (including the manner of presentation) is
the exclusive property of Airshed Planning Professionals (Pty) Ltd. It is a criminal offence to reproduce
and/or use, without written consent, any matter, technical procedure and/or technique contained in this
document.

Air Quality Impact Assessment for the Development and Operation of a Conveyor Belt, Adit and Associated Infrastructure at the Kangra Coal Kusipongo Coal Reserve, Maquasa West Extension Mining Right Area
Report No.14ERM15 ii
Abbreviations
Airshed Airshed Planning Professionals (Pty) Ltd
AQMP Air Quality Management Plan
ASTM American Society of Testing and Materials
ALARP As Low As Reasonably Practicable
AQG Air Quality Guidelines
DEA South African Department of Environmental Affairs
DEAT South African Department of Environmental Affairs and Tourism (Currently called DEA)
HPA Highveld Priority Area
GLCs Ground Level Concentrations
LM Local Municipality
MRA Mining Rights Area
ERM ERM Southern Africa (Pty) Ltd
NAAQS National Ambient Air Quality Standards
NEMAQA National Environmental Management Air Quality Act
NPI National Pollutant Inventory
NDCR National Dust Control Regulations – South Africa
SAWS South African Weather Services
US EPA United States Environmental Protection Agency
WHO World Health Organisation
Air Quality Impact Assessment for the Development and Operation of a Conveyor Belt, Adit and Associated Infrastructure at the Kangra Coal Kusipongo Coal Reserve, Maquasa West Extension Mining Right Area
Report No.14ERM15 iii
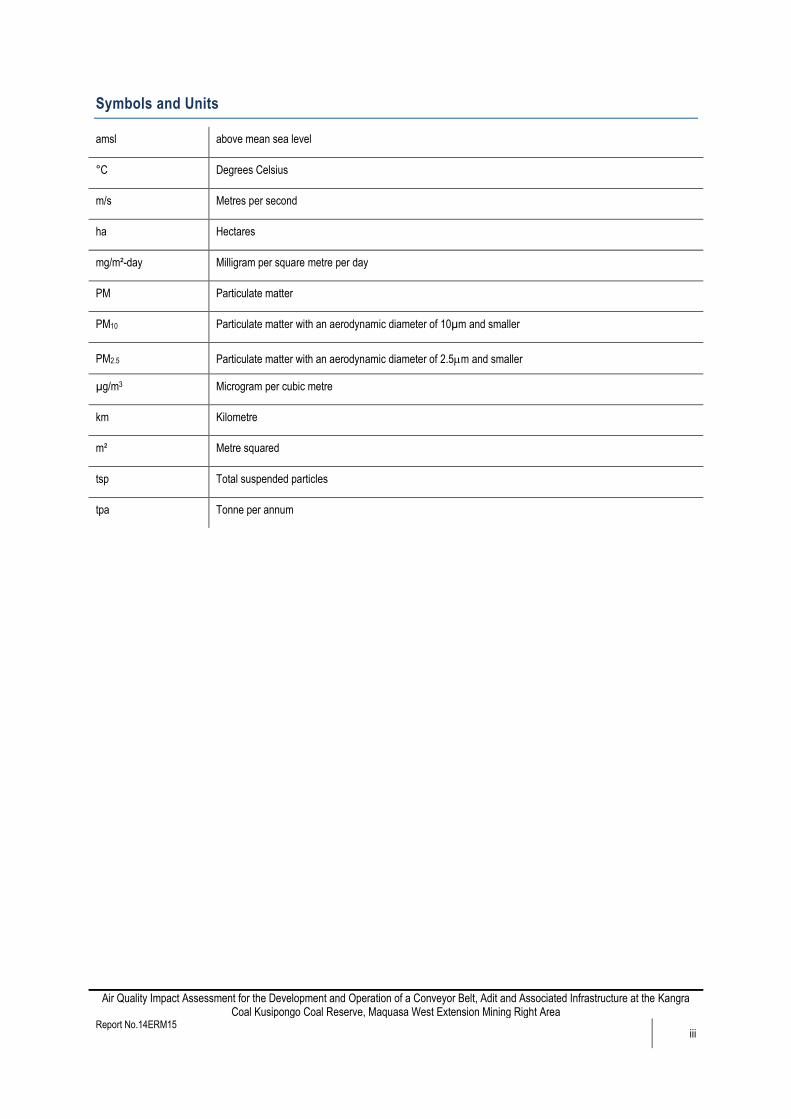
Symbols and Units
amsl above mean sea level
°C Degrees Celsius
m/s Metres per second
ha Hectares
mg/m²-day Milligram per square metre per day
PM Particulate matter
PM10 Particulate matter with an aerodynamic diameter of 10µm and smaller
PM2.5 Particulate matter with an aerodynamic diameter of 2.5m and smaller
µg/m3 Microgram per cubic metre
km Kilometre
m² Metre squared
tsp Total suspended particles
tpa Tonne per annum
Air Quality Impact Assessment for the Development and Operation of a Conveyor Belt, Adit and Associated Infrastructure at the Kangra Coal Kusipongo Coal Reserve, Maquasa West Extension Mining Right Area
Report No.14ERM15 iv
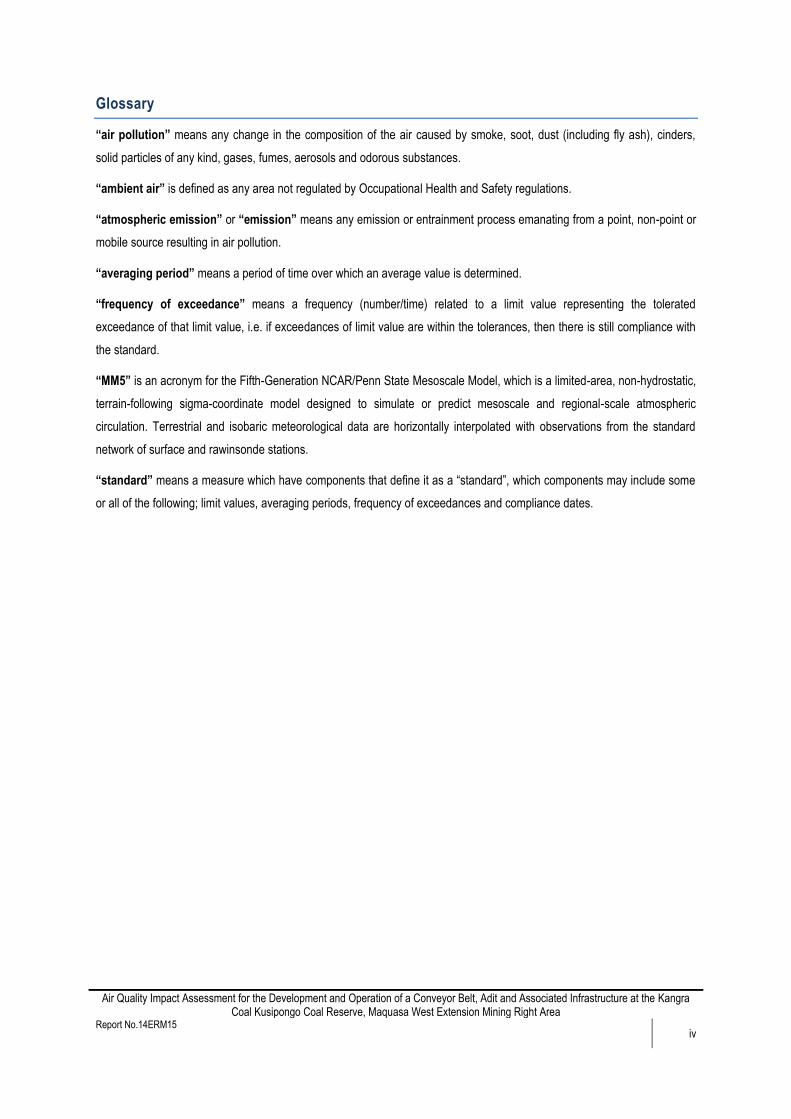
Glossary
“air pollution” means any change in the composition of the air caused by smoke, soot, dust (including fly ash), cinders,
solid particles of any kind, gases, fumes, aerosols and odorous substances.
“ambient air” is defined as any area not regulated by Occupational Health and Safety regulations.
“atmospheric emission” or “emission” means any emission or entrainment process emanating from a point, non-point or
mobile source resulting in air pollution.
“averaging period” means a period of time over which an average value is determined.
“frequency of exceedance” means a frequency (number/time) related to a limit value representing the tolerated
exceedance of that limit value, i.e. if exceedances of limit value are within the tolerances, then there is still compliance with
the standard.
“MM5” is an acronym for the Fifth-Generation NCAR/Penn State Mesoscale Model, which is a limited-area, non-hydrostatic,
terrain-following sigma-coordinate model designed to simulate or predict mesoscale and regional-scale atmospheric
circulation. Terrestrial and isobaric meteorological data are horizontally interpolated with observations from the standard
network of surface and rawinsonde stations.
“standard” means a measure which have components that define it as a “standard”, which components may include some
or all of the following; limit values, averaging periods, frequency of exceedances and compliance dates.
Air Quality Impact Assessment for the Development and Operation of a Conveyor Belt, Adit and Associated Infrastructure at the Kangra Coal Kusipongo Coal Reserve, Maquasa West Extension Mining Right Area
Report No.14ERM15 v
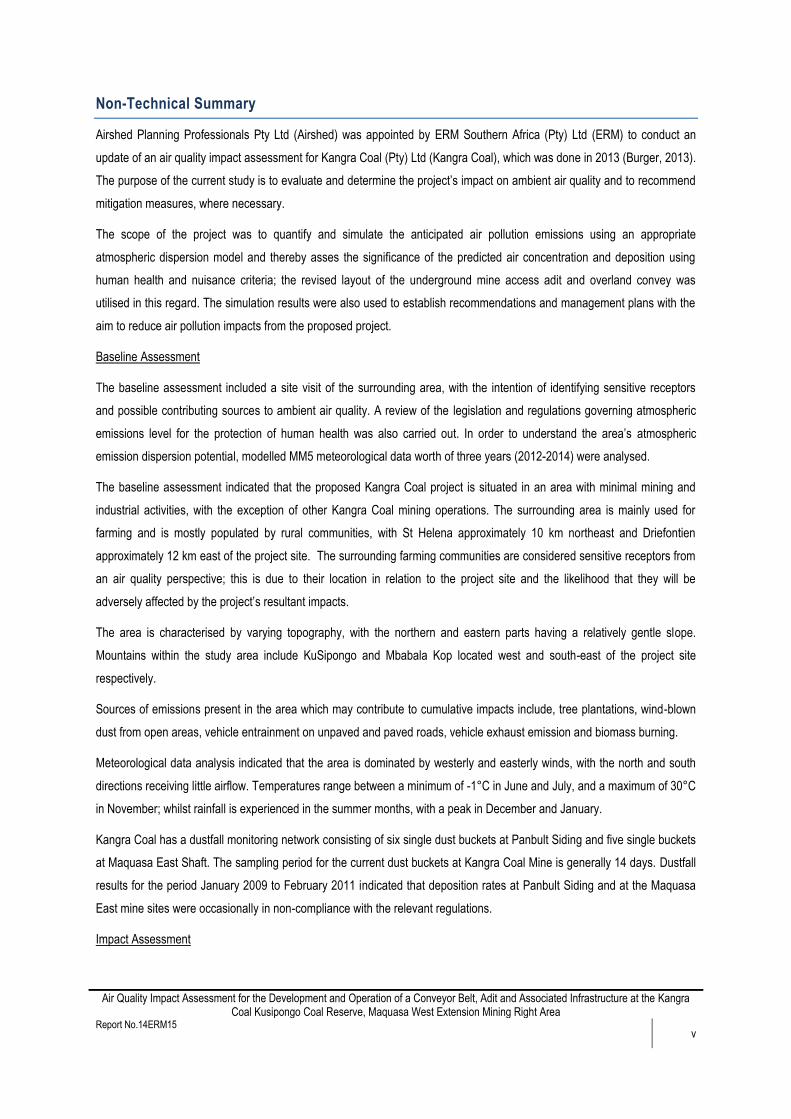
Non-Technical Summary
Airshed Planning Professionals Pty Ltd (Airshed) was appointed by ERM Southern Africa (Pty) Ltd (ERM) to conduct an
update of an air quality impact assessment for Kangra Coal (Pty) Ltd (Kangra Coal), which was done in 2013 (Burger, 2013).
The purpose of the current study is to evaluate and determine the project’s impact on ambient air quality and to recommend
mitigation measures, where necessary.
The scope of the project was to quantify and simulate the anticipated air pollution emissions using an appropriate
atmospheric dispersion model and thereby asses the significance of the predicted air concentration and deposition using
human health and nuisance criteria; the revised layout of the underground mine access adit and overland convey was
utilised in this regard. The simulation results were also used to establish recommendations and management plans with the
aim to reduce air pollution impacts from the proposed project.
Baseline Assessment
The baseline assessment included a site visit of the surrounding area, with the intention of identifying sensitive receptors
and possible contributing sources to ambient air quality. A review of the legislation and regulations governing atmospheric
emissions level for the protection of human health was also carried out. In order to understand the area’s atmospheric
emission dispersion potential, modelled MM5 meteorological data worth of three years (2012-2014) were analysed.
The baseline assessment indicated that the proposed Kangra Coal project is situated in an area with minimal mining and
industrial activities, with the exception of other Kangra Coal mining operations. The surrounding area is mainly used for
farming and is mostly populated by rural communities, with St Helena approximately 10 km northeast and Driefontien
approximately 12 km east of the project site. The surrounding farming communities are considered sensitive receptors from
an air quality perspective; this is due to their location in relation to the project site and the likelihood that they will be
adversely affected by the project’s resultant impacts.
The area is characterised by varying topography, with the northern and eastern parts having a relatively gentle slope.
Mountains within the study area include KuSipongo and Mbabala Kop located west and south-east of the project site
respectively.
Sources of emissions present in the area which may contribute to cumulative impacts include, tree plantations, wind-blown
dust from open areas, vehicle entrainment on unpaved and paved roads, vehicle exhaust emission and biomass burning.
Meteorological data analysis indicated that the area is dominated by westerly and easterly winds, with the north and south
directions receiving little airflow. Temperatures range between a minimum of -1°C in June and July, and a maximum of 30°C
in November; whilst rainfall is experienced in the summer months, with a peak in December and January.
Kangra Coal has a dustfall monitoring network consisting of six single dust buckets at Panbult Siding and five single buckets
at Maquasa East Shaft. The sampling period for the current dust buckets at Kangra Coal Mine is generally 14 days. Dustfall
results for the period January 2009 to February 2011 indicated that deposition rates at Panbult Siding and at the Maquasa
East mine sites were occasionally in non-compliance with the relevant regulations.
Impact Assessment

Air Quality Impact Assessment for the Development and Operation of a Conveyor Belt, Adit and Associated Infrastructure at the Kangra Coal Kusipongo Coal Reserve, Maquasa West Extension Mining Right Area
Report No.14ERM15 vi
Three phases of the project were taken into account – construction, operational and decommissioning phases. The
construction phase focused on emissions as a result of the establishment of the access adit and associated infrastructure,
whereas the operational phase was primarily aimed at quantifying emissions as a result of the transportation of coal from the
proposed mine shaft to the Maquasa West. A qualitative study was done for the decommissioning phase.
A comprehensive emissions inventory was compiled based on the revised mine layout, supplied mining rates and
information provided by ERM. In the quantification of emissions the National Pollutant Inventory (NPI) and United States
Environmental Protection Agency (US-EPA) emission factor document were utilised.
Particulates represent the main pollutant of concern when assessing mining operations. Airborne particulates are divided
into different particle size categories with TSP (total suspended particulates, typically less than 100m) associated with
nuisance impacts and the finer fractions of PM10 (particulate matter with an aerodynamic diameter of less than 10m) and
PM2.5 (particulate matter with an aerodynamic diameter of less than 2.5m) linked with potential health impacts. PM10 is
primarily associated with mechanically generated dust.
Dispersion modelling was used to simulate the potential for impacts on the surrounding environment and human health.
Dispersion models do not contain all the features of a real system but hold the feature of interest for management issues or
scientific problems to be solved. For the current project the US EPA AERMOD atmospheric dispersion modelling system
was utilised.
The analysis of the modelling results comprised the comparison of the predicted PM10 and PM2.5 concentrations and dustfall
levels against the National Ambient Air Quality Standards and National Dust Control Regulations. This was to determine
compliance and the potential for air quality impacts.
The emission inventory indicated that construction emissions are highly influenced by the size of the area constructed and
the duration of the operation; this therefore means that large areas constructed over an extended period of time are likely to
result in high emissions. Wind-blown dust from the conveyor was the biggest contributor to operational phase emissions,
with material handling operations having only 2% contribution across all inventoried pollutants. Emissions during the
decommissioning phase are likely to stem from vehicle entrainment on roads, wind-blown dust from exposed stockpiles and
the demolition of structures.
Simulated ground level concentrations (GLCs) as a result of the construction phase indicate that PM10 impacts are likely to
adversely affect sensitive receptors located 1 km away from the project site, more so in the south and north-west direction.
Impacts are expected to have a short duration due to the timelines of the phase.
Simulated dustfall rates resultant impacts, though still impacting on a few receptors, showed a reduced area of impact (~200
from the project site) in comparison to PM10 impacts.
Overall, the construction phase unmitigated impacts are expected to be major in significance. To ensure minimal impacts on
both human health and the environment proper and effective mitigation measures should be put in place, this will reduce the
significance of the impacts to moderate.
Simulated GLCs as a result of the operational phase indicate that resultant impacts are mostly localised - within a 300 m
radius; with areas of non- compliance more apparent around operational areas such as conveyor transfer points. Dustfall
rates indicated a similar pattern, with localised impacts.
Air Quality Impact Assessment for the Development and Operation of a Conveyor Belt, Adit and Associated Infrastructure at the Kangra Coal Kusipongo Coal Reserve, Maquasa West Extension Mining Right Area
Report No.14ERM15 vii
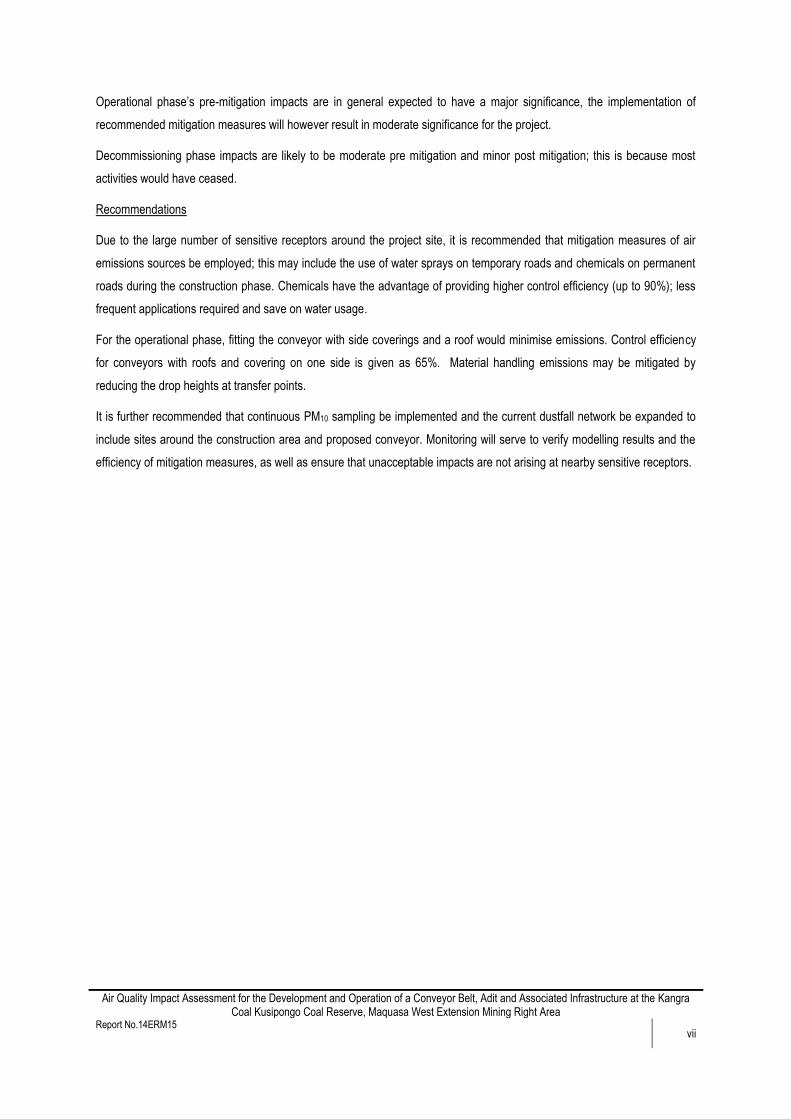
Operational phase’s pre-mitigation impacts are in general expected to have a major significance, the implementation of
recommended mitigation measures will however result in moderate significance for the project.
Decommissioning phase impacts are likely to be moderate pre mitigation and minor post mitigation; this is because most
activities would have ceased.
Recommendations
Due to the large number of sensitive receptors around the project site, it is recommended that mitigation measures of air
emissions sources be employed; this may include the use of water sprays on temporary roads and chemicals on permanent
roads during the construction phase. Chemicals have the advantage of providing higher control efficiency (up to 90%); less
frequent applications required and save on water usage.
For the operational phase, fitting the conveyor with side coverings and a roof would minimise emissions. Control efficiency
for conveyors with roofs and covering on one side is given as 65%. Material handling emissions may be mitigated by
reducing the drop heights at transfer points.
It is further recommended that continuous PM10 sampling be implemented and the current dustfall network be expanded to
include sites around the construction area and proposed conveyor. Monitoring will serve to verify modelling results and the
efficiency of mitigation measures, as well as ensure that unacceptable impacts are not arising at nearby sensitive receptors.

Air Quality Impact Assessment for the Development and Operation of a Conveyor Belt, Adit and Associated Infrastructure at the Kangra Coal Kusipongo Coal Reserve, Maquasa West Extension Mining Right Area
Report No.14ERM15 viii
Table of Contents
1 Introduction.................................................................................................................................................................... 1-1
1.1 Project Activities Description from an Air Quality Perspective ............................................................................. 1-1
1.2 Terms of Reference ............................................................................................................................................. 1-3
1.3 Approach and Methodology ................................................................................................................................. 1-4
Baseline Impact Assessment .......................................................................................................................... 1-4 1.3.1
Impact Assessment ........................................................................................................................................ 1-4 1.3.2
1.4 Assumptions, Exclusions and Limitations ............................................................................................................ 1-5
1.5 Report Outline ..................................................................................................................................................... 1-5
2 REGULATORY REQUIREMENTS AND ASSESSMENT CRITERIA ............................................................................ 2-1
2.1 Ambient Air Quality Standards for Criteria Pollutants .......................................................................................... 2-1
2.2 National Dust Control Regulations ...................................................................................................................... 2-2
2.3 Air Quality Management Plans ............................................................................................................................ 2-3
3 DESCRIPTION OF THE RECEIVING ENVIRONMENT ............................................................................................... 3-1
3.1 Topography and Environmental Setting .............................................................................................................. 3-1
3.2 Air Quality Sensitive Receptors ........................................................................................................................... 3-2
3.3 Atmospheric Dispersion Potential ........................................................................................................................ 3-4
Surface Wind Field ......................................................................................................................................... 3-4 3.3.1
Temperature ................................................................................................................................................... 3-6 3.3.2
Rainfall ............................................................................................................................................................ 3-7 3.3.3
Atmospheric Stability ...................................................................................................................................... 3-8 3.3.4
3.4 Status Quo Ambient Air Quality ......................................................................................................................... 3-11
Qualitative Assessment of Regional Sources of Pollution ............................................................................ 3-11 3.4.1
3.5 Measured Ambient Air Quality Data within the Project Site ............................................................................... 3-16
Highveld Priority Area ................................................................................................................................... 3-16 3.5.1
Kangra Coal Mine Monitoring ....................................................................................................................... 3-17 3.5.2
4 IMPACT OF PROPOSED PROJECT ON THE RECEIVING ENVIRONMENT ............................................................. 4-1
4.1 Atmospheric Emissions Inventory ....................................................................................................................... 4-1
Air Quality Impact Assessment for the Development and Operation of a Conveyor Belt, Adit and Associated Infrastructure at the Kangra Coal Kusipongo Coal Reserve, Maquasa West Extension Mining Right Area
Report No.14ERM15 ix
Construction Phase ........................................................................................................................................ 4-1 4.1.1
Operational Phase .......................................................................................................................................... 4-2 4.1.2
Decommissioning Phase ................................................................................................................................ 4-4 4.1.3
4.2 Simulation Results ............................................................................................................................................... 4-5
Construction Phase ........................................................................................................................................ 4-5 4.2.1
Operational Phase ........................................................................................................................................ 4-10 4.2.2
Decommissioning Phase .............................................................................................................................. 4-16 4.2.3
4.3 Analysis of Impacts on the Environment ........................................................................................................... 4-16
Predicted Impacts on Vegetation and Animals ............................................................................................. 4-16 4.3.1
4.4 Impact Ranking .................................................................................................................................................. 4-17
5 RECOMMEDED AIR QUALITY MEASURES ............................................................................................................... 5-1
5.1 Source Ranking ................................................................................................................................................... 5-1
Source Ranking by Emissions ........................................................................................................................ 5-1 5.1.1
Source Ranking by Impacts ............................................................................................................................ 5-1 5.1.2
5.2 Source Specific Recommended Management an Mitigation Measures .............................................................. 5-2
Construction Phase ........................................................................................................................................ 5-2 5.2.1
Operational Phase .......................................................................................................................................... 5-2 5.2.2
Decommissioning Phase ................................................................................................................................ 5-3 5.2.3
5.3 Performance Indicators ....................................................................................................................................... 5-6
Ambient Air Quality Monitoring ....................................................................................................................... 5-6 5.3.1
Visual Inspection ............................................................................................................................................. 5-8 5.3.2
Community Complaints ................................................................................................................................... 5-8 5.3.3
6 Conclusions and Recommendations ............................................................................................................................. 6-1
6.1 Main Findings ...................................................................................................................................................... 6-1
Baseline Environment ..................................................................................................................................... 6-1 6.1.1
Air Quality Impact Assessment ....................................................................................................................... 6-1 6.1.2
Monitoring ....................................................................................................................................................... 6-1 6.1.3
6.2 Conclusion ........................................................................................................................................................... 6-1
6.3 Recommendations ............................................................................................................................................... 6-1
Air Quality Impact Assessment for the Development and Operation of a Conveyor Belt, Adit and Associated Infrastructure at the Kangra Coal Kusipongo Coal Reserve, Maquasa West Extension Mining Right Area
Report No.14ERM15 x
7 References .................................................................................................................................................................... 7-1
8 Appendices.................................................................................................................................................................... 8-1
8.1 Appendix A: Fine Particulates Monitors ............................................................................................................... 8-1
Filter-based Monitors ...................................................................................................................................... 8-1 8.1.1
Non-filter-based Monitors ............................................................................................................................... 8-4 8.1.2
Data Transfer Options .................................................................................................................................... 8-5 8.1.3
8.2 Appendix B: Emission Factors and Equations ..................................................................................................... 8-6
General Construction Activities ....................................................................................................................... 8-6 8.2.1
Material Handling ............................................................................................................................................ 8-6 8.2.2
Overland Conveyor System ............................................................................................................................ 8-7 8.2.3
Air Quality Impact Assessment for the Development and Operation of a Conveyor Belt, Adit and Associated Infrastructure at the Kangra Coal Kusipongo Coal Reserve, Maquasa West Extension Mining Right Area
Report No.14ERM15 xi
List of Tables
Table 2-1: National ambient air quality standards................................................................................................................... 2-2
Table 2-2: National dust control regulations ........................................................................................................................... 2-3
Table 3-1: Atmospheric stability classes ................................................................................................................................. 3-8
Table 4-1: Kangra Coal source parameters and assumptions ................................................................................................ 4-3
Table 4-2: Kangra Coal project emission rates (tpa) .............................................................................................................. 4-4
Table 4-3: Kangra Coal project construction phase PM10 maximum GLCs at identified sensitive receptors .......................... 4-9
Table 4-4: Kangra Coal project operational phase PM10 maximum GLCs at identified sensitive receptors ......................... 4-12
Table 4-5: Kangra Coal project operational phase PM2.5 maximum GLCs at identified sensitive receptors......................... 4-15
Table 4-6: Impact characteristic terminology ........................................................................................................................ 4-17
Table 4-7: Designation definitions ......................................................................................................................................... 4-17
Table 4-8: Definition of likelihood designations..................................................................................................................... 4-18
Table 4-9: Impact significance .............................................................................................................................................. 4-20
Table 4-10: Context of significance ....................................................................................................................................... 4-20
Table 4-11: Kangra Coal mine impact rating for the construction phase (pre-mitigation) ..................................................... 4-21
Table 4-12: Kangra Coal mine impact rating for the construction phase (post-mitigation) ................................................... 4-22
Table 4-13: Kangra Coal mine impact rating for the operational phase (pre-mitigation) ...................................................... 4-23
Table 4-14: Kangra Coal mine impact rating for the operational phase (post-mitigation) ..................................................... 4-24
Table 4-15: Kangra Coal mine impact rating for the decommissioning phase (pre-mitigation) ............................................ 4-25
Table 4-16: Kangra Coal mine impact rating for the decommissioning phase (pre-mitigation) ............................................ 4-26
Table 5-1: Summary of conveyor belt emission reduction (NPI 2001) .................................................................................... 5-2
Table 5-2: Kangra Coal project impacts mitigation measure per source group and project phase ........................................ 5-4
Table 8-1: Comparison of TEOM and BAM performance ....................................................................................................... 8-3
Air Quality Impact Assessment for the Development and Operation of a Conveyor Belt, Adit and Associated Infrastructure at the Kangra Coal Kusipongo Coal Reserve, Maquasa West Extension Mining Right Area
Report No.14ERM15 xii
List of Figures
Figure 1-1: Location of mine site infrastructure....................................................................................................................... 1-2
Figure 3-1: Topography of the area surrounding the project site ............................................................................................ 3-1
Figure 3-2: Location of sensitive receptors in the study area. ................................................................................................ 3-2
Figure 3-3: Rural farming community in close proximity to the proposed site ........................................................................ 3-3
Figure 3-4: Closest formal residential area (St. Helena) less than 10km north-east of the proposed project site .................. 3-3
Figure 3-5: Period, day-time and night-time wind roses (MM5 data 2012 – 2014) ................................................................. 3-5
Figure 3-6: Seasonal wind roses (MM5 data 2012 – 2014) .................................................................................................... 3-6
Figure 3-7: Monthly temperature pattern for the project site (MM5 Data: 2012 to 2014) ........................................................ 3-7
Figure 3-8: Rainfall pattern for the project site (MM5 Data: 2012 to 2014) ............................................................................. 3-8
Figure 3-9: Diurnal variation in atmospheric stability as described by Monin-Obukhov length and mixing height (MM5 Data
2012– 2014) .......................................................................................................................................................................... 3-10
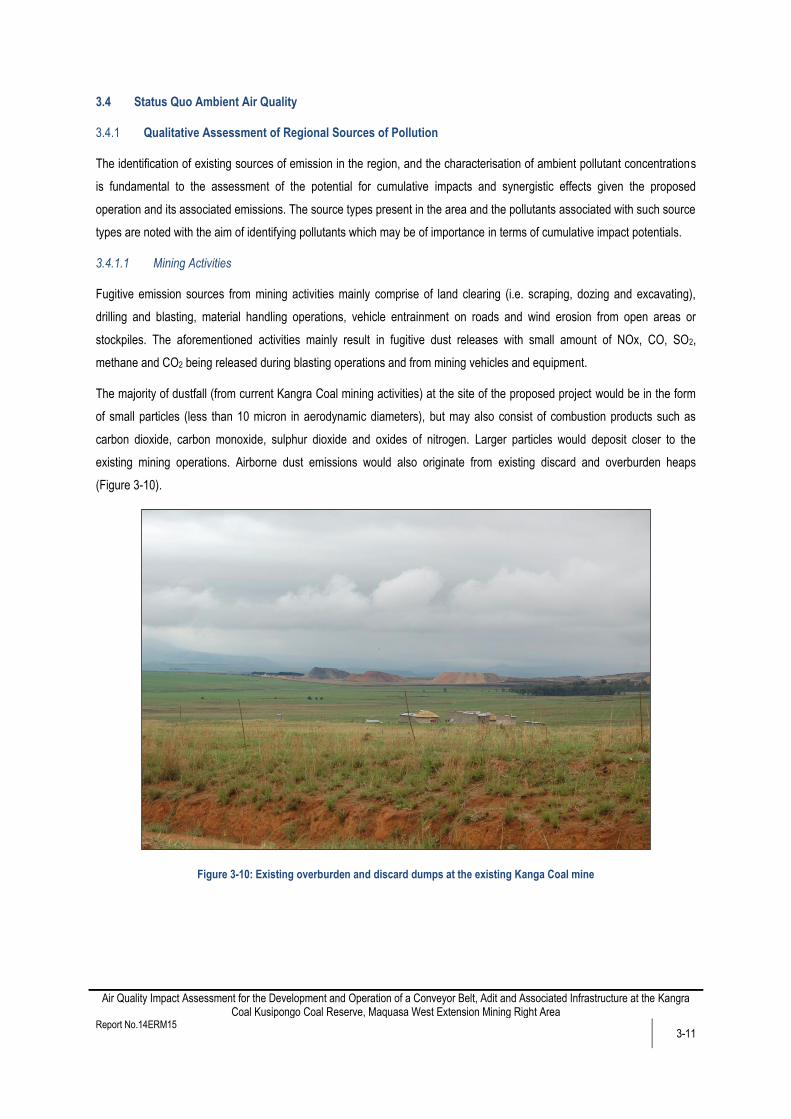
Figure 3-10: Existing overburden and discard dumps at the existing Kanga Coal mine ....................................................... 3-11
Figure 3-11: Tree plantations between the proposed project site and Panbult Siding.......................................................... 3-12
Figure 3-12: Cultivation of land in the vicinity of the project site ........................................................................................... 3-13
Figure 3-13: Exposed agricultural areas prone to wind erosion ............................................................................................ 3-13
Figure 3-14: Dust mitigation (water spraying) on public roads to Panbult Siding ................................................................. 3-14
Figure 3-15: Mud Carry-over from Panbult Siding onto Public Road .................................................................................... 3-15
Figure 3-16: Modelled frequency of exceedance of 24-hour ambient PM10 standards in the HPA, indicating the air quality
Hot Spot areas (DEA 2011). ................................................................................................................................................. 3-17
Figure 3-17: Dustfall monitoring network at Panbult Siding .................................................................................................. 3-18
Figure 3-18: Dustfall monitoring network at Kangra Coal mine ............................................................................................ 3-18
Figure 4-1: Kangra Coal project simulated PM10 annual average GLCs (construction phase) ............................................... 4-7
Figure 4-2: Kangra Coal project simulated PM10 NAAQS daily frequency of exceedance (construction phase) .................... 4-7
Figure 4-3: Kangra Coal project simulated dustfall rates (construction phase) ...................................................................... 4-8
Figure 4-4: Kangra Coal project simulated PM10 annual average GLCs (operational phase) .............................................. 4-11
Figure 4-5: Kangra Coal project simulated PM10 NAAQS daily frequency of exceedance (operational phase) ................... 4-11
Figure 4-6: Kangra Coal project simulated PM2.5 annual average GLCs (operational phase) .............................................. 4-13
Figure 4-7: Kangra Coal project simulated PM2.5 NAAQS daily frequency of exceedance (operational phase)................... 4-13

Air Quality Impact Assessment for the Development and Operation of a Conveyor Belt, Adit and Associated Infrastructure at the Kangra Coal Kusipongo Coal Reserve, Maquasa West Extension Mining Right Area
Report No.14ERM15 xiii
Figure 4-8: Kangra Coal project simulated dustfall rates (operational phase) ...................................................................... 4-14
Figure 5-1: Kangra Coal mine indicative monitoring network ................................................................................................. 5-7
Figure 8-1: Partisol-Plus Sequential Air Sampler .................................................................................................................... 8-1
Figure 8-2: TEOM sampler linked to the ACCUTM conditional sampling system .................................................................... 8-4
Air Quality Impact Assessment for the Development and Operation of a Conveyor Belt, Adit and Associated Infrastructure at the Kangra Coal Kusipongo Coal Reserve, Maquasa West Extension Mining Right Area
Report No.14ERM15 1-1
1 INTRODUCTION
Airshed Planning Professionals Pty Ltd (Airshed) was appointed by ERM Southern Africa (Pty) Ltd (ERM) to conduct an
update of an air quality impact assessment for Kangra Coal (Pty) Ltd (Kangra Coal) which was done on 2013 (Burger,
2013). The purpose of the current study is to evaluate and determine the project’s impact on ambient air quality and to
recommend mitigation measures, where necessary.
In the original project Kangra Coal considered expanding their coal mining operations at the Savmore Colliery, located within
the Mkhondo and Dr Pixley Ka lsaka Seme Local Municipalities (which form part of the Gert Sibande District Municipality) in
Mpumalanga, which is approximately 51 km west-south-west from Piet Retief and 64 km south east from Ermelo.
The expansion was proposed to include the Kusipongo coal resource, situated to the west of existing operations. The
proposed project in the Mining Right Application (MRA) was restricted to underground mining and some surface
infrastructure to support this underground expansion. Although there were a number of adits, the assessment focused only
on Adit A, which would have been the entrance to the proposed underground mine. The Adit A footprint would’ve also
included offices, workshops, stores, change house, silos, etc. In addition to Adit A, the assessment also included the impact
of emissions from an overland conveyor system, which would have been used to transport coal from the underground
operations at the proposed Adit A to the existing Maquasa West Adit conveyor system.
The MRA for the Kusipongo reserve was however rejected by the Department of Mineral Resources (DMR); Kangra Coal
subsequently revised their layout to move the surface infrastructure to an area within the Maquasa West Extension. The
current project therefore focuses on undertaking an air quality impact assessment with the revised layout, as well as Section
102 amendment related to establishing the surface infrastructure within the existing mining right area on Maquasa West
Extension.
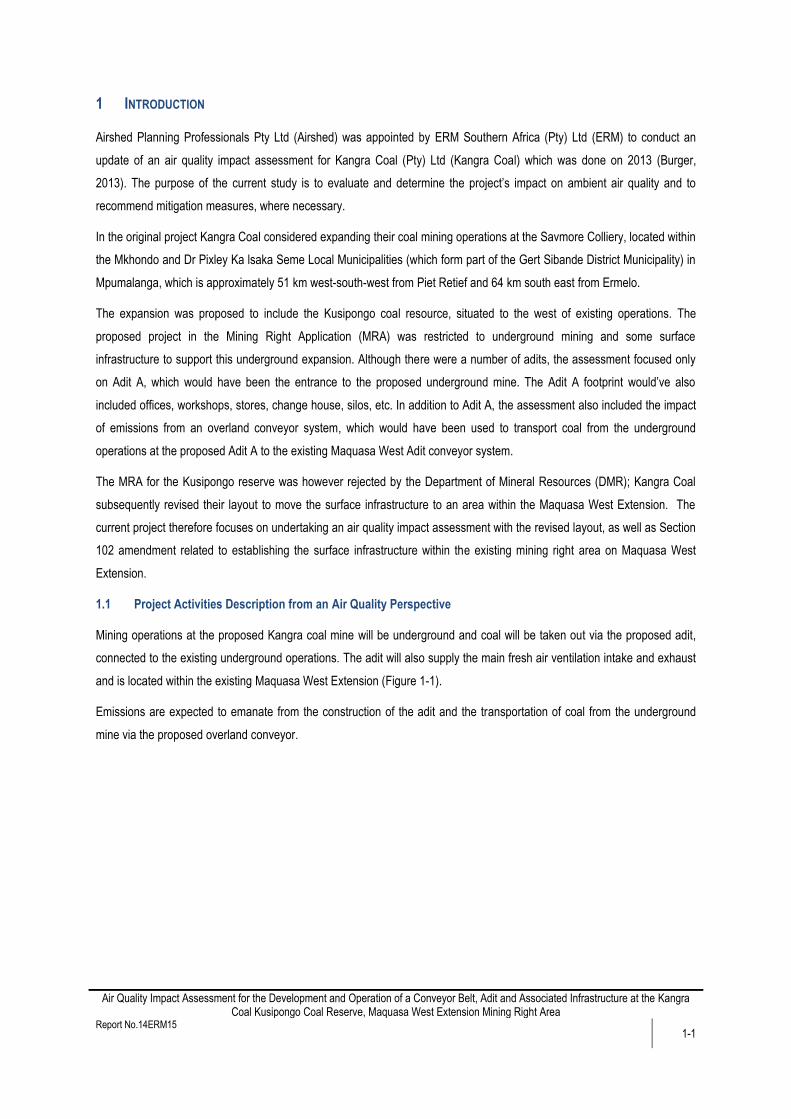
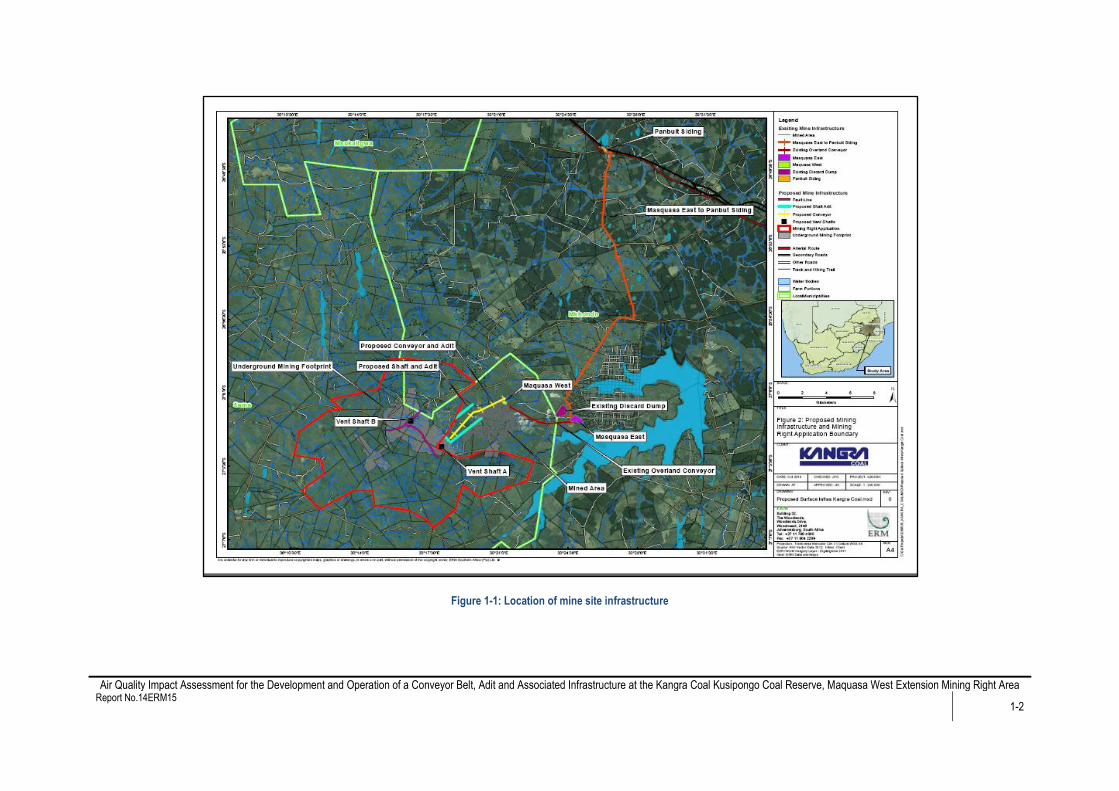
1.1 Project Activities Description from an Air Quality Perspective
Mining operations at the proposed Kangra coal mine will be underground and coal will be taken out via the proposed adit,
connected to the existing underground operations. The adit will also supply the main fresh air ventilation intake and exhaust
and is located within the existing Maquasa West Extension (Figure 1-1).
Emissions are expected to emanate from the construction of the adit and the transportation of coal from the underground
mine via the proposed overland conveyor.
Air Quality Impact Assessment for the Development and Operation of a Conveyor Belt, Adit and Associated Infrastructure at the Kangra Coal Kusipongo Coal Reserve, Maquasa West Extension Mining Right Area Report No.14ERM15
1-2
Figure 1-1: Location of mine site infrastructure
Air Quality Impact Assessment for the Development and Operation of a Conveyor Belt, Adit and Associated Infrastructure at the Kangra Coal Kusipongo Coal Reserve, Maquasa West Extension Mining Right Area
Report No.14ERM15 1-3
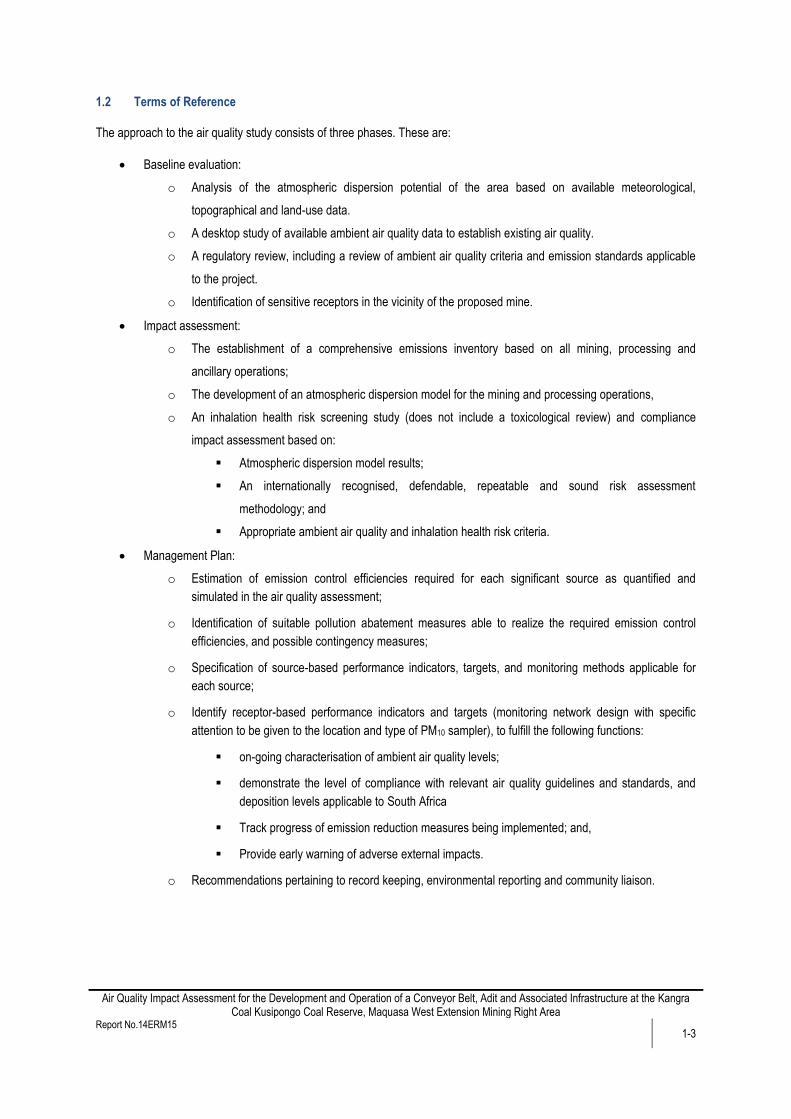
1.2 Terms of Reference
The approach to the air quality study consists of three phases. These are:
Baseline evaluation:
o Analysis of the atmospheric dispersion potential of the area based on available meteorological,
topographical and land-use data.
o A desktop study of available ambient air quality data to establish existing air quality.
o A regulatory review, including a review of ambient air quality criteria and emission standards applicable
to the project.
o Identification of sensitive receptors in the vicinity of the proposed mine.
Impact assessment:
o The establishment of a comprehensive emissions inventory based on all mining, processing and
ancillary operations;
o The development of an atmospheric dispersion model for the mining and processing operations,
o An inhalation health risk screening study (does not include a toxicological review) and compliance
impact assessment based on:
Atmospheric dispersion model results;
An internationally recognised, defendable, repeatable and sound risk assessment
methodology; and
Appropriate ambient air quality and inhalation health risk criteria.
Management Plan:
o Estimation of emission control efficiencies required for each significant source as quantified and
simulated in the air quality assessment;
o Identification of suitable pollution abatement measures able to realize the required emission control
efficiencies, and possible contingency measures;
o Specification of source-based performance indicators, targets, and monitoring methods applicable for
each source;
o Identify receptor-based performance indicators and targets (monitoring network design with specific
attention to be given to the location and type of PM10 sampler), to fulfill the following functions:
on-going characterisation of ambient air quality levels;
demonstrate the level of compliance with relevant air quality guidelines and standards, and
deposition levels applicable to South Africa
Track progress of emission reduction measures being implemented; and,
Provide early warning of adverse external impacts.
o Recommendations pertaining to record keeping, environmental reporting and community liaison.
Air Quality Impact Assessment for the Development and Operation of a Conveyor Belt, Adit and Associated Infrastructure at the Kangra Coal Kusipongo Coal Reserve, Maquasa West Extension Mining Right Area
Report No.14ERM15 1-4
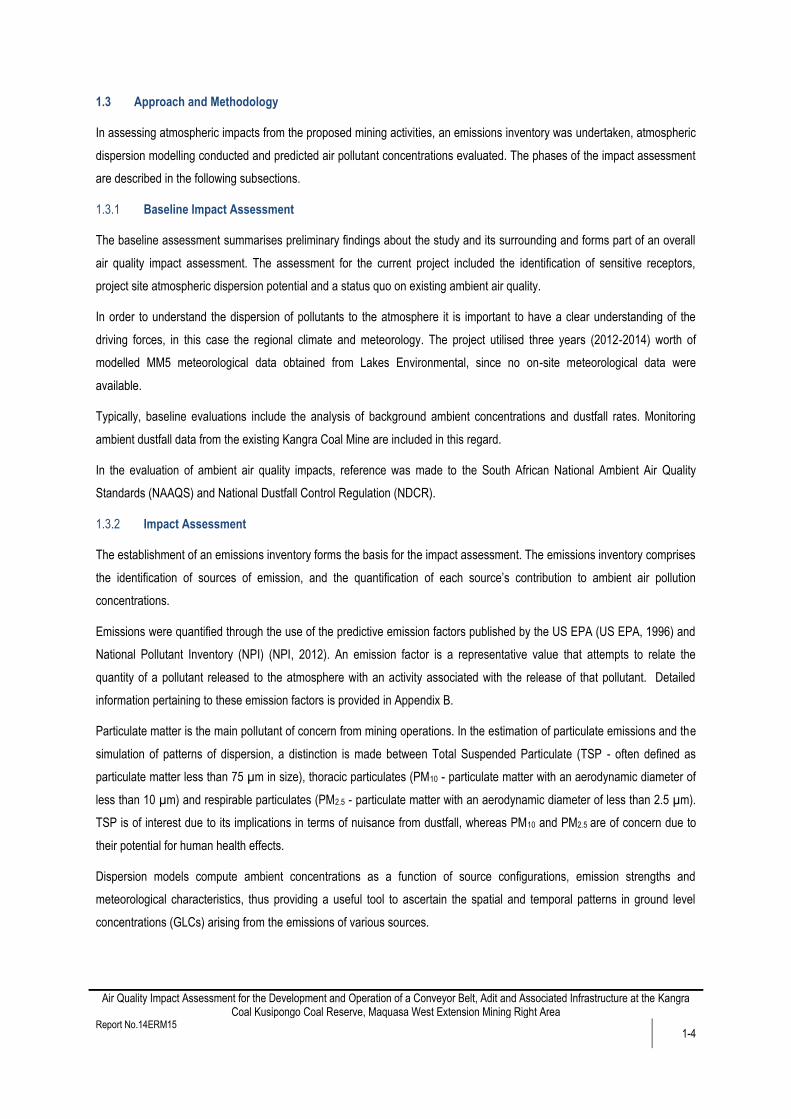
1.3 Approach and Methodology
In assessing atmospheric impacts from the proposed mining activities, an emissions inventory was undertaken, atmospheric
dispersion modelling conducted and predicted air pollutant concentrations evaluated. The phases of the impact assessment
are described in the following subsections.
Baseline Impact Assessment 1.3.1
The baseline assessment summarises preliminary findings about the study and its surrounding and forms part of an overall
air quality impact assessment. The assessment for the current project included the identification of sensitive receptors,
project site atmospheric dispersion potential and a status quo on existing ambient air quality.
In order to understand the dispersion of pollutants to the atmosphere it is important to have a clear understanding of the
driving forces, in this case the regional climate and meteorology. The project utilised three years (2012-2014) worth of
modelled MM5 meteorological data obtained from Lakes Environmental, since no on-site meteorological data were
available.
Typically, baseline evaluations include the analysis of background ambient concentrations and dustfall rates. Monitoring
ambient dustfall data from the existing Kangra Coal Mine are included in this regard.
In the evaluation of ambient air quality impacts, reference was made to the South African National Ambient Air Quality
Standards (NAAQS) and National Dustfall Control Regulation (NDCR).
Impact Assessment 1.3.2
The establishment of an emissions inventory forms the basis for the impact assessment. The emissions inventory comprises
the identification of sources of emission, and the quantification of each source’s contribution to ambient air pollution
concentrations.
Emissions were quantified through the use of the predictive emission factors published by the US EPA (US EPA, 1996) and
National Pollutant Inventory (NPI) (NPI, 2012). An emission factor is a representative value that attempts to relate the
quantity of a pollutant released to the atmosphere with an activity associated with the release of that pollutant. Detailed
information pertaining to these emission factors is provided in Appendix B.
Particulate matter is the main pollutant of concern from mining operations. In the estimation of particulate emissions and the
simulation of patterns of dispersion, a distinction is made between Total Suspended Particulate (TSP - often defined as
particulate matter less than 75 µm in size), thoracic particulates (PM10 - particulate matter with an aerodynamic diameter of
less than 10 µm) and respirable particulates (PM2.5 - particulate matter with an aerodynamic diameter of less than 2.5 µm).
TSP is of interest due to its implications in terms of nuisance from dustfall, whereas PM10 and PM2.5 are of concern due to
their potential for human health effects.
Dispersion models compute ambient concentrations as a function of source configurations, emission strengths and
meteorological characteristics, thus providing a useful tool to ascertain the spatial and temporal patterns in ground level
concentrations (GLCs) arising from the emissions of various sources.
Air Quality Impact Assessment for the Development and Operation of a Conveyor Belt, Adit and Associated Infrastructure at the Kangra Coal Kusipongo Coal Reserve, Maquasa West Extension Mining Right Area
Report No.14ERM15 1-5
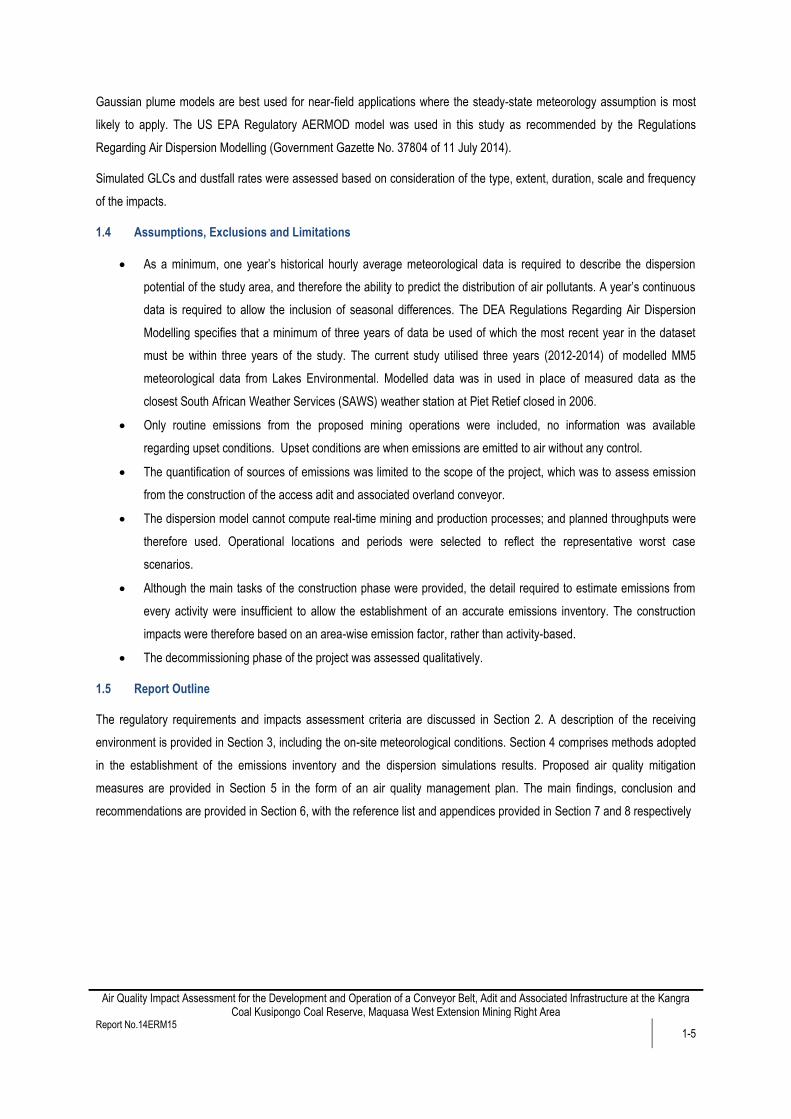
Gaussian plume models are best used for near-field applications where the steady-state meteorology assumption is most
likely to apply. The US EPA Regulatory AERMOD model was used in this study as recommended by the Regulations
Regarding Air Dispersion Modelling (Government Gazette No. 37804 of 11 July 2014).
Simulated GLCs and dustfall rates were assessed based on consideration of the type, extent, duration, scale and frequency
of the impacts.
1.4 Assumptions, Exclusions and Limitations
As a minimum, one year’s historical hourly average meteorological data is required to describe the dispersion
potential of the study area, and therefore the ability to predict the distribution of air pollutants. A year’s continuous
data is required to allow the inclusion of seasonal differences. The DEA Regulations Regarding Air Dispersion
Modelling specifies that a minimum of three years of data be used of which the most recent year in the dataset
must be within three years of the study. The current study utilised three years (2012-2014) of modelled MM5
meteorological data from Lakes Environmental. Modelled data was in used in place of measured data as the
closest South African Weather Services (SAWS) weather station at Piet Retief closed in 2006.
Only routine emissions from the proposed mining operations were included, no information was available
regarding upset conditions. Upset conditions are when emissions are emitted to air without any control.
The quantification of sources of emissions was limited to the scope of the project, which was to assess emission
from the construction of the access adit and associated overland conveyor.
The dispersion model cannot compute real-time mining and production processes; and planned throughputs were
therefore used. Operational locations and periods were selected to reflect the representative worst case
scenarios.
Although the main tasks of the construction phase were provided, the detail required to estimate emissions from
every activity were insufficient to allow the establishment of an accurate emissions inventory. The construction
impacts were therefore based on an area-wise emission factor, rather than activity-based.
The decommissioning phase of the project was assessed qualitatively.
1.5 Report Outline
The regulatory requirements and impacts assessment criteria are discussed in Section 2. A description of the receiving
environment is provided in Section 3, including the on-site meteorological conditions. Section 4 comprises methods adopted
in the establishment of the emissions inventory and the dispersion simulations results. Proposed air quality mitigation
measures are provided in Section 5 in the form of an air quality management plan. The main findings, conclusion and
recommendations are provided in Section 6, with the reference list and appendices provided in Section 7 and 8 respectively
Air Quality Impact Assessment for the Development and Operation of a Conveyor Belt, Adit and Associated Infrastructure at the Kangra Coal Kusipongo Coal Reserve, Maquasa West Extension Mining Right Area
Report No.14ERM15 2-1
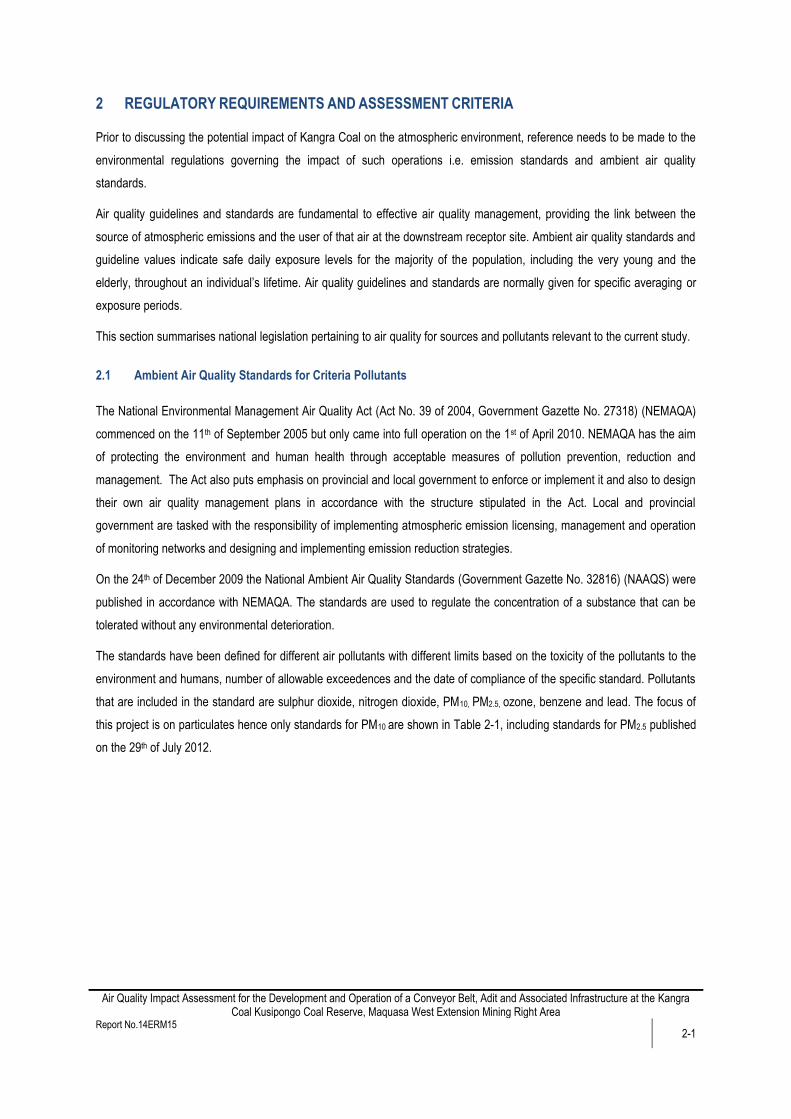
2 REGULATORY REQUIREMENTS AND ASSESSMENT CRITERIA
Prior to discussing the potential impact of Kangra Coal on the atmospheric environment, reference needs to be made to the
environmental regulations governing the impact of such operations i.e. emission standards and ambient air quality
standards.
Air quality guidelines and standards are fundamental to effective air quality management, providing the link between the
source of atmospheric emissions and the user of that air at the downstream receptor site. Ambient air quality standards and
guideline values indicate safe daily exposure levels for the majority of the population, including the very young and the
elderly, throughout an individual’s lifetime. Air quality guidelines and standards are normally given for specific averaging or
exposure periods.
This section summarises national legislation pertaining to air quality for sources and pollutants relevant to the current study.
2.1 Ambient Air Quality Standards for Criteria Pollutants
The National Environmental Management Air Quality Act (Act No. 39 of 2004, Government Gazette No. 27318) (NEMAQA)
commenced on the 11th of September 2005 but only came into full operation on the 1st of April 2010. NEMAQA has the aim
of protecting the environment and human health through acceptable measures of pollution prevention, reduction and
management. The Act also puts emphasis on provincial and local government to enforce or implement it and also to design
their own air quality management plans in accordance with the structure stipulated in the Act. Local and provincial
government are tasked with the responsibility of implementing atmospheric emission licensing, management and operation
of monitoring networks and designing and implementing emission reduction strategies.
On the 24th of December 2009 the National Ambient Air Quality Standards (Government Gazette No. 32816) (NAAQS) were
published in accordance with NEMAQA. The standards are used to regulate the concentration of a substance that can be
tolerated without any environmental deterioration.
The standards have been defined for different air pollutants with different limits based on the toxicity of the pollutants to the
environment and humans, number of allowable exceedences and the date of compliance of the specific standard. Pollutants
that are included in the standard are sulphur dioxide, nitrogen dioxide, PM10, PM2.5, ozone, benzene and lead. The focus of
this project is on particulates hence only standards for PM10 are shown in Table 2-1, including standards for PM2.5 published
on the 29th of July 2012.
Air Quality Impact Assessment for the Development and Operation of a Conveyor Belt, Adit and Associated Infrastructure at the Kangra Coal Kusipongo Coal Reserve, Maquasa West Extension Mining Right Area
Report No.14ERM15 2-2
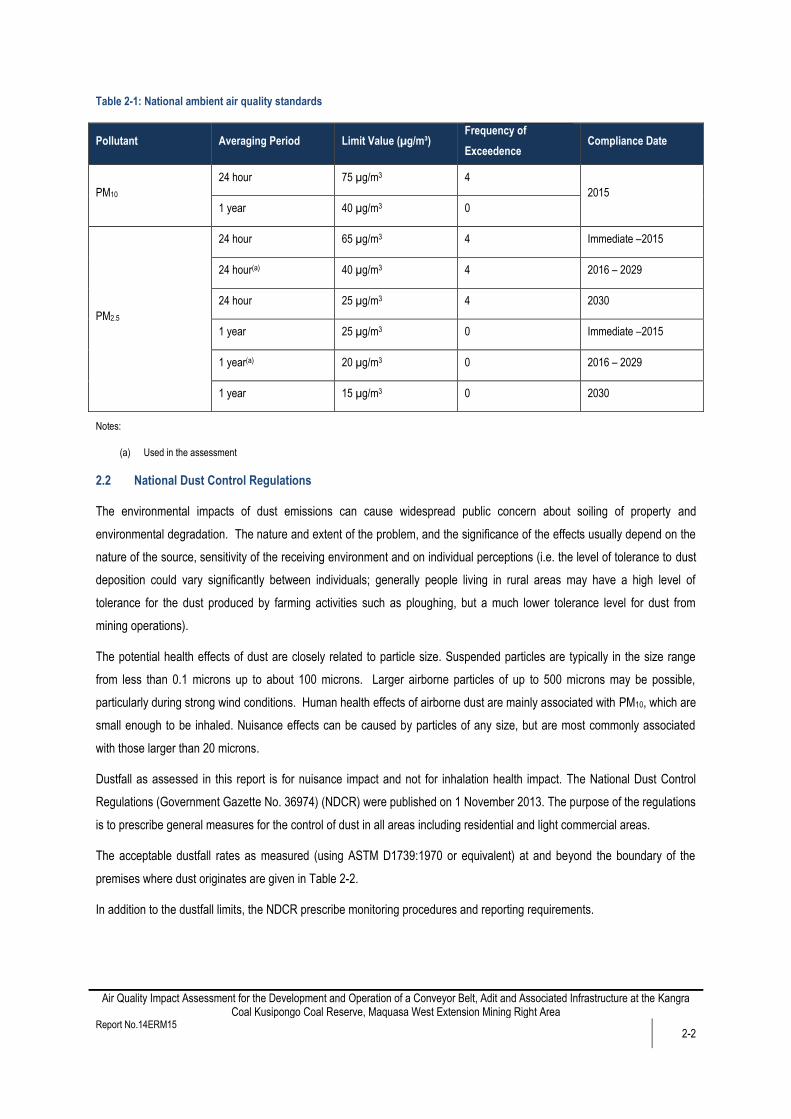
Table 2-1: National ambient air quality standards
Pollutant Averaging Period Limit Value (µg/m³) Frequency of
Exceedence Compliance Date
PM10
24 hour 75 µg/m3 4
2015
1 year 40 µg/m3 0
PM2.5
24 hour 65 µg/m3 4 Immediate –2015
24 hour(a) 40 µg/m3 4 2016 – 2029
24 hour 25 µg/m3 4 2030
1 year 25 µg/m3 0 Immediate –2015
1 year(a) 20 µg/m3 0 2016 – 2029
1 year 15 µg/m3 0 2030
Notes:
(a) Used in the assessment
2.2 National Dust Control Regulations
The environmental impacts of dust emissions can cause widespread public concern about soiling of property and
environmental degradation. The nature and extent of the problem, and the significance of the effects usually depend on the
nature of the source, sensitivity of the receiving environment and on individual perceptions (i.e. the level of tolerance to dust
deposition could vary significantly between individuals; generally people living in rural areas may have a high level of
tolerance for the dust produced by farming activities such as ploughing, but a much lower tolerance level for dust from
mining operations).
The potential health effects of dust are closely related to particle size. Suspended particles are typically in the size range
from less than 0.1 microns up to about 100 microns. Larger airborne particles of up to 500 microns may be possible,
particularly during strong wind conditions. Human health effects of airborne dust are mainly associated with PM10, which are
small enough to be inhaled. Nuisance effects can be caused by particles of any size, but are most commonly associated
with those larger than 20 microns.
Dustfall as assessed in this report is for nuisance impact and not for inhalation health impact. The National Dust Control
Regulations (Government Gazette No. 36974) (NDCR) were published on 1 November 2013. The purpose of the regulations
is to prescribe general measures for the control of dust in all areas including residential and light commercial areas.
The acceptable dustfall rates as measured (using ASTM D1739:1970 or equivalent) at and beyond the boundary of the
premises where dust originates are given in Table 2-2.
In addition to the dustfall limits, the NDCR prescribe monitoring procedures and reporting requirements.
Air Quality Impact Assessment for the Development and Operation of a Conveyor Belt, Adit and Associated Infrastructure at the Kangra Coal Kusipongo Coal Reserve, Maquasa West Extension Mining Right Area
Report No.14ERM15 2-3
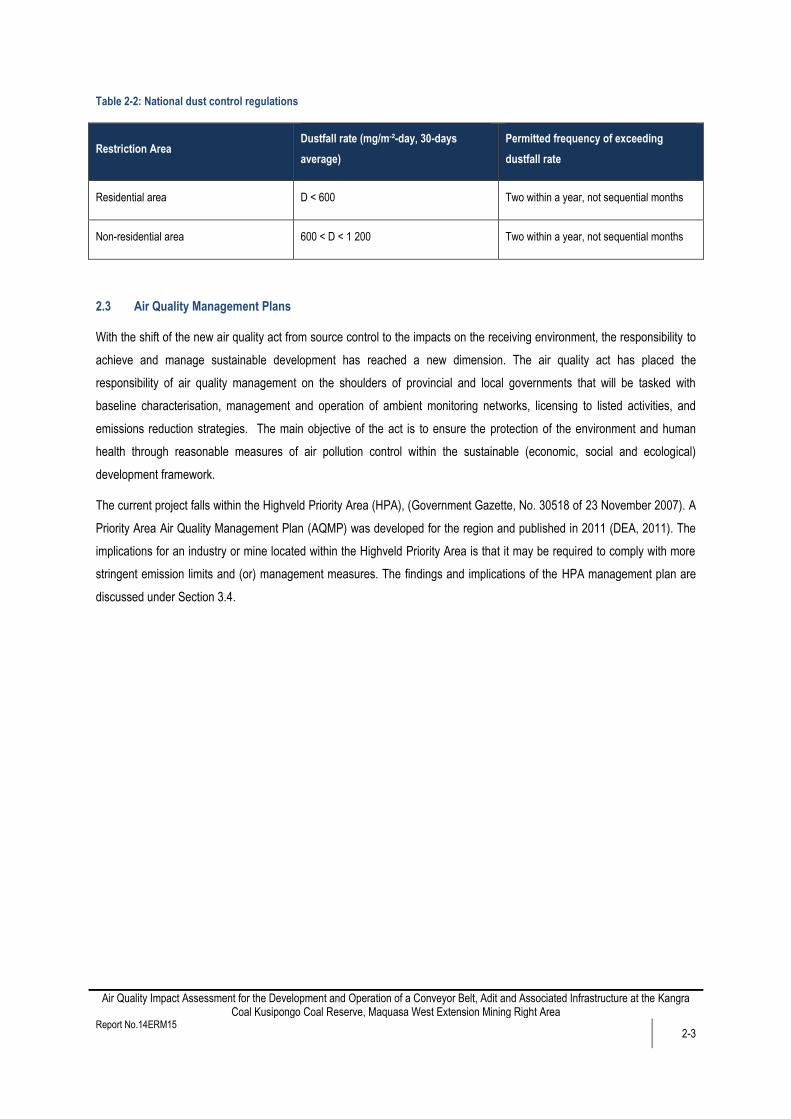
Table 2-2: National dust control regulations
Restriction Area Dustfall rate (mg/m-²-day, 30-days
average)
Permitted frequency of exceeding
dustfall rate
Residential area D < 600 Two within a year, not sequential months
Non-residential area 600 < D < 1 200 Two within a year, not sequential months
2.3 Air Quality Management Plans
With the shift of the new air quality act from source control to the impacts on the receiving environment, the responsibility to
achieve and manage sustainable development has reached a new dimension. The air quality act has placed the
responsibility of air quality management on the shoulders of provincial and local governments that will be tasked with
baseline characterisation, management and operation of ambient monitoring networks, licensing to listed activities, and
emissions reduction strategies. The main objective of the act is to ensure the protection of the environment and human
health through reasonable measures of air pollution control within the sustainable (economic, social and ecological)
development framework.
The current project falls within the Highveld Priority Area (HPA), (Government Gazette, No. 30518 of 23 November 2007). A
Priority Area Air Quality Management Plan (AQMP) was developed for the region and published in 2011 (DEA, 2011). The
implications for an industry or mine located within the Highveld Priority Area is that it may be required to comply with more
stringent emission limits and (or) management measures. The findings and implications of the HPA management plan are
discussed under Section 3.4.
Air Quality Impact Assessment for the Development and Operation of a Conveyor Belt, Adit and Associated Infrastructure at the Kangra Coal Kusipongo Coal Reserve, Maquasa West Extension Mining Right Area
Report No.14ERM15 3-1
3 DESCRIPTION OF THE RECEIVING ENVIRONMENT
The baseline air quality assessment characterises further details about:
Topography and environmental setting
Sensitive receptors
Atmospheric dispersion potential
Status quo ambient air quality
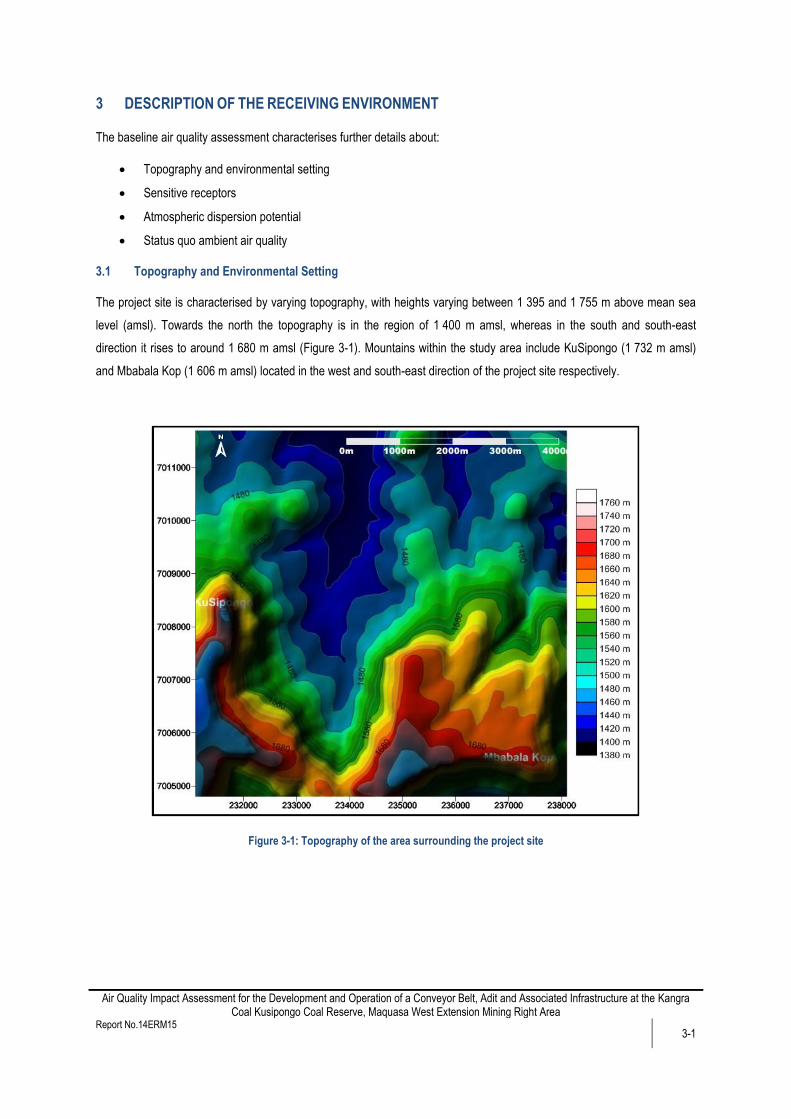
3.1 Topography and Environmental Setting
The project site is characterised by varying topography, with heights varying between 1 395 and 1 755 m above mean sea
level (amsl). Towards the north the topography is in the region of 1 400 m amsl, whereas in the south and south-east
direction it rises to around 1 680 m amsl (Figure 3-1). Mountains within the study area include KuSipongo (1 732 m amsl)
and Mbabala Kop (1 606 m amsl) located in the west and south-east direction of the project site respectively.
Figure 3-1: Topography of the area surrounding the project site
Air Quality Impact Assessment for the Development and Operation of a Conveyor Belt, Adit and Associated Infrastructure at the Kangra Coal Kusipongo Coal Reserve, Maquasa West Extension Mining Right Area
Report No.14ERM15 3-2
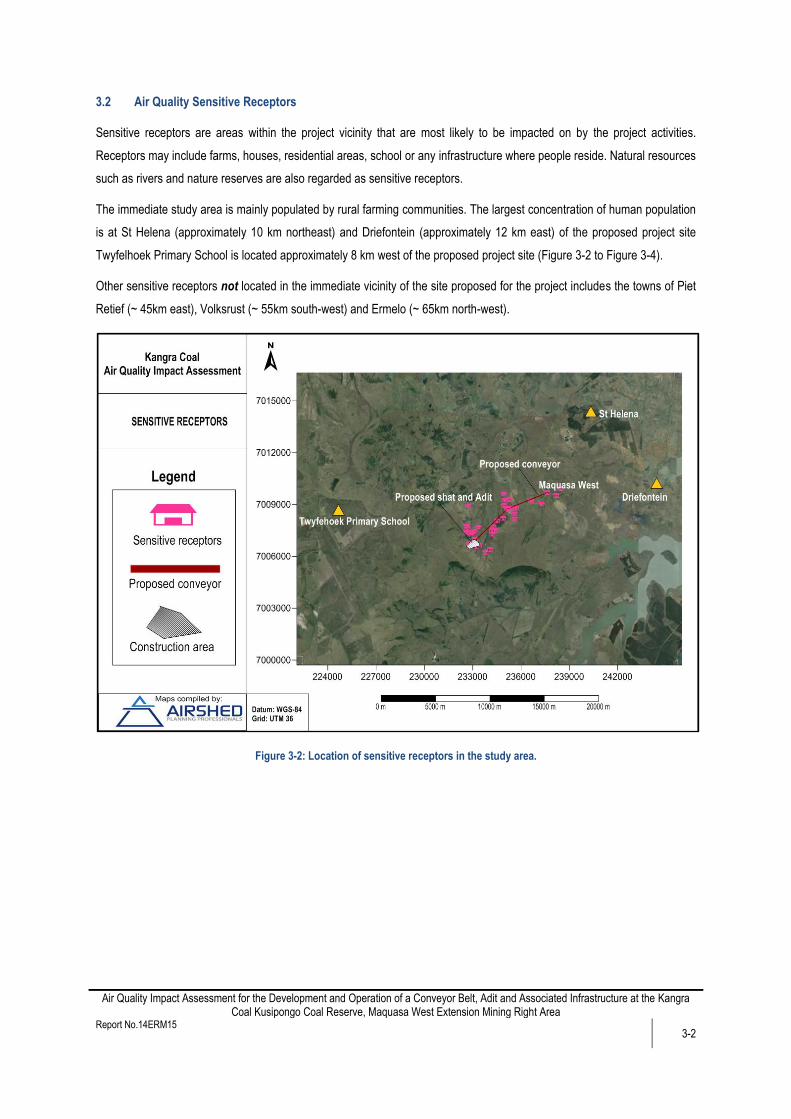
3.2 Air Quality Sensitive Receptors
Sensitive receptors are areas within the project vicinity that are most likely to be impacted on by the project activities.
Receptors may include farms, houses, residential areas, school or any infrastructure where people reside. Natural resources
such as rivers and nature reserves are also regarded as sensitive receptors.
The immediate study area is mainly populated by rural farming communities. The largest concentration of human population
is at St Helena (approximately 10 km northeast) and Driefontein (approximately 12 km east) of the proposed project site
Twyfelhoek Primary School is located approximately 8 km west of the proposed project site (Figure 3-2 to Figure 3-4).
Other sensitive receptors not located in the immediate vicinity of the site proposed for the project includes the towns of Piet
Retief (~ 45km east), Volksrust (~ 55km south-west) and Ermelo (~ 65km north-west).
Figure 3-2: Location of sensitive receptors in the study area.

Air Quality Impact Assessment for the Development and Operation of a Conveyor Belt, Adit and Associated Infrastructure at the Kangra Coal Kusipongo Coal Reserve, Maquasa West Extension Mining Right Area
Report No.14ERM15 3-3
Figure 3-3: Rural farming community in close proximity to the proposed site
Figure 3-4: Closest formal residential area (St. Helena) less than 10km north-east of the proposed project site

Air Quality Impact Assessment for the Development and Operation of a Conveyor Belt, Adit and Associated Infrastructure at the Kangra Coal Kusipongo Coal Reserve, Maquasa West Extension Mining Right Area
Report No.14ERM15 3-4
3.3 Atmospheric Dispersion Potential
In order to understand and assess the possible impacts on the surrounding environment and human health, it is necessary
to understand the regional climate and local air dispersion potential of the area.
Meteorological characteristics of a site govern the dispersion, transformation and eventual removal of pollutants from the
atmosphere (Pasquill and Smith, 1983; Godish, 1990). Dispersion potential refers to the ability of pollutants to spread in
different directions and therefore to different locations. Dispersion potential can be observed both horizontally and vertically
and is dependent on the degree of thermal and mechanical turbulence within the earth’s boundary layer. Wind field largely
facilitates horizontal dispersion leading to wind speed determining both the distance of downward transport and dilution of
pollutants as a result of plume stretching. Vertical dispersion is facilitated by atmospheric stability and the depth of the
surface mixing layers. The generation of mechanical turbulence is similarly a function of the wind speed coupled with
surface roughness.
Pollution concentration levels fluctuate in response to changes in atmospheric stability, to concurrent variations in the mixing
depth, and to shifts in the wind field. Spatial variations, and diurnal and seasonal changes, in the wind field and stability
regime are functions of atmospheric processes operating at various temporal and spatial scales (Goldreich and Tyson,
1988). Atmospheric processes at macro- and meso-scales need therefore be taken into account in order to accurately
parameterise the atmospheric dispersion potential of a particular area.
Parameters that need to be taken into account in the characterisation of meso-scale ventilation potentials include wind
speed, wind direction, extent of atmospheric turbulence, ambient air temperature and mixing depth. Modelled MM5
meteorological data for a period of three years was used in the study in the absence of on-site data.
Surface Wind Field 3.3.1
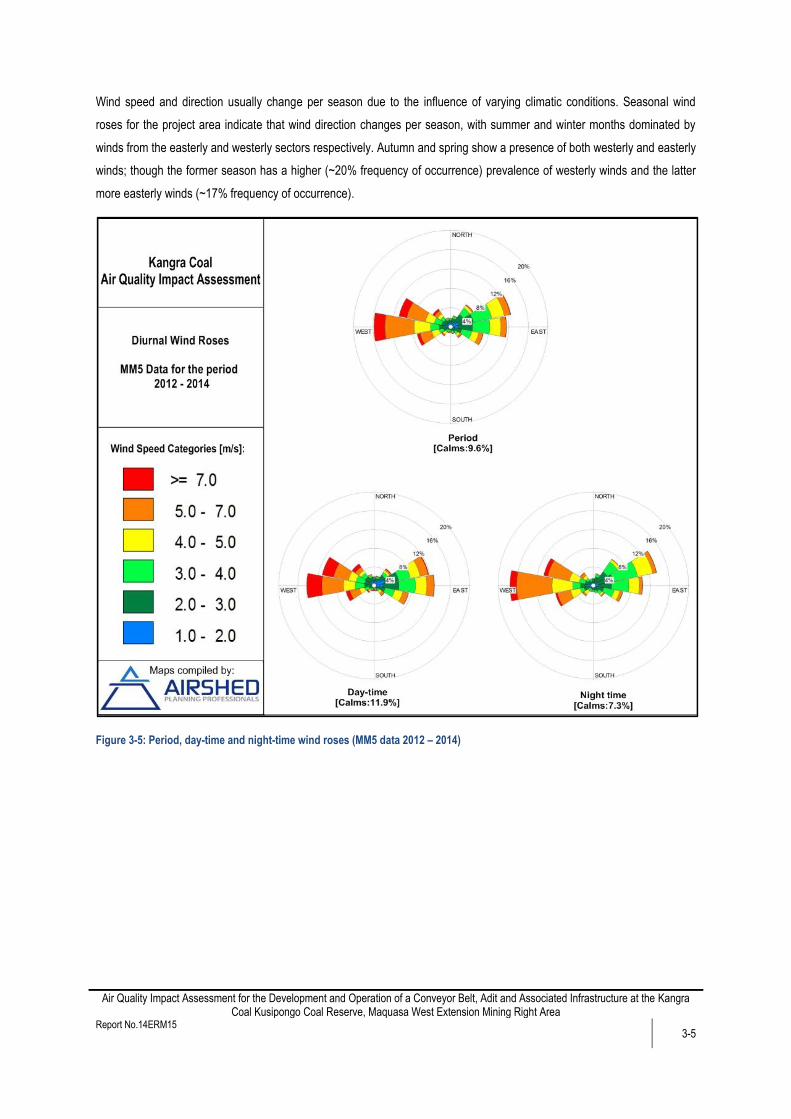
The current project utilised Lakes WR plot view program to produce wind roses from Lakes MM5 meteorological data. Wind
roses comprise 16 spokes, which represent the direction from which winds blew during a specific period. The colours
indicate wind speeds; e.g. the yellow coloured band represents winds with a speed between 4 m/s and 5 m/s. Calms refer to
wind speeds of less than 1 m/s, whereas the dotted lines show the frequency of occurrence of wind speeds and direction
categories. The diurnal and seasonal wind fields are further elaborated on below. The period and diurnal variability in the
wind field are shown in Figure 3-5, whereas seasonal variations are presented in Figure 3-6.
Meteorological data indicate that the project area is mainly characterised by westerly winds (>16% frequency of occurrence)
and some easterly winds (>12% frequency of occurrence) (Figure 3-5). The north and south directions receive little airflow,
with less than 4% frequency of occurrence of winds with varying velocities.
Night-time conditions are normally associated with stable atmospheres, whereas daytime conditions are more unstable,
hence near ground level releases can result in relatively high concentrations during the night. Day time and night time
conditions though similar in the dominant wind direction – westerly, differ with regard to wind velocity, with night time
conditions showing a higher prevalence of winds with a velocity between 5 and 7 m/s and having less (7.3%) calms.
Air Quality Impact Assessment for the Development and Operation of a Conveyor Belt, Adit and Associated Infrastructure at the Kangra Coal Kusipongo Coal Reserve, Maquasa West Extension Mining Right Area
Report No.14ERM15 3-5
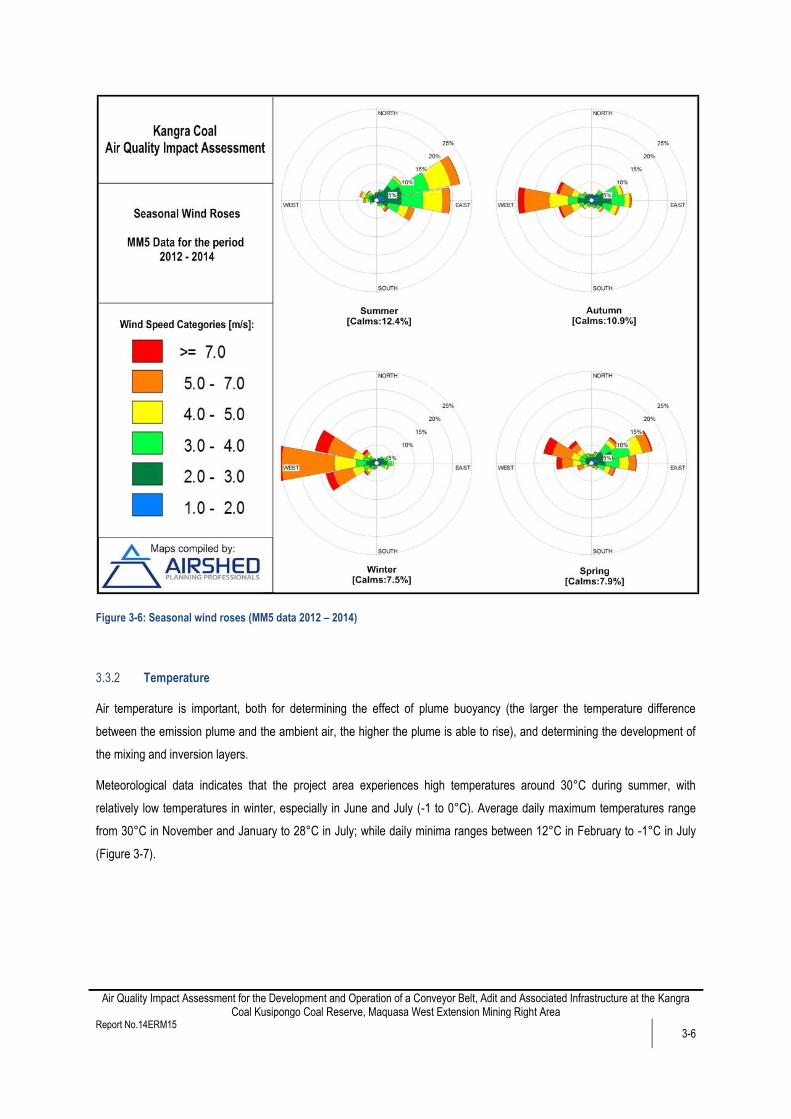
Wind speed and direction usually change per season due to the influence of varying climatic conditions. Seasonal wind
roses for the project area indicate that wind direction changes per season, with summer and winter months dominated by
winds from the easterly and westerly sectors respectively. Autumn and spring show a presence of both westerly and easterly
winds; though the former season has a higher (~20% frequency of occurrence) prevalence of westerly winds and the latter
more easterly winds (~17% frequency of occurrence).
Figure 3-5: Period, day-time and night-time wind roses (MM5 data 2012 – 2014)
Air Quality Impact Assessment for the Development and Operation of a Conveyor Belt, Adit and Associated Infrastructure at the Kangra Coal Kusipongo Coal Reserve, Maquasa West Extension Mining Right Area
Report No.14ERM15 3-6
Figure 3-6: Seasonal wind roses (MM5 data 2012 – 2014)
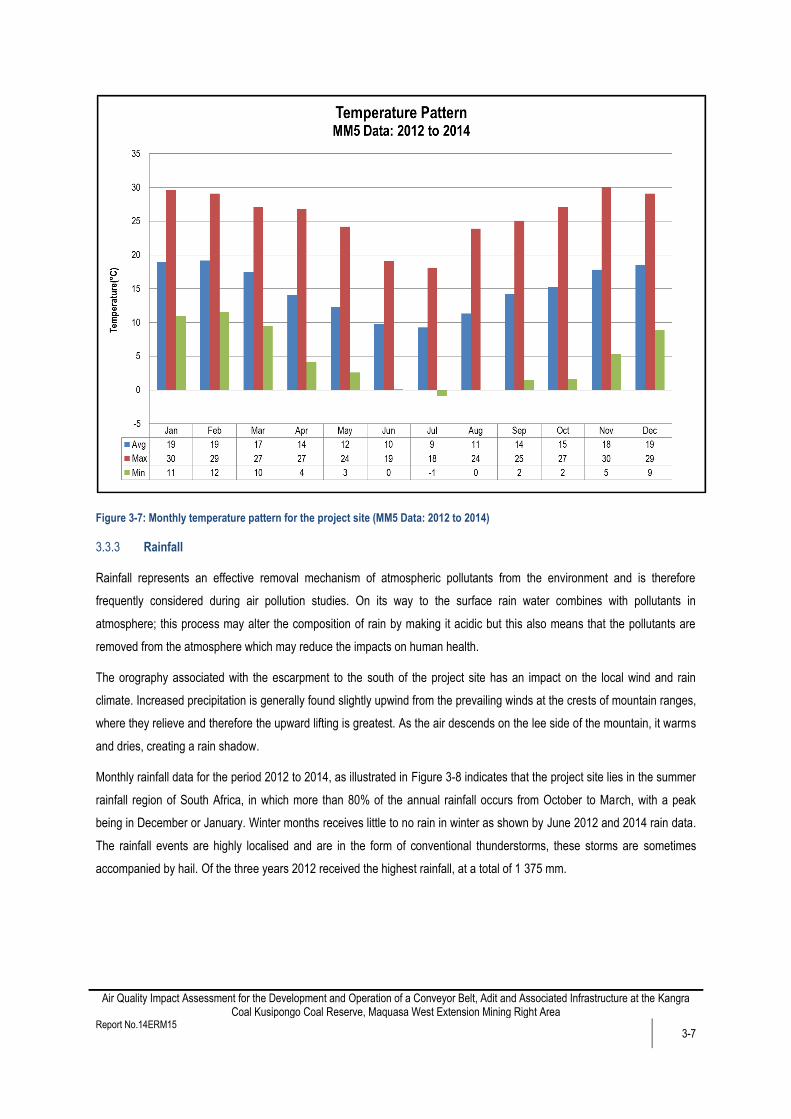
Temperature 3.3.2
Air temperature is important, both for determining the effect of plume buoyancy (the larger the temperature difference
between the emission plume and the ambient air, the higher the plume is able to rise), and determining the development of
the mixing and inversion layers.
Meteorological data indicates that the project area experiences high temperatures around 30°C during summer, with
relatively low temperatures in winter, especially in June and July (-1 to 0°C). Average daily maximum temperatures range
from 30°C in November and January to 28°C in July; while daily minima ranges between 12°C in February to -1°C in July
(Figure 3-7).
Air Quality Impact Assessment for the Development and Operation of a Conveyor Belt, Adit and Associated Infrastructure at the Kangra Coal Kusipongo Coal Reserve, Maquasa West Extension Mining Right Area
Report No.14ERM15 3-7
Figure 3-7: Monthly temperature pattern for the project site (MM5 Data: 2012 to 2014)
Rainfall 3.3.3
Rainfall represents an effective removal mechanism of atmospheric pollutants from the environment and is therefore
frequently considered during air pollution studies. On its way to the surface rain water combines with pollutants in
atmosphere; this process may alter the composition of rain by making it acidic but this also means that the pollutants are
removed from the atmosphere which may reduce the impacts on human health.
The orography associated with the escarpment to the south of the project site has an impact on the local wind and rain
climate. Increased precipitation is generally found slightly upwind from the prevailing winds at the crests of mountain ranges,
where they relieve and therefore the upward lifting is greatest. As the air descends on the lee side of the mountain, it warms
and dries, creating a rain shadow.
Monthly rainfall data for the period 2012 to 2014, as illustrated in Figure 3-8 indicates that the project site lies in the summer
rainfall region of South Africa, in which more than 80% of the annual rainfall occurs from October to March, with a peak
being in December or January. Winter months receives little to no rain in winter as shown by June 2012 and 2014 rain data.
The rainfall events are highly localised and are in the form of conventional thunderstorms, these storms are sometimes
accompanied by hail. Of the three years 2012 received the highest rainfall, at a total of 1 375 mm.

Air Quality Impact Assessment for the Development and Operation of a Conveyor Belt, Adit and Associated Infrastructure at the Kangra Coal Kusipongo Coal Reserve, Maquasa West Extension Mining Right Area
Report No.14ERM15 3-8
Figure 3-8: Rainfall pattern for the project site (MM5 Data: 2012 to 2014)
Atmospheric Stability 3.3.4
The vertical component of dispersion is a function of the extent of thermal turbulence and the depth of the surface mixing
layer. The mixing layer is not easily measured, and must therefore often be estimated using prognostic models that derive
the depth from some of the other parameters that are routinely measured, e.g. solar radiation and temperature. Atmospheric
stability is frequently categorised into one of six stability classes. These are briefly described in Table 3-1.
Table 3-1: Atmospheric stability classes
Class Description Description
A very unstable calm wind, clear skies, hot daytime conditions
B moderately unstable clear skies, daytime conditions
C unstable moderate wind, slightly overcast daytime conditions
D neutral high winds or cloudy days and nights
E stable moderate wind, slightly overcast night-time conditions
F very stable low winds, clear skies, cold night-time conditions

Air Quality Impact Assessment for the Development and Operation of a Conveyor Belt, Adit and Associated Infrastructure at the Kangra Coal Kusipongo Coal Reserve, Maquasa West Extension Mining Right Area
Report No.14ERM15 3-9
The atmospheric boundary layer is normally unstable during the day as a result of the turbulence due to the sun's heating
effect on the earth's surface. The thickness of this mixing layer depends predominantly on the extent of solar radiation,
growing gradually from sunrise to reach a maximum at about 5-6 hours after sunrise. This situation is more pronounced
during the winter months due to strong night-time inversions and a slower developing mixing layer. During the night a stable
layer, with limited vertical mixing, exists. During windy and/or cloudy conditions, the atmosphere is normally neutral.
Atmospheric stability and mixing depth influence dispersion potential of emissions, for example low level releases such as
vehicle entrainment from unpaved roads will have the highest concentrations occurring during weak wind speeds and stable
(night-time) atmospheric conditions. Wind erosion, on the other hand, requires strong winds together with fairly stable
conditions to result in high ground level concentrations i.e. neutral conditions.
The atmospheric dispersion model AERMOD used in the current study is a “new generation” dispersion model which
describes atmospheric stability as a continuum rather than discreet classes. The atmospheric boundary layer properties are
therefore described by two parameters; the boundary layer depth and the Monin-Obukhov length, rather than in terms of the
single parameter Pasquill Class.
The Monin-Obukhov length (LMO) provides a measure of the importance of buoyancy generated by the heating of the ground
and mechanical mixing generated by the frictional effect of the earth’s surface. Physically, it can be thought of as
representing the depth of the boundary layer within which mechanical mixing is the dominant form of turbulence generation.
The atmospheric boundary layer constitutes the first few hundred metres of the atmosphere. During the daytime, the
atmospheric boundary layer is characterised by thermal turbulence due to the heating of the earth’s surface. Night times are
characterised by weak vertical mixing and the predominance of a stable layer. These conditions are normally associated
with low wind speeds and less dilution potential.
In the context of atmospheric dispersion potential, low wind speeds and large positive reciprocal Monin-Obukhov lengths
provide poor dispersion conditions for ground level releases, but releases from elevated sources (stable plumes under these
conditions) travel long distances before making ground fall, therefore night time conditions generally do not result in high
ground level concentrations. In contrast strong winds and large negative reciprocal Monin-Obukhov lengths provide good
dispersion conditions for ground level releases, these conditions however result in looping plumes from elevated releases,
these may result in high concentrations near the source, albeit of relatively short duration.
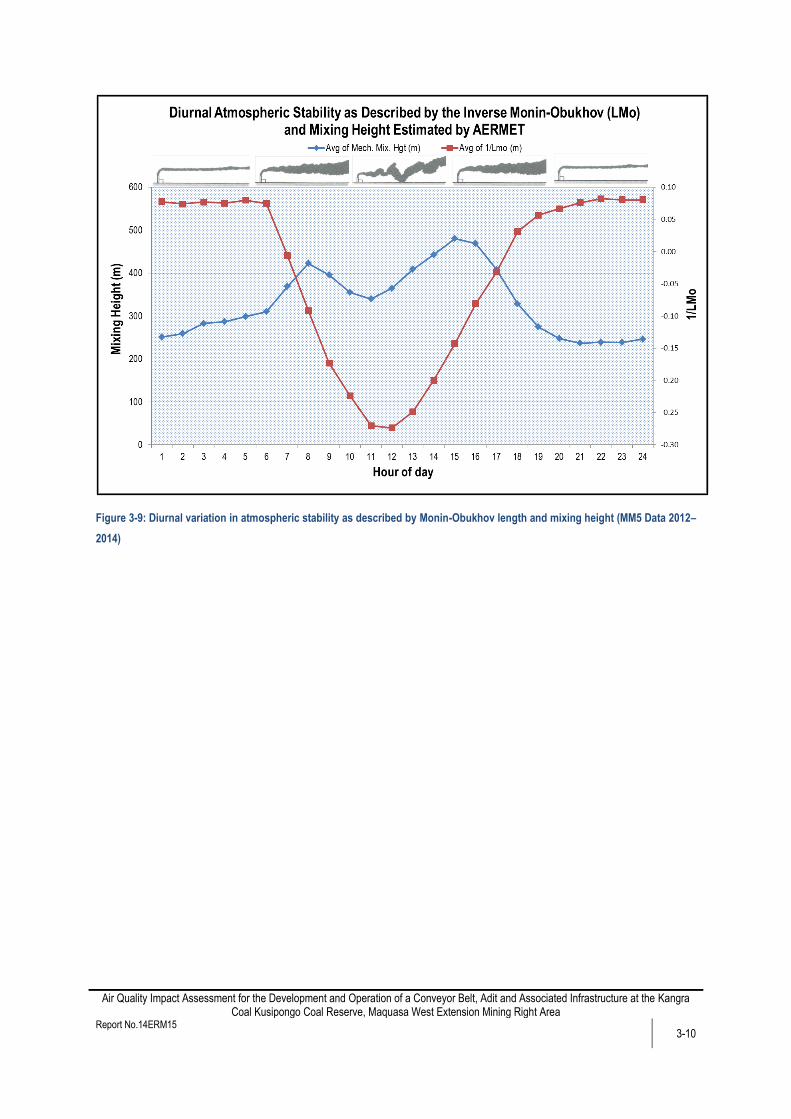
Focusing on the current project meteorological conditions, diurnal variations in atmospheric stability as calculated from
modelled MM5 data and described by the LMo is provided in Figure 3-9. The graph indicates that during the day, when the
sun is at its peak, LMo is mostly negative; whereas at night it’s mostly positive. Based on wind data and Figure 3-9, ground
level emissions are expected to disperse easily during the day and less so at night. Elevated sources are expected to have
a looping trend during the day and at night time emissions are expected to travel further from the source prior to making
ground fall.
Air Quality Impact Assessment for the Development and Operation of a Conveyor Belt, Adit and Associated Infrastructure at the Kangra Coal Kusipongo Coal Reserve, Maquasa West Extension Mining Right Area
Report No.14ERM15 3-10
Figure 3-9: Diurnal variation in atmospheric stability as described by Monin-Obukhov length and mixing height (MM5 Data 2012–
2014)
Air Quality Impact Assessment for the Development and Operation of a Conveyor Belt, Adit and Associated Infrastructure at the Kangra Coal Kusipongo Coal Reserve, Maquasa West Extension Mining Right Area
Report No.14ERM15 3-11
3.4 Status Quo Ambient Air Quality
Qualitative Assessment of Regional Sources of Pollution 3.4.1
The identification of existing sources of emission in the region, and the characterisation of ambient pollutant concentrations
is fundamental to the assessment of the potential for cumulative impacts and synergistic effects given the proposed
operation and its associated emissions. The source types present in the area and the pollutants associated with such source
types are noted with the aim of identifying pollutants which may be of importance in terms of cumulative impact potentials.
3.4.1.1 Mining Activities
Fugitive emission sources from mining activities mainly comprise of land clearing (i.e. scraping, dozing and excavating),
drilling and blasting, material handling operations, vehicle entrainment on roads and wind erosion from open areas or
stockpiles. The aforementioned activities mainly result in fugitive dust releases with small amount of NOx, CO, SO2,
methane and CO2 being released during blasting operations and from mining vehicles and equipment.
The majority of dustfall (from current Kangra Coal mining activities) at the site of the proposed project would be in the form
of small particles (less than 10 micron in aerodynamic diameters), but may also consist of combustion products such as
carbon dioxide, carbon monoxide, sulphur dioxide and oxides of nitrogen. Larger particles would deposit closer to the
existing mining operations. Airborne dust emissions would also originate from existing discard and overburden heaps
(Figure 3-10).
Figure 3-10: Existing overburden and discard dumps at the existing Kanga Coal mine
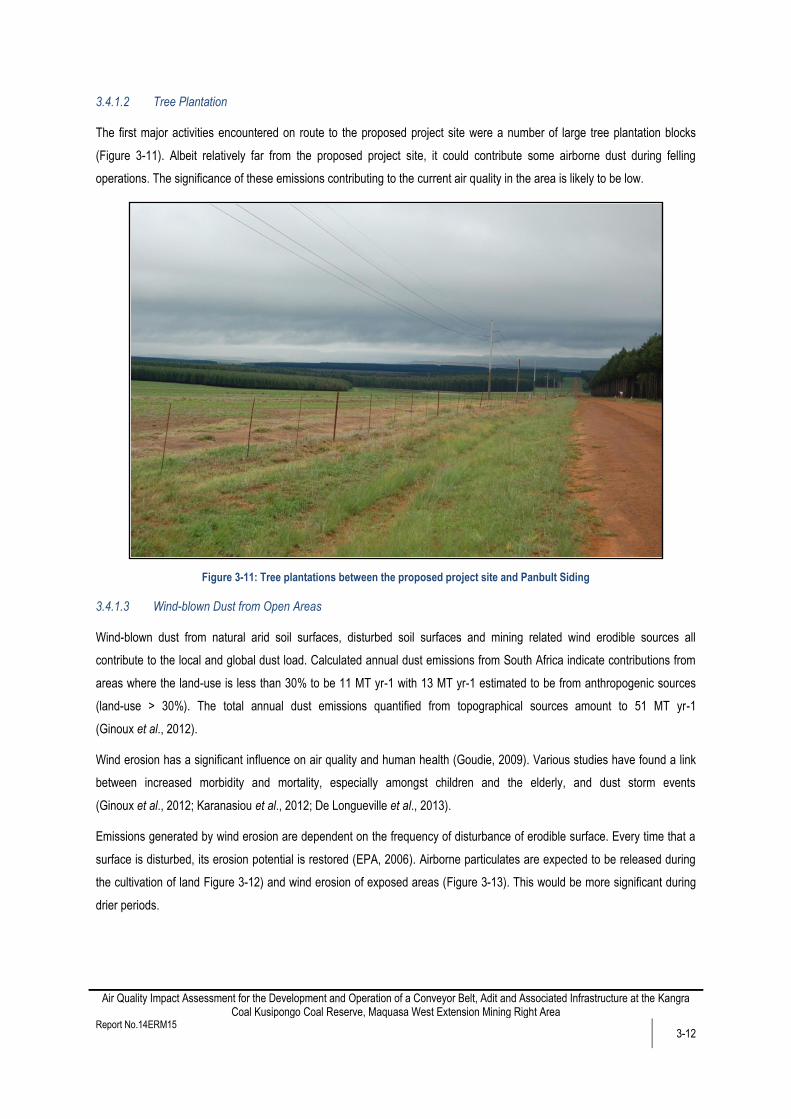
Air Quality Impact Assessment for the Development and Operation of a Conveyor Belt, Adit and Associated Infrastructure at the Kangra Coal Kusipongo Coal Reserve, Maquasa West Extension Mining Right Area
Report No.14ERM15 3-12
3.4.1.2 Tree Plantation
The first major activities encountered on route to the proposed project site were a number of large tree plantation blocks
(Figure 3-11). Albeit relatively far from the proposed project site, it could contribute some airborne dust during felling
operations. The significance of these emissions contributing to the current air quality in the area is likely to be low.
Figure 3-11: Tree plantations between the proposed project site and Panbult Siding
3.4.1.3 Wind-blown Dust from Open Areas
Wind-blown dust from natural arid soil surfaces, disturbed soil surfaces and mining related wind erodible sources all
contribute to the local and global dust load. Calculated annual dust emissions from South Africa indicate contributions from
areas where the land-use is less than 30% to be 11 MT yr-1 with 13 MT yr-1 estimated to be from anthropogenic sources
(land-use > 30%). The total annual dust emissions quantified from topographical sources amount to 51 MT yr-1
(Ginoux et al., 2012).
Wind erosion has a significant influence on air quality and human health (Goudie, 2009). Various studies have found a link
between increased morbidity and mortality, especially amongst children and the elderly, and dust storm events
(Ginoux et al., 2012; Karanasiou et al., 2012; De Longueville et al., 2013).
Emissions generated by wind erosion are dependent on the frequency of disturbance of erodible surface. Every time that a
surface is disturbed, its erosion potential is restored (EPA, 2006). Airborne particulates are expected to be released during
the cultivation of land Figure 3-12) and wind erosion of exposed areas (Figure 3-13). This would be more significant during
drier periods.
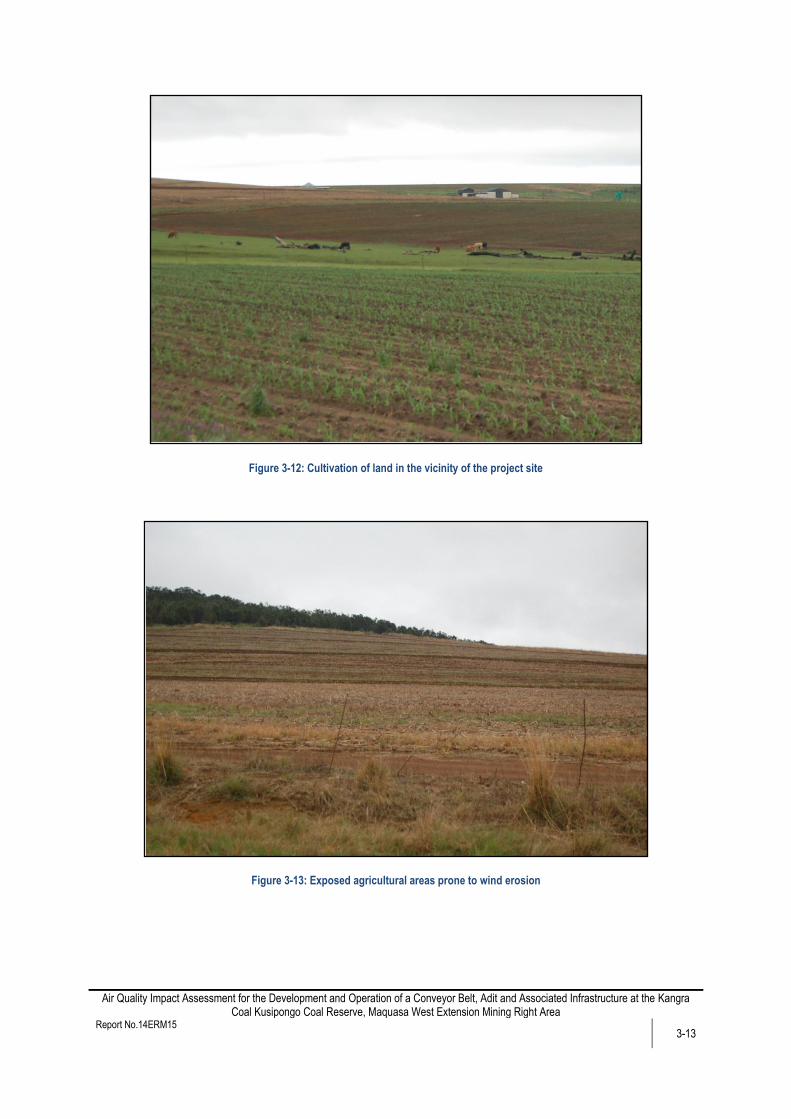
Air Quality Impact Assessment for the Development and Operation of a Conveyor Belt, Adit and Associated Infrastructure at the Kangra Coal Kusipongo Coal Reserve, Maquasa West Extension Mining Right Area
Report No.14ERM15 3-13
Figure 3-12: Cultivation of land in the vicinity of the project site
Figure 3-13: Exposed agricultural areas prone to wind erosion
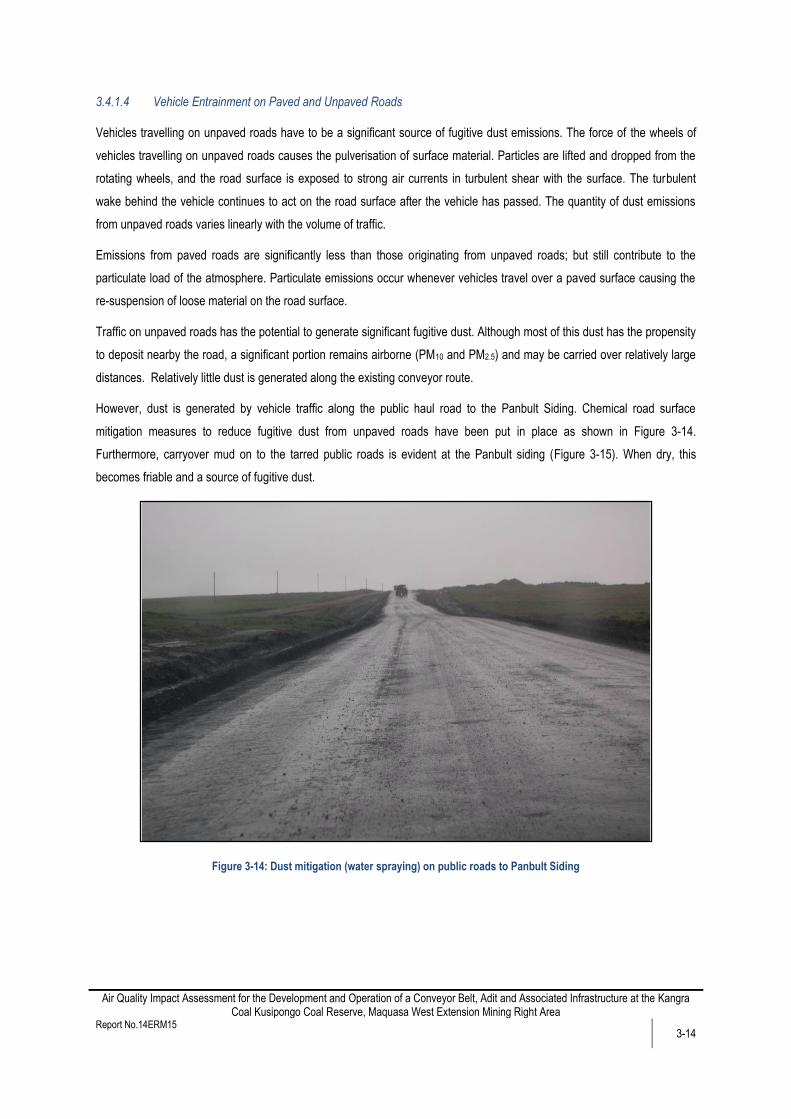
Air Quality Impact Assessment for the Development and Operation of a Conveyor Belt, Adit and Associated Infrastructure at the Kangra Coal Kusipongo Coal Reserve, Maquasa West Extension Mining Right Area
Report No.14ERM15 3-14
3.4.1.4 Vehicle Entrainment on Paved and Unpaved Roads
Vehicles travelling on unpaved roads have to be a significant source of fugitive dust emissions. The force of the wheels of
vehicles travelling on unpaved roads causes the pulverisation of surface material. Particles are lifted and dropped from the
rotating wheels, and the road surface is exposed to strong air currents in turbulent shear with the surface. The turbulent
wake behind the vehicle continues to act on the road surface after the vehicle has passed. The quantity of dust emissions
from unpaved roads varies linearly with the volume of traffic.
Emissions from paved roads are significantly less than those originating from unpaved roads; but still contribute to the
particulate load of the atmosphere. Particulate emissions occur whenever vehicles travel over a paved surface causing the
re-suspension of loose material on the road surface.
Traffic on unpaved roads has the potential to generate significant fugitive dust. Although most of this dust has the propensity
to deposit nearby the road, a significant portion remains airborne (PM10 and PM2.5) and may be carried over relatively large
distances. Relatively little dust is generated along the existing conveyor route.
However, dust is generated by vehicle traffic along the public haul road to the Panbult Siding. Chemical road surface
mitigation measures to reduce fugitive dust from unpaved roads have been put in place as shown in Figure 3-14.
Furthermore, carryover mud on to the tarred public roads is evident at the Panbult siding (Figure 3-15). When dry, this
becomes friable and a source of fugitive dust.
Figure 3-14: Dust mitigation (water spraying) on public roads to Panbult Siding

Air Quality Impact Assessment for the Development and Operation of a Conveyor Belt, Adit and Associated Infrastructure at the Kangra Coal Kusipongo Coal Reserve, Maquasa West Extension Mining Right Area
Report No.14ERM15 3-15
Figure 3-15: Mud Carry-over from Panbult Siding onto Public Road
3.4.1.5 Vehicle Exhaust Emissions
Emissions resulting from motor vehicles can be grouped into primary and secondary pollutants. While primary pollutants are
emitted directly into the atmosphere, secondary pollutants form in the atmosphere as a result of chemical reactions.
Significant primary pollutants emitted by internal combustion engines include carbon dioxide, carbon monoxide, carbon,
sulphur dioxide, oxides of nitrogen (mainly nitric oxide), particulates and lead. Secondary pollutants include nitrogen dioxide,
photochemical oxidants such as ozone, sulphuric acid, sulphates, nitric acid, and nitrate aerosols (particulate matter).
Vehicle (i.e. model-year, fuel delivery system), fuel (i.e. type, oxygen content), operating (i.e. vehicle speed, load), and
environmental parameters (i.e. altitude, humidity) influence vehicle emission rates (Onursal, 1997). National and some
regional roads may be sources of emissions due to the expected high traffic volumes on these roads.
Airborne particulates and diesel exhaust fumes are emitted along haul roads and public roads in the project site’s vicinity.
3.4.1.6 Biomass Burning
Crop-residue burning and general wild fires (veld fires) represent significant sources of combustion-related emissions
associated with agricultural areas. The significance of seasonal impacts due to biomass burning is well known and recorded
(Piketh et al., 1996). Biomass burning is an incomplete combustion process (Cachier, 1992), with carbon monoxide,
methane and nitrogen dioxide gases being emitted. Approximately 40% of the nitrogen in biomass is emitted as nitrogen,
10% is left is the ashes, and it may be assumed that 20% of the nitrogen is emitted as higher molecular weight nitrogen
compounds (Held et al, 1996). The visibility of the smoke plumes is attributed to the aerosol (particulate matter) content.
Air Quality Impact Assessment for the Development and Operation of a Conveyor Belt, Adit and Associated Infrastructure at the Kangra Coal Kusipongo Coal Reserve, Maquasa West Extension Mining Right Area
Report No.14ERM15 3-16
3.5 Measured Ambient Air Quality Data within the Project Site
Highveld Priority Area 3.5.1
As previously mentioned Kangra Coal mine falls within the Highveld Priority Area (HPA). The HPA was the second national
air quality priority area declared (after the Vaal Triangle Airshed Priority Area) by the Minister of Environmental Affairs at the
end of 2007 (HPA, 2011). This required that an AQMP for the area be developed. The plan includes the establishment of
emissions reduction strategies and intervention programmes based on the findings of a baseline characterisation of the
area. The implication of this is that all contributing sources in the area will be assessed to determine the emission reduction
targets to be achieved over the following few years.
A comprehensive emissions inventory was completed for the region as part of the study. The results of the inventory were
used to carry out a comprehensive dispersion modelling study over the area using the CALPUFF model (DEA, 2011).
Within the Pixley Ka lsaka Seme Local Municipality (LM) the HPA identified industries, motor vehicles, residential fuel
burning, agricultural burning and tyre burning as air quality source. The modelling results as illustrated by Figure 3-161,
indicates that the LM had less than 9 exceedances of the PM10 NEMAQA standard in a three year period (2004 – 2006)
1 The figure gives the areas in which ambient air quality standards are predicted to be in exceedance for more than the allowed 1% of the
time

Air Quality Impact Assessment for the Development and Operation of a Conveyor Belt, Adit and Associated Infrastructure at the Kangra Coal Kusipongo Coal Reserve, Maquasa West Extension Mining Right Area
Report No.14ERM15 3-17
Figure 3-16: Modelled frequency of exceedance of 24-hour ambient PM10 standards in the HPA, indicating the air quality Hot
Spot areas (DEA 2011).
Kangra Coal Mine Monitoring 3.5.2
Particulates represent the main pollutant of concern in the assessment of mining operations. The existing Kangra Coal mine
has a dustfall network and this is important as it provides management with an indication of what the increase in fugitive
dust levels are from the mining operations. This is also important as it would bring the mining operations in line with the
NEMAQA.
The mine has six single dust buckets at Panbult Siding (Figure 3-17) and five single buckets at Maquasa East Shaft (Figure
3-18). The sampling period for the current dust buckets at Kangra Coal Mine is generally 14 days.
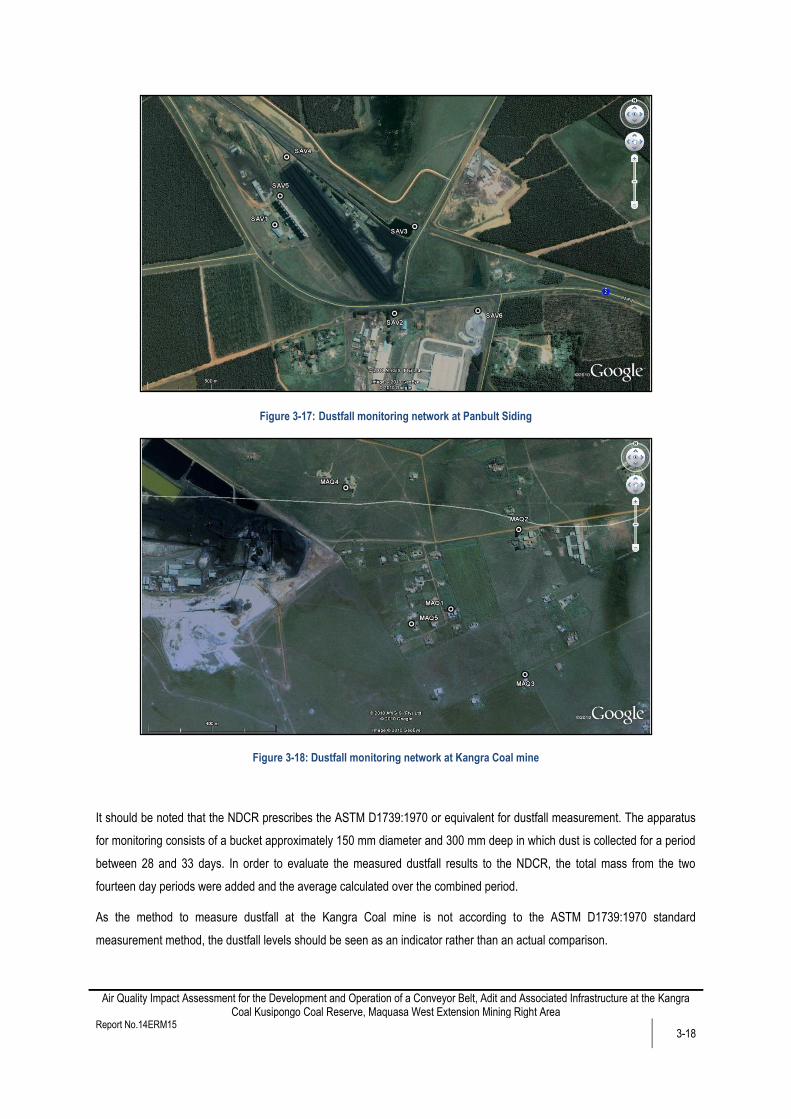
Air Quality Impact Assessment for the Development and Operation of a Conveyor Belt, Adit and Associated Infrastructure at the Kangra Coal Kusipongo Coal Reserve, Maquasa West Extension Mining Right Area
Report No.14ERM15 3-18
Figure 3-17: Dustfall monitoring network at Panbult Siding
Figure 3-18: Dustfall monitoring network at Kangra Coal mine
It should be noted that the NDCR prescribes the ASTM D1739:1970 or equivalent for dustfall measurement. The apparatus
for monitoring consists of a bucket approximately 150 mm diameter and 300 mm deep in which dust is collected for a period
between 28 and 33 days. In order to evaluate the measured dustfall results to the NDCR, the total mass from the two
fourteen day periods were added and the average calculated over the combined period.
As the method to measure dustfall at the Kangra Coal mine is not according to the ASTM D1739:1970 standard
measurement method, the dustfall levels should be seen as an indicator rather than an actual comparison.

Air Quality Impact Assessment for the Development and Operation of a Conveyor Belt, Adit and Associated Infrastructure at the Kangra Coal Kusipongo Coal Reserve, Maquasa West Extension Mining Right Area
Report No.14ERM15 3-19
3.5.2.1 Dustfall Results
Dustfall results for the period January 2009 to February 2011 indicated that the residential area limit of 600 mg/m2-day was
exceeded occasionally at both Panbult Siding and at the Maquasa East mine sites. The highest impacted location was
SAV2 (Panbult Siding), which observed nine months exceeding or equal to the non-residential limit and three months
exceeding the non-residential limit of 1 200 mg/m2-day, during the entire monitoring period. The highest dustfall was
observed at MAQ5 (Figure 3 17) exceeding the non-residential limit of 1 200 mg/m2-day on one occasion. In general,
dustfall rates at the sampling sites were below the non-residential level.

Air Quality Impact Assessment for the Development and Operation of a Conveyor Belt, Adit and Associated Infrastructure at the Kangra Coal Kusipongo Coal Reserve, Maquasa West Extension Mining Right Area
Report No.14ERM15 4-1
4 IMPACT OF PROPOSED PROJECT ON THE RECEIVING ENVIRONMENT
The aim of the study is to identify air pollution emission sources, perform an emissions inventory to obtain emission rates
and model the results so as to assess the spatial extent of the impacts. These are then compared with the relevant
regulations and standards for legal compliance and used to determine mitigation measures which will result in the reduction
of the total environmental impacts.
4.1 Atmospheric Emissions Inventory
An emissions inventory for the current project is provided below. The establishment of an emissions inventory comprises the
identification of sources of emissions, and the quantification of each source's contribution to ambient air pollution
concentrations.
Pollutants included in the inventory are limited to particulates - TSP, PM10, and PM2.5. Emission rates were calculated based
on planned operations at the proposed project site and detailed information provided by ERM. The fugitive dust emission
factors utilised in the study are taken from the NPI and US EPA emission factor documents and are provided in Appendix B.
The study differentiates between three phases of the project, construction, operational and decommissioning phase.
Emissions in the construction phase will result from the establishment of the access adit. Operational phase emissions will
emanate from material handling operations as well as wind-blown dust from the proposed overland conveyor. The
decommissioning phase was assessed qualitatively and emissions are expected to stem from wind-blown dust from
exposed stockpiles and the maintenance of roads, storage facilities and building structures etc.
Construction Phase 4.1.1
The main issues associated with construction activities on air quality relate to particulate emissions from excavation and
transport of spoil, the placement of fill and the stockpiling of materials. Emissions of dust can also be produced from
concrete batching plants, vehicles travelling on temporary untreated roads and wind-generated erosion from open areas.
Each of these operations has their own duration and potential for dust generation. It is anticipated that the extent of dust
emissions would vary substantially from day to day depending on the level of activity, the specific operations, and the
prevailing meteorological conditions.
Other air pollutants can include odours from asphalt laying, asphalt plant and emissions from internal combustion engines of
mobile and stationary equipment such as excavators, trucks, generators and compressors.
A detailed air pollution impact assessment would include a comprehensive inventory of all these sources of air emissions.
Unfortunately, this level of detail was not available at the time of the investigation. Instead the methodology followed was
that proposed by the US EPA, which relates to the dust generation to the area of construction (Appendix B).
The US EPA construction emission factor is a fixed value for total suspended particulate matter (TSP): ETSP = 2.69 ton/ha
per month of activity. No particle size modifiers are available; however, the US EPA estimates that the PM10 fraction is 30%.
Source parameters for this phase may be found in Table 4-1.
It was given that the total estimated footprint of the development is about 21 ha. For the purposes of the calculations, an
area of 1.376 ha was utilised, this is equal to the total footprint of the access adit, excluding related infrastructure.

Air Quality Impact Assessment for the Development and Operation of a Conveyor Belt, Adit and Associated Infrastructure at the Kangra Coal Kusipongo Coal Reserve, Maquasa West Extension Mining Right Area
Report No.14ERM15 4-2
Operational Phase 4.1.2
The operational phase quantified fugitive emissions emanating from material handling and wind-blown dust from the
proposed overland conveyor. Pollutants included in the inventory are TSP, PM10 and PM2.5. A detailed explanation of
sources quantified follows, with source parameters in Table 4-1.
4.1.2.1 Material Handling
Material handling operations can be sources of significant emission depending on the volume of material handled, the
number of handling steps or transfer points and the manner in which the activity is done i.e. with machines or manually.
Various climate parameters such as wind speed and precipitation may influence emissions from these sources. Fine
particulates are most readily disaggregated and released to the atmosphere during the material transfer process and as a
result of exposure to strong winds. Increases in the moisture content of the material being transferred will decrease the
potential for dust emissions since moisture promotes the aggregation and cementation of fines to the surfaces of larger
particles. Material handling operation for the current project will consist of the following:
Material transfer from the mining shaft onto the overland conveyor
Conveyor material transfer points, including tipping onto Maquasa West conveyor.
4.1.2.2 Wind-blown Dust from Conveyor
Dust emissions from conventional conveyors are wind speed dependent with stronger wind speeds causing dust particles to
be entrained by the wind. For the current project a conveyor to transport coal from the proposed mining shaft to the
Maquasa West conveyor is proposed. Parameters and emission calculation methodology for this source can be found in
Table 4-1 and Appendix B respectively.
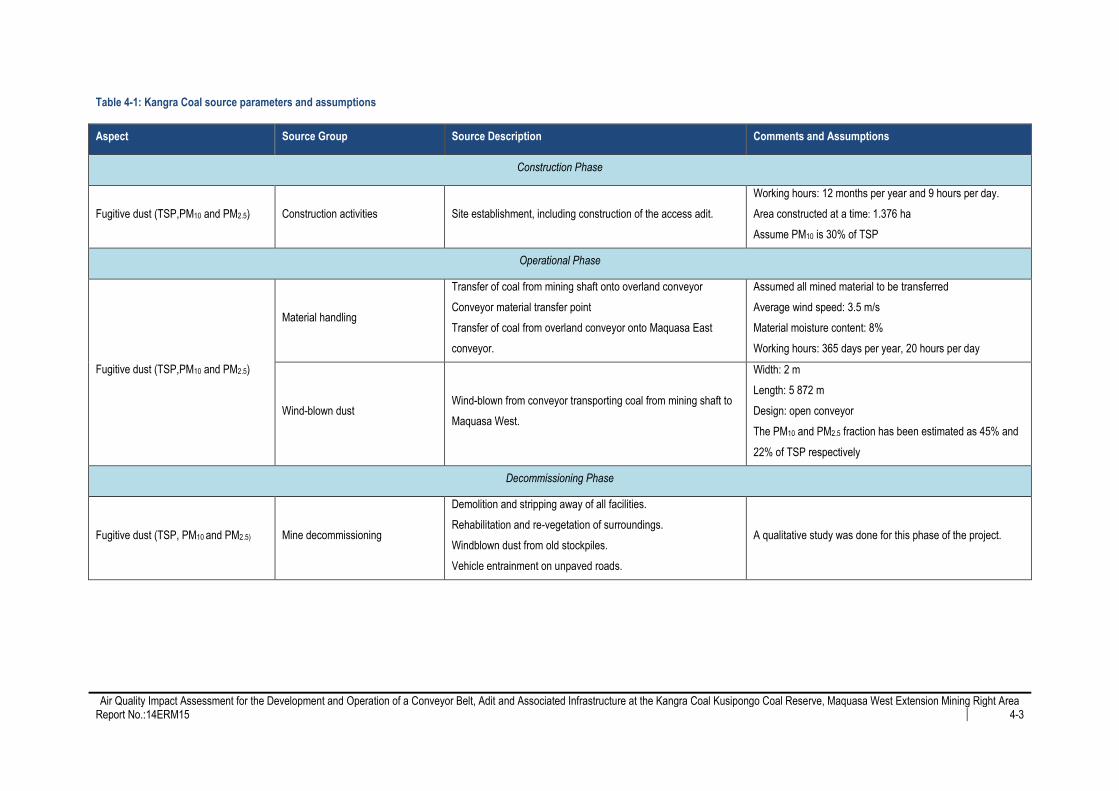
Air Quality Impact Assessment for the Development and Operation of a Conveyor Belt, Adit and Associated Infrastructure at the Kangra Coal Kusipongo Coal Reserve, Maquasa West Extension Mining Right Area
Report No.:14ERM15 4-3
Table 4-1: Kangra Coal source parameters and assumptions
Aspect Source Group Source Description Comments and Assumptions
Construction Phase
Fugitive dust (TSP,PM10 and PM2.5) Construction activities Site establishment, including construction of the access adit.
Working hours: 12 months per year and 9 hours per day.
Area constructed at a time: 1.376 ha
Assume PM10 is 30% of TSP
Operational Phase
Fugitive dust (TSP,PM10 and PM2.5)
Material handling
Transfer of coal from mining shaft onto overland conveyor
Conveyor material transfer point
Transfer of coal from overland conveyor onto Maquasa East
conveyor.
Assumed all mined material to be transferred
Average wind speed: 3.5 m/s
Material moisture content: 8%
Working hours: 365 days per year, 20 hours per day
Wind-blown dust Wind-blown from conveyor transporting coal from mining shaft to
Maquasa West.
Width: 2 m
Length: 5 872 m
Design: open conveyor
The PM10 and PM2.5 fraction has been estimated as 45% and
22% of TSP respectively
Decommissioning Phase
Fugitive dust (TSP, PM10 and PM2.5) Mine decommissioning
Demolition and stripping away of all facilities.
Rehabilitation and re-vegetation of surroundings.
Windblown dust from old stockpiles.
Vehicle entrainment on unpaved roads.
A qualitative study was done for this phase of the project.

Air Quality Impact Assessment for the Development and Operation of a Conveyor Belt, Adit and Associated Infrastructure at the Kangra Coal Kusipongo Coal Reserve, Maquasa West Extension Mining Right Area
Report No.:14ERM15 4-4
4.1.2.3 Emission Rates Summary
Emission rates for the construction and operational phases are listed per source group in Table 4-2. Wind-blown dust from
the conveyor is the biggest contributor to total study emissions, this in contrast to material handling operations which
contribute approximately 2%, across all inventoried pollutants. The low emissions from material handling operations may be
attributed to the high moisture content (>4%) of coal and the few conveyor transfer points.
It must be noted that conveyor emissions were calculated assuming that the conveyor is to have no coverings, i.e. no roof or
side coverings.
Table 4-2: Kangra Coal project emission rates (tpa)
Source group TSP PM10 PM2.5
Construction Phase
Construction 44 13
Operational Phase
Material handling 4 2 0.25
Wind-blown dust from conveyor 174 78 39
Total study’s emissions 222 93 39
Decommissioning Phase 4.1.3
Emissions in the decommissioning phase are likely to stem from vehicle entrainment on roads, wind-blown dust from
exposed stockpiles and the demolition of structures and maintenance of roads and building structures. Generally emissions
from this phase are minor and are expected to have minimal impacts on the environment provided proper rehabilitation
efforts are put in place early on in the operational phase.

Air Quality Impact Assessment for the Development and Operation of a Conveyor Belt, Adit and Associated Infrastructure at the Kangra Coal Kusipongo Coal Reserve, Maquasa West Extension Mining Right Area
Report No.:14ERM15 4-5
4.2 Simulation Results
Atmospheric dispersion models compute ambient concentrations as a function of source configurations, emission strengths
and meteorological characteristics, thus providing a useful tool to ascertain the spatial and temporal patterns in the ground
level concentrations (GLCs) arising from the emissions of various sources. Increasing reliance has been placed on
concentration estimates from models as the primary basis for environmental and health impact assessments, risk
assessments and emission control requirements.
Dispersion modelling was undertaken to determine highest daily and annual average incremental GLCs for each pollutant.
These averaging periods were selected to facilitate the comparison of simulated pollutant concentrations with relevant air
quality standards. It should be noted that the GLC isopleths depicted present interpolated values from the concentrations
simulated by AERMOD for each of the receptor grid points specified.
Plots reflecting daily averaging periods contain only the 99th percentile simulated GLC, for those averaging periods, over the
entire period for which simulations were undertaken. It is therefore possible that even though a high daily average
concentration is predicted to occur at certain locations, that this may only be true for one day of the year.
Highest daily and annual average concentrations were simulated. These results represent interpolated values for each
receptor grid point for the various averaging periods. The heading of simulated annual average refers to the highest
concentration of emissions over the period modelled. Simulated daily average refer to the second highest concentrations of
all the modelled data and frequency of exceedances indicate the amount of days in a year the concentration of the pollutant
will be above the regulated limit.
Simulated fine particulates (PM10 and PM2.5) GLCs and dustfall rates were compared against the relevant guidelines in
Section 2. The purpose of this comparison is to determine the extent of the dispersion of pollutants and impact on sensitive
receptors and the surrounding environment as a whole.
Construction Phase 4.2.1
4.2.1.1 PM10 Concentrations
Simulated PM10 annual GLCs as a result of the construction of the access adit at Kangra Coal are illustrated in Figure 4-1.
The isopleths plot indicates that impacts are localised around the project site, with only the closest receptors likely to be
impacted. Daily simulated GLCs for PM10 show non-compliance for the daily NAAQS (Figure 4-2), with the resultant impacts
extending towards sensitive receptors located in close proximity to the site (C88, C89 C90, C93 and C94), in the south (C91
and C91) and north-westerly (C81, C82, C83 and C86) direction of the project site.
Depending on the area being constructed, different sensitive receptors are likely to be impacted, for example, when
construction activities are concentrated in the east, receptors C96 to C99 are likely to be impacted on.
The most adversely impacted receptors are those in close proximity to the project site, or within a 500 m radius, this includes
receptors C88, C89, C90, C93 and C94. This is substantiated by simulated GLCs at this receptors, with a maximum daily
concentration of 1 362 µg/m³ at C90 (Table 4-3).

Air Quality Impact Assessment for the Development and Operation of a Conveyor Belt, Adit and Associated Infrastructure at the Kangra Coal Kusipongo Coal Reserve, Maquasa West Extension Mining Right Area
Report No.:14ERM15 4-6
4.2.1.2 Dustfall Rates
Simulated dustfall rates (Figure 4-3) for Kangra Coal project are limited to the project site and only impact on nearby
receptors.
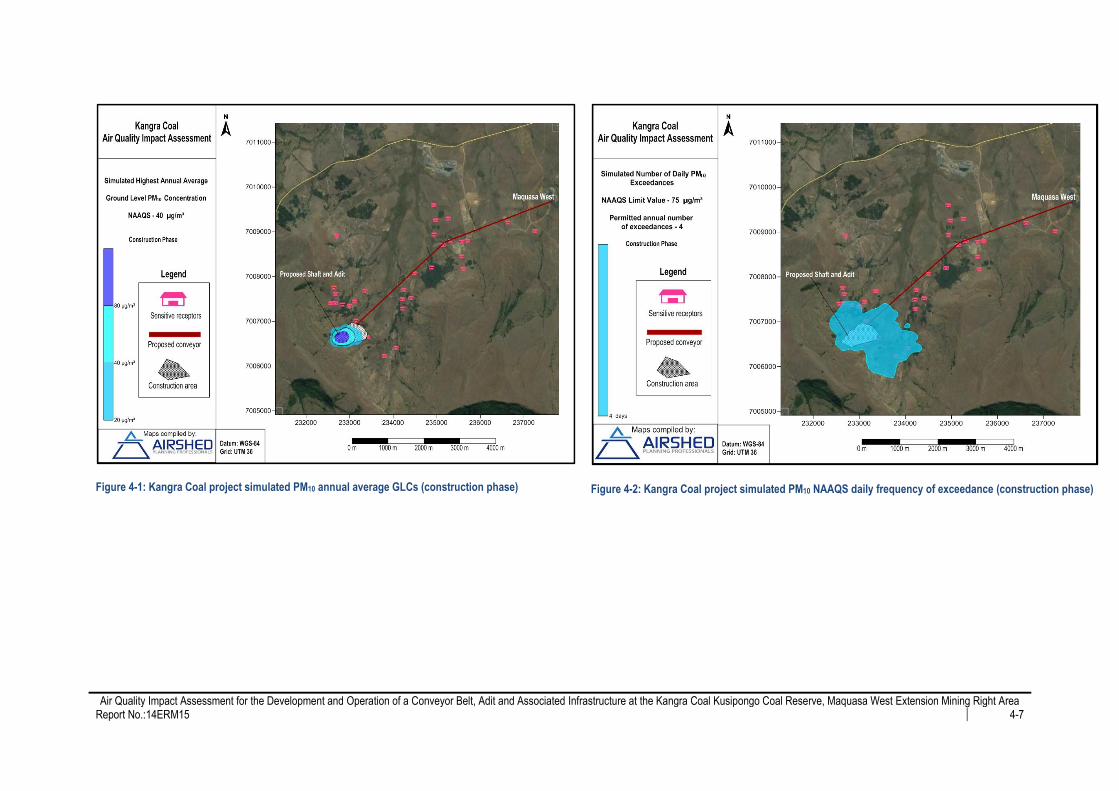
Air Quality Impact Assessment for the Development and Operation of a Conveyor Belt, Adit and Associated Infrastructure at the Kangra Coal Kusipongo Coal Reserve, Maquasa West Extension Mining Right Area
Report No.:14ERM15 4-7
Figure 4-1: Kangra Coal project simulated PM10 annual average GLCs (construction phase)
Figure 4-2: Kangra Coal project simulated PM10 NAAQS daily frequency of exceedance (construction phase)
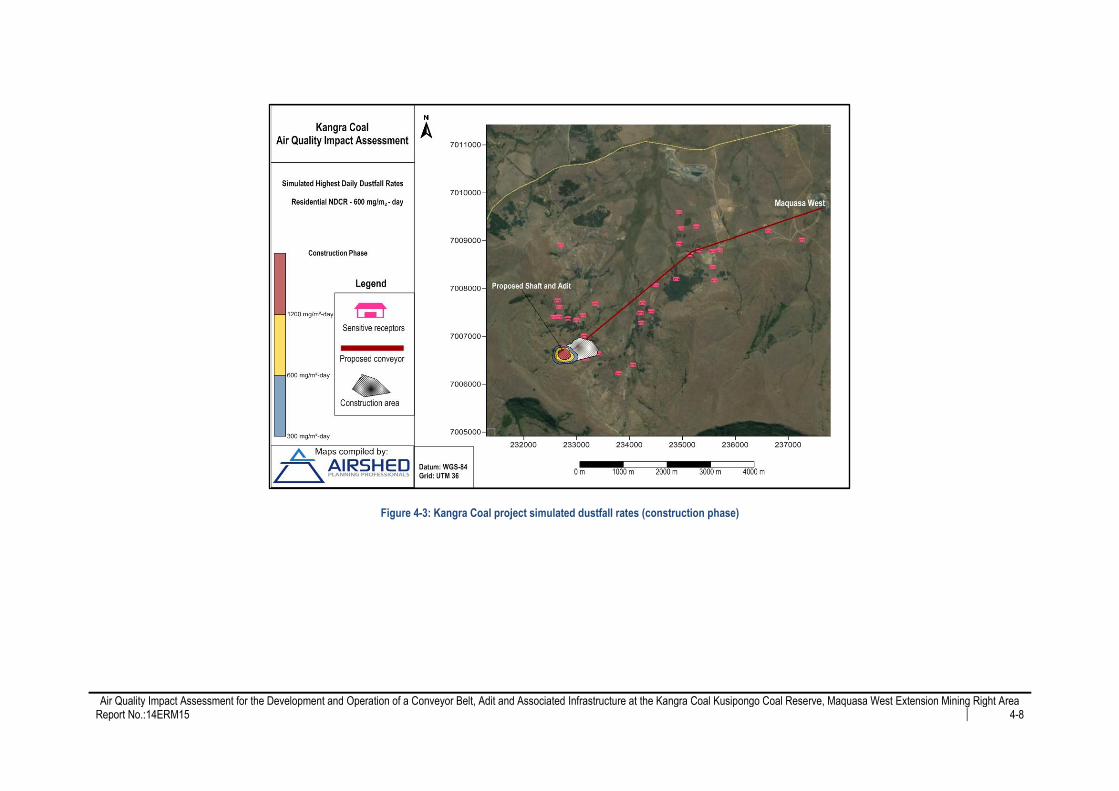
Air Quality Impact Assessment for the Development and Operation of a Conveyor Belt, Adit and Associated Infrastructure at the Kangra Coal Kusipongo Coal Reserve, Maquasa West Extension Mining Right Area
Report No.:14ERM15 4-8
Figure 4-3: Kangra Coal project simulated dustfall rates (construction phase)

Air Quality Impact Assessment for the Development and Operation of a Conveyor Belt, Adit and Associated Infrastructure at the Kangra Coal Kusipongo Coal Reserve, Maquasa West Extension Mining Right Area
Report No.:14ERM15 4-9
Table 4-3: Kangra Coal project construction phase PM10 maximum GLCs at identified sensitive receptors
Receptor PM10 annual (µg/m3) Days of exceedance of the PM10 limit value of 75 µg/m³
C49 0 0
C50 0 0
C51 0 0
C52
0
C53 1 0
C54 0 0
C55 0 0
C56 0 0
C57 0 0
C58 0 0
C69 1 0
C70 0 0
C71 1 1
C81 3 7
C82 2 5
C83 2 2
C84 1 3
C85 2 4
C86 3 5
C87 2 2
C88 7 11
C89 37 58
C90 149 179
C91 4 7
C92 4 7
C93 28 42
C94 15 19
C95 1 1
C96 1 1
C97 2 1
C98 1 1
C99 2 2
NAAQS 75 µg/m³ 4
Notes: Text in bold indicates exceedance of the relevant air quality standard as per Section 2

Air Quality Impact Assessment for the Development and Operation of a Conveyor Belt, Adit and Associated Infrastructure at the Kangra Coal Kusipongo Coal Reserve, Maquasa West Extension Mining Right Area
Report No.:14ERM15 4-10
Operational Phase 4.2.2
4.2.2.1 PM10 Concentrations
Simulated annual PM10 GLCs as a result of the operational phase for Kangra Coal can be viewed in Figure 4-4. The
isopleths plots shows that resultant impacts are mostly centralised to the operational areas, such as conveyor transfer
points; this is substantiated by Figure 4-5 which illustrates the area of non-compliance with the daily NAAQS; the image also
shows that exceedances are more apparent around areas of operation.
Receptors to be impacted include C88, C89, and C90, located at the mining shaft transfer point and C72, C54, C55 and C56
situated around the conveyor transfer point.
The receptor with the highest simulated concentration is C90 at a daily concentration of 577 µg/m³ and 204 days of
exceedance of the daily limit of 75 µg/m³ (Table 4-4).
4.2.2.2 PM2.5 Concentrations
PM2.5 simulated annual GLCs resultant impacts are also mostly confined to the operational areas. Wind-blown dust impacts
are more apparent around the first segment of the conveyor (Figure 4-6).
The number of days where the PM2.5 daily air quality limit of 40 µg/m³ is exceeded at the receptors ranges between 1 (C55
and C98) and 196 (C90), this can be observed in Figure 4-7 and Table 4-5.
4.2.2.3 Dustfall Rates
Simulated dustfall rates are localised and more apparent at material handling points (Figure 4-8).

Air Quality Impact Assessment for the Development and Operation of a Conveyor Belt, Adit and Associated Infrastructure at the Kangra Coal Kusipongo Coal Reserve, Maquasa West Extension Mining Right Area
Report No.:14ERM15 4-11
Figure 4-4: Kangra Coal project simulated PM10 annual average GLCs (operational phase)
Figure 4-5: Kangra Coal project simulated PM10 NAAQS daily frequency of exceedance (operational
phase)

Air Quality Impact Assessment for the Development and Operation of a Conveyor Belt, Adit and Associated Infrastructure at the Kangra Coal Kusipongo Coal Reserve, Maquasa West Extension Mining Right Area
Report No.:14ERM15 4-12
Table 4-4: Kangra Coal project operational phase PM10 maximum GLCs at identified sensitive receptors
Receptor PM10 annual (µg/m3) Days of exceedance of the PM10 limit value of 75 µg/m³
C49 4 0
C50 7 0
C51 3 0
C52 12 3
C53 17 9
C54 28 23
C55 8 1
C56 7 0
C57 6 0
C58 5 0
C69 6 0
C70 5 0
C71 38 56
C81 7 0
C82 5 0
C83 5 0
C84 4 0
C85 5 0
C86 9 1
C87 9 0
C88 35 51
C89 17 10
C90 96 204
C91 3 0
C92 4 0
C93 9 1
C94 9 1
C95 9 0
C96 21 21
C97 14 6
C98 10 1
C99 10 1
NAAQS 75 µg/m³ 4
Notes: Text in bold indicates exceedance of the relevant air quality standard as per Section 2
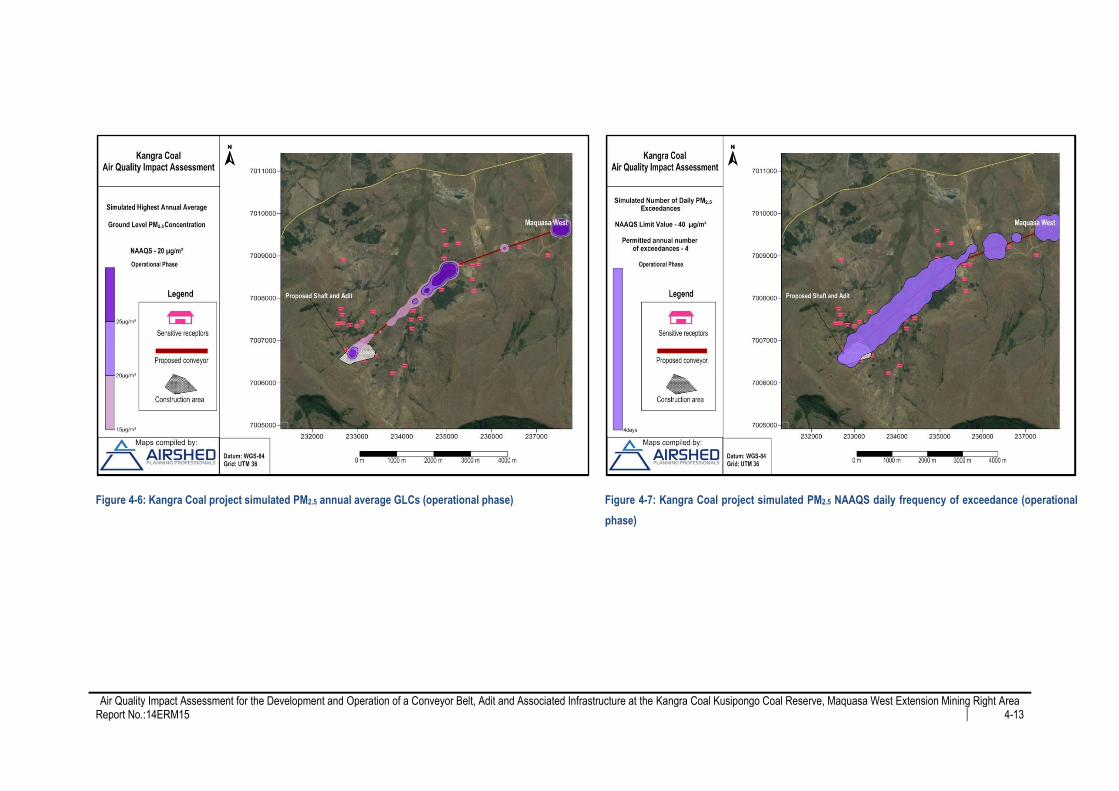
Air Quality Impact Assessment for the Development and Operation of a Conveyor Belt, Adit and Associated Infrastructure at the Kangra Coal Kusipongo Coal Reserve, Maquasa West Extension Mining Right Area
Report No.:14ERM15 4-13
Figure 4-6: Kangra Coal project simulated PM2.5 annual average GLCs (operational phase)
Figure 4-7: Kangra Coal project simulated PM2.5 NAAQS daily frequency of exceedance (operational
phase)
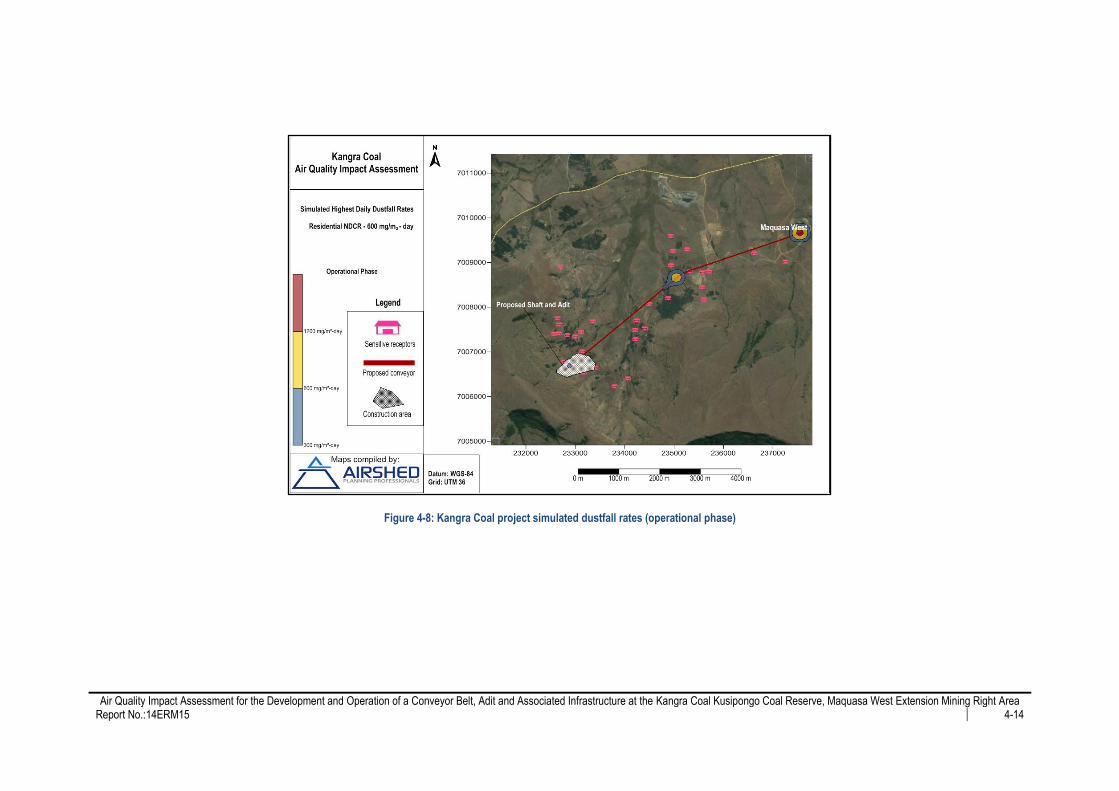
Air Quality Impact Assessment for the Development and Operation of a Conveyor Belt, Adit and Associated Infrastructure at the Kangra Coal Kusipongo Coal Reserve, Maquasa West Extension Mining Right Area
Report No.:14ERM15 4-14
Figure 4-8: Kangra Coal project simulated dustfall rates (operational phase)
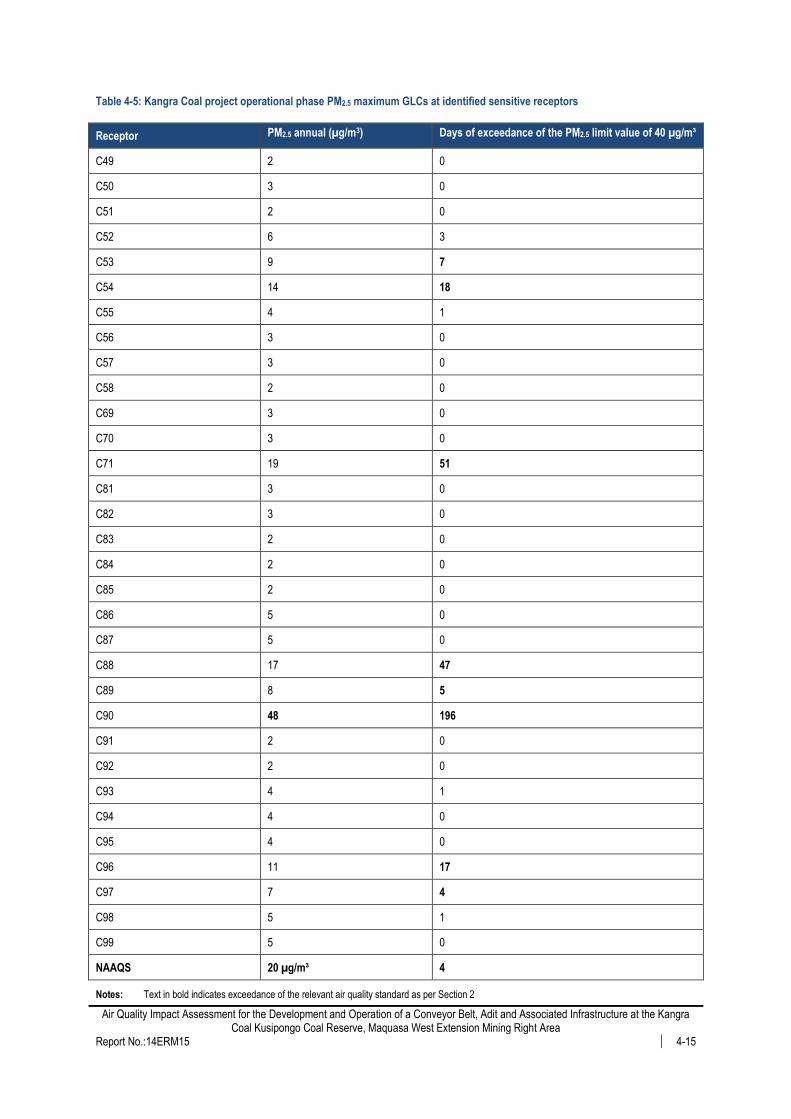
Air Quality Impact Assessment for the Development and Operation of a Conveyor Belt, Adit and Associated Infrastructure at the Kangra Coal Kusipongo Coal Reserve, Maquasa West Extension Mining Right Area
Report No.:14ERM15 4-15
Table 4-5: Kangra Coal project operational phase PM2.5 maximum GLCs at identified sensitive receptors
Receptor PM2.5 annual (µg/m3) Days of exceedance of the PM2.5 limit value of 40 µg/m³
C49 2 0
C50 3 0
C51 2 0
C52 6 3
C53 9 7
C54 14 18
C55 4 1
C56 3 0
C57 3 0
C58 2 0
C69 3 0
C70 3 0
C71 19 51
C81 3 0
C82 3 0
C83 2 0
C84 2 0
C85 2 0
C86 5 0
C87 5 0
C88 17 47
C89 8 5
C90 48 196
C91 2 0
C92 2 0
C93 4 1
C94 4 0
C95 4 0
C96 11 17
C97 7 4
C98 5 1
C99 5 0
NAAQS 20 µg/m³ 4
Notes: Text in bold indicates exceedance of the relevant air quality standard as per Section 2
Air Quality Impact Assessment for the Development and Operation of a Conveyor Belt, Adit and Associated Infrastructure at the Kangra Coal Kusipongo Coal Reserve, Maquasa West Extension Mining Right Area
Report No.:14ERM15 4-16
Decommissioning Phase 4.2.3
A qualitative assessment was performed for the decommissioning phase; it is assumed that all mining activities would have
ceased, and that all surface infrastructures would be demolished and removed.
Emissions are expected to arise from wind-blown dust from exposed stockpiles and demolition of structures and vehicle
entrainment on roads. These sources need to be properly managed and mitigated to avoid significant impacts on the
ambient environment.
4.3 Analysis of Impacts on the Environment
Predicted Impacts on Vegetation and Animals 4.3.1
No national ambient air quality standards or guidelines are available for the protection of animals and vegetation. In the
absence of national ambient standards for animals, the standards used for the protection of human beings may be used to
assess the impacts on animals. Areas of non-compliance of the relevant air quality guidelines due to the proposed project
operations are provided in Sections 4.2.
While there is little direct evidence of what the impact of dustfall on vegetation is under a South African context, a review of
European studies has shown the potential for reduced growth and photosynthetic activity in Sunflower and Cotton plants
exposed to dust fall rates greater than 400 mg/m²/day (Farmer, 1991). Dustfall modelling results for both the construction
and operational phase indicate localised impacts (Figure 4-3 and Figure 4-8).
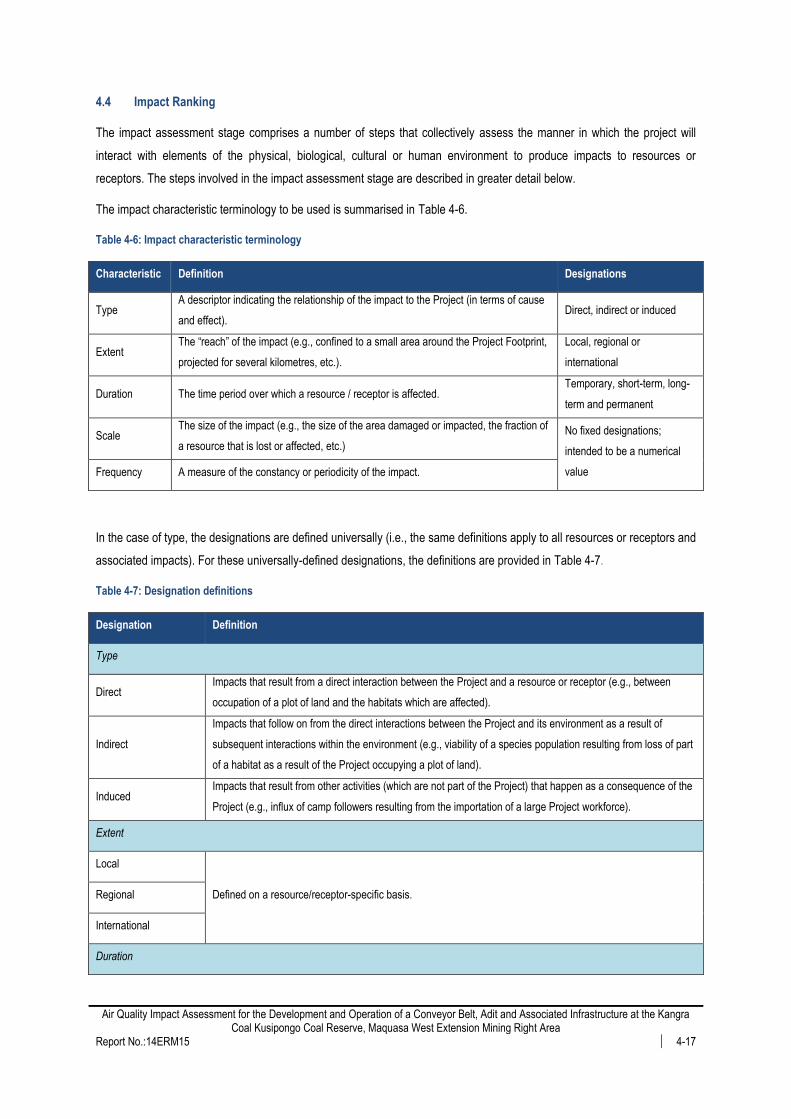
Air Quality Impact Assessment for the Development and Operation of a Conveyor Belt, Adit and Associated Infrastructure at the Kangra Coal Kusipongo Coal Reserve, Maquasa West Extension Mining Right Area
Report No.:14ERM15 4-17
4.4 Impact Ranking
The impact assessment stage comprises a number of steps that collectively assess the manner in which the project will
interact with elements of the physical, biological, cultural or human environment to produce impacts to resources or
receptors. The steps involved in the impact assessment stage are described in greater detail below.
The impact characteristic terminology to be used is summarised in Table 4-6.
Table 4-6: Impact characteristic terminology
Characteristic Definition Designations
Type A descriptor indicating the relationship of the impact to the Project (in terms of cause
and effect). Direct, indirect or induced
Extent The “reach” of the impact (e.g., confined to a small area around the Project Footprint,
projected for several kilometres, etc.).
Local, regional or
international
Duration The time period over which a resource / receptor is affected. Temporary, short-term, long-
term and permanent
Scale The size of the impact (e.g., the size of the area damaged or impacted, the fraction of
a resource that is lost or affected, etc.)
No fixed designations;
intended to be a numerical
value Frequency A measure of the constancy or periodicity of the impact.
In the case of type, the designations are defined universally (i.e., the same definitions apply to all resources or receptors and
associated impacts). For these universally-defined designations, the definitions are provided in Table 4-7.
Table 4-7: Designation definitions
Designation Definition
Type
Direct Impacts that result from a direct interaction between the Project and a resource or receptor (e.g., between
occupation of a plot of land and the habitats which are affected).
Indirect
Impacts that follow on from the direct interactions between the Project and its environment as a result of
subsequent interactions within the environment (e.g., viability of a species population resulting from loss of part
of a habitat as a result of the Project occupying a plot of land).
Induced Impacts that result from other activities (which are not part of the Project) that happen as a consequence of the
Project (e.g., influx of camp followers resulting from the importation of a large Project workforce).
Extent
Local
Defined on a resource/receptor-specific basis. Regional
International
Duration

Air Quality Impact Assessment for the Development and Operation of a Conveyor Belt, Adit and Associated Infrastructure at the Kangra Coal Kusipongo Coal Reserve, Maquasa West Extension Mining Right Area
Report No.:14ERM15 4-18
Designation Definition
Temporary
Defined on a resource/receptor-specific basis.
Short-term
Long-term
Permanent
In the case of extent and duration, the designation themselves (Table 4-6.) are universally consistent, but the definitions for
these designations will vary on a resource or receptor basis (e.g., the definition of what constitutes a “short term” duration for
a noise-related impact may differ from that of a “short term” duration for a habitat-related impact). This concept is discussed
further below.
In the case of scale and frequency, these characteristics are not assigned fixed designations, as they are typically numerical
measurements (e.g., number of acres affected, number of times per day, etc.).
The terminology and designations are provided to ensure consistency when these characteristics are described in an impact
assessment deliverable. However, it is not a requirement that each of these characteristics be discussed for every impact
identified.
An additional characteristic that pertains only to unplanned events (e.g., traffic accident, operational release of toxic gas,
community riot, etc.) is likelihood. The likelihood of an unplanned event occurring is designated using a qualitative (or semi-
quantitative, where appropriate data are available) scale, as described in Table 4-8.
Table 4-8: Definition of likelihood designations
Likelihood Definition
Unlikely The event is unlikely but may occur at some time during normal operating conditions.
Possible The event is likely to occur at some time during normal operating conditions.
Likely The event will occur during normal operating conditions (i.e., it is essentially inevitable).
Likelihood is estimated on the basis of experience and/or evidence that such an outcome has previously occurred. It is
important to note that likelihood is a measure of the degree to which the unplanned event is expected to occur, not the
degree to which an impact or effect is expected to occur as a result of the unplanned event. The latter concept is referred to
as uncertainty, and this is typically dealt with in a contextual discussion in the impact assessment deliverable, rather than in
the impact significance assignment process.
In the case of impacts resulting from unplanned events, the same resource/receptor-specific approach to concluding a
magnitude designation is utilised, but the ‘likelihood’ factor is considered, together with the other impact characteristics,
when assigning a magnitude designation. There is an inherent challenge in discussing impacts resulting from (planned)
Project activities and those resulting from unplanned events. To avoid the need to fully elaborate on an impact resulting from
Air Quality Impact Assessment for the Development and Operation of a Conveyor Belt, Adit and Associated Infrastructure at the Kangra Coal Kusipongo Coal Reserve, Maquasa West Extension Mining Right Area
Report No.:14ERM15 4-19
an unplanned event prior to discussing what could be a very low likelihood of occurrence for the unplanned event, this
methodology incorporates likelihood into the magnitude designation (i.e., in parallel with consideration of the other impact
characteristics), so that the “likelihood-factored” magnitude can then be considered with the resource or receptor
sensitivity/vulnerability/importance in order to assign impact significance. Rather than taking a prescriptive (e.g., matrix)
approach to factoring likelihood into the magnitude designation process, it is recommended that this be done based on
professional judgment, possibly assisted by quantitative data (e.g., modelling, frequency charts) where available.
Once the impact characteristics are understood, these characteristics are used (in a manner specific to the resource or
receptor in question) to assign each impact a magnitude. In summary, magnitude is a function of the extent, duration, scale,
frequency and likelihood.
Magnitude essentially describes the degree of change that the impact is likely to impart upon the resource or receptor. As in
the case of extent and duration, the magnitude designations themselves (i.e., negligible, small, medium, large) are
universally used and across resources/receptors, but the definitions for these designations will vary on a resource or
receptor basis, as is discussed further below. The universal magnitude designations are, positive, negligible, small, medium
and large.
The magnitude of impacts takes into account all the various dimensions of a particular impact in order to make a
determination as to where the impact falls on the spectrum (in the case of adverse impacts) from negligible to large. Some
impacts will result in changes to the environment that may be immeasurable, undetectable or within the range of normal
natural variation. Such changes can be regarded as essentially having no impact, and should be characterised as having a
negligible magnitude. In the case of positive impacts no magnitude will be assigned.
In addition to characterising the magnitude of impact, the other principal step necessary to assign significance for a given
impact is to define the sensitivity/vulnerability/importance of the impacted resource/receptor. There are a range of factors to
be taken into account when defining the sensitivity/vulnerability/importance of the resource/receptor, which may be physical,
biological, cultural or human. Where the resource is physical (for example, a water body) its quality, sensitivity to change
and importance (on a local, national and international scale) are considered. Where the resource or receptor is biological or
cultural (for example, the marine environment or a coral reef), its importance (for example, its local, regional, national or
international importance) and its sensitivity to the specific type of impact are considered. Where the receptor is human, the
vulnerability of the individual, community or wider societal group is considered.
Other factors may also be considered when characterising sensitivity/vulnerability/importance, such as legal protection,
government policy, stakeholder views and economic value.
As in the case of magnitude, the sensitivity/vulnerability/importance designations themselves are universally consistent, but
the definition for these designations will carry on a resource or receptor basis. The universal
sensitivity/vulnerability/importance designations are, low, medium and high.
Once magnitude of impact and sensitivity/vulnerability/importance of resource or receptor have been characterised, the
significance can be assigned for each impact. Impact significance is designated using the matrix shown in Table 4-9.
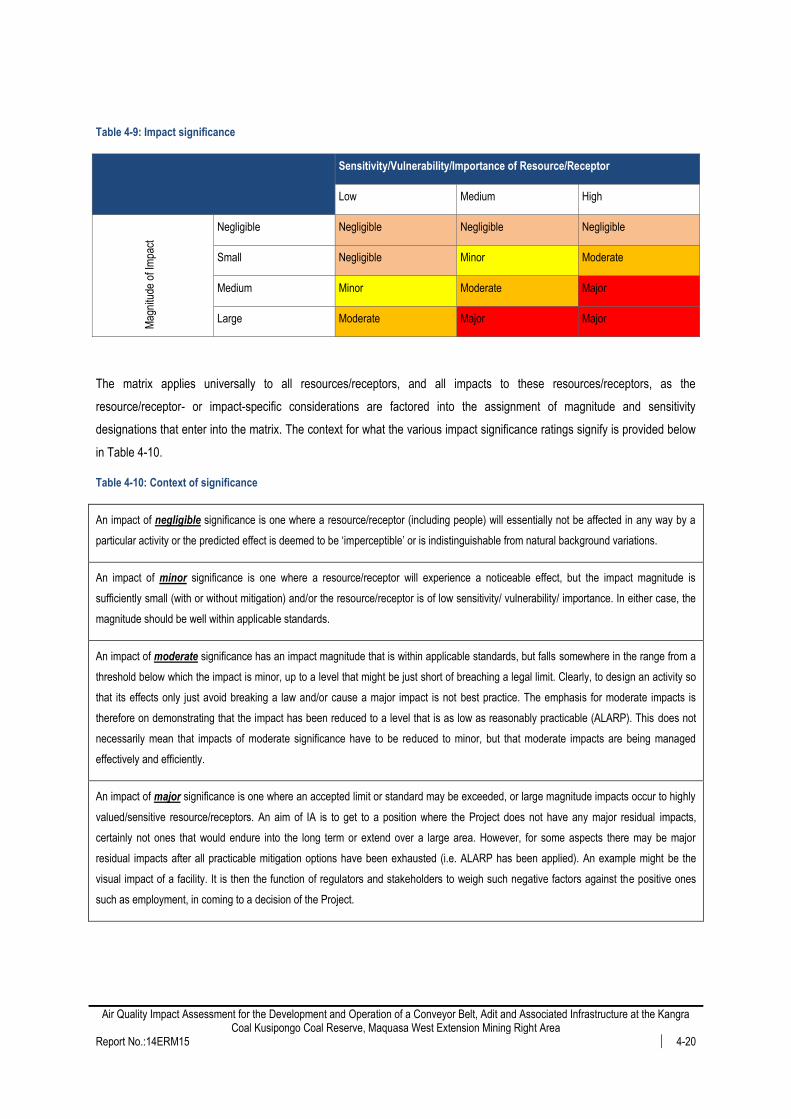
Air Quality Impact Assessment for the Development and Operation of a Conveyor Belt, Adit and Associated Infrastructure at the Kangra Coal Kusipongo Coal Reserve, Maquasa West Extension Mining Right Area
Report No.:14ERM15 4-20
Table 4-9: Impact significance
Sensitivity/Vulnerability/Importance of Resource/Receptor
Low Medium High
Mag
nitu
de o
f Im
pact
Negligible Negligible Negligible Negligible
Small Negligible Minor Moderate
Medium Minor Moderate Major
Large Moderate Major Major
The matrix applies universally to all resources/receptors, and all impacts to these resources/receptors, as the
resource/receptor- or impact-specific considerations are factored into the assignment of magnitude and sensitivity
designations that enter into the matrix. The context for what the various impact significance ratings signify is provided below
in Table 4-10.
Table 4-10: Context of significance
An impact of negligible significance is one where a resource/receptor (including people) will essentially not be affected in any way by a
particular activity or the predicted effect is deemed to be ‘imperceptible’ or is indistinguishable from natural background variations.
An impact of minor significance is one where a resource/receptor will experience a noticeable effect, but the impact magnitude is
sufficiently small (with or without mitigation) and/or the resource/receptor is of low sensitivity/ vulnerability/ importance. In either case, the
magnitude should be well within applicable standards.
An impact of moderate significance has an impact magnitude that is within applicable standards, but falls somewhere in the range from a
threshold below which the impact is minor, up to a level that might be just short of breaching a legal limit. Clearly, to design an activity so
that its effects only just avoid breaking a law and/or cause a major impact is not best practice. The emphasis for moderate impacts is
therefore on demonstrating that the impact has been reduced to a level that is as low as reasonably practicable (ALARP). This does not
necessarily mean that impacts of moderate significance have to be reduced to minor, but that moderate impacts are being managed
effectively and efficiently.
An impact of major significance is one where an accepted limit or standard may be exceeded, or large magnitude impacts occur to highly
valued/sensitive resource/receptors. An aim of IA is to get to a position where the Project does not have any major residual impacts,
certainly not ones that would endure into the long term or extend over a large area. However, for some aspects there may be major
residual impacts after all practicable mitigation options have been exhausted (i.e. ALARP has been applied). An example might be the
visual impact of a facility. It is then the function of regulators and stakeholders to weigh such negative factors against the positive ones
such as employment, in coming to a decision of the Project.
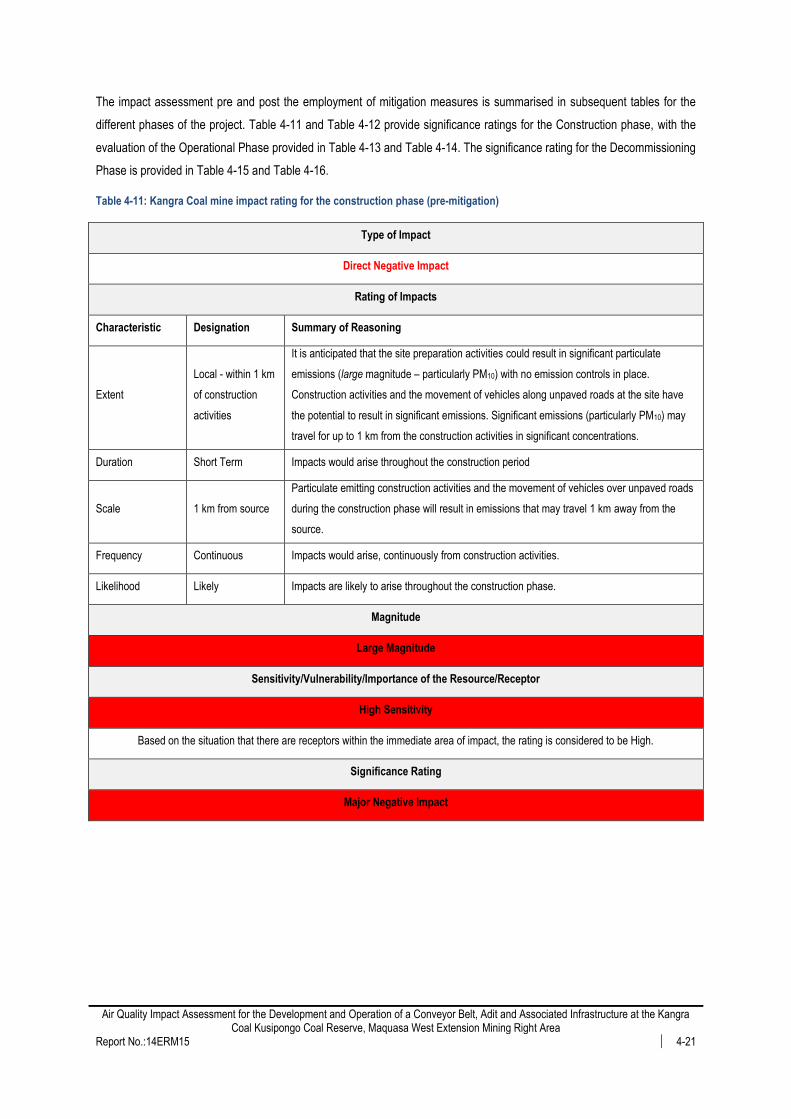
Air Quality Impact Assessment for the Development and Operation of a Conveyor Belt, Adit and Associated Infrastructure at the Kangra Coal Kusipongo Coal Reserve, Maquasa West Extension Mining Right Area
Report No.:14ERM15 4-21
The impact assessment pre and post the employment of mitigation measures is summarised in subsequent tables for the
different phases of the project. Table 4-11 and Table 4-12 provide significance ratings for the Construction phase, with the
evaluation of the Operational Phase provided in Table 4-13 and Table 4-14. The significance rating for the Decommissioning
Phase is provided in Table 4-15 and Table 4-16.
Table 4-11: Kangra Coal mine impact rating for the construction phase (pre-mitigation)
Type of Impact
Direct Negative Impact
Rating of Impacts
Characteristic Designation Summary of Reasoning
Extent
Local - within 1 km
of construction
activities
It is anticipated that the site preparation activities could result in significant particulate
emissions (large magnitude – particularly PM10) with no emission controls in place.
Construction activities and the movement of vehicles along unpaved roads at the site have
the potential to result in significant emissions. Significant emissions (particularly PM10) may
travel for up to 1 km from the construction activities in significant concentrations.
Duration Short Term Impacts would arise throughout the construction period
Scale 1 km from source
Particulate emitting construction activities and the movement of vehicles over unpaved roads
during the construction phase will result in emissions that may travel 1 km away from the
source.
Frequency Continuous Impacts would arise, continuously from construction activities.
Likelihood Likely Impacts are likely to arise throughout the construction phase.
Magnitude
Large Magnitude
Sensitivity/Vulnerability/Importance of the Resource/Receptor
High Sensitivity
Based on the situation that there are receptors within the immediate area of impact, the rating is considered to be High.
Significance Rating
Major Negative Impact
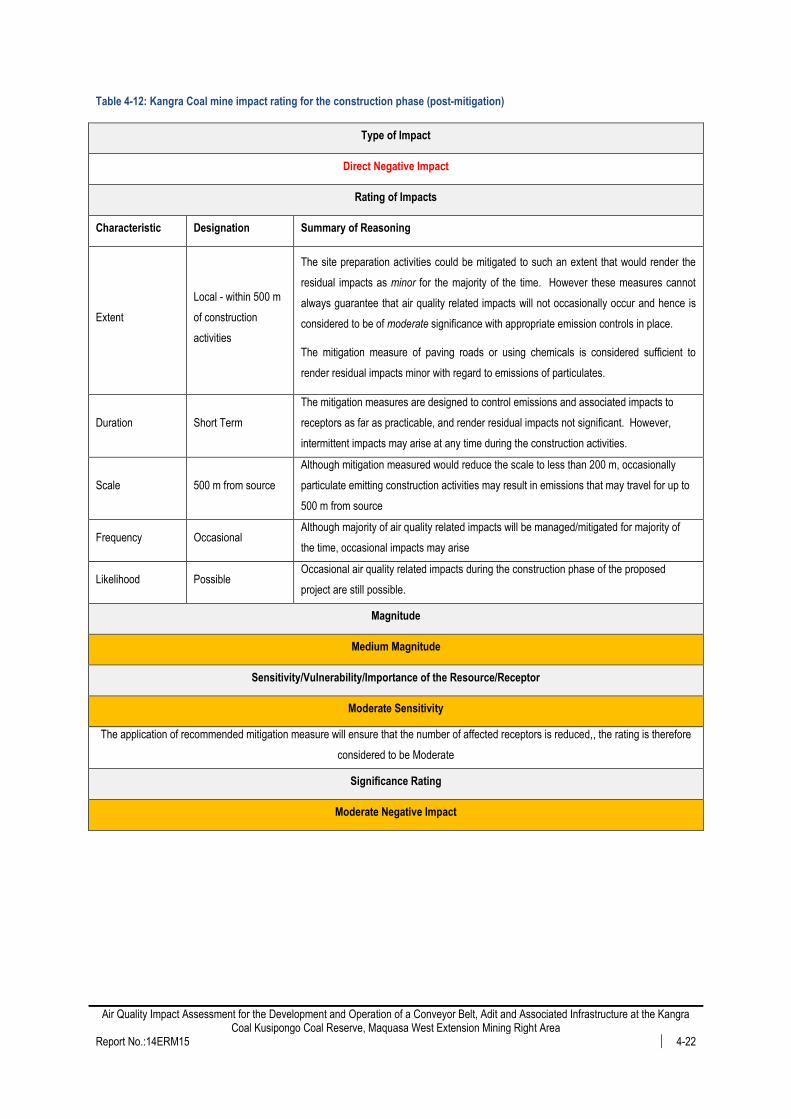
Air Quality Impact Assessment for the Development and Operation of a Conveyor Belt, Adit and Associated Infrastructure at the Kangra Coal Kusipongo Coal Reserve, Maquasa West Extension Mining Right Area
Report No.:14ERM15 4-22
Table 4-12: Kangra Coal mine impact rating for the construction phase (post-mitigation)
Type of Impact
Direct Negative Impact
Rating of Impacts
Characteristic Designation Summary of Reasoning
Extent
Local - within 500 m
of construction
activities
The site preparation activities could be mitigated to such an extent that would render the
residual impacts as minor for the majority of the time. However these measures cannot
always guarantee that air quality related impacts will not occasionally occur and hence is
considered to be of moderate significance with appropriate emission controls in place.
The mitigation measure of paving roads or using chemicals is considered sufficient to
render residual impacts minor with regard to emissions of particulates.
Duration Short Term
The mitigation measures are designed to control emissions and associated impacts to
receptors as far as practicable, and render residual impacts not significant. However,
intermittent impacts may arise at any time during the construction activities.
Scale 500 m from source
Although mitigation measured would reduce the scale to less than 200 m, occasionally
particulate emitting construction activities may result in emissions that may travel for up to
500 m from source
Frequency Occasional Although majority of air quality related impacts will be managed/mitigated for majority of
the time, occasional impacts may arise
Likelihood Possible Occasional air quality related impacts during the construction phase of the proposed
project are still possible.
Magnitude
Medium Magnitude
Sensitivity/Vulnerability/Importance of the Resource/Receptor
Moderate Sensitivity
The application of recommended mitigation measure will ensure that the number of affected receptors is reduced,, the rating is therefore
considered to be Moderate
Significance Rating
Moderate Negative Impact
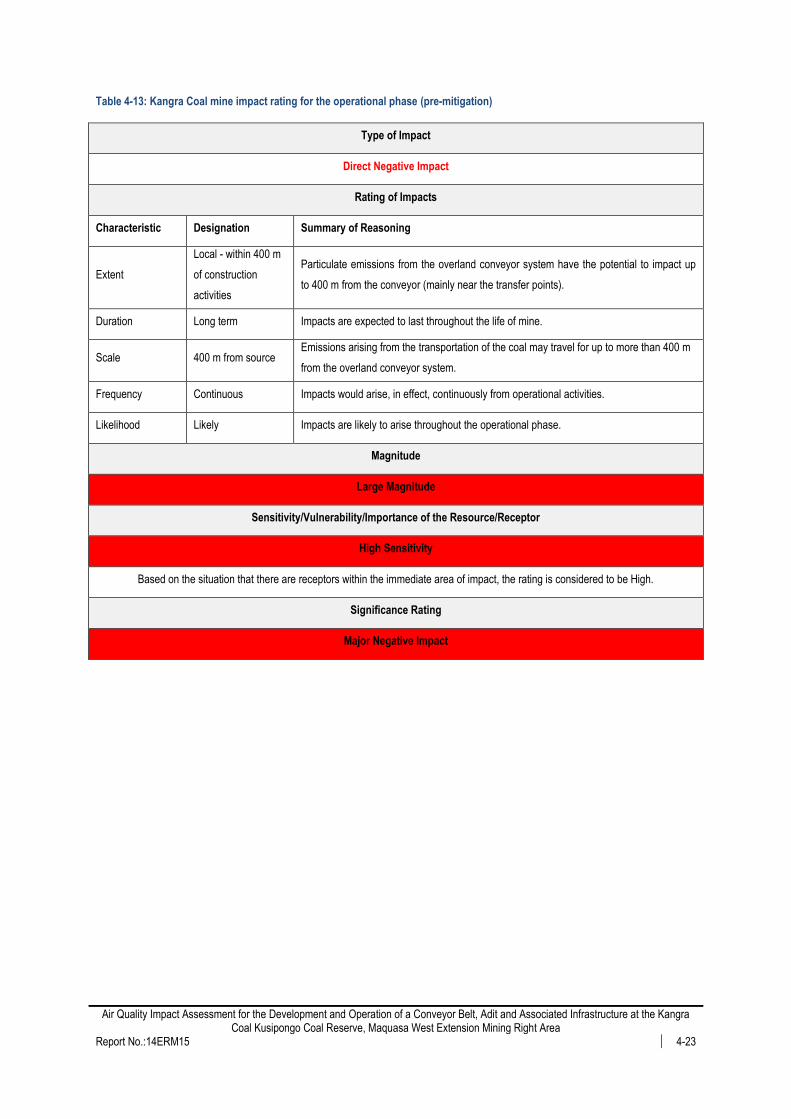
Air Quality Impact Assessment for the Development and Operation of a Conveyor Belt, Adit and Associated Infrastructure at the Kangra Coal Kusipongo Coal Reserve, Maquasa West Extension Mining Right Area
Report No.:14ERM15 4-23
Table 4-13: Kangra Coal mine impact rating for the operational phase (pre-mitigation)
Type of Impact
Direct Negative Impact
Rating of Impacts
Characteristic Designation Summary of Reasoning
Extent
Local - within 400 m
of construction
activities
Particulate emissions from the overland conveyor system have the potential to impact up
to 400 m from the conveyor (mainly near the transfer points).
Duration Long term Impacts are expected to last throughout the life of mine.
Scale 400 m from source Emissions arising from the transportation of the coal may travel for up to more than 400 m
from the overland conveyor system.
Frequency Continuous Impacts would arise, in effect, continuously from operational activities.
Likelihood Likely Impacts are likely to arise throughout the operational phase.
Magnitude
Large Magnitude
Sensitivity/Vulnerability/Importance of the Resource/Receptor
High Sensitivity
Based on the situation that there are receptors within the immediate area of impact, the rating is considered to be High.
Significance Rating
Major Negative Impact
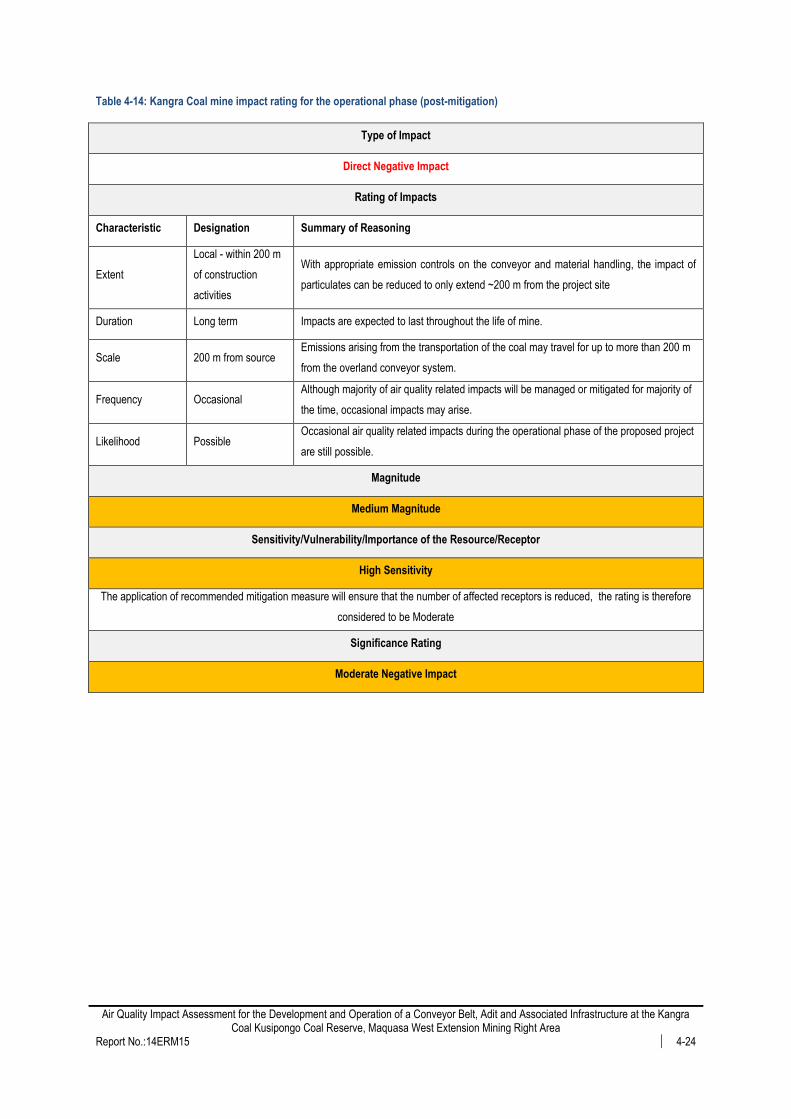
Air Quality Impact Assessment for the Development and Operation of a Conveyor Belt, Adit and Associated Infrastructure at the Kangra Coal Kusipongo Coal Reserve, Maquasa West Extension Mining Right Area
Report No.:14ERM15 4-24
Table 4-14: Kangra Coal mine impact rating for the operational phase (post-mitigation)
Type of Impact
Direct Negative Impact
Rating of Impacts
Characteristic Designation Summary of Reasoning
Extent
Local - within 200 m
of construction
activities
With appropriate emission controls on the conveyor and material handling, the impact of
particulates can be reduced to only extend ~200 m from the project site
Duration Long term Impacts are expected to last throughout the life of mine.
Scale 200 m from source Emissions arising from the transportation of the coal may travel for up to more than 200 m
from the overland conveyor system.
Frequency Occasional Although majority of air quality related impacts will be managed or mitigated for majority of
the time, occasional impacts may arise.
Likelihood Possible Occasional air quality related impacts during the operational phase of the proposed project
are still possible.
Magnitude
Medium Magnitude
Sensitivity/Vulnerability/Importance of the Resource/Receptor
High Sensitivity
The application of recommended mitigation measure will ensure that the number of affected receptors is reduced, the rating is therefore
considered to be Moderate
Significance Rating
Moderate Negative Impact

Air Quality Impact Assessment for the Development and Operation of a Conveyor Belt, Adit and Associated Infrastructure at the Kangra Coal Kusipongo Coal Reserve, Maquasa West Extension Mining Right Area
Report No.:14ERM15 4-25
Table 4-15: Kangra Coal mine impact rating for the decommissioning phase (pre-mitigation)
Type of Impact
Direct Negative Impact
Rating of Impacts
Characteristic Designation Summary of Reasoning
Extent
Local - within
500m of
construction
activities
Decommissioning activities and the movement of vehicles along unpaved roads at the site
have the potential to result in significant emissions (medium magnitude) with no emission
controls in place.
Significant emissions may travel for up to 500m from the decommissioning activities in
significant concentrations.
Duration Short term Impacts would arise throughout the decommissioning period.
Scale More than 500 m
from source
Particulate and dust emitting decommissioning activities and the movement of vehicles over
unpaved roads during the decommissioning phase will result in dust emissions may travel for
up to 500m from source.
Frequency Continuous Impacts would arise, in effect, continuously from decommissioning activities.
Likelihood Likely Impacts will arise throughout the decommissioning period
Magnitude
Medium Magnitude
Sensitivity/Vulnerability/Importance of the Resource/Receptor
Moderate Sensitivity
Based on the situation that there are receptors within the immediate area of impact, the rating is considered to be Moderate
Significance Rating
Moderate Negative Impact
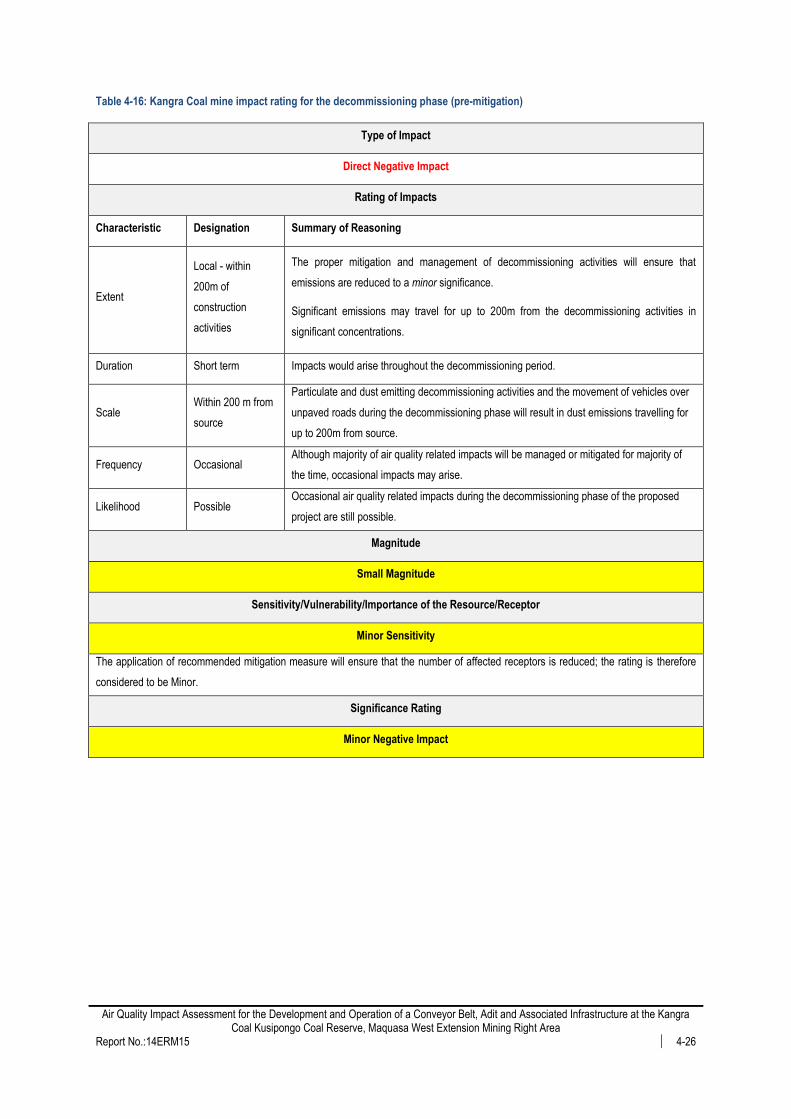
Air Quality Impact Assessment for the Development and Operation of a Conveyor Belt, Adit and Associated Infrastructure at the Kangra Coal Kusipongo Coal Reserve, Maquasa West Extension Mining Right Area
Report No.:14ERM15 4-26
Table 4-16: Kangra Coal mine impact rating for the decommissioning phase (pre-mitigation)
Type of Impact
Direct Negative Impact
Rating of Impacts
Characteristic Designation Summary of Reasoning
Extent
Local - within
200m of
construction
activities
The proper mitigation and management of decommissioning activities will ensure that
emissions are reduced to a minor significance.
Significant emissions may travel for up to 200m from the decommissioning activities in
significant concentrations.
Duration Short term Impacts would arise throughout the decommissioning period.
Scale Within 200 m from
source
Particulate and dust emitting decommissioning activities and the movement of vehicles over
unpaved roads during the decommissioning phase will result in dust emissions travelling for
up to 200m from source.
Frequency Occasional Although majority of air quality related impacts will be managed or mitigated for majority of
the time, occasional impacts may arise.
Likelihood Possible Occasional air quality related impacts during the decommissioning phase of the proposed
project are still possible.
Magnitude
Small Magnitude
Sensitivity/Vulnerability/Importance of the Resource/Receptor
Minor Sensitivity
The application of recommended mitigation measure will ensure that the number of affected receptors is reduced; the rating is therefore
considered to be Minor.
Significance Rating
Minor Negative Impact

Air Quality Impact Assessment for the Development and Operation of a Conveyor Belt, Adit and Associated Infrastructure at the Kangra Coal Kusipongo Coal Reserve, Maquasa West Extension Mining Right Area
Report No.:14ERM15 5-1
5 RECOMMENDED AIR QUALITY MEASURES
The air quality assessment focuses on the impacts on human health. The management plan given, thus aims to provide
mitigation measures that can be utilised to reduce the impacts on humans and improve ambient air quality.
5.1 Source Ranking
The ranking of sources serves to confirm, or where necessary revise, the current understanding of the significance of
specific sources, and to evaluate the emission reduction potentials required for each source. Sources of emissions for
simulated scenarios are ranked based on emission and impacts.
Source Ranking by Emissions 5.1.1
Source ranking by emissions highlights sources of concern based on the emission rates. Construction phase generally has
medium to high emission rates, over a limited period of time. Emissions from this phase of the project are highly influenced
by the size of the area constructed and the duration of the operation; this therefore means that large areas constructed over
an extended period of time are likely to result in high emissions.
For the operational phase, wind-blown dust from the conveyor had high emission rates, when compared to material handling
points. This is influenced by the conveyor parameters such as the length, width and lack of a roof and side coverings.
The decommissioning phase of the project is likely to result in low emissions, this is because most operations would have
ceased. Emissions may arise from vehicle entrainment on unpaved and the maintenance of infrastructure and the
demolishing of building and other structures.
Source Ranking by Impacts 5.1.2
Source ranking by impacts highlights sources of concern based on simulated GLCs. Construction phase impacts are
predicted to be major in significance; however impacts will have a short duration. Modelling results show that construction
impacts will affect receptors in close proximity to the project site. To ensure minimal impacts on both human health and the
environment proper and effective mitigation measures should be put in place during this phase of the project, this will reduce
the significance of the impacts to moderate.
Operational phase impacts are mostly as result of wind-blown dust from the conveyor. Material handling impacts are minor
and in compliance with relevant standards. This is true for all pollutants modelled. Pre-mitigation impacts are expected to
have a major significance, the implementation of recommended mitigation measures will however result in moderate
significance for the project.
The decommissioning phase is expected to have minimal impacts on human health and the environment; with significance
rating of moderate pre-mitigation and minor post-mitigation.
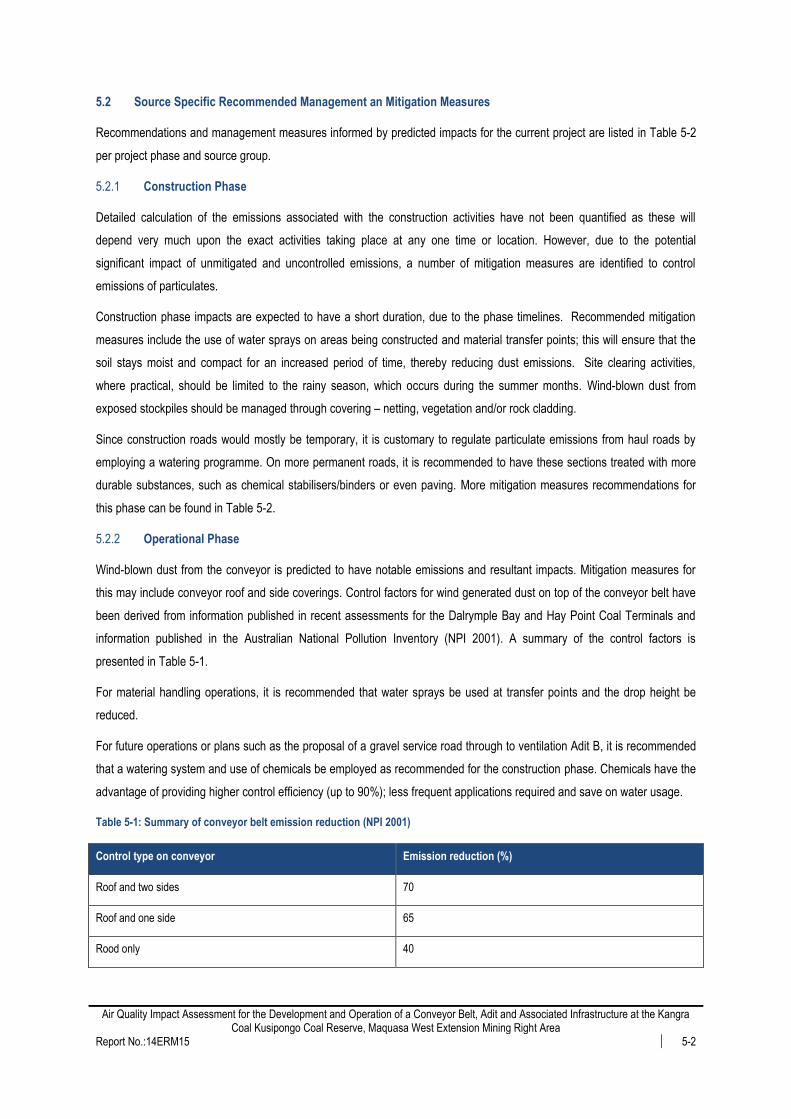
Air Quality Impact Assessment for the Development and Operation of a Conveyor Belt, Adit and Associated Infrastructure at the Kangra Coal Kusipongo Coal Reserve, Maquasa West Extension Mining Right Area
Report No.:14ERM15 5-2
5.2 Source Specific Recommended Management an Mitigation Measures
Recommendations and management measures informed by predicted impacts for the current project are listed in Table 5-2
per project phase and source group.
Construction Phase 5.2.1
Detailed calculation of the emissions associated with the construction activities have not been quantified as these will
depend very much upon the exact activities taking place at any one time or location. However, due to the potential
significant impact of unmitigated and uncontrolled emissions, a number of mitigation measures are identified to control
emissions of particulates.
Construction phase impacts are expected to have a short duration, due to the phase timelines. Recommended mitigation
measures include the use of water sprays on areas being constructed and material transfer points; this will ensure that the
soil stays moist and compact for an increased period of time, thereby reducing dust emissions. Site clearing activities,
where practical, should be limited to the rainy season, which occurs during the summer months. Wind-blown dust from
exposed stockpiles should be managed through covering – netting, vegetation and/or rock cladding.
Since construction roads would mostly be temporary, it is customary to regulate particulate emissions from haul roads by
employing a watering programme. On more permanent roads, it is recommended to have these sections treated with more
durable substances, such as chemical stabilisers/binders or even paving. More mitigation measures recommendations for
this phase can be found in Table 5-2.
Operational Phase 5.2.2
Wind-blown dust from the conveyor is predicted to have notable emissions and resultant impacts. Mitigation measures for
this may include conveyor roof and side coverings. Control factors for wind generated dust on top of the conveyor belt have
been derived from information published in recent assessments for the Dalrymple Bay and Hay Point Coal Terminals and
information published in the Australian National Pollution Inventory (NPI 2001). A summary of the control factors is
presented in Table 5-1.
For material handling operations, it is recommended that water sprays be used at transfer points and the drop height be
reduced.
For future operations or plans such as the proposal of a gravel service road through to ventilation Adit B, it is recommended
that a watering system and use of chemicals be employed as recommended for the construction phase. Chemicals have the
advantage of providing higher control efficiency (up to 90%); less frequent applications required and save on water usage.
Table 5-1: Summary of conveyor belt emission reduction (NPI 2001)
Control type on conveyor Emission reduction (%)
Roof and two sides 70
Roof and one side 65
Rood only 40

Air Quality Impact Assessment for the Development and Operation of a Conveyor Belt, Adit and Associated Infrastructure at the Kangra Coal Kusipongo Coal Reserve, Maquasa West Extension Mining Right Area
Report No.:14ERM15 5-3
Decommissioning Phase 5.2.3
The biggest contributor to the decommissioning phase particulates emissions is expected to be vehicle entrainment on
unpaved and wind-blown dust from exposed stockpiles.
Depending on traffic volumes chemicals or water sprays should be used on unpaved roads. Capping or covering stockpiles
would highly reduce the potential for wind-blown dust (Table 5-2).
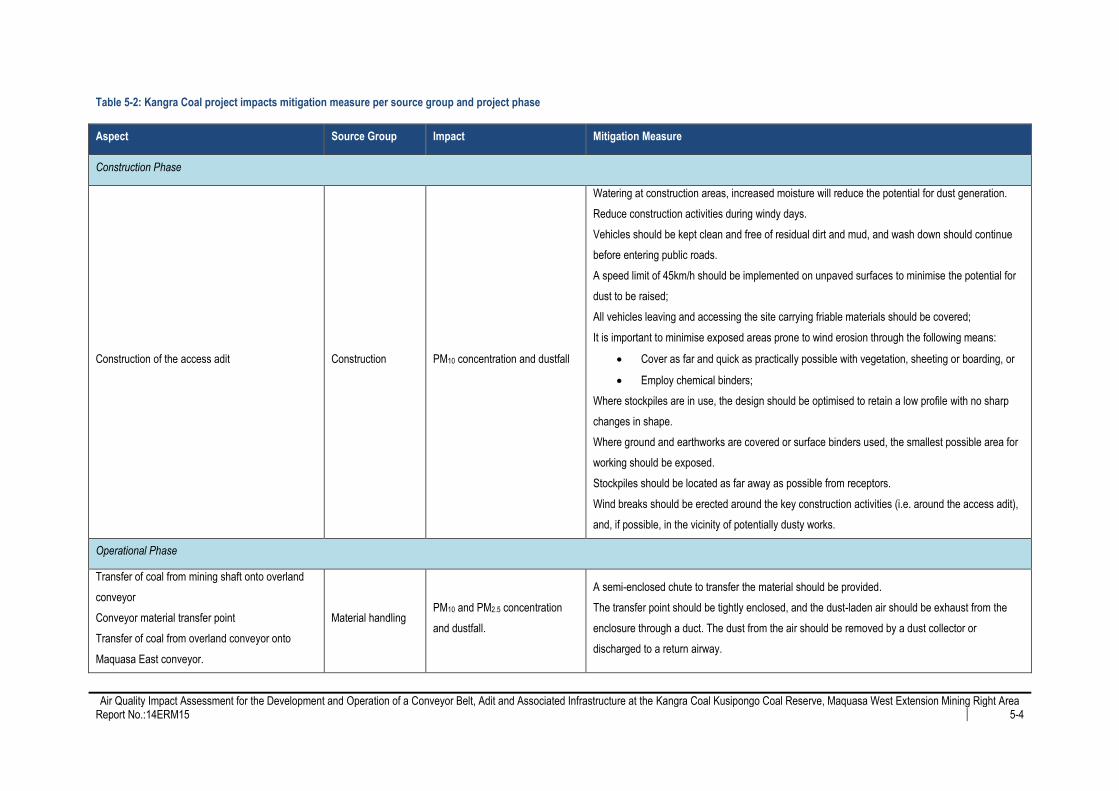
Air Quality Impact Assessment for the Development and Operation of a Conveyor Belt, Adit and Associated Infrastructure at the Kangra Coal Kusipongo Coal Reserve, Maquasa West Extension Mining Right Area
Report No.:14ERM15 5-4
Table 5-2: Kangra Coal project impacts mitigation measure per source group and project phase
Aspect Source Group Impact Mitigation Measure
Construction Phase
Construction of the access adit Construction PM10 concentration and dustfall
Watering at construction areas, increased moisture will reduce the potential for dust generation.
Reduce construction activities during windy days.
Vehicles should be kept clean and free of residual dirt and mud, and wash down should continue
before entering public roads.
A speed limit of 45km/h should be implemented on unpaved surfaces to minimise the potential for
dust to be raised;
All vehicles leaving and accessing the site carrying friable materials should be covered;
It is important to minimise exposed areas prone to wind erosion through the following means:
Cover as far and quick as practically possible with vegetation, sheeting or boarding, or
Employ chemical binders;
Where stockpiles are in use, the design should be optimised to retain a low profile with no sharp
changes in shape.
Where ground and earthworks are covered or surface binders used, the smallest possible area for
working should be exposed.
Stockpiles should be located as far away as possible from receptors.
Wind breaks should be erected around the key construction activities (i.e. around the access adit),
and, if possible, in the vicinity of potentially dusty works.
Operational Phase
Transfer of coal from mining shaft onto overland
conveyor
Conveyor material transfer point
Transfer of coal from overland conveyor onto
Maquasa East conveyor.
Material handling PM10 and PM2.5 concentration
and dustfall.
A semi-enclosed chute to transfer the material should be provided.
The transfer point should be tightly enclosed, and the dust-laden air should be exhaust from the
enclosure through a duct. The dust from the air should be removed by a dust collector or
discharged to a return airway.
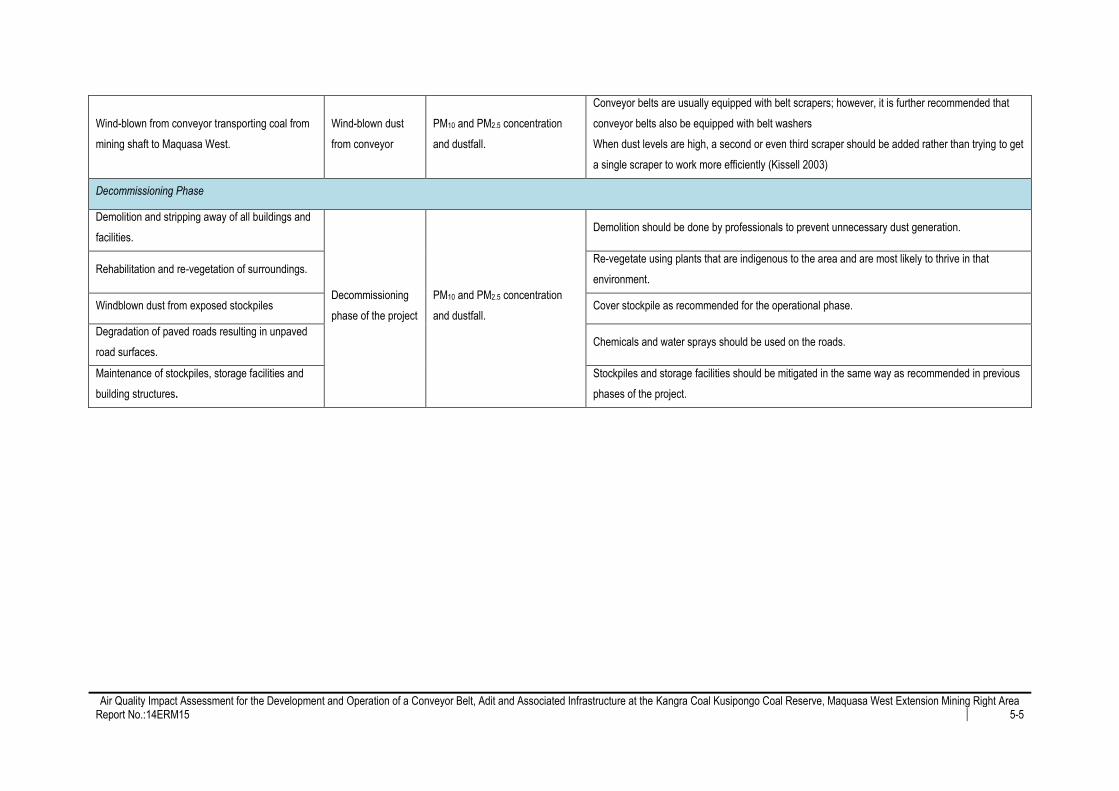
Air Quality Impact Assessment for the Development and Operation of a Conveyor Belt, Adit and Associated Infrastructure at the Kangra Coal Kusipongo Coal Reserve, Maquasa West Extension Mining Right Area
Report No.:14ERM15 5-5
Wind-blown from conveyor transporting coal from
mining shaft to Maquasa West.
Wind-blown dust
from conveyor
PM10 and PM2.5 concentration
and dustfall.
Conveyor belts are usually equipped with belt scrapers; however, it is further recommended that
conveyor belts also be equipped with belt washers
When dust levels are high, a second or even third scraper should be added rather than trying to get
a single scraper to work more efficiently (Kissell 2003)
Decommissioning Phase
Demolition and stripping away of all buildings and
facilities.
Decommissioning
phase of the project
PM10 and PM2.5 concentration
and dustfall.
Demolition should be done by professionals to prevent unnecessary dust generation.
Rehabilitation and re-vegetation of surroundings. Re-vegetate using plants that are indigenous to the area and are most likely to thrive in that
environment.
Windblown dust from exposed stockpiles Cover stockpile as recommended for the operational phase.
Degradation of paved roads resulting in unpaved
road surfaces. Chemicals and water sprays should be used on the roads.
Maintenance of stockpiles, storage facilities and
building structures.
Stockpiles and storage facilities should be mitigated in the same way as recommended in previous
phases of the project.
Air Quality Impact Assessment for the Development and Operation of a Conveyor Belt, Adit and Associated Infrastructure at the Kangra Coal Kusipongo Coal Reserve, Maquasa West Extension Mining Right Area
Report No.:14ERM15 5-6
5.3 Performance Indicators
Key performance indicators against which progress of implemented mitigation and management measures may be
assessed form the basis for all effective environmental management practices. In the definition of key performance
indicators careful attention is usually paid to ensure that progress towards their achievement is measurable, and that the
targets set are achievable given available technology and experience.
Performance indicators are usually selected to reflect both the source of the emission directly (source monitoring) and the
impact on the receiving environment (ambient air quality monitoring). Ensuring that no visible evidence of windblown dust
exists represents an example of a source-based indicator, whereas maintaining off-site dustfall levels to below 600 mg/m²-
day represents an impact- or receptor-based performance indicator.
Source monitoring at mining activities can be challenging due to the fugitive and wind-dependant nature of particulate
emissions. The focus is therefore rather on receptor based performance indicators i.e. compliance with ambient air quality
standards and dustfall regulations. Due to the number of receptors in the vicinity of the project site, it is highly recommended
that air quality guidelines listed in Section 2 be adopted by Kangra Coal as receptor-based objectives.
Ambient Air Quality Monitoring 5.3.1
Air quality impacts as result of the operation Kangra Coal project are predicted to be major; this is mainly influenced by
sensitive receptors around the project site. . Fine particulates (specifically PM10) and ambient dustfall monitoring is
recommended so as to ascertain the modelling results. Monitoring should commence during the construction phase and
continue throughout the life of the project. The monitoring programme is designed to assist in the decision making process
around the implementation of mitigation, verify the efficiency of mitigation measures and ensure that unacceptable impacts
are not arising at nearby sensitive receptors.
Monitoring effort should be focused on areas (Figure 5-1), where simulated concentrations exceed the PM10 daily standard
of 75 µg/m³, such as at receptors C88, C90 and C72. PM10 monitoring should be undertaken using devices that are
recognised by the DEA for compliance purposes. In this regard, gravimetric sampling (filter-based methods) is required. The
use of “mini-vol”, filter based sampling requires the daily changing of filters. Appendix A provides a detailed discussion
regarding the various types of PM10 monitors on the market.
During the construction phase the monitoring data should be reviewed on a daily basis; and during the operational phase,
should be considered on a monthly basis. Where PM10 emissions associated with the site are above the NAAQS
investigations should be made into the sources of emissions and measures implemented to manage emissions.
Dustfall monitoring should be carried out using the American Society of Testing and Materials (ASTM) methodology. The
apparatus for monitoring consists of a bucket approximately 150 mm in diameter and 300 mm deep in which dust is
collected for a period between 28 and 33 days. Solid matter larger than 2 mm in size (insects etc.) is removed by screening.
The remaining solid matter is washed from the bucket, filtered and weighed. Use of this method will ensure that sampled
dustfall rates are comparable to the NDCR.
A dustfall monitoring network should be expanded to include areas around sensitive receptors, conveyor route and material
handling points. Indicatives sites are illustrated in Figure 5-1. The proposed monitoring locations may be revised annually or
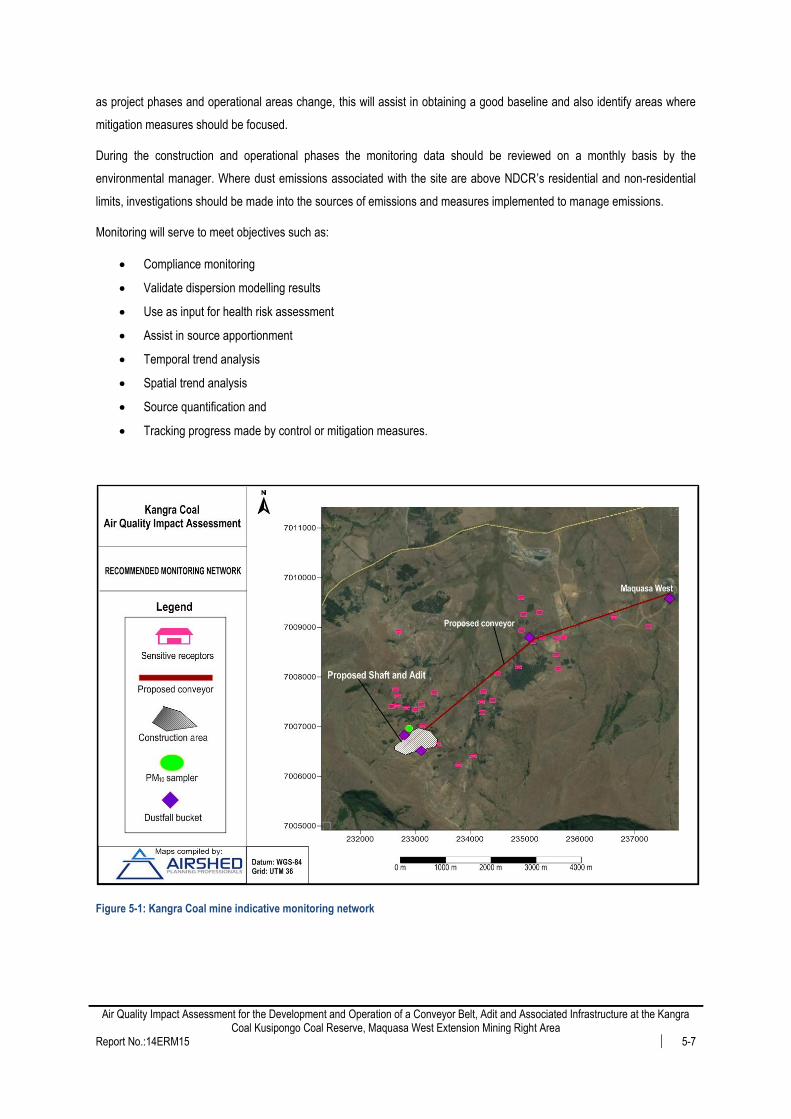
Air Quality Impact Assessment for the Development and Operation of a Conveyor Belt, Adit and Associated Infrastructure at the Kangra Coal Kusipongo Coal Reserve, Maquasa West Extension Mining Right Area
Report No.:14ERM15 5-7
as project phases and operational areas change, this will assist in obtaining a good baseline and also identify areas where
mitigation measures should be focused.
During the construction and operational phases the monitoring data should be reviewed on a monthly basis by the
environmental manager. Where dust emissions associated with the site are above NDCR’s residential and non-residential
limits, investigations should be made into the sources of emissions and measures implemented to manage emissions.
Monitoring will serve to meet objectives such as:
Compliance monitoring
Validate dispersion modelling results
Use as input for health risk assessment
Assist in source apportionment
Temporal trend analysis
Spatial trend analysis
Source quantification and
Tracking progress made by control or mitigation measures.
Figure 5-1: Kangra Coal mine indicative monitoring network

Air Quality Impact Assessment for the Development and Operation of a Conveyor Belt, Adit and Associated Infrastructure at the Kangra Coal Kusipongo Coal Reserve, Maquasa West Extension Mining Right Area
Report No.:14ERM15 5-8
Visual Inspection 5.3.2
During the construction, operation and decommissioning phase’s commitment should be made to undertake visual
inspections of activities resulting in dust on-site. In the event that activities on site are observed to be generating significant
airborne dust, the activity generating the emissions should be reviewed and as required, additional mitigation implemented,
or if required, activities should be ceased. The visual inspections should be undertaken on a daily basis, and should reflect
the ethos of ‘see it, own it’, in terms of identifying and addressing significant dust emissions. Where significant emissions are
observed, these should be recorded by the environmental manager in accordance with the quality management system.
This may include electronic record keeping as well as hardcopy reports. On the basis of the reports, where there are
activities that repeatedly result in significant emissions, further investigations should be undertaken to reduce emissions.
This should be the role of the site environmental manager, or nominated representative.
Community Complaints 5.3.3
A register of community complaints should be maintained by the environmental manager. Where complaints are received
these should be investigated and verified, where substantiated complaints are identified, an investigation into the cause of
the complaint should be undertaken, and as required, measures implemented to reduce the future potential of such impacts
reoccurring.

Air Quality Impact Assessment for the Development and Operation of a Conveyor Belt, Adit and Associated Infrastructure at the Kangra Coal Kusipongo Coal Reserve, Maquasa West Extension Mining Right Area
Report No.:14ERM15 6-1
6 CONCLUSIONS AND RECOMMENDATIONS
6.1 Main Findings
Baseline Environment 6.1.1
Kangra Coal project is situated in an area with minimal mining and industrial activities, with the exception of other Kangra
Coal mining operations. The surrounding area is mainly used for farming and is mostly populated by rural communities, with
St Helena approximately 10 km northeast and Driefontien approximately 12 km east of the project site.
The project area is characterised by wind from the westerly and easterly direction. The north and south directions receive
little airflow, with less than 4% frequency of occurrence of winds with varying velocities. Temperatures at the project site
range between a minimum of -1°C in June and July, and a maximum of 30°C in November. The area receives summer rain,
with winter months receiving little to no rain.
Air Quality Impact Assessment 6.1.2
Construction phase unmitigated impacts are expected to be major; arising from varying activities such as site clearing,
vehicle entrainment on unpaved roads and infrastructure development. The employment of proper mitigation such as the
use of water sprays or chemicals on roads should reduce the impacts to have a moderate significance.
Dispersion modelling results for the operational phase indicates that daily PM10 and PM2.5 GLCs will adversely affect nearby
sensitive receptors. Simulated dustfall rates are expected to be limited to operational areas such as material transfer points.
The unmitigated overall impact rating for this phase is thus major, but with proper implementation of mitigation measure the
rating may be reduced to moderate.
The decommissioning phase of the project is likely to have a moderate impact rating pre-mitigation; this is because this
phase has minimal activities. It must however be noted that mitigation measures need to be efficiently employed to ensure
that the phase has a minor impact rating.
Monitoring 6.1.3
Fine particulates monitoring (especially PM10) and the expansion of the dustfall monitoring network are recommended.
Indicative sampling sites were informed by the locations of sensitive receptors and dispersion modelling results. Monitoring
should commence during the construction phase of the project and continue throughout the life of mine.
6.2 Conclusion
The main conclusion is that Kangra Coal mine operation is likely to result in major impacts without mitigation, this is largely
due to the close proximity of sensitive receptors to the project. The application of mitigation measures as per Section 5.2
would reduce the significance of impacts to moderate.
6.3 Recommendations
To ensure the lowest possible impact on nearby communities it is recommended that the air quality management plan as set
out in this report should be adopted. This includes the mitigation of sources of emission, management of associated air
quality impacts and ambient air quality monitoring.
Air Quality Impact Assessment for the Development and Operation of a Conveyor Belt, Adit and Associated Infrastructure at the Kangra Coal Kusipongo Coal Reserve, Maquasa West Extension Mining Right Area
Report No.:14ERM15 7-1
7 REFERENCES
Baig N A, Dean AT and Skiver D W,1994 Successful use of belt washers. In: Proceedings of the American Power
Conference. Chicago, IL: Illinois Institute of Technology, pp. 976-978.
Burger L 2013, Air Quality Impact Assessment Report, Ref: 0120258_V5.0_AQIA. Airshed Planning Professionals
Cachier, H, 1992, Biomass burning sources. Encyclopedia of Earth System Science, Academic Press Inc., 1, 377 – 385.
DEA, 2014 Regulations Regarding Air Dispersion Modelling, Government Gazette No. 37804 of 11 July 2014
DEA, 2012 National Dust Control Regulations Government, Gazette No. 36974 of 1 November 2013
DEA, 2012 National Ambient Air Quality Standards for Particulate Matter with Aerodynamic Diameter less than 2.5 Micron
Meter (PM2.5), Government Gazette No. 35463 of 29 June 2012
DEA, 2009 National Ambient Air Quality Standards, Government Gazette No. 32816 of 24 December 2009
DEAT, 2007 Declaration of the Highveld Priority Area in Terms of the Section 18(1) o the National Environmental
Management: Air Quality Act, 2004 (Act No 39 of 2004), Government Gazette No. 30518 of 23 November 2007
DEA, 2005 National Environmental Management Air Quality Act (Act No. 39 of 2004), Government Gazette No. 27318 of 11
September 2005
DEA, 2011 The Highveld Priority Area Air Quality Management Plan Department of Environmental Affairs, Chief Directorate:
Air Quality Management, pp 291
De Longueville, F., Ozer, P., Doumbia, S. & Henry, S., 2013 Desert dust impacts on human health: an alarming worldwide
reality and a need for studies in West Africa.. International Journal of Biometeorology, 57, 1-19.
US EPA, 2006. AP-42, 5th Edition, Volume 1, Chapter 13: Miscellaneous Sources, 13.2 Introduction to Fugitive Dust
Sources, 13.2.5 Industrial Wind Erosion. [Online] Available at: http://www.epa.gov/ttn/chief/ap42/
US EPA 1999. Compilation of Air Pollution Emission Factors (AP-42), 6th Edition, Volume 1, as contained in the AirCHIEF
(AIR Clearinghouse for Inventories and Emission Factors), Environmental Protection Agency, Research Triangle Park,
North Carolina
US EPA, 1996, Compilation of Air Pollution Emission Factors (AP-42), 6th Edition, Volume 1, as contained in the AirCHIEF
(AIR Clearinghouse for Inventories and Emission Factors) CD-ROM (compact disk read only memory), US Environmental
Protection Agency, Research Triangle Park, North Carolina.
Farmer A M, 1991 The effects of dust on vegetation-A review. Environmental Pollution pp79:63-75
Ginoux, P., Prospero, J. M., Gill, T.E., Hsu, C., & Zhao, M., 2012. Global-scale attribution of anthropogenic and natural
dust sources and their emission rates based on MODIS Deep Blue aerosol products. Reviews of Geophysics, 50, 1 36.
Goldreich, Y. and Tyson, P.D,1988, Diurnal and inter-diurnal variations in large-scale atmospheric turbulence over
southern Africa, South African Geographical Journal, 70, 48-56.
Goudie, A. S., 2009. Dust storms: Recent developments. Journal of Environmental Management, 90, 89–94.
Haskins G and DOceanics, 1975. Hay Point Environmental Planning Study.
Air Quality Impact Assessment for the Development and Operation of a Conveyor Belt, Adit and Associated Infrastructure at the Kangra Coal Kusipongo Coal Reserve, Maquasa West Extension Mining Right Area
Report No.:14ERM15 7-2
Held,G., Gore,B.J., Surridge, A.D., Tosen, G.R., Turner,C.R., & Walmsley (eds), 1996. Air Pollution and its impacts on
the South African Highveld. Environmental Scientific Association, Cleveland, 144 pp.
Karanasiou, A., Moreno , N ., Moreno, T., Viana , M., de Leeuw , F., Querol, X., 2012. Health effects from Sahara dust
episodes in Europe: literature review and research gaps.. Environment International, 15, 107-114.
Kissell F.N, 2003 Handbook for Dust Control in Mining, Information Circular 9465, U.S. Department Of Health And Human
Services.
MAC, 1980 Design guidelines for dust control at mine shafts and surface operations. 3rd ed. Ottawa, Ontario, Canada:
Mining Association of Canada.
NPI, 2012. Emission Estimation Technique Manual for Mining
NPI, 2001 Emission Estimation Technique Manual for Mining Version 2.3, Australian Government, Department of the
Environment, Water, Heritage and the Arts.
Onursal, B. and S.P. Gautam, 1997: Vehicular Air Pollution: Experiences from Seven Latin American Urban Centers
Parrett, FW, 1992, Dust emission – a review, Applied Environmetrics (Balwyn).
Pasquill, F. and Smith, F.B, 1983, Atmospheric Diffusion. Study of the Dispersion of Windborne Material from Industrial
and Other Sources, Ellis Horwood Ltd., Chichester, 437 pp.
Piketh, S.J., Annegarn, H.J. and Kneen, M.A., 1996. Regional scale impacts of biomass burning emissions over southern
Africa, in J.S. Levine (ed.), Biomass Burning and Global Change, MIT Press, Cambridge, 320-326.
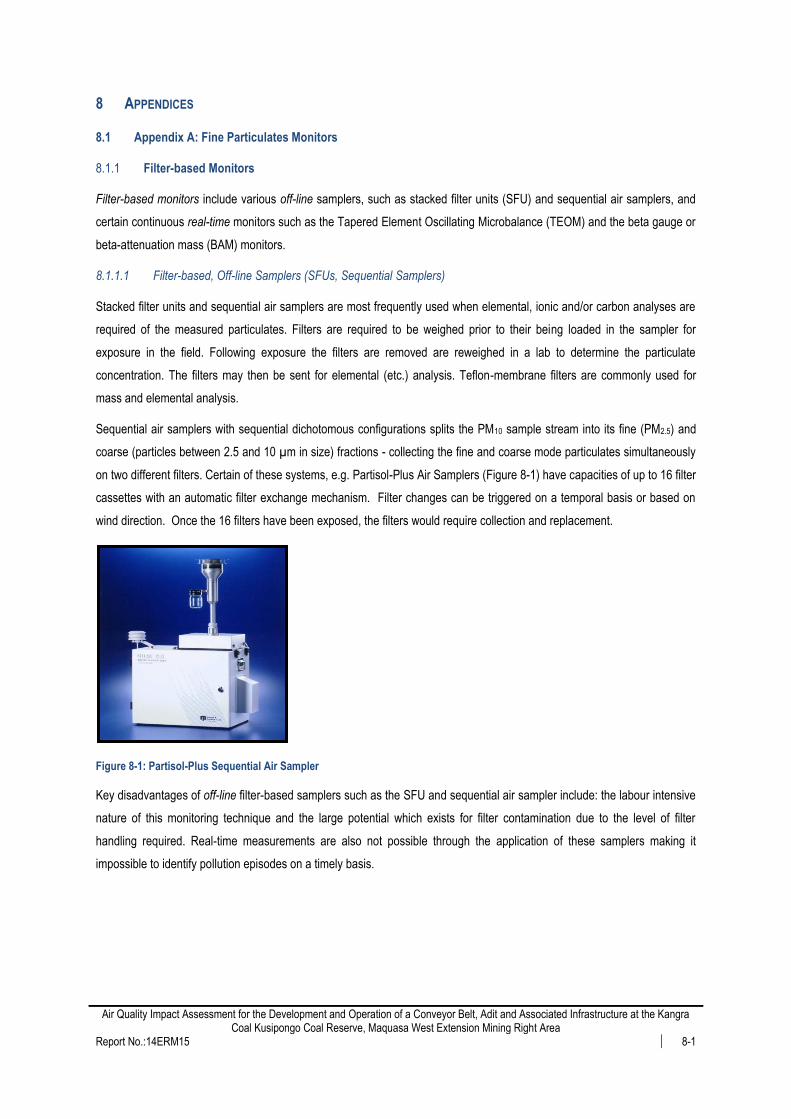
Air Quality Impact Assessment for the Development and Operation of a Conveyor Belt, Adit and Associated Infrastructure at the Kangra Coal Kusipongo Coal Reserve, Maquasa West Extension Mining Right Area
Report No.:14ERM15 8-1
8 APPENDICES
8.1 Appendix A: Fine Particulates Monitors
Filter-based Monitors 8.1.1
Filter-based monitors include various off-line samplers, such as stacked filter units (SFU) and sequential air samplers, and
certain continuous real-time monitors such as the Tapered Element Oscillating Microbalance (TEOM) and the beta gauge or
beta-attenuation mass (BAM) monitors.
8.1.1.1 Filter-based, Off-line Samplers (SFUs, Sequential Samplers)
Stacked filter units and sequential air samplers are most frequently used when elemental, ionic and/or carbon analyses are
required of the measured particulates. Filters are required to be weighed prior to their being loaded in the sampler for
exposure in the field. Following exposure the filters are removed are reweighed in a lab to determine the particulate
concentration. The filters may then be sent for elemental (etc.) analysis. Teflon-membrane filters are commonly used for
mass and elemental analysis.
Sequential air samplers with sequential dichotomous configurations splits the PM10 sample stream into its fine (PM2.5) and
coarse (particles between 2.5 and 10 µm in size) fractions - collecting the fine and coarse mode particulates simultaneously
on two different filters. Certain of these systems, e.g. Partisol-Plus Air Samplers (Figure 8-1) have capacities of up to 16 filter
cassettes with an automatic filter exchange mechanism. Filter changes can be triggered on a temporal basis or based on
wind direction. Once the 16 filters have been exposed, the filters would require collection and replacement.
Figure 8-1: Partisol-Plus Sequential Air Sampler
Key disadvantages of off-line filter-based samplers such as the SFU and sequential air sampler include: the labour intensive
nature of this monitoring technique and the large potential which exists for filter contamination due to the level of filter
handling required. Real-time measurements are also not possible through the application of these samplers making it
impossible to identify pollution episodes on a timely basis.
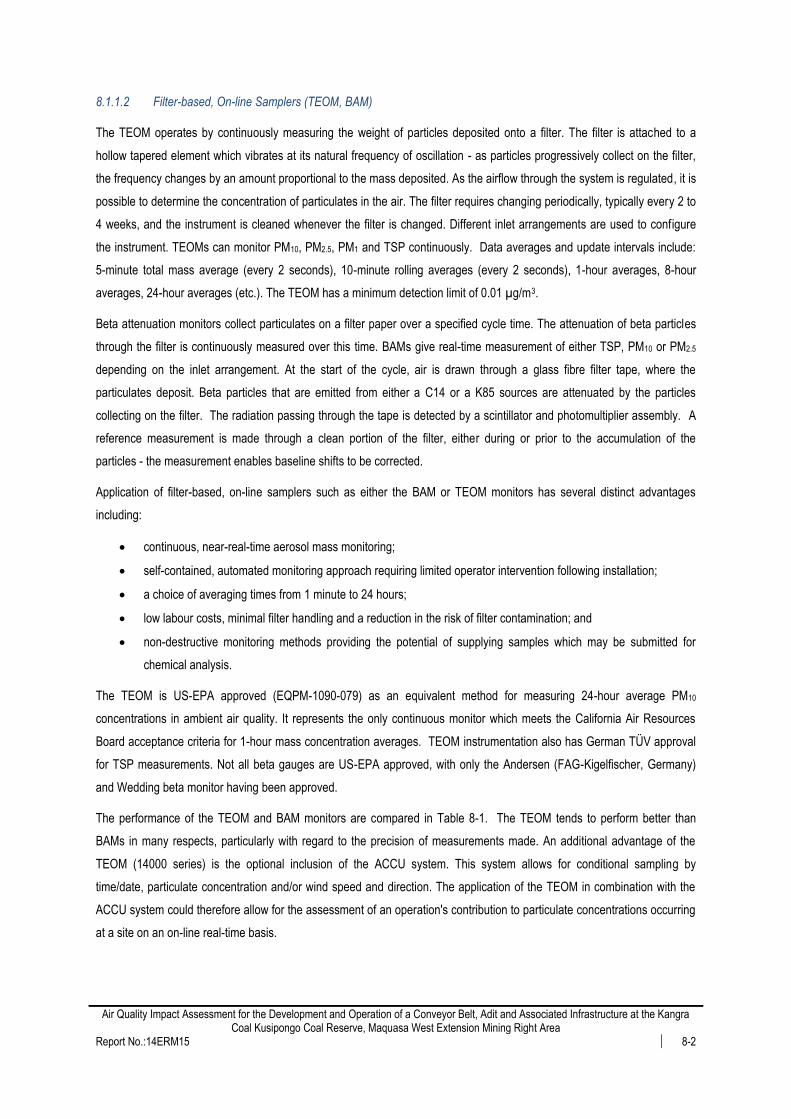
Air Quality Impact Assessment for the Development and Operation of a Conveyor Belt, Adit and Associated Infrastructure at the Kangra Coal Kusipongo Coal Reserve, Maquasa West Extension Mining Right Area
Report No.:14ERM15 8-2
8.1.1.2 Filter-based, On-line Samplers (TEOM, BAM)
The TEOM operates by continuously measuring the weight of particles deposited onto a filter. The filter is attached to a
hollow tapered element which vibrates at its natural frequency of oscillation - as particles progressively collect on the filter,
the frequency changes by an amount proportional to the mass deposited. As the airflow through the system is regulated, it is
possible to determine the concentration of particulates in the air. The filter requires changing periodically, typically every 2 to
4 weeks, and the instrument is cleaned whenever the filter is changed. Different inlet arrangements are used to configure
the instrument. TEOMs can monitor PM10, PM2.5, PM1 and TSP continuously. Data averages and update intervals include:
5-minute total mass average (every 2 seconds), 10-minute rolling averages (every 2 seconds), 1-hour averages, 8-hour
averages, 24-hour averages (etc.). The TEOM has a minimum detection limit of 0.01 µg/m3.
Beta attenuation monitors collect particulates on a filter paper over a specified cycle time. The attenuation of beta particles
through the filter is continuously measured over this time. BAMs give real-time measurement of either TSP, PM10 or PM2.5
depending on the inlet arrangement. At the start of the cycle, air is drawn through a glass fibre filter tape, where the
particulates deposit. Beta particles that are emitted from either a C14 or a K85 sources are attenuated by the particles
collecting on the filter. The radiation passing through the tape is detected by a scintillator and photomultiplier assembly. A
reference measurement is made through a clean portion of the filter, either during or prior to the accumulation of the
particles - the measurement enables baseline shifts to be corrected.
Application of filter-based, on-line samplers such as either the BAM or TEOM monitors has several distinct advantages
including:
continuous, near-real-time aerosol mass monitoring;
self-contained, automated monitoring approach requiring limited operator intervention following installation;
a choice of averaging times from 1 minute to 24 hours;
low labour costs, minimal filter handling and a reduction in the risk of filter contamination; and
non-destructive monitoring methods providing the potential of supplying samples which may be submitted for
chemical analysis.
The TEOM is US-EPA approved (EQPM-1090-079) as an equivalent method for measuring 24-hour average PM10
concentrations in ambient air quality. It represents the only continuous monitor which meets the California Air Resources
Board acceptance criteria for 1-hour mass concentration averages. TEOM instrumentation also has German TÜV approval
for TSP measurements. Not all beta gauges are US-EPA approved, with only the Andersen (FAG-Kigelfischer, Germany)
and Wedding beta monitor having been approved.
The performance of the TEOM and BAM monitors are compared in Table 8-1. The TEOM tends to perform better than
BAMs in many respects, particularly with regard to the precision of measurements made. An additional advantage of the
TEOM (14000 series) is the optional inclusion of the ACCU system. This system allows for conditional sampling by
time/date, particulate concentration and/or wind speed and direction. The application of the TEOM in combination with the
ACCU system could therefore allow for the assessment of an operation's contribution to particulate concentrations occurring
at a site on an on-line real-time basis.

Air Quality Impact Assessment for the Development and Operation of a Conveyor Belt, Adit and Associated Infrastructure at the Kangra Coal Kusipongo Coal Reserve, Maquasa West Extension Mining Right Area
Report No.:14ERM15 8-3
Table 8-1: Comparison of TEOM and BAM performance
TEOM BAM
Principle of operation
Measured mass on a filter based upon inertia (as
fundamental as gravimetric method).
Inferred mass on a filter based upon the strength of a
radioactive beam.
Measures only mass (represents a true mass
measurement)
Do not measure mass but rather the transmission of
beta rays
Advantages and
disadvantages
Performs well under varying humidity conditions.
Samples and measures at a defined filter face velocity
and conditioning temperature to ensure standardized
data under low humidities
Can produce erroneous measurements under
changing humidity conditions
Not sensitive to particulate composition since it makes
a mass-based measurement.
Sensitive to interferences (site/season specific) arising
due to: particle composition, particle distribution
across the filter, radioactive decay and the effect of air
density in the radioactive beam.
Precision (measured
by standard
deviation)
Standard deviation for hourly data: ± 1.5-2.0 µg/m³.
(Precision of ±5 µg/m3 for 10-minute averaged data.)
Beta monitors with strong source: standard deviation
for hourly data: ± 15-20 µg/m³.
Beta monitors with weak source: hourly data not
acceptable.
TEOMs have been found to typically under-predict actual particulate concentrations by a consistent amount (typically 18% to
25%). In the US TEOM results are typically multiplied by a factor of 1.3 to determine actual concentrations (this single factor
is made possible by the consistency or high precision of the instrument). TEOMs tend to be less effective in environments
with elevated nitrate concentrations or high potentials for the adsorption of volatile compounds on particles. Beta attenuation
monitors perform poorly in areas with soils that have a radioactive component.
A common disadvantage of the TEOM and BAM monitors is that they all require electricity to operate thus limiting the
potential sites for the location of such monitors. A further disadvantage of the TEOM and BAM monitors are that they are
relatively costly to purchase. Despite the relatively high costs of purchasing continuous real-time monitors such as the
TEOM and beta gauge monitors, significant savings can be achieved in the operation of such monitors due to the low labour
costs and the minimal filter handling required by these techniques.
Air Quality Impact Assessment for the Development and Operation of a Conveyor Belt, Adit and Associated Infrastructure at the Kangra Coal Kusipongo Coal Reserve, Maquasa West Extension Mining Right Area
Report No.:14ERM15 8-4
Figure 8-2: TEOM sampler linked to the ACCUTM conditional sampling system
Non-filter-based Monitors 8.1.2
Real-time but non-filter based monitors include the TSI DustTrak, the DustScan Sentinel Aerosol Monitor and the Topas
Dust Monitor. Several of these monitors can be solar-powered negating the need for selecting a site with power access.
Such monitors measures particle concentrations corresponding to various size fractions, including PM10, PM2.5 and PM1.0,
and comprise many of the benefits of the TEOM and BAM monitors including:
continuous, near-real-time aerosol mass monitoring;
a choice of averaging times from 1 minute to 24 hours;
limited operator intervention; and
minimal filter handling.

Air Quality Impact Assessment for the Development and Operation of a Conveyor Belt, Adit and Associated Infrastructure at the Kangra Coal Kusipongo Coal Reserve, Maquasa West Extension Mining Right Area
Report No.:14ERM15 8-5
Data Transfer Options 8.1.3
Although most analysers have internal data storage facilities, logging is usually carried out by means of a dedicated data
logger (PC or specialised data logger). Data transfer may be undertaken in various ways:
downloaded intermittently from the instrument - PC link cable required;
real-time, continuous transfer via telemetry - telemetry control unit required;
near real-time, intermittent transfer via radio link - requires transmitter & license to use frequency; or
continuous download via satellite.
In selecting the data transfer option possible future accreditation requirements must be taken into account, e.g.: (i) raw data
is to be kept for minimum of 3 years, and (ii) all manipulations of data must be recorded.
Air Quality Impact Assessment for the Development and Operation of a Conveyor Belt, Adit and Associated Infrastructure at the Kangra Coal Kusipongo Coal Reserve, Maquasa West Extension Mining Right Area
Report No.:14ERM15 8-6
8.2 Appendix B: Emission Factors and Equations
General Construction Activities 8.2.1
The US EPA provides a very general emission factor for construction activities based on the size of the construction area.
Based on field measurements of total suspended particulate (TSP) concentrations surrounding apartment and shopping
centre construction projects, the approximate emission factors for construction activity operations is:
E = 2.69 megagrams (Mg)/hectare/month of activity
This value is most useful for developing estimates of overall emissions from construction scattered throughout a
geographical area. The value is most applicable to construction operations with: (1) medium activity level, (2) moderate silt
contents, and (3) semiarid climate. Test data were not sufficient to derive the specific dependence of dust emissions on
correction parameters. Because the above emission factor is referenced to TSP, use of this factor to estimate particulate
matter (PM) no greater than 10μm in aerodynamic diameter (PM10) emissions will result in conservatively high estimates.
Also, because derivation of the factor assumes that construction activity occurs 30 days per month, the above estimate is
somewhat conservatively high for TSP as well.
Although the equation above represents a relatively straightforward means of preparing an area-wide emission inventory, at
least two features limit its usefulness for specific construction sites. First, the conservative nature of the emission factor may
result in too high an estimate for PM10 to be of much use for a specific site under consideration. Second, the equation
provides neither information about which particular construction activities have the greatest emission potential nor guidance
for developing an effective dust control plan.
Material Handling 8.2.2
The quantity of dust that will be generated from materials handling operations will depend on various climatic parameters,
such as wind speed and precipitation, in addition to non-climatic parameters such as the nature and volume of the material
handled. Fine particulates are most readily disaggregated and released to the atmosphere during the material transfer
process, as a result of exposure to strong winds. Increases in the moisture content of the material being transferred would
decrease the potential for dust emission, since moisture promotes the aggregation and cementation of fines to the surfaces
of larger particles. The following equation was used to estimate emissions from material transfer operations:
EFTSP =0.47*0.0016*(U/2.2)1.3 /(M/2)1.4
EFpm10 =0.35*0.0016*(U/2.2)1.3 *(M/2)1.4
Where,
U = mean wind speed in m/s
M = moisture content in % (by weight)

Air Quality Impact Assessment for the Development and Operation of a Conveyor Belt, Adit and Associated Infrastructure at the Kangra Coal Kusipongo Coal Reserve, Maquasa West Extension Mining Right Area
Report No.:14ERM15 8-7
Overland Conveyor System 8.2.3
The dust emissions from conveyors are wind speed dependent with stronger wind speeds causing dust particles to be
entrained by the wind. The degree of entrained dust also depends on the level of enclosure, i.e. roof cover and/or sides.
The wind speed dependence has been based on the recommendations of Parrett (1992) where the dust emission rate (as
grams per metre of conveyor) is equivalent to a constant multiplied by the difference between the friction velocity (u*) and
the threshold friction velocity of the coal (u*t):
)**( tTSP uucE
An estimate for the constant (c) has been made on data reported by GHD/Oceanics (1975) for measured conveyor
emissions at a wind speed of 10 m/s. The PM10 and PM2.5 fraction has been estimated as 45% and 22% of TSP
respectively. As indicated, the approach is conservative since it assumes emissions from a conventional conveyor.
The logarithmic wind speed profile may be used to estimate friction velocities from wind speed data recorded at a reference
anemometer height of 10 m ( US EPA, 1999): u* =0.053 u10. This equation assumes a typical roughness height of 0.5 cm
for open terrain, and is restricted to large relatively flat piles or exposed areas with little penetration into the surface layer.
Parrett’s (1992) estimate of u* over coal surfaces was determined as typically 0.11 times the 10 metre level wind speed.
Furthermore, the threshold wind speed (u*t) for coal dust to be lifted (particles in the 20-30 μm range) is 3.1 m/s. The value
for u*t therefore is typically 0.34 m/s. Emissions for wind speeds below 3.1 m/s are likely to be negligible.