air pollution and health: quantifying damages in china and beyond
TRANSCRIPT

Air Pollution and Health: Quantifying Damages in China and Beyond Noelle E. Selin Assistant Professor of Engineering Systems and Atmospheric Chemistry Georgetown University Public Health in Asia Series [email protected] http://mit.edu/selin http://mit.edu/selingroup
Air Quality in China and Beyond
o Air quality: what’s the problem? o Emissions, concentrations and trends in
China o Quantifying pollution health damages o Issues for further research and policy
Air Quality: What’s the problem?
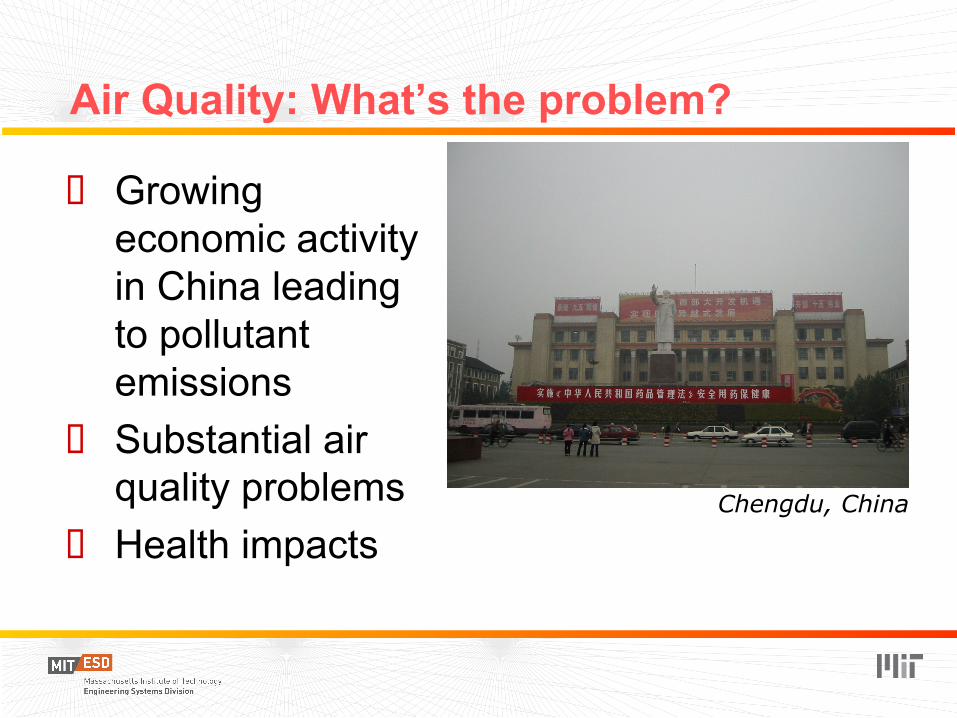
o Growing economic activity in China leading to pollutant emissions
o Substantial air quality problems
o Health impacts Chengdu, China
Air Quality and Health Damages
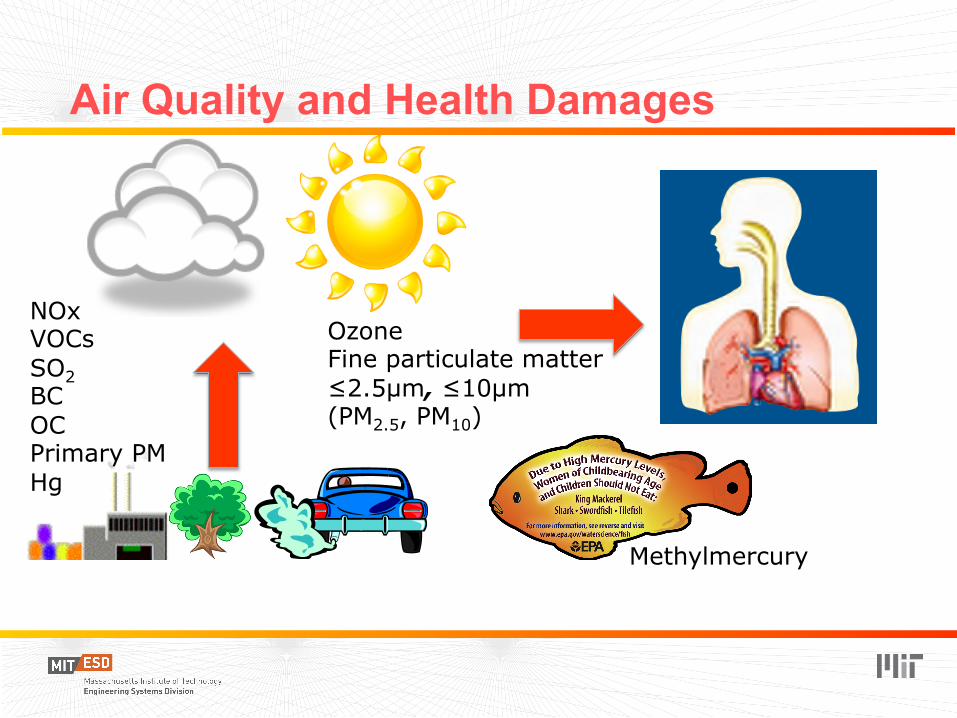
NOx VOCs SO2 BC OC Primary PM Hg
Ozone Fine particulate matter ≤2.5µm, ≤10µm (PM2.5, PM10)
Methylmercury
GLOBAL EXPOSURE TO PM10
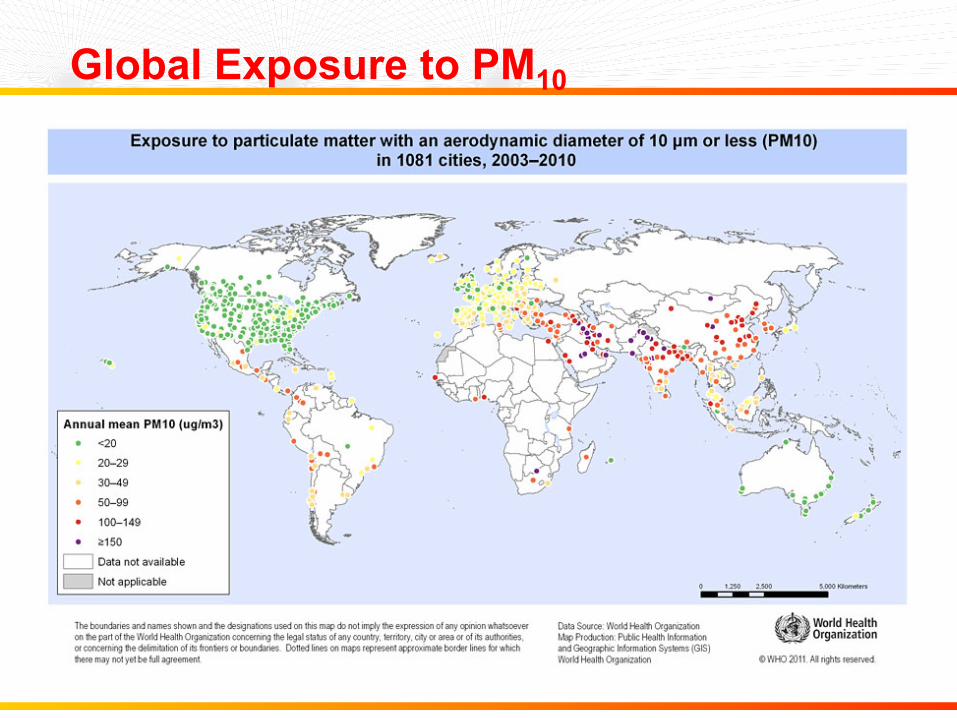
Global Exposure to PM10
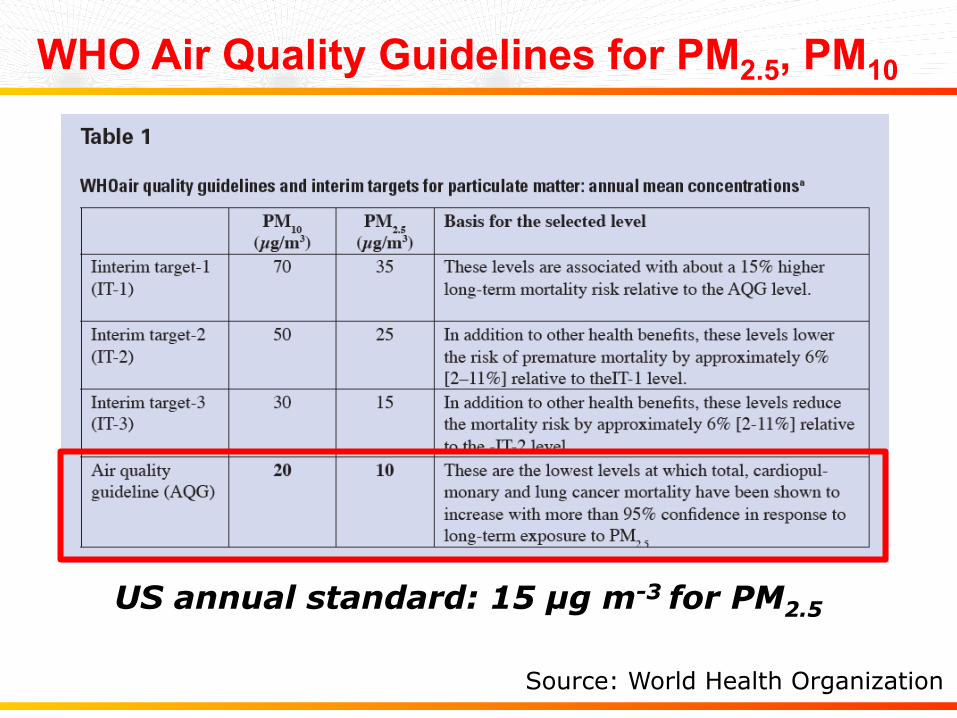
GLOBAL PM10 AND PM2.5
Source: World Health Organization
WHO Air Quality Guidelines for PM2.5, PM10
US annual standard: 15 µg m-3 for PM2.5
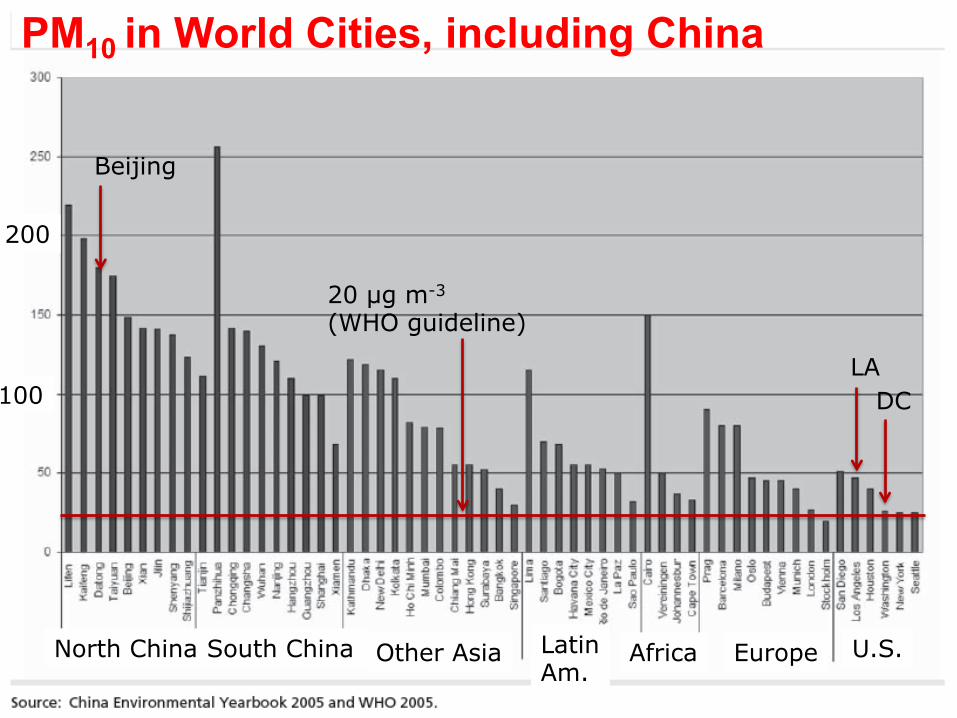
PM10 in World Cities, including China
North China South China Other Asia Latin Am.
Africa Europe U.S.
20 µg m-3
(WHO guideline)
100
200
Beijing
LA DC

Industrial Emissions in China from Satellite
o NOx, precursor to O3
o March 2012 o Shows
industrial centers
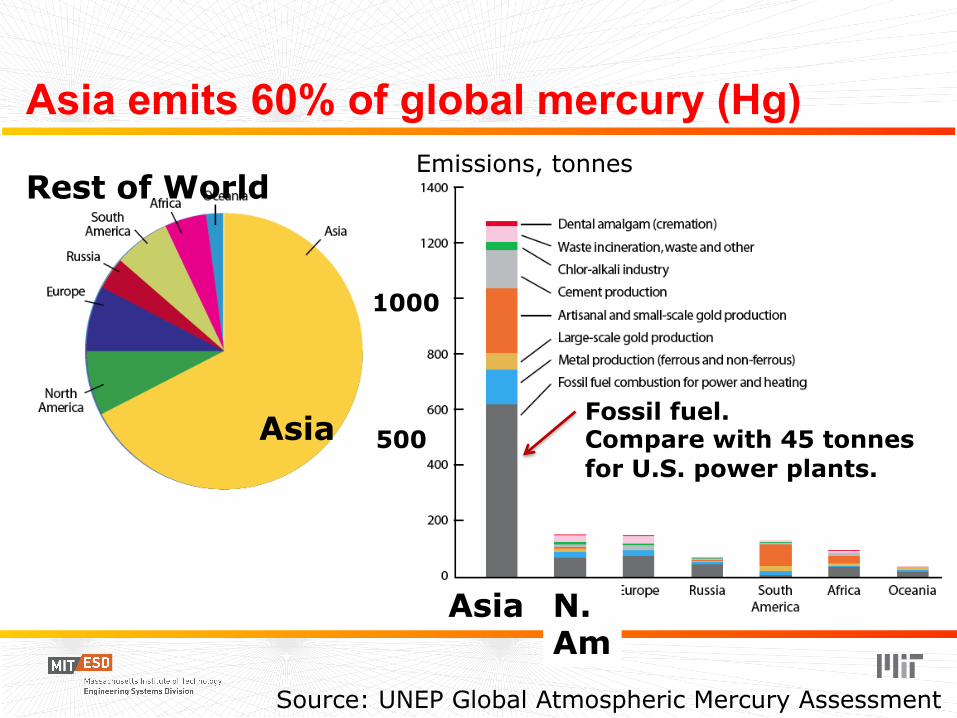
Asia emits 60% of global mercury (Hg)
Source: UNEP Global Atmospheric Mercury Assessment
Asia
Rest of World
Asia N. Am
Fossil fuel. Compare with 45 tonnes for U.S. power plants.
1000
500
Emissions, tonnes

Asia will determine future Hg globally
Asia
2020: 3 scenarios 2005
600
1200
Emissions, tonnes
Source: UNEP Global Atmospheric Mercury Assessment

Projections of future emissions in Asia
2100 2020 2000
Source: RCP database
NOx emissions in Asia
Tg N
O2 p
er y
ear
30
40
50
2040 2060 2080
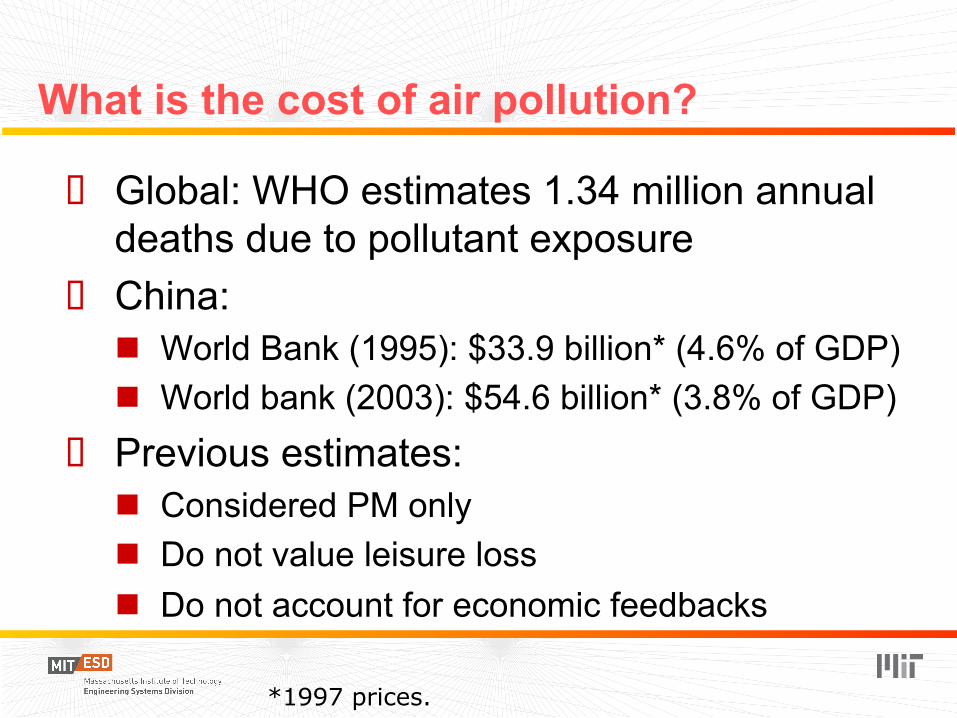
What is the cost of air pollution?
o Global: WHO estimates 1.34 million annual deaths due to pollutant exposure
o China: n World Bank (1995): $33.9 billion* (4.6% of GDP) n World bank (2003): $54.6 billion* (3.8% of GDP)
o Previous estimates: n Considered PM only n Do not value leisure loss n Do not account for economic feedbacks
*1997 prices.
Questions for Research
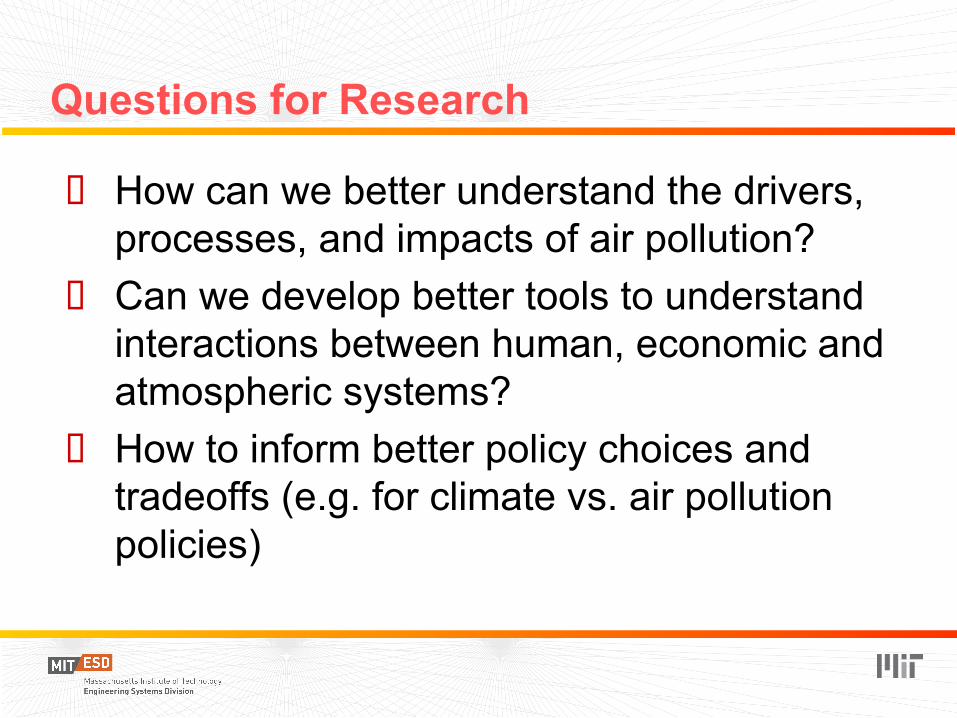
o How can we better understand the drivers, processes, and impacts of air pollution?
o Can we develop better tools to understand interactions between human, economic and atmospheric systems?
o How to inform better policy choices and tradeoffs (e.g. for climate vs. air pollution policies)
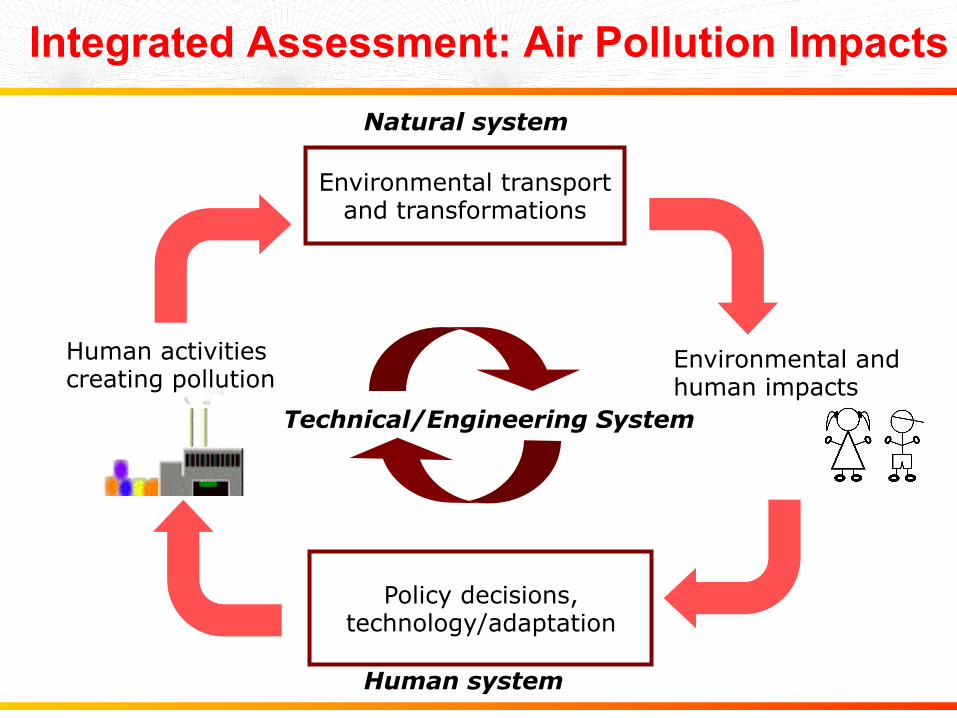
Integrated Assessment: Air Pollution Impacts
Environmental transport and transformations
Policy decisions, technology/adaptation
Human activities creating pollution
Environmental and human impacts
Human system
Technical/Engineering System
Natural system

Economic Assessment of Health Damages
Morbidity and mortality outcomes and costs (from epidemiological literature)
Loss of labor, capital and equilibrium economic effects over time; economic activity and emissions
Concentration of O3, particulate matter (data, model): Population-weighted concentration per region
[EPPA-HE model: Matus et al., Clim. Change, 2008; Selin et al., ERL, 2009]
China paper: K. Matus, K. M. Nam, N. E. Selin, L. N. Lamsal, J. M. Reilly and S. Paltsev, 2012. “Health Damages from Air Pollution in China.” Global Environmental Change, 22(1):55-66, doi:10.1016/j.gloenvcha.2011.08.006.
MIT Emissions Prediction and Policy Analysis (EPPA) model
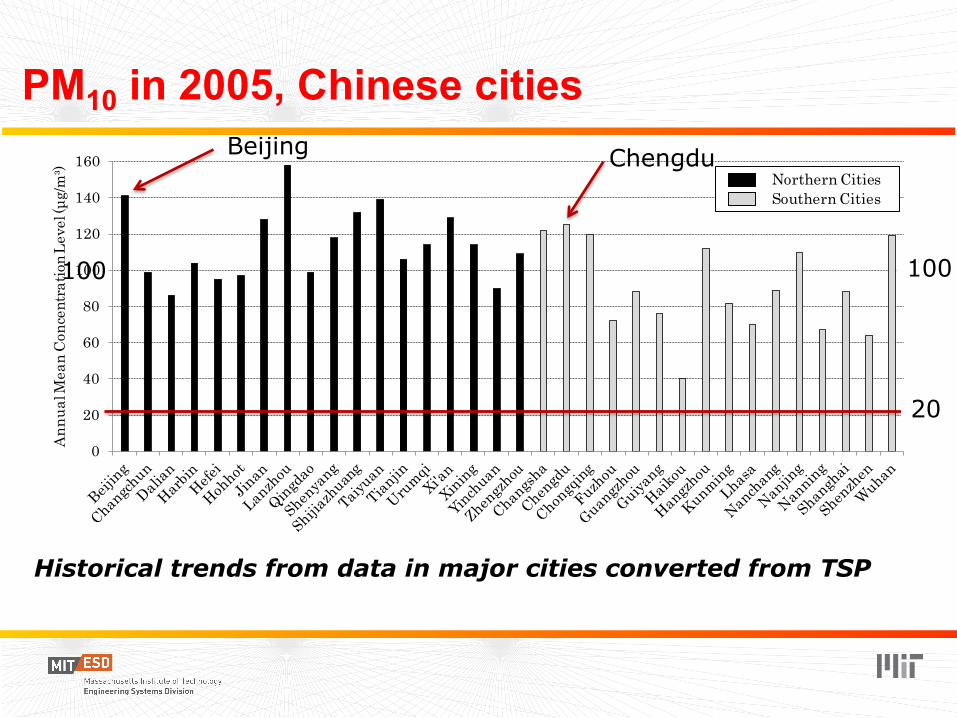
PM10 in 2005, Chinese cities
0
20
40
60
80
100
120
140
160
Annu
al M
ean
Conc
entr
atio
n Lev
el (µ
g/m³)
PM10 in 2005
Northern CitiesSouthern Cities
Historical trends from data in major cities converted from TSP
100
20
Beijing Chengdu
100
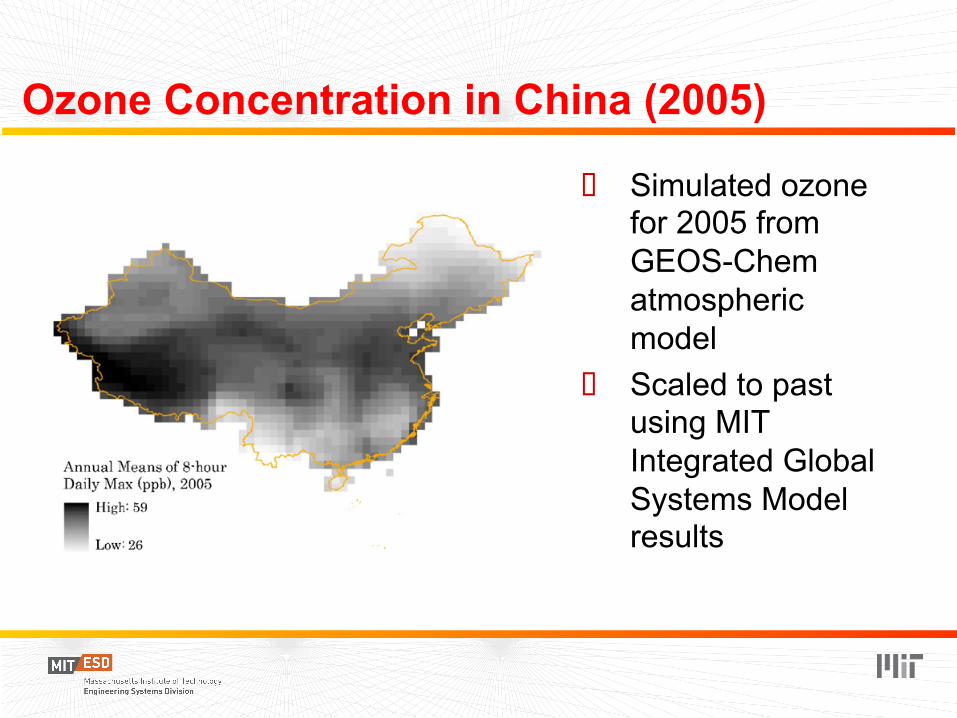
Ozone Concentration in China (2005)
o Simulated ozone for 2005 from GEOS-Chem atmospheric model
o Scaled to past using MIT Integrated Global Systems Model results

PM10, Ozone trends in China: 1970-pres.
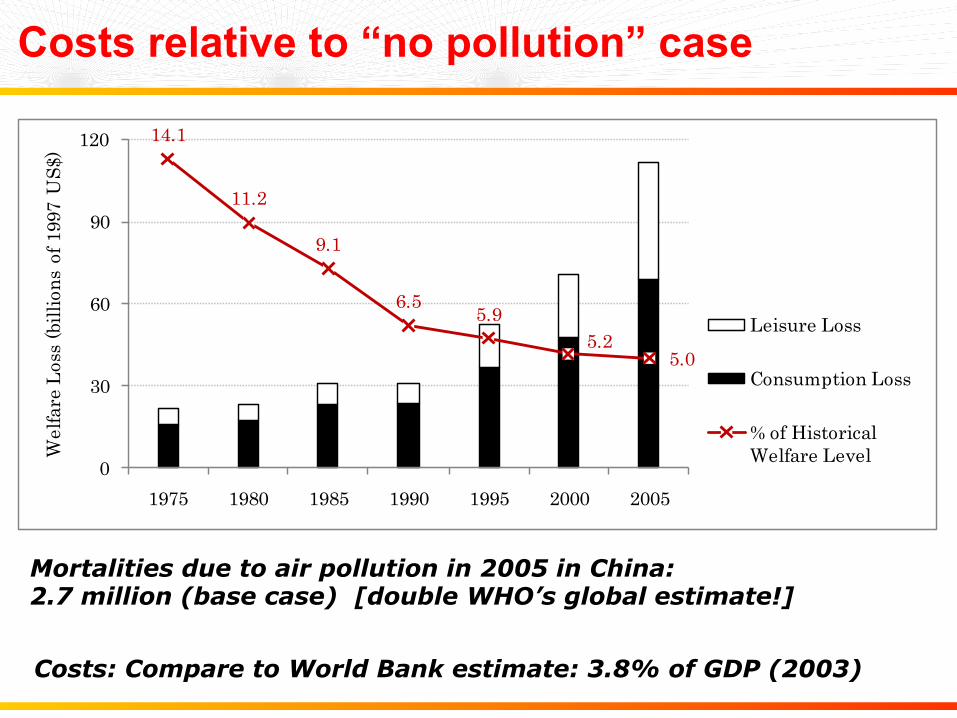
Costs relative to “no pollution” case
14.1
11.2
9.1
6.5 5.95.2
5.0
0
30
60
90
120
1975 1980 1985 1990 1995 2000 2005
Wel
fare
Los
s (b
illio
ns o
f 199
7 U
S$)
Leisure Loss
Consumption Loss
% of Historical Welfare Level
Mortalities due to air pollution in 2005 in China: 2.7 million (base case) [double WHO’s global estimate!]
Costs: Compare to World Bank estimate: 3.8% of GDP (2003)

Why do we need an integrated assessment?
62%10%
28%
Direct loss due to mortalities from chronic exposure
Direct loss due to other health outcomes
Broader economic losses
q PM10 and O3 account for 87% and 13% of the 2005 total pollution health costs, respectively.
q Chronic exposure to PM: 62% q Broader Economic Losses
category account for 28% of the total welfare loss in 2005.
q This category considers impacts of distorted resource allocation and cumulative economic loss.
q Larger in fast-growing economies (e.g., 12% for Europe)

0
10
20
30
40
50
60
70
Conc
entr
atio
n Le
vel (
µg/m
3 )
Year
Ozone (EMEP)
PM10 (AirBase)
PM10 (World Bank)
Air pollution in Europe results in €370 billion in economic losses Uncertainty: €209-550 billion
(Compare to China: ≈$100 billion)
Health Costs of Air Pollution in Europe
[Nam et al., Energy Policy, 2010]

Trans-Pacific transport of Asian pollution
Paper: S. Strode, L. Jaeglé, D.A. Jaffe, P.C. Swartzendruber, N.E. Selin, C. Holmes, and R.M. Yantosca. 2008. “Trans-Pacific transport of mercury.” Journal of Geophysical Research Atmospheres, 113, D15305, doi:10.1029/2007GB003040.
Asian pollution events measured and simulated on U.S. west coast (Mt. Bachelor, Oregon)
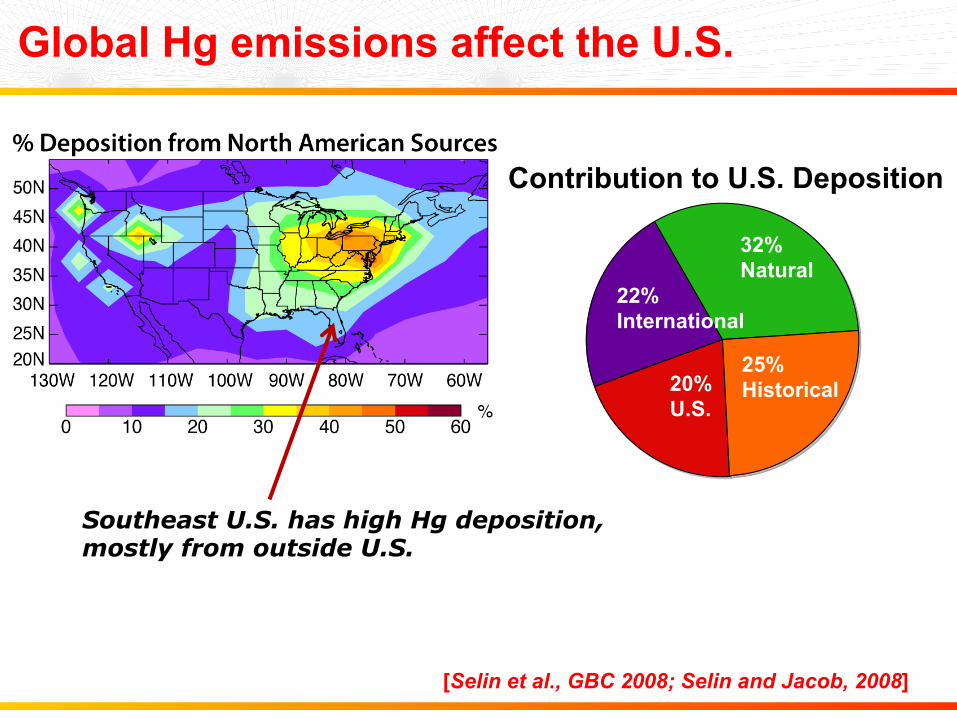
[Selin et al., GBC 2008; Selin and Jacob, 2008]
Contribution to U.S. Deposition
22% International
32% Natural
20% U.S.
25% Historical
Global Hg emissions affect the U.S.
Southeast U.S. has high Hg deposition, mostly from outside U.S.
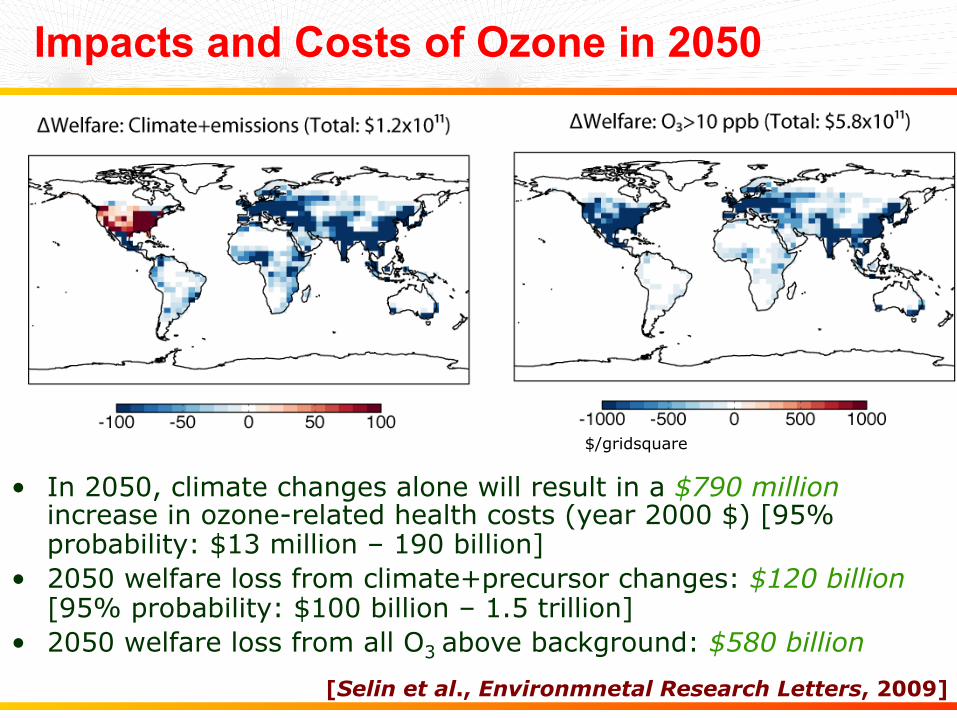
Impacts and Costs of Ozone in 2050
• In 2050, climate changes alone will result in a $790 million increase in ozone-related health costs (year 2000 $) [95% probability: $13 million – 190 billion]
• 2050 welfare loss from climate+precursor changes: $120 billion [95% probability: $100 billion – 1.5 trillion]
• 2050 welfare loss from all O3 above background: $580 billion
$/gridsquare
[Selin et al., Environmnetal Research Letters, 2009]

Co-Benefits of Climate Policy (2050)
IPCC (2007): high agreement and much evidence that health co-benefits from reduced air pollution as a result of climate action can be substantial, and may offset a substantial fraction of climate mitigation costs Health-related “co-benefits” of BC, OC, SO2 reductions valued at 0.03-0.09% of global GDP in 2050 Climate change policies cost 0.4-6.7% of global consumption in 2060 Relevant to policies for short-lived climate forcers (e.g. black carbon)
“750
ppm
” po
licy
“450
ppm
” po
licy
[Selin et al., in prep]

Acknowledgments
• Coauthors on the China paper: – Kira Matus (MIT Master’s student, now at LSE) – Kyung-min Nam (MIT Postdoc) – John Reilly (MIT) – Lok Lamsal (Dalhousie) – Sergey Paltsev (MIT)
Funding: NSF: Atmospheric Chemistry Program, “CAREER: Understanding Chemistry, Transport and Fate of Mercury and Persistent Organic Pollutants through Global Atmospheric Modeling,”; MIT Research Support Committee Ferry fund; U.S. EPA: Science to Achieve Results (STAR) Program, "Air Pollution, Health and Economic Impacts of Global Change Policy and Future Technologies: An Integrated Model Analysis,” MIT Joint Program on the Science and Policy of Global Change and its consortium of government and industry sponsors, see http://globalchange.mit.edu
For more information, publication copies or comments: http://mit.edu/selingroup [email protected]