air permit for the construction and operation of a …
TRANSCRIPT

AIR PERMIT FOR THE CONSTRUCTION AND OPERATION OF A CALCIUM CARBIDE
MANUFACTURING PLANT
A Thesis Presented to
the Faculty of the Graduate School at the University of Missouri-
Columbia
In Partial Fulfillment of the Requirements for the Degree
Master of Science
by EMILY WILBUR
Dr. Thomas Marrero, Thesis Supervisor
MAY 2010

The undersigned, appointed by the Dean of the Graduate School, have examined the thesis entitled
AIR PERMIT FOR THE CONSTRUCTION AND OPERATION OF A CALCIUM CARBIDE MANUFACTURING PLANT
presented by Emily Wilbur,
a candidate for the degree of Master’s of Science,
and hereby certify that, in their opinion, it is worthy of acceptance.
Professor Thomas Marrero
Associate Professor Patrick Pinhero
Professor Baolin Deng

ii
ACKNOWLEDGEMENTS
I would like to thank my advisor, Dr. Thomas Marrero, for the guidance to
complete this thesis document. Without his support, graduating from the
Master’s graduate program would have been close to impossible.
I would also like to express my appreciation of Dr. Patrick Pinhero, who
has helped me navigate the Master’s program. Lastly, I would like to thank the
members of the thesis committee for their review and input.

iii
TABLE OF CONTENTS
ACKNOWLEDGEMENTS ...................................................................................... ii
LIST OF ILLUSTRATIONS ................................................................................... v
LIST OF TABLES ................................................................................................. vi
ABSTRACT ........................................................................................................ viii
Chapter
1. INTRODUCTION ........................................................................................ 1
1.1 Calcium Carbide and Acetylene ................................................................ 1
1.2 Sustainability of Acetylene from Biomass ................................................. 2
1.3 Specific Topic of Research ....................................................................... 5
2. CALCIUM CARBIDE MANUFACTURING THROUGH BIOMASS GASIFICATION ...................................................................................... 7
2.1 The Gasification Process .......................................................................... 7
2.2 Ancillary Processes................................................................................... 8
2.3 Mass Balance and Energy Balance .......................................................... 9
3. REGULATORY REQUIREMENTS ........................................................... 12
3.1 Regulatory Background .......................................................................... 12
3.2 Air Permitting .......................................................................................... 14
3.3 New Source Review ............................................................................... 14
3.4 Emissions and Controls .......................................................................... 19
3.5 Emission Factors .................................................................................... 20
4. EVALUATIONS AND RESULTS ............................................................... 26
4.1 True De minimis Source ......................................................................... 26
4.2 Synthetic De minimis Source .................................................................. 27

iv
4.3 Minor Source .......................................................................................... 29
4.4 Major Source .......................................................................................... 33
5. CONCLUSION .......................................................................................... 39
6. RECOMMENDATIONS ............................................................................. 40
REFERENCES .................................................................................................. 71
GLOSSARY ........................................................................................................ 73
APPENDICES: EMISSIONS CONTROL TECHNOLOGIES ............................... 79

v
LIST OF ILLUSTRATIONS
Figure Page
1. Process Flow Diagram of the Three Stage Gasification Process ............... 63
2. Schematic of Emission Units for a Biomass CaC2 Plant ............................ 64
3. Flow Diagram for Determining Permit Type Required ................................ 65
4. Conversion of Raw Materials through the Carbide Process ....................... 66
5. Quarry Spreadsheet - Snapshot of the Data Entry Tab ............................. 67
6. Quarry Spreadsheet - Snapshot of the Ambient Impact & Emissions Tab . 68
7. Quarry Spreadsheet Impact Extrapolation for PM10 ................................... 69
8. Screen3 Model Output File ........................................................................ 70

vi
LIST OF TABLES
Table Page
1. Summary of Emission Units ....................................................................... 42
2. Material Balance for Carbide Production from Wood ................................. 43
3. Thermal Balance of Carbide Production from Wood .................................. 44
4. Boiler Design Heating Requirements ......................................................... 45
5. De minimis Levels for Regulated Air Pollutants ......................................... 46
6. NSR Major Thresholds ............................................................................... 47
7. Emission Factors for PM10 ......................................................................... 48
8. Emission Factors for NOx and VOC ........................................................... 50
9. Emission Factors for CO2 and CO ............................................................. 51
10. Comparison of Wood Feed Rates and Carbide Production Rates to Annual Emission Rates ...................................................................................... 52
11. NAAQS and Increment Standards ............................................................. 53
12. Summary of PM10 Modeling Based on Quarry Spreadsheet for a True Minor Installation ............................................................................................. 54
13. Summary of PM10 Modeling Based on Quarry Spreadsheet for a Synthetic Minor Installation.................................................................................... 55
14. Summary of PM10 Modeling Based on Quarry Spreadsheet for a Major Installation ............................................................................................ 56
15. Stack Parameter Ranges for NOx Impact Evaluation Using Screen3 ........ 57
16. Comparison of Increased Exiting Temperature on NOx Impacts Based on Screen3 .......................................................................................... 58
17. Comparison of Increased Stack Height on NOx Impacts Based on Screen3 ................................................................................................. 59
18. Comparison of Increased Exit Velocity on NOx Impacts Based on Screen3 ................................................................................................. 60

vii
19. Summary of Worst-Case NOx Modeling Based on Screen3 ...................... 61
20. Pollutants Requiring Modeling Based on Annual Emission Rates ............. 62

viii
ABSTRACT
The purpose of this thesis is to determine the regulatory requirements
necessary for constructing calcium carbide manufacturing plants. Material and
thermal balances were made on the basis of biomass as a substitute for typical
carbon raw materials, such as petroleum coke. The calcium carbide plant design
was adapted from a novel concept that gasifies biomass in three stages to form
the carbon raw material. Emission rates to air were calculated using comparable
emission factors to determine the potential environmental impacts of the plant
and its compliance to current State of Missouri air pollution regulations. The
results show that the emissions associated with the calcium carbide plant allow
for 1,657 tons per year of production for a true de minimis source, without the
need for a construction or operating permit. For higher levels of production, a de
minimis, minor or major permit is required. A synthetic de minimis source can
achieve an annual calcium carbide production rate of up to 6,362 tons with the
use of particulate filters. A true minor source can produce 30,273 tons per year
without control devices. A synthetic minor source can produce 39,876 tons
annually with the use of particulate filters. A major source can produce 44,389
tons annually with the installation of low NOx burners and particulate filters. The
results of this thesis are significant for the design and operation of a pilot or
permanent calcium carbide manufacturing plant because permitting of air
emissions is necessary prior to the start of any construction activities.

1
Chapter 1: Introduction
1.1 Calcium Carbide and Acetylene
Calcium carbide is an amorphous solid chemical compound. Dark grey in
color, pure calcium carbide is difficult to prepare, and once produced quickly
oxidizes with air liberating the carbon1. It is commercially available in a form that
is approximately 80% pure. The remaining 20% is composed primarily of
calcium oxide and impurities from the raw materials2.
The stoichiometric equation for producing calcium carbide from lime is:
CaO + 3C CaC2 + CO H = 442 BTU/mol (466 kJ/mol3)
Calcium carbide is produced industrially using a method that has changed
very little from its first industrial productions starting in 18961. This longstanding
method heats calcium oxide and carbon in an electric arc furnace to achieve
temperatures up to 3632OF required by the endothermic reaction. In US plants,
the calcium oxide in the form of lime is calcined from limestone in a kiln at the
plant. The carbon sources are typically petroleum coke, metallurgical coke and
anthracite coal4. In the US, the production rate has been decreasing over the
years as the production and demand for calcium carbide has grown in China. In
1997, the estimated production of calcium carbide in the US and Mexico
combined was 270,000 tons per year, which was 5.7 % of the total global
production. China had a production of close to 3 million tons3. More recently,

2
the production in China has grown rapidly with an increase of 21.4% in total
output from 2003 to 2004. That is a production rate of 6.55 million tons per year,
of which 600,000 tons are exported5. In 2007, China represented 95% of the
total global production and consumption of calcium carbide6.
Calcium carbide has several uses on its own in the iron and steel
industries for desulphurization and the removal of unwanted iron and maganese
oxides in slag 2,1. It is also used as an intermediate for calcium cyanamide
manufacture3. However, the predominant use of calcium carbide is the
production of acetylene, and the largest source of acetylene is calcium carbide1.
The chemical reaction of calcium carbide yields the production of
acetylene with the addition of water:
CaC2 + 2H2O C2H2 + Ca(OH)2 H = -123 BTU/mol (-130 kJ/mol3)
Acetylene is used in industrial applications and chemical manufacture.
Industrial applications include using the acetylene for heating, welding and
cutting1, 3.
1.2 Sustainability of Acetylene from Biomass
Recently, interest in acetylene as an alternative fuel source has increased
and new company ventures are pursuing this aspect7. As an alternative fuel,
acetylene would need to be produced with raw materials available in the US and
the raw materials would preferably be renewable for sustainability as a reliable

3
fuel source. Missouri is a candidate for acetylene production through the
manufacture of calcium carbide with renewable materials.
In Missouri, both raw materials for the production of calcium carbide are
abundant by using biomass as the carbon source and lime as the calcium
component of the formula. Carbon, in the form of trees, is a natural resource
already used as a raw material for the production of charcoal in Missouri. In
2000, the primary wood-using industries in Missouri were sawmills, cooperage
mills, post mills, charcoal plants, handle mills, and veneer mills processing 127
million cubic feet of industrial roundwood8. In 2003, these industries generated
1.8 million green tons of wood and bark residues9. According to the Missouri
Department of Conservation, in 2007, Missouri was a leader in forest products,
including charcoal10. On a global scale, the potential for biomass availability is
substantial with approximately 30% of the Earth’s surface covered in forestland11.
In 2004, the United States, in combination with other Organisation for Economic
Co-operation and Development (OECD) countries, represented 12.6% of the
total global shares of available biomass. In contrast, China by itself represented
19.7% of the global total.
Lime is typically produced through the calcination of limestone, although it
can be produced from items such as aragonite, chalk, coral, marble and sea
shells. Rock that qualifies as limestone must have a calcium carbonate content
of at least 50 percent. If the rock contains 30 to 45 percent magnesium
carbonate, the limestone is considered dolomite4.

4
Missouri is the highest producer of lime in the nation, according to the
Mining Industry Council of Missouri12. Globally, the United States is the second
largest producer of lime with 20,200 metric tons produced in 2007. China led the
world with 170,000 metric tons13.
Lime production requires quarrying raw limestone, crushing and sizing the
limestone, calcining limestone, processing the lime, and storing and handling the
lime. The main process of lime production is the calcining process which occurs
in a kiln. In the United States, approximately 90 percent of all lime production
occurs in a rotary kiln. In this type of kiln, limestone and hot combustion gases
pass counter currently through a long, cylindrical, slightly inclined, refractory-lined
furnace. Although the details of lime manufacturing are outside the scope of this
thesis, a detailed description of the process and the associated emissions can be
found in AP-42 Section 11.17 Lime Manufacturing4.
Once the manufacture of calcium carbide using biomass based raw
materials is established, acetylene as a renewable fuel has many benefits.
Calcium carbide can be stored in containers and easily transported to locations in
need of a power source without the use of extensive piping and storage of
combustible fuels. Once on-site, the calcium carbide can be reacted with water
to quickly generate acetylene for use in acetylene generators. Existing
commercial engines can be modified to operate on acetylene fuel by modifying
the fuel injection system14.

5
Possible disadvantages of producing calcium carbide from biomass
materials stem from the availability of biomass for the production of calcium
carbide and the heat requirement of the calcium carbide reaction itself. As the
desired production rate of calcium carbide increases, the amount of biomass
necessary also increases. Areas with limited access to biomass material would
have difficulty producing high quantities of calcium carbide. However, this can be
considered similar to the issues raised in the use of non-renewable raw materials
such as petroleum coke. Another disadvantage is the high temperatures and
large amounts of electricity the calcium carbide manufacturing process itself
requires14.
1.3 Specific Topic of Research
The abundance of both raw materials, lime and biomass, necessary in the
gasification process, make Missouri a prime consideration for the location of this
process. In order for any entity wishing to construct or modify a source with the
potential to emit any regulated air pollutant in the State of Missouri must first
obtain proper authority from various permitting agencies. This thesis looks into
the regulatory aspect as it pertains to air emissions of establishing a biomass
calcium carbide plant in Missouri. This thesis is divided into two evaluations: the
process emissions and the permit type based on plant size.
Although biomass encompasses a variety of possible raw materials, wood
was chosen for evaluation in this thesis because wood is a common biomass

6
material. Wood is a general term that includes both hardwoods and softwoods
regardless of age. Possible variations in the wood that would affect process
emissions were considered and a conservative approach was used during the
evaluation of this thesis.

7
CHAPTER 2
Calcium Carbide Manufacturing through Biomass Gasification
2.1 The Gasification Process
This study is based on an invention that gasifies biomass to produce
calcium carbide and ultimately acetylene in a three-stage gasification process. A
patent application for the three-stage gasification of biomass was filed in May
200715. Biomass is defined as carboneous materials such as biocrops, animal
waste, or even used tires and often refers to materials that are renewable.
The first stage of the process is a fixed bed pyrolysis reactor. Similar to
charcoal producing techniques, this reactor carbonizes the biomass at
temperature specific to this patent of 300-1000OF. The resulting charcoal is
transported to a storage site for use as raw material for the production of calcium
carbide. The exhaust for the first stage is vented to the second stage of the
process to be partially combusted in a chamber at 1200-1400OF. This partial
combustion produces acetylene, hydrogen, and other carbon gases that are
exhausted to a condenser for combustion in the third stage.
The third stage consists of a chamber for the complete combustion of the
wood material in addition to the biogases produced in earlier stages to raise the
temperature in the chamber to 3000 OF. The heat produced in the third stage
chamber supplies the environment necessary for the reaction of the charcoal and

8
lime to form calcium carbide in molten form. From here the molten calcium
carbide is cooled and processed for transport or conversion into acetylene.
Electricity is produced by an internal combustion engine fueled by the off-gases
and/or acetylene produced by the process15. A process flow diagram of the
process can be found in Figure 1.
2.2 Ancillary Processes
For the purposes of this study, the additional auxiliary processes not
mentioned in the patent application are included in order to produce a complete
study of the total emissions expected from proposed plant. Haul roads are
necessary to truck raw materials onto the property and product to off-site
locations. Once the raw materials are delivered, the wood raw material can be
stored in storage piles on the property.
From there, the wood is transferred by front-end loader to the dryer where
the excess moisture is removed from the wood prior to pyrolysis. The dried wood
can either be transferred back to storage or conveyed to the three-stage
gasification system for further processing. The lime is trucked in and stored in
silos located on the property. From the silos, the lime is conveyed to the
gasification system. Once the molten calcium carbide is produced, a condenser
is needed to cool and solidify the product. The product is crushed and sized for
delivery or sent to the acetylene processing equipment for use in the internal
combustion engine. During crushing, the process is ventilated or kept under an

9
inert gas blanket to prevent explosion hazards from acetylene generated by the
reaction of calcium carbide with moisture in the ambient air. The engine
provides the electricity necessary to run the gasification process.
Each individual equipment or process is a source of emissions commonly
referenced as an emissions unit. For ease of tracking through the process, each
emissions unit is labeled with a unique identifier. For this study, the emissions
units were divided into three categories: direct process equipment, ancillary
processes, and combustion equipment. A summary of these emission units and
their labels are presented in Table 1, and Figure 2 is a schematic depiction of the
emission units.
2.3 Mass Balance and Energy Balance
Miller1 evaluates the average mass balance in a carbide furnace using
chemical reactions thought to occur in the furnace and typical compositions of
the raw materials used in the process. The balance is based on the production
of one kilogram of calcium carbide by reaction of lime and coke.
For this study, the same reactions are used as a basis for the material
balance in the gasification process. The lime is assumed to have the same
general composition as lime in the Miller analysis1. However, the gasification
process uses charcoal as its carbon source which has a different impurity
composition from coke thus producing a different mass result from the carbide
furnace process.

10
Charcoal is a carbon residue that is formed through the pyrolysis of
carbon containing materials. The most commonly used materials are woods,
such as beech, birch, hard maple, hickory, and oak. Other materials can be
used, including nutshells, fruit pits, coal, vegetable wastes, and paper mill
residues. During the manufacturing process, external heat is applied to the wood
to drive off water and highly volatile organic compounds. Once the wood
temperature rises to approximately 275°C (527°F), the volatile organic
compounds are released at an increasing rate and the carbonization reactions
become exothermic4. The impurities seen in the charcoal differ considerably
from those in coke.
In general, wood has an elemental composition of about 50% carbon and
trace amount of several metal ions with the remaining percentage comprised of
oxygen and hydrogen16. Some trace elements reported were calcium,
potassium, magnesium, phosphorous, manganese, iron, zinc, sodium and
chlorine. For purposes of this study, an average of the metal contents was
established over the wood species in the study and used in the material balance.
The two elements not mentioned in the study, but of interest in the gasification
process, are nitrogen and sulfur in the wood. In general, wood and its associated
biomass materials such as bark and greenery have low sulfur content levels.
The sulfur content of wood is 0.01 percent with bark, having a slightly higher
content of 0.02-0.1 percent based on dry mass17. The nitrogen content is
thought to be 0.1-0.5 percent based on dry mass.

11
Impurities in the raw materials ultimately end up as an impurity in the
resulting product1. The results of the material balance can be seen in Table 2.
The resulting quantities determined in the analysis are used in later sections as
the basis for establishing the design rate for the gasification process equipment.
Miller1 also evaluates the thermal aspects of the carbide furnace process.
Based on the mole balance contained in the material balance analysis, a thermal
analysis of the gasification process was evaluated following the same reactions
used in the carbide furnace process. The results of the thermal balance can be
seen in Table 3. The resulting thermal requirements of this analysis are used in
later sections for evaluating the fuel combustion requirements of the gasification
process. This information is translated into the heating requirements for a boiler
design that would be necessary to maintain the process operations. The results
of this analysis can be seen in Table 4 and is considered in determining the
viability of producing a self-sustaining operation.

12
CHAPTER 3
REGULATORY REQUIREMENTS
3.1 Regulatory Background
Air permits are regulated under the Clean Air Act of 1963 and its
amendments. After incidents of public health safety were threatened by
increased pollution in the surrounding air, several federal and state laws were
passed, including the original Clean Air Act of 1963. The Act established funding
to study air pollution and strategies to clean up the air pollution. In 1970,
Congress passed a revised version of the Clean Air Act which created a more
comprehensive response for addressing air pollution. It was in that same year
that Congress established the Environmental Protection Agency (EPA) with the
primary objective to carry out the revised law. Subsequently, several Clean Air
Act programs have been established in the effort to reduce nationwide air
pollution18.
The Clean Air Act was further revised and expanded with the passing of
the 1990 Amendments which allowed EPA more leeway in implementing and
enforcing the regulations that were intended to reduce the emissions of certain
air pollutants. It was at this time that the EPA considered cost-effectiveness of a
control device in combination with the reduction effectiveness in air pollution.

13
The EPA is the primary agency for setting limits on regulated air pollutants
that ensure that the basic health and environmental condition for the general
population is not compromised by excessive air pollution. This is achieved
through restrictions on emissions from industrial sources that emit regulated air
pollutants. On a local level, the directives of the EPA are executed through state,
tribal and local agencies that are approved by the EPA. States and tribes may
create stricter air pollution laws that address specific problems the state or tribe
wishes to address. However, in no case can those laws be less strict that those
set by the EPA. Each state that has an approved State Implementation Plan
(SIP) has been designated by the EPA to control air pollution under the Clean Air
Act. The SIP is a collection of the regulations, programs and policies that the
state will administer for the control of air pollution. In Missouri, the
implementation and enforcement of air pollution laws is the responsibility of the
Department of Natural Resources Air Pollution Control Program.
It should be noted that although Missouri is a SIP approved state and the
results of this study should generally be applicable in other states of the United
States, the Missouri air pollution laws do contain slight variations from other
states in regards to minor source permitting evaluations. The results of this study
are based on Missouri laws effective February 2010.

14
3.2 Air permitting
There are two major types of permits that can be obtained by a company
proposing the emission of any regulated air pollutant: construction permits and
operating permits. Construction permits are issued under the New Source
Review requirements and are required prior to start of construction. Start of
construction is a term that refers to the activities associated with construction of
the proposed project, or the Greenfield installation. This includes the
establishment of permanent structures for the purposes of the new installation.
Pouring concrete is typically cited as an example of starting construction.
Activities such as clearing land or leveling the area in which the installation is to
be located has historically not been considered start of construction under New
Source Review.
Issuance of an operating permit occurs after start up of the installed
equipment. Operating permits are intended to consolidate all compliance and
monitoring requirements found in construction permits, federal standards,
consent decrees, etc. Details on operating permits are outside the scope of this
thesis.
3.3 New Source Review
The regulations in the State of Missouri allow for three general (3) types of
permitting for Greenfield installations: De minimis, Minor, and Major19. The steps
of how a permit type is assessed do not change and a general outline of the

15
process can be seen in Figure 3. The first step is determining the project scope:
is there a modification occurring? The definition of modification as stated in the
Missouri State Regulations 10 CSR 10-6.020(M)(8):
Modification – Any physical change, or change in the method of operation of, a source operation or attendant air pollution control equipment which would cause an increase in potential emissions of any air pollutant emitted by the source operation.
For a Greenfield operation, the new plant is considered a modification and
the project is defined as the entire installation. For clarification, the term
installation is defined in 10 CSR 10-6.020(I)(6) as:
Installation – All source operations including activities that result in fugitive emissions, that belong to the same industrial grouping (that have the same two (2)-digit code as described in the Standard Industrial Classification Manual, 1987), and any marine vessels while docked at the installation, located on one (1) or more contiguous or adjacent properties and under the control of the same person (or persons under common control).
The next step in determining the type of permitting review of the
modification is calculation of the potential to emit, which is defined in 10 CSR 10-
6.020(P)(19) as:
Potential to emit – The emission rates of any pollutant at maximum design capacity. Annual potential shall be based on the maximum annual-rated capacity of the installation assuming continuous year-round operation. Federally enforceable permit conditions on the type of materials combusted or processed, operating rates, hours of operation and the application of air pollution control equipment shall be used in the determining the annual potential. Secondary

16
emissions do not count in determining annual potential.
The potential to emit of the installation is established by multiplying the
maximum hourly design rate of each equipment by an appropriate emission
factor for the process. A comprehensive, but not exhaustive, list of emission
factors that are nationally recognized and rated for quality is found in the EPA
document AP-42. However, if an emission factor is not listed under the desired
process, an approximation can be justified and used in the absence of an
appropriate emission factor. In most cases, performance testing conducted on
the equipment or similar equipment may be acceptable20.
The de minimis levels for each regulated air pollutant are the first tier of
regulation found in the Missouri State Regulations. Once an installation reaches
de minimis levels, they are reviewed for permitting requirements and evaluated
under the New Source Review.
The second tier of regulation determines the major source levels as
outlined in Table 6 for named and non-named installations. The State maintains
a list of sources categories that are called “named installations21” that are
affected by a different major source level. Currently, there are 27 source
categories listed in the Code of State Regulations21. For the proposed calcium
carbide manufacturing plant, the major source level is 250 tons of air pollutant
per year since it is not considered a named installation. Therefore, any fugitive
emissions created at this source will be counted towards the potential to emit of

17
the entire installation. Once the potential emissions of the installation are
determined the type of permit that is issued can be determined.
This research is based on a Greenfield installation. Therefore, the
permitting levels are also used in defining the source classification. For example,
if the potential emissions of this plant are less than de minimis levels, the source
is called a de minimis source.
The timeframe for permit issuance is dependent upon the type of permit
being issued. The statutory time limit for all Section (5) and Section (6) permits is
90 days from the receipt of a complete application (10 CSR 10-6.060). However,
if additional information is requested by the permitting authority, the application
may be placed on hold until the information is received. There is not public
comment period for these types of permits.
For major reviews conducted under Section (7), Section (8) or Section (9),
the statutory time limit is 184 days from the receipt of a complete application.
This also does not include time the application is placed on hold for additional
information. However, these permits are subject to a public notice period that is
included in the statutory time limit. The notice period lasts for 40 days. At that
time, anyone from the public may comment on the proposed permit. A public
hearing on the permit is scheduled during the public notice period but may be
canceled if a public hearing is not requested. All comments received during the
public notice period must be addressed and become a permanent addition to the
final permit.

18
At the time of this writing, carbon dioxide was determined by the Supreme
Court to be a greenhouse gas under the jurisdiction of the Clean Air Act. In
March 2010, the EPA finalized a rulemaking for the automobile and light-truck
industry that increased the efficiency standards for model years 2012 to 2016.
Once this rule was final, carbon dioxide became a regulated pollutant by
definition under the New Source Review rules and thus became permittable
under the same rules. As such, any sources with carbon dioxide emissions will
be required to obtain a construction permit prior to construction.
On March29, 2010, the EPA announced that permitting of these sources
will be phased in over the next few years to properly address carbon dioxide
emitting sources. Details on the levels at which permitting is necessary are being
proposed by EPA through the Greenhouse Gas Tailoring Rule, which proposes
to raise the major threshold for carbon dioxide from the current 100 or 250 tons
per year to 25,000 tons of carbon dioxide equivalent per year. A carbon dioxide
equivalent is methane, nitrous oxide, hydrofluorocarbons, perfluorocarbons, and
sulfur hexafluoride. Permitting requirements will not be triggered until January
2011 and will only first effect large stationary sources as the smaller sources are
phased in over the next few years22.
Carbon dioxide emissions are expected from this plant, and emission
factors for the release of carbon dioxide were discussed in the emission factors
section. No other carbon dioxide equivalents are expected.

19
3.4 Emissions and Controls
The level of emissions that are generated from the gasification process is
dependent upon the size of the equipment involved. The ratio of raw materials
necessary to produce a specific amount of product is based on the material
balance presented in an earlier section. Figure 4 outlines the conversion ratios
used in the potential emission calculations.
Potential emissions are based on information that most accurately
characterizes the emissions as they are released into the ambient air. The most
reliable source of information is direct testing of the emissions from the emission
source. However, this type of information requires that the emission source be
built and operating to perform the test. In most cases, this is nearly impossible
since a permit is required prior to being built. Test data from similar sources is
also acceptable if the sources are identical. Again, this may not be desirable
since similar equipment may be owned by competing companies who are not
willing to share their private information.
For most sources that lack the resources to provide direct testing data, the
EPA has compiled a document called AP-42 that examines various types of
industries and their emissions. The EPA document is categorized into 12
general sections. The emission factors are rated by letters that represent the
confidence of the emission factor4. Other methods of emission quantification are
mass balance, and estimation. For this study, the emission factors were taken

20
from AP-42 for processes addressed in AP-42. Since this is a new process,
estimations for emission factors were used.
3.5 Emission factors
The emission factors utilized in this evaluation were all obtained from AP-
42. In the cases where there were no emission factors specific to the processes
at this plant, a comparable emission factor from AP-42 was used. A summary of
the emission factors can be found in Table 7, 8 and 9 for PM10, NOx and VOC,
and CO and CO2, respectively. Each emission factor is referenced by a Source
Classification Code (SCC) that is an 8-digit code the EPA uses to classify
different emissions activities.
Prior to processing, the wood may be dried in a wood dryer that is fueled
by the combustion of wood or natural gas. The emissions from this part of the
process contain particulate matter, NOx, VOC, CO and CO2. This type of wood
drying is not discussed directly in AP-42. Therefore, drying of similar material
was used as a substitution. In particular, particleboard was chosen based on the
material used in the manufacturing of particleboard such as wood shavings,
flakes, wafers, and chips. These emission factors are found in Section 10.6.2
Particleboard.
The storage and handling of the wood and lime/dolomite raw materials
and intermediate products such as charcoal and the combination of charcoal and
lime are sources of particulate matter. As the material is conveyed into the silo,

21
air is displaced through the silo through openings located at the top of the silo.
These openings relieve the air pressure in the silo simultaneously carrying
entrained particulate matter into the surrounding atmosphere. The quantity of
particulate matter that is released is dependent on the material being stored in
the silo.
For the raw materials, emissions were based on emission factors taken
from Section 11.17-4 Lime Manufacturing4, which contains emission factors for
both the storage and handling of lime. Wood is hard fibrous substance that is not
expected to contribute as much fine particulate emissions as lime and dolomite
which are typically shipped as powders. However, emission factors for the
storage and handling of wood are not represented in AP-42. Therefore, wood
emissions were conservatively estimated using the same emission factors as
lime/dolomite.
For the intermediate materials, emissions were based on emission factors
taken from Section 11.4 Calcium Carbide Manufacturing4. Although the emission
factors in this section are based on traditional calcium carbide manufacturing
processes, emissions from the intermediate materials are expected to be similar.
The calcium carbide condensing and crushing operations are common in
typical calcium carbide manufacturing plants, and the emission factors listed in
Section 11.4 Calcium Carbide Manufacturing4 are representative of the
emissions from this plant. The solidified calcium carbide is crushed in a primary
crusher usually a jaw crusher, followed by a secondary crusher and screening for

22
size. Since crushing is performed in either an air-swept environment, or in an
inert atmosphere, the exhaust can be vented to a control device. It should be
noted that these emission factors were based on the use of a fabric filter as a
control device. To determine the uncontrolled emission factor, a control
efficiency of 99% was assumed for the use of a fabric filter as indicated in
Appendix B.2 of AP-424 and an emission factor was back-calculated using the
controlled emission factor.
The third stage reactor will combust off-gases produced during the
process which is expected to create emissions of PM10, NOx, VOC, CO and CO2.
Since it is difficult to predict the quantities and constituent of the off-gases, it is
assumed that natural gas is a comparable fuel type. The off gases are expected
to have a high carbon gas content and combustion products from previous
stages. Natural gas is comprised mainly of methane. Based on these
similarities, the emission factors for natural gas combustion were used to
determine emissions of the off-gases. These emission factors were taken from
Section 1.4 Natural Gas Combustion and Section 3.2 Natural Gas-fired
Reciprocating Engines4.
Part of the process relies on the combustion of the product acetylene gas
produced by the process as fuel for the equipment of the process. In this way,
the process is intended to achieve self-sustaining operations without the need for
additional outside resources. The intended combustion products of acetylene
are primarily carbon dioxide (CO2) and water based on the complete combustion

23
of acetylene in the appropriate amount of oxygen. The emission factor for CO2 is
157.45 pounds per million BTU23. However, under real world operating
conditions, the possibility of creating an oxygen deficient environment is a
possibility and appreciable amounts of carbon monoxide can form1. Studies
have shown that an oxygen content of less than 17% in the air can result in the
creation of CO of up to 5.9% of the resulting exhaust gas. Since it is not the
intention to run the combustion engine in an oxygen-deficient state, a
conservative estimate for CO emissions was based on a conversion of less than
1%. These values are consistent with the values found in AP-42 for natural gas
combustion. Therefore, AP-42 values were used as comparable emission
factors for CO and CO2.
The presence of nitrogen in the air allows for the possibility of creating
thermal nitrogen oxides (NOx). At high temperatures, usually above 1600°C
(2900°F), the nitrogen (N2) and oxygen (O2) molecules in the combustion air
decompose into their atomic states allowing for the oxidation of the nitrogen and
the formation of NOx, at a rate that is dependent upon the temperature and
residence time at that temperature24. The exact amount of NOx produced during
combustion, although unknown, is comparable to NOx from the combustion of
natural gas due to the low nitrogen content of natural gas.
Two ancillary processes are also considered here: the outside storage of
wood in a storage pile and haul roads. These processes are not directly related

24
to the manufacturing of the product. However, they are necessary for plant
operations. Both of these processes will be sources of particulate emissions.
Emissions from wood storage piles can be characterized into three
categories: load-in and load-out of wood, wind erosion, and vehicular activity. As
wood is loaded onto the wood pile or removed from the wood pile, emissions
occur due to the disturbance of the material in the storage pile. The equation for
determining these emissions, found in Section 13.2.4 Aggregate Handling and
Storage Piles4, is included here.
E = 0.0032k(U/5)1.3/(M/2)1.4 where
E = emission factor
k = particle size multiplier (dimensionless)
U = mean wind speed (m/s)
M = material moisture content (%)
The wind erosion and vehicular activity emissions were based on
equations taken from the Quarry Emission Worksheet25.
Haul roads emissions are addressed in Section 13.2.1 Paved Haul Roads
and Section 13.2.2 Unpaved Haul Roads depending on haul road conditions at
the plant. Each type yields a different quantity of emissions based on the type of
activity occurring at the plant, the kind of material being hauled, and the weight of
the truck hauling the material. As the trucks drive over the road, the tires crush
the material on the roads and lift it into the air. A set of empirical expressions are
included in the AP-42 for the estimation of particulate matter.

25
(unpaved) E = k (s/12)a(W/3)b where
E = size-specific emission factor (lb/VMT)
s = surface material silt content (%)
W = mean vehicle weight (tons)
M = surface material moisture content (%)
S = mean vehicle speed (mph)
C = emission factor for 1980's vehicle fleet exhaust, brake wear and tire
wear.
k, a, b, c and d are empirical constants.
(paved) E = k(sL/2)0.65 x (W/3)1.5 – C
where: E = particulate emission factor (having units matching the units of
k),
k = particle size multiplier for particle size range and units of interest (see
below),
sL = road surface silt loading (grams per square meter) (g/m2),
W = average weight (tons) of the vehicles traveling the road, and
C = emission factor for 1980's vehicle fleet exhaust, brake wear and
tire wear

26
CHAPTER 4
EVALUATION AND RESULTS
4.1 True De minimis Source
For a plant with a potential to emit (PTE) of less than de minimis levels for
all criteria air pollutants, no construction permit is required for the construction
and operation of the installation. A true de minimis source does not require
control equipment to maintain the emissions of regulated pollutants below de
minimis levels. In other words, no control devices are used to reduce emissions
released into the ambient air. When considering true de minimis sources, if the
haul roads that will be used are already paved, the methods for calculating these
emissions would differ from haul roads that are unpaved.
In this case study, the two scenarios that are examined are paved haul
roads and unpaved haul roads. In order to qualify as a paved haul road, they
must be paved with appropriate paving materials such as asphalt or concrete.
Table 13 shows the PTE of plant with paved haul roads and with unpaved haul
roads. The reductions in emissions from the paving of the haul allows for an
increase in production of 104 tons per year. In either case, the rate of production
cannot exceed 4.5 tons per day before a construction permit is necessary. This
would require a maximum wood feed rate of 0.11 tons per hour.

27
Because the pollutant with the greatest potential to emit is PM10, it is
considered the limiting air pollutant. Therefore, as the production at the plant
increases, the emission of PM10 will reach de minimis levels before the other
pollutants.
4.2 Synthetic De minimis Source
A plant with potential emissions greater than de minimis levels can
consent to emissions limitations and/or control requirements that will lower their
potential emissions to de minimis levels. Such permitted sources are called
synthetic de minimis sources and, for these sources, the review and issuance of
a construction permit is required prior to start of construction of the installation. If
an emissions limitation is imposed, the installation may not operate in a manner
that will cause emissions from the installation to exceed the emissions limitation.
This typically translates into a limited production rate. If the installation will
employ control devices as a means for reducing emissions, the installation will be
required to maintain and monitor the pollution control equipment.
Specifically for the carbide production plant, the pollutant being controlled
will be PM10. By reducing the PM10 emissions, the limiting pollutant changes
from PM10 in a true de minimis source to NOx. Table 13 shows the carbide
production level at which NOx will remain a de minimis source. This means that
a plant with a maximum production capacity greater than 6,362 tons per year will

28
require an emissions limit to remain a de minimis source based on the NOx
emissions.
Similar to the true de minimis source, potential emissions of the
installation will vary based on the use of unpaved or paved haul roads. For
purposes of simplification, controlled emissions are based on the use of paved
haul roads while uncontrolled emissions are based on the use of unpaved haul
roads.
The most common means of controlling particulate emissions are fabric
filters. Fabric filters can be added to the silos to reduce the particulate matter
release at the silo vents. The type of fabric filter can have an effect on how much
reduction in particulate matter can be achieved. The range of control efficiencies
is 90-99.9% with higher efficiencies possible through bag designs. In this case, a
conservative control efficiency of 99% was assumed for the use of a fabric filter
on non-combustion equipment. Ancillary processes (i.e. storage piles and haul
roads) are not controlled by fabric filters and control options for these units were
not explored beyond the paving alternative. A summary of the emissions can be
seen in Table 13.
It should be noted that the calculations are based on a capture efficiency
of 100%. Enclosures can be utilized to capture emissions from conveyors
moving the materials between processes. The captured emissions would be
drawn into the silo for control by the fabric filter. Although enclosures only
achieve a control efficiency of 3.7% by themselves, the capture efficiency can

29
increase to 100% depending on how the enclosure is design. If a negative
pressure is produced by the induction of air flow into the silo, the capture
efficiency is 100%.
Varying degrees of control require varying monitoring and recordkeeping
of the control devices. As the control efficiency of the equipment increases, the
amount of documentation for the increased control efficiency also increases.
Therefore, it is important for a company to take into these factors in the design
process to avoid undesirable requirements during the operation of the plant.
4.3 Minor Source
Based on a plant size greater than 30,273 tons per year, the potential
emissions will exceed the minor source levels and therefore must be designed at
a maximum feed capacity of 2.046 tons per hour to remain a minor source. If the
capacity of the plant is higher than this amount, a limit on the emissions that will
achieve this capacity can be taken to remain a minor source.
For plants that wish to obtain any minor source permit for PM10 and/or SOx
issued in an increment area, they are required to conduct a modeling analysis.
In addition, if the potential to emit of the installation is above 50 tons per year, the
minor source will be required to submit modeling showing that their source is in
compliance with the PM10 and SOx National Ambient Air Quality Standards
(NAAQS). As the minor source permitting implications are examined with the
carbide facility, the modeling aspects are also addressed.

30
The air quality standards can be found in 10 CSR 10-6.010 and are
summarized in Table 11. Since this plant is not expected to have SOx emissions,
a SOX evaluation is not necessary.
Without a specific location for the installation, an accurate increment or
NAAQS modeling analysis cannot be performed. Refined modeling takes into
account site specific information to replicate the interactions of the new site with
existing emissions in the area. Refined modeling is the preferred method for
modeling impacts. However, since site specific information is unavailable for this
study, screen modeling is used to determine the impact of pollutants from this
process. The most common EPA approved screening model is Screen3.
However, when dealing with multiple emission sources and/or area sources like
haul roads, Screen3 is not designed to model these types of sources. The
Missouri Department of Natural Resources currently maintains a set of modeling
nomographs developed by the Air Pollution Control Program that is used for
modeling construction industries such as concrete batch plants, asphalt batch
plants, and quarry operations. These nomographs are considered very
conservative in predicting impacts and were chosen as the modeling method for
the carbide plant as a general evaluative tool for determining the impact of
emissions from the carbide plant on the ambient air.
For purposes of this research, the impacts from various distances to the
property boundary were evaluated. The location of the plant to the property
boundary can have a significant effect on a model since the distance the

31
emissions have to travel before reaching ambient air also affect the impact those
emissions have on the ambient air. Although ambient air is defined in the
regulations as: “All space outside of buildings, stacks or exterior ducts (10 CSR
10-6.020(2)(A)19 ), for modeling and permitting purposes, ambient air is better
defined as air outside of a fenced property boundary. This is air that can be
reached by a public entity.
The nomograph-based spreadsheet distributed by the Missouri
Department of Natural Resources (MDNR) has been utilized as a surrogate for
refined modeling. Specifically, the nomograph-based spreadsheets designed to
account for emissions of a quarry operation were utilized since the emission
points associated with a quarry operation are similar to the emission points
associated with this plant study. Quarries operated conveyors, crushers, storage
piles and haul roads similar to the operations at the carbide facility. The
nomograph-based spreadsheets are considered conservative screening models
and, for purposes of this study, these screening models will provide a general
overview of how the emissions are impacting the air.
Although two standard averaging times exist for the PM10, only the 24-
hour standard is evaluated in this study since the nomograph-based
spreadsheets only address the 24-hour standard. Demonstrating compliance
first with the 24-hour standard is useful in identifying initial issues that may occur.
Without site specific information, further analysis of the annual standard was not
conducted.

32
Figures 5 and 6 show a snapshot of the spreadsheet model taken directly
from the MDNR website. Parameters specific to the carbide plant were keyed
into the spreadsheet and the results were summarized. Table 12 and 10 provide
summaries of the impacts based on the spreadsheet.
For a minor source not wishing to take any conditions on the installation,
the potential emissions of PM10 can go up to 249 tons per year without exceeding
major levels. For this type of source, the facility is not expected to comply with
either the increment or the NAAQS for PM10 unless the facility can be located
quite a distance from the property boundary. The nomograph spreadsheet is not
equipped for distances greater than 2500 feet. However, if the data is
extrapolated as seen in Figure 7, the distance needed to meet the NAAQS is
3140 feet. Moreover, the distance needed to comply with the increment standard
is higher at 3525 feet. Unless the installation can be located on a large plot of
land, the data suggests that refined modeling will be necessary once specific
information on the plant is confirmed if the full installation intends on emitting the
249 tons per year.
As an alternative, the plant may reduce the production rate of the plant to
achieve a lower uncontrolled emission rate. Table 12 looks at how a decrease in
the production rates affects the installation’s impact. A production between
10,000 to 15,000 tons per year at a distance of 2500 feet from the property
boundary is able to meet the NAAQS using the spreadsheet model.

33
For a plant designed for the control of particulate matter, the potential
emissions of PM10 decrease drastically allowing production to increase and the
limiting pollutant, NOx, to increase to 249 tons per year. This is a production rate
of close to 40,000 tons per year. In addition, the modeled impact decreases
such that the plant is able to locate closer to the property boundary without
exceeding air quality standards. Table 13 shows a comparison of impacts with
respect to the distance of the plant to the property boundary. In contrast to the
distance needed for a true minor source to comply with air standards, a synthetic
minor source is able to locate as close as 500 feet to the nearest property
boundary. This shows how decreasing the emissions increases flexibility for the
plant.
4.4 Major Source
Based on a plant size of 44,389 tons per year, the controlled potential
emissions of NOx will exceed the major source levels. The major source
evaluated in this thesis will be located in an attainment area for all criteria
pollutants. This includes areas outside of the St. Louis metropolitan area (i.e. St.
Louis, St. Charles, Jefferson and Franklin Counties and the City of St. Louis).
Therefore the review of the plant will be conducted under Section (8) of the
construction permit rule. For the review of a major source, a compliant refined
modeling analysis and a Best Available Control Technology (BACT) analysis
must be conducted for the major pollutant, which is, in this case, NOx.

34
For plants that wish to construct in a non-attainment area, a review under
Section (7) of the construction permit rule is required. This includes a Lowest
Achievable Emission Rate (LAER) review in lieu of a BACT review of the
possible control devices. In a LAER review, the most stringent emission limit
must be considered regardless of economic, energy or environmental impacts
associated with the controls device or limitation. The LAER review is outside the
scope of this thesis.
A compliant modeling analysis for a major review for the carbide plant will
include a demonstration of compliance with the NOx NAAQS and increment
standard. In addition, any applicable minor source modeling requirements must
be completed for all major reviews. In this case, the potential emissions of PM10
exceed the de minimis levels but not major levels. Therefore, a PM10 NAAQS
and increment analysis is also necessary. Table 14 outlines the PM10 impacts
based on the quarry spreadsheet. In order to meet the NAAQS, the plant would
need to locate between 400 and 500 feet from the property boundary. For the
increment standard, the plant would need to locate more than 1300 feet from the
property boundary.
Similar to the discussion found in the previous minor source modeling
section, screen modeling is used as a surrogate for refined modeling since site
specific information is not available for this study. Again, the nomograph-based
spreadsheet model is used as the modeling method for PM10. For NOx, the
conservative model called Screen3 is utilized to evaluate impacts from the site.

35
As noted previously, Screen3 is not intended for multiple emission sources and is
not a good model for haul roads or storage piles. However, there is a procedure
allowed by the Screen3 model that merges nearby emission stacks into a single
representative stack for evaluation in the Screen3 model26. The carbide facility
only consists of three sources of NOx emissions: the wood dryer, the reactor,
and the IC engine. This research uses the representative stack procedure to
combine these similar sources and determine the impact of NOx from the facility.
Screen3 allows the user to input stack parameters, emission rates and
other modeling considerations such as building downwash, terrain, and
meteorological conditions. Default parameters for the modeling aspects of the
program are set up for the Screen3 model and are typically used when running
the model for permit screening purposes. However, stack parameters and
emission rates must be inputted by the user before the model can run properly.
Once the model is finished running, the program supplies an output of
information including the impacts at discrete distances from the source. For this
research, a user-friendly interface called Screen View Version 3.0, produced by
Lakes Environmental, was used. Figure 8 is an example of the output file
created by Screen3.
Several factors may affect the impact of emissions including stack height,
exit velocity, and exit temperature. These three parameters were investigated
using the ranges specified in Table 12. The results seen in Table 13, 14 and 15
show that the lower stack height, temperature, and exit velocity values have the

36
highest effect on the impact of the plant on the ambient air. These factors should
be considered in determining the optimum design for a carbide plant. Finally, by
taking the lowest stack parameter values, the distance from the stack to the
property boundary can be determined by finding the maximum impact that will
not exceed either the NAAQS or the increment standard for NOx. These results
can be seen in Table 16.
For major reviews, a BACT analysis is also required. The top-down
approach is outlined in the EPA document Draft New Source Review Manual and
is used as the basis for the BACT analysis for this research. The top-down
approach consists of five steps that evaluate the technical, economical and
environmental aspects of a control technology as it applies to the process. The
five steps are:
1. identify all control technologies;
2. eliminate technically infeasible options;
3. rank remaining control technologies by control effectiveness;
4. evaluate most effective controls and document results; and
5. select BACT.
To perform a complete BACT analysis, the costs and specific design
parameters are needed for each piece of equipment. However, this type of
information is invariably dependent upon the company responsible for the
construction of the plant. Therefore, the first three steps of the analysis have

37
been reviewed and presented. The final two steps were completed based on the
typical selection of BACT at other facilities.
To identify control technologies used on throughout the US, the EPA has
developed a clearinghouse of permit determinations called the
RACT/BACT/LAER Clearinghouse (RBLC). This is used as the tool for
permitting authorities to search control technologies currently permitted in other
states. Since the three stage reactor is a new technology, previous BACT
analyses have not been performed for this process.
The equipment included in this BACT analysis are those equipment that
emit the pollutants that exceed the major levels. The only sources of NOx at the
carbide plant are the combustion equipment. This includes the three-stage
reactor, the IC engines and the wood dryer.
Although a BACT analysis has not been completed for the three stage
reactor, control options for the pollutants found in the exhaust are similar to those
found for the control of IC engine emissions. Based on the potential to emit
analysis, both processes are expected to emit comparable amounts of NOx, VOC
and CO. Therefore the control technologies discussed in the following sections
may be applied to these process emissions.
PM10, VOC and CO will not be emitted in amounts greater than the major
threshold levels and are not included in this BACT analysis. However, PM10,
VOC and CO control technologies are included in the Appendix as an overview
of possible control options for higher production rates.

38
The control technologies for NOx from IC engines are:
Low Excess Air (LEA)
Low NOx Burners (LNB)
Overfire Air (OFA)
Flue gas recirculation (FGR)
Selective Non-Catalytic Reduction (SNCR)
Selective Catalytic Reduction
A description of these control technologies can be found in the Appendix.
Although a BACT analysis can also take into account factors such as cost and
environmental impacts, these factors are not examined by this review. Based on
the common occurrence of LNBs in BACT determinations, LNBs were chosen as
the control of choice for this review. LNBs are designed to limit NOx formation by
controlling the stoichiometric makeup of the combustion flame and the
temperature profile in each burner flame. This control is accomplished by
regulating the aerodynamic distribution and mixing of the fuel and air, thus
reducing oxygen (O2) in the primary combustion zone, flame temperature and
residence time at peak combustion temperatures.

39
CHAPTER 5
CONCLUSION
A calcium carbide manufacturing plant can be permitted for construction in
Missouri at each air regulatory permitting level: de minimis, minor and major
source levels. The type of permit and level of review necessary will depend on
the total amount of production specified in the process. For a true de minimis
source, or an annual calcium production rate of less than 1,657 tons, no control
devices are required. For a synthetic de minimis source, or an annual calcium
production rate of 6,362 tons, particulate filters with a control efficiency of 99%
are required. Similarly, for a true minor source, or an annual calcium production
rate of less than 30,273 tons, no control devices are required. For a synthetic
minor source, or an annual calcium production rate of 39,876 tons, particulate
filters with a control efficiency of 99% are required. A major source, or an annual
calcium production rate of 44,389 tons, requires the installation of low NOx
burners in addition to particulate filters.
For each regulated pollutant, emission modeling was performed by the
application of screen models. The modeling results indicate compliance with
applicable air standards is reasonably achievable depending on the location of
the plant to the property boundary.

40
CHAPTER 6
RECOMMENDATIONS
For future consideration of acetylene production at the calcium carbide
plant, air emissions can be considered negligible. Acetylene production requires
the addition of water to the calcium carbide. The main source of emissions
would be particulate matter from the processing of calcium carbide or the
handling of the calcium carbonate produced during the reaction. These
emissions would be dependent on the number of equipment used in the plant
design and the final production rate. No other regulated air pollutants are
expected.
This thesis represents the writer’s estimation of emissions from a plant still
in the conceptual stages. To the best of the writer’s knowledge at the time of
writing, these emissions estimations are considered conservative to provide a
general idea of the level of permitting required at various production rates.
Actual review results are dependent on the final design of the plant, the location
of the plant, and any additional regulations that may become effective after
publication of this thesis. It is recommended that current regulations are
consulted prior to submission of any permit application.
Although Hazardous Air Pollutants are not expected in quantities that
would exceed the de minimis threshold for HAPs, each individual HAP is

41
assigned a Screen Modeling Action Level (SMAL) that, for certain HAPs, have
considerably lower thresholds than the HAP de minimis level. If an individual
HAP has a potential to emit greater than its SMAL, modeling will need to be
performed to determine if the emissions of that particular HAP will have an
impact on the ambient air. The modeled impact must demonstrate compliance
with the Risk Assessment Level (RAL) for the modeled HAP. The RAL is a
concentration based on a one-in-million cancer risk and is a concentration that is
not expected to produce adverse human health effects during a defined period of
exposure, which is different for each HAP. Generally, the exposure periods are
listed as 8-hour, 24-hour and annual periods. If testing reveals that HAP
emissions are a possibility, it is recommended that the emissions are compared
to the HAP SMALs for further possible review.

42
Table 1. Summary of Emission Units for the Gasification Production of Calcium
Carbide using Biomass and Lime
Emission Unit Identification
Emission Unit Description Emission Type
Identifying category
EU-1 Wood dryer Point Combustion EU-2 Dried wood conveyor Area Ancillary EU-3 Charcoal conveyor Area Ancillary EU-4 Lime conveyor Area Ancillary EU-5 Charcoal/lime storage silo Point Ancillary EU-6 Charcoal/lime conveyor Area Ancillary EU-7 Dolomite conveyor Area Ancillary EU-8 Dolomite storage silo Point Ancillary EU-9 3rd stage reactor combustion Point Direct Process
EU-10
Ca C2 condenser Point Direct Process
EU-11 Ca C2 crusher Area Ancillary EU-12 Ca C2 conveyor Area Ancillary EU-13 Ca C2 loading Area Ancillary EU-14 IC engine – off-gases Point Combustion EU-15 Storage Pile – wood Area Ancillary EU-16 Haul Road Fugitive -
Area Ancillary

43
Table 2. Material Balance for Carbide Production from Wood based on 1 ton Carbide1
Materials Fed (lb) Carbide Produced (lb) Gas and dust (excl. CO) Carbon Consumed
CO Emitted
Component Lime Wood Total
Feed Component
used
In Product Feed
Component
Evolved
as amount as amountCaO 1846.8 1846.8 1467.4 CaC2 1677.0 943.3 191.5 CaO 191.5 64.4 CaO 64.4 9.2 Ca 6.6 110.8 Ca 79.1 25.7 0.2 CaS 0.2 0.0 0.6 Ca3P2 0.6 0.1 2.7 Ca3N2 2.4 0.6 C 1124.9 1124.9 98.8 C 98.8 40.5 C 40.5 139.3 0.1 Al4C3 0.3 0.1 1.9 SiC 6.0 1.9 H2O 4.1 59.2 63.3 63.3 H2 7.2 42.0 volatiles 112.5 112.5 112.5 H2 15.9 CH4 63.7 SiO2 30.7 30.7 7.8 SiO2 7.8 0.8 SiO2 0.8 9.0 SiC 6.0 13.1 Si 8.9 Fe2O3 14.3 14.3 2.6 Fe2O3 2.6 11.7 Fe 3.3 0.0 Al2O3 10.2 10.2 5.1 Al2O3 5.1 1.8 Al2O3 1.8 0.7 Al4C3 0.3 2.6 Al 0.7 1.2 MgO 6.1 6.1 1.0 MgO 1.0 5.1 Mg 3.1 1.5 Na2O 10.2 10.2 10.2 Na 3.7 2.0 S 0.0 0.1 0.1 0.1 CaS 0.2 0.0 S 0.0 SO3 2.0 2.0 2.0 SO2 1.6 0.0 CO2 20.5 20.5 P2O5 0.6 0.6 0.5 Ca3P2 0.6 0.1 P 0.1 0.1 N 0.0 0.6 0.6 0.5 Ca3N2 2.4 0.1 N2 0.1
total (lb) 1944.97 1296.54 2000.0 286.3 1166.9 1009.3

44
Table 3. Thermal Balance of Carbide Production from Wood based on 1 ton of Carbide1
Reaction H
BTU/mol
Basis
Heat Consumed
BTU Reactant lb moles
CaO + 3C = CaC2 + CO 441 CaO 1467.4 11885.9 5,241,902CaO + C = Ca + CO 497 CaO 123 1000.2 496,666H2O + C = CO + H2 167 H2O 63 1435.5 239,108Ca(OH)2 = CaO + H2O 63 H2O 9 205.1 13,013CaSiO3 = CaO + SiO2 80 SiO2 3 19.3 1,539SiO2 + 2C = Si + 2CO 589 SiO2 22 167.3 98,559Si + C = SiC -6 SiC 6 68.0 -378Fe2O3 + 3C = 2Fe + 3CO 442 Fe2O3 12 53.1 23,480Ca(AlO2)2 = CaO + Al2O3 0 Al2O3 5 23.2 0Al2O3 + 3C = 2Al + 3CO 1230 Al2O3 2.5 11.4 14,0554Al + 3C = Al4C3 0 Al4C3 0.3 1.1 0MgO + C = Mg + CO 473 MgO 5 58.0 27,433Na2O + C = 2Na + CO 288 Na2O 10 77.3 22,290
Ca SO4 + C = CaO + SO2 + CO 350 SO3 2 11.6 4,061
CaCO3 + C = CaO + 2CO 331 CO2 20 210.8 69,737Ca3(PO4)2 + 5C =
3CaO + 2P + 5CO 1566 P2O5 0.6 2.5 3,961
3Ca + 2P = Ca3P2 -397 P2O5 0.6 2.5 -1,003Ca + Sorganic = CaS -198 S 0.09 1.3 -253Ca + Norganic = Ca3N2 -198 N 0.5 14.6 -2,892
Total Chemical Reactions 6,251,276
Heat content of carbide at 3578oF, cp 0.522 BTU/lb 2,055,137Latent heat of fusion 229,942Heat content of 263.1 lb of dust at 1148OF, cp 0.450 BTU/lb 73,352Heat content of 1009.3 lb of CO at 1148OF cp 0.468 BTU/lb 292,620Heat content of 23.1 lb of H2 at 1148OF cp 6.299 BTU/lb 28,233Heat content of 63.7 lb of CH4 and 1.8 lb of other gases 18,742
Total chemical and sensible heat 8,949,301 Transformer and electrode cooling water, 8% 715,944
Total
(approx) 9,665,246

45
Table 4. Boiler Design Heating Requirements
heat required for the production based on 1 ton 9,665,246 BTU/ton CaC2 produced boiler efficiency 85%
heat required to boiler 11,370,877 BTU/ton CaC2 produced
Heat Content Comparison among Fuels Natural Gas 1,439,277 BTU/ft3
Methane, CH4 1,332,837 BTU/ft3 Acetylene 1,874,407 BTU/ft3
Quantity of Fuel Required to Boiler Natural Gas 7.9 ft3/ton CaC2 produced
Methane, CH4 8.5 ft3/ton CaC2 produced Acetylene 6.1 ft3/ton CaC2 produced
density of methane 0.0417 lbm/ft3 density of natural gas 0.044 lbm/ft3
density of acetylene 0.0682 lbm/ft3
Natural Gas 0.33 lbm fuel/ton carbide produced
Methane, CH4 0.38lbm fuel/ton carbide produced
Acetylene 0.41 lbm fuel/ton carbide produced

46
Table 5. De Minimis Levels for Regulated Air Pollutants Regulated Air Pollutants De minimis Level (tons per year) Carbon Monoxide 100.0 Nitrogen dioxide 40.0 Particulate Matter less than 10 microns (PM10)
15.0
Sulfur dioxide 40.0 Ozone (to be measured as VOC) 40.0 Lead 0.6 Hazardous Air Pollutant (each) 10.0 Sum of Hazardous Air Pollutants 25.0

47
Table 6. New Source Review Major Thresholds Pollutant
Named Sources (tons per year)
Non-named sources (tons per year)
PM10 100 250
SOx 100 250
NOx 100 250
VOC 100 250
CO 100 250
HAPs 10/25 10/25

48
Table 7. PM10 Emission Factors for Carbide Production
ID Emission Unit location EF units Note EU-1 Wood dryer SCC 3-07-006-25,
AP-42 Table 10.6.2-1 (uncontrolled) 2.2 lb/dried ton
EU-2 Dried wood conveyor SCC 3-05-016-15 AP-42 Table 11.17-4 2.2
lb PM/ton processed
EU-3 Charcoal conveyor SCC 3-05-016-15 AP-42 Table 11.17-4 2.2
lb PM/ton processed
EU-4 Lime conveyor SCC 3-05-016-15 AP-42 Table 11.17-4 2.2
lb PM/ton processed
EU-5 Charcoal/lime storage silo SCC 3-05-004-06 AP-
42 Table 11.4-2 (with fabric filter) 0.22
lb PM/ton processed
Determined uncontrolled EF by assuming 99% control efficiency
for the baghouse per AP-42 Appendix B.2
EU-6 Charcoal/lime conveyor (charging conveyor) SCC 3-05-004-06 AP-
42 Table 11.4-2 (with fabric filter) 0.22
lb PM/ton processed
Determined uncontrolled EF by assuming 99% control efficiency
for the baghouse per AP-42 Appendix B.2
EU-7 Dolomite conveyor SCC 3-05-016-15 AP-42 Table 11.17-4 2.2
lb PM/ton processed
EU-8 Dolomite storage silo SCC 3-05-016-15 AP-42 Table 11.17-4 2.2
lb PM/ton processed
EU-9 3rd stage reactor combustion
SCC 1-02-006-02 AP-42 Table 1.4-2 0.00745
lb PM/MMBTU
EU-10 Ca C2 condenser (tap fume vents) SCC 3-05-004-04 AP-
42 Table 11.4-2 (with fabric filter) 0.14
lb PM/ton throughput
Determined uncontrolled EF by assuming 99% control efficiency
for the baghouse per AP-42 Appendix B.2

49
Table 7 ID
(Cont.) Emission Unit location EF units Note
EU-11 Ca C2 crusher SCC 3-05-004-05 AP-42 Table 11.4-2 (with fabric filter) 0.11
lb PM/ton throughput
Determined uncontrolled EF by assuming 99% control efficiency
for the baghouse per AP-42 Appendix B.2
EU-12 Ca C2 conveyor SCC 3-05-020-06 AP-42 Table 11.19.2-2 (uncontrolled) 0.0011
lb/ton throughput
EU-13 Ca C2 loading SCC 3-05-020-32 AP-42 Table 11.19.2-2 (uncontrolled) 0.0001
lb/ton throughput
EU-14 IC engine – off-gases SCC 2-02-002-54 AP-42 Table 3.2-2
7.71E-05 lb/MMBTU
EU-15 Storage Pile – wood AP-42 13.2.4 Aggregate Handling and Storage Piles Equation
EU-16 Haul Road AP-42 13.2.1 Paved haul road Equation lb/VMT

50
Table 8. NOx and VOC Emission Factors for Carbide Production
NOx VOC
location EF units location EF units EU-1 Wood dryer SCC 3-07-006-25,
AP-42 Table 10.6.2-2 (uncontrolled) 2.7 lb/dried ton
SCC 3-07-006-25, AP-42 Table 10.6.2-3 (uncontrolled) 11.79
lb/dried ton
EU-2 Dried wood conveyor N/A N/A EU-3 Charcoal conveyor N/A N/A EU-4 Lime conveyor N/A N/A EU-5 Charcoal/lime storage silo N/A N/A EU-6 Charcoal/lime conveyor
(charging conveyor) N/A N/A EU-7 Dolomite conveyor N/A N/A EU-8 Dolomite storage silo N/A N/A EU-9 3rd stage reactor
combustion SCC 1-02-006-02 AP-42 Table 1.4-1 0.098 lb/MMBTU
SCC 1-02-006-02 AP-42 Table 1.4-2 0.005 lb/MMBTU
EU-10 Ca C2 condenser (tap fume vents) N/A N/A
EU-11 Ca C2 crusher N/A N/A EU-12 Ca C2 conveyor N/A N/A EU-13 Ca C2 loading N/A N/A EU-14 IC engine – off-gases SCC 2-02-002-54
AP-4 Table 3.2-2 0.847 lb/MMBTU SCC 2-02-002-54 AP-4 Table 3.2-2 0.118 lb/MMBTU
EU-15 Storage Pile – wood N/A N/A EU-16 Haul Road N/A N/A

51
Table 9. CO2 and CO Emission Factors for Carbide Production
CO2 CO
location EF units location EF units EU-1 Wood dryer
SCC 3-07-006-25, AP-42 Table 10.6.2-2 (uncontrolled) 573
lb/dried ton
SCC 3-07-006-25, AP-42 Table 10.6.2-2 (uncontrolled) 3.5
lb/dried ton
EU-2 Dried wood conveyor N/A N/A EU-3 Charcoal conveyor N/A N/A EU-4 Lime conveyor N/A N/A EU-5 Charcoal/lime storage silo N/A N/A EU-6 Charcoal/lime conveyor
(charging conveyor) N/A N/A EU-7 Dolomite conveyor N/A N/A EU-8 Dolomite storage silo N/A N/A EU-9 3rd stage reactor
combustion SCC 1-02-006-02 AP-42 Table 1.4-1 117.647
lb/MMBTU
SCC 1-02-006-02 AP-42 Table 1.4-1 0.082
lb/MMBTU
EU-10 Ca C2 condenser (tap fume vents) N/A N/A
EU-11 Ca C2 crusher N/A N/A EU-12 Ca C2 conveyor N/A N/A EU-13 Ca C2 loading N/A N/A EU-14 IC engine – off-gases SCC 2-02-002-54 AP-4
Table 3.2-2 110 lb/MMBTU
SCC 2-02-002-54 AP-4 Table 3.2-2 0.557
lb/MMBTU
EU-15 Storage Pile – wood N/A N/A EU-16 Haul Road N/A N/A

52
Table 10. Comparison of Wood Feed Rates and Carbide Production Rates to Annual Emission Rates
Haul Road Type
MHDR of wood in tons
Control Efficiency
PM10 NOx VOC CO CO2 Carbide Production Rate
Permitting Classification tpy tpy tpy tpy tpy tpy
True de minimis unpaved 0.112 14.9 10.4 6.4 7.8 1,436 1,657 paved 0.119 14.7 11.0 6.8 8.2 1,526 1,761 Synthetic de minimis paved 0.43 99% 3.8 39.9 24.6 29.8 5,514 6,362 True minor paved 2.046 249.8 189.7 117.0 141.8 26,236 30,273 Synthetic minor paved 2.695 99% 20.9 249.9 154.1 186.8 34,558 39,876
Controlled major paved 3 99% 23.2 278.1 171.6 208.0 38,468 44,389

53
Table 11.NAAQS and Increment Standards
Pollutant Concentration (g /m3)
Averaging Time NAAQS Increment
PM10 50 17 Annual
150 30 24-hour
CO 10,000 N/A 8-hour 40,000 N/A 1-hour
NOx 100 25 Annual

54
Table 12. Summary of PM10 modeling based on quarry spreadsheet for a true minor installation
Carbide Production
(tpy) annual emissions
(tpy)
distance to boundary
(ft)
Installation 24-hour impact * (g /m3)
Tru
e M
inor
30,273 249.8 2000 509.92
30,273 249.8 2250 419.56
30,273 249.8 2500 353.85
25,000 206.2 2500 290.75
20,000 164.8 2500 232.61
15,000 124 2500 174.47
10,000 82.7 2500 116.33
* An installation 24-hour impact of 150 g /m3 demonstrates compliance with the NAAQS

55
Table 13. Summary of PM10 modeling based on quarry spreadsheet for a synthetic minor installation
Carbide Production
(tpy) annual emissions
(tpy)
distance to boundary
(ft)
Installation 24-hour impact* (g /m3)
Syn
thet
ic M
inor
39,876 20.9 2000 13.49
39,876 20.9 1500 22.1
39,876 20.9 1300 28.23
39,876 20.9 1000 44.2
39,876 20.9 750 65.5
39,876 20.9 500 127.6
39,876 20.9 400 182.5 * An installation 24-hour impact of 150 g /m3 demonstrates compliance with the NAAQS. An installation 24-hour impact of 30 g /m3 demonstrates compliance with the increment standard.

56
Table 14. Summary of PM10 modeling based on quarry spreadsheet for a major installation
Carbide Production
(tpy) annual emissions
(tpy)
distance to boundary
(ft)
Installation 24-hour impact* (g /m3)
Maj
or
44389 23.2 2000 14.95
44389 23.2 1500 24.5
44389 23.2 1300 31.31
44389 23.2 1000 49.02
44389 23.2 750 72.63
44389 23.2 500 141.5
44389 23.2 400 202 * An installation 24-hour impact of 150 g /m3 demonstrates compliance with the NAAQS. An installation 24-hour impact of 30 g /m3 demonstrates compliance with the increment standard.

57
Table 15. Stack parameter ranges for NOx impact evaluation using Screen3
Stack parameter Range
Height 5 ft - 30 ft Exit velocity 19 ft/s - 30 ft/s
Exit temperature 77oF - 185 oF

58
Table 16. Comparison of increased exiting temperature on NOx impacts based on Screen 3
Stack height: 5 ft, Diameter: 2 ft, Exit velocity: 10 ft/s
Carbide
Production (tpy)
annual emissions
(tpy) temperature (oF)maximum 1-hour impact (g /m3)
Installation annual impact
(g /m3)
Maj
or
44,389 23.2
77 1140 483.36
113 976.2 413.91
149 755.5 320.33
185 628.9 266.65
* An installation annual impact of 100 g /m3 demonstrates compliance with the NAAQS. An installation annual impact of 25 g /m3 demonstrates compliance with the increment standard.
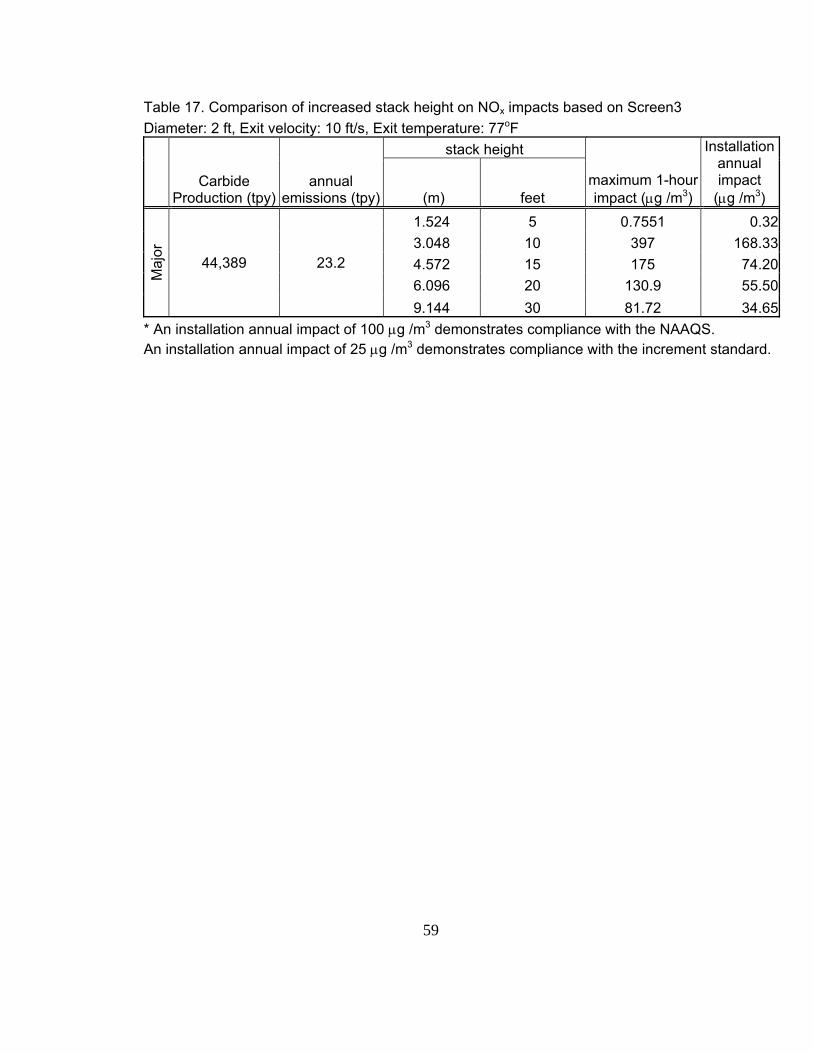
59
Table 17. Comparison of increased stack height on NOx impacts based on Screen3
Diameter: 2 ft, Exit velocity: 10 ft/s, Exit temperature: 77oF
Carbide Production (tpy)
annual emissions (tpy)
stack height
maximum 1-hour impact (g /m3)
Installation annual impact
(g /m3) (m) feet
Maj
or
44,389 23.2
1.524 5 0.7551 0.32
3.048 10 397 168.33
4.572 15 175 74.20
6.096 20 130.9 55.50
9.144 30 81.72 34.65
* An installation annual impact of 100 g /m3 demonstrates compliance with the NAAQS. An installation annual impact of 25 g /m3 demonstrates compliance with the increment standard.

60
Table 18. Comparison of increased exit velocity on NOx impacts based on Screen3
Diameter: 2 ft, Exit velocity: 10 ft/s, Exit temperature: 77oF
exit velocity
maximum 1-hour impact (g/m3)
Installation annual impact (g/m3)
Carbide Production (tpy)
annual emissions (tpy) (m/s) ft/s
Maj
or
44,389 23.2
3.048 10 1140 483.36
4.572 15 758.8 321.73
6.096 20 570 241.68
7.62 25 445 188.68
9.144 30 380 161.12
* An installation annual impact of 100 g/m3 demonstrates compliance with the NAAQS. An installation annual impact of 25 g/m3 demonstrates compliance with the increment standard.

61
Table 19. Summary of worst-case NOx modeling based on Screen3
Stack Height 5 ft, Diameter: 2 ft, Exit Velocity: 10 ft/s , Temperature: 77oF
Carbide Production (tpy)
annual emissions (tpy)
distance to boundary
1-hour impact (g/m3)
Installation annual impact* (g/m3) meters feet
Maj
or
44,389 23.2
30 98.208 1140 483.36
100 327.36 370.8 157.22
200 654.72 211.7 89.76
300 982.08 136.4 57.83
500 1636.8 124.8 52.92
1000 3273.6 63.61 26.97
1100 3600.96 56.68 24.03
1500 4910.4 38.11 16.16
* An installation annual impact of 100 g /m3 demonstrates compliance with the NAAQS. An installation annual impact of 25 g /m3 demonstrates compliance with the increment standard.

62
Table 20. Pollutants Requiring Modeling Based on Annual Emission Rates
Permitting Classification
Carbide Production
Rate PM10 NOx CO tpy tpy modeling tpy modeling tpy modeling
True de minimis 1,657 14.9 n 10.4 n 7.8 n 1,761 15.0 n 11.0 n 8.2 n Synthetic de minimis 6,362 4.8 n 39.9 n 29.8 n True minor 30,273 249.8 y 189.7 n 141.8 n Synthetic minor 39,876 27.2 y 249.9 n 186.8 n
Major 44,389 30.2 y 278.1 y 208.0 n

63
First Stage300 – 1000 oF
Second Stage~1200 oF
Third Stage~3000oF
Molten Solid Materials
Heat
O2
OR Steam
Controlled Air
Controlled Air
Biofuel Gases
BiofuelLiquids
And Gases
Condenser Condenser
Biofuel Gas
Clean Air & Water
Biomass or Carbon Waste
Material
Pyrolysis
Controlled Partial
Combustion
Complete Combustion
Figure 1. Process Flow Diagram of the Three Stage Gasification Process15

64
Figure 2. Schematic of Emission Units for a Biomass CaC2 Plant

65
Figure 3. Flow Diagram for Determining Permit Type Required
Start Calculate installation PTE
Is PTE of all criteria air pollutants < de minimis?
Yes No
Is PTE of all criteria air pollutants < major level? Yes
No
Section (6) permit required
Section (7) or (8) permit required
End
End
Does the applicant wish to take a voluntary minor limit on pollutants that exceed
minor levels?
No
No permit is required per 10 CSR 10-6.060
End
Does the applicant wish to take a voluntary de minimis
limit on pollutants that exceed de minimis levels?
Yes No
Section (5) permit required
End
Yes

66
1124.85 lb wood into process 1846.80lb CaO into process 0.61 ratio of wood to CaO 0.8 conversion factor for wood to charcoal 0.6 ratio of dolomite needed per CaO used 0.56 ratio of wood used to CaC2 produced
Figure 4. Conversion of Raw Materials through the Carbide Process

67
Figure 5. Quarry Spreadsheet - Snapshot of the Data Entry Tab

68
Figure 6. Quarry Spreadsheet - Snapshot of the Ambient Impact & Emissions Tab

69
Figure 7. Quarry Spreadsheet Impact Extrapolation for PM10
Extrapolation of Installation 24‐hour impact (μ g/m3)
y = ‐0.3121x + 1130.1
300
350
400
450
500
550
0 500 1000 1500 2000 2500 3000
Installation 24‐hour impact (mg/m3)
Linear (Installation 24‐hour impact (mg/m3))
Impact of 150 mg/m3 = 3140 ft
Impact of 30 mg/m3 = 3525 ft

70
Figure 8. Screen3 Model Output File
03/29/10 10:37:30 *** SCREEN3 MODEL RUN *** *** VERSION DATED 96043 *** SIMPLE TERRAIN INPUTS: SOURCE TYPE = POINT EMISSION RATE (G/S) = 0.125998 STACK HEIGHT (M) = 1.5240 STK INSIDE DIAM (M) = 0.6096 STK EXIT VELOCITY (M/S)= 3.0480 STK GAS EXIT TEMP (K) = 298.0000 AMBIENT AIR TEMP (K) = 293.0000 RECEPTOR HEIGHT (M) = 0.0000 URBAN/RURAL OPTION = RURAL BUILDING HEIGHT (M) = 0.0000 MIN HORIZ BLDG DIM (M) = 0.0000 MAX HORIZ BLDG DIM (M) = 0.0000 THE REGULATORY (DEFAULT) MIXING HEIGHT OPTION WAS SELECTED. THE REGULATORY (DEFAULT) ANEMOMETER HEIGHT OF 10.0 METERS WAS ENTERED. BUOY. FLUX = 0.047 M**4/S**3; MOM. FLUX = 0.849 M**4/S**2. *** FULL METEOROLOGY *** ********************************** *** SCREEN AUTOMATED DISTANCES *** ********************************** *** TERRAIN HEIGHT OF 0. M ABOVE STACK BASE USED FOR FOLLOWING DISTANCES *** DIST CONC U10M USTK MIX HT PLUME SIGMA SIGMA (M) (UG/M**3) STAB (M/S) (M/S) (M) HT (M) Y (M) Z (M) DWASH ------- ---------- ---- ----- ----- ------ ------ ------ ------ ----- 30. 1140. 4 5.0 5.0 1600.0 1.55 2.73 1.68 NO 100. 370.8 4 1.5 1.5 480.0 5.24 8.27 4.77 NO 200. 211.7 4 1.0 1.0 320.0 7.10 15.64 8.65 NO 300. 136.4 6 1.0 1.0 10000.0 10.40 11.52 6.17 NO 400. 137.5 6 1.0 1.0 10000.0 10.40 14.85 7.49 NO 500. 124.8 6 1.0 1.0 10000.0 10.40 18.14 8.77 NO 600. 109.2 6 1.0 1.0 10000.0 10.40 21.39 10.01 NO 700. 94.62 6 1.0 1.0 10000.0 10.40 24.59 11.22 NO 800. 82.30 6 1.0 1.0 10000.0 10.40 27.75 12.24 NO 900. 72.09 6 1.0 1.0 10000.0 10.40 30.88 13.23 NO 1000. 63.61 6 1.0 1.0 10000.0 10.40 33.98 14.18 NO 1100. 56.68 6 1.0 1.0 10000.0 10.40 37.05 15.04 NO 1200. 50.87 6 1.0 1.0 10000.0 10.40 40.10 15.86 NO 1300. 45.94 6 1.0 1.0 10000.0 10.40 43.12 16.66 NO 1400. 41.74 6 1.0 1.0 10000.0 10.40 46.12 17.45 NO 1500. 38.11 6 1.0 1.0 10000.0 10.40 49.10 18.21 NO 1600. 34.97 6 1.0 1.0 10000.0 10.40 52.06 18.95 NO 1700. 32.23 6 1.0 1.0 10000.0 10.40 55.00 19.68 NO 1800. 29.82 6 1.0 1.0 10000.0 10.40 57.92 20.39 NO 1900. 27.68 6 1.0 1.0 10000.0 10.40 60.83 21.09 NO 2000. 25.79 6 1.0 1.0 10000.0 10.40 63.73 21.78 NO 2100. 24.17 6 1.0 1.0 10000.0 10.40 66.60 22.35 NO 2200. 22.72 6 1.0 1.0 10000.0 10.40 69.47 22.92 NO 2300. 21.41 6 1.0 1.0 10000.0 10.40 72.32 23.48 NO 2400. 20.23 6 1.0 1.0 10000.0 10.40 75.16 24.02 NO 2500. 19.15 6 1.0 1.0 10000.0 10.40 77.99 24.56 NO 2600. 18.16 6 1.0 1.0 10000.0 10.40 80.80 25.08 NO 2700. 17.26 6 1.0 1.0 10000.0 10.40 83.61 25.60 NO 2800. 16.43 6 1.0 1.0 10000.0 10.40 86.40 26.10 NO 2900. 15.66 6 1.0 1.0 10000.0 10.40 89.19 26.60 NO 3000. 14.95 6 1.0 1.0 10000.0 10.40 91.96 27.10 NO MAXIMUM 1-HR CONCENTRATION AT OR BEYOND 30. M: 30. 1140. 4 5.0 5.0 1600.0 1.55 2.73 1.68 NO DWASH= MEANS NO CALC MADE (CONC = 0.0) DWASH=NO MEANS NO BUILDING DOWNWASH USED DWASH=HS MEANS HUBER-SNYDER DOWNWASH USED DWASH=SS MEANS SCHULMAN-SCIRE DOWNWASH USED DWASH=NA MEANS DOWNWASH NOT APPLICABLE, X<3*LB *************************************** *** SUMMARY OF SCREEN MODEL RESULTS *** *************************************** CALCULATION MAX CONC DIST TO TERRAIN PROCEDURE (UG/M**3) MAX (M) HT (M) -------------- ----------- ------- ------- SIMPLE TERRAIN 1140. 30. 0. *************************************************** ** REMEMBER TO INCLUDE BACKGROUND CONCENTRATIONS ** ***************************************************

71
REFERENCES
1. Miller, S. A., Acetylene; its properties, manufacture and uses. Academic Press: New York, 1965; Vol. 1, p v. 2. International Association for Calcium Carbide Home Page. http://calciumcarbide.org/ (accessed September 10, 2009). 3. Kirk, R. E.; Othmer, D. F., Kirk-Othmer encyclopedia of chemical technology. In Calcium Carbide [Online] 4th ed.; Wiley: New York, 2000. http://proxy.mul.missouri.edu:2048/login?url=http://mrw.interscience.wiley.com/emrw/9780471238966/home/ http://mulibraries.missouri.edu/search/databases/moreinfo.aspx?id=139. 4. AP-42 Fifth Edition Compilation of Air Pollutant Emission Factors. Standards, O. o. A. Q. P. a.; Radiation, O. o. A. a., Eds. Research Triangle Park, January 1995. 5. Glatzer, E., Coal-to-Chemicals: An Alternative Solution to Rising Feedstock Costs. ICIS Chemical Business (Weekly) 2006, v1 (i7), 20-22. 6. Davis, S.; Funada, C.; Schlag, S. Calcium Carbide Chemical Economics Handbook [Online], 2008. http://www.sriconsulting.com/CEH/Public/Reports/724.5000/. 7. Braden, J., Company Sees Bright Future in its Acetylene Investment. Missourian February 12, 2008. 8. Piva, R. J.; Treiman, T. B., Missouri Timber Industry - An Assessment of Timber Product Output and Use. Agriculture, U. S. D. o., Ed. North Central Research Station, 2000. 9. Fink, R. J.; Fink, R. L., An Assessment of Biomass Feedstock Availability in Missouri. Resources, M. D. o. N., Ed. 2006. 10. Domke, L., Missouri Tops in these Things from Trees. Conservation, M. D. o., Ed. 2007. 11. State of the World's Forests 2001; Food and Agriculture Organization: Rome, 2001. 12. Mining Industry Council of Missouri. http://momic.com/xstream.aspx?pxid=48490&xid=48662 (accessed April 14). 13. Miller, M. M., Lime. In 2007 Minerals Yearbook, U.S. Geological Survey: 2009. 14. Marrero, T. R.; Wilson, R. B., Prospects for a Relatively Safe, Environmentally-Friendly, and Sustainable Fuel and its Manufacture: Acetylene from Calcium Carbide and Water Using Waste Materials. Chemical Engineering, University of Missouri: Columbia, MO, p 4. 15. Seidel, D. L. Three-Stage Gasification - Biomass-to-Electricity Process with an Acetylene Process. US 2008/0281133 A1, 2008. 16. Pettersen, R. C., The Chemical Composition of Wood. United States Departement of Agriculture, F. S., Forest Products Laboratory, Ed. American Chemical Society: Madison, WI, 1984; p 58.

72
17. Wood Energy and Environment. http://www.ncp.fi/koulutusohjelmat/metsa/5Eures/WoodEnergyEcology/emissions.htm (accessed September 14, 2009). 18. Environmental Protection Agency Plain English Guide Home Page. http://www.epa.gov/air/caa/peg/understand.html (accessed August 31, 2009). 19. Construction Permitting of Air Emission Sources. In 10 CSR 10-6.060, Code of State Regulations: 2010; p 23. 20. Emission Information for Construction Permit - Instructions. Program, A. P. C., Ed. 2000; p 10. 21. Definitions and Common Reference Tables. In 10 CSR 10-6.202, Code of State Regulations: p 15. 22. EPA Formally Announces Phase-in of Clean Air Act Permitting for Greenhouse Gases. In Environmental Protection Agency, 2010. 23. The Climate Registry General Reporting Protocol 1.1 Updates and Clarifications. www.theclimateregistry.org (accessed January 29,2010). 24. Colburn, K., Technical Supporting Document Chapter 5 Appendix A States' Report on Electric Utility Nitrogen Oxides Reduction Technology Options for Application by the Ozone Trransport Assessment Group. 1996. 25. New Source Review (NSR) Electronic Permit Application Packages. http://www.dnr.mo.gov/env/apcp/NSRpermits.htm#quarry. 26. Standards, O. o. A. Q. p. a., Screening Procedures for Estimating the Air Quality Impact of Stationary Sources, Revised. Agency, U. S. E. P., Ed. Research Triangle Park, NC, 1992; pp 2-2.

73
GLOSSARY Ambient Air: All space outside of buildings, stacks or exterior ducts. 10 CSR 10-6.020(2)(A) Attainment Area: All areas that have not been designated as non-attainment. Since
attainment designations are pollutant specific, an area may be designated as attainment for one pollutant and non-attainment for another.
BACT: Best Available Control Technology. An emission limitation (including a
visible emission limit) based on the maximum degree of reduction for each pollutant which would be emitted from any proposed installation or major modification which the director on a case-by-case basis, taking into account energy, environmental and economic impacts and other costs, determines is achievable for the installation or major modification through application of production processes or available methods, systems and techniques, including fuel cleaning or treatment or innovative fuel combustion techniques for control of the pollutant. In no event shall application of BACT result in emissions of any pollutant which would exceed the emissions allowed by any applicable emissions control regulation, including New Source Performance Standards established in 10CSR 10-6.070 and 40 CFR part 60 and National Emissions Standards for Hazardous Pollutants established in 10 CSR 6.080 and 40 CFR part 61. If the director determines that technological or economic limitations on the application of measurement methodology to a particular source operation would make the imposition of an emission limitation infeasible, a design, equipment, work practice, operational standard or combination of these may be prescribed instead to require the application of BACT. This standard to the degree possible shall set forth the emission reduction achievable by implementation of the design, equipment, work practice or operation and shall provide for compliance by means which achieve equivalent results. 10 CSR 10-6.020(2)(B)
BTU: British thermal unit. The amount of energy required to raise the
temperature of a pound of water one degree Fahrenheit. CFR: Code of Federal Regulations. Codified general and permanent federal
rules divided into 50 titles (e.g., Title 40 is Protection of the Environment).

74
Capture Efficiency: The capture efficiency is the amount of pollutant that is routed to a control
device. This is typically expressed as a percent of the total amount of emissions from a particular emissions unit. Capture efficiency is pollutant dependent.
CO: Carbon Monoxide. This is a criteria pollutant. CO2: Carbon Dioxide. This is a regulated pollutant. Construction
Fabricating, erecting, reconstructing, or installing a source operation. Construction shall include installation of building supports and foundations, laying of underground pipe work, building of permanent storage structures, and other construction activities related to the source operation. 10 CSR 10-6.020(2)(C)
Control Device: The equipment used to reduce the amount of pollutant being emitted from
an emissions unit.. Control Efficiency: Control efficiency refers to the amount of reduction in emissions of a
pollutant achieved by the control device. This is typically expressed as a percent of the total amount of emissions from a particular emissions unit.
Criteria Pollutants: Air pollutants for which air quality standards have been established in 10
CSR 10-6.010. 10 CSR 10-6.020(2)(B) Specifically they are: PM10 - Particulate Matter less than 10 microns in diameter NOX - Nitrogen Oxide Compounds SOX - Sulfur Oxide Compounds VOC - Volatile Organic Compounds Lead - Lead (Pb) CO - Carbon Monoxide CSR: Code of State Regulations. Codified general and permanent state rules
divided into 22 titles (e.g., Title 10 is Department of Natural Resources).

75
De minimis Levels: Any emissions level less than or equal to the rates listed in Table 1,
subsection (3)(A) of this rule. Emission Factor: An emissions factor is intended to be a representative value that relates
the amount of emissions associated with a process to the process based on factors such as weight, volume, distance, or duration of the process emitting the pollutant (e.g., pound of pollutant per ton of product produced).
Emission Point: This is the point at which an emissions unit releases emissions. More than
one Emission Unit may be associated to one emission point. Emission Unit: Any part or activity of an installation that emits or has the potential to emit
any regulated air pollutant or any pollutant listed under section 112(b) of the Act. 10 CSR 10-6.020(2)(E)
EPA: The United States Environmental Protection Agency Hazardous Air Pollutant (HAP):
Any of the air pollutants listed in 10 CSR 10-6.020(3)(C). Installation:
All source operations including activities that result in fugitive emissions, that belong to the same industrial grouping (that have the same two (2)-digit code as described in the Standard Industrial Classification Manual, 1987), and any marine vessels while docked at the installation, located on one (1) or more contiguous or adjacent properties and under the control of the same person (or persons under common control). 10 CSR 10-6.020(2)(I)
LAER: Lowest Achievable Emission Rate. That rate of emissions which reflects –
1) the most stringent emission limitation which is contained in any state implementation plan for a class or category of source, unless the owner or operator of the proposed source demonstrated that the limitation s are not achievable or 2) the most stringent emission limitation which is achieved in practice by the class or category of source, whichever is more stringent.

76
LAER shall not be less stringent than the new source performance standard limit. 10 CSR 10-6.020(2)(L)
MHDR (Maximum Hourly Design Rate): Maximum Hourly Design Rate is the maximum capacity of the equipment
during a one hour period of continuous operation. This is typically based on the manufacturer’s rated capacity. However, physical bottlenecks may reduce the maximum hourly design rate by limiting the process throughput.
Major Source: A major source is an installation with the potential to emit of any pollutant
greater than the major source levels. The level varies between 100 tons per year and 250 tons per year based on the location of the source in an attainment or non-attainment area or the classification of the source as a named or non-name installation.
Modification
Any physical change, or change in method of operation of, a source operation or attendant air pollution control equipment which would cause an increase in potential emissions of any air pollutant emitted by the source operation. 10 CSR 10-6.020(2)(M)
NAAQS: National Ambient Air Quality Standards. Air quality standards established
by EPA. NSR
New Source Review Nonattainment Area: Those geographic areas in Missouri that have officially been designated
by the U.S. Environmental Protection Agency in 40 CFR part 81 as nonattainment areas. 10 CSR 10-6.020(2)(N)
NOX:
Nitrogen Oxide Compounds. This is a criteria air pollutant. NSPS:
New Source Performance Standard. These standards are listed in 40 CFR Part 60. Certain emissions limits, testing requirements, monitoring requirements, etc. are required for applicable sources.
PM10 (Particulate Matter less than ten microns):

77
Particulate Matter with an aerodynamic diameter of less than 10 microns, a criteria air pollutant. This is a criteria pollutant.
Potential to Emit: The emissions rates of any pollutant at maximum design capacity. Annual
potential shall be based on the maximum annual-rated capacity of the installation assuming continuous year-round operation. Federally enforceable permit conditions on the type of materials combusted or processed, operating rates, hours of operation and the application of air pollution control equipment shall be used in determining the annual potential. Secondary emissions do not count in determining annual potential. 10 CSR 10-6.020(2)(N)
Potential Emissions: Potential emissions are the emissions based on the potential to emit.
Potential emissions and potential to emit are commonly interchangeable. PSD Prevention of Significant Deterioration. This is commonly used to refer to
the type of construction permit issued for a major modification. RAL Risk Assessment Level. These levels are concentrations at which adverse
human health effects are not expected to be produced during a defined period of exposure.
Regulated Air Pollutant: All air pollutants or precursors for which any standard has been
promulgated. 10 CSR 10-6.020(2)(R) SMAL Screen Model Action Levels. These levels are emission rates at which
screen modeling is required. State Implementation Plan (SIP): A series of plans adopted by the commission, submitted by the director,
and approved by the administrator, detailing methods and procedures to be used in attaining and maintaining the ambient air quality standards in Missouri. 10 CSR 10-6.020(2)(S)
SOX:
Sulfur Oxide Compounds. This is a criteria air pollutant. TPY

78
Tons Per Year VMT: Vehicle Miles Traveled. VOC:
Volatile Organic Compounds. This is a criteria air pollutant.

79
APPENDICES: EMISSION CONTROL TECHNOLOGIES APPENDIX A: NOx Control Technologies Low Excess Air (LEA) The LEA control technique reduces the amount of excess air supplied to the combustion chamber through the use of combustion control. This includes LEA firing, adjustments of air registers, fuel injector positions, overfire air dampers and operational controls to reduce the amount of excess air. By limiting the excess air, the combustion temperature is controlled in a manner that may reduce the formation of NOx during the combustion process. This technique is technically feasible. However, the reduction of excess air could lead to incomplete combustion which would contribute to the increase of VOC and CO emissions. Low NOx Burners (LNB) LNBs are designed to limit NOx formation by controlling the stoichiometric makeup of the combustion flame and the temperature profile in each burner flame. This control is accomplished by regulating the aerodynamic distribution and mixing of the fuel and air, thus reducing oxygen (O2) in the primary combustion zone, flame temperature and residence time at peak combustion temperatures. Overfire Air (OFA) The OFA process reduces the formation of NOx by the injection of air into the firing chamber staged into two zones. The staging of the combustion air results in a cooler flame, and it also results in less oxygen reacting with fuel molecules. Flue gas recirculation (FGR) The FGR system recycles a portion of the flue gas back into the primary combustion zone to control. The combustion products contained in the recycled air are inert during combustion thereby lowering combustion temperatures and NOx emissions. In addition, the oxygen content of the recycled air is lower than fresh air thereby lowering the overall oxygen content in the primary flame zone. Selective Non-Catalytic Reduction (SNCR) With the SNCR system ammonia or urea is directly injected at flue gas temperatures of approximately 1600 oF – 1900 oF. The ammonia or urea reacts with NOx in the flue gas to produce N2 and water. SNCR systems must be designed properly to ensure that the reagent will be injected at the optimum flue gas temperature, and that there will be adequate mixing and residence time. Selective Catalytic Reduction Like the SNCR system, ammonia is injected into the boiler flue gas, but unlike the SNCR, the SCR system includes the presence of a catalyst to reduce NOx to

80
nitrogen and water. The performance of an SCR system is influenced by several factors including flue gas temperature, SCR inlet NOx level, the catalyst surface area, volume and age of the catalyst, and the amount of ammonia slip that is acceptable. APPENDIX B: CO and VOC Control Technologies Good Combustion Practices Both CO and VOC emissions occur as a result of incomplete combustion in the combustion chamber of the reactor. The most efficient means of controlling VOC emissions is combustion. The proper operation of the combustion chamber through the use of good combustion practices will promote complete combustion. Although, reducing CO emissions can result in an increase of NOX emissions, CO and NOX emissions can be balanced through the use of good combustion practices. Good combustion practices include extended residence time, proper mixing of air and fuel, and steady high temperatures in the combustion zone.
Catalytic Oxidation Catalytic oxidation systems are used to oxidize both CO and VOCs to CO2 and water and are currently used for gas turbines and refinery operations. Catalytic oxidation requires a high exhaust temperature for the oxidation to take place. In this case, the exit temperature of the reactor gas would need to be increased prior to entering the control device. The result would be the combustion of additional fuel and the creation of additional emissions. In evaluating the control device an additional aspect is the catalyst. It does not appear that the exhaust gases will contain materials that will potentially poison the catalyst making it ineffective. Therefore, this control device is appears to be technically feasible although it may not be environmentally or cost effective.
Thermal Oxidation Thermal oxidizers operate at considerably higher temperatures since there is no catalyst. Thermal oxidizers typically use natural gas to heat the combustion chamber of the control device. This is the same technique that is used in the three-stage reactor and is redundant. Although technically feasible, the addition of this control technique on the three-stage reactor would be redundant. However, such a device on the wood dryer would be technically feasible. Good Combustion Practices Good combustion practices are common BACT determinations. Both CO and VOC emissions occur as a result of incomplete combustion in the combustion chamber of the reactor. The most efficient means of controlling VOC emissions is combustion. The proper operation of the combustion chamber through the use of good combustion practices will promote complete combustion. Although, reducing CO emissions can result in an increase of NOX emissions, CO and NOX emissions can be balanced through the use of good combustion practices. Good

81
combustion practices include extended residence time, proper mixing of air and fuel, and steady high temperatures in the combustion zone.
APPENDIX C: PM10 CONTROL TECHNOLOGIES HAUL ROADS Haul road emissions are considered fugitive since the emissions cannot be capture and vented to a control device. Therefore there are two general options for the control of fugitive haul road emissions. The first option is the application of a chemical surfactant or water to an unpaved surface. By applying a chemical surfactant, the particles on the road remain on the road as traffic travels over the surface. The same effect can be achieved by applying water. However, the amount of water applied depends on the size of the road and they type of road material (e.g. crushed rock). This control technique achieves a control efficiency of 90%. The second option is paving the surface and periodically washing the paved surface. By paving the road with asphalt or concrete, the amount of particles on the road is greatly reduced and is dependent on the type of material being hauled on the road. The control efficiency of this technique is greater than 95%. Both techniques are technically feasible. STORAGE PILES Similar control techniques apply to the vehicular activity areas of the storage piles as the haul roads. These vehicular activity areas include all areas between and within the active piles and the inactive pile that could be used during material transfer between the piles or individual pile maintenance. MATERIAL HANDLING PROCESSES Material handling transfer points include conveyors and silos. There are three general techniques for control these types of emissions: spray dust suppression, enclosures, cyclones, and baghouses. The first option requires the application of a dust suppression material onto the material being handled to reduce the release of the particles into the air. The technical feasibility of this control technique would depend on how the dust suppression agent would react in the process. A typical dust suppression material such as oil would coat the materials. Since the process is dependent on the reaction of the raw materials, coating the materials would reduce the effectiveness of the reaction. Therefore this option is considered technically infeasible. The second option acts as a capture device for the emissions to be vented to a control device. By fully enclosing the process, the emissions are completely captured. Partial enclosures have lower capture efficiencies than full enclosures, but are also effective in routing emissions to a control device. The third option is the use of a cyclone. A cyclone uses centrifugal force to separate larger particles from the air stream. This technique provides 50% control efficiency. The fourth option is the baghouse. Baghouses use a bag to filter particles out the air stream. The amount that is allowed into the air is dependent on the bag design.

82
A maximum outlet emission rate of 0.005 grains per dry standard cubic foot (gr/dscf) is considered a high level of control. These control options are all considered technically feasible.