air permeability of.parachute cloths · low-pressure tunnel . . . 95 appendix iv. pressure square...
TRANSCRIPT

(i7ADC TECHNICAL REPORT 52-283
AIR PERMEABILITY OF.PARACHUTE CLOTHS
M. J. GOGLIA
STATE ENGINEERING EXPERIMENT STATIONGEORGIA INSTITUTE OF TECHNOLOGY
NOVEMBER 1952
Statement ASep! Approved for Public Release
WRIGHT AIR DEVELOPMENT CENTER
AF-WP-(B)-O. 12 MAN 53 200
NOTICES
When Government drawings, specifications, or other data are usedfor any purpose other than in connection with a definitely related Govern-ment procurement operation, the United States Government thereby in-curs no responsibility nor any obligation whatsoever; and the fact thatthe Government may have formulated, furnished, or in any way suppliedthe said drawings, specifications, or other data, is not to be regardedby implication or otherwise as in any manner licensing the holder orany other person or corporation,or conveying any rights or permissionto manufacture, use, or sell any patented invention that may in anywaybe related thereto.
The information furnished herewith is made available for studyupon the understanding that the Government's proprietary interests inand relating thereto shall not be impaired. It is desired that the JudgeAdvocate (WCI), Wright Air Development Center, Wright-PattersonAir Force Base, Ohio, be promptly notified of any apparent conflict be-tween the Government's proprietary interests and those of others.
.pp..pC"CMMPCP0

WADC TECHNICAL REPORT 52-283
AIR PERMEABILITY OFRPARACHUTE CLOTHS
M. J. Goglia
State Engineering Experiment StationGeorgia Institute of Technology
November 1952
Materials LaboratoryContract No. AF33(038)-15624
RDO No. 612-12
Reproduced FromBest Available Copy
Wright Air Development CenterAir Research and Development Command
United States Air ForceWright-Patterson Air Force Base, Ohio

FOREWORD
This report was prepared by the. State Engineering Experiment Station
of the Georgia Institute of Technology under Contract Number AF 33(038)-
15624 and Research and Development Order No. 612-12,, "Textiles for High
Speed Parachutes!' It was administered under the direction of the Mate-
rials Laboratory, Directorate of iesearch, Wright Air Development Center,
with Mr. W. A. Corry and Mr. J. H. Ross acting as project engineers. This
report is one of a series to be issued on this project.
Yr. H. W. S. LaVier, Research Associate Professor in the State Engi-
neering Experiment Station of the Georgia Institute of Technology, and
Professors J. L. Taylor and G. B. Fletcher of the Georgia Institute of
Technology participated extensively in the study. Dr. J. J. Moder's
assistance in the formulation of the statistical analysis is gratefully
acknowledged.
WADC M.R52-283

ABSTRACT
The air permeability of eight standard nylon parachute cloths was
determined using a sample 6.05 inches in diameter in a wind tunnel whose
capacity permitted obtaining static pressure differentials across the
cloth as high as 55 inches of water. Fifty-nine experimental nylon cloths
manufactured by the Bally Ribbon Mills were subjected to the same test
procedure, as were two experimental fabrics of orlon and dacron, respec-
tively.
Upon assuming that the pressure gradient in the flow through a para-
chute fabric is proportional to the arithmetic sum of an inertial (Aev 2)
and the viscous contribution (C•uv), one is able to infer the existence
of a parameter, A , whose measure is length. This length can be employed
to characterize the geometry of the cloth. Experimental work to date in
the case of the eight standard cloths and the orlon and dacron fabrics
has indicated a verification of the assumption; a high-pressure tunnel
employing pressure differentials across the cloth approximating ten pounds
per square inch was used for this purpose.
Employing the characteristic length so determined permits writing a
single relation common to all cloths between a "flow-through-drag coeffi-
cient," Cf, and a Reynolds number based on the characteristic length;
viz., Cf = 2 +CfRe
PUBLICATION RVIVW
This report has been reviewed and is approved.
FOR THE COMMANDING GENRAL:
SM. E. SORTEColonel, USAFChief, Materials LaboratoryfDirectorate of Research
WADC TR 52-293 iii
TABLE OF CONTENTS
Section Page
I* NOMENCLATURE . . 1II. INTRODUCTIONS09& ,0000 2
A. Statementof the Problem.... . .......... 2
B. Definition of Terms . . .............. . 2
III. LITERATURE SURVEY . . . . . .... . . . . . ......
A. Application of Permeability Data to Parachute Design. 4
1. Increased Precision . . ...... ... •4
2. Reduced Shock on Opening. ... ..... .. • • 5
3. Stable Opening . . . . . . . . . . . . . & . . 5
4.. Safe Loading. .................. 5
5. Stable Uniform Descent . ............. 5
B. Air Permeability of Parachute Fabrics . . . . . . . . .
1. Approach to the Problem Previous to thisInvestigation.. 5
2 . Industrial Testing. 6
3.' Statistical Variation. . . . ... . . . . . . . . 7
4. Geometric Concept and Theory of Models. . . . . . 7
5. Cloth Deformation " 7
6. Necessity for Aerodynamic Interpretation .... . 8
WADC TR 52-283 iv

TABLE OF CONTENTS (Continued)
Section Page
C. Methods and Apparatus for Air PermeabilityDetermination... 8
1.. Densometer (Gurley) . ............ . 8
2. Fabric Porosity Machine .............. 9
3. Saxl Apparatus .................. 9
4. Bureau of Standards (Frazier) Apparatus . . . . . 9
5. Permeameter (Gurley) . .............. 10
6. Other Types of Testing Machines ......... 10
IV. APPARATUS ........................ 11
A. Introduction...... ......... .... . 11
B. Low-Pressure Tunnel ................. 11
1e Fan e ............... .... . 12
2. Wind Tunnel . . .*. . . . . .. . . ..*. . . ... 12
3. Sample Holder . ...... ..... ...... 16
C. High-Pressure Tunnel. .... ......... . .. 16
V. TEST PROCEDURE AND METHOD OF HANDLING DATA. . . . . . . . 21
A. Selection of Cloth Sample . . . . 21
B. Test Procedure for Low-Pressure Tunnel. ..... • . 21
1. Sample Mounting Procedure ........... 21
2. Preliminary Operations.............. 25
3. Data Obtained . . . . . . . . .... . .. . 25
4. Averaging of Data..............••. 27
5. Calculations. ..... • • .. . .. . . . 27
6. Correlation of Calculated Values. . . . . . . . . 27
WADC TR 52-283 v

TABLE OF CONTENTS (Continued)
Section Page
C. Test Procedure for High-Pressure Tunnel . . . . . . . 35
I. Introduction. . ... .. . .. ... 35
2. Preliminary Operations . . . . . . . . . . . . . 35
3. Data Obtained . . . . . . . . . . . .. . . . . . . 37
4. -Handling of Data . . . . . . . 38
VI. PHOTOMICROGRAPHIC STUDIES. ....... .. . .... ... 39
A. Appearance. . . . . . ................ 39
1. Plain Weave . . . . . . . . . . . . . . . . . . .. 39
2. Rip-Stop. . . . . ... . . . . . . . . . . . . . . 39
3* Dacron* 9ee o*e a 0000 504. Orlon. . . . . . . . . ... . . . . . . . . . . 50
B. Effect of Finishing ................ 50
C. Effect of Dirt in Air ................. 50
VII. STATISTICAL ANALYSIS. 53
A. Necessity for Statistical Analysis . . . . . . . . . 53
B. Program I. I e * e e 53
C. Program II... .. . . . . ............. 55
D. Program III .... . .. . .. .. . . . . . . . . 56
E. Limitations in the Analysis of Samples. . . ..... 58
VIII. LOW-PRESSURE TUNNEL AIR PERMEABILITY RESULTS. . . . . . . 58
As WADC Cloths . . . . . . . . . . . . . . . . . . . . . 58
1. Description of Samples ..... ......... 58
2. Sunary Data and Results....... ...... 58
WADC•TR 52-283 vi
TABLE OF CONTENTS (Continued)Section page
B. Bally Ribbon Clothe . . ... 63
1. Description of Samples.... .. ..... .. 63
2. Statistical Considerations. .... • • • ... 63
3. Data and Results. . . . . . . . . . . . . . . . 66
IX. HIGH-PRESSURE TUNNEL CHARACTERISTIC LENGTH STUDY. . . . 67
A. Theory . . . . . . . . . . . . . . . 67
B. Experimental Results ... .......... ... 70
C. Discussion and Recommendation .......... . 70
APPENDIX I. Bibliography and Abstracts . . . . . . .
APPENDIX II. Comparison of Georgia Tech and WADCHandling of Data... 90
APPENDIX III. Porosity-Permeability R#esults from theLow-Pressure Tunnel . . . 95
APPENDIX IV. Pressure Square Gradient-Mass VelocityResults from the High-Pressure Tunnel.. 3.1
WADC TR 52-283 vii

LIST OF TABLES
PageI. DATA ON AVERAGED ORIFICE PRESSURE DROPS VS STATIC
PRESSURE USED FOR FIGURE 12. . . . 29
II. SAMPLE DATA AND RESULTSHEET. .. .. .... ...... 32
III. EXPERIMENTAL DATA USED IN FIGUREI 4 . ... ... . .. .
IV. VISUS ..AND hER OE"IEWOTS- FOR 7TEN WADC FABRICS.. '126,
V. STATISTICAL DATAPROGRAM I. o *. . ........... 54
VI. -STATISTICAL RESULTS--PROGRAM II. . . . o . 57
VII. STATISTICAL RESULTs-PGRAM III. . . . ... . . . . . .. 57
VIII. IDENTIFICATIONNOFW ADCT T...............a 59
fl, PHYSICAL AND TEXTILE PROPERTIES OF WADC CLOTH . . . . . . 60
L IDENTIFICATION OF BALLY RIBBON CLOTHS . . . . . .... 64
I, THE EFFECT OF ?ILLING THE COUNT VARIATION ONRELATIVE POROSITY. . . . 107
XII. THE EFFECT OF FILLINO THRA DENIER ON RELATIVEPOROSITY.... 1o9
XIII.. THE EFFECT OF TYPE OF WEAVE (PLAIN AND 2/1 TWILL)ON RELATIVE PoROSITY o . • • U0
XIV. THE ZF T OF TYRP OF WEAVE (2/1 AID 2/2 TWILL)ON RELATIVE POROSITY . , . . 111
XV. THE EFFECT OF TYPE OF WEAVE (2/1 TWILL AND 5 HARNESSSATIN) ON RELATIVE POROSITY . . L12
XVI. THE EFFECT OF TYPE OF WEAVE (2/2 TWILL AND 5 HARNESSSATIn) ON RELATIVE POROSITY . 113
WADC TR 52-283 viii.

List of Illustrations
Page1. Test Setup . . ................ . . . . ........ 13
2. Gauge Board . . . . . . . . . . . . . . . . . . . . . .. 14
3. Typical Orifice Installation. . . . . . . . . . .. ... 15
4. Exploded View of Low-Pressure Sample Holder . . . . . . . . 17
5. Upstream Face of Sample Holder . ..................... 18
6. Downstream Face of Sample Holder ........ ...... 19
7. High-Pressure Tunnel ...........0 ...... 20
8. Piping Assembly of High-Pressure Tunnel . . . . . . o . . . 22
9. A. Upstream Flange of High-Pressure Sample Holder. . . . . 23
B. Downstream Flange of High-Pressure Sample Holder. . . . 23
10. High-Pressure Sample Holder . o ................ 24
11. Sample Log Sheet for Low-Pressure Study . . . . . . . . . . 26
12. Relation of Static Pressure to Orifice Pressure Drop. . . . 28
13. Master Data and Result Sheet. . . . . . . . .. . . . . .. 30
14. Porosity-Permeability Characteristics . . . . ....... 33
15. Orifice Coefficient Curve ... .............. 36
16. Photomicrograph of WADC Fabric No. I (USAF White Rip-Stop). 40
17. Photomicrograph of WADC Fabric No. 2 (USAF Orange Rip-Stop) 41
18. Photomicrograph of WADC Fabric No. 3 (USAF White Twill) . . 42
19. Photomicrograph of WADC Fabric No. 4 (USAF Camouflage Twill) 43
20. Photomicrograph of WADC Fabric No. 5 (Cheney Bros. WhiteFinished)' . 44
21. Photomicrograph of WADC Fabric No. 6 (Cheney Bros. WhiteGreige) . . 45
22. Photomicrograph of WADC Fabric No. 7 (Cheney Bros. WhiteRip-Stop Finished).. 46
WADO TR 52-283 ix

List of Illustration (Continued)Page
23. Photomicrograph of WADC Fabric No. 8 (Cheney Bros. WhiteRip-Stop Greige) . 47
24.' Photomicrograph of WADC Fabric No. 9 (Duplan Corp. WhiteDacron) • e 48
25- Photomicrograph of WADC Fabric No. 10 (Duplan Corp. WhiteOrlon) . . 49
26. Photomicrograph of WADC Fabric No. 1 (USAF White Rip-Stop)Showing Dirt Accumulation. . 51
27. Photomicrograph of WADC Fabric No. 3 (USAF White Twill)Showing Dirt Accumulation. . 52
28. Porosity-Permeability Characteristics of the Ten WADC Cloths 62
29. The Effect of Filling Thread Denier on Relative Porosity. . 100
30. The Effect of Type of Weave (Plain and 2/1 Twill) onRelative Porosity.. 101
31. The Effect of Type of Weave (2/1 Twill and 2/2 Twill) onRelative Porosity.. 102
32. The Effect of Type of Weave (2/1 Twill and 5 Harness Satin)on Relative Porosity. • 103
33. The Effect of Type of Weave (2/2 Twill and 5 Harness Satin)on Relative Porosity. • I0
34. Porosity-Permeability Characteristics of Twelve Bally RibbonMills Samples . . 105
35. Porosity-Permeability Characteristics of Ten Bally RibbonMills Samples . . 106
36. Relation of Pressure Square Gradient to Mass Velocity forWADC Fabric No. 1. . . 115
37. Relation of Pressure Square Gradient to Mass Velocity forWADC Fabric No. 2. . . 116
38. Relation of Pressure Square Gradient to Mass Velocity forWADC Fabric No. 3- • • 117
39. Relation of Pressure Square Gradient to Mass Velocity forWADC Fabric No. 4. .. . 11.
WADC 7R 52-283 I

List of Illustrations (Continued
Page
40. Relation of Pressure Square Gradient to Mass Velocity forWADC Fabric No. 5. • • liq
41. Relation of Pressure Square Gradient to Mass Velocity forWADC Fabric NO. 6... 12:
42 . Relation of Pressure Square Gradient to Mass Velocity forWADC Fabric No. 7. . . 121
43. Relation of Pressure Square Gradient to Mass Velocity forWADC Fabric No. 8... 122
44. Relation of Pressure Square Gradient to Mass Velocity forWADC Fabric No. 9. • • 123
45. Relation of Pressure Square Gradient to Mass Velocity forWADC Fabric No. 10 . . 12
46. C(and16 versus Relative Porosity . . . . . . . . . 72
47. Relation of Flow-Through-Drag Coefficient to ReynoldsNumber . . . 73
WADC TR 52-283 xi

If
N

I. NOMENCLATURE*
Symbol Quantity Dimensions.
A Area L2
Cf Flow-Through-Drag Coefficient Nondimensional
d Dimensional Constant 124, (in ft 1 l)4
G Mass Velocity MT-k"2
90 Dimensional Constant 32.2, (ibm ft Ibf 1isec"2)
K Orifice Coefficient Nondimensional
L Cloth Thickness L
m Mass Flow MT- 1
NRe Reynolds Number Nondimensional
P,p Pressure FL" 2
R Gas Constant FLM-I 9 "i
T Temperature G
V,v Velocity LT" 1
I Average Value of a Quantity
ot Viscous Coefficient L"2
Inertial Coefficient L"1
(See note in Table IV.)
6' (See note in Table IV.)
#*M Viscosity ML'IT-1
P Density ML-3
tr "Standard" Deviationfrom True Value
Symbols used on Master. Data and Result Sheet (Figure 13) are definedthere.
*The force, F, mass, M, length, L, time, T, temperature,G , system isused. Units of quantities employed are indicated in illustrativeinstances of calculations, e.g., •on Master Data and Result Sheet.
WADC TR 52-283 1

Subscripts
1--Upstream of Cloth Sample
2--Downstream of Cloth Sample
II. INTRODUCTION
A. Stat6ment of the Problem
The study reported herein was an outgrowth of a Wright Air Develop-
ment Center project established at the State Engineering Experiment Station
of the Georgia Institute of Technology. It was concerned with the deter-
mination of the air permeability of nylon-type fabrics used in the manu-
facture of parachutes. The scope of the project included the experimental
determination of the air flow through sanples of the various fabrics under
conditions of pressure differentials across the cloth up to 50 inches of
water.
In order to permit the presentation of results in a general, non-
dimensional manner, a characterization by means of a length parameter of
the geometry. of the fabric is required. A search of the literature indi-
cated that little consideration (1,22) had been given to the characteri-
zation of fabrics from a point of view of the mechanism of air flow
through them. Accordingly, an attempt was made, in the case of air flow
through parachute fabric, to apply analysis similar to that employed in
dealing with flow through porous media (2). A portion of this report
deals, then, with the analysis and technique employed in the determina-
tion of the characteristic length for ten parachute cloths.
B. Definition of Terms
The literature indicates a lack of uniformity in the use of defi-
nitions concerned with permeability and porosity. For the sake of clarity
the following terms are defined at this point and a comparison is given
WAflC T 52-283

later (AppendixII) between their usage here and elsewhere.
Permeability: the time rate of mass flow of air per unit
projected area of cloth.
Relative Porosity: arbitrarily defined as the ratio of the
velocity of the air upstream of the cloth to
the theoretical velocity attainable because of
the pressure drop impressed across the cloth.
The illustrative sketch below and the symbols employed serve to implement
these definitions. Subscripts 1 and 2 in the sketch indicate, respec-
tively, the flow conditions upstream and downstream relative to the fabric.
P2 F1
Fabric
F1FF. . . Approach ductFabric Holder
PlVIA!• • . IbmPermeability =
A lv 01,sec ft2
1
Relative Porosity = 1 (dimensionless)
In a more general sense, porosity would be measurable as the fraction
representing void space within the volume of porous fabric under con-
sideration; relative porosity is employed here as an index of porosity.
In the course of discussion this report will make reference to 10
WADC fabrics in contradistinction to-the 59 Bally Ribbon cloths. The
former are identified in Tables VIII and IX and the latter in Table I.
WADC TR 52-283 3

The WADC' cloths will be referred to as fabrics numbered 1 through 10 and
the Bally Ribbon cloths as fabrics BR-i, BR-2, etc.
Further reference will be made to a low-pressure tunnel and a high-
pressure tunnel; all cloths were subjected to tests in. the low-pressure
tunnel, but only the 10 WADC cloths were tested in the high-pressure
tunnel. Both tunnels are described completely in Section IV,. Apparatus.
III. LITERATURE SURVEY
An extensive bibliography, including abstracts dealing with various
phases of parachute design and performance as effected by permeability,
is included as Appendix L. The following discussion is concerned with
certain aspects of these references and theii relation to the problem at
hand.
A. Application of Permeability Data to Parachute Design
1. Increased Precision
Present-day military and civilian operations employing para-
chutes require a higher degree of precision than was possible in the past.
In order to meet this demand in precision bombing and in dropping supplies
* or parachute troops, and to make parachuting safe for untrained passengers
in general, accurate knowledge of the air permeability characteristics
of the parachute fabric becomes necessary. The length of time for the opening
of a parachute depends largely upon the rate at which the canopy permits
air to pass through it. This knowledge, coupled with information on cross
currents and initial velocity, allows a more exact prediction of the loca-
tion of the chute and its cargo at any time after drqpping. The effect
of the least accurately known variables, the directions and velocities of
cross currents, is directly dependent on the time of descent and, thus,
on permeability.
WADC TR 52-283 4

2. Reduced Shock on Opening
At the instant that a parachute opens; the pressure developed
under the canopy is quite high, and the shock is likewise high. It has
been shown that this shock can be minimized by use of a panel of a highly
permeable fabric around the central canopy vent (31). A strip of low-
porosity fabric around the hem line has been recommended as beneficial
to good opening characteristics (h6).
3. Stable Opening
The spontaneous partial collapse of a parachute during descent,
termed squidding, occurs when a certain critical velocity of descent is
reached. This critical velocity is increased by the use of less permeable
or porous canopies. (32,41,h3,h5,47)
4. Safe Loading
The maximum load which a canopy will support safely depends on
the opening characteristics and on the drag during the uniform descent
period. Both of these depend upon canopy permeability. (32,36)
5. Stable Uniform Descent
Parachutes of certain designs tend to pendulate and are dynami-
cally unstable, even in uniform descent. This swinging and oscillating
can be reduced by the use of high-permeability fabrics. (43,46)
B. Air Permeability of Parachute Fabrics
1. Approach to the Problem Previous to This InvestiEation
The first recorded air permeability data for fabrics appears
to be that of Rubner in 1907 (26). Interest in the air permeability of
fabrics for use in parachutes dates back to the World War I need for
efficient chutes in large numbers. Permeability of.cloth in general had
been, and still is, of interest to the clothing manufacturer and to the
lighter-than-air ship fabricator as well. VAny machines and methods
WADOC TR 52-283 5

(3,8,10,11,19,26,29,59), most of them as simplified as possible, were
devised by weavers for measuring the tendency of a cloth to permit the
passage of air or other gases. The calibration (9) and the interrela-
tionship of readings from different machines (7) are carefully described
in the literature. Most of these measuring devices utilize vacuum pumps
to draw atmospheric air through the fabric at a low pressure drop across
the cloth (about ten inches, or less, of water). To facilitate the
measurement, the instrument is usually mounted downstream from the loom
and the measurement made on the uncut cloth between the rolls as it
leaves the loom under tension.
While this sort of data may be acceptable to the garment trade, a
higher pressure drop and more carefully controlled conditions seemed
necessary to the parachute manufacturer. (1,15,18,3Q,30,31,49,55,56)
2. Industrial Testing
Air permeability, defined as the volume of air which will flow\*
through a unit area of a cloth under a given pressure head, has been
considered to be, principally, a function of the type and looseness of
the weave and the yarn twist and diameter. It may also vary with texture,
the amount of carding, extent of felting, etc. (6,14,19,25,27) The
theory was advanced that fabric could be considered as a multiplicity of
orifices (3,5,22,23,29), and emphasis was placed on the geometry of the
cloth and its yarns (14,20,51,60). Presuming absolute uniformity of pore
size, the theory of models was used to make data on the flow of a liquid
through an idealized pore applicable to air flow through fabric. Other
This is a definition of air permeability employed by many; the airvolume is measured at a prescribed temperature, pressure and relativehumidity. Normally the pressure drop impressed across the cloth is 0.5inch of water. An illustration of the conversion of data reported hereinto this definition is given in sample calculations in Appendix II.
WADC TR 52-283 6

investigators theorized that fabrics are not uniform enough to allow
only geometrical considerations in establishing orifice dimensions (4).
Photomicrographic-studies discussed in this report clearly indicate the
random variation in the size and shape of pores.
3. Statistical Variation
The fact that randomness in pore dimensions is of such a nature
that an average value of either porosity or permeability is not obtained
from one sample from one piece of cloth is attested to by a report on the
statistical variation in permeability from one location to another in one
piece of cloth (16,17). This statistical variation, determined for
several of the weaves employed on this project, is of such magnitude as
to render any single permeability determination doubtful to the extent
of plus or minus 15 per cent.
4. Geometric Concept and Theory of Models
The geometrical analogy used by some investigators assumes per-
fect symmetry, whereas it is almost universal practice in textiles to use
yarns of different denier and twist in the warp and- weft. A more logical
approach appears to follow the theory of flow through porous media (2)
where, obviously, the dimensions of the individual pores and cavities
are unknown, and yet a characterization of geometry is required. Hoerner
(1) has indicated that fabric permeability data are correlated by a method
similar to Green's (2).
5. Cloth Deformation
This project has given some consideration to the deformation
of the cloth matrix under the stress of applied pressure. Results indi-
cate a greater cloth porosity with increased flow through the cloth and
an attendant increase in pressure drop across the fabric.
WADC TR. 52-283 7

6; Necessity for Aerodynamic Interpretation
It would seem necessary to conclude that the determination of
the statistical variation of permeability in a fabric must precede inter-
pretations of permeability data, an4 that aerodynamic, rather than geome-
trical, considerations must be followed in establishing the basis for
prediction of flow properties of a cloth.-
C. Methods and Apparatus for Air Permeability Determination
Three methods in general use for measuring the ability of a fabric
to allow passage of air are (26)s (1) measurement of the time required
for the passage of a given volume of air through a given area of cloth,
(2) measurement of the pressure differential required for passage of air
at a given constant volume rate through a given area of cloth and (3)
measurement of the volume rate of flow of air through a given area under
a given pressure differential.
Of the commercially available instruments, the Densometer represents
the first method; the Fabric Porosity Machine, the second method; and the
third method, which is the one most generally employed in this country in
the field of bextiles :is followed by the Frazier, the Saxl and the Per-
meame ter instruments.
1. Densometer (Gurley)
The Gurley Densometer consists of two self-aligning, coaxial,
circular metal discp which have standard-sized (1.0 or 0.1 square inch)
circular orifices at their centers. The cloth sample whose permeability
is to be measured is clamped between these orifices. A capstan screw
clamping device permits quick and efficient securing of the sample so
that no leakage occurs along the face of either disc. The upper disc
serves as the bottom of a vertical cylinder, 3-1/2 inches in diameter
and 9-1/2 inches high, into which telescopes another cylinder closed at
WADC TR 52-283 8

the top. This upper cylinder weighs 5.0 ounces, and its walls telescope
into an oil-filled annulus which serves as a seal between the free-
floating and the stationary cylinders. The air pressure exerted at the
orifice at the bottom of the cylinder by the floating cylinder is equal
to 1.22 inches of water, and, by noting the relative elevations of the
floating cylinder before and after its descent, the amount of air expelled
through the orifice is measured.
Permeability readings are expressed in terms of the time required
for the passage of 300 cc of air through the standard orifice area under
the constant head of 1.22 inches of water.
2. Fabric Porosity Machine
The Albany Felt Company holds a patent on what they call a
"Fabric Porosity Machine" in which 'a low-pressure blower drives air
through a small measuring orifice and then through the test fabric, which
is held in pneumatic-powered jaws. The back pressure behind the cloth
,at a given flow rate is termed a "fair measure of the porosity of the
goods to air flow." (29)
3. Saxl Apparatus
The Saxl Instrument Company produces a machine called the "New
Porosity Tester" which consists of a blower to force air through the fabric
into a rotameter to measure the rate of flow directly (29).
4. Bureau of Standards (Frazier) Apparatus
In the Frazier machine the cloth sample is held by a clamp
horizontally over an orifice at the top of one of two airtight chambers,
an upper and a lower chamber. Air is drawn through the sanple into the
upper chamber, through a standard measuring orifice into the lower cham-
ber, and through a suction fan- out into the atmosphere. Baffles just
above the fan ifntake prevent the formation of a vortex at that point.
WDOC TR 52-283 9

Pressure measurements by means of manometers in the upper and lower cham-
bers permit a calculation of the rate of flow, and the results are ex-
pressed in cubic feet/min. of air at a prescribed temperature, pressure
and humidity passing through a given area of cloth under a standard pres-
sure head of 0.5 inch of water.
It has been shown on the basis of extensive data on many types of
weaves that the results of the Frazier instrument and the Gurley denso-
meter can be correlated. The relationship obtained was Frazier- u (7)
5. Permeameter (Gurley)
The principle of the Permeameter (29) is comparable to that of
the electrical Wheatstone bridge in that pressures are balanced to give
an accurate determination of permeability. The apparatus consists of two
airtight chambers and a suction fan. Air is drawn through a fixed orifice
into the first chamber and out through another fixed orifice, thus main-
taining a fixed pressure in this chamber. The same fan draws air into the
second chamber through a calibrated micrometer valve of the plug and ori-
fice type. A tube connects each chamber to a variometer, and the pressures
are adjusted to the same value by the proper setting of the micrometer
valve. This setting indicates the air permeability when the instrument is
properly calibrated against standard orifice plates. Air leakage between
the fabric and the clamping rings is prevented by maintaining the same
vacuum in an annular groove around the sample as that on the sample.
6. Other Types of Testing Machines
A practical apparatus, used in Britain and described in Endi
neering (London) in 1939, consists simply of a tube of standard cross
section over the end of which the sample is held by rubber bands. Air is
drawn through the cloth by a suction pump and the pressure drop required
to cause a flow of air of one cubic foot per minute is measured and termed
WADC TR 52-283 10

the "porosity," contrary to the usage of that term in this country to
designate the percentage of void space in the volume occupied by a
porous media.
The Apermeter developed at Lowell Textile Institute utilizes a
hydrostatic head, developed by adjusting the elevation of a "leveling
bottle" containing water, to draw atmospheric air through a cloth sample.
No provision is made for maintaining a constant pressure differential
across the fabric. The developers of the Apermeter have redefined air
permeability as the ratio of the times required for a given volume of
flow with and without a cloth sample over the inlet orifice.
An instrument for the measurement of air permeability of blankets
was designed by Sale and Hedrich; in this ,the material is stretched across
the top of a cylinder at a tension of one per cent of its breading load.
Air drawn through the sample by an aspirator bottle arrangement is meas-
ured by a wet-gas meter, and the pressure drop, by a micromanometer.
IV. APPARATUS
A. Introduction
Two wind tunnels were employed during this investigation; one will
be referred to as the low-pressure tunnel (0-55 inches of water) and the
other as the high-pressure tunnel (0-15 pounds per square inch).
B. Low-Pressure Tunnel
.The fabric sample, cut approximately as a circle at least nine inches
in diameter, was clamped between two flanges of the sample holder. In
turn, the sample holder was mounted in a vertical plane on the end of the
wind tunnel (which is horizontal). A circle of fabric 0.2 square feet in
area was exposed to a flow of air from the end of the tunnel; the down-
stream face of the cloth was subjected to atmospheric pressure at all
times.
WADC TM 52-283 11

1. Fan
Air drawn from within the Research Building was blown into the
upstream end of the tunnel through a Buffalo Forge Centrifugal Blower,
Model 35-lCB, with a direct-coupled, constant-speed, 7-1/2 hp motor. A
pressure drop as high as 53 inches of water was obtained across the fabric
with some of the more dense cloth samples.; the pressure drop was measured
using vertical glass manometers filled with water. By throttling the fan
intake with a conical plug valve, the pressure drop could be varied to
any value down to less than one inch of water.
"2. Wind Tunnel
The wind tunnel'was made up of three sections of 5-3/4 inches
in inside diameter plastic tubing totaling 10 feet in length. Temperature
measurements were made by mercury thermometers installed at the fan inlet
and the tunnel outlet. The rate of flow of air was measured by an appro-
priately sized orifice installed in the tunnel duct. These were standard
sharp-edged orifices designed according to specifications of the ASME
Special Research Committee on Fluid. Meters (72). In each installation
the orifice was preceded and followed by straightening vanes in accordance
with the ASIE, specifications. One-fourth-inch upstream and dbwnstream
flange-type pressure taps led to a micromanometer containing alcohol
(sp. gr. 0.790) in which the pressure was balanced against the alcohol
head in a flexible (rubber) tube. The tube's altitude above the alcohol
reservoir level was adjusted by means of a micrometer screw. Since no
liquid flowed into or out of the tube or reservoir, no error was intro-
duced by change in reservoir alcohol content.
Photographs of the test setup and instrument board are shown in
Figures I and 2. A typical orifice installation is shown in Figure 3.
WADC TR 52-283 12

L 4-1
WADC TR-52-293 13

F~igure 2. Gauge Board.
WADC MR 52-293

Figure 3. Typical Orifice Installation.
WADCTR 52-293 15

3. Sample Holder
The sample holder, designed for this project, consisted of two
round flat flanges of one-inch aluminum, 12 inches in diameter, and is
shown in Figures 4, 5 and 6. A hole six inches in diameter was cut in
the center of the upstream flange so that the holder fitted over the end
of the tunnel tube. A hole 5-3/4 inches in diameter was cut in the center
of the downstream flange; thus the actual area of cloth exposed to flow
of air was 0.2 square foot, A groove of 1/8 inch radius was provided,
forming a concentric circle. with the hole in the center. When clamped
between the flanges, the fabric is forced into this groove by a ring of
1/4-inch rubber tubing, thus preventing any slippage of fabric when the
stress of pressure is applied to it. With the sample thus mounted, the
flanges were held together by seven bolts; the whole holder assembly is
clamped in place on a flange on the end of the tunnel.
The low-pressure tunnel was employed to determine the air permea-
bility of the parachute fabrics with pressure drop across the cloth not
exceeding approximately 55 inches of water. The high-pressure tunnel
was required-in order to determine the characteristic length for the ten
samples.,
C. High-Pressure Tunnel
In describing the high-pressure tunnel, reference will be made
to Figure 7 which ts.a photograph of the experimental setup. A service
air line (upper. right hand portion of photograph) supplies air to the
wind tunnel. The air passes in turn through an oil and water strainer,
through a spring-loaded pressure-regulating valve, through either or both
of two manually controlled pressure-regulating valves, through either of
two orifice meter installations, and, finally, through the fabric sample
and into the atmosphere. T:easurements of the air flow through the cloth
ViWDC TR r2-283 16

Figure 14. Exploded View of Low-Pressure Sample Holder.
WADC TR52-293 17

3tigure 5. Upstream Face of Sample Holder.
WAflO TR 5&-293 1

Pigure 6. Downstreaim Face of Sample Holder.
WADC TR 5a-293 19

14I,
W=ATH 52-293

and of the pressure upstream of the cloth were made with different
instruments, depending upon the range of variables-involved. Diagram-
Smatic sketches showing design features of the piping and sample holder
are included as Figure 8 and Figure 9, respectively. A photograph of
the sample holder is Figure 10.
V. TEST PROCEDURE AND METHOD OF HANDLING DATA
A. Selection of Cloth Sample
The position on the cloth yardage from which each sample was cut
was selected as dictated by statistical considerations described in
Chapter VII of this report, Statistical Analysis. The same procedure
for selecting the sample was employed for both the low-pressure and high-
pressure wind tunnels.
B. Test Procedure for Low-Pressure Tunnel
1. Sample IMounting Procedure
The sample was cut with a pair of hand shears and laid flat on
the face of the upstream flange of the sample holder, which was described
in the section on apparatus and is shown in the photograph of Figure 4.
A removable circle of plywood placed in the center hole provided a flat
stage for the cloth during mounting. A ring of 1/h-inch rubber tubing was
laid on the cloth over the groove in the flange face. The downstream
flange was carefully placed over the other, allowing the 3/8-inch taper
pins attached to it to center the aligning holes in the other flange.
The faces of the flanges were then pressed together, and, while in this
horizontal position, the two flanges were fastened together with seven
bolts which passed through the upper flange and threaded into the lower
one.
The fabric was securely held by the pressure of the ring of rubber
tubing, and there was no noticeable stress applied to the cloth. The
WADC TR 52-283 21

d
In 0
00
x0
'-4
0
"@t0
ca
WADO TR 52-283 -22-

1/4' POSITIONING PINFORC FIT17/64 DRILL
J/4 1/8
'00
1/4- POSITIONING PIN "•tFORCE FIT
Figure 9. A. Upstream Flange of High-Pressure Sample Holder,
POSITIONING PIN HOLE 3/16
11 1/4 -20 TAP3/41
31Ž1
POSITIONING PIN HOLE
Figure 9. B. Downstream Flange of High-Pressure Sample Holder.
WADC TR 52-283 -23-

?igure 10. High-Pressure Sample Bolder.
WAJDC TR 5a2-3 2

statistical analysis showed that any effect on the results which was due
to this technique of mounting, when reasonable tarefufly executed, was
negligible.
2. Preliminary Operations
After completing of the operational procedure of placing the
sample in its holder, the assemblage was mounted over the discharge end
of the tunnel. Zero readings were taken from the manometers and the
thermometers. With the plug valve closed, the fan was started and allowed
to come up to speed. The plug valve was then opened quickly, thus simu-
lating the shock of opening the parachute.
3. Data Obtained
When the flow had become steady, as indicated by the constancy
of the static pressure upstream of the sample (a steady temperature,
approximately 125* F, usually obtained downstream of the cloth), a record
was made on the log sheets of this static pressure and the orifice pres-
sure drop, along with the inlet and outlet air temperatures. The relative
humidity of the air in the laboratory was determined by a sling psychro-
meter. The laboratory room was served by the building air conditioning
system; tunnel inlet air at a constant condition was not available.
Similar readings were taken at about twelve different static pres-
sures distributed over the possible range; the entering of the complete
sample identification, the date and the psychrometer data completed the
log sheet. The barometric pressure was recorded twice daily.
Eight more samples from the same piece of fabric, the locations of
which were so selected that the statistical variation of the fabric per-
meability would be represented, were treated in the same fashion as the
first sample. Figure 11, a sample log sheet for test ES-l, dated 29
August 1951, is attached. The test designation ES-l refers to WADC Fabric
No. 3, USAF plain weave white, Table VII.
WADC TR 52-283 25

Run No. ES-I Page No. 1
LOG SHEET
Project 170-117
Cloth Identification Date.29 August 51Style No. 000/100Fiber Content Nylon Room TemperaturesWeave Pattern Plain -131461A Dry Bulb_ _Color Style White Wet Bulb
Remarks, U. S. Air Force Baro 29.23
Static OrificeTest Pressure Pressure Drop Temperatures *F
Number in. W.G. in. W.G. Inlet OutletZero
Readings 0.03 0.00 83 83
I 43.02 4.112 90 118
II 40.57 3.826 90 120
III 31.23 3.047 90 120
IV 25.82 2.288 89 121
V 18.52 1.549 88 121
VI 14.97 1.218 89 121
VII 9.87 0.759 89 122
VIII 5.87 o.4o6 89 122
Szx 2.97 0.170 91 124
x 2.37 0.138 95 124
XI 9.65 0.619 88 125
III 18.60 1.300 89 125
XIII 30.55 2.353 89 124
xIv 43.65 3.546 91 123
Figure 11. Sample Log Sheet For Low-Pressure Study.
WADC TR 52-283 26

4. Averaging of Data
From the data for each of these nine samples nine curves were
plotted of the static pressure versus orifice pressure drop. (A sample
plot for test ES-I is shown as Figure 12.) The nine values for orifice
pressure drop read at various values of static pressure were then aver-
aged. This manipulation gave a set of smoothed data which was presumed
to represent the fabric statistically. A table giving the results of
this averaging process for test ES-I is included as Table I.
.Calculations
These statistically corrected data were used in a series of.
calculations described in detail by an itemized list of 28 operations
in the Master Data and Result Sheet, which is included herewith as Figure
13. Table II is a record of the results obtained upon applying the cal-
culation procedure to the statistically smoothed data shown in Table I.
In the course of these calculations.the density of the air flowing was
obtained, the rate of flow through the ASME standard orifice was calcu-
lated, and the velocity pressure upstream of the fabric was obtained.
6. Correlation of Calculated Values
The square root of the ratio of velocity pressure upstream of
the fabric to the static pressure upstream was termed the "relativeIbm
porosity" and its variation plotted versus the mass velocity, sec ft2'
of the air upstream of the cloth to give a curve characteristic of the
fabric permeability. The curve in Figure 14 represents this result for
the sample ES-i. Table III includes the numerical values used in con-
structing Figure 14.
The following comments serve to illustrate the manner of application
of the Master Data and Result Sheet, Figure 13.
WADO TR 52-283 27

10 - - _ _ _ __ _ _ _ _
9.08.0
7.0
6.0
5.0
4.0
3.0 -
LU.= -:
S2. 0- - - - - - -- - -
LL.1
" 1.00.9
"0.8•0.7-- 0./ - _ _ _ _
•0.6
a-O 05 -/ ______
0.30.2
0.1
2 3 0 5 678910 20 30 40 50 60
STATIC PRESSURE (INCHES OF WATER)
Figure 12. Relation of Static Pressure to Orifice Fressure Drop.
WADC TR 52-283 -28-

0
CO) 'oC - D 0 0 coI- o V ~H% CCCý riC4C
W0 0 --1 U\ 0r tO\ (X) co 0CD C ,1 0 H r- ON cl 0 - 0N HN c C
I-H0 CO~-) P
r') r) r4. r) r- r*r 4 r 4 r
U3
0 %O C) 0 (X) E- INI ON 'iNC\ r- OI
Q- o H tI- r- ON OD El- OD I'- o" co N
U) C3 C C 88
44l 01 CC) N N NC)' UN bC C t-\ No Not U'r- O . -:1 0 0-) ON OD H ON Cj
(-4 0-) r- 0- 0l 0I 0 0 0-_ 0
C- 00( U 0 VNC 0X U'\ 0' U C &
U*).-4 0A 0 0 - 0 G\ 0~ 0: 00
-~ C)
*o *r- NO -\ a-. C) .:t o4 -4\ -\ UN co -4.\ r-41 = 0~ \C) r -* * c * - %1 * -. -. r . l \. I
"H DD 0z 0 ~ 0 r 0 n 0 0f 0 00 0I-- 0-PO l\ ci I- r - 0 U\ \C
-H J ,c4CD "N 0 0 -41 - 0D 0 CCl U'\ -4- U-\C 4-D :-,-I Ci H- 0 -4 CC. IN (NJ 0 N - O
rl" 00- ONO7 m (IN . . .*HW0 0 0 0 0 0 000 0 0 0n
VN N ~ N CAD 0I NO NoN\No -zI HN H D 0 c- O H (X \ C'j
a4) Hj H~ Hl NOi 04(NI ~ j
H) fI C;4(I N - (D* (N3 C\ 8N cN ON (0 0) 0 0 001
4- -- , '-~i H' uNCI CC) --- co) IA -. I "1\ - -4t a) -4t0~ 0 4 1 C - 0-i (\I CO H- ON ONl (NI 0) 0 411
H- 0-J CN .- I H- (Ni \'j H- CH H- (NJ CNJ (I N H*ý ,D *ý *ý * . . *
C) -4 (d 0A a) 0 0 0 040) C)
Cd() C,:*~ Hl' (N N 4 UN 'C - cC)l ON 0
Ci) '- ) 01
WADC TR 52-283 29

Figure 13. Master Data and Result Sheet
Item No. Dimension
1. Barometer in. Hg
2. Barometer (0.491 x item 1) lb in-2
3. Static pressure (S.P.) inches of water
4 . Static pressure (0.0362 x item 3) lbf in-2
5. Static pressure, P, (item 2 + item 4) lb in"2 abs.f
6. Inlet air temperature OF abs.
7. Outlet air temperature, T, *F abs.
8. Psychrometer Data
Dry bulb temperature F
Wet bulb temperature 0F
Relative humidity %
9. Orifice pressure drop, ho, inches of water
Pi00, T. (item + item 7)
11. Air density at cloth, e, (0.004672 x item 5) lb mft"3
12. h, (item 9 x item 11)
13. , (item 12)1/2
14. Estimated air flow, M (0.894 x item 13) lb sec"1
m
15. Air viscosity,#,. at temperature of item 7 cp
16. m +A (item 14 .'- item 15)
17. Reynolds number at throat, NRe (6179 x x item 14)
18. Corrected orifice coefficient, K,
19. Correct flow, N (item 14 x item 18Ibseitem 19) f
20. Mass velocity at cloth, G, ( item lb sec 1 ft-20.2* m
21. Reynolds number in tube, NRe, (0.64 x item 17)
WADC TR.52-283 30

Figure 13. Master Data and Result Sheet (Continued)
22. M (item 19 - item 11)
23. Velocity in duct, V (item 22 - 0.179 ) ft sec-
24. IV 2 [item 11 x (item 23)]
25. Velocity pressure, V.P., (0.00299 x item 24) in W.G.
26. Item 25 - item 3
27. Relative porosity (item 26)1/2
"0.2 ft projected area of cloth sample.
**0.179 ft 2 wind tunnel area.
WADC TR 52-283 31

C4('.5 CO4 .- .i *\ . * *-H'
4)4D*AOrN A c ('C'l 0 -0 0- U'. V\M C
0 OCd M 0 I oU n 0
Cýcý M Cl ** .(' ýo - LJc00 J0
0C'.JC U\0 ýU% 8Ul n -1HU 00ciO U\ r- V\'ý OZC4'5'0 IA% o ou c . -1
*ý9 C * -- ."C4j r- A'.00 1 'C" - 0s --t co0* I0
Cl-4r (\0- -. 0 0 JE-4 ~~c-i ONr n -Y :IU 01%C'.jGo'. 0 0 %0 V\ 0 r-4-IOC'.FU'.
* ~ ~ 9l ('-D c-~CJ l'-o0 S I r --I'.4r *~ 8 I
'.\0H 0 0 ~ 0
1.4 In * .t ( '.0 r--1H o 0- (7 r- --t c'1 IS\U.. 0 Lw-ý 10 0 00 ('.5 ('5 0 'c0 C\ r * 0N0 00
HE-4 C.j r-IH r!I *'.. m'- *H~ .C'1 H * .
El- 00
jx~~~~~~IC .r-4I . *l %D m0 Go. %. ~.)0 1-'0 GO L'- IS\ %0 UN. * 0~ E a-Cý~ ~ ~~~~l U*00i *mrio -,,;
0)kt0H cm."' M a 0 0 %10O'\ '.J '0
-470 * S r-I 4\ i l \ IN c-Im% .'cz ý so0r- 0 0)Ul) ~ ~ ~ ~ ~ ~ ~ ~ ~ (. .NCj f\0 0rI I--Z . - -W000 V0
CNJ.~ 0 . U'. 0Qli" -P0H)r ..0~ 0.-4 4) 11O' H qJ'0- 0 )% 4 Z-0 -
U~ ) PL *o 0,-(.5 '.0\ H cnC". ' I M~ 0\ ' C".lL\ M*NC)69C 0 '.50 z. Cd.r~j cn0, c! 0 .4C'.JOOOHH I co 0 '.-i .0 -:1000 r
4- H (' S H '.r ... en .. *C.-Ir-4 -jC) . . .*rIl $4
-P IUN r-4
'O0 $4 r. C". 0 U\ --.t ' 0%0A 0U~0 0 (%..4C'M a)
H -I H -I Cd .('j C\J \C) H C\J H- V "0,% H C\ C-E- C'- -:~t 8- %,C +4
H Cý ~('0 0 0 HH -40 Is\ 0 r- Is\C~'j - * . 0 0 0dP..4 o C\ C. . . *(J H Q..,%f * 'd -r-
00 co) clH- ('.14.H .0H 0UN 0 '0, 0U' IA aJ,'.0G a- H
H000 0 0 ONtz-0 t0-%. .0 00
0V.4-.. cd ot(1
WADO TR 52-283 32

10 _
0
w
< 6-J
0 0.5 1.0 1.5 2 .0 2.5
MASS V ELOC ITY UPSTR EAM OF CLOTH, LBM SEC 1 FT-2
Figure 14. Poros ity-Permeabil~ity Characterist ics.
WADO TR 52-283 -33-

TABLE III
EXPERIMENTAL DATA USTD ID FIGURE 14
Helative PorosityG (Item 20, Figure 13) (Item 27, Figure 13)
(lbs sec-1 ft-2)
0.498 0.0678
0.590 0.0693
0.635 0.0693
0.735 0. 0702
0.800 0.0 0710
0.857 0.0711
0.975 0.0719
1.235 0.0731
1.450 0.0748
1.85 0.0773
2.19 0.078
2.5 0.080
WADC TR 52-283 34

Items 1 through 8 are self explanatory. Items 9 through 19 indicate
the procedure employed to calculate the air flow through the fabric sample
from measurements relating to air density and orifice pressure drops.
The procedure is a standard one wherein the appropriate orifice coeffi-
cient, K, is selected, and an estimate is made of the flow through the
orifice; a Reynolds number at the orifice is now calculable and a corrected
value of K obtainable; in turn the correct air flow is calculated. A
typical Reynolds number vs. orifice coefficient curve is shown in Figure
15. The mass velocity at the cloth is obtained in item 20 as the ratio
of the mass flow through the cloth to the total cloth area subject to
the flow; the latter is fixed at 0.2 square foot. Items 22, 23, 24 and
25 serve to illustrate the manner of arriving at velocity pressure up-
stream of the cloth. Items 26 and 27 show the application of the arbitrary
definition of relative porosity to the sample data.
C. Test Procedure for High-Pressure Tunnel
1. Introduction
Based on the experience of operating the low-pressure tunnel,
the air requirements at a 15 psi pressure drop for a 0.2-square-foot
sample were estimated as greatly exceeding any service air supply avail-
able at test facilities. Accordingly the sample size for the high-pressure
tunnel was reduced to an effective circular section 2.06 inches in diameter.
In view of this reduced sample size, the sample holder design was changed
in accordance with the description reported in the section on apparatus.
This portion of the study was restricted to the eight standard cloths and
to the orlon and dacron fabrics. None of the Bally Ribbon cloths was
subjected to the high-pressure study.
2. Preliminary Operations
The specimen fabric, a strip approximately 4 inches by 10 inches,
was cut from the cloth yardage in accordance with the technique described
WADC TR 52-283 35

U 0
CLu
LL-0 4)
2 *1-4
to
0)
iN313:1O30 3OWNDSIUI
WAflC TE 52-283 -36-

under statistical considerations. It was placed over the upstream flange
of the sample holder (this flange was fixed to the tunnel), and the down-
stream flange was lowered and fixed in place, giving an installation
wherein essentially uniform tension could be expected from sample to
sample. No quantitative measure could be put on the small tension to
which the samples were subjected. As in the case of the low-pressure
tunnel, zero readings of instruments were observed and recorded. Once
the air flow to the apparatus was established, its control was possible
by manipulation of either of the manual control valves or of the spring-
loaded regulating valve or by any combination. The air flow was increased
to permit establishment of desired static pressures upstream of the cloth,
starting with the lowest pressure setting, being based upon the read-
ability of the indication of the micromanometer filled with alcohol as
the manometric fluid. Thus, this series of tests was carried out without
placing a simulated shock load on the sample, as was the case in the low-
pressure tunnel.
3. Data Obtained
Measurements of air flow and static pressure upstream of the
cloth, as well as air temperature, were the quantities required. In order
to measure air flow, three flow-measuring units were employed; for the
low flows a calibrated gas meter (obtained from the Atlanta Gas Company)
was used, for intermediate flows, a O.488-inch orifice plate meter, and
for high flows, a 0.978-inch orifice meter. These meters were installed
in parallel in 1.96 i.d. brass tubes.
The gas meter, when in use, was installed in paiallel with the mani-
fold of two manual control valves which, of course, were closed when the
gas meter was totalizing flow. (The gas meter was known to indicate with-
in l-1.5 per cent on measured flows 0.5 ft 3 or greater; gas meters of this
WADC TR 52-283 37

type are sensitive to the small gas flows required for the pilot light on
common home appliances.) When flow reached predetermined values, assur-
ing applicability of standard orifice coefficients, its measurement was
switched in turn to the two orifice plate meters. Pressure differentials
across the orifices were observed using in turn, as required, an alcohol
micromanometer and a vertical water manometer.
Static pressure readings upstream of the cloth were observed by using
in turn an alcohol micromanometer, a vertical water manometer and a verti-
cal mercury manometer.
Nine samples from each bolt of cloth were again employed in order
that the statistical variation of the fabric would be represented. For
practical reasons, as well as limitations of time, the statistical analy-
sis employed for the low-pressure tunnel was assumed to be valid in prin-
ciple for the high-pressure tunnel.
4. Handling of Data
From the data obtained for each sample calculations were carried
out, resulting in a set of points depicting the interrelation between the
pressure square gradient across the sample versus the mass velocity up-
stream of the cloth. The significance of these two terms and the theo-
retical interrelation involved are discussed in Section IX of this report,
High-Pressure Tunnel Characteristic Length Study.
The pressure square gradient-mass velocity results for the nine
samples of each fabric were plotted on a single log log graph; from this
set of results an equation of the form SP2-=O +6'A was fitted analyti-
cally. In view of the range of variables three techniques were employed
in establishing the fit: (1) least squares, (2) by eye in the high G range
and least squares in the low G range and (3) method of averages throughout.
The results for the three methods are shown in Appendix IV in Table IV and
in the corresponding graphical presentations, Figures 36 through 45.
WADC TR 52-283 38

Rather than submit a detailed set of data resulting from the high-
pressure tunnel study, the recommended values ofO( andd are given in
Table IV. Figures 36 through 45 show the extent of variation of the
experimental points from the recommended fit.
VI. PHOTOMICROGRAPHIC STUDIES
A. Appearance
1. Plain Weave
Photomicrographs at 100 diameters were taken of each of the
four fabrics supplied by the Air Force, of the four Cheyney fabrics and
of the orlon and dacron fabrics manufactured by the Duplon Corporation.
These are shown as Figures 16 through 25.
The plain weave (white or camouflage-printed) appeared to have quite
evenly spaced warp and filling, with interstices being generally rectan-
gular in shape and varying considerably in size. The warp showed much
less twist than the filling. (The Georgia Tech Textile Laboratory re-
ported the warp to be 7 to 8 turns/inch and the filling to be 1 to 2 turns/
inch.) The filling in the finished cloth was flattened to approximately
twice the projected width of that of the warp and the interstices were
about 1-1/2 times as long as they were in width.
2. Rip-Stop
The white and the orange rip-stop cloths were also similar in
appearance. Except in those photographs in which the dense rip-stop lines
were shown, the appearance of the rip-stop was similar to that of the plain
weave as would be expected.
Twist appeared in the threads of both white and orange cloth as an
occasional crossing of adjacent pairs of filaments rather than an actual
twisting together of all filaments in one thread.
WADC TR 52-283 39

Tigure 16. Photomicrograph of WADC Fabric No. 1 (USAF White Rip Stop).
W c•R 52-293 4o

71oa. 17. phoatomcrograjob of WAX Fabric No. 2- (USAF Orange Rip Stop).
WAX TR 52-283 ~41
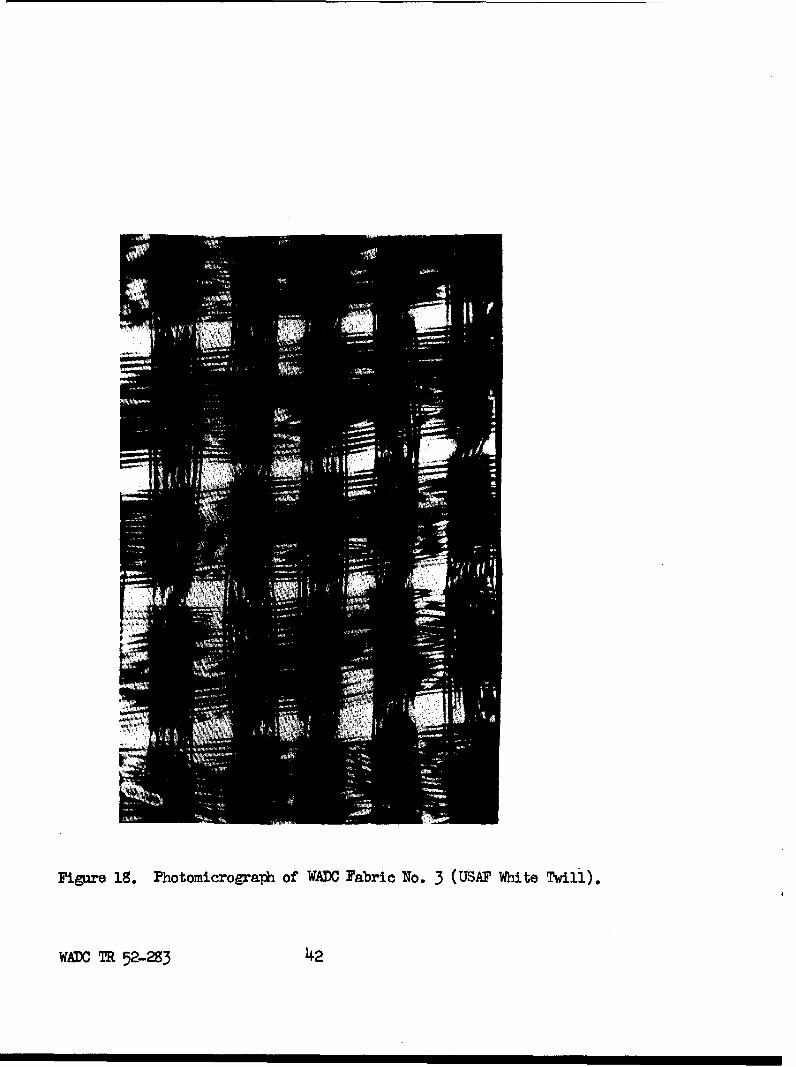
Figure 18. Photomicrographi of WADO Fabric No. 3 (UJSAF White Twill).
WADC TR 52-283 ~42

Figure 19. Photomicrograph of WADO FabricN.T U amulg wl)
WADO~~ fY22S 4

Figure a). Photomicrograph of IWADO Fabric No- 5 (CheneY Bros- White Finished).
WADC TR 52-293 144

Figure 21. Photanicrograpii of WAflO Fabric No. 6 (Cheney, Bros. White Greige).
WADO TRl 52-283 145

Figure 22. Photomicrograph1 of WADO Fabric No. 7 (Cheney Bros. White Rip Stop
Finished).
WADO TR 52~-293 4+6
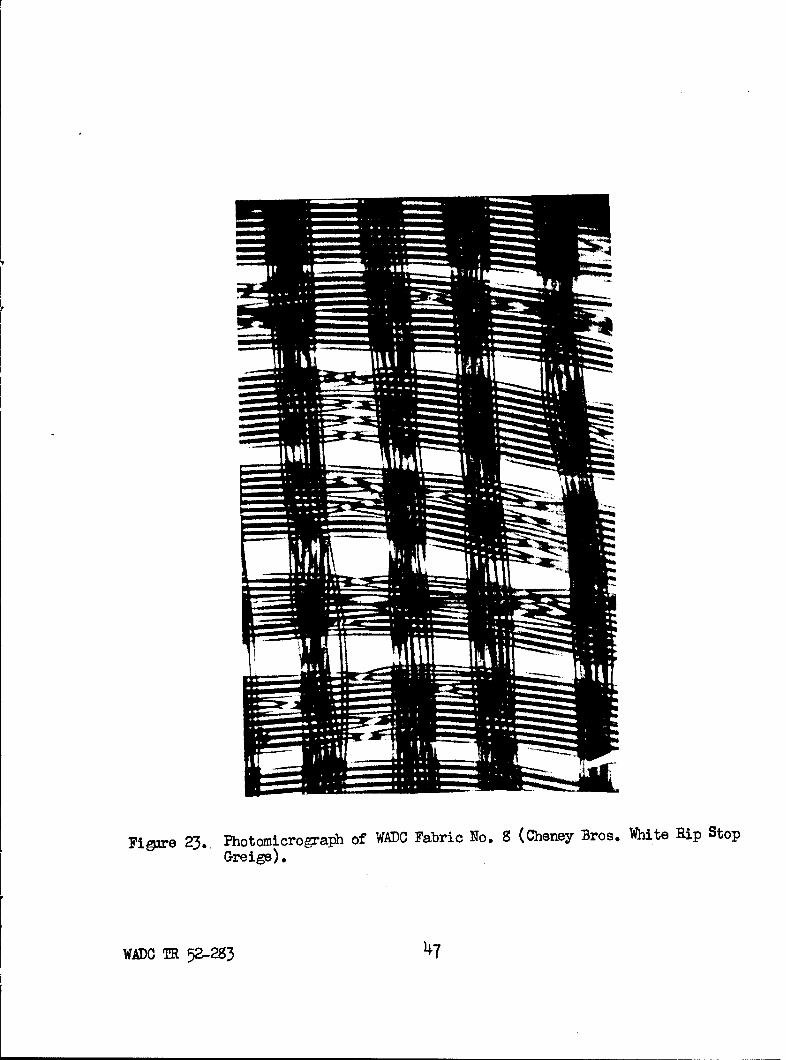
piolre 23.. Photomiicrograph of WADC Fabric No. 9 (Cheney Bros. White Rip Stop
Greige).
WADC TR 52-293 4

Figure 24. Photomicroersrh of WADC Fabric No. 9 (Thiplan Corp. White Dacron).
WADO TR 52-283 4

F~igin' 25. Thotomicrographi of .WADO Fabric No. 10 (Thipian Corp. White Orlon).
WM0OTR 52 293 4

3. Dacron
The photomicrograph of the dacron fabric at 100 diameters showed
the greater denier and higher twist of its warp and filling, which appeared
to be the same size and contained more filament per thread than the nylon.
A supplementary view at 50 diameters showed that the birds-eye weave caused
the pore sizes to be irregular and some of the pore shapes to be trapezoidal.
4. Orlon
The orlon's appearance was similar to that of the dacron, i.e.,
higher twist, greater denier, more filaments per thread and irregular
pore size and shape.
B. Effect of Finishing
Photomicrographs were taken of plain white cloth and of white rip-stop
in both greige and finished states. The pore shapes in the greige were
rectangular in general but much larger than in the finished cloth. The
warp seemed to be much more closely packed (circular cross section), where-
as in the finished cloth it had been flattened, and thus the spaces between
were smaller. The filling had much the same appearance in both states.
C. Effect of Dirt in Air
In spite of the precautions taken (using an air-conditioned laboratory
which was kept closed from the corridor and having its floor wet-mopped each
morning), there was some air-borne dirt in the fan discharge. This was
evident from the slight discoloration of that area of the sample exposed to
flow of air. Photomicrographs of this dirty area, Figures 26 and 27, and
of a clean piece of the same cloth, Figures 16 and 18, respectively, were
made, and a comparison showed the dirt particles to be of the order of twice
the diameter of one of the nylon filaments. It was found that the dirt did
not tend to clog the cloth interstices but did cling to the outer surface
of the threads. Thus, the interstices were left unobstructed.
WADC TB 52-283 50

Figure 26. Photomicrograph of WADC Fabric No. 1 (USAF White Rip Stop)
Showing Dirt Accumulation.
WADC MR 52-293 51

Pigure 27. PhotamicrograTp1 of WADC Pabric No.. 3 (UISAF White Twill)
Showing Dirt Accumulation.
W=. TR 5&-293 52

VII. STATISTICAL ANALYSIS
A. Necessity for Statistical Analysis
Since a piece of fabric is the product of many varied and separate
mechanical operations, its permeability (or any other property) is gener-
ally recognized to be widely variable from sample to sample within the
same piece of cloth. The problem of determining the nature and extent of
this variation yields most readily to a planned statistical analysis.
The statistical analysis of data from this project was divided into three
programs.
B. Program I
The first program consisted of a comparison of the readings of the
flow orifice manometer for each of twelve samples from the same cloth.
The variation could occur with the sample location in a direction along
either the-warp or the filling threads, or along both, and, in the case
.of permeability testing, some of the variation may be due to mounting
technique. In order to produce suitable data for such an analysis, the
samples were taken four in a row across the cloth width, in three rows
spaced five yards apart along the length of the cloth. Data were taken
on each sample at a static pressure of 35 inches of water and then the
cloth was allowed to "relax" for exactly 24 hours after which each deter-
mination was repeated.
The original data shown in Table V were analyzed for the signifi-
cance of the main effects and for all possible interactions of these main
effects. The analysis showed that variation due to mounting, the procedure
for which is described in Section V, B, was not significant (0. per cent).
While the variation along the filling (across the cloth width) was con-
siderable (13 per cent), it was much less than that along the warp (66
per cent). The analysis of variance showed the interaction of main effects
WADC TR 52-283 53

TABLE V
9TATMSTICAL DATA--P•OG•A I
Orifice Manometer i~eading (Inches of Water)
Values of Flow 42'-42
F1 Ml 3.99 2.63 2.h6M2 3.93 2.73 2.42
F2 I! 4.37 3.23 2.6342 h.431 3.26 2.63
F3 MI 4.30 3.3h 2.611v'2 4.14 3.33 2.71
Fh 11 3.74 3.06 2.65
M2 3.73 3.03 2.71
*Static pressure constant at 35 inches of water.
**F is position across the cloth (filling variation). II is replication(= 2) of data (due to remounting).
'* is position down the cloth (warp variation).
Wl = 0 yards, W2 = 5 yards and W3 = 10 yards.
WADC TR 52-283 54

(warp and filling variation) yielded a 17 per cent contribution; an
additional 4 per cent residual effect was calculated. The average of
the values for sarples taken in a row across the cloth was found to cor-
respond to the value for any sample located at a point 1/4 of the cloth's
width in. from either selvage. This is in agreement with the findings at
the British Ministry of Supply (16).
C. Program II
The variation along the warp was shown to be the most important,
but the analysis had been based on only three sampling positions. In
order to determine more accurately the pattern and the extent of this
variation, data were obtained from 22 samples of plain-weave cloth, taken
nine inches apart along the length of the cloth, the center of each sample
being nine inches from the selvage edge of the 36-inch width. The 22
samples were divided into three groups by location, each succeeding group
being separated from the last by three yards. All data were taken at
static pressure of 35 inches of water.
The values of the flow orifice pressure differential for Group 1,
consisting of ten samples, were in the ranges 3.25 and 3.80 with an average
value of 3.5. Assuming that their values are "normally" distributed, 95
per cent of repeated measurements should be between 3.0 and 4.0 (i t 20-x
or 3.5 *_ 0.5). In Group 2 (six samples) the average value was 3.41 and
the standard deviation was 0.48. This change in characteristics was
attributed to the noticeable and abrupt change in the appearance of the
fabric occurring in that portion of the cloth from which these six samples
were taken. For the six samples of Group 3 the standard deviation was
again 0.25, the same as for Group 1. The value of the mean, somewhat
lower than either other group, was 3.16. Table VI is a summary of the
above results.
WADC TR 52-283 55

The data for each of the three groups were subjected to an "analysis
of variance." The variance between groups was shown to be not significant;
therefore, an over-all average and standard deviation is proper. These
values proved to be 3.39 and 0.35, respectively. The following 95 per
cent confidence intervals were computed.
Number of Per CentRandom Samples Deviation
1 20.44 10.49 7.0
16 5.225 4.236 3.5
Practical economics suggested a program of nine random samples, which
should assure that, at worst, their mean value will be within t 7 per cent
of the true average value for 95 per cent of the determinations.
It is recognized that more than three groups for the analysis of va-
riation might have revealed a small but finite variation. For this reason
it was recommended that the nine samples be taken from as widely separated
positions as possible, including the entire piece available for testing.
D. Program III
In an attempt to indicate the order of magnitude of the variation
due to the type of weave, a third program of statistical work was per-
formed in which nine random samples from ten different cloths of four
different weaves were considered. The average flow orifice manometer
reading (in inches of water), taken at static pressure of 40 inches of
water for each cloth, and the standard deviation of each are presented
in Table VII. The average and standard deviations show lack of control,
and there is significant variation in bcth average level and variability
from cloth to cloth.
WADC TR 52-283 56
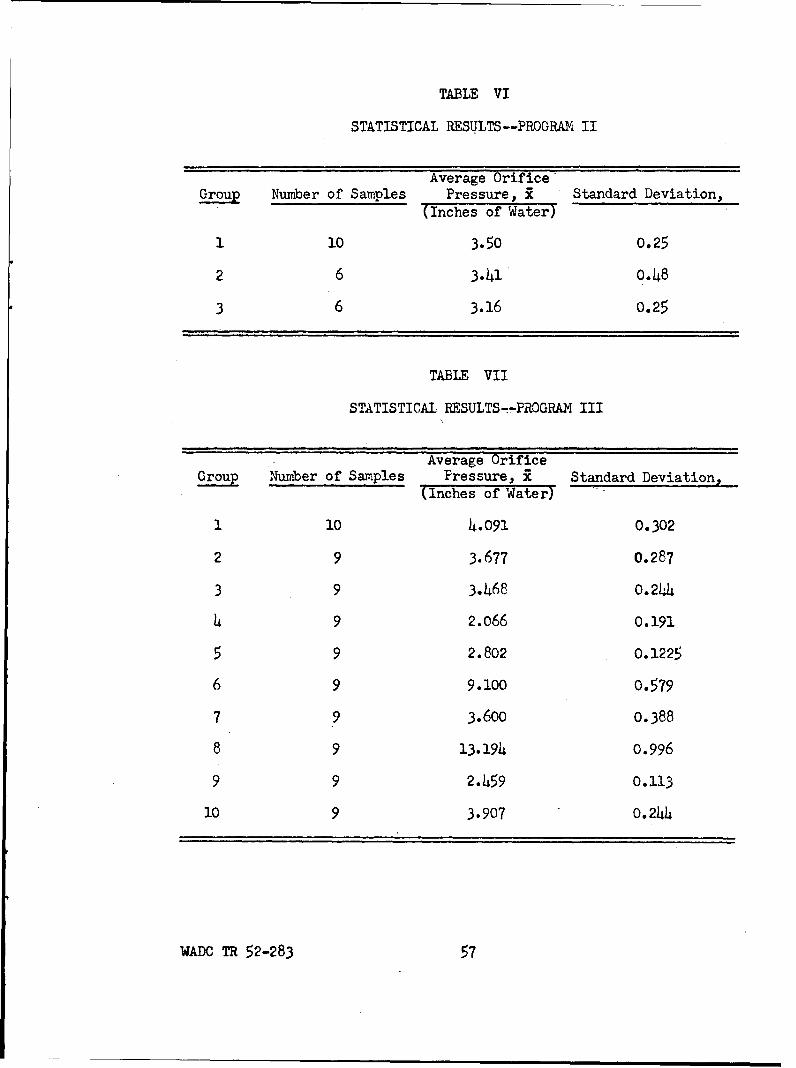
TABLE VI
STATISTICAL RESULTS--PROGRAM II
"Average Orifice'Group Number of Samples Pressure, x Standard Deviation,
(Inches of Water)
1 10 3.50 O.25
2 6 3.41 o.48
3 6 3.16 0.25
TABLE VII
STATISTICAL RESULTS-,!PROGRAWI III
Average OrificeGroup Number of Samples Pressure, x Standard Deviation,
(Inches of Water)
1 10 4.091 0.302
2 9 3.677 0.287
3 9 3.468 O.2,4,4
4 9 2.066 0.191
5 9 2.802 0.1225
6 9 9.100 0.579
7 9 3.600 0.388
8 9 13.194 0.996
9 9 2.459 0.113
10 9 3.907 0.244
WADC TR 52-283 57

E. Limitations in the Analysis of Samples
It should be emphasized that in this project the representation of
any one weave is by fabric from one loom in one mill. This fact limits
the generalizations, based on results obtained, to comparison of these
individual pieces of cloth, or to other pieces from the same loom if that
loom were to be again operated under the same statistical quality control.
In view of these facts, conclusions are limited to the sample cloths
supplied and application to each general type of cloth is not justifiable
because of the very real possibility of significant variation in the per-
meability of the products of different looms, different mills, etc.,. man-
ufacturing the cloth of the same weave, denier, twist, threads per inch,
etc.
The program of investigation of various weaves produced on the same
loom under the standarized conditions in the weave room here at Georgia
Tech permits broader generalization, and the results of this study will
be presented in a subsequent technical report.
VIII. LOW-PRESSURE TUNNEL AIR PERMEABILITY RESULTS
A. WADC Cloths
1. Description of Samples
Table VIII serves to provide identification for this set of ten
fabrics, using the designations Fabric No. 1 through 10; the physical and
textile properties for the cloths are recorded in Table IX, using the
indicated designation.
2. Summary Data and Results
Figure 28 represents the graphical summary of the porosity-
permeability characteristics for the io WADC cloths. Appendix III, Section 1
is the tabular summary of data from which Figure 28 was prepared.
WADC TR 52-283 58

TABLE VIII
IDENTIFICATION OF WADC CLOTHS*
Fabric Source
Number of.Supply Color and Type Style
1 USAF White Rip Stop 200-300, 118187A
2 USAF Orange Rip Stop 200-300, 135744A
3 USAF White Twill 000-100, 131461A
4 USAF Camouflage Twill 081-110, 2695-05B
5 Cheney Bros. White Finished 179362
6 Cheney Bros. White Greige 179362A
7 Cheney Bros. White Rip Stop 176498Finished
8 Cheney Bros. White Rip Stop 176498AGreige
9 Duplan Corp. White Dacron S ill
10 Duplan Corp. White Orlon S 193
Fabrics numbered 1 through 8 are nylon cloths.
WADC TR 52-283 59

U.- % 0
0%00
Cl- GoNOU
0, 000 0000.
A I
-1 0%
00 GoU
('m 924 r 9 - ; -
0 0 -U
H 0 cUN MIS U\ %OI~~4 0
0 0 0 o-C-
WADC R 52-83 6

0 8 448
r-4 0-t%0
''0
ON0.4
Go o 0 C4
V\ 0
V. ý O000N
0%~m t-
0 1-1 c C. 00c
or-4 *DX
I) 0
0% P4
00
0cl 0- ufr 0
(~~U\ .-4 ~ *\
co- 040 C z 4
0 -0
011-4 0$
"4-r-U ~ ~ ~ ~ ~ ( CO$ mf4t
mVH0 C) b.0-
Nu 0
WA0C lO 52-283 61

ihgm)
IiWi
0)
E-4
MAMOR 0 1ýNiL0
r.4
ci)
eco
I A±U)N~ 3AIr~0
WADC..... 0I 223-2

In view of the nature of the definition of relative porosity and its
relation to mass velocity upstream of the cloth, the loci of points cor-
responding to a constant static pressure drop across the cloth are straight
lines through the origin of coordinates. The loci for constant static
pressure drops of 50, 20, 10 and 5 inches of water column are indicated.
Evident from the presence of these loci on the porosity-permeability plot
is the indication that an increase of pressure differential across a fabric
causes a reorientation in the order of increasingly porous (and therefore
permeable) fabrics. For example, at five inches of water static pressure
drop in the order of increasing porosity one finds the sequence 4, 2, 5, 9,
1, 7, 3, 10, 6, 8, whereas at a 50-inch drop the ordering becomes 4, 9, 5,
2, 7, 10, 1, 3, 6, 8.
B. Bally Ribbon Cloths
1. Description of Samples
The Wright Air Development Center furnished this project with
59 nylon ribbon cloths; these had been manufactured by the Bally Ribbon
Mills and were prepared incorporating different weaves, threads and picks
per inch, different deniers of warp and filling threads and combinations
of these. Each bolt of cloth was nine inches wide with selvage at each
edge; the lot ranged from quite dense fabrics to rather open weaves of
fine thread. All samples had been subjected to identical mill finishing
processes; accordingly, no contribution to permeability variations was
expected from this source. A summary of the specifications of the cloth
as furnished by the Wright Air Development Center is given in Table X.
2. Statistical Considerations
The same statistical considerations apply to the ribbon mater-
ial as were proposed for the fabrics 36 inches wide. The test equipment
required a sample at least nine inches in diameter with an area of 0.2
WADX TR 52-283 63

TABLE X
IDENTIFICATION OF BALLY RIBBON CLOTHS
Manufacturers Data Wright Field Data
Thread Count Thread Count"Per Inch Yarn Denier Per Inch..
Item MillNumber Style W Filling W Filling Weave W Filling Weiht
1 7171 138 110 30/10 30/10 Plain .135 -13 1.052 7172 " 120 133 122 1.083 7173 " 110 2/1 Twill 132 113 1.034 7174 " 120 133 125 1.095 7175 " 95 " 40/13 Plain 134 99 1.126 7176 " 105 " 137 110 1.207 7177 " 95 " " 2/1 Twill 136 94 1.088 7178. " 105 3" 135 103 1.159 7180 120 95. 40/13 40/34 Plain 119 85 1.192
10 7181 " 105 " " 118 83 1.17511 7182 . 95 " 40/13 " 122 95 1.2112 7183 " 105 " " " 123 105 1.2413 7184 " 75 " 60/20 " " 75 1.3014 7185 " 85 " " " 125 87 1.4015 7186 " 75 " . 2/1 Twill 124 75 1.2816 7187 " 85 " " " 125 86 1.38.17 7188 100 75 60/20 60/20 Plain 100 75 1.4818 7189 " 85 " " 102 84 1.5519 7190 " 75 " " 2/1 Twill 101 75 1.4920 7191 " 85 " " " 85 1.5121 7192 90 68 70/34 70/34 88 66 1.5022 7193 " 78 " " " " 78 1.6023 7194 " 68 " " 2/2 Twill 89 69 1.5524 7195 " 78 " " " 91 71 1.6829 7209 " 68 " " 5 H. Satin 93 70 1.5830 7210 " 78 " " 92 80 1.6731 7211 " 68 " OQ/34 2/1 Twill 91 69 1.8032 7212 " 78 , " 91 78 1.9533 7213 " 68 " U 2/2 Twill 92 68 1.8034 7214 " 78 " "' 90 77 1.9735 7215 " 68 3 " 5 H. Satin 92 73 1.7836 7216 " 78 " " " 94 80 1.9437 7217 76 57 100/34 100/34 2/1 Twill 79 57 1.8238 7218 " 67 U "' 79 66 2.0039 7219 " 57 " 2/2 Twill 81 57 1.8340 7220 " 67 " "' 79 69 2.0245 7225 " 57 " " 5H. Satin 82 57 1.87
WADC TR 52-283 64
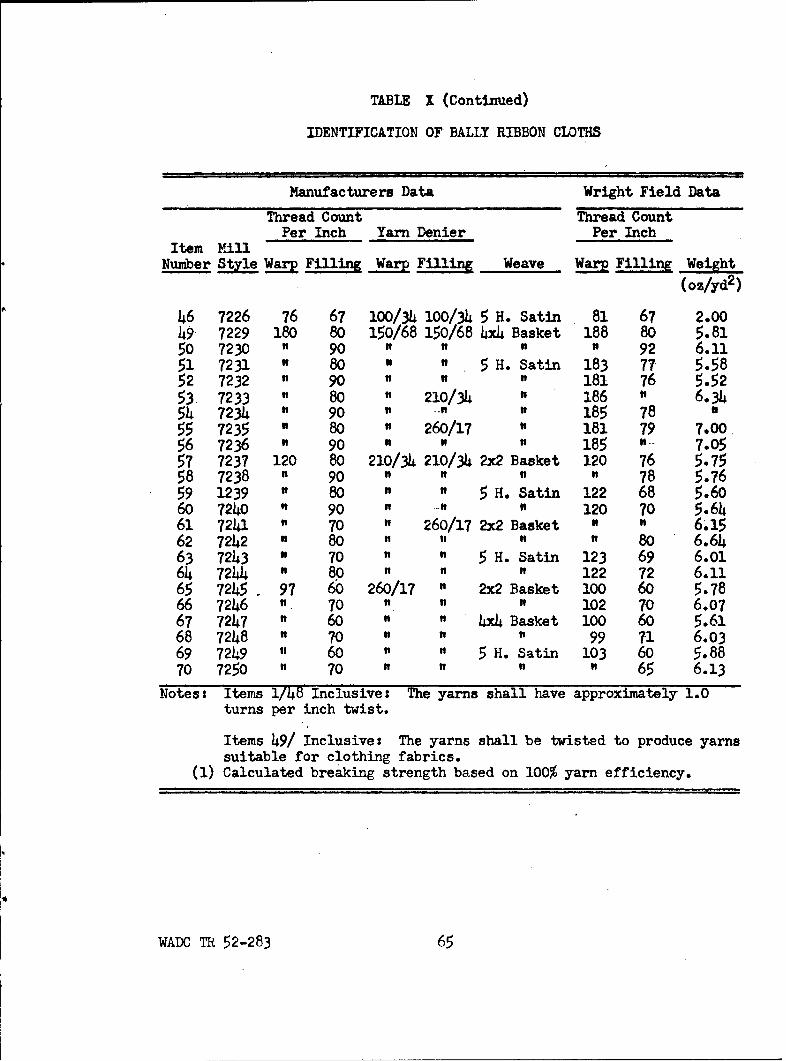
TABLE I (Continued)
IDENTIFICATION OF BALLY RIBBON CLOTHS
Manufacturers Data Wright Field Data
Thread Count Thread CountPer Inch Yarn Denier Per Inch
Item MillNumber Style W Filling Wa Filling Weave Warp Filling Weight
(oz/yd2 )
46 7226 76 67 100/34 100/34 5 H. Satin 81 67 2.0049 7229 180 80 150/68 150/68 4xh Basket 188 80 5.8150 7230 " 90 92 6.1151 7231 " 80 " " 5 H. Satin 183 77 5.5852 7232 " 90 181 76 5.5253 7233 " 80 " 210/34 186 " 6.3454 7234 " 90 185 78 055 7235 " 80 " 260/17 181 79 7.0056 7236 " 90 185 " 7.0557 7237 120 80 210/34 210/34 2x2 Basket 120 76 5.7558 7238 " 90 78 5.7659 1239 " 80 5" H. Satin 122 68 5.6060 7240 " 90 120 70 5.6461 7241 " 70 " 260/17 2x2 Basket " 6,1562 7242 " 80 " 80 6.6463 7243 " 70 " 5 H. Satin 123 69 6.O164 7244 " 80 122 72 6.1165 7245 97 60 260/17 " 2x2 Basket 100 60 5.7866 7246 " 70 102 70 6.0767 7247 " 60 " 4x4 Basket 100 60 5.6168 7248 " 70 99 71 6.0369 7249 " 60 5" H. Satin 103 60 5.8870 7250 " 70 65 6.13
Notes: Items 1/48 Inclusive: The yarns shall have approximately 1.0turns per inch twist.
Items 49/ Inclusives The yarns shall be twisted to produce yarnssuitable for clothing fabrics.
(1) Calculated breaking strength based on 100% yarn efficiency.
WADC TR 52-283 65

square foot of cloth exposed to air flow; accordingly, there was no
possibility of effecting a study of permeability variation in the filling
direction. Each cloth sample, therefore, was assumed to represent the
average permeability as concerns variation in filling direction. To intro-
duce the effect of variations in warp direction, again as with the standard
cloths, nine samples were taken at intervals of five yards. Finally, the
handling of the data obtained was identical with the manner employed for
all data derived from the low-pressure tunnel; it should be remembered that
the Bally Ribbon cloths were not subjected to study in the high-pressure
tunnel.
3. Data and Results
The relative porosity-permeability results for the 59 Bally
Ribbon samples are presented graphically in Figures 29 to 35 and in Tables
XI through XVI in Appendix III, The samples numbered BR-4 9 through
BR-70 are not parachute weaves; accordingly, only the graphical summaries
of the results for these 22 samples are presented (Figures 34 and 35), and
for the purpose of this report these results are not pursued any further.
In order to facilitate the making of comparisons among the remaining
37 cloths, the relative porosity-permeability curve for each of the samples
was prepared. Furthermore, the relative porosity at a pressure different-
ial of 20 inches of water was abstracted from the individual curves, and
this value was used to indicate a measure of comparison among the various
weaves.
Table XI shows the effect of thread count variation on relative poro-
sity; clearly, in each of the successive pairs of samples the two cloths
differ only in the measure of thread count in the filling. In general,
one observes that, upon increasing the filling thread count, the relative
porosity is decreased regardless of weave, denier and warp thread count.
WADC TR 52-283 66

Table XII serves to illustrate the effect of filling thread denier
variation on the relative porosity. Here increasing the filling yarn
denier generally lowers the relative porosity. One can also observe the
relative effects of weave; some indication of this effect can be observed
among the plain 5 harness satin, 2/1 twill and 2/2 twill weaves. The
effect of weave is best observed by examining Tables XIII, XIV, XV and
XVI wherein comparison is made in pairs between plain and 2/1 twill, 2/1
and 2/2 twill, 2/1 twill and 5 harness satin, and 2/2 twill and 5 harness
satin. Figures 29-33 are graphical summaries among the various cloths in
one-to-one correspondence as concerns variables with Tables XII-XVI inclu-
sive.
IX. HIGH-PRESSURE TUNNEL CHARACTERISTIC LENGTH STUDY
A. Theory
The complexity of the geometry of a parachute cloth precludes the
prediction a priori of its permeability from analytical considerations
of fluid mechanics. Such geometric difficulties are found to be similar
to those arising in the fields of chemical engineering and mechanical
engineering, wherein such problems as the flow of fluids through packed
beds of particles, sweat cooling and boundary layer control are considered.
In the case of parachute cloths, attempts (22) have been-made to consider
the cloth as a series of orifices, and a correlation based on orifice dis-
charge coefficients has been suggested. Others (4) have attempted to con-
sider the geometry of the cloth utilizing fabric-like structure and observ-
ing flow photographically; these conclude that a similarity can only be
vostulated if an applicable linear dimension is determined. Hoerner (1)
argued that, if a Reynolds number could be prescribed for a flow through
a cloth, then at low values of the Reynolds number viscous forces pre-
dominate, and at high Reynolds numbers dynamic forces control. Lacking-
WADC TR 52-283 67

in each of these presentations is anr suggestion as to the appropriate
length parameter that might be employed to characterize the geometry of
the cloth. Green and Duwez (2), in considering the flow of fluids through
porous media, obtained a measure of success in characterizing porous media
through the assumption that the pressure gradient at an interior point of
the flow is due to the presence of inertia and viscous contributions com-
bined linearly. In particular they argue that the gradient takes the form
- -4V +,e v 2 (1) where -_ , a positive quantity, is the space rate
of pressure decrease in the direction of flow; here a viscous coefficient,O(,
has dimension negative two in length (L- 2 ), and4, the inertia coefficient,
has dimension negative one in length (L' 1 ). CC and8 might conceivably
represent, respectively, wall effect and successive channel expansions and
contractions per unit length of passage. If this same assumption be employ-
ed in the consideration of air flow through parachute cloth and, furthermore,
if changes in cloth geometry brought about by air loading are considered
negligible, then the momentum equation written to include momentum effects
on a macroscopic scale becomes
dp +•O4v dx +.Apv2 dx +10v dv - 0 (2)
Now multiplying through by O and by defining the mass velocity, G, as
equal to the productiev, equation (2) becomes
edp .0(4G dx +A82 dx + Ged(2) (3)
Furthermore, the assumption is made that G is independent of x and that
the gas has the equation of state* 1- P/RT; equation (3) becomes
Sdp +Og dx+,6G 2 dx - G2 = 0 (4)
*Green and Duwez erroneously state that this condition implies "isothermalflow of a perfect gas."
WADC TR 52-283 68
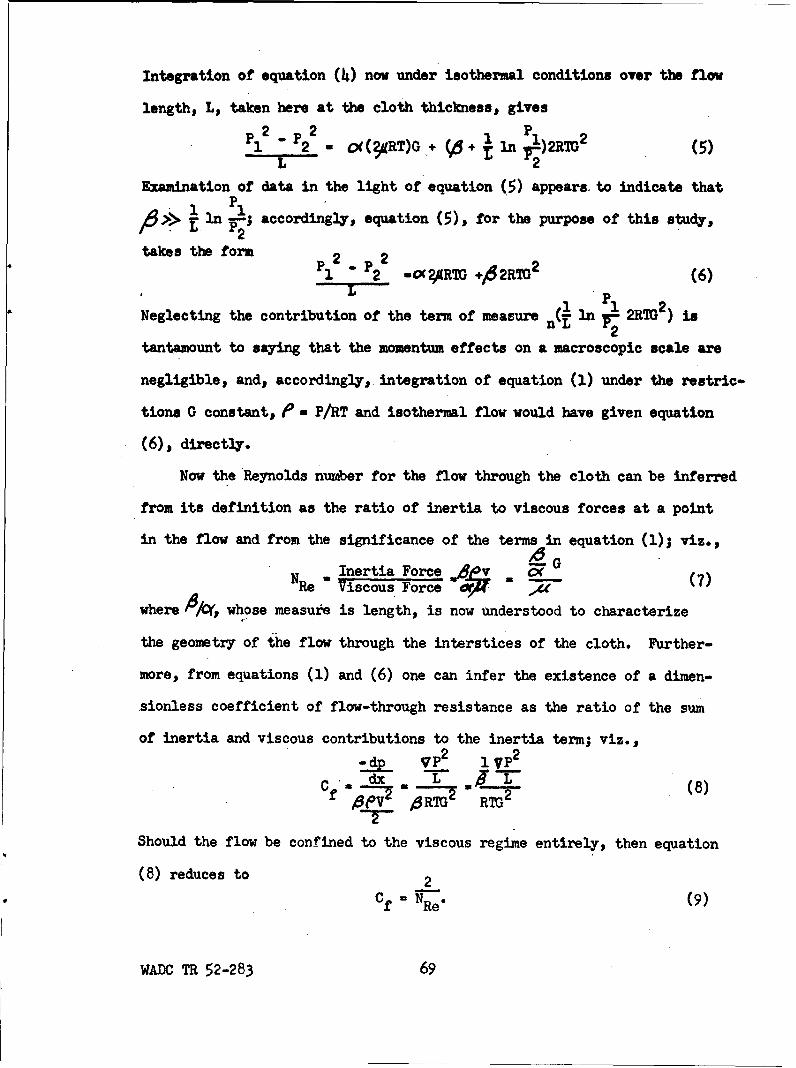
Integration of equation (4) now under isothermal conditions over the flow
length, L, taken here at the cloth thickness, givesP1 2 _ P2 2R. (3R)+ 1 ln 2RM2 (5)
T r2
Examination of data in the light of equation (5) appears. to indicate that
l~ n 1; accordin gly, equation (5), for the purpose of this study,L 2
takes the form 2+2RT 2 (6)1 2 mCCgAM ,62 (6
L lP 2Neglecting the contribution of the term of measure (I in 2RT ) is
nL 2tantamount to saying that the momentum effects on a macroscopic scale are
negligible, and, accordingly, integration of equation (1) under the restric-
tions G constant, e - P/RT and isothermal flow would have given equation
(6), directly.
Now the Reynolds number for the flow through the cloth can be inferred
from its definition as the ratio of inertia to viscous forces at a point
in the flow and from the significance of the terms in equation (1); viz.,
Inertia Force Ge (NRe Viscous Force 4 m 'A
where B/O6 whose measure is length, is now understood to characterize
the geometry of the flow through the interstices of the cloth. Further-
more, from equations (1) and (6) one can infer the existence of a dimen-
sionless coefficient of flow-through resistance as the ratio of the sum
of inertia and viscous contributions to the inertia term; viz.,=42- VP 2 1 VP 2
. dx . L • Z (8)S8P-1V SRT12 RTG
Should the flow be confined to the viscous regime entirely, then equation
(8) reduces to 2
Cf N Re. (9)
WADC TR 52-283 69

Similarly, if inertia effects predominate, then equation (8) becomes
C f = 2. (10)
Accordingly, for the range of flows considered, equation (8) may now be
written as 2C f - 2. (+1)
Re
This equation, then, describes completely the hydrodynamic behavior for
the air flow through the parachute fabric hypothesized to have negli-
gible deformation over the range of flows ccnsidered.
B. Experimental Results
A series of ten parachute cloths was examined in the light of the
indications of equation (6), employing the test procedure and computa-
tional devices indicated earlier in this report. The ten families of
results and the recommended fits are shown in Figures 36 through 45
(Appendix IV). Table IV (Appendix IV) records the values for O( and,8 and
the ratio b/bfor the ten fabrics. Figure 46 serves to show the existence
of a trend in a relation between O(and8 and the relative porosity at 20
inches of static pressure. Figure 47 is the universal plot for all the
fabrics and represents the flow-through-resistance coefficient, Cf, vs.
the Reynolds number based on the characteristic length fl/x.
C. Discussion and Recommendation
Given a parachute fabric whose textile description is known com-
pletely, what is its behavior when subject to air flow through its inter-
stices? If an answer to this question were available a priori, then the
parachute designer could specify with certainty the performance of the
parachute when its behavior was dependent upon permeability characteris-
tics alone. The objective of this' study, apart from obtaining quanti-
tatively a measure of the permeability of various cloths in the range of
pressure differentials up to 55 inches of water, was to examine the
WADC TR 52-283 70

possibility of the existence of a characteristic length prescribed from
hydrodynamic considerations alone. A partial answer to the question above
is given in that the measure of the ratiod/'O does give such a characteri-
zation. There remains as yet the problem of establishing a correlation,
if one exists, between the ratio 6 /0(and those necessary and sufficient
physical designations which establish the cloth from a textile point of
view. Stated differently, the flow of air through a parachute fabric
presents the problem of interrelating the effects of mechanical deforma-
tion of the cloth upon the permeability and its characterization, as
herein attempted. That is, as the flow of air is increased through the
interstices of the cloth, the cloth will deform; thus, the geometry of
the passages traversed by the air will change, and the characteristic
length4 A/x( will change.
The recommendation is made, therefore, that a study be undertaken to
examine the extent of the significance and the importance of variation of
geometry, due to deformation of cloth, upon its hydrodynamic characteri-
zation as herein defined.
WADC TR 52-283 71

103,
I--U&.
0
L-w_1 1
U-J
w_z€
100 t0 102
1.5 x10
0
0
0
L-
U-€
*o
a 102
u.
>.
101
100 10 102
RELATIVE POROSITY AT 20 INCHES, 9
Figure 46, a and p versus Relative Porosity.
WADC TR 52-283 72

r-40)
CHCH00)
404o
E4,
0)
*4-0
0)
40
z.q
(SS-lOIN3WCI : 'IN1:[-ziO:)v~o-onoHIMO1.
WADCz 0R52237

Appendix I
BIBLIOGRAPHY AND ABSTRACTS
WADC TR 52-293 74

I. PERJEABILITY
A. Theory
1. Hoerner, S. F., Aerodynamic Properties of Screens and Fabrics.Wright Air Dev. Center, Aerodynamics Branch, Aircraft Laboratory,Dayton, Ohio.
Using the Reynolds number, the ratio of dynamic forces to viscousforces on a mass of flowing fluid, to characterize flow, Hoerneris able to show viscous forces to predominate at low values ofNRe, while at high values the dynamic forces are the controllingfactor.
2. Green, Leon and Duwez, Pol, "Fluid Flow Through Porous Media."J. of App. Mech. 18, No. 1, 39-45 (March 1951).
Pap'er is primarily concerned with flow through porous metals buttheories are applicable to any media.
(a) Viscous flow pressure drop can be expressed as_d- (Constant) (x-)
where M, - viscosity,V = superficial bulk velocity and
S- a length characterizing pore opening.
(b) Turbulent flow pressurl drop can be expressed as
- •-(Constant)(
where p = density.
(c) To describe the entire range of flow (viscous, transition,turbulent) the pressure drop may be expressed as a sum:
- =ijv +,6v 2
where O(ande contain the length term
(d) Granting compressibility of the fluid (1v is constant, G),the momentum balance is dp +O(vdx +j6ev7-x +P-vdv - 0.
P(e) Granting perfect gas and isothermal flow, L dp +q dx +
L2 G2 L bT
S + dR -O.
(f) Integration over a path length L yields:P 12
LL 2 g
(g) In the case of flow through metals, experiment showed thatthe momentum change term 1 In P1 was negligible.
WADC TR 52-283 75

3. Longnecker, Kenneth W., Development of a Theoretical Formula forCalculating Air Flow Through Woven Materials Under Certain Re-stricted Conditions. M.S. Thesis, Lowell Text. Inst., June 1950.
Description is given of apparatus which was used to determinepermeability of both screens of various mesh sizes and fabricsof different weaves. Resulting data is presented. h,- 1/2 inchof water is mistakenly used in place of h -AP/W for air whichmakes his calculations questionable. For example, his reportedvelocities are only 1/50 of what would be expected.
4. Penner, Stuart E., A Study of Flow Through Fabric-Like Structures.M. S. Thesis, Inst. of Text. Tech., Charlottesville, Va., June1950.
The theories of models and of similarity are utilized in design-ing an apparatus for observing, photographically, the mechanicsof flow through orifices similar to fabric pores. The photo-graphs so obtained were analyzed and the conclusion reached thatfabric pores can be considered as orifices only if the applicableorifice dimension is determined.
5. Taylor, G. I. and Davies, R. M., Aerodnamics of Porous Sheets.Publication Board No. 92975 .(Brit.nf. L 30 Roch Pace, NewYork 20). [Biblio. of Sci. & Id. Reps. 10, No. 5, (Nov. 1948).]
Description of measurements of air resistance of perforatedsheets, gauze and some fabrics and of the drag coefficients offlat circular sheets droppbd as parachutes in air and in water.Correlation by a proposed theory is shown.
B. Apparatus
6. Draper, S., Investigation of a New Method of Determining Porosityof Fabrics, Thesis, Mass. Inst. Tech. r.ext. Res. J. 18, 650-8(1948), from Bacher's Thesis, M.I.T.
The conclusion is drawn that, qualitatively, air permeability isdirectly proportional to the yarn twist and looseness of weaveand inversely related to the texture, the amount of carding theyarn diameters and the extent of fabric felting (in woolens5.
7. Landsberg, M. I. and Winston, Gerald, Relationship Between Mea-surements of Air Permeability by Two Machines. Pub. Board 97014(Q.M.C. ThR 35).
Deviation of the empirical relationship between the readings ofthe Frazier and the Gurley instruments, both commonly used fordetermining the air permeability of fabrics, etc. The limitationsof each machine are discussed, and, the number of specimens re-quired for testing. The correlation is applied to data from bothmachines operating at.0.5 and 1.26 inches of water.
WADC TR 52-283 76
8. Shinkle, John H., and Morean, Arthur J., "The Apermeter, A NewAir Permeability Determination Apparatus." Am, Dyestuff Reptr.36, 245-7 (5 May 1947). rText. Tech. Digest 4 No. 1,S-ov. 1947),j
5
Design of the aperameter, developed at Lowell Textile Institute,is described, and the correlation of its data with results oftests with a Frazier tester is shown.
9. Teres, J., and Sharnoff, P., "Calibration of Silk Porosity Meters."Rayon Textile Monthly 20, No. 10, 589-90 (Oct. 1939). Engineer-ing Index (1939)r, -
Description by schematic diagram of the porosity meter developedby the National Bureau of Standards and adapted at Wright Fieldfor the purpose of insuring accuracy in measuring porosity ofparachute fabrics.
10. Anonymous, "Fabric-Porosity Testing Apparatus." Engineering(London) 148, No. 3856, 634 (8 Dec. 1939). (W.P.A. Bibliographyon Aeronautics, Supp. 5.)
Description of a practical apparatus for rapid permeabilitydetermination. Sample is held over the end of a tube of definitecross section by rubber bands. Air is drawn through the sampleby a suction pump. Reading is the pressure drop required to give1 cubic foot per minute flow.
C. Data, For Fabrics
11. Anonymous, "Gas Permeability." Tech. News Bulletin, No. 32851-8 (1944). [Text. Tech. Digest 1, No. 47, 3 (Sept. 1944).j
Discussion of balloon fabrics and of test methods in use at theNational Bureau of Standards. Neoprene has low gas permeability.
12. Brown, W. D., Air Flow Through Materials Liable to be Used forMan-Carrying Parachutes with Special Reference to Celanese.E(RAE)TN Aero l0Ll Reel 3757 Frame 905, Reel 3780 Frame 603.(Air Documents Index)
Weight, strength and porosity of substitute materials for silkin man-carrying parachutes are considered. Cotton proved superiorto, nylon similar to, and Celanese inferior to silk.
13. Brown, W. D., The Effect of Tension on the Porosity of A ParachuteFabric. A.R.C., R & M 2325 (7543), Brit. Min. of Supply, T.N.,Jan. 1944.
The technique of prestressing fabric samples of a cruciform shapeis described, and data for pressure drop of 5 and 10 inches ofwater through a number of different weaves of fabrics are given.
WADC TR 52-283 77

The conclusion is reached that tensions and air pressurescorresponding to flight conditions must be established inexperimental testing procedures if satisfactory predictionof parachute performance is expected.
14. Clayton, F. B., t"Measurement of Air Permeability of Fabrics."J. Text. Inst. 26, T171-86 (1935). rext. Res. J. 18, 650-8(19 4 8), from Bacer's Thesis, M.I.T.J
Air Permeability varies linearly with twist. Increase in picksper inch from 35 to 65 resulted in a linear decrease in permea-bility of a plain weave fabric; above 65 the curve flattens out,indicating approach to complete closure. ,iir permeability wasfound to vary linearly also with filling count as the fillingyarns were increased in size in a plain weave.
Clayton, in lieu of total air permeability, considers whathe calls "sectional" air permeability which is the productof total permeability and the cloth thickness.
15. Doetsch, H., A Comparison of the Air Permeability of the Materialto the Resistance of the Parachute. Z.W.B. /FBI/ 230 Reel 2717Frame 72h (Jan. 1935). LAir Documents Indexj
Tests conducted with various types of material used in the manu-facture of parachutes to determine the degree of resistanceoffered by the different types of cloth.
16. Glaskin, A., A Statistical Note on the Variation of Porosity ofNylon Fabric to Specification D.T.D. 556A. A.R.C., R & M 2313,Brit. Min. of Supply, A.R.C., T.N. (June 1945).
A large number of porosity (permeability) measurements, at pres-sure drop of 9.15 inches of water, on twill and plain weavefabrics show that porosity varies across the width but not alongthe length of a piece of fabric. The minimum porosity occurs atthe selvage and the maximum at the center of the width. Ingeneral, the average value occurs at a distance of 9 inches fromthe selvage. (The standard width for this specification is 36inches.)
By a consideration of probability, it is shown that littleis gained by using the average of more than 10 random meas-urements to establish the mean.
17. Glaskin, A., A Note on the Variation of Porosity of Cotton Fabricsto Specification D.T.D. 562 and D.T.D. 624. E/R.A.E./T.N. Aero166l Reel 3760 Frame 11451. DAir Documents IndexI
An investigation of variation of porosity of two types of cottonfabrics used in manufacture of supply-dropping parachutes wasmade. Results are shown in graphs and tables.
WADC T 52-283 78

18. Johns, T. F. and Anterson, E. I., The Porosityy of Nylon Fabricsfor Man-Carrying Parachutes. E/R.•7T.TN. Aero. 1176 Reel3564 Frame 60d (April 1943).
Recommendations for porosity for various denier yarn of parachutefabrics made of American nylon yarns are presented.
19. Marsh, M. C., "Some Notes on the Permeability of Fabrics to Air.".J. Text. Inst. 22, T56-63 (1931). [Chem. Abs. 25, 5035 (1931).]
Description of an apparatus similar to that of Sale and Hedrickis given and results of its use to determine permeability ofmany fabrics. When a fabric is milled, its air permeabilitydecreases markedly.
20. Rainard, L. W., "Air Permeability of Fabrics I." Text. Res. J.16, 473-80 (1946). •jTest. Res. J. 18 640-8 (1948), from Bacher'sThesis, M.I.T.]
The following relationship is established:
F 1 ()+ F2 = Pa/A-
where A is air permeability,Pa is pressure differential,F1 (slope of curve) is dependent on pore radius and
number of pores per square inch, and is inde-pendent of fabric thickness, and
F2 (intercept) is dependent on pore radius, numberof interstices per inch and fabric thickness.
21. Rainard, L. W., "Air Permeability of Fabrics II." Textile Res.J. 17, 167-70 (1947). [Chem. Abs. 41, 3630h (1947)].
Discussion of the application of the Haggenbach equation to flowthrough fabrics. This equation applies to streamline flow throughtubes with a correction for kinetic effects.
22. Robertson, A. F., Air Porosity of Open Weave Fabrics. I. MetallicMeshes. Tech. Rep. No. 1, Proj. 5007, Inst. of Text. Tech.,U-hiirttesville, W. Va.
(a) History of Project is given.
(b) Methods of other investigators are reviewed.
(c) Open area defined as (1 - td)2
where t is wires (or threads) per inch andd is wire (or thread) diameter.
(d) It is suggested that porosity be correlated by two dimen-sionless groups of variables, Reynolds number, Re, and dis-charge coefficient, C.
WADC TR 52-283 79

He 0 DVP
where D is diameter of circular orifice or width of squareorifice,
V is velocity,0 is density and
4 is viscosity.
QC a A2 [2gh/(l'A eif..
where h is pressure head of flowing fluid,g is acceleration of gravity,A2 is nozzle projected open area,A1 is upstream flowchannel area,Ae isA/A andQ is volumetric flow rate per pore.
(e) Data for screens for Re values from 4 to 1000 are presentedas plots of Re vs. C, and good correlation is shown.
(f) Comparison with other data for fabrics of a plain weaveshows that the correlation should apply equally well totextile fabrics.
(g) Concern is expressed over obtaining discharge coefficientsgreater than unity.
23. Robertson, A. F., Air Porosity of Open Weave Fabrics. II. Tex-tile Fabrics. Tech. Rep. No. 2, Proj. 5007, Inst. of Text. Tech.,
sCharlottesvill, W. Va.
(a) Good correlation is shown for each weave except twill byplotting Re vs C (as described in previous report) for45 different open weave fabrics over a wide range of fabricweights and porosities in the following four weave patterns:(1) plain, (2) basket, (3) moch-leno, (4) twill.
(b) Lack of correlation of the data for twill weave is attri-buted to much smaller open space obtained in this weave andthe greater opportunity for movement of the yarns.
(c) Abnormally high discharge coefficients (mentioned in pre-vious report) are explained by faulty technique in measure-ment of pressure drop across the fabric, accurate measure-ment of which gave reasonable values for the dischargecoefficient.
(d) Accurate prediction of open area is made possible by therelation of "effective" diameter, , of yarn and denier.
d
where d is actual yarn diameter,Deis denier of yarn andSis a constant for a particular fabric construction.
WADC TR 52-283 O0

(e) Although the twist was shown to have small effect onporosity, a standardization called the twist multiplier(TM) was defined as
- T.P.I. (001/2
where T.P.I. is twist in turns per inch,0( is yarn denier andK is a dimensionless constant (which for viscose
rayon is 72.8).
(f) Porosity (as used in these reports) is defined as a measureof the ability of a fabric to allow passage of fluid(A3/min A2).
24. Robertson, A. F., "Air Porosity of Open Weave Fabrics." Text.Res. J. 20, No. 12, 838-57 (Dec. 1950). [Engineering Index-51,1622 (1951)],
Analysis of flow through metallic meshes is correlated on basisof two dimensionless ratios: Reynolds number and dischargecoefficient. 45 different weaves were studied and data presented.
25. Schiefer, H. E., Cleveland, R. S., Porter, J. E., and Miller, J.,"Effect of Weave on Properties of Cloth." Nat. Bur. of Stds. J.Res. 11, 441-51 (1932). [Text. Res. J. 18, 65048 (1948), fromBacher'rs Thesis, M.I.Tj
Air permeability is lower in firm, closely woven cloth having alarge number of thread interlacings per unit area and short floatsthan in cloths of the same weight which are loosely woven, sleazy,with a small number of threads interlacings per unit area andlong floats. For a given texture, sateens possess the highestpermeability followed in order by herring bone twill, herringbone twill--modified, oxford and plain weave.
26. Siemenske, M. A. and Hotte, G. H., "The Permeability of FabricsI." Raon Text. Monthly., 68-70 (Jan 194.5). [Tech. Data Digest(AAF), 33 (Mar.195
Detailed bibliography and discussion of development of permea-bility test methods and apparatus. General methods: (1) volumeof air passing through unit area in unit time, (2) back pres-sure at a given rate of air passage, and (3) rate of flow undera given pressure drop through fabric.
27. Siemenske, M. A. and Hotte, G. H., "The Permeability of FabricsII.) Rayon Text. Monthly, 61-2 (March 1945). Tech. Data Digest(AAF), 36 (June, July 1945)].
(a) Permeability increases with tension in fabric.
(b) Permeability decreases with time of flow (due to dirtclogging pores, matting of fibers, etc.).
WADC TR 52-283 81

(c) Increase in temperature should result in increased per-
meability.
(d) No data are shown for effect of absolute pressure.
(e) Permeability at 3 per cent relative humidity was six timesthat at 97 per cent, with straight line relationship between.
(f) Fabric structure, in order of permeability; (1) plain weave,(2) twill, (3) satin. Foil with small orifices was 15 percent more permeable than single orifice of area equal tosum of small orifice areas.
28. Westbrook, F. A., "Permeability of Fabrics to Air and WaterVapor." Text. Manufacturer 73, 451-3 (Oct. 1947). [Text. Tech.Digest (948.
Test methods and results of starches on fabric permeability toair and water vapor at low velocities (fraction of an inch dif-ferential pressure).
29. Williams, K. A., Jr., The Air Permeability of Woven Fabrics. M.S.Thesis in M.E., Rensselaer Polytech. Inst., 1949.
Alteration of a commercial apparatus to measure the weight rateof flow of air through woven materials is described. Data takenwith this instrument over a range of pressure drops and atmos-pheric conditions (temperature and humidity) for different typesof weaves are presented. The flow is characterized as occurringin a fashion analogous to flow in parallel through a multiplicityof orifices. Results indicate that permeability is maximized byusing a square weave with the lowest possible denier yarn, andwould be minimized by use of the greatest possible denier yarnwoven by a system which contained many more threads in the warpthan in the weft (or vice versa).
II. PARACHUTES
A. General
30. Alkan, R., "Contributions a l'etude a lessai des Parachutes."Aeronautique 16, No. 179, 37-43 (Apr. 1934). Ungineering Index
A study of the performance of modern parachutes, pointing out theimportance of porosity and resilience of parachute tissues, testsof chronophotographic control of parachutes.
31 -. Anonymous, Report of Research and Experiments on the High-SpeedParachute. Tech. Intelligence, Air Mat. Com. Translation No.F-S-W30-6E, 18 July 1946.
WADC TR 52-283 92

(a) Utilization of an auxilliary parachute as an "air-brake"was investigated and abandoned due to danger of foulingmain chute shroud lines.
(b) Use of loose knit fabric in area around vent at crown ofchute resulted in nearly eliminating shock on opening.
(c) Improved method of folding chute into its container so asto facilitate its opening in order from skirt resulted ina reduction of 213g in comparison with ordinary chute.
Techniques (b) and (c) are recommended to be usedsimultaneously.
32. Brown, W. D. and Harrison, K., Design of Parachutes for LargeBombs. Aero. Res-Council, R & M No. 2324 (5699), A.R.C. Tech.Report.
Defining porosity as the reciprocal of air permeability (whichis the pressure in pounds per square foot required to cause aflow of 14.4 cubic feet of air per minute through one squarefoot of material) the drag of the parachute was found to varydirectly with the porosity of its material. Drag = CDAPv 2
CD is a function of porosity. Squidding develops at Vc which
is increased in value by reducing porosity.
33. Jarnagin, L. B., Phase of Parachute Problem. U.S.A.F., Air Tech.Intell.; Tech. Data Digest 13, No. 2, 7-12 (1948). [Eng. Index(1948).]
Discussion of research and development of parachutes of high-and low-porosity fabric.
34. Johns, T. F. and Picken, J., Cotton Supplies-Dropping Parachutes:Tests with Containers Loaded to 500 Pounds. E/Royal Air Estab./T.N. Aero 1554 Reel 3423 Frame 857 (Nov. 1944). 1Air DocumentsIndex]
Discussion of tests on the use of a strong panel at the vent andof more porous material for the strong panel.
35. Johns, T. F., Parachute Design. Royal Aircraft Estab., Farm-borough, Tech. Note No. Arm. 365, Dec. 1946.
This report is a r6sume of work done on parachutes in generalat the Royal Air Establishment, Farmborough, and contains thesuggestion that permeability (called porosity in the report) becorrelated by plotting v against CD/CD..
where v is velocity of flow through the cloth(v - 1/2?V2 ),
V is parachute velocity,CD. is a constant for a given type of parachute and
WADC TR 52-283 93

CD is the drag coefficient(CD. Drag D- .
(Cl/pV2) "
It is suggested that CD CD T-2.-5 ).
36. Madelung, George, Report on the Works of the Parachute Department(Forschungsanstalt Gref. Zopplin). Air Mat. Come., Tech. Intell.Summary Rept. No. F-SU-1107-ND, 20 May 1946.
The work done on parachutes in general at the institute of Fly-ing Techniques (Germany), as well as other research on the sub-ject of parachutes by other activities, is reviewed. Descriptionof an innovation--the ribbon parachute--and its applications tomany different uses are given. Textiles, paper and artificialmaterials are also discussed. Photographs of retractible andreefable parachutes in use on aircraft are included.
37. Stevens, G. W. H.e Experimental Work on Parachutes Used in AirDefense Apparatus. E/Roy. Air. Estab., Rept. No. Exc.114 -Reel3432 Frame 633 (Jan. 1942). [Air Documents Index
Porous cloths have low drag values, but, since they are lighter,the drag-weight ratios are not appreciable different.
38. U. S. Ary Air Forces (T-2 Translation), Report of Research andExperiments on the High-Speed Parachute. T-2 Translation 430,July 1946.
A special weave which teduces opening shock and methods of test-ing are given.
39. Weinig, F. S., The Theory of the Parachute. J.D.L. I, 620-21(1940). P. 2B231]
The theory of the previous fabric parachute is given.
40. Weinig, F. S., Parachutes with Canopies Composed of Self-Support-ing Ribbons. Tech. Intell., Air Mat. Com., Tech. Rept. No. F-TR-216-IN8D,7 ct. 1947. [G.S. - A.A.F. - Wright Field No. 22.3
Behavior during uniform descent of parachutes in general andfabric requirements are discussed. Stresses during uniformdescent are relatively easily calculated, but those occurringduring the opening process are difficult and are comptued fromdrop tests. Requirements for dynamic similarity in models arediscussed. Calculations and an illustrated example for thedesign of a self-supporting ribbon parachute are given.
B. Theory
41. Duncan, W. J., The Cause of the Spontaneous Opening and Closingof Parachutes (The Phenomena of Squidding). Aero. Res. Council
WADC TR 52-283- 94

Tech. Rept., R & M No. 2119 (7293), Dec. 1943. [Brit. Min. ofSupplij
An open parachute with a porous canopy will collapse to a "squid"shape at a critical value of the relative air speed. Uponfurther reduction of the relative air speed the collapsed canopywill reopen at a second (lower) critical speed.
The phenomena is explained on the basis of increased poro-sity with increased pressure drop through the canopy. Thecritical speed is higher for longer shroud lines, greaterporosity (or venting).
If the force of the flow of air (radically) out of thecanopy, across its lip, is not greater than the inwardradical component of the tension in the shroud lines, thecanopy will "squid". The maximum diameter in this condi-tion has been found to be approximately one-third of themaximum diameter (normal, full extended).
42. Duncan, W. J., Stevens, G. W. H. and Richards, G. J., Theory ofthe Flat Elastic Parachute. Aero. Res. Council Tech. Rept., R &M No. 2116 (5693), Mar. 19J,2. Drit. Min. of Suppla
The behavior of flat parachutes under load depends largely on theelasticity of the fabric. Their form and the stresses in themare expressed mathematically by relations derived in this report.The assumption that the canopy (at least near the crown) is asurface of revolution is made. In practice, canopies usuallyfail at places of stress concentration, such as rigging lineattachments, etc. However the tensile stress at the crown deter-mines an upper limit of load-carrying capacity. When the great-est permissable stretch is very small, the permissible load isproportional to the fourth root of this stretch.
43. Johns, T. F. and Anterson, E. I., The Effects of Various Factors.on Parachute Characteristics. Aero. Res. Council, R & M 2335,1950. EAero. Eng. Review 9, 65 (Oct. 1950)1
Three important factors are drag, critical opening speed andstability. porosity causes a decrease in drag. This change isabout 40 per cent over the normal range of porosities encounteredin parachute textiles. Other factors have only small effect ondrag coefficients.
Critical opening speed is mainly dependent on porosity, ishigher when less porous fabric is used and is affected byshape of parachute. Porosity is. the main factor controllingthe stability of the parachute, which is improved by in-creased porosity and is affected by parachute shape.
44.- Jones, R. A., On the Aerodynamic Characteristics of Parachutes -A Complete Account of Researches Incorporated in Various Papers
WADC TR 52-283 95

Submitted to the Advisory Committee for Aeronautics, Aero.Res. Council, A.C.R., R & M 862.
Discussion of weight analysis and shape of parachutes and stressanalysis methods. Wind tunnel data on models of different shapesare given including pressure distribution and drag coefficients.Tests showed porosity had no effect on the drag coefficients.
45. O'Hara, F., "Notes on the Opening Behavior and the Opening Forcesof Parachutes." Roy. Aero. Soc. J. 53, No. 467, 1053-62 (Nov.1949). - Rero. Eng. IndeA
The rate of canopy development is computed from the excess of themean velocity of the outflow through the end and the porosity ofthe fabric, and the formula is used for an analysis of parachuteopening forces. The critical opening speed above which the chutewill "squid" depends on porosity of fabric and on the number andlength of the rigging lines.
46. Scher, S. H. and Gale, L. J., Wind Tunnel Investigations of theOpening Characteristics, Drag and Stability of Several Hemispher-ical Parachutes (NACA). NACA Tech. Note No. 1869, April 1949.
Drag coefficients were measured and motion picture studies weremade of seven different designs of parachutes (hemispherical) atair speeds up to 200 m.p.h. Drag coefficient is defined as theforce of drag divided by the product of the dynamic pressure andthe projected area. For a given parachute, increased air speedsgenerally impaired opening characteristics, lowered drag coeffi-cients, and improved stability.
Beneficial effects on the opening characteristics wereobtained with longer shroud lines relative to parachutediameter, with a strip of low porosity fabric around the
.canopy just above the hem line and with floating hem linestacked to prevent the hem line loops pulling out under load.
47. Simmons, L. F. G., Gould, R. W. F. and Cowdrey• C. F., Wind TunnelExperiments on the Suiddng of Parachutes. LAero. Res. CouncilR & M No.. 2525 (7062), 6 Nov. 1943.1
The underlying causes of collapse of a parachute (squidding) areinvestigated. Pressure measurements along the surfaces of modelsrepresenting squidded and fully extended parachutes were made ina wind tunnel. Both fabric and rigid sheet metal (perforated tosimulate the same porosity) models were used. Squidding occursat the air speed at which the net pressure on the lip of thechute is inward, and the chute resumes a fully extended shapeonly when the air speed is reduced (to a speed much lower thanthe critical, squidding speed) until the sum of flow pressures,tension of rigging, and hem lines, etc. is outward.
WA ' TR52-283 s6

C. Textiles for Parachutes
48. Anonymous, Rot Proof Parachute Canopy Fabrics. Roy. AircraftEstab., Farorough, Rept. CN No. 742. Tech. Data Digest (AAF)(Aug. 1945)]
Tests of porosity of treated fabrics by (1) Cambridge low pres-sure instruments and (2) Met/Ch instrument for measuring air flow.at high wind speed equivalent are discussed.
49. Anonymous, "Parachutes and the New Fabrics They Require." TextileWorld 93, No. lO,'65-8 (Oct. 1943). Dngineering Index (1973-1.T
Data on rayon and nylon constructions for special textiles nowbeing procured; physical properties of parachute fabrics are dis-cussed.
50. Appel, W. D. and Warner, R. K., Investigation of Cotton for Para-chute Cloth. NACA Tech. Note No. 393, Sept. 1931. [EngineeringIndex (1931) ]
Development of light-weight cotton fabric of suitable air permea-bility for parachute manufacture is presented.
51. Bacher, Stanley, The Relationship Between the Structural Geometryof Textile Fabrics and Their Physical Properties. P.B. 95956(Q.M.C. T.S.R. No. 52) Aug. 1948. B-iblio. of Sci. and Ind.Reptr. 11, No. 3, 249 (Mar. 1949)]
This report is a literature review with tables of data and 36references. The relationship between structural characteristicsand gas permeability is shown. [ee also: Textile Res. J. 18650-8 (1948) and Chem. Abs. 43 I193 (1949).]
52. Bartell, F. E., Purcell, W. R. and Dodd, C. G., "Measurement ofthe Effective Pore Size and of the Water Repellancy of TightlyWoven Textiles." Discussions of the Faraday Societ 3, 257-64(1948). ext. Tech. Di est]
A method for the quantitative determination of effective poresize in fabrics is described and equations are given. The pro-cedure is to apply a variable pressure differential across afabric sample which has been wet with a liquid and so mountedthat a thin layer of the liquid lies upon it. The appearanceof the first bubble indicates the pressure value to be used inthe given equation.
53. Brown, W. D., A Note on the Development of Artificial Silk forParachutes with Special Reference to Their Use on U. Z. ArmyStores. E/Roy. Air. Estab.iT.N. Aero. 1457 (June 1941.4) Reel3785 Frame 997.
WADC TR 52-283 57

The development of a parachute for USA mines and fragmentationbombs is discussed, as is the recommendation of a measuringinstrument developed at Farmborough for 'porosity determination.
54 . Cleary, C. J., "Textile Materials Used in Aircraft." SilkJournal & Rayon World 17, No. 198, 21-3 (Nov. 1940). rTineer-ing Index (1940).J
Major technical advances and applications of textiles made duringthe first World War. Performance and properties of parachutefabrics.
55. Cleary, C. J., "Parachute Fabrics." Aira Age 10, No. 11, 1766-8 (Nov. 1929). Dngineering Index (1929)]
Rate at which air flows through the main sail of a parachute hasa definite relation to its performance with reference to its rateof descent and its ability to withstand shock load of opening.Probable limit of permeability discussed on basis of a series oftests made. Specifications of future fabrics are discussed.
56. Hamburger, W. J., "Effect of Yarn Elongations on Parachute FabricStrength." R Textile Monthl) 23 No. 3, 151-3, No. 5, 291-2,No. 6 332-4 (1942). Also SilkJ. & Rayon World 19, No. 222,27-9 (1942). jngineering Inex (1942)]
Resistance to impact in canopy fabrics is discussed, and a briefreview of various types of textile fabrics is given.
57. Heinrich, Helmut, Tests on Stability of Parachutes and Develop-ment of Parachutes of Standard Permeable Fabrics. P. B. 37256(1943).
Development of a new ribbon-like structure for parachutes isdescribed.
58. Johns, T. F. and Hallum, M. E., Note on the Useful Life of SilkParachutes Used by Paratroops. E/Roy Aircraft Estab./T.N. Aero1405 Reel 3653 Frame 65s k1944). (Air Documents Index
After 25 descents parachutes showed sufficient increase in poro-sity to necessitate discarding.
59. McNicholas, H. J. and Hedrick, A. F.,,'The Structure and Propertiesof Parachute Cloths. N.A.C.A. T.N. No. 335 March 1930.neering Index (1930].
Requisite properties of parachute fabrics and methods for measur-ing them are discussed. Comparison of domestic and importedfabrics showed the superiority in some respects of domestic mate-rials. Specifications for manufacture are given.
WADC TR 52-283 99

60. Pierce, F. T., "Geometrical Principles Applicable to the Designof Functional Fabrics." Textile Research Journal 17, 123-47(1947). FText. Res. J. Abs. -18, 650-8 (1948), from Bacher'sThesis, M.I.T.]
Flow resistance is primarily a function of warp cover factor,provided the weave is firm enough to hold the close warp yarnsfirmly in place. Flow is proportioned to the pressure drop perunit thickness for any shape cross section.
D. Further References
61. Anonymous, "Navy Testing American Silk Cloth for Parachutes."U.S. Air Services 12, No. 5, 27 (May 1927). [W.P.A. Biblio-graphy on Aeronautics, p. 24.1
62. Anonymous, Physical Characteristics of Parachute Cloth UnderVarying Atmospheric Conditions. U. S. Gov't. Printing Office,Air Corps Info. Circular No. 651, 1930. [W.P.A. Bibliographyon Aeronautics, p. 24.1
63. Battles, H. G., Neoprene Coated Nylon Rip-Stop Parachute Fabric.P.B. 95555 (Sept. 1948). jiblio. of Sci. & Ind. Reptr. 11,No. 1 (Jan. 1949)].
64. Black, J., "Trustworthiness in Fabrics Vital in Parachute Use."Textile World 78, No. 4, 28-30 (26 July 1930). [EngineeringIndex (19 30).)
65. Holgate, B. A., Parachutes and Parachute Materials Used in Germany.F.I.A.T. 465 (P.B. 3882) 1945. [F.I.A.T. Reptr. Office of Tech.Serv., Dept. of Comm., Jan. 1948T.
66. Johns, T. F., Parachutes with an Axial Cord as Well as Cords Overthe Canopy. A.R.C. R & M 2336, 1944.
67. Laroso, P. and Burton, A. C., Parachutes. B.I.O.S. EvaluationRept. 477 Mar. 1946. [Bibliography of Sci. & Ind. Reptr._]
68. Smith, Julian F., Records of Fabrics, Cords and Designs Developedfor Personnel, Cargo and Projectile Parachutes. F.I.A.T. 453 (P.B.3874, 1-388) 1945. EF.I.A.T. Bibliography, Dept. of Commerce]
69. Stevens, G. W. H. and Johns, T. F., The Theory of Parachutes withCords 'over the Canopy. Aero. Res. Council, Tech. Rept. R & M No.2320 (6068), July 1942.
70. U. S. Aeronautical Board, Cloth: Parachute,. Saponified AcetateArmy - Navy - CCC C-491-1 fP.B. 21268].
71. U. S. Bureau of Ordnance, Viscose Rayon Parachute Fabric. NavalOrdnance Spec. 1309, Jan.1944. E.B. 36055]
72. Fluid Meters Report, 4th edition. Am. Soc. Mech. Engrs., New
York, 1947.
WADC TR 52-283 9

Appendix II
COMPARISON OF GEORGIA TECHAND WADC HANDLING OF DATA
WADC TR 52-283 90

COMPARISON OF GEORGIA TECH AND
WADC HANDLING OF DATA
The following remarks are submitted to facilitate the reduction of
GIT data to the manner employed by WADC or vice versa.
1. WADC Technique
The permeability data made available by experiments at WADC is
currently summarized graphically by plotting the quantity versus V p
for each parachute fabric. The definition of each of these quantities
is given in terms of the observed pressure drop imposed across the cloth
to produce a time rate of flow of air--the permeability, 9,--measured.in
cubic feet (at a standard temperature, pressure and relative humidity)
per unit area of cloth exposed to the air flow.
1. Assume that the permeability Pis measured, for example, in ft 3
-i -
sec ft-2, and
2. That the corresponding pressure drop Vp is given in lbf ft 2 .
3. Now define the dynamic head as
q V- P-l2
4. Also define the pressure drop in terms of a velocity of descent,
i.e., in terms of the relative velocity V between a falling para-
chute cloth and still air a great distance from the cloth; viz.,
2
5. In both (3) and (4) is the actual air density in the undisturbed
air; 1 may be assumed constant throughout the field of flow.
The quantity)Rpthen becomes equal to
A 29
WADC TR 52-283 91

The plotting of -q versus the pressure drop Vp results in ap
characteristic variation for a particular cloth.
2. Georgia Tech Technique
The data obtained in the low-pressure tunnel at the Georgia
Institute of Technology are reduced to show the variation of what is
termed the relative porosity with the mass velocity, G, of the air up-
stream of the cloth. The relative porosity is dimensionless, and G is
measured in units of pounds mass per second per square foot of cloth.
Flow data obtained from the orifice permit the calculation of the
mass rate of air flow, M, through the cloth. Given the effective pro-
jected area, A, of the cloth subjected to this air flow, the quantity G
results as the ratio M/A.
Now M must equal the air flow through the cloth; this, in turn, might
be expressed in terms of a product of an effective open area for the cloth,
(a), a corresponding velocity, v, and an air densityPO, viz.,
_¶M - 2av2.
FUrthermore, M has a measure given by a corresponding product AVI, where
(a) is the effective projected area of the cloth sample and V1 is the velo-
city of approach of the air. Thus, the continuity equation becomes
0 av* - 4AV1 .
Under conditions of operation for the low-pressure tunnel ( p . 50 inches
of water), the density # may be taken as a constant; then continuity re-
duces toV av1
VI/V2 is termed the relative porosity in view of the significance of the
ratio a/A. In order to evaluate the relative porosity, V1 and v must be
WADC TR 52-283 92

M Gmeasured. V1 is given by the equation V1 -j and v is arbitrarly
taken asF21 where Vp is the pressure drop across the cloth. Thus,
there results the equalitya V
avI~f
A plot of relative porosity, I vs. mass velocity upstream of the cloth
results in a characteristic variation for each fabric.
3. Comparison
In the case of the independent variables, the WADC data are refer-
enced to the pressure drop vp across the cloth, whereas the Georgia Tech
data are examined as a function of the mass velocity G upstream of the
cloth. The choice of G stems from the fact that upon establishing a char-
acteristic length, L, to describe the geometry of the fabric an immediate
conversion to a Reynolds number would be possible, viz.,
N aGLRe x.
Thus, plotting versus G is in effect plotting versus the Reynolds number,
sinceA is essentially constant for any one test procedure.
Now in the case of the dependent variablesp and a/A, these are
dimensionless and are related in the following manner as can easily be
shownw
where fs is the air density at standard conditions corresponding to WADC
determination and e is that of Georgia Tech determinations. Since the
Georgia Tech data reported includes the density variation, the intercon-
version of data is immediately possible.
Clearly, then, the two methods of handling the low-pressure data are
simply related. The Georgia plot includes the pressure drop variation
(see Low-Pressure Tunnel Air Permeability plot for 10 WADC cloths, Fig. 28)
WADC TR 52-283 93

which appears as the independent variable for the WADC procedure. Further-
more, the Georgia Tech plot is essentially a nondimensional plot. Neither
of these plots, however, is as general as the flow-through-drag coefficient
vs. Reynolds number (Cf, N)Re plot proposed in this report.
WADC 7R 52-283

Appendix III
POROSITY-PERMEABILITY RESULTSFROM THE LOW-PRESSURE TUNNEL
Tabular Summary of Data for Figure 28 . . . . . . . . . 96
Results for Bally Ribbon Cloths . . . . . . . . . . . . 105
WADC TR 52-283 95

Tabular Summary of Data for Figure 28
Static: Pressure Air Density Mass Velocity of RelativeUpstream Upstream Air Upstream Porosityof Cloth of Cloth of Cloth of Cloth
(Inches water) (iba ft.- 3 ) (Ibm sec.'Ift. -2 ) (Per Cent)
Fabric Number 1
50 .0753 2.44 7.740 .0737 2.1 7.5.30. .0721 1.74 7.220 .0702 1.4 6.8615 .0694 1.11 6.6410 .0686 .85 6.3
9 .0683 .8 6.238 .0683 .74 6.1o7 .0680 .68 6.046 .0680 .61 5.885 .0678 .54 5.684 .0675 .467 5.47
Fabric Number 2
50 .0756 2.37 7.440 .0740 2.04 7.2430 .0724 1.7 7.04
. 20 .0707 1.31 6.68S15 .0696 1.08 6.4310 .0688 .84 6.159 .0688 .725 .5.638 .0686 .72 5.937 .0683 .655 5.766 .0683 .60 5.725 o.68 .535 5.514 .068 .458 5.36
Fabric Number 3
50 .075 2.53 8.0440 .0734 2.19 7.8230 .0718 1.85 7.7320 .0704 1.45 7.4815 .0694 1.23 7.3110 .0685 .975 7.199 .0685 .923 7.208 .0680 .858 7.117 .0680 .80 7.106 .o680 .735 7.025 .0675 .635 6.934 .0675 .590 6.933 .0671• .498 6.78
WADC TR 52-283 96"

Tabular Summary of Data for Figure 28 (Continued)
Static Pressure Air Density Mass Velocity of RelativeUpstream Upstream Air Upstream Porosityof Cloth of Cloth of Cloth of Cloth
(Inches Water) (ibm ft.-3) (ibm sec.-Ift.! 2 ) (Per Cent)
Fabric Number 4
50 .0758 1.83 5.7340 .0741 1.59 5.6130 .0724 1.33 5.4820 .0707 1.05 5.3615 .0698 .880 5.2710 .069 .685 5.049 .0688 .640 4.978 .0687 .600 4.957 .0685 .550 4.866 .0684 .500 4.765 .0681 .445 4.674 .068 .390 4.593 .0078 .337 4.56
Fabric Number 5
50 .0755 2.11 6.6740 .0738 1.83 6.5230 .0721 1.53 6.3820 .0704 1.21 6.2815 .0695 1.02 6.1410 .0687 .801 5.929 .0685 .755 5.858 .o684 .70 5.827 .0682 .645 5.726 .068 .585 5.585 .0678 .524 5.524 .0677 .465 5.453 .0675 .393 5..40
Fabric Number 6
50 .0753 3.77 11.840 .0737 3.29 11.730 .0721 2.78 11.520 .0702 2.20 11.315 .0694 1.88 11.310 .0686 1.51 11.1
9 .0683 1.42 11.08 .0683 1.33 11.07 .068 1.24 11.06 .o68 1.14 10.9.5 .0678 1.04 11.0
WADC TR 52-283 97
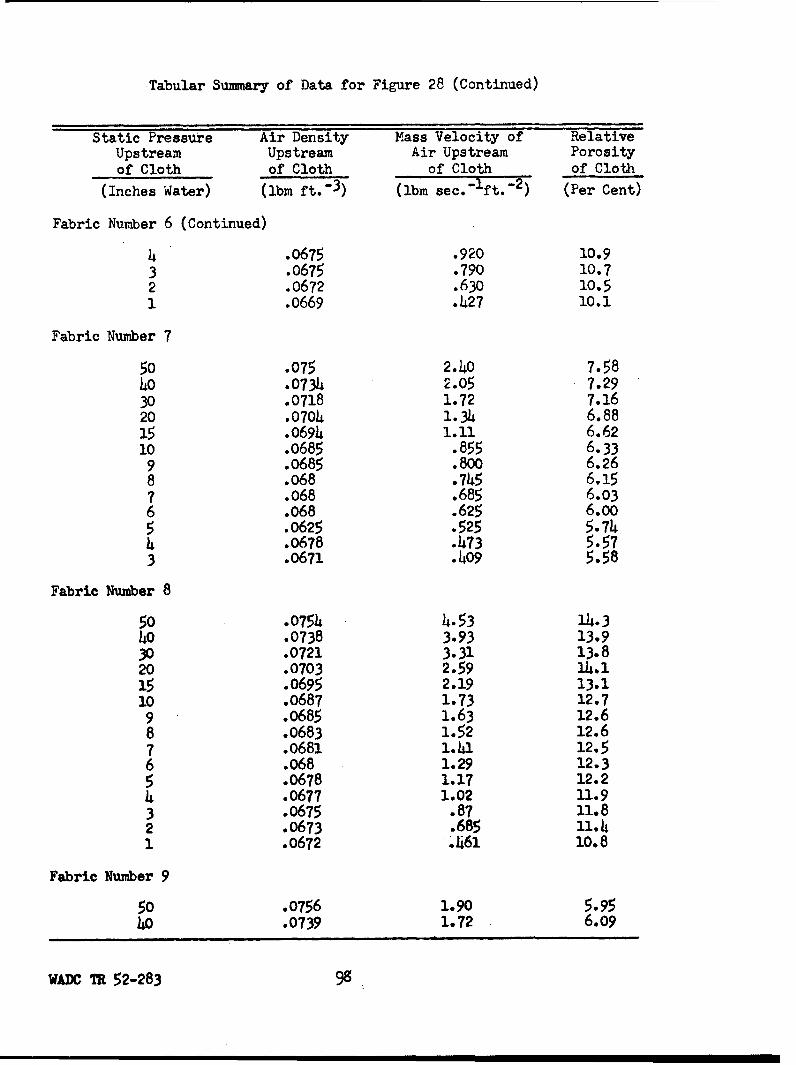
Tabular Summary of Data for Figure 28 (Continued)
Static Pressure Air Density Mass Velocity of RelativeUpstream Upstream Air Upstream Porosityof Cloth of Cloth of Cloth of Cloth
(Inches Water) (lbm ft." 3 ) (ibm sec.-ift.7 2 ) (Per Cent)
Fabric Number 6 (Continued)
4 .0675 .920 10.93 .0675 .790 10.72 .0672 .630 10.51 .0669 .427 10.1
Fabric Number 7
50 .075 2.4o 7.5840 .0734 2.05 7.2930 .0718 1.72 7.1620 .0704 1.34 6.8815 .0694 1.11 6.6210 .0685 .855 6.33
9 .0685 .800 6.268 .068 •745 6.157 .068 .685 6.036 .068 .625 6.005 .0625 .525 5.744 .0678 .473 5.573 .0671 .409 5.58
Fabric Number 8
50 .0754 4.53 14.340 .0738 3.93 13.930 .0721 3.31 13.820 .0703 2.59 14.115 .0695 2.19 13.110 .0687 1.73 12.7
9 .0685 1.63 12.68 .0683 1.52 12.67 .0681 1.41 12.56 .068 1.29 12.35 .0678 1.17 12.24 .0677 1.02 11.93 .0675 .87 11.82 .0673 .685 11.41 .0672 .461 10.8
Fabric Number 9
50 .0756 1.90 5.9540 .0739 1.72 6.09
WADC TR 52-283 98

Tabular Summary of Data for Figure 28 (Concluded)
Static Pressure Air Density Mass Velocity of RelativeUpstream Upstream Air Upstream Porosityof Cloth of Cloth of Cloth of Cloth
(Inches Water) (lbm ft."3) (lbm sec.'Ift.- 2 ) (Per Cent)
Fabric Number 9 (Continued)
30 .0723 1.48 6.1120 .0705 1.18 6.1015 .0697 1.02 6.1110 .0688 .815 5.999 .0687 .765 5.968 .0685 .715 5.917 .0683 .660 5.846 .0682 .600 5.735 .068 .540 5.684 .0678 .468 5.513 .0676 .387 5.23
Fabric Number 10
50 .0760 2.44 7.6340 .0743 2.18 7.7030 .0726 1.86 7.7320 .o7o9 1.51 7.7515 .0701 1.30 7.7310 o0692 1.o6 7.77
9 .0691 1.01 7.828 .0689 .935 7.667 .0687 .875 7.736 .0686 .810 7.705 .0684 .725 7.624 .o682 .640 7.483 .068 .540 7.33
WADC TR 52-283 99

ROR!
14-
co 0
41-2
CH
P4
% 'AISC)d 3Al~l0
WADC_ TR __ 52.28 100

100
m ca4
'm- _ _ _-
coH
0)q
a, C\l
-o
0
C'O 0
a)
CH
WD 0)5223 0

.p
(i2
0
0
co
0
.rd
0
H H
WC 5280
0
-J
WADC~~~ HR5-8 0

4-3
-J HH
CH)0
0 * a0
c0 0
* 0
C\!0 ~0'3
vPr
%N ',US-4d3AiVlI
WADC R 52-83-10

C12
0)
0
0
CHI-
0
% A.LIO~Od AI±Y0
WADC0 T452?

01
0 ________ _______ ________ _____so
0~ ~ ~~v A____ ____ ____ ____ ____
04 C4 -
S 'AISO~d AUVU.
WADC R 52-83 10

to
02
CH
0Lei,0
0(
0-
ILH
_ _ _ __ _m co-
0
00-J 02
I-K
00
-j .P4-
A 0
'Ail9O d 3,4IV13t
WAW'T 52-23 (o

TABLE XI
THE EFFECT OF FILLING THREAD COUNTVARIATION ON RELATIVE POROSITY
SpecificationThread Count
Per Inch Yarn DenierRelative Item MillPorosity Number Style Warp Filling Warp Filling Weave
(20 Inches Water)
17.9 BR-i 7171 138 110 30/10 30/10 Plain16.8 BR-2 7172 " 120
21.5 BR-3 7173 138 110 30/10 30/10 2/1 Twill17.4 BR-4 7174 " 120
18.7 BR-5 7175 138 95 30/10 40/13 Plain15.8 BR-6 7176 " 105
20.8 BR-7 7177 138 95 30/10 40/13 2/1 Twill18.5 BR-8 7178 " 105 " t "
17.7 BR-9 7180 120 95 40/13 40/34 Plain19.2 BR-lI 7181 " 105
17.7 BR-1l 7182 120 95 40/13 40/13 Plain15.4 BR-12 7183 " 105
10.8 BR-13 7184 120 75 40/13 60/20 Plain8.25 BR-14 7185 " 85
10.6 BR-15 7186 120 75 40/13 60/20 2/1 Twill7.72 BR-16 7187 " 85 N " N
11.2 BR-17 7188 100 75 60/20 60/20 Plain7.38 BR-18 7189 " 85 " t "
10.6 BR-19 7190 100 75 60/20 60/20 2/1 Twill7.03 BR-20 7191 " 85 N " "
22 1"* BR-21 1192 90 68 70/34 70/34 2/1 Twill18.4: BR-22 7193 " 78 N N "
22.6* BR-23 7194 90 68 70/34 70/34 2/2 Twill18.7 BR-24 7195 " 78
WADC TR 52-283 107

TABLE XI (Continued)
THE EFFECT OF FILLING THREAD COUNTVARIATION ON RELATIVE POROSIT!
SpecificationThread Count
Per Inch Yarn DenierRelative Item MillPorosit , Number Style Warp Filling Warp Filling Weave20Inches Water)....'...
26.74 BR-29 7209 90 68 70/34 70/34 5 Har. Satin22.3 BR-30 7210 " 78
7.14 BR-31 7211 90 68 70/34 100/34 2/1 Twill4.28 BR-32 7212 " 78
6.25 BR-33 7213 90 68 70/34 100/34 2/2 Twill-4.71 BR-34 7214 " 78
5.48 BR-35 7215 90 68 70/34 100/34 5 Har. Satin3.79 BR-36 7216 " 78
11.9 BR-37 7217 76 57 100/34 100/34 2/1 Twill7.62 BR-38 7218 " 67
9.39 BR-39 7219 76 57 100/34 100/34 2/2 Twill5.81 BR-40 7220 " 67
10.1 BR-45- 7225 76 57 100/34 100/34 5 Har. Satin
6.56 BR-46 7226 " 67 " "
*Interpolated value.
**Extrapolated value.
WADC TR 52-283. 10i

TABLE XII
THE EFFECT OF FILLING THREADDENIER ON RELATIVE POROSITY
SpecificationThread Count
Per Inch Yarn DenierRelative Item MillPorosity Number Style a Filling Warp Filling Weave
(20 Inches Water)
17.7 BR-9 7180 120 95 40/13 40/34 Plain17.7 BR-il 7182 /" " 40/13
19.2 BR-1O 7181 120 105 40/13 40/34 Plain15.4 BR-12 7183 " " 40/13
26.7" BR-29 7209 90 68 70/34 70/34 5 Har. Satin5.48 BR-35 7215 " " 100/34 "
22.3 BR-30 7210 90 78 70/34 70/34 5 Har. Satin3.79 BR-36 7216 " " 100/34
22.1* BR-21 7192 90 68 70/34 70/34 2/1 Twill7.14 BR-31 7211 " " 100/34 "
18.14 BR-22 7193 90 78 70/34 70/34 2/1 Twin4.28 BR-32 7212 " " 100/34
22.6* BR-23 7194 90 68 70/34 70/34 2/2 Twill6.25 BR-33 7213 " " 100/34
18.7 BR-24 7195 90 78 70/34 70/34 2/2 Twill
4.71 BR-34 7214 " " 100/34
*Interpolated value.
"Extrapolated value.
WADC TR 52-283 lo9
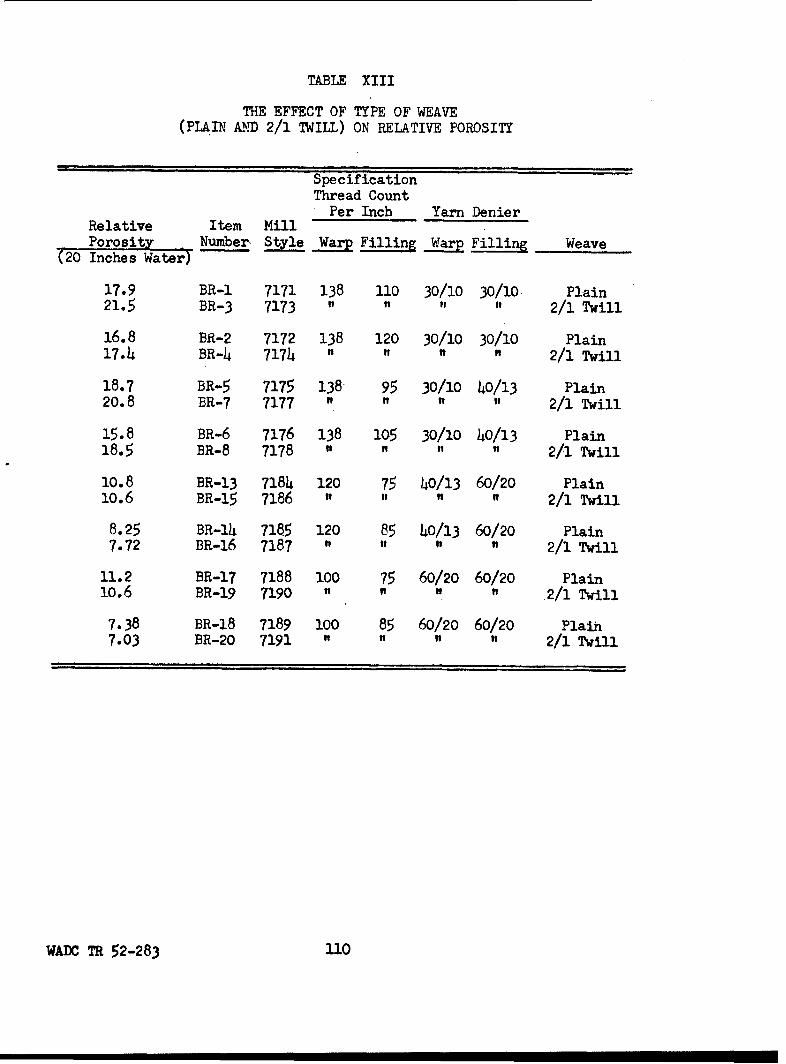
TABLE XIII
THE EFFECT OF TYPE OF WEAVE(PLAIN AND 2/1 TWILL) ON RELATIVE POROSITY
SpecificationThread Count
Per Inch Yarn DenierRelative Item MillPorosity Number Style Warp Filling Warp Filling Weave
(20 Inches Water)
17.9 BR-I 7171 138 110 30/10 30/10 Plain21.5 BR-3 7173 " 2/1 Twill
16.8 BR-2 7172 138 120 30/10 30/10 Plain17.4 BR-4 7174 " " It 2/1 Twill
18.7 BR-5 7175 138 95 30/10 40/13 Plain20.8 BR-7 7177 " it 2/1 Twill
15.8 BR-6 7176 138 105 30/10 40/13 Plain18.5 BR-8 7178 " 1 2/1 Twill
10.8 BR-13 7184 120 75 40/13 60/20 Plain10.6 BR-15 7186 It " 11 2/1 Twill
8.25 BR-14 7185 120 85 40/13 60/20 Plain7.72 BR-16 7187 " " 1 " 2/1 Twill
11.2 BR-17 7188 100 75 60/20 60/20 Plain10.6 BR-19 7190 " " " .2/1 Twill
7.38 BR-18 7189 100 85 60/20 60/20 Plain7.03 BR-20 7191 "I 2/1 Twill
WADC TR 52-283 Ui0

TABLE XIV
THE EFFECT OF TYPE OF WEAVE(2/1 AND 2/2 TWILL) ON RELATIVE POROSITY
SpecificationThread Count
Per Inch Yarn DenierRelative Item MillPorosity Number Style Warp Filling Warp Filling Weave
(20 Inches Water)
22.1" BR-21 7192 90 68 70/34 70/34 2/1 Twill22.6 BR-23 7194 " If f 2/2 Twill
18.4" BR-22 7193 90 78 70/34 70/34 2/1 Twill18.7 BR-24 7195 " If 2/2 Twill
7.14 BR-31 7211 90 68 70/34 100/34 2/1 Twill6.25 BR-33 7213 " " to 2/2 Twill
4.28 BR-32 7212 90 78 70/34 100/34 2/1 Twill4.09 BR-34 7214 " If 2/2 Twill
11.9 BR-37 7217 76 57 100/34 100/34 2/1 Twill9.39 BR-39 7219 " If 2/2 Twill
7.62 BR-38 7210 76 67 100/34 100/34 2/1 Twill5.81 BR-40 7220 " If 2/2 Twill
*Interpolated value.
WADC TR 52-283 111>

TABLE XV
THE EFFECT OF TYPE OF WEAVE(2/1 TWILL AND 5 HARNESS SATIN) ON RELATIVE POROSITY
SpecificationThread Count
Per Inch Yarn DenierRelative Item MillPorosi!- Number Style Warp Filling Warp Filling Weave
T2EIO nes Water) . ......
22.1* BR-21 7192 90 68 70/34 70/34 2/1 Twill26:7 BR-29 7209 5" " 5 Har. Satin
18.4* BR-22 7193 90 78 70/34 70/34 2/1 Twill22.3 BR-30 7210 5" " Har. Satin
7.14 BR-31 7211 90 68 70/34 100/34 2/1 Twill5.36 BR-35 7215 " 5 Har. Satin
4.28 BR-32 7212 90 78 70/34 lO1/34 2/1 Twill3.79 BR-36 7216 " " 5Har. Satin
11.9. BR-37 7217 76 57 100/34 100/34 2/1 Twill10.1 BR-45 7225 " " 5Har. Satin
7.62 BR-38 7218 76 67 100/34 100/34 2/1 Twill
6.56 BR-46 7226 " " 5Har. Satin
*Interpolated value.
+Extrapolated value,
WADC TR 52-283 112

TABLE XVI
TEE EFFECT OF TYPE OF WEAVE(2/2 TWILL AND 5 HARNESS SATIN) ON RELATIVE POROSITY
SpecificationThread Count
Per Inch Yarn Denieritelative Item Mill
Porosity Number Style War Filling Warp Filling Weave(20 Inches Water)
22.6* BR-23 7194 90 68 70/34 70/34 2/2 Twill26.7 BR-29 7209 " 5 Har. Satin
18.7 BR-24 7195 90 78 70/34 70/34 2/2 Twill22.3 BR-30 7210 " 5 Har. Satin
6.25 BR-33 7213 90 68 70/34 100/34 2/2 Twill5.36 BR-35 7215 " " 5 Har. Satin
4.09 BR-34 7214 90 78 70/34 100/34 2/2 Twill3.79 BR-36 7216 " EHar. Satin
9.39 BR-39 7219 76 57 100/34 100/34 2/2 Twill10.1 BR-45 7225 " " 5 Har. Satin
5.81 BR-40 7220 76 67 100/34 100/34 2/2 Twill
6.56 BR-46 7226 " 5 Har. Satin
*Interpolated value.
+Extrapolated value.
WADC TR 52-283 113

Appendix IV
PRESSURE SQUARE GRADIENT-MASS VELOCITY RESULTSFROM THE HIGH-PRESSURE TUNNEL
WADC TR 52-283 1114.

104
I03
cl
z 0C.,
2: 0I-
00
00
x
T 10z
00
wX
101
7Z
(If
U,
10r o'110 10210
MASS VELOCITY UPSTREAM OF CLOTH, LBM SEC-'FT-2
Figure'36. Relation of Pressure Square Gradient to Mass Velocityfor WADC Fabric No. 1.
WADC TR 52-283 115

10 4
103
z
ob
1- 102
w
Cr"I-
m
w
I-
0
, . -_ _ _ _ _ _ _ _ _ _ _ _ _ _ _ __ _ _ _ _ _ _ _
.10"2 I0- 0 02 1O0
MASS VELOCITY UPSTREAM OF CLOTH, LBmSEC`-FT-2
Figure •37e Relation of Pressure Square Gradient to Mass Velocity
for'WADC Pabric No. 2.
WADC TR 52-283 7,36

10 4
z
F- -xF-0
'C
C,
UC,
'0-I@-I
'MASS VELOCITY TUPS~1TR~M OF CO~TH, T-F igure-39. Relation of Pressure Square Gradient to Mass Velocity
f or ýWADC Fabric No.- 3
rWADC TR 52-283 117

104
103
U;
N
W 102
wz
I.-oo
3.I-.a<w
00
0'
n.
Vl 2- .4.57 6+ 11.8G 0z'- 10w
CrC o
Ia
4
10- 2 I0- 1
1I0
102 103
MASS VELOCITY UPSTREAM OF CLOTH, L OM SE C"I FT- 2
Figure .39-?. Relation of Pressure Square Gradient to Mass Velocity
for WAX F~abric No. 4.
WADC TR 52-28311
I•lU lr

104
103
_oo
U) ol,
z
I-
i--
I 0
z
w
_w(9
/ vP =4.8OG + 7.97G
aI
lO"!at 0Id
10"1 1 10 102 103
MASS VELOCITY UPSTREAM OF CLOTH, LBM SEC-'FT- 2
Figure 410. Relation of Pressure Square Gradient to Mass Velocityfor WAfl Fabric No. 5.
WADC TR 52-283 .119

103
wz
z
w
w4ra-
U).0.4G+ AG
010
MASS VELOCITY UPSTREAM OF CLOTH, LBu SEC-'FT- 2
Figure' 41. Relation of Pressure Square Gradient to Mass Velocityfor V00O Fabric No. 6.
WADO TR 52-28312

104
102
q C4
z
z1 0
"I"
I-
I0
-(
0
x
D,,
v P 2= 2.48G + 6.1 -G 2
En,
w
.cr
UI)
Cn,0.
4
0O
10-
10- 1
10
102
103
MASS VELOCITY UPSTREAM OF CLOTH, LB.SEC-iFT-2
Figure 42. Relation of Pressure Square Gradient to Mass Velocityfor WADC Fabric No. 7.
WADC TR 52-283 121

104
103
Z
"r"
I--
,-J
1 -z 00
LIJ
w
uJ
(n(I)
P2.,, 0.670 G * 2.64G
i0"0 0
IO-2 IOr' IO1 10210
MASS VELOCITY UPSTREAM OF CLOTH, LBM SEC-' FT-2
Figure 43. Relation of Pl'essure Square Gradient to Mass Velocityfor WADO Fabri c No. 8.
WADC TR 52-283 122

104
103
wz 10
I-"r"0
z-J_D
LUcr vP?= 1.56G+i 14 .4G?
S
0
w
LLJ0-0,01
MPHRPi
10-2 Io-' I t0 102 10
MASS VELOCITY UPSTREAM OF CLOTH, LBM SEC-'FT-•
Figure 4]4. Relation of Pressure Square Gradient to Mass Velocity
for WADC Fabric No. 9.
WADC TR 52-283 123

104
10 3
w 102z
0I-
z-
0
w
w
U)
w
7P== 1.36G+7.02d'
.-10-=... /
I0-2 10- IO 102 103
MASS VELOCITY UPSTREAM OF CLOTH, LBM SEG-mFT-2
Figure 45. Relation of Pressure Square Gradient to Mass Velocity
for WADC Fabric No. 10.
W.ADC "R 52-283 •.124"I

Explanator7 Note for Table IV
The evaluation of O(and,8 defined by the pressure square gradient
equation 2 [2RCV P2 U 0T r+ l~ .9[~A g o G (12)
was effected in the following manner. (All symbols and units of measure
are shown in Section I, Nomenclature.) The quantities c(' andS' (enu-
merated in Table IV) were defined as
godg 02•R d . (13).
and L . (1o4)
reducing equation (12) to2 2Vp -0('G +8'G. (15)
c< andS' were determined from the data using the three methods for which
the results are indicated in Table IV. Clearly, given O' andA', c(and.0
are determined, and, 8 A0(u4'/e0') as well. HereA( is taken as 1.24 x
10-5 lb ft 1Isec"I and T as 5460 F abs.m
WADC TR 52-283 ,125•

4-1CH4 C~ 0 '0 0 %0 Lc- %0 0%
-~ '0 c:) --- "~ t~ 0 w: U\ -
0 H
0 4'
Q . . 0 0
qH H0 w ~ \C m mLr\ CY CJ CV% (n CY
)oH H
0 0 0% - 0 .0 9
0- V- H0 H- 0: - '0\ '.0
\. 0 0 * 0 r0 _: %0 If 0 (\
I'0 _-j \J.40 C'J 0 H V H 4
04 HH)
a~ UN H0)f
U9 '10 '0(A ~ ~ Uýco 48cZ c;
H4 %0 0 U CJ 0 %00a
%0 ' 4' 10c tl 00 %' 0% %0 ON Y m 0
A. a: H~s 2~ %coH10 % CJ in c - 0 r
-% 0
S04,
IAL~% %0 c
WADC TR 52-283 6