air force institute of technology - dtic.mil 2.1. power in wind ... control many kites closely...
TRANSCRIPT

AIRBORNE WIND ENERGY:
IMPLEMENTATION AND DESIGN FOR THE U.S. AIR FORCE
THESIS
Troy L. Cahoon, BSE
Captain, USAF
AFIT/GAE/ENY/11-M04
DEPARTMENT OF THE AIR FORCE AIR UNIVERSITY
AIR FORCE INSTITUTE OF TECHNOLOGY
Wright-Patterson Air Force Base, Ohio
APPROVED FOR PUBLIC RELEASE; DISTRIBUTION UNLIMITED

The views expressed in this thesis are those of the author and do not reflect the official
policy or position of the United States Air Force, Department of Defense, or the United
States Government. This material is declared a work of the U.S. Government and is not
subject to copyright protection in the United States.

AFIT/GAE/ENY/11-M04
AIRBORNE WIND ENERGY:
IMPLEMENTATION AND DESIGN FOR THE U.S. AIR FORCE
THESIS
Presented to the Faculty
Department of Aeronautics and Astronautics
Graduate School of Engineering and Management
Air Force Institute of Technology
Air University
Air Education and Training Command
In Partial Fulfillment of the Requirements for the
Degree of Master of Science in Aeronautical Engineering
Troy L. Cahoon, BSE
Captain, USAF
March 2011
APPROVED FOR PUBLIC RELEASE; DISTRIBUTION UNLIMITED

AFIT/GAE/ENY/11-M04
AIRBORNE WIND ENERGY:
IMPLEMENTATION AND DESIGN FOR THE U.S. AIR FORCE
Troy L. Cahoon, BSE
Captain, USAF
Approved:
____________________________________ ________
Frederick G. Harmon, Lt Col, USAF (Chairman) Date
____________________________________ ________
Dr. Mark F. Reeder, AFIT (Member) Date
____________________________________ ________
Dr. James A. Menart, Wright State University (Member) Date

iv
AFIT/GAE/ENY/11-M04
Abstract
Excitement among researchers about Airborne Wind Energy (AWE) technology
matches DoD aims to advance and employ renewable energy. AWE seeks to cost-
effectively tap the vast supply of wind energy available at altitudes high above the reach
of conventional, ground-based wind turbines (e.g. 500-12,000 m). This paper explores
the viability and implementation of AWE technology for fulfilling USAF energy needs.
The characteristics, potential, and developmental status of the AWE resource are
presented. A design tool for a rotor-based AWE system is developed, facilitating the
analysis of blade performance to simplify design and provide the best efficiencies for a
range of conditions. USAF bases are evaluated based upon energy needs, design
requirements, and other factors to determine which bases could benefit most from AWE.
Bases most viable for an AWE project, with 75% potential savings on energy costs per
base (up to $40M annually for larger bases), are: Tinker, Vance, Wright-Patterson,
Arnold, Ellsworth, and Grand Forks. Key results reveal it is possible to achieve notable
benefits for the USAF using AWE technology.

v
Acknowledgments
First, I would like to thank my Heavenly Father for my wonderful family and all
of the opportunities that he has given us, including the chance to study here at AFIT. I
would also like to thank my beautiful wife Heidi for her love, encouragement, patience,
and for her excellent work to help me edit this document and many other assignments.
She lovingly helps and encourages me to look, sound, and be professional. I also thank
Lt. Colonel Frederick Harmon for his exceptional guidance and feedback, and for
encouraging me and for keeping me on pace to make this work the superb research that it
is. He has been great at providing a challenge while maintaining a good life balance. I
thank Dr. James Menart for inspiring me with this interesting topic and for his help and
interest in this work. I also thank the many other professors and mentors that have given
me tips and guidance that have helped me to become the engineer and officer that I am
today. And I cannot forget to thank my boys, Joshua and Evan, for loving me even
though I have not been able to play with them as much as they would like because I have
been at ―school-work!‖
Troy Cahoon

vi
Table of Contents
Page
Abstract .............................................................................................................................. iv
Acknowledgments................................................................................................................v
Table of Contents ............................................................................................................... vi
List of Figures .................................................................................................................... ix
List of Tables .................................................................................................................... xii
List of Abbreviations ....................................................................................................... xiii
Nomenclature ................................................................................................................... xiv
I. Introduction ..................................................................................................................1
1. Background .........................................................................................................1
2. Motivation ...........................................................................................................4
3. Problem Statement ..............................................................................................6
4. Research Objective ..............................................................................................6
5. Research Scope ...................................................................................................7
6. Methodology .......................................................................................................7
7. Thesis Overview ..................................................................................................8
II. Literature Review .........................................................................................................9
1. Chapter Overview ...............................................................................................9
2. Characteristics of the Airborne Wind Energy Resource ...................................10
2.1. Power in Wind ........................................................................................... 10
2.2. Planetary Boundary Layer ......................................................................... 11
2.3. Jet Streams & Global Wind Patterns ......................................................... 13
2.4. Capacity Factor .......................................................................................... 21
3. Advantages and Challenges for Airborne Wind Energy Systems.....................22
4. Overview of Specific Types of Airborne Wind Energy Systems .....................26
4.1. Rotor Concept ............................................................................................ 26
4.2. Kite Concept .............................................................................................. 30
4.3. Balloon Concept ........................................................................................ 36

vii
5. Important Component Studies ...........................................................................39
5.1. Electric Generators .................................................................................... 39
5.2. Rotors......................................................................................................... 41
6. Literature Review Summary .............................................................................42
III. Methodology ..............................................................................................................45
1. Chapter Overview .............................................................................................45
2. Design Tool for AWE Blade Design.................................................................47
2.1. High-Altitude Wind Properties .................................................................. 49
2.2. Design Parameters ..................................................................................... 52
2.3. Optimum Wind-Rotor Blade Design ......................................................... 54
2.4. General Blade Shape Performance ............................................................ 59
2.5. Automated Calculations ............................................................................ 62
2.6. Keeping the AWE System Airborne ......................................................... 64
3. Base AWE System Feasibility ..........................................................................67
3.1. Base Vulnerability ..................................................................................... 67
3.2. Local AWE Power Density ....................................................................... 68
3.3. Space Available ......................................................................................... 72
3.4. Energy and Cost Savings ........................................................................... 77
3.5. Base AWE Feasibility Methodology Summary ........................................ 79
IV. Analysis and Results ..................................................................................................80
1. Design Tool for AWE Blade Design.................................................................80
2. USAF Base AWE System Feasibility ...............................................................90
2.1. USAF Base AWE Feasibility Category Results ........................................ 91
2.2. Results: Overall Best USAF Base AWE Feasibility Scores...................... 96
3. Preliminary USAF Base AWE System Design and Performance.....................99
V. Conclusions and Recommendations .........................................................................103
1. Conclusions of Research .................................................................................103
2. Recommendations for Future Research ..........................................................106
Appendix A: Design Tool Screen Shots .........................................................................108
Appendix B: USAF Base Feasibility Study Data ...........................................................114

viii
References ........................................................................................................................120
Biography .........................................................................................................................123

ix
List of Figures
Page
Figure 1. Planetary boundary layer shear profile15
......................................................... 12
Figure 2. Wind-speed variation as a function of altitude; this data is based on the
average European wind speed of 3 m/s at ground level16
.......................................... 13
Figure 3. A typical jet stream pattern, with two jet streams per hemisphere17
............... 14
Figure 4. Wind power density (kW/m2) that was exceeded 50%, 68%, and 95%
of the time during 1979-2006 at 80 m (top left) 1,000 m (top right) 5,000 m
(bottom left) and 10,000 m (bottom right)13
.............................................................. 16
Figure 5. Optimal wind power density (kW/m2, left panels) and optimal height
(km, right panels), exceeded 50%, 68%, and 95% of the times during years in
1979-200613
............................................................................................................... 17
Figure 6. Map of U.S. average annual wind power densities at heights of 10 m &
50 m18
......................................................................................................................... 19
Figure 7. Wind power density (kW/m2) that was exceeded 5%, 32%, 50%, 68%,
and 95% of the time as a function of altitude; profiles at the five largest cities
in the world, shown in (b-f); the global average profile (a) is the area
weighted mean at all grid points13
............................................................................. 20
Figure 8. Photograph of early two-rotor prototype in flight10
......................................... 26
Figure 9. High strength low weight cables by Applied Fiber20
...................................... 27
Figure 10. Artist’s rendering of Sky WindPower Corporation’s planned 240 kW
four-rotor AWE generation system called the Flying Electric Generator
(FEG)10,14
................................................................................................................... 30
Figure 11. KE-yoyo (Kite Energy) configuration cycle: traction (solid) and
passive (dashed) phases; the kite is kept inside a polyhedral space region
whose dimensions are (a × a × Δr) meters, which allows users to stack and
control many kites closely together9 .......................................................................... 31
Figure 12. Comparison between wind turbines and airfoils in energy production;
in wind towers, limited blade portions (red) contribute predominantly to
power production; the kite acts as the most active portions of the blades,
without the need for mechanical support of the less active portions and the
tower16
........................................................................................................................ 32
Figure 13. KE-yoyo small-scale prototype operating near Torino, Italy9 ....................... 32

x
Figure 14. Scheme of the kite steering unit; the kite steering unit, which provides
automatic control for KiteGen, includes the electric drives, drums, and all of
the hardware needed to control a single kite16
........................................................... 33
Figure 15. Kite Gen21, 24
.................................................................................................. 34
Figure 16. The Magenn Air Rotor System (MARS)11
.................................................... 36
Figure 17. Implementation concepts for the Magenn Air Rotor System
(MARS)11
................................................................................................................... 38
Figure 18. Kite and rotor combination concept by Joby Energy26
................................... 39
Figure 19. Sky WindPower’s Flying Electric Generator (FEG)14
.................................. 47
Figure 20. Summary of the AWE system design process ............................................... 49
Figure 21. Blade geometry5 ............................................................................................ 54
Figure 22. Chord shape comparison for an optimum design blade and a
simplified constant chord blade with a 50 m diameter and a 5 m hub diameter ....... 58
Figure 23. Sikorsky SC1095 rotorcraft airfoil33
.............................................................. 65
Figure 24. Optimal wind power density (kW/m2, left panels) and optimal height
(km, right panels) that were exceeded 50%, 68%, and 95% of the time during
years in 1979-200613
.................................................................................................. 69
Figure 25. Screen shots from the High-Altitude Wind Power Atlas;13
zoomed in
on the U.S. from left to right, are the 50th, 68th, and 95th percentile power
densities ..................................................................................................................... 70
Figure 26. Google Earth view of the U.S., with a High-Altitude Wind Power
map overlay; the red paddle icons indicate the locations of the bases being
evaluated; the image overlay in this shot is for the 68th percentile wind power
density ........................................................................................................................ 70
Figure 27. Color key for the High-Altitude Wind Power map in kW/m2 ....................... 71
Figure 28. Map of 2009 population density by county for the U.S. (U.S. Census
Bureau)36
.................................................................................................................... 74
Figure 29. Airline route maps overlaid on a Google Earth map of the U.S.;
airline routes shown are from Airline Route Mapper data from December
2010.37
........................................................................................................................ 75

xi
Figure 30. Screen shot of air traffic over two USAF bases, taken at an eye
altitude of 200 miles; left is Grand Forks AFB, ND, and on the right is
Wright-Patterson AFB, OH ....................................................................................... 76
Figure 31. U.S. residential average price of electricity (kWh) for 200938
...................... 79
Figure 32. Blade chord shape, as a function of the radius .............................................. 82
Figure 33. Blade twist angle, as a function of radius ...................................................... 82
Figure 34. Sample size, diameter, and rated power for ground-based wind
turbines5 ..................................................................................................................... 87
Figure 35. USAF base AWE feasibility study results ..................................................... 94
Figure 36. AWE feasibility scores for the top six USAF bases; Hanscom (ranked
12th
overall) was also added for comparison, since it had the highest power
density score .............................................................................................................. 96
Figure 37. Comparison of the projected average cost of energy from several
sources, based on data from the ―High-Altitude Wind Power Generation‖9 ........... 100
Figure 38. Estimated power density operating time distribution .................................. 101
Figure 39. Design tool screen shot of optimal blade design calculations ..................... 108
Figure 40. Design tool screen shot of simplified blade design calculations (Part 1) .... 109
Figure 41. Design tool screen shot of simplified blade design calculations (Part 2) .... 110
Figure 42. Design tool screen shot of atmosphere density calculations ....................... 111
Figure 43. Design tool screen shot of thrust and lift capacity calculations .................. 112
Figure 44. Design tool screen shot of USAF base AWE cost and energy savings
calculations .............................................................................................................. 113

xii
List of Tables
Table 1. Capacity factor table for U.S. locations14
.......................................................... 22
Table 2. Comparison based on estimates of the cost of energy per MWh9 ..................... 35
Table 3. Calculation constants ........................................................................................ 50
Table 4. Optimum blade sample results for a 50 m diameter blade ................................ 59
Table 5. Constant chord, no twist blade calculations ...................................................... 66
Table 6. Population Density Score key ........................................................................... 73
Table 7. Air Traffic Density Score Key .......................................................................... 76
Table 8. Air Force Base Air Traffic Density Ranking and Scores .................................. 77
Table 9. Optimized blade shape performance ................................................................. 85
Table 10. Constant chord, no twist blade performance ................................................... 85
Table 11. Constant chord, 6° linear twist blade performance ......................................... 86
Table 12. Airborne Wind Energy (AWE) USAF base feasibility decision matrix ......... 93
Table 13. Base AWE project design ............................................................................... 99
Table 14. USAF base electricity consumption data for 2007 ....................................... 114
Table 15. USAF base AWE feasibility study category rankings .................................. 119

xiii
List of Abbreviations
AFB Air Force Base
AFIT Air Force Institute of Technology
AFRL Air Force Research Labs
AWE Airborne Wind Energy
DoD Department of Defense
FAA Federal Aviation Administration
FEG Flying Electric Generator
OSD Office of the Secretary of Defense
RPM Rotations per Minute
U.S. United States
USAF United States Air Force
WPAFB Wright-Patterson Air Force Base
Wright-Patt Wright-Patterson Air Force Base

xiv
Nomenclature
Symbol Description (Units)
a Axial induction factor (m2)
a’ Angular induction factor (m2)
A Area (m2)
Aeff Effective area (m2)
B Number of blades
c Chord length
Cd Coefficient of drag
Cl Coefficient of lift
Cp Coefficient of power
CT Coefficient of thrust
D Diameter of blade
Dh Hub diameter of rotor
f Frequency
F Tip loss factor
g Gravity (m/s2)
h Altitude (m)
i Current (A)
IR Generator rotor current (A)
Is Generator stator current (A)
J Advance ratio
l Length of blade
ls Length of blade station
Lapse Lapse rate (K/m)
L Lift force (N)
m Mass (kg)
M Mach number
Mair Molar mass of dry air (kg/mol)

xv
n Rotational speed
N Number of blade stations
ns Generator synchronous speed
P Power (W)
Pgin Mechanical power input into generator (W)
Pgout Generator power output (W)
Pmechloss Mechanical power losses (W)
Po Sea level pressure (Pa)
Poles Number of generator poles
Prout Generator rotor power output (W)
Pwind Power available in the wind (W)
Q Torque (Nm)
r Blade station radius (m)
R Rotor radius (m)
Re Reynolds number
RR Resistance in generator rotor (Ω)
Rs Resistance in generator stator (Ω)
Ru Universal gas constant (J/mol-K)
S Slip of generator
T Thrust (N)
To Sea level standard temperature (K)
TVertical Vertical component of thrust (N)
U Wind velocity (m/s)
Urel Relative wind velocity (m/s)
v Voltage (V)
Vs Speed of sound (m/s)
W Weight (N)
α Angle of attack
ΔAbs Blade station swept area
ΔCp Blade station power coefficient

xvi
ΔCTr Blade station local coefficient of thrust
Δλr Blade station tip speed ratio
η Efficiency
ηgen Electric motor efficiency
ηmech Mechanical efficiency
ηprop Propeller efficiency
ηrot Wind-rotor efficiency
γ Specific heat ratio for air
λ Tip speed ratio
λmaxPower Maximum power tip speed ratio
μ Dynamic viscosity
μo Reference air viscosity (kg/m-s)
ω Wake rotational speed (rad/s)
Ω Blade rotational speed (rad/s)
φ Angle of relative wind
ρ Density (kg/m3)
σ’ Local solidity
θ Rotor axis angle
θp Section pitch angle
θp,o Blade pitch angle
θT Section twist angle
θTroot Total twist angle at blade root
%A Blade station percent of total blade swept area
%Cp Blade station percent of total power contribution

1
AIRBORNE WIND ENERGY:
IMPLEMENTATION AND DESIGN FOR THE U.S. AIR FORCE
I. Introduction
1. Background
Since the 1980’s, the United States’ Department of Defense (DoD) has had
pressure put upon them to shift away from oil-based energies. Now, Congress and the
White House are demanding an even more efficient use of energy to reduce the nation’s
reliance on imported oil. Specifically, The Defense Authorization Act of 2007 calls for
no less than 25% of DoD total energy needs to come from renewable sources by the year
2025. ―If the DoD were a state, it would rank between the 35th
and 36th
largest states,
based on total electricity consumption.‖ 1 The DoD is indeed under realistic demands to
come up with viable renewable energy solutions.1
There are several key points that drive the need for the DoD to invest in
renewable energy. These driving factors fall into three categories: security, economics,
and the environment. Addressing security, it is important to diversify the U.S. energy
supply, reduce or eliminate U.S. dependence on foreign sources of oil, and eliminate
vulnerabilities in U.S. supply lines for fuel. Economic driving factors include the need to
reduce costs of energy and make energy available in remote areas. Environmental
interests incorporate the desire to lead the world in developing clean energy while
exploring renewable energy sources to the point that these resources can sustain the
country and the world.2

2
Diversifying our energy supply is important so that the U.S. will be less
vulnerable to energy politics and shortages. ―We must transform the way we use
energy—diversifying supplies, investing in innovation, and deploying clean energy
technologies. By doing so, we will enhance energy security, create jobs, and fight
climate change.‖2 Having a diverse energy supply will ensure that there is no single point
of failure in the country’s energy.
As long as the U.S. is dependent on other countries for energy, the threat of one or
multiple countries boycotting or withholding resources from the country exists;
realistically, the fight for energy could create a disastrous situation for the U.S.
Consequently, the government and DoD are well aware of how energy affects our
economy. The 2010 National Security Strategy states:
Meanwhile, the nation that leads the world in building a clean energy
economy will enjoy a substantial economic and security advantage. That is why
the Administration is investing heavily in research…promoting developments in
energy, and expanding international cooperation. As long as we are dependent on
fossil fuels, we need to ensure the security and free flow of global energy
resources. But without significant and timely adjustments, our energy
dependence will continue to undermine our security and prosperity. This will
leave us vulnerable to energy supply disruptions and manipulation….2
Oil is the largest energy concern for the U.S., with about 60% of its oil being
imported from other countries.3 Oil is such an intrinsic part of U.S. energy needs…could
the U.S. imagine life without oil? Many products including gasoline, lubricants, plastic,
and paints are each made from oil. The country would come to a screeching halt in a
matter of weeks if oil supplies were cut off, since the U.S. economy is set up to be so
dependent upon oil and its daily use.

3
Decreasing dependence upon oil would simultaneously benefit the DoD by
eliminating vulnerabilities in its supply line: ―The generation, storage, and distribution of
energy on the battlefield have always been essential to sustaining military operations.‖4
A recent study indicated that 70% of convoys in Iraq were for transporting fuel; these
fuel supply lines continue to be potential, visible targets for enemy combatants. A goal
of military logisticians could be to reduce that vulnerability by bringing actual sources of
energy with them, not just generators that need continual refueling.4
Another aspect of U.S. energy that applies directly to the DoD is the need to use
energy that pre-exists and is available in remote areas. On many levels, it would be most
beneficial to the DoD (saving time, money, and resources) if they could bring with them
some method to harness energy from resources that are available locally, at the remote
location. High-altitude wind power is one possible resource, available at virtually all
locations across the globe. This energy supply would be perfect for the military to use
because they often find themselves deploying to locations with un-established or
inadequate infrastructures for bringing in fuel and energy.
The DoD recognizes the importance for the U.S. to lead the world in developing
clean energy: ―The United States has a window of opportunity to lead in the development
of clean energy technology. If successful, the United States will lead in this new
Industrial Revolution in clean energy that will be a major contributor to our economic
prosperity.‖2 The security of the U.S. is dependent upon the economy of the country.
Therefore, it is important that the U.S. lead economically to support a secure nation and
continue to endorse security for the world. The DoD requires the means to accomplish

4
the U.S. national security strategy, implementing anything the country needs to do, and
developing clean energy is vital to doing this.
Exploring renewable energy sources to the point that they can sustain the country
and the world is the only way that 25% of DoD needs will be met by the year 2025.1
This must be done by finding innovative ways to make renewable energy sources, such as
wind power and solar power, competitive economically with traditional energy sources
such as coal, oil, and natural gas. If the U.S. has already made the transition to using
renewables, sustaining the country will be possible because renewable energy is
renewable—the U.S. will no longer have to worry about the depletion of fossil fuels, and
can set other developmental and security goals.
2. Motivation
The DoD’s mission to reduce dependence on imported oil makes exploring
Airborne Wind Energy (AWE) a timely idea for helping to realize these goals. Just in
recent years, harnessing wind power has started to come into maturity with technology so
that it can now be a competitive energy. Wind power developed in several areas before
even being considered a useful source of energy to the U.S. Developments included
creating and enhancing the technology for efficient wind energy conversion, researching
and forming materials (like carbon fiber blades), and improving wind power reliability
while reducing maintenance costs. In 1981, the low reliability of wind turbines led to
under 20% operational availability for these turbines in the U.S. But in a short amount of
time, wind turbines managed to increase their availability up to the high 90th
percentile.5

5
However, now that ground-based wind power is reaching a peak and
advancements are leveling off, it has become difficult to significantly improve the cost-
effectiveness of wind power unless someone makes a new leap in the technological
approach used to harness wind energy. One innovative way to make a new leap in wind
power technology would be to encourage the DoD to look into, and use, the winds at
higher altitudes, where vastly more energy is available. Ground-based wind power has
proven that it can be competitive with other energy sources when the price of energy is
high. However, if the technology of AWE is advanced to the point where it is cost-
effective and competitive at any energy price, then this would greatly benefit the DoD,
citizens, utilities, and the U.S. Thus, the future of the country is dependent on utilizing
and enhancing such resources as AWE technology.
Airborne Wind Energy has many interesting attributes that could lead to a
potential solution for many of the energy issues that the U.S. faces. AWE is a means to
have energy on demand at a remote location, without dependence upon a supply line.
AWE is available almost everywhere in the entire world. The leap and potential for
energy availability, and the consistency at which this energy can be tapped, is very far-
reaching. It is possible that continued development in technology for wind power could
push this energy into being fully competitive with fossil fuels. This source of energy
could do wonders for the U.S. economy and domestic energy security. AWE has the
ability to supplant traditional energy sources on its own, without subsidy. And
streamlined AWE could meet all of the DoD’s national security goals described.

6
3. Problem Statement
Since the desire to develop renewable energy is so vital to the United States for
the security of the nation economically and militarily, this thesis explores the potential,
implementation, and viability of AWE technology for fulfilling DoD needs, specifically
those of the USAF.
4. Research Objective
The ―DoD faces three key challenges in meeting the renewable energy goals.
First, renewable energy projects may sometimes be incompatible with installation’s need
to use land for primary mission objectives…Second, renewable energy is often more
expensive than nonrenewable energy…Third…the use of private sector approaches can
be constrained…By addressing these challenges, DoD would strengthen its ability to
fully realize the potential of its renewable energy resources, improving its chances of
meeting the goals in the most cost effective way.‖6 This research will work towards
overcoming these DoD challenges for using renewable energy by advancing AWE
technology. The thesis will build on the AWE research that has already been done by
civilian researchers so that it may be utilized by the DoD.
The specific objectives of this research are, first, to increase the awareness of
AWE technology and the potential benefits that it could provide for the USAF and for the
DoD. Second, to advance the AWE technology with the development of a design tool
that can be used to develop a rotor-based AWE system to efficiently harness wind energy
to meet the renewable energy goals of the Department of Defense. Third, to conduct
feasibility study to evaluate which USAF bases would provide the best chance for

7
successfully implementing an AWE project. Combining the results of the second and
third objectives will also provide some insights on the potential energy production and
benefits that an AWE system can provide for the best USAF base candidates.
5. Research Scope
This research focuses on the potential benefits of AWE for the USAF, as well as
on the aerodynamics and performance of an AWE system. The scope of the research
does not include a detailed structural analysis of an AWE system. A detailed design of
the controls and other subsystems of an AWE system will also be left for future research.
6. Methodology
The development and the current status of AWE technology were reviewed, to
include exploration of the potential advantages of the AWE wind resource and the
challenges AWE presents. In addition, some of the main concepts currently being
pursued by researchers and industry for harvesting AWE were examined.
The methodology of this paper focuses on the achievement of two main
objectives: to realize the best power production and efficiency for an AWE system, and
to identify critical USAF base candidates that would benefit the DoD most from AWE.
To accomplish the first objective, a design tool was created that would technically
analyze and compare an idealized wind turbine rotor blade to more simplified versions,
and then enable a comparison of the performance of the different blade designs. Sample
results are produced using the design tool, and these results are then analyzed for trends
that can help designers achieve the best balance of performance, reliability, and cost in
the AWE systems they design. Then, in order to realize the second objective, a USAF

8
base AWE feasibility decision matrix was created. The decision matrix provides a
standard tool used to evaluate and compare which USAF bases are most feasible and
likely to succeed using AWE projects to accomplish the energy needs of the DoD while
fulfilling the goals of the National Security Strategy.2
Finally, the energy requirements of the USAF base locations that were discovered
to be the best suited for AWE projects were analyzed. For each of the best base
locations, basic estimates for AWE system efficiency, performance, and design
requirements were produced and are presented.
7. Thesis Overview
Chapter II of this thesis reviews applicable theory from influential research and
contemporary literature. Chapter III discusses the specific methodology used to
accomplish the research objectives. Chapter IV provides results from the design tool, and
presents analysis of the research. Chapter V relates conclusions drawn from the analysis,
and makes recommendations for future AWE research.

9
II. Literature Review
1. Chapter Overview
People across the world are working on innovative solutions to the never-ending
quest for cheaper and cleaner energy. One promising solution that could fit the cheaper
and cleaner categories is wind power. The advantages of wind power include: wind is
clean, wind has no emissions, wind is locally available, wind is domestically sustainable,
and the land around wind turbines is usable. There have been significant improvements
in the efficiency and reliability of wind power technology in recent years. It is important
for this thesis to study the evolution of and innovations that have occurred in the field of
wind power. This history will provide a foundation of knowledge that can be built upon
as an AWE system is created.
Some researchers are currently studying the possibility of utilizing the higher
wind speeds at altitudes higher than ground-based wind turbines can reach. The idea of
harnessing Airborne Wind Energy is not new. There has been considerable research
done, dating back to the 1970’s. There is also an Airborne Wind Energy Consortium,7
which holds a yearly conference,8 where researchers and interested investors come
together to make connections and share innovative ideas for advancing AWE systems.
Several researchers have built and tested AWE prototypes, and in some cases are close to
AWE system production.9-11
Tapping into these higher altitude winds will have many advantages and
challenges—this chapter will discuss four main aspects of this research. First, the
characteristics of the high-altitude wind resource are explored. Next, some of the

10
advantages and challenges related to accessing this high-altitude power are discussed.
Then, three of the current implementation concepts for harvesting AWE will be
described, compared, and contrasted. Finally, the main components that will be used in
the AWE system, like the generator and rotors, are investigated. Understanding these
components will help to fulfill the thesis goals to build an AWE design tool and analyze
the feasibility of using an AWE system to meet the energy needs of the DoD on an U.S.
Air Force base.
2. Characteristics of the Airborne Wind Energy Resource
2.1. Power in Wind
The most important part to exploiting the wind’s power is first understanding the
wind resource and how much energy it offers. The equation for power available in wind
(Equation 1) is given in Wind Power Explained:5
(1)
Where ρ is the air density, A is the cross-sectional area of the wind being considered, and
U is the wind speed. The important features of this equation, when comparing wind
power harvesting on the ground with wind harvesting at higher altitudes, are density and
wind velocity. Air density decreases with increased altitude. Wind velocity tends to
increase with altitude. The wind power equation shows that wind speed is extremely
important to the amount of power produced because power is a function of wind velocity
cubed. The magnitude of this effect is seen when considering that if wind speed is
doubled, this results in eight times more power (23 = 8)! This large dependence on wind

11
speed is the driving factor for many as they attempt to increase wind power production by
seeking to tap the winds at higher altitudes.5
The reduction in power due to the density drop with altitude also needs to be
considered. Wind power generation is regarded as high-altitude at altitudes above what
can normally be harvested by a ground-based wind turbine. Common large-scale wind
turbines are about 80 m in tower height, so Airborne Wind Energy can be from about 200
m to about 16,000 m. Jet streams tend to be the strongest between 6,000 m and 12,000
m. The density of air drops from 1.224 kg/m3 at sea level to 0.413 kg/m
3 at 10,000 m.
This density (at 10,000 m) is a third of the sea level density; thus, the power produced at
a given wind speed at 10,000 m would be a third of the power produced by the same
wind turbine at sea level. The change in density is approximately linear with altitude.
So, at lower altitudes the effect of density changes with altitude is fairly small. At 1,000
m, the density drops to 1.111 kg/m3; which is only a reduction of 9% from the density at
sea level.12, 13
2.2. Planetary Boundary Layer
The wind resource at ground level is limited for a few reasons. The contours of
the land, and large features like hills, buildings, etc., can block the wind and reduce the
locations available for effective wind power production. Wind close to the ground is also
affected by the planetary boundary layer (Figure 1). This is a phenomenon where the air
at the ground has zero velocity and, because of shear forces, there is greatly reduced wind
speed close to the ground when compared to wind in the free stream far away from the
earth’s surface. This boundary layer can range between a few hundred meters to 2 km
high, depending on atmospheric conditions and the roughness of the terrain.14

12
Figure 1. Planetary boundary layer shear profile15
As is seen in Figure 1, if the wind power generation system can access winds that
are not affected by the worst part of the planetary boundary layer, this will provide much
higher mean wind speeds. The main advantage of using high-altitude winds at altitudes
from 1,000-2,000 m is that an AWE generation system can then access the higher energy
available. Figure 2 shows that the average wind speeds for Europe are about 3 m/s at low
altitudes where ground-based wind turbines can reach. But up at 1,000 m, the average
wind speed of the wind power being extracted is essentially tripled to 9 m/s. Moreover,
up to 2,000 m, the average wind speed continues to increase to 10 m/s, instead of the 3
m/s being harnessed at ground level. Again, considering the power that a wind
generation system can extract is a function of wind velocity cubed. This means a huge
increase in power, even for these relatively lower high-altitudes (for example, tripled
wind speed gives 33
= 27 times more power).16
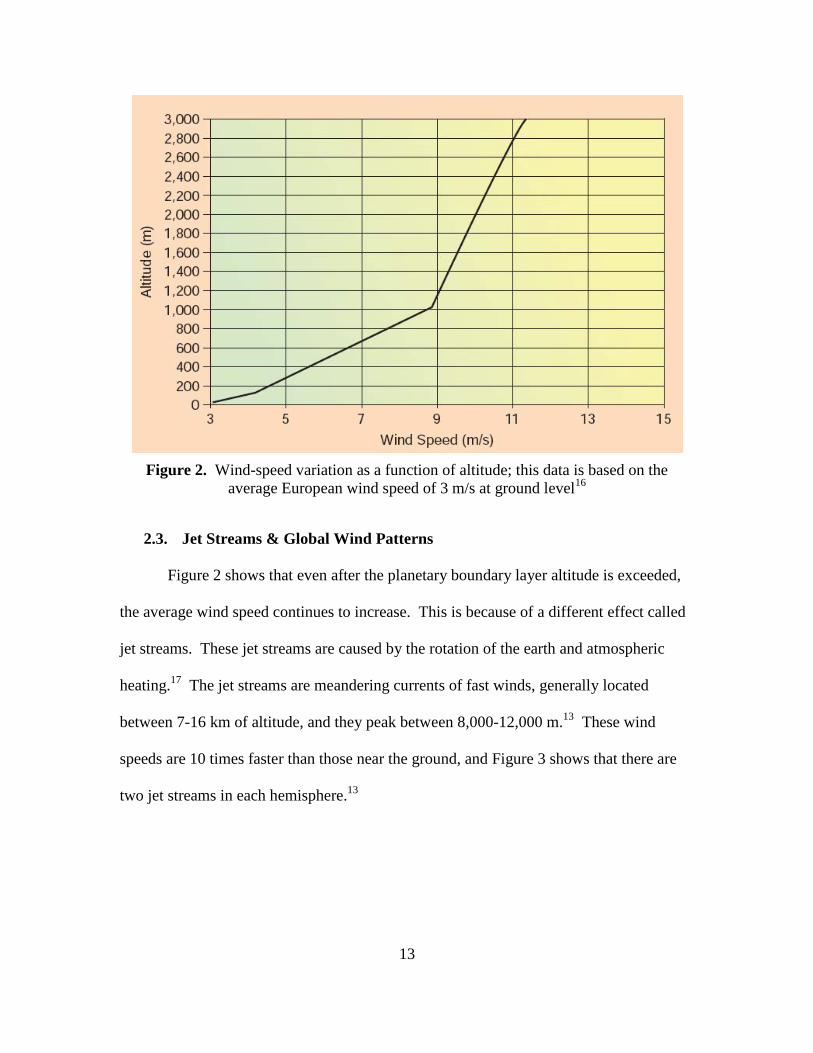
13
Figure 2. Wind-speed variation as a function of altitude; this data is based on the
average European wind speed of 3 m/s at ground level16
2.3. Jet Streams & Global Wind Patterns
Figure 2 shows that even after the planetary boundary layer altitude is exceeded,
the average wind speed continues to increase. This is because of a different effect called
jet streams. These jet streams are caused by the rotation of the earth and atmospheric
heating.17
The jet streams are meandering currents of fast winds, generally located
between 7-16 km of altitude, and they peak between 8,000-12,000 m.13
These wind
speeds are 10 times faster than those near the ground, and Figure 3 shows that there are
two jet streams in each hemisphere.13

14
Figure 3. A typical jet stream pattern, with two jet streams per hemisphere17
Because of these jet streams, all of the wind above the boundary layer continues
to increase in speed gradually until it reaches a jet stream. Again, increasing wind speed
increases the power available in the wind. The importance of harnessing more power at
higher volumes per system is that it will result in less cost per kWh of energy produced,
which emphasizes one reason for the DoD to pursue this energy.
In the article, ―Global Assessment of High-Altitude Wind Power,‖ environmental
scientist Christina Archer took 28 years of atmospheric data to create a worldwide atlas
of wind speed distributions and persistency.13
Archer presents the data in wind power
density (kW/m2), a format convenient for estimating the potential for energy harvesting.
The wind power density takes into account the effects of changes in both wind velocity
and air density at each altitude. In Figure 4, the wind power density is shown for a few of
the altitudes studied.

15
Figure 4a. Wind power density (kW/m2) that was exceeded 50%, 68%, and 95% of the
time during 1979-2006 at 80 m (left) 1,000 m (right) 13

16
Figure 4b. Wind power density (kW/m2) that was exceeded 50%, 68%, and 95% of the
time during 1979-2006 at 5,000 m (left) and 10,000 m (right)13
With this wind power density information, planners can estimate how much
power production they can expect at a proposed location, even a DoD location. Note that
the scale shown on the bottom of Figure 4 indicates that each subsequent step represents
approximately a doubling of the power density. Figure 5 shows the optimum power
density that a high-altitude wind turbine can exploit by always flying at the altitude with
the best winds; it is an example from the ―High-Altitude Wind Power Atlas,‖13
which
shows the optimal wind power density for an AWE system on the left. The right portion

17
of Figure 5 illustrates the optimal altitude for an AWE system that would reach those
power densities. Figure 5 allows a designer to first determine the potential output of their
power system at the selected location, and to then determine the best altitude for their
AWE system.
Figure 5. Optimal wind power density (kW/m2, left panels) and optimal height (km,
right panels), exceeded 50%, 68%, and 95% of the times during years in 1979-200613
Note that most of the U.S. can obtain power densities greater than 3 kW/m2 over
50% of the time if always flying the AWE system at the optimum height. In Figure 4a, at
80 m (ground level), the U.S. wind power density is 0.2 kW/m2, or less, 50% of the time.

18
This suggests gains of greater than 15 times the power production at higher altitudes 50%
of the time. These are very impressive energy gains if the DoD can find a means to cost-
effectively tap them.
Another comparison of AWE power density to conventional wind turbine systems
can be seen in Figure 6. Figure 6 shows a more detailed map of the ground-based power
densities for the U.S. The key item to notice when comparing Figure 5 and Figure 6 is
how the high-altitude power densities range between 2 to over 10 kW/m2 across the entire
U.S. at least 50% of the time. In Figure 6 for wind at ground-based wind power altitudes
(50m), the average wind power density ranges from 0.2 to 2 kW/m2, with the higher
power densities available in very small portions of the country. This again suggests that
AWE technologies can harvest wind energy with power densities well over 10 times
higher than what is available at ground level.
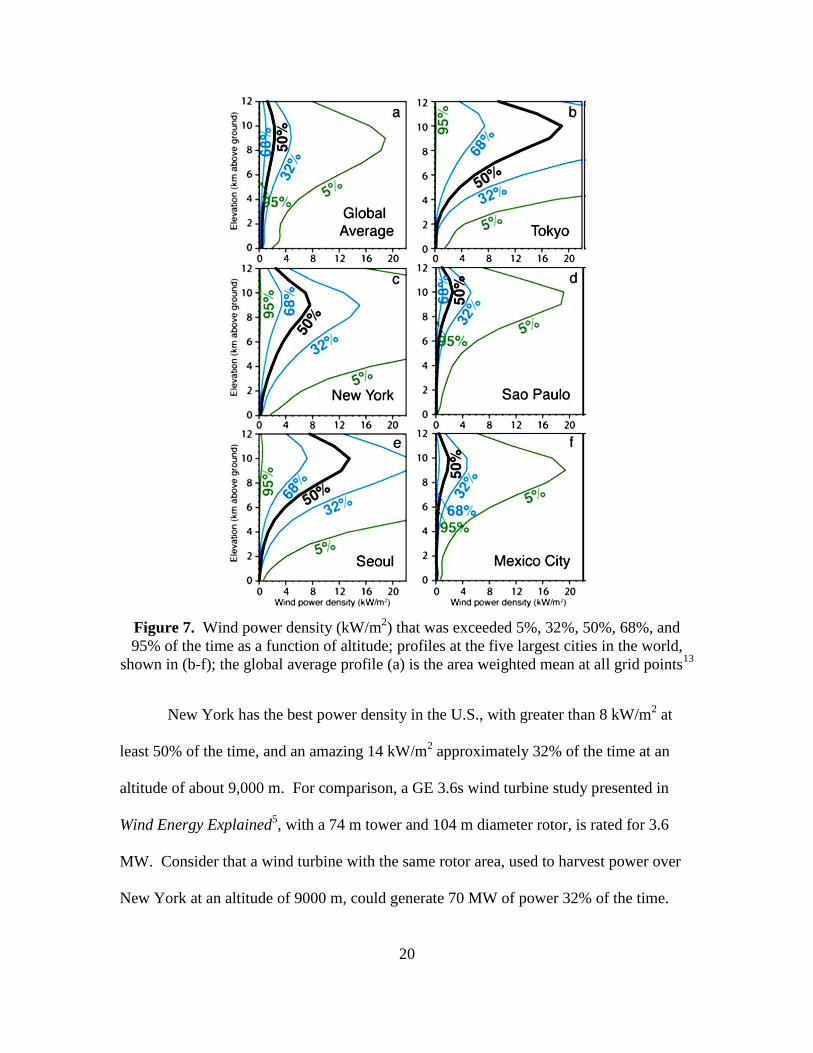
Figure 7 shows a sample of the wind power density as a function of altitude for a
sampling of the world’s largest cities. Notice that there is large variability in the power
density from location to location; this is dependent on whether or not the location is in or
close to one of the major jet streams.

19
Figure 6. Map of U.S. average annual wind power densities at heights of 10 m & 50 m18
20
Figure 7. Wind power density (kW/m2) that was exceeded 5%, 32%, 50%, 68%, and
95% of the time as a function of altitude; profiles at the five largest cities in the world,
shown in (b-f); the global average profile (a) is the area weighted mean at all grid points13
New York has the best power density in the U.S., with greater than 8 kW/m2 at
least 50% of the time, and an amazing 14 kW/m2 approximately 32% of the time at an
altitude of about 9,000 m. For comparison, a GE 3.6s wind turbine study presented in
Wind Energy Explained5, with a 74 m tower and 104 m diameter rotor, is rated for 3.6
MW. Consider that a wind turbine with the same rotor area, used to harvest power over
New York at an altitude of 9000 m, could generate 70 MW of power 32% of the time.

21
2.4. Capacity Factor
Another important factor to consider in wind power is the consistency of the
wind. A measure of the consistency of the wind resource at a particular site is the
capacity factor, which is the fraction of power actually generated by a wind turbine
compared to the rated power of the turbine. Ground-based wind power sites typically
have a capacity factor of less than 35%.14
Table 1 shows calculated capacity factors for
U.S. locations at altitudes of 15,000 ft (4.6 km) and 10 km. These high capacity factors
are extremely important, not only because of the additional total energy produced, but
also because electric companies need consistent power to feed to the grid. Having
consistent wind energy can decrease the need for energy storage or other power
generation facilities, and it helps to fill in energy production gaps, which in turn enables
an increase in the total fraction of the energy grid that can be powered by wind.
The total amount of wind power available is also a question of interest.
Researchers estimate that there is roughly 100 times more energy available in the wind
than is currently being used by all of human civilization. Humans currently consume
about 1013
W of power, yet winds are estimated to contain about 1015
W of power.
Therefore, the DoD only needs to tap 1% of this vast resource to nearly meet world
demand.10
Considering the vast size of the wind resource and the dramatic increases in
wind power density and capacity factor at high-altitudes, it is no surprise that there are
several researchers and companies developing a variety of concepts designed to tap into
this enormous resource (examples of AWE progress are presented later in the chapter).

22
Table 1. Capacity factor table for U.S. locations14
Location State 4,600 m 10,000 m
Aberdeen South Dakota 75% 92%
Albany New York 73% 87%
Amarillo Texas 66% 82%
Bismarck North Dakota 68% 87%
Brownsville Texas 57% 72%
Buffalo New York 71% 87%
Chatham Massachusetts 79% 89%
Denver Colorado 44% 77%
Detroit Michigan 72% 90%
Jacksonville Florida 55% 74%
Medford Oregon 54% 83%
Miami Florida 34% 61%
Midland Texas 60% 75%
Morehead City North Carolina 64% 77%
Oakland California 50% 80%
Quillayute Washington 62% 83%
Rapid City South Dakota 64% 86%
San Diego California 40% 71%
Topeka Kansas 77% 91%
Tucson Arizona 42% 69%
3. Advantages and Challenges for Airborne Wind Energy Systems
If the DoD is to employ AWE technology, then they need to understand the
advantages and challenges of different approaches for AWE systems. Three main
concepts for harvesting Airborne Wind Energy are the rotor, kite, and balloon concepts.
Each approach has strengths and challenges. There are some advantages over ground-
based wind power or other fossil fuels that all of these AWE approaches share. In the
next section, the main advantages and challenges facing each of the three AWE systems
will be discussed.
Compared to fossil fuels, there is very little impact on the environment when
harnessing wind power. Wind power generation does not contribute harmful emissions

23
to the atmosphere, nor waste products outside of the energy and materials required to
manufacture the systems. For many, this is one of the most attractive features of wind
power. See ―Global Assessment of High-Altitude Wind Power‖13
for an analysis
showing negligible climate effect if Airborne Wind Energy extraction were employed at a
scale comparable to total global electricity demand.
In addition to these advantages, because wind harvesting occurs at higher altitudes
in three-dimensional space and with higher power densities when compared to ground-
based wind generation, there could be a very small land footprint. One analysis estimates
that a kite energy farm with multiple kite energy systems, placed far enough apart to
avoid entanglement could produce about 7 to 13 times the yearly-generated power per
km2 compared to a ground-based wind farm at the same location.
9
The high-altitude nature of the wind power generation means that it is bird and
bat-safe, unlike ground-based wind power that kills birds. This would make high-altitude
systems more acceptable to the public when compared with their ground-based wind
turbine counterparts.
Located at a high altitude also has the benefits of reduced visual impact for the
public and for the DoD. With an AWE system running at a high altitude, systems will
appear very small.
A fourth advantage that the Airborne Wind Energy could provide is power
generation portability. Since there is no requirement for a large and expensive tower and
foundation, these systems could be implemented at temporary sites. AWE systems could
be extremely useful in instances where power has been knocked out, such as emergency

24
or disaster relief efforts. And they would be invaluable to the DoD in remote locations or
many other situations, operational or supportive.
Next, because Airborne Wind Energy is so highly available across the globe,
these high-altitude systems could be placed relatively close to cities or bases. Since these
systems are up and out of the way, this advantage could help to bring the AWE resource
near users. This feature of the AWE system could save on infrastructure and electrical
losses typically required for long-distance power transmission.
Security for the public and for AWE systems could also be enhanced over the
security of ground-based systems. With shorter transmission lines, there would be less
exposure to potential vandals. The airborne systems would also be well out of reach of
most ground-based threats.
One of the most important advantages of high-altitude systems is that the resource
of wind is plentifully available domestically. This is a benefit because there is a large
drive in public opinion to reduce U.S. dependence on foreign oil. But this is also a
national security issue—the less dependent the U.S. is on other countries for energy, the
more secure the economy and energy availability will be for the country.
One challenge for AWE systems when compared to ground-based systems are the
components, such as flying wind-rotors, that increase the level of complexity for AWE
systems. For example, the technology for low-weight, high-strength cables has recent
improvements that will make AWE more viable than it has been in the past. But low-
weight, high-strength cables are not yet widely available, and remain semi-expensive.10
This makes AWE systems more complex and, therefore, more expensive to operate than
systems that are simply sitting on the ground. Also, a challenge would be to ensure

25
compatibility with the DoD mission requirements; for example, allowing aircraft
operations may require the AWE system to be geographically separated from the
installation and within a certain safety distance from the base so that cables do not pose a
safety hazard.
One of the biggest problems with green energy sources, such as wind and solar
power, is that energy flow is intermittent. This means that there is always some period of
time, even in the best locations, where absolutely zero power will be produced. Even for
AWE, the best locations will still produce no power at least 5% of the time.13, 19
Power
intermittence is a major problem for utility companies, even for devices like solar
generators. If a company or military operation has to have a fossil fuel power station or
massive energy storage to act as a backup for the wind power, then it drastically reduces
any cost savings that the AWE might provide.
Another concern is lightning striking upon systems that are in a higher altitude.
This has to be mitigated by either bringing down the high-altitude system during
lightning storms, or by designing it so that it can withstand the lightning strikes. This can
be done: but it, too, increases the expense and complexity of the system.11
The challenges to the development of AWE are significant, but there do not
appear to be any obstacles that cannot be overcome by combining and applying current
technologies. The advantages of the high-density wind power resource at high-altitudes
provide the potential to give tremendous returns to those who can innovatively overcome
the challenges and produce a competitive system. There are currently several researchers
and companies that are trying to do just that.9,10,11
Three specific types of innovative

26
approaches being pursued are a rotor based concept, a kite based concept, and a balloon
based concept.
4. Overview of Specific Types of Airborne Wind Energy Systems
4.1. Rotor Concept
The rotor concept is the most similar to the classic ground-based, horizontal axis,
wind turbine, wind power system. The main difference between traditional ground-based
systems and this AWE system is that the spinning rotor (or multiple rotors) is flown like a
kite up into altitudes with the best winds (see Figure 8). The wind provides a torque on
the rotor that produces the rotational motion and the power generation. The wind also
imparts a thrust force on the rotor, which is used to lift the system to the desired altitude.
This flying rotor kite requires a control system to orient and steer the apparatus for
maximum power production. These controls can include wings and tails with control
surfaces. The thrust force can also be controlled by adjusting the torque applied by the
generator, as it draws power, and by adjusting the rotor’s blade pitch control.10
Figure 8. Photograph of early two-rotor prototype in flight10

27
This flying rotor-type of AWE system requires that the generator be an actual part
of the kite; therefore, the system transmits the power down to the ground through the
cable. The tether must be made of very light materials, yet still provide enough strength
to manage the powerful forces generated by the wind turbine and the weight of the
kilometers-long cables themselves. The cables must also provide a sufficient amount of
conductivity to transmit the power to the ground with minimal losses. This is a difficult
engineering challenge: however, there are currently commercial vendors that have
developed this kind of tether technology for NASA and for military applications.14
The
system transmits the power to the ground using high voltages to minimize electrical
losses.14
Tethers that appear to have the best combination of properties are a composite
combination of insulated aluminum conductors and high-strength Kevlar-type fibers.10
Figure 9 shows a demonstration of a similar composite cable, made by Applied Fiber.
The cable shown on the right lifted six cars, while the cable made from conventional steel
snapped with only three cars.20
Figure 9. High strength low weight cables by Applied Fiber20
One advantage of the rotor-type of system is that it can be highly efficient at
converting wind energy into electrical power. Because it operates so similarly to the

28
ground-based systems, the expected performance would also be similar. Thus, the rotor
system should be able to convert up to approximately 50% of the power available in the
wind that is intercepted by the rotor area.5
The flying electric generators also have the advantage of being quieter and less
visible than ground-based systems. Since a system could run at about 10 km (32000 ft),
what someone might see and hear from an AWE rotor system could be compared to what
they would see and hear as a large aircraft flies overhead at the same altitude. Think
about how small these large aircraft appear at that altitude! Also, the noise level would
be much less than ground-based systems, because of the large distance between the rotor
system and anyone on the ground.
The rotor-type of system also handles turbulence very well. Any large
disturbances tend to be easily absorbed by a temporary adjustment to the slack in the
cable. The rotors also generate a tremendous amount of thrust that is proportional to the
wind speed squared. The turbulence handling and high thrust characteristics of the rotor-
type of AWE system enables it to potentially reach the highest altitudes with the most
powerful jet streams.14
Of course, the extreme heights that these AWE systems operate in also create
some major obstacles. Chiefly, a 10 km high tethered system requires a massive region
of restricted air space. This altitude occurs at about the same altitude that airlines like to
fly at; this could cause significant resistance in the aviation industry to AWE systems
operating at these heights, not to mention that the rotor systems require a logistical,
creative solution for military installations where AWE is used simultaneously near an

29
airfield. But in such cases, a circular area of AWE systems spaced around the DoD site
could be established to ensure safety of all aircraft.
Another factor to consider is that some wind energy is required to provide the lift
for these systems. To keep the system aloft, the rotors must be tilted partially upward in
order to point the thrust vector upward. Doing so slightly reduces the cross-sectional area
of the wind intercepted by the rotors. To diminish this, the structure, cables, generators,
and gear systems must all be light. This adds to the level of complexity of the design that
the ground-based systems do not have to be as concerned about.
Safety is also a major concern for AWE systems. The idea of a massive wind-
rotor falling out of the sky and landing on a populated area is frightening. Therefore, the
systems would need to be designed with safety and redundancies as a top priority.
Obviously, the first generations of designs would not be flown close to population
centers. Eventually, the reliability and safety record of the systems could be improved to
the same degree of other flying aircraft. This would allow the systems to take advantage
of the high-altitude wind energy in close proximity to the largest energy users.
To address safety issues of a rotor system, safety features could be incorporated
into tethers between the AWE system and the ground. In the event of something large,
such as an aircraft, striking the system, the tether could be designed to safely sever. One
method that could be used to reduce the damage in the event of a cable severing would be
to use the rotors as a helicopter. Onboard sensors could detect the problem and use
automatic controls to glide the unit safely back to the earth.
Despite the technical challenges faced by this type of AWE system, the
researchers developing this technology estimate that it will still be profitable. It is

30
predicted that the cost of the power produced will be about 2 cents per kWh (including
land lease, maintenance, operations, and capital costs), which is cheaper than any other
current source of power.10
Currently, one company is in the process of building a
relatively large-scale prototype version of this rotor-type AWE system. Sky WindPower
Corporation is building and plans to fly their demonstration rotorcraft, seen in Figure 10,
at altitudes up to 4,600 m (15,000 ft).10,14
Figure 10. Artist’s rendering of Sky WindPower Corporation’s planned 240 kW four-
rotor AWE generation system called the Flying Electric Generator (FEG)10,14
4.2. Kite Concept
The kite concept typically uses a kite attached with cables to a ground-based
portion of the system. The ground station has cable spools that are attached to generator-
motors. The kites use sweeping figure-eight motions (Figure 11 and Figure 12) to cut
across the wind, generating aerodynamic forces. The powerful forces generated by the

31
sweeping motion of the kite pull the cables, generating power as they turn the generator
attached to the spool. Once the kite has reached its maximum altitude, it goes into a low-
resistance dive that allows the spool to reel in the cable, attached to the kite, closer to its
beginning altitude. Then, the pattern is repeated. The energy required to reel the kite in
is much less than the energy generated as the kite sweeps across the wind, resulting in a
large net gain in power with each cycle.9,
16
Figure 11. KE-yoyo (Kite Energy) configuration cycle: traction (solid) and passive
(dashed) phases; the kite is kept inside a polyhedral space region whose dimensions are (a
× a × Δr) meters, which allows users to stack and control many kites closely together9

32
Figure 12. Comparison between wind turbines and airfoils in energy production; in wind
towers, limited blade portions (red) contribute predominantly to power production; the
kite acts as the most active portions of the blades, without the need for mechanical
support of the less active portions and the tower16
Fagiano and his research team were initially responsible for developing and
testing small-scale kite prototypes, as seen in Figure 13. Results looked promising, so a
large company called Kite Gen was formed. Kite-Gen is now planning for the
development of large-scale AWE kites.16
Figure 13. KE-yoyo small-scale prototype operating near Torino, Italy9

33
Figure 14. Scheme of the kite steering unit; the kite steering unit, which provides
automatic control for KiteGen, includes the electric drives, drums, and all of the hardware
needed to control a single kite16
Figure 14 shows that these kite generation systems are controlled similarly to a
recreational kite, with two cables, but they also have GPS and position censors to keep
them moving in the most efficient pattern. This controlled pattern can also allow
multiple kites generating energy to operate in relatively close proximity to each other.
Figure 15 below shows a concept, by the company Kite Gen, to implement large-scale
energy production using kite-based generation. Multiple kite systems are automatically
controlled simultaneously through a central base-station.21
At the end of each of the arms
would be a kite steering unit like the one in Figure 14.16, 22, 23
The advantages of such kite based high-altitude systems are: the AWE airborne
portion of the system is very simple, the cross-sectional area of the wind harvested can be
very large, and a kite system could be relatively cheaper than ground-based wind turbines
and even fossil fuels.9 Because the kite system is simple, like a kite, the materials can be
soft and flexible like a parachute. This feature improves the safety factor because there is
no potential of a heavy rotor system crashing to the ground. Next, the harvested area of

34
the kite can be very large as it sweeps across immense patches of sky, since the kite
system is not restricted to the size of a rotor. And compared to ground-based power, this
system eliminates a large, expensive tower, making it more cost-effective and worthwhile
to continue developing.
Figure 15. Kite Gen21, 24
One disadvantage of this approach is that the kite method would not be as
aerodynamically efficient at capturing the wind, when compared to a rotor system, per
unit area of sky. The kite system is not generally considered as capable of handling
turbulent winds because the kite cables can become tangled—especially when multiple
kites are attached to the same line.14
Also, because the power is transmitted to the ground
mechanically from the pulling forces on the cables, there are diminishing returns as
longer lengths of cable are extended. The weight of the cable eventually outweighs the
extra force added by attempting to reach the higher winds at extreme heights. This means
that kite wind power solutions have an optimal point to be operated at, and are generally
better suited for lower altitudes, up to about 1000 meters.9 Scaling up the size of these

35
kites, and really improving cable technology, could potentially allow them to reach
higher altitudes. One advantage of flying at lower altitudes is that the size of required
restricted air space, particularly around DoD sites, would not need to be as large. 1000 m
or 2000 m of restricted airspace could be easier for people and for the government to
accept than a rotor system that may go up to 10,000 m.
The current status of the kite system technology is that research into the cost
feasibility of generating power using this method has been conducted. Also, small-scale
prototypes have been tested, as seen in Figure 13. The operation of small-scale
prototypes match well with predicted performance.9, 25
The predicted cost of kite energy
is shown in Table 2. The estimated cost includes all costs associated with the power
production, including land lease, maintenance, operations, and capital costs. At an
average of 2¢/kWh, kite energy cost estimates are lower than any other power source.
Table 2. Comparison based on estimates of the cost of energy per MWh9
Because of the advantages listed previously, using this method of power
generation suggests it is feasible that these predicted cost figures could be realized. Yet,
the caveat is this: there could be an unknown learning curve before such energy rates
could be obtained.

36
4.3. Balloon Concept
Balloon-type AWE systems use a large helium balloon, with flaps arranged
around the balloon to catch the wind (Figure 16). Each end of the balloon has a generator
attached between the cables and the balloon. As the wind strikes the balloon, the flaps on
the top catch the wind, while the flaps on the bottom flatten. Thus, the high drag on top,
coupled with the low drag on the bottom, causes a torque that spins the balloon around its
horizontal axis. This is a drag type machine, meaning that it does not use lift forces, as
the rotor and kite type systems do, but instead uses only the drag forces of the wind to
rotate. The major disadvantage of this type of system is that it is only about half as
efficient at extracting power from the wind as a rotor-type system that can utilize both lift
and drag. But this reduction in efficiency, compared to ground-based wind power
generation, is expected to be more than offset by the increased wind speeds and
consistency of the wind at the higher altitudes that it could reach. This could translate to
an overall cost for energy production per KWh to be less than the cost of energy from the
ground-based systems.11
Figure 16. The Magenn Air Rotor System (MARS)11

37
There are some other advantages to this system. The spinning of the balloon
causes what is known as the Magnus effect. The Magnus effect is when the spinning of
the balloon causes more of the wind airstream to flow over the top of the balloon than the
bottom. The faster airflow above the top of the balloon creates a lower pressure region
over the top. This results in extra lift, in addition to the lift of the helium. The extra lift
allows the system to reach altitudes that it could not reach using helium alone. The
Magnus effect also stabilizes the balloon and helps to keep the system naturally aligned
with the wind, within a strictly controlled position.11
The balloon system is interesting because it holds itself up in the air without being
dependant on lift from the wind. This is good because the risk of the system crashing
into the ground is low, and it can stay aloft in very low winds. This also allows the
system to be able to lift off the ground, even if the wind speed at ground level is too low
for power generation.11
One challenge that this type of system faces is that the lift force available is
highly dependent on the size of the balloon. This means that to reach the very high-
altitude jet streams with the highest wind speeds, the balloon would need to be quite large
to overcome the weight of the tether.
Another challenge is that the balloon system requires a very large amount of
helium. This helium is a very significant portion of the startup and operating costs.
Helium also tends to leak over time. But if the balloon membrane is designed well, the
leakage rate can be kept down to about 6% per year.11
The current status of the development of this type of wind power system is that a
company called Magenn Power Inc. has designed, built, and is currently testing a 100 kW

38
system (seen in Figure 16). Magenn expects to begin selling similar production versions
sometime in late 2011. Current target for this product is for remote locations, and for
temporary sites like construction or disaster relief, which could directly benefit the DoD
goals (Figure 17, left and center). Eventually, Magenn expects to introduce larger
versions that can be used in large-scale wind farms to generate power for the power grid
(see Figure 17, right).11
Figure 17. Implementation concepts for the Magenn Air Rotor System (MARS)11
In summary, these are the three main approaches being used to harvest AWE (the
rotor concept, the kite concept, and the balloon concept). Since AWE is still in the early
stages of development, there is still a wide variety of variations in these approaches. One
example is a hybrid AWE strategy that uses a combination of the rotor and the kite
concepts where there is a kite with rotor-blades on the front that generate electricity as
the kite sweeps across the sky (see Figure 18).26

39
Figure 18. Kite and rotor combination concept by Joby Energy26
As the technology for AWE matures, it is probable that a dominant design will
emerge. However, there is still a lot of innovation in the field of AWE that is occurring,
and this section has presented a basic overview for the current state of the technology.
5. Important Component Studies
It is important to understand the key concepts and equations related to the main
components of wind power generation systems. The most important components for
AWE systems are the rotor and the generator. A review of literature related to these
components has been conducted, and some of the main ideas for these components are
presented below.
5.1. Electric Generators
It is important to understand the main components of the AWE rotor system so
that one can successfully be designed. Generators and electric motors are essentially the
same: the difference is that energy is put into the system to run it as a motor, and power is
drawn from the device while a mechanical power source drives the system to run it as a
generator. In finding information about electric generators, the research found that
several key power equations for analyzing these generators could be used.

40
In the ―Validation of Small Scale Electric Propulsion System Models,‖ motors are
studied.27
Yet, this study also applies to generators because it demonstrates that
optimizing the ―propulsion system‖ can be more important than optimizing the
aerodynamics. This report additionally teaches that designers have to be careful when
purchasing off-the-shelf parts, such as motors, because the actual measured efficiencies
may not match the advertised efficiencies given by the manufacturer.
Examining further analysis of generators helped to investigate the different kinds
of generators: direct current (DC) generators and alternating current (AC) generators.
Within the AC generators, there are two main kinds used in wind power applications—
synchronous and induction generators.5 The key equations governing the performance
of induction generators are:
In these key equations, n is the rotational speed (Equation 2) of the generator, and s is the
slip of the generator (Equation 3). ns is the synchronous speed of the generator. If the
generator is driven at a speed faster than the synchronous speed, then it results in power
(2)
(3)
(4)
(5)
(6)
41
generation (Equation 4). However, if the generator is going at a speed slower than the
synchronous speed, then the generator is operating as a motor.
Next, f is the frequency of alternating current. The number of poles that the
induction generator contains is a design choice. The efficiency (ηgen) of the generator
(Equation 6) is the ratio of electrical power output (Pgout) from the generator to the
mechanical power (Prout) supplied to the generator by the rotor (Equation 5). IR and IS are
the current in the generator rotor and in the stator, respectively. RR and RS are the
resistance in the generator rotor and in the stator. The mechanical loss (Pmechloss)
represents the mechanical losses experienced in the shaft and in the gearbox between the
rotor and the generator. Considering this information will allow selection of a generator
appropriate for an AWE design.
5.2. Rotors
Rotors are another key component of an AWE rotor system. Rotors are similar in
design to propellers except that the rotor is designed to convert the energy in the wind to
mechanical, rotational energy, while a propeller does the opposite. Rotors are essentially
airfoils that operate rotationally; therefore, all of the same principles of lift and other
aerodynamic forces that can be applied to wings are applicable to rotors.
The equations and principles of aerodynamics applied to rotors are laid out in
detail in Wind Energy Explained.5 The key governing equations for rotors are the
equations for thrust and power, given here:

42
Rotor power out ( ) measures how much power the rotor has extracted from
the wind. The axial induction factor is a measure of the ratio between the free stream
velocity of the wind and the wind speed seen at the rotor plane. As with the power and
wind equation given in Equation 7, the power output is proportional to the wind velocity
(U) cubed. The difference between Equations 7 and 8 is that the power that one can
extract from the wind by the rotor is limited by the laws of conversation of momentum,
which is manifested in the axial induction factor (a). This knowledge is used to
determine the efficiency (η) of a rotor in converting the power in wind to mechanical
rotational power (see Equation 9).
Once power has been determined, thrust (T) is the important factor in determining
the lift that the AWE device will have available to stay aloft (see Equation 10). Notice
that the equation for thrust is very similar to the equation for power, except that it is
proportional to wind speed squared. This information allows calculation of the forces
and loads required for the AWE design to manage.
6. Literature Review Summary
The concepts described in this chapter are the result of many years of study and
effort that are now on the verge of becoming a practical and viable source of clean and
(7)
(8)
(9)
(10)

43
cheap energy that the DoD could utilize. The AWE technologies still have a lot of room
to develop and improve, but the studies conducted to date show that these technologies
all offer the potential for great improvements in wind power.
The vast size of the high-altitude wind resource, along with its close proximity to
users and its consistency, make it a tempting, viable source to tap as the country searches
for more ways to find clean, reliable, and inexpensive energy. The inexpensive
component is the most important aspect because it makes AWE resources competitive
with current energy resources.9 If AWE is truly competitive with current energy sources,
the technology will rise on its own based upon its profits, and this will allow the high-
altitude technologies to be independent of government subsidies.
The challenges that this AWE resource face are significant. First, AWE systems
require restricted air space to operate—this will take a lot of discussion among people,
such as the FAA and Congress, to determine how the U.S. and the DoD can take this
step. The systems need to be proven reliable and safe, because no one wants any
accidents such as wind generators falling on houses or massive cables crashing down. In
addition, if technology can develop (for example, in such a way as to reduce cable weight
per unit length), then this will allow the AWE systems to consistently reach the highest
altitudes. The capacity factor reveals that if the systems are operated perfectly, they will
still not be as consistently available as fossil fuel sources. Even the best AWE sites will
provide no power at least 5% of the time.13, 19
Yet in conclusion, pursuing high-altitude energy is recommended because this
vast resource is more reliable than ground wind power, and AWE can be more cost-
competitive than other resources. In the U.S. economy, AWE will save money for both

44
utilities and consumers such as the DoD. One reason it is important to drive the cost of
wind power down is that current ground wind power is only cost-competitive when the
price of other energy (like the price of oil or coal) is high. The effect of this is that
interest in wind-power and capital tends to dry up when the price of energy drops.
Therefore, if AWE prices can be competitive, even at low energy prices, it will make
interest and development in the AWE technology consistent regardless of the price of
energy. Additionally, the high-altitude systems could be beneficial because they can be
very close to users, the systems can be portable (they are only attached to the ground with
a cable), and they can be used in varied locations and in a wide range of operating
situations. Realizing each of these items will help the USAF to accomplish the goals of
the National Security Strategy.2
It seems that the objectives of AWE can be reached. The goal to generate power
at the lowest possible cost per kW produced has been realistically cost analyzed.
Investigation has been done to use the minimum possible land in these AWE systems so
that the maximum energy per area on the ground (kW/km2) can be achieved. Some of the
benefits to AWE systems are monetary (reduced land use and low environmental impact),
but there is also a realistic potential that the high-altitude approaches for more effectively
harvesting wind power will collectively provide cheaper, cleaner, and inexhaustible
energy technologies that the DoD can directly utilize.

45
III. Methodology
1. Chapter Overview
The methodology of this paper focuses on the achievement of two main
objectives: to realize the best power production and efficiency for an AWE system, and
to identify critical USAF base candidates that would benefit the DoD most from AWE.
To accomplish the first objective, the creation of a design tool that would technically
analyze and compare an idealized wind turbine rotor blade to a more simplified version,
and then compare the performance of the two, was conducted. In this chapter, the
equations that go into the design tool to yield solutions for the most efficient AWE rotor-
based wind turbine are presented. Then, in order to realize the second objective, it was
essential that a USAF base decision matrix be created. The second half of this chapter
presents how the evaluation was conducted, and compares which bases in the decision
matrix are most feasible and most likely to succeed using AWE projects to accomplish
the energy needs of the DoD and fulfill the goals of the National Security Strategy.2 The
methodology of the base decision matrix presents categories that the USAF bases were
evaluated on, the data that was used for the evaluations, and how each base was scored.
Each of the approaches for harnessing AWE (rotor-type, kite-type, and balloon-
type) has very interesting advantages and challenges. It is not possible to study all three
in this research, so in order to limit the research scope, the rotor-type AWE system was
selected for in-depth study. The rotor-type approach has a few advantages that were
appealing to the author. One advantage is that the author was already familiar with the
theory behind a ground-based rotor-type wind turbine. In addition, the rotor type turbines

46
are very efficient at harnessing energy in a given area of wind stream. The relatively
stationary nature of the rotor-type turbine also allows a greater degree of three-
dimensional placement of the AWE systems, which should lead to a much smaller ground
footprint per kWh of energy produced.
Creating a design tool for rotor blades was necessary in order to determine the
lowest cost for an AWE system, identify ways to make systems easier to produce, and to
find the most reliable designs to be used that had the best minimal significant efficiency
losses. Each of these factors guided the research equations into discovering which
airborne wind-rotor style concept would have the most reasonable benefits for the USAF.
The methodology also presents that the first step in determining feasibility of
USAF bases was to select a few sample bases that could most benefit from increased
power supply from renewables. The second step was to analyze and compare results of
the USAF bases based upon the good prediction estimates for the power production and
efficiencies the design tool yielded, and match up those bases with locations that are ideal
for AWE based on the capacity factor and energy density at that particular location. The
methodology consequently found a sampling of six USAF bases that are best for
operating AWE systems.
The results of the methodology analysis are presented in Chapter 4. Sample
outputs from the design tool and analyses of these outputs are put forward to achieve the
first objective of most efficiently designing an AWE system. The second objective is met
through the methods used to conduct an analysis of the sample bases’ energy needs, and
then comparing base needs to the performance of the designed AWE system. The key
conclusions and recommendations will be presented in Chapter 5.

47
2. Design Tool for AWE Blade Design
Why is it important to analyze energy conversion on different blade designs?
Analysis of energy conversion on varying blade designs will allow the USAF to build the
most efficient and reliable AWE systems. Optimized designs for wind turbine blades
result in a complex shape that includes high twist (which varies along the blade
nonlinearly), as well as a chord length that changes nonlinearly along the length of the
blade. Often, the airfoil shape varies along the blade radius in order to squeeze every bit
of energy out of the wind that is harvestable. These complex shapes can be very difficult
and expensive to manufacture, and they can cause complex stresses in the blade structure.
The high wind speeds and high rotation rates that AWE devices will operate in will
magnify the effect of these stresses.5
Figure 19. Sky WindPower’s Flying Electric Generator (FEG)14
Complex stresses can make it difficult to maximize the reliability of the blades.
The design tool assists in comparing these optimized blade designs with simplified
designs that can be more easily manufactured (e.g., off-the-shelf helicopter blades). The
simplest design would be one with constant chord, no twist, and a single airfoil cross-
section shape along the entire blade. Other variations could include small amounts of

48
linear twist, while still holding the chord and airfoil constant. Being able to analyze
simplified blade design performance under the high-altitude conditions they are to be
operated in will allow designers to make design simplifications that will lead to high
reliability and low cost, while still producing power efficiently.
Again, if renewables are to be massively adopted, the key is that the cost of
renewables (such as AWE) must be lower than fossil fuels. Renewables need to be
cheaper than fossil fuels and become the go-to source of energy, leaving the fossil fuels
as the backup when the availability of the preferred renewable source is not available.
Airborne Wind Energy devices must be highly reliable and inexpensive to
produce and maintain in order to keep lifetime costs low. Simple blade designs will
better meet these goals because they are cheaper to produce and will have less internal
stresses causing fatigue.
The conceptual design tool that was developed during this research can be used to
analyze various blade designs, both optimized and simplified. Figure 20 provides a
summary of the inputs, process, and outputs used by the design tool for the design of a
rotor-based AWE system. Much of the theory and equations used in the design tool come
from the text of Wind Energy Explained.5
The design tool compares the power coefficient (efficiency) and thrust for the
various designs. The design tool allows analysis of different airfoil designs, different
number of blades, and different blade rotor diameters. The design tool is capable of
analyzing trends across variable flight conditions, such as wind speed and altitude
changes. Being able to use the design tool to analyze simplified blade design
performance under the high-altitude conditions they are to be operated in will allow

49
designers to make design simplifications that will lead to high reliability and low-cost,
while still producing power efficiently.
Figure 20. Summary of the AWE system design process
The following sections of the paper provide a detailed description of the equations
used to develop the design tool. The tool can then be utilized to compare the power
coefficient (efficiency) and thrust for the various designs. The tool can also be used to
conduct analysis of different airfoil designs, different number of blades, different blade
rotor diameters, and to analyze trends across variable flight conditions, such as wind
speed and altitude changes.
2.1. High-Altitude Wind Properties
The first step in analyzing the performance of an AWE device was to determine
the properties of the atmosphere at the operating altitude. The following table provides
known constants used in determining the properties of the air at an altitude of interest.

50
Table 3. Calculation constants
Parameter Value Units
Sea Level Standard Temperature (T0) 288.15 K
Sea Level Standard Pressure (P0) 101325 Pa
Reference Air Viscosity (μ0) 1.827E-5 kg/(m-s)
Lapse Rate (Lapse) .0065 K/m
Universal Gas Constant (Ru) 8.31447 J/mol-K
Molar Mass of Dry Air (Mair) 0.0289644 kg/mol
Gravity (g) 9.80665 m/s2
Specific Heat Ratio for Air (γ) 1.4 -
One of the first parameters to determine for an AWE system is to select the
desired operating altitude. This is a design choice for the designer. The choice can be
based upon factors that answer such questions as: What altitudes are the strongest winds
at? What altitudes will the FAA allow the AWE system to fly? What altitudes can
physically, feasibly be reached with the design? For this design tool, the calculator is
able to estimate the properties of the air, up to an altitude of at least 12,000 meters.
The most important characteristic of the atmosphere for wind-powered generation
is the density of the air, since the function for the power available in wind is directly
proportional to the air density. The air density can be estimated using Equations 11, 12,
and 13.28
(11)

51
(12)
(13)
Density is dependent upon the temperature and pressure of the air. Equation 11 shows
that the temperature can be estimated as T0 (the sea level standard air temperature of
288.15 K) at sea level, and then decreases at a constant rate, Lapse (called the lapse rate),
as altitude (h) increases. Equation 12 estimates the air pressure as a function of the
altitude (h). In addition, Equation 13 gives the air density as a function of the estimated
pressure and temperature.
These estimates should be reasonable throughout the troposphere, the region of
the atmosphere extending from sea level up to 8,000 m to 16,000 m, depending on
latitude. The troposphere is thicker at the equator and thinner at the poles. The air
density estimates given by Equations 11-13 will provide sufficient accuracy for the
altitudes most important for analysis of AWE systems because the strongest jet streams
tend to range from 8,000 m to 12,000 m, with the higher jet streams closer to the equator.
The importance of the reduction of density with altitude is shown by comparing the
density at sea level with the density at 12,000 m. The density at 12,000 m is about ¼ the
density at sea level. Thus, the power in the wind at 12,000 m would also be ¼ of the
power at sea level for the same wind speed.29
Another important characteristic of the air for analyzing an AWE system is the
speed of sound. This will be used later to calculate the Mach number and Reynolds

52
number, numbers which will be used to determine the lift and drag coefficients. Equation
14 gives the speed of sound, where
and T was determined previously.
(14)
Dynamic viscosity (μ) of air is a function of temperature and is obtained from
Sutherland’s Formula30, 31
, given in Equation 15. The Reynolds number is calculated
later using the dynamic viscosity.
(15)
Now that the characteristics of the atmosphere are defined, the amount of energy
in the wind can be estimated.
2.2. Design Parameters
After defining the atmosphere, the next step in analyzing the performance of an
AWE rotor is to define the design parameters for the device. One of the most important
design choices is the diameter (D) of the blade, because the power generation is
proportional to the area swept out by the rotor. This choice is based on the desired power
output—the larger the blade diameter, the more power produced, but the diameter will be
limited by the physical limits of the blade’s structural strength.5
Upfront, the diameter (D), number of blades (B), and hub diameter (Dh) are
selected. Initially, these numbers are estimated; however, they will be adjusted based on
the results of the performance calculations. Once the diameter and hub diameter have
been selected, Equation 16 gives the blade length. A blade element analysis will be used

53
to analyze the blade/rotor performance, so the blade is divided into a certain number (N)
of blade stations. Ten blade stations will be used for this project (ten to twenty is
commonly used). Equation 17 gives the length of each blade station (ls).5
(16)
(17)
Next, tip speed ratio (λ) is a very important parameter because it affects the
amount of power that can be pulled out of the wind and the amount of thrust on the wind-
rotor. The tip speed ratio can be controlled in a number of different ways, such as
adjusting the amount of power drawn from the wind or by using blade stall or blade pitch
angle.5 For this performance analysis, focus is on the performance at the maximum
power tip speed ratio, which can be estimated using Equation 18.32
(18)
With tip speed ratio set, the next thing to do is to calculate the blade rotation
speed (Ω) using Equation 19. With (R) as the rotor radius in meters, and the wind speed
(U) in meters per second, the result of this equation will be in radians per second (to get
rpm, multiply by 60/2π).5
(19)

54
2.3. Optimum Wind-Rotor Blade Design
The ideal shape for a wind-rotor blade design can be determined using the
combination of blade element theory and momentum theory. The derivation of the
equations used to determine the ideal shape of a wind-rotor blade is given in Wind
Energy Explained.5 The method gives the ideal twist angle and chord lengths for each
blade station, which result in the maximum power. This maximum power occurs when
all of the blade elements are at the angle of attack that produces the best lift-to-drag ratio
for the airfoil used.
Figure 21. Blade geometry5

55
Figure 21 shows the blade geometry defining the blade and wind angles
associated with the blade element analysis. The axial induction factor (a) is defined as
the fractional decrease in wind velocity between the free stream and the rotor plane.5
With the blade geometry defined, the properties at each blade station can then be
computed. Equation 20 gives the local speed ratio (λr) for an intermediate radius (r). The
blade element theory and momentum theory give Equations 21 and 22 for the local angle
of relative wind (φ) and ideal local chord length (c), respectively. The ideal chord length
is one of the necessary blade design parameters.5
(20)
(21)
(22)
Once the angle of relative wind is found, the section pitch angle (θp) that will give
the angle of attack for minimum drag is calculated using Equation 23. The section twist
angle (θT) is then found by subtracting the blade pitch angle (θp,0), as shown in Equation
24. The pitch angle is an important operating parameter to the AWE system, and the
twist angle is an important design parameter that defines the twist in the system blades.5
(23)
(24)

56
Once the blade chord and twist angles are defined, the rotor performance is
estimated using Equation 25. The coefficient of power (Cp) is a measure of the fraction
of power in the wind that is extracted by the wind-rotor.5
(25)
This integral could also be estimated by splitting the blade up into elements
contributed by each blade station (ΔCp). The contribution of each blade station to the
power coefficient is calculated with Equation 26.5
(26)
The term is the increment of tip speed ratio from one blade station to the
next. All the blade stations have the same value of if the blade stations are each the
same length (see Equation 27).5
(27)
The coefficient of lift and drag (Cl and Cd) in Equations 25 and 26 are the lift and
drag coefficients for the blade airfoil at the angle of attack of minimum drag. Next, sum
the ΔCp’s for all blade stations to get the total power coefficient (Cp), as in Equation 28.
The power output of the optimized rotor is then calculated with Equation 29.5
(28)
(29)

57
The coefficient of power essentially represents the efficiency of an AWE system.
The power (P) represents the main goal of these calculations, finding the actual power
output of the wind turbine’s rotor. The power output will be used when designing the
system for its applications’ power requirements.5
It is interesting to evaluate the percent of power contribution (%Cp) from each
blade station, Equation 30, and compare it to the percent of area swept out by each blade
station (%A) using Equations 31 and 32. ΔAbs is the area swept out by a blade station at
radius (r). The percentage of power contributed by each portion of the blade is important
because the portions of the blade delivering the most power to the overall system power
output can be evaluated. By comparing %Cp to %A, portions of the blade that are
contributing more to the total output than could be accounted for just based on the area
swept out by that portion of the blade, are revealed.
(30)
(31)
(32)
Some other parameters of interest in designing the AWE system blades are the
local solidity (σ′), the axial induction factor (a), and angular induction factor (a′). The
local solidity (Equation 33) is the fraction of the circle swept out by the blade that is
actually solid blade structure. The axial induction factor is given in Equation 34. The
angular induction factor (a′) is a measure of the wake rotational speed (ω) induced on the

58
wind flow as it travels through the rotor. The angular induction factor can be calculated
in the case of optimum rotor at max power using Equation 35.5
(33)
(34)
(35)
Thus far, these calculations do not include the effects of tip losses. Tip losses for
optimal wind-rotor blade design can be accounted for and the equation for these losses
will be given in the next section under ―General Blade Design.‖ Tip loss analysis is used
to more closely reflect realistic flight for the AWE system.
Figure 22. Chord shape comparison for an optimum design blade and a simplified
constant chord blade with a 50 m diameter and a 5 m hub diameter
A sample calculation of an optimum design rotor using a 50-meter diameter at an
altitude of 10,000 meters with a wind speed of 25 m/s was conducted using the design
tool. Figure 22 shows the resulting chord shape as a function of blade radius.
0
1
2
3
4
5
6
7
0 5 10 15 20 25 30
Ch
ord
(m
)
Radius (m)
Optimum blade chord shape
Simple blade

59
The resulting calculations for twist angle, chord, and power coefficient are given
in the table below; Table 4 shows a sample of the results based on the equations from the
previous section.
Table 4. Optimum blade sample results for a 50 m diameter blade
Blade Station r (m) θT chord ΔCp
0 2.5 29.732 5.863
1 3.625 22.687 5.450 0.013
2 5.875 14.129 4.237 0.023
3 8.125 9.425 3.327 0.033
4 10.375 6.533 2.705 0.042
5 12.625 4.597 2.268 0.051
6 14.875 3.215 1.948 0.059
7 17.125 2.182 1.705 0.068
8 19.375 1.382 1.515 0.076
9 21.625 0.745 1.362 0.084
10 23.875 0.225 1.237 0.092
tip 25 0.000 1.183
Cp
0.5416
Factors to notice from these calculations are the large nonlinear changes in twist
and chord along the radius. In addition, the power coefficient (Cp) of 0.542 is relatively
high compared to the theoretical limit of 0.593 (called Betz limit). This result is reduced
by 5% to 0.489 when tip losses are accounted for.
2.4. General Blade Shape Performance
The optimum design calculated in the previous section requires blades with
complex twist and cord shapes that vary non-linearly with radius. These blade designs
would be difficult to build and would be expensive in an AWE system. This section

60
explains the procedure for predicting the performance for any given general blade shape.
Then, the performance of blades with simplified designs can be analyzed. Blade
simplifications can include no twist or linear twist, and constant or linear chord
variations. The equations in this section have also been derived in Wind Energy
Explained, using blade element theory and momentum theory. The local speed ratio (λr)
is again calculated using Equation 20, and Δλr is calculated using Equation 27.5
The designer sets the twist angle, blade pitch angle (θp,0), and chord. A good
starting point for theses values are the blade pitch and twist angles similar to the ones
calculated in the optimum design. For twist that varies linearly with radius, use the total
twist angle at the root (θTroot) and Equation 36 for (θT) at each blade section. Calculate
the section pitch angle (θp) using Equation 37.
(36)
(37)
The next step is to solve iteratively for the axial induction factor (a) and angular
induction factor (a′) for each blade station. Start with an initial guess for these values. A
good starting guess could be the values from the optimum blade design. Then, using
these values, calculate the angle of relative wind (φ) and angle of attack (α) using
Equations 38 and 39.
(38)
(39)

61
To include tip loss effects, calculate the tip loss factor (F) using Equation 40. F is
a value between zero and one. To neglect the tip losses, set F equal to one.
(40)
The local solidity (σ′) is calculated using Equation 33. Use the calculated values
for φ, F, and σ′ to calculate the next guess for (a) and (a′) with Equations 41 and 42.
(41)
(42)
If no coefficient of lift (Cl) data is available, then estimate (Cl) using Equation 43.
(43)
If airfoil data is available, use the coefficient of lift (Cl) and drag (Cd) data for the
calculated Mach (M) or Reynolds (Re) numbers and angle of attack (α). The Mach
number for each blade station is calculated in Equation 45 using the relative wind
velocity (Urel) seen by the airfoil at the blade station. Urel is determined with Equation
44. The Reynolds number (Equation 46) is a function of density, chord, relative wind
velocity and dynamic viscosity, which were estimated earlier.
(44)

62
(45)
(46)
Once the new guesses for (a) and (a′) are calculated, the values are substituted
back into Equation 38 to recalculate φ and iterate the process over again. The process is
repeated a few times until the difference between the guess and the calculated values for
(a) and (a′) is sufficiently small.
2.5. Automated Calculations
This process would be extremely time-consuming if done by hand, but it can be
automated using a spreadsheet or other computer math tool. For this to work, the data for
the lift and drag coefficients must be imported into the spreadsheet in such a form that the
software can automatically select the correct coefficients based on the calculated Mach or
Reynolds numbers and angle of attack. One way to get this data is to import it from an
airfoil software tool, such as XFOIL or XFLR5. The advantage of this method is that
designers can obtain data for any airfoil shape they can find or create. This method,
however, has the disadvantage of losing accuracy at high speeds where compressibility
effects become an important factor.
Another very convenient source for lift and drag data is found using C-81 Tables.
These tables have been used in the past for helicopter development programs. The airfoil
lift and drag data is tabulated for angles of attack from -180 degrees to zero to +180
degrees, and for several Mach numbers from zero to about one. These tables are very
flexible because they cover the full spectrum of possible angles of attack and Mach

63
numbers. Unfortunately, this method only works for airfoils for which C-81 table data
can be found.
Now, calculations for the blade station coefficient of power (ΔCp) and the total
power coefficient (Cp) with Equations 47 and 48, respectively, can be done.
(47)
(48)
The power output (P) of the AWE rotor is the power available in the wind (Pwind)
times the power coefficient (see Equations 49 and 50). Since the efficiency (η) is the
fraction of the power available that is extracted, the efficiency is also the coefficient of
power (Equation 51).
(49)
(50)
(51)
Additionally, the blade station local coefficient of thrust (ΔCTr), and the total
thrust coefficient (CT) are computed via Equation 52 and Equation 53 respectively.
Again, the coefficient of power represents the efficiency of the system and P represents
the amount of power the system can generate.

64
(52)
(53)
The total thrust (T) on the rotor is given by Equation 54. This result is very
important to the AWE system because it represents the force keeping the system airborne.
(54)
Again, these calculations are essential to designing an AWE system because they
determine the coefficient of power, which represents the efficiency of the system, and
power (P). The power result is the key since it is used to design the system in order to
meet energy requirements.
2.6. Keeping the AWE System Airborne
To get vertical lift, the thrust vector must be pointed upward. The thrust vector
always points in the direction of the axis of rotation. Thus, in order to provide vertical
lift, the axis of rotation must point at some angle (θ) above the horizontal. Assuming the
prevailing wind is in the horizontal direction, this reduces the projected rotor disk area
facing into the wind. The effective area swept out by the wind-rotor is calculated with
Equation 55.
(55)
The reduced power and thrust generated is determined by substituting the
effective area (Aeff) into power and thrust Equations 49 and 54 instead of the total area
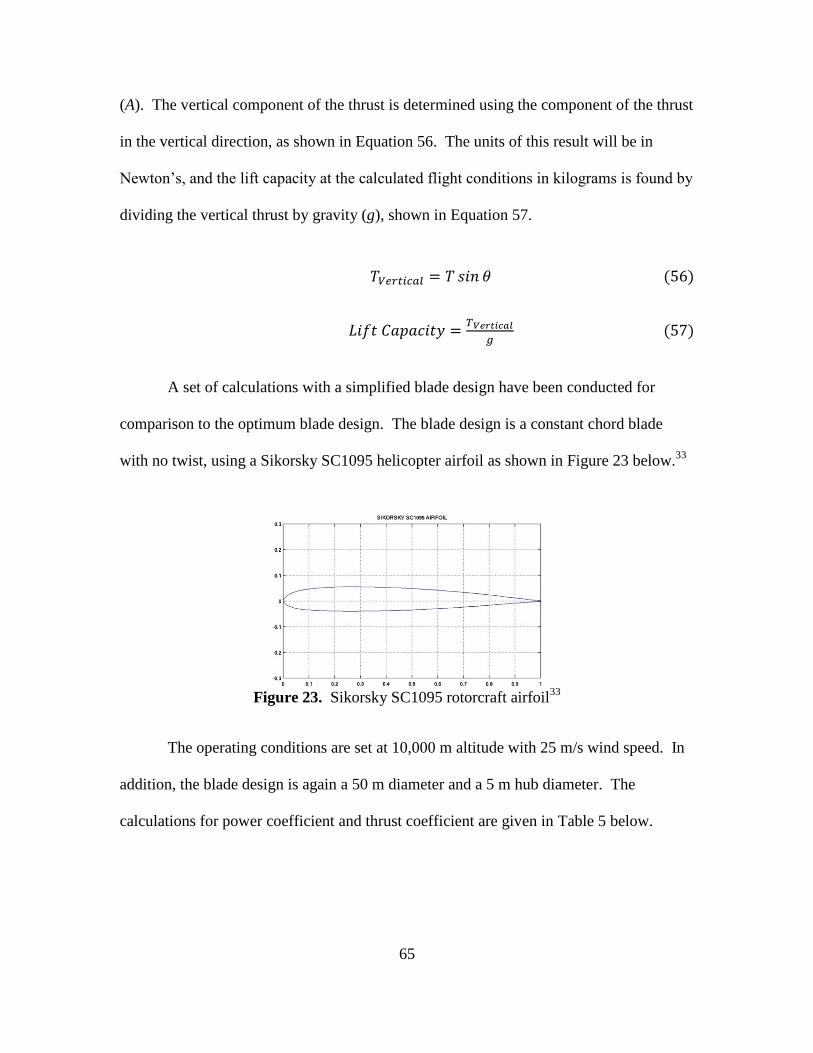
65
(A). The vertical component of the thrust is determined using the component of the thrust
in the vertical direction, as shown in Equation 56. The units of this result will be in
Newton’s, and the lift capacity at the calculated flight conditions in kilograms is found by
dividing the vertical thrust by gravity (g), shown in Equation 57.
(56)
(57)
A set of calculations with a simplified blade design have been conducted for
comparison to the optimum blade design. The blade design is a constant chord blade
with no twist, using a Sikorsky SC1095 helicopter airfoil as shown in Figure 23 below.33
Figure 23. Sikorsky SC1095 rotorcraft airfoil
33
The operating conditions are set at 10,000 m altitude with 25 m/s wind speed. In
addition, the blade design is again a 50 m diameter and a 5 m hub diameter. The
calculations for power coefficient and thrust coefficient are given in Table 5 below.

66
Table 5. Constant chord, no twist blade calculations
Blade Station r (m) ΔCp ΔCT
root 2.5 1 3.625 -0.0035 0.0111
2 5.875 -0.0012 0.0191
3 8.125 0.0039 0.0313
4 10.38 0.0338 0.057
5 12.63 0.0473 0.0772
6 14.88 0.0564 0.0911
7 17.13 0.0627 0.1046
8 19.38 0.0475 0.0915
9 21.63 0.0025 0.0572
10 23.88 -0.0092 0.0528
tip 25
Cp CT
0.2402 0.5927
The power coefficient for this scenario (Cp of 0.24) is about half of the power
coefficient for the optimized blade (Cp of 0.49). The power coefficient values for the
simplified blade change a great deal depending on the operating conditions and blade
pitch angle.
In summary, Airborne Wind Energy devices must be highly reliable and
inexpensive to produce and maintain in order to keep lifetime costs low. Simple blade
designs will better meet these goals because they are cheaper to produce and will have
less internal stresses causing fatigue. The equations presented represent a design tool that
allows blade design of a rotor-based Airborne Wind Energy system. The design tool
assists in capturing the AWE resource in a way that will produce power for the least cost,

67
while being highly efficient over a wide range of operating conditions. Results and
analysis from the blade design tool will be presented and discussed in Chapter 4.
3. Base AWE System Feasibility
To develop the AWE technology, it is important to select good DoD locations for
pilot AWE systems to be deployed. These early AWE systems will help to determine the
best implementation methods, as well as build reliability and confidence in the
technology. Therefore, the first locations selected should be ones that will provide the
best probability of project success. To evaluate which USAF bases would provide the
best chance for success, a decision matrix was developed where a random sample of
several bases were scored on four categories. The four categories used for the assessment
are: base vulnerability to power outages; wind energy available locally in the higher-
altitude winds; space available; and energy and cost savings.
Each of these categories were given equal weight, and the methods used to
determine the score for each category are described in the following sections. For this
study, 27 major continental USAF bases were randomly selected. Additional Air Force
bases, or any other location, can also be compared using the same methodology described
in this chapter. Thus, AWE project planners can use these steps as a standard of
comparison to use when finding suitable locations for their project.
3.1. Base Vulnerability
The score for base vulnerability to power outages was based on the work of
Sabatowski, Thal, and Sitzabee.34, 35
This score reflects a motivational factor for the
installation. An USAF base installation and its leadership will have a greater desire to

68
develop alternate sources of energy if they are already searching for ways to improve the
security and reliability of their power supply. Sabatowski evaluated all of the major
continental USAF installations on several factors, and developed a vulnerability index
score for each location. High index scores indicate bases with high vulnerability to
power outages.
For the AWE viability decision matrix, the vulnerability index score is then
normalized on a 10-point scale by dividing each score by the highest score and then
multiplying by 10. Thus, the base with the highest score (e.g. Tinker AFB) receives 10
points, and the rest fall somewhere between 0 and 10.
3.2. Local AWE Power Density
The next score in the AWE viability decision matrix is for the energy available
locally in the high altitude winds at each USAF base. The score for this is based on the
―Global Assessment of High-Altitude Wind Power,‖ published by Archer and Caldeira.13
As shown previously in the thesis, Archer developed an atlas with a map showing the
average annual wind power density at any location in the world (see Figure 24). (Note:
this figure is the same as Figure 5, given in Chapter 2; the figure is again presented
below, repeated as Figure 24).
The left side of the figure shows average annual wind power density for an AWE
system if it is flown at the optimal altitude. The top box shows the power density
available at least 50% of the time; the next box gives the power density available at least
68% of the time; and the bottom box gives the power density available at least 95% of the
time. The right portion of the figure illustrates the optimal altitude for an AWE system
that would reach those power densities.

69
Figure 24. Optimal wind power density (kW/m2, left panels) and optimal height (km,
right panels) that were exceeded 50%, 68%, and 95% of the time during years in 1979-
200613
In order to determine the power density available at each USAF base, it was
useful to overlay the wind power map covering the U.S. on top of a map of the bases
being evaluated. A screen capture of the wind power map, zoomed in upon the U.S., was
taken as seen in Figure 25 below.

70
Three images were taken, one for each for the 50th
, 68th
, and 95th
percentile power
densities. Each image was then overlaid on top of a Google earth map of the U.S., and a
pin was placed in the location of each USAF base being evaluated (see Figure 26).
Figure 25. Screen shots from the High-Altitude Wind Power Atlas;13
zoomed in on the
U.S. for the 50th
(top left), 68th
(top right), and 95th
(bottom) percentile power densities
Figure 26. Google Earth view of the U.S., with a High-Altitude Wind Power map
overlay; the red paddle icons indicate the locations of the bases being evaluated; the
image overlay in this shot is for the 68th percentile wind power density

71
This method allows an easy way to determine the power density at each base. It
also allows other bases or locations to be added easily by doing a search for the base
location on Google earth and adding a marker. A good estimate for the wind power
density available at a location was determined by comparing the color of the location on
the map with the power density key (Figure 27) and observing the base locations
proximity to the contour lines.
Figure 27. Color key for the High-Altitude Wind Power map in kW/m2
The power density was recorded for each of the power density percentiles (50th
,
68th
, and 95th
), then the score was obtained by normalizing the data on a 10-point scale,
with the highest score receiving 10 points. Thus, each location was given three scores,
one for each power density percentile, and each of these scores was weighted equally
within the power available score category.
The AWE power density score is important because it will indicate which bases
have the strongest and most consistent high-altitude wind energy resource available in
their local area. A comparison between the data in Figure 26 and a map of ground-based
wind will reveal that the resource is actually excellent all across the U.S. However, the
score in this category will give project planners a good idea of how the wind energy
potential of one location will compare against other locations. The wind power density
trend for the U.S. reveals that the strongest wind power density is in the northeast, and
decreases for locations moving toward the south and the west. Higher scores in this

72
category will translate directly to cost savings for an AWE project, since each system will
produce more energy per unit in locations with the higher power density score.
3.3. Space Available
The success of an AWE system project at an USAF base is also dependent upon
finding space available to install and run the system. This will be particularly important
in the early stages of the system development and testing because it will take some time
for designers to improve the reliability and safety of the systems. Thus, the pilot program
systems will require a larger safety buffer zone.
Some factors to consider are: How much ground space is available next to the
base being considered? Is there space available in other locations nearby? How busy is
the air space in the area being considered? Answers to these questions were estimated
using data for population density maps and air traffic maps. The score for the space
available category is composed of three factors: population density in the county where
the USAF base is located; population density in a county adjacent to the base; and airline
traffic density.
Ideally, an AWE project planner would like to place the system right next to the
USAF base (or other location) that they are providing power for. A good indicator to
estimate the possibility of finding a suitable location with enough space is the population
density of the county where the base is located. Counties with low population densities
will have a better chance of having the space available for the project. They will also
tend to have lower costs associated with using the land. The bases in counties with very
low population densities were given the highest score.

73
The data for population density came from the 2009 population estimate data
given on the census.gov website.36
The population density for each county was recorded,
and then a score was given on a 10-point scale. The scale used is shown in Table 6. A
map showing a visual representation of the population data used is shown in Figure 28.
Table 6. Population Density Score key
In some cases, USAF bases are located in counties where the population density is
very high. This can occur if the base is in the same county as a city that is very large, yet
it still may be possible to find a location within a reasonable distance that may be
suitable. To estimate the likelihood of this, the population density of counties adjacent to
the bases’ county was also evaluated. The population density of the adjacent county with
the lowest population density was recorded, and a score was given for it based on the
same scale shown in Table 6.
Persons/mi2 Score
<10 10
10-49 9
50-99 8
100-199 7
200-299 6
300-399 5
400-499 4
500-699 3
700-999 2
1000-2000 1
>2000 0

74
Of course, it is more desirable to have the power system located directly next to
the user. So the bases county score is weighted higher within the space available
category than the score for adjacent counties. The split used was 40% for the base
county, and 20% for the adjacent county. The final 40% of the space available category
score is for the local air traffic density.
In order to operate an AWE system, it will be necessary to have sufficient air
space available in which to operate. The altitudes that these systems will be most
efficient at will be at altitudes that will be competing with other air traffic for space.
Therefore, bases in locations with low air traffic density will be more likely to obtain
approval to operate.
To compare the air traffic density of the local area for each USAF base, an
application tool called Airline Route Mapper was used.37
The tool shows the airline
Figure 28. Map of 2009 population density by county for the U.S. (U.S. Census Bureau)36

75
routes of over 650 airlines worldwide. Screenshots were taken of the airline routes over
the U.S., and the images were overlaid on Google Earth in the same manner as the wind
power density maps. In order to get a good resolution for the airline routes in the
screenshot images, the Airline Route Mapper was zoomed in upon the U.S., dividing the
country into approximately 4 even images. The images were then lined up on Google
Earth using the contours of the coasts and by matching up the major airports. Below is a
screen shot of the images overlaid on Google Earth, with the USAF bases showing
(Figure 29).
Figure 29. Airline route maps overlaid on a Google Earth map of the U.S.; airline routes
shown are from Airline Route Mapper data from December 2010.37
To compare the density of the air traffic over each USAF base, Google Earth was
zoomed in directly over each base to an eye altitude of 200 miles. A screen shot was
taken from this perspective for each USAF base, and the image was saved. Figure 30

76
below shows two sample images taken this way. The entire set of images can be found in
Appendix B.
The images were then sorted in order, from least air traffic to most air traffic.
This was done with an objective visual inspection, while locations with large airports
nearby and a lot of air traffic overhead were ranked lower.
Once the bases were ranked, they were grouped into one of six categories (shown
in Table 7) and scored accordingly. The air traffic ranking and scores, from lowest to
highest amount of air traffic, is given in Table 8.
Figure 30. Screen shot of air traffic over two USAF bases, taken at an eye altitude of 200
miles; left is Grand Forks AFB, ND, and on the right is Wright-Patterson AFB, OH
Table 7. Air Traffic Density Score Key
Air Traff ic Density Score
Low 10
Medium Low 8
Medium 6
Medium High 4
High 2
Extreme 0

77
If additional locations need to be evaluated, a screenshot for the additional
location can be taken and compared to the rest of the images found in Appendix B. The
appendix is used to evaluate and compare new images, identifying which one matches a
base the best. Then, the same score is applied to the base that it matches.
3.4. Energy and Cost Savings
The final category for comparison is the USAF base potential cost and energy
savings. Two factors were considered that contribute to this metric: base energy
requirement and the cost of electricity. Within the energy and cost savings category the
factor for cost of electricity was weighted higher at 60% because it contributes more
directly to cost savings per kWh of electricity produced. The electricity requirement
factor was weighted 40%.
The first factor examined was the base electricity requirement. The amount of
energy being used by a base represents how much energy the project can replace with
renewables; based on economies of scale, larger projects will tend to be more cost
effective per watt-hour produced. Larger projects are also more attractive because they
would make a larger contribution to U.S. independence from foreign oil, and directly
Table 8. Air Force Base Air Traffic Density Ranking and Scores
Rank AFB Score Rank AFB Score Rank AFB Score
1 Ellsworth 10 11 Beale 6 21 Seymour Johnson 2
2 Grand Forks 10 12 Tinker 6 22 Pope 2
3 Minot 10 13 Hill 6 23 WPAFB 2
4 Mountain Home 10 14 Little Rock 6 24 Patrick 0
5 Davis Monthan 10 15 FE Warren 6 25 Hanscom 0
6 Vandenberg 8 16 Luke 4 26 Langley 0
7 Eglin 8 17 Barksdale 4 27 McGuire 0
8 Vance 8 18 Arnold 4
9 Randolph 8 19 Los Angeles 4
10 McChord 8 20 MacDill 2

78
enhance national security. Therefore, bases that use more electricity annually are given
higher scores.
The data used for this evaluation came from the research of Sabatowski.34, 35
USAF base energy consumption figures were collected directly from the USAF civil
engineering energy managers. The data collected included the total annual energy
consumption of the base, presented in Mega watt-hours (MWh), for 2007. A table
showing the energy consumption data for most of the major USAF installations is
displayed in Appendix B.
To obtain the energy savings score, the total annual energy consumption (MWh)
was recorded. Then, the base energy consumption was normalized on a 10-point scale,
the base with the highest energy consumption receiving a score of 10 points.
The second factor considered was the cost of electricity within the USAF bases
local area. Higher local electricity costs would lead directly to higher cost savings for a
base implementing an AWE project. Thus, bases in areas with higher electricity prices
were also given higher scores.
The average price of electricity for each state is published by the U.S. Energy
Information Administration on their website.38
Below is a map showing the 2009
average price of electricity by state.
The price for each state an USAF base resides in was recorded. Then, the cost of
energy score was computed by normalizing the price figures on a 10-point scale, with the
base with the most expensive electricity price given a score of 10 points.

79
Figure 31. U.S. residential average price of electricity (kWh) for 200938
3.5. Base AWE Feasibility Methodology Summary
The final step for the base AWE decision matrix was to combine the scores from
the four categories, with each category being weighted equally. The end results were
scores for each base, given on a 100-point scale (0-100 points). These scores were then
ranked from highest (best) to lowest. The top six bases were further evaluated, and some
preliminary design and estimates for system efficiency, productivity, and cost were
outlined. These results, along with the results of the design tool and the AWE feasibility
study, will be presented and analyzed in Chapter 4.

80
IV. Analysis and Results
Chapter 4 is presented in three parts. First, a discussion about the purpose,
sample results, analysis and comparisons, and validation of the design tool is
communicated. Second, the AWE feasibility study for USAF bases is given. The third
and final part of the chapter consists of applying the knowledge learned about AWE
performance, efficiency, and design (using the design tool) to the top USAF bases so that
a realistic plan for achieving AWE projects will be met. Preliminary design of what an
AWE system project would look like at each base, how efficient each system would be,
how much power each system would produce, the size of each system, and the potential
cost savings and impact of each AWE system are presented.
1. Design Tool for AWE Blade Design
The goals in this first section of Chapter 4 are to: 1) use the design tool to show
sample results; 2) compare the results, produced through the design tool for a theoretical
AWE system, with three different blade designs operating at three different locations; and
3) validate the design tool results by comparing them to the results of the paper,
―Harnessing High-Altitude Wind Power.‖10
It should be emphasized that the design tool was created so that developers would
be able to use it to help design and predict the performance of an AWE system for a
desired application. The inputs and outputs could be selected by researchers and
developers in order to fulfill specific purposes adapted to the individual needs of each
USAF base or location. The selection for the sample inputs will first be explained. Then,
comparisons to examine trends among AWE sample outputs will be given.

81
To compare the performance of an AWE system with different blade shapes, and
to validate the design tool, a hypothetical AWE system was created. First, several design
choices where made which led to the design of this theoretical AWE system. Then, this
system was applied to three different USAF base locations. The design tool created
several sample outputs for each blade design, and analysis is provided. Three USAF base
locations were selected, and the locations pinpointed what local power density and
altitude should be used for the calculations.
The two main inputs for each USAF base location were the altitude and the power
density. The power density was based on the high-altitude wind power map for the
fiftieth percentile power densities.13
Selected USAF base locations were evaluated at
three different altitudes: 1,000 m, 5,000 m, and 9,000 m. These values were chosen
because 9,000 m was the altitude where the locations studied had the best power density.
1,000 m was chosen because this range was high enough in altitude to be outside of most
of the planetary boundary layer effects, but remained at the lower end of high-altitude
wind energy. 5,000 m was chosen because it provided a good idea of what performance
to expect when an AWE system would be operated at an intermediate altitude.
The three USAF base locations that were evaluated are: Hanscom, MA; Wright-
Patterson, OH; and Ellsworth, SD. Hanscom AFB was selected because this base had the
highest power density. WPAFB was selected because of its access to AFIT and to the
Air Force Research Labs (AFRL), in addition to having good power density and a high-
energy consumption and cost rankings. Ellsworth AFB was selected because it was a top
six USAF base (determined by the base feasibility matrix results), and this base had a

82
significant amount of space available, making Ellsworth a good candidate for piloting an
early AWE project.
The design tool was used to plot the chord and the twist for an optimal blade
design. The analysis, below, will compare the performance of this optimized design to
some simplified designs. This was done to study how much impact there was on
efficiency and power output performance when the blade design was simplified. The two
simplified designs to be compared are: simplified blade A, a no twist and no chord
variation; and simplified blade B, a variation with some linear twist and constant chord
(Figure 32 and Figure 33).
Figure 32. Blade chord shape, as a function of the radius
Figure 33. Blade twist angle, as a function of radius
0.0
1.0
2.0
3.0
4.0
5.0
6.0
7.0
0 5 10 15 20 25 30
Ch
ord
(m
)
Radius (m)
Optimum Blade
Simple Blades A & B
0
5
10
15
20
25
30
35
0 5 10 15 20 25 30
Tw
ist A
ng
le (
de
gre
es)
Radius (m)
Optimum Blade
Simple Blade B

83
A design choice of a two-meter chord length for the simplified blade was chosen
because it was a good approximation of the average chord length, when compared to the
optimal blade chord shape (Figure 32). Several values of linear twist for the simplified
blade B were tried, and the twist value that provided the best performance, over the range
of operating conditions sampled, had 6° of twist (shown in Figure 33). Note that the best
twist was small when compared to the optimum blade design that had up to 30° twist at
the blade root. However, Figure 33 shows that the twist angle was very similar to the
optimized blade twist angle on the outer portions of the blade. Since the outer portions of
the blade would rotate at the highest speed and provide most of the power for the system,
this relationship between the twist on the optimized blade and the simplified blade B
makes sense.
Several more design choices were made for this analysis. One design choice was
a 50 m rotor diameter, with a 2.5 m rotor hub radius and a 25 m blade radius. The
number of rotor blades was set at two. The number of rotors for the airborne system was
another design choice, and for this study, one single rotor was selected. The airfoil used
was the Sikorsky SC1095 airfoil because it seemed to perform well at high blade
speeds.33
The system was designed to have a 50% capacity factor, using the annual
average power densities of the 50th
percentile power densities, given in the High-Altitude
Wind Power Atlas.13
Additionally, a design choice (and variable with significant impact) was the angle
of the rotor axis. The angle of the rotor axis was set at 45° above the horizontal for the
calculation of maximum vertical lift and lift capacity, but for everything else, it was
assumed that the system was facing directly into the wind. The power and efficiency of

84
the system would also be affected when pointing the system upward to create vertical lift.
To calculate the loss of power and efficiency, the cosine of the angle would be multiplied
by the power output calculated (assuming that the system was facing directly into the
wind). This loss of efficiency in an AWE system would vary from somewhere between
10-30%, depending on the steepness of the upward pointing angle of the rotor axis.
Stronger winds and a lighter AWE system would allow smaller upward pointing of the
rotor axis. Since the thrust vector would be much larger with stronger winds, the vertical
component would then be sufficient to keep an AWE system airborne at lower angles.
There is a functional tradeoff between having vertical lift, or having power and
thrust, as the rotor points more and more upwards, power and thrust are reduced.
However, as more and more of the thrust vector points upward, it results in more vertical
lift. This variable is again important to the AWE system because the maximum vertical
lift would occur at approximately a 45° angle; however, the best power produced is at an
angle of 0°, which has zero vertical lift. Thus, a balance for an AWE system must be
struck somewhere between 45° and 0°–this would give enough lift, but maximize the
power output of a system.
Table 9, Table 10, and Table 11 show the key results from the design tool for the
three locations and the three altitudes studied. Table 9 gives the results for the optimized
blade design. The results for the simplified blade A, with no twist or chord variation, are
given in Table 10. Finally, Table 11 presents the results for the simplified blade B, with
constant chord and 6° of twist.

85
Table 9. Optimized blade shape performance
Table 10. Constant chord, no twist blade performance
Altitude
Pow
er density
Pow
er coeff
Efficiency
Pow
er out
Thrust
Max vertical lift
Lift capacity
9,000 m kW/m2W N N kg
Hanscom 10 0.489 48.9% 9,683,311 495,738 247,869 25,276
WPAFB 7 0.489 48.9% 6,735,715 389,188 194,594 19,843
Ellsworth 4 0.489 48.9% 3,845,578 267,841 133,921 13,656
5,000 m
Hanscom 3 0.489 48.9% 2,913,320 259,163 129,582 13,214
WPAFB 2 0.489 48.9% 1,926,957 196,741 98,371 10,031
Ellsworth 1.6 0.489 48.9% 1,559,070 170,827 85,414 8,710
1,000 m
Hanscom 0.45 0.489 48.9% 443,336 84,750 42,375 4,321
WPAFB 0.3 0.489 48.9% 294,300 64,493 32,247 3,288
Ellsworth 0.3 0.489 48.9% 294,300 64,493 32,247 3,288
Altitude
Pow
er density
Pow
er coeff
Efficiency
Pow
er out
Thrust
Max vertical lift
Lift capacity
9,000 m kW/m2W N N kg
Hanscom 10 0.304 30.4% 6,026,561 321,294 160,647 16,381
WPAFB 7 0.354 35.4% 4,873,262 246,536 123,268 12,570
Ellsworth 4 0.388 38.8% 3,050,965 201,606 100,803 10,279
5,000 m
Hanscom 3 0.385 38.5% 2,291,787 228,215 114,108 11,636
WPAFB 2 0.375 37.5% 1,478,350 178,358 89,179 9,094
Ellsworth 1.6 0.381 38.1% 1,213,082 154,441 77,221 7,874
1,000 m
Hanscom 0.45 0.380 38.0% 344,593 76,630 38,315 3,907
WPAFB 0.3 0.381 38.1% 228,966 58,309 29,155 2,973
Ellsworth 0.3 0.380 38.0% 228,710 58,314 29,157 2,973

86
Table 11. Constant chord, 6° linear twist blade performance
In each of the tables, the first two columns were design choices that were inputs to
the design tool. The power density used was the annual average for the location at each
altitude, referenced in the High-Altitude Wind Power Atlas.13
The biggest findings to see from this data are the high potential of the power that
could be generated from these systems. For example, at Hanscom AFB, all three of the
blade designs generated over 5.5 MW from a single 50 m diameter AWE system, at an
altitude of 9,000 m. Even Wright-Patterson and Ellsworth would generate over 4.5 and
3.5 MW, respectively.
Figure 34, from Wind Power Explained, illustrates that a ground-based wind
turbine with a 50 m diameter would only be rated for 660 kW. In order to achieve
capacities similar to an AWE turbine (also 50 m in diameter), a ground-based turbine
Altitude
Pow
er density
Pow
er coeff
Efficiency
Pow
er out
Thrust
Max vertical lift
Lift capacity
9,000 m kW/m2W N N kg
Hanscom 10 0.289 28.9% 5,561,599 290,436 145,218 14,808
WPAFB 7 0.331 33.1% 4,562,816 223,148 111,574 11,377
Ellsworth 4 0.403 40.3% 3,168,419 217,801 108,901 11,105
5,000 m
Hanscom 3 0.399 39.9% 2,375,009 212,147 106,074 10,816
WPAFB 2 0.396 39.6% 1,558,982 162,469 81,235 8,284
Ellsworth 1.6 0.402 40.2% 1,281,321 138,553 69,277 7,064
1,000 m
Hanscom 0.45 0.402 40.2% 364,355 68,738 34,369 3,505
WPAFB 0.3 0.402 40.2% 242,005 52,308 26,154 2,667
Ellsworth 0.3 0.402 40.2% 242,014 52,306 26,153 2,667

87
would need to be at least 126 m in diameter (nearly three times in diameter, and over six
times the area).5
Figure 34. Sample size, diameter, and rated power for ground-based wind turbines5
Another observation from the sample blade performance tables was that the
optimized blade design calculator, for the scenarios used, predicted an efficiency of
48.9%. At lower wind speeds, this was a reasonable estimate if a good airfoil design
would be used with a high lift-to-drag ratio. The estimates for efficiency and power were
higher than they should be for the higher wind power densities at Hanscom and Wright-
Patterson (at 9,000 m). This was because the optimal blade design calculations did not
take into account the decrease in lift-to-drag when the blade would operate at higher
Mach numbers in the transonic region (in the range of Mach 0.7 to 1). Notice that the

88
efficiencies calculated for the simplified blades at Hanscom and Wright-Patterson (at
9,000 m) were much lower than the optimal blade estimated efficiency. This was
because the calculator for the simplified blade design did include the effects of increased
drag as the blade speed approaches Mach 1. One way to avoid this increased drag from
operating in the transonic region would be to increase the number of blades on an AWE
system. This would allow the system to operate at a lower rotational speed, meaning the
blades could be kept at a speed under the transonic region.
Additionally, another important note when comparing the three different blade
designs were the efficiency differences between each of them. For the simplified blade
A, with constant chord and no twist, the efficiency across almost all of the operating
conditions was about 10% less than what was predicted for the optimized blade design.
With the exception of the high-altitude Wright-Patterson and Hanscom locations, the
efficiency drop was larger because of the increased drag effects as the blade wind speed
approached Mach 1, as mentioned above.
For simplified blade B, with constant chord and 6° of twist, the efficiency loss
was about 8%. A 2% increase over blade A, improvement came because it was closer to
the optimal shape than the non-twist version. Yet, it was not as much of an improvement
as a designer could hope for: an 8% loss in power generation, over the lifetime of a
system, would have tremendous cost impact. Therefore, the simplified blade would need
to have a very large cost savings in the form of being less expensive to manufacture
and/or having higher reliability in order to compensate for this loss.
An important trend to observe was the large difference in power generated at the
varying altitudes. The power generated at 1,000 m tended to be less than 1/10th
of the

89
power, generated at the same location, at 9,000 m. The power available at 1,000 m
would still be significantly greater, and a lot more consistent, than what would be
available at ground level. However, an AWE system operator would only want to
operate at the lower altitudes if it was necessary. On the other hand, at 5,000 m, the
power that could be generated was significantly lower than at 9,000 m. This option could
still be attractive because the resulting power generating predictions were significant.
The thrust and lift capacity numbers were also revelatory, because they showed
that for the lower altitudes, there was a lift capacity of 2,500-4,000 kg for a system. For
the higher altitudes, the lift capacity ranged from 10,000-25,000 kg per system. This was
remarkable, since 9,000 m of system cable would have significant weight.
From these results, a recommendation for blade design would be best satisfied by
using the design tool to tweak an AWE system design until satisfactory compromise
between efficiency needs and ease of manufacturing and reliability are met. The actual
structural analysis will be left for future work; however, the data presented using the
design tool will give AWE system designers accurate expectations of where to begin.
To validate the design tool, the tool was used to duplicate the calculations of
similar research in ―Harnessing High-Altitude Wind Power.‖ 10
The researchers
developed a four-rotor, Flying Electric Generator (FEG) designed to generate 240,000 W
(see Figure 19). The specifications for the FEG rotors were entered into the design tool,
and the results calculated by the design tool were compared to the results given in this
paper to see if both came up with similar performance predictions.
The FEG used four, two-bladed rotors, each having a diameter of 10.7 m. The
rated wind speed was set at 18.4 m/s, and the operating altitude was designed for 4,600

90
m. These operating conditions would produce a wind power density of about 2.4 kW/m2.
The blade used for the design comparison had a constant chord with no twist, comparable
to the simplified blade A studied earlier in the chapter. For these inputs, the design tool
calculated a coefficient of power of .395 (39.5% efficiency). This result was very close
to the estimated value, given in ―Harnessing High-Altitude Wind Power,‖ of .4 (40%
efficiency). After combining the calculated result for four rotors and accounting for an
electrical transmission efficiency of 90%, the design tool predicted a power output of 306
kW. Assuming a rotor axis angle of 45°, this resulted in a calculated power output of 216
kW. This result was extremely close to the paper’s predicted performance of 240 kW.
The small difference could be accounted for by assuming a slightly different rotor axis
angle. Thus, the design tool was validated.10
2. USAF Base AWE System Feasibility
When considering the development and use of a new technology like AWE, it was
important to select a location for the project that would provide the best chance for
success. Therefore, the goal of this evaluation was to provide a standardized method to
compare USAF bases (or other sites) to see which locations would be the best for a pilot
AWE project. A good score on this evaluation does not necessarily guarantee success,
nor does a bad score mean an AWE project would not provide great benefit to that
location. Each location would have various needs and challenges that will have to be
worked out in order to implement an AWE project of such scale and complexity. This
section of the research will identify and highlight key factors that should be considered in
order to pick the best base locations. Twenty-seven major continental USAF installations

91
were evaluated, based on these factors: base vulnerability to power outages; wind energy
available locally in the higher-altitude winds; space available; and energy and cost
savings. The top bases in each category were then identified, and six USAF bases with
top overall scores (as well as Hanscom, for comparison) are presented and discussed.
The information below presents the results of the USAF base feasibility matrix,
and provides analysis and discussion. The data used for the evaluation, and the results,
are shown in the subsequent table and figure (Table 12 and Figure 35).
2.1. USAF Base AWE Feasibility Category Results
The results of the U.S. Air Force base AWE evaluation are displayed in Table 12.
The final scores are visually represented in Figure 35. The techniques used for this
standard method of comparison were described in Chapter 3. Each of the four AWE
feasibility evaluation categories was color-coded; the blue columns in Table 12, and the
blue portions of the bar graph in Figure 35, represent the category for power outage
vulnerability. Red corresponds to the AWE power density available within the local area.
Green illustrates the space available category. The purple color code relates the cost and
energy savings category.
The first column in each category gives the overall category score. The following
columns contain the raw data for each of the category sub factors. The last columns in
each category show the normalized scores for the sub factors, on a 10-point scale.
The four highest scoring USAF bases in the category of vulnerability to power
outages are (in order): Tinker, OK; Vance, OK; Little Rock, AR; and McDill, FL. The
first three of these four are all within the same general region of the U.S. (each in one of
two neighboring states, Oklahoma or Arkansas). This category of vulnerability score was

92
based upon the vulnerability index developed by Sabatowski.35
These areas have had a
history of large power outages, each lasting a long amount of time. The leadership at
these USAF bases may be interested in an AWE project in order to help improve the
security of their energy supplies.
In the category of local AWE power density, the bases in the best locations for
power generation are: Hanscom, MA; McGuire, NJ; Wright-Patterson, OH; and Grand
Forks, ND. The best AWE power density in the U.S. is in the New England area, and the
wind strength gradually reduces for locations farther south and west (see Figure 26).
AWE power was particularly applicable for these locations because a high score here
could directly translate into cost efficiency for a system. Each AWE system operating in
these locations would produce significantly more power per generating system than at
other locations, because of their high scores in this category. The results at these USAF
bases would include lower costs for the required upfront infrastructure, as well as lower
rates for operating and maintenance costs per MWh of electricity produced.
The USAF bases that received the top scores for the space available category are:
Ellsworth, ND; Mt Home, ID; Grand Forks, ND; and Minot, ND. These locations would
have a high probability of finding a suitable location on the ground to base an AWE
system at, and they would provide a more reasonably sized safety zone than some of the
bases in more densely populated areas. These USAF bases would also be more likely to
obtain approval to use airspace and to operate at the ideal altitude for power generation.
The remoteness and land available at these locations would also contribute to lower costs
associated with using the land.

93
Table 12. Airborne Wind Energy (AWE) USAF base feasibility decision matrix
Pow
er Outage V
ulnerability
Vulnerability
Vulnerability
Local AW
E P
ower D
ensity
50th68th
95th50th
68th95th
Space A
vailable
County P
opulation Density
Lowest A
djacent County D
ensity
Air Traffic D
ensity
County P
opulation Density
Lowest A
djacent County D
ensity
Air Traffic D
ensity
Energy &
Cost S
avings
Energy R
equirement
Cost of Electricity
Energy R
equirement
Cost of Electricity
Total
Rank
Air Force Base State County Adjacent County
Ca
teg
ory
Sc
ore
No
rma
lize
d
Ca
teg
ory
Sc
ore
kW
/m2
kW
/m2
kW
/m2
No
rma
lize
d
No
rma
lize
d
No
rma
lize
d
Ca
teg
ory
Sc
ore
pe
rso
ns/m
i 2
pe
rso
ns/m
i 2
No
rma
lize
d
No
rma
lize
d
No
rma
lize
d
Ca
teg
ory
Sc
ore
MWh ¢/KWh
No
rma
lize
d
No
rma
lize
d
Arnold TN Coffee Grundy 8.5 0.39 3.4 13.3 7.0 2.5 0.3 7 5 4.0 15.5 122.4 39.2 Medium High 7 9 4 18.3 564,132 9.32 10.0 5.5 55.6 4
Barksdale LA Bossier Webster 12.8 0.59 5.1 10.3 5.5 2.0 0.2 5.5 4 2.9 15 133.0 68.0 Medium High 7 8 4 9.1 108,208 8.10 1.9 4.8 47.2 11
Beale CA Yuba Sierra 2.2 0.10 0.9 9.9 4.0 1.8 0.3 4 3.6 4.3 18 115.4 3.3 Medium 7 10 6 14.8 96,954 14.70 1.7 8.7 44.9 15
Davis Mon. AZ Pima Graham 0.7 0.03 0.3 8.2 4.0 1.5 0.2 4 3 2.9 22 111.0 8.0 Low 7 10 10 11.4 104,520 10.73 1.9 6.4 42.3 19
Eglin FL Okaloosa Covington AL 6.1 0.28 2.4 8.7 5.0 1.5 0.2 5 3 2.4 19.5 191.9 35.6 Medium Low 7 9 8 16.4 301,744 12.39 5.3 7.3 50.6 9
Ellsworth SD Meade Perkins 6.7 0.31 2.7 15.1 5.0 3.0 0.5 5 6 7.1 25 6.9 1.0 Low 10 10 10 8.5 54,442 8.49 1.0 5.0 55.4 5
F.E. Warren WY Laramie Platte 4.1 0.19 1.7 12.7 4.5 2.5 0.4 4.5 5 5.7 20 33.0 4.0 Medium 9 10 6 9.7 114,214 8.58 2.0 5.1 46.5 14
Grand Forks ND Grand Forks Steele 3.9 0.18 1.6 18.8 7.0 3.5 0.6 7 7 8.6 24 46.2 2.5 Low 9 10 10 8.3 87,578 7.58 1.6 4.5 55.0 6
Hanscom MA Middlesex Hillsborough NH 3.3 0.15 1.3 25.0 10.0 5.0 0.7 10 10 10.0 3 1839.0 463.0 Extreme 1 4 0 15.8 46,586 16.87 0.8 10.0 47.1 12
Hill UT Davis Morgan 7.0 0.32 2.8 11.8 4.5 2.0 0.4 4.5 4 5.7 11.5 1007.0 15.0 Medium 1 9 6 12.3 269,049 8.48 4.8 5.0 42.6 18
Langley VA Hampton York 4.6 0.21 1.8 17.2 7.5 3.0 0.5 7.5 6 7.1 1.5 2805.0 583.5 Extreme 0 3 0 12.4 169,034 10.61 3.0 6.3 35.7 25
Lit t le Rock AR Pulaski Lonoke 16.5 0.76 6.6 11.7 6.5 2.0 0.3 6.5 4 3.6 13 502.0 87.0 Medium 3 8 6 9.5 77,529 9.14 1.4 5.4 50.7 8
Los Angeles CA Los Angeles Kern 13.5 0.62 5.4 8.0 3.0 1.5 0.3 3 3 3.6 8 2427.0 99.0 Medium High 0 8 4 13.6 32,495 14.70 0.6 8.7 43.1 17
Luke AZ Maricopa Gila 2.2 0.10 0.9 8.8 4.0 1.5 0.3 4 3 3.6 12.5 437.0 11.0 Medium High 4 9 4 11.1 89,948 10.73 1.6 6.4 34.6 26
McChord WA Pierce Lewis 3.9 0.18 1.6 11.9 5.0 2.5 0.3 5 5 4.3 16.5 477.2 31.0 Medium Low 4 9 8 8.4 87,355 7.68 1.5 4.6 40.7 20
McDill FL Hillsborough Polk 15.0 0.69 6.0 6.8 3.0 1.5 0.2 3 3 2.1 5.5 1173.0 325.0 High 1 5 2 13.4 133,851 12.39 2.4 7.3 40.7 21
McGuire NJ Burlington Atlantic 1.5 0.07 0.6 20.9 8.5 4.0 0.6 8.5 8 8.6 5 558.6 489.0 Extreme 3 4 0 15.9 80,796 16.31 1.4 9.7 43.3 16
Minot ND Ward Burke 5.0 0.23 2.0 17.0 6.5 3.0 0.6 6.5 6 7.9 24 28.3 1.7 Low 9 10 10 7.9 64,168 7.58 1.1 4.5 53.8 7
Mt Home ID Elmore Camas 1.3 0.06 0.5 12.7 4.5 2.5 0.4 4.5 5 5.7 25 9.4 1.0 Low 10 10 10 7.8 46,237 7.80 0.8 4.6 46.7 13
Patrick FL Brevard Osceola 7.2 0.33 2.9 7.2 3.5 1.5 0.2 3.5 3 2.1 6 527.8 203.8 Extreme 3 6 0 12.3 70,355 12.39 1.2 7.3 32.6 27
Pope NC Cumberland Bladen 4.8 0.22 1.9 13.6 7.0 2.5 0.3 7 5 4.3 10.5 483.4 37.0 High 4 9 2 9.4 30,959 9.99 0.5 5.9 38.3 23
Randolph TX Bexar Bandera 3.0 0.14 1.2 8.8 4.0 1.5 0.3 4 3 3.6 13.5 1332.0 26.0 Medium Low 1 9 8 12.6 92,208 12.38 1.6 7.3 38.0 24
Seymour J. NC Wayne Duplin 3.9 0.18 1.6 13.6 7.0 2.5 0.3 7 5 4.3 12 205.8 65.2 High 6 8 2 10.1 70,730 9.99 1.3 5.9 39.6 22
Tinker OK Oklahoma Lincoln 25.0 1.15 10.0 13.9 6.0 2.5 0.4 6 5 5.7 11.5 1011.0 34.0 Medium 1 9 6 15.7 460,255 8.49 8.2 5.0 66.1 1
Vance OK Garfield Grant 19.6 0.90 7.8 13.9 6.0 2.5 0.4 6 5 5.7 21 55.0 4.0 Medium Low 8 10 8 8.0 27,523 8.49 0.5 5.0 62.5 2
Vandenberg CA Santa San Luis Obispo 4.6 0.21 1.8 9.5 3.5 1.8 0.3 3.5 3.6 4.3 19 148.8 80.9 Medium Low 7 8 8 17.3 241,241 14.70 4.3 8.7 50.4 10
Wright Patt OH Greene Fayette 7.4 0.34 3.0 19.3 8.0 4.0 0.5 8 8 7.1 11 386.3 69.2 High 5 8 2 18.1 488,081 10.67 8.7 6.3 55.8 3
Category Weight 25 25 25 25 100
Sub Factor Weight 100 33.3 33.3 33.3 40 20 40 40 60

94
Figure 35. USAF base AWE feasibility study results
0
10
20
30
40
50
60
70
Power Outage Vulnerability Local AWE Power Density Space Available Energy & Cost Savings

95
Because space available is so important for operating an AWE system, some of
the bases with the lowest scores in this category could face some very strong resistance to
operating AWE systems in their area. Because of this, it is significant to note which
USAF bases received the lowest scores in this category. The worst scores in this
category were given to: Langley, VA; Hanscom, MA; McGuire, NJ; and McDill, FL.
Some options that these locations would have to consider, in order to operate AWE
systems, are listed below.
Find a hole in the existing air traffic patterns
Have the FAA create a space where AWE systems can operate
Find a location (away from large airports) that may have air traffic in the
higher altitudes, and operate a system at lower altitudes
Deploy a sea-worthy version of an AWE system off the coast
Each of these options could present difficult challenges, as well as high additional
costs and risks. Note that two of the bases with the worst space available (Hanscom and
McGuire) are locations that have the best power density available, as well as having the
highest electricity costs. These factors make it tempting to try to implement an AWE
system, despite the additional challenges.
Energy and cost savings were accounted for in the final category that was
evaluated. The USAF bases with the best score are: Arnold, TN; Wright-Patterson, OH;
Vandenberg, CA; and Eglin, FL. Each of these locations have reasonably high electricity
prices, and also have very high levels of energy consumption that dwarf the consumption
of some of the smaller installations. In some cases, these bases consume 10 times more
energy than smaller USAF bases. Even though the cost of electricity factor was weighted

96
more than the energy requirement factor, the latter still had a very strong impact on the
score for this category. It would be most beneficial to place an AWE project at the USAF
bases that scored well in the energy and cost savings category, because this would
provide a much larger impact on renewable energy use and cost savings (even if these
bases only utilized a single project) than other locations would.
2.2. Results: Overall Best USAF Base AWE Feasibility Scores
The bases that received the top six overall combined scores are (in order,
beginning with the highest ranking): Tinker, OK; Vance, OK; Wright-Patterson, OH;
Arnold, TN; Ellsworth, SD; and Grand Forks, ND. Figure 36, below, shows the score for
the top six bases, as well as Hanscom, MA, for comparison.
Figure 36. AWE feasibility scores for the top six USAF bases; Hanscom (ranked 12th
overall) was also added for comparison, since it had the highest power density score
0
10
20
30
40
50
60
70
AW
E Fe
asib
ility
Sco
re
Power Outage Vulnerability Local AWE Power Density Space Available Energy & Cost Savings

97
All of the top six bases scored as a top four base in either one or two categories.
For the most part, none of these bases scored poorly in any of the four categories, which
could make them balanced options for an AWE project. These top six stand in contrast
with Hanscom, which scored very well in two categories, but had very low scores in the
space available and vulnerability categories. This imbalance contributed to its relatively
lower 12th
place overall ranking, and addressed the possibility of some serious
implementation difficulties. The low power outage vulnerability for a base means that
USAF leadership could have a reduced motivation for the project, and the low space
available could cause location difficulties already discussed.
Tinker AFB was given the highest overall score because this base scored fairly
well in each category, but additionally had a high vulnerability score. It received the top
vulnerability score, which was significantly higher than the number two vulnerability
score for Vance AFB. Tinker also has had very large energy consumption, at about
460,000 MWh per year, which is the third highest for energy consumption of the bases
studied. Tinker’s only weakness was a high county population density; however, there is
a county nearby with a low population density, and the air traffic around Tinker is
average. An AWE project could need to be some distance from this base, increasing the
project costs, but the overall combination of good scores in all categories made this base
the best initial choice for an AWE pilot system.
Vance AFB had the next highest overall score. Vance came in second in the
vulnerability score, and it had more space available than Tinker. Vance is located close
to Tinker, so they both had the same average score for AWE power density available.
The biggest weakness for Vance was that this base has had a somewhat low price for

98
electricity, combined with a small energy consumption of only 28,000 MWh. Vance’s
other high scores suggested that if beginning with a small AWE project is desirable, then
this USAF base would be a good place to start.
Wright Patterson Air Force base was third overall. WPAFB received the second
highest energy and cost savings score, and the third highest AWE power density score.
The combination of these two scores made WPAFB a very exciting location for an AWE
project, since it could produce enormous benefits in the form of cost efficiency per MWh
produced, as well as provide overall impact and considerable energy benefits through a
single project. The challenge at WPAFB was finding available airspace.
Arnold AFB was ranked fourth overall, getting the top score in cost and energy
savings. The base has consumed a whopping 564,000 MWh each year. Arnold gets
slightly above average scores in the rest of the categories, suggesting that this base would
be a well-rounded location for putting an AWE project at; Arnold also has had a high
potential to make a large difference in renewable energy use and cost savings.
Ellsworth and Grand Forks Air Force bases had nearly identical overall scores,
ranking fifth and sixth respectively. Both bases were in the top four of the space
available category (first and third, respectively). Ellsworth and Grand Forks also had
good AWE power density scores (seventh and fourth, respectively). However, these
bases’ vulnerability scores were average, and their energy and cost savings scores were
well below average, so the impact of an AWE project would be limited in size. The
biggest advantage to these locations would be that they would be relatively easy to site,
and they would provide efficient power.

99
These top six ranked USAF bases comprised the best balance of factors that
would contribute to a successful AWE project. The next section will apply some of the
data (compiled using the design tool), about AWE performance and design, to the energy
requirements of these top ranked bases. Then, projections about what an AWE system at
these locations would look like and how it would perform are presented.
3. Preliminary USAF Base AWE System Design and Performance
This final section of Chapter 4 used the design tool and the top six USAF bases
(as well as Hanscom) to output an estimated design for an AWE system that would meet
each bases’ needs. Preliminary design of each base AWE system project, the efficiency
of each system, the power output of each system, and the size of each system were
proposed. From these factors, the performance of the system, the potential cost savings,
and the impact for each base location could be predicted. Overall impact for the DoD is
then put forward.
Table 13. Base AWE project design
AFB Arnold Ellsworth Grand Forks Hanscom Tinker Vance Wright Patt
State TN SD ND MA OK OK OH
Ranking 4 5 6 12 1 2 3
Power requirement (MWh) 564,132 54,442 87,578 46,586 460,255 27,523 488,081
Annual energy /AWE system (MWh) 24,409 19,054 25,793 36,737 21,448 21,448 29,348
Number of systems to meet demand 29 4 5 2 27 2 21
Annual energy generated (MWh) 566,281 60,971 103,170 58,779 463,273 34,317 493,044
Cost of energy (¢/kWh) 9.32 8.49 7.58 16.87 8.49 8.49 10.67
Value of energy generated (Million) $52.8 $5.2 $7.8 $9.9 $39.3 $2.9 $52.6
Cost of AWE @ 2 ¢/kWh (Million) $11.3 $1.2 $2.1 $1.2 $9.3 $0.7 $9.9
Cost savings (Million) $41.5 $4.0 $5.8 $8.7 $30.1 $2.2 $42.7
% Cost savings 79% 76% 74% 88% 76% 76% 81%

100
Table 13 shows some projected system design, performance, and cost figures for
an AWE project applied to the top six USAF bases, and Hanscom. The table gives an
idea of what it would take to meet the needs of an USAF base using an AWE project.
The table shows several aspects of what a projected AWE design would look like.
The power requirement for each base, how much energy a single theoretical AWE system
would provide annually, and the number of systems needed to meet the demands of each
USAF base were presented. Next, the total commercial value of the energy generated for
each base (based on current electricity prices) was calculated. Based on the estimated
cost of energy to produce AWE power, when compared to current electricity rates, a
projection of potential cost savings was made. The cost used for this assessment was
2¢/kWh (see Figure 37).9, 10
Finally, the total cost savings and percentage of cost savings
was determined. The numbers of potential savings using this AWE technology were
impressive. Imagine if the USAF’s electricity bill could be reduced by 70-80%! Just
these seven combined AWE projects could save the USAF $135 million, annually.
Figure 37. Comparison of the projected average cost of energy from several sources,
based on data from the ―High-Altitude Wind Power Generation‖9,
10

101
There were several design choices and assumptions used to calculate these
figures. First, the same theoretical 50 m diameter AWE system, developed in the design
tool section of this chapter, was used. It was assumed that the AWE system would be
operated at the altitude with the best power density, which would be at about 9,000 m
most of the time. Figure 38 shows the assumed operating power density that an AWE
system would use for each USAF base location.
Figure 38. Estimated power density operating time distribution
Figure 38 shows the assumption that 50% of the time, the system operated at its
peak (in the 50th
percentile power density). For the next percentage of time, it was
0
2
4
6
8
10
12
0 20 40 60 80 100
Po
we
r D
en
sity
kW
/m2
Time Distribution
Power Density Operating Time Distribution
Wright Patt
Vance
Tinker
Hanscom
Grand Forks
Ellsworth
Arnold

102
assumed to operate on a distribution spread linearly between the 50th
and 68th
percentile
power density, and then the 68th
to 95th
power density. At least 5% of the time, no power
would be produced. An aerodynamic efficiency of 30%, and 20% of electrical losses,
were also assumed.10
The culmination of this information is a strategy for future AWE project planners
to use in designing and fielding AWE systems. The feasibility of AWE systems at these
top six USAF bases is promising. Utilizing AWE systems in other locations can then
become more viable, too, as AWE system use is honed and broadened. The design tool
has provided a method to analyze and predict the performance of an individual AWE
system. The feasibility study provided a method by which a good location could be
selected for an AWE project. With this information, users can now plan for and project
the benefits that an AWE system could provide for any USAF base, and other energy
applications. The examples given in this chapter have helped to demonstrate that there
are great benefits in the form of cost savings, energy security, and renewable and clean
energy available from the AWE resource.
Based on current technologies, the research has shown how dramatic the impact
of AWE systems can be for the DoD. But if battery technologies continue to improve
and vehicle fleets transition to electric and hybrid vehicles, electricity consumption will
continue to rise over the next several years. It is even likely that many aircraft developed
in the future will be electric or hybrid. As this transformation in energy consumption for
the U.S. economy and for the DoD occurs, USAF AWE systems would magnify the
redeeming impact that the development of AWE technology could have.
103
V. Conclusions and Recommendations
1. Conclusions of Research
Tapping into higher altitude winds will have many advantages and challenges.
For example, one advantage involves the effects that the planetary boundary layer and the
jet streams have on power density as altitude increases. These effects lead to wind speeds
that are up to 10 times faster than those near the ground, resulting in much higher power
density. Another advantage of AWE is that there are more consistent winds, reducing the
intermittency and energy storage requirements typically experienced by other renewable
energy sources. Also, the energy source comes to the AWE system so that the system
can work in isolated locations without importing fuel or being dependent on the local
utilities and infrastructure. A major advantage of AWE is the global availability of the
high-altitude wind, with a plentiful supply available domestically in the U.S.
The AWE technology does face some significant challenges that need to be
overcome. One challenge is the increased complexity of an airborne system. The
airborne nature of AWE systems requires the use of lighter and more expensive materials.
An airborne system will also require the development of flight controls. The long tether
is also a significant design challenge. An additional obstacle to AWE implementation is
the issue of allocating air space for the AWE systems to use and share with other aircraft.
Despite the challenges of AWE technology, no obstacles appear to be insurmountable.
AWE could be very beneficial for supporting military energy needs. AWE can be
used in remote areas, wartime areas, on bases, and in certain areas of civilian populations
(where air traffic does not travel). From a civil engineering perspective, AWE can be one

104
of the tools that will be in place first as the military sets up new installations, especially in
areas without electricity or other energy sources.
AWE can have great impact on the security, economics, and environment for the
USAF, and for the country. Supporting security and national energy independence, AWE
can provide a stable and consistent source of domestic energy that is renewable. This
will allow the USAF to meet the goals of the National Security Strategy2 and the Air
Force Energy Plan 2010.39
Economically, researchers estimate that the cost of fully
developed AWE technology will produce energy that will be less expensive than any
other current source of energy at around 2¢/kWh (see Figure 37).9, 10
AWE energy can
tremendously benefit the USAF, since energy costs the USAF $9 billion per year (8% of
the total USAF budget).39
If renewables are to be massively adopted by the USAF or the population, the key
is that the cost of renewables (such as AWE) must be lower than fossil fuels.
Renewables need to be cheaper than fossil fuels and become the go-to source of energy,
leaving the fossil fuels as the backup when the availability of the preferred renewable
source is not available.
The design tool developed in this research will be beneficial for the future
development of AWE systems because it has the adaptability to analyze the blade/rotor
performance at any altitude and at any operating condition. The design tool will allow an
optimum blade design to be chosen that meets the criteria of having a good combination
of efficiency, while being easily and inexpensively manufactured. Key results from the
blade design comparisons are that the optimal blade design had 48.9% projected
efficiency, while the simplified blade A (with no chord or twist variations) had 30-38%

105
predicted efficiencies, and the simplified blade B (with constant chord and 6° twist) had
predicted efficiencies of 28-40%. The efficiency numbers that the design tool realized
are promising. Through the design tool, analysis is ongoing. Changes in the design have
a large affect on the performance of the blade, therefore, it is important to use a good tool
to design the best AWE system blade for an application.
The design tool is an invaluable instrument for analyzing trends of and coming up
with recommendations for blade designs for AWE systems to be used at USAF bases.
USAF bases with high vulnerability to utility power disruptions have an increased need
for an alternate source of energy to improve the security of their energy.34, 35
Using the
base feasibility decision matrix, bases with a high vulnerability were scored higher
because of their greater motivation to acquire an alternate energy source. The higher the
power density, the more power a particular-sized system can output. Therefore, the cost
of a system at a location with a high power density will be cheaper, so USAF bases with
a high power density were scored higher in that category. The AWE system will need
adequate air and ground space as a safety zone for testing and implementation; thus,
bases with low population densities were scored higher, since finding a suitable location
is more likely. In addition, bases that have a low population density in an adjacent
county were also scored higher. USAF bases that consume a high amount of energy, and
have higher electricity rates, would benefit more by having a larger decrease in their
electric bill. These bases were scored highest in that specific category. Each category
was weighted based upon its relative importance.
The highest scoring USAF bases of those sampled in the decision matrix were
Tinker, Vance, Wright-Patterson, Arnold, Ellsworth, and Grand Forks (Hanscom was

106
also scored), with scores ranging between 40-60 out of 100. USAF bases beyond what
Figure 35 shows can additionally be scored in a similar manner, so that planners can
decide the viability of their particular base. Once any base has been selected, the design
tool can then be used to design, prototype, and manufacture an AWE system tailored to
the energy needs of each selected USAF base.
Key results, from applying a preliminary AWE system design to the top USAF
bases, showed a potential for 75-80% in cost savings for electricity. Applying airborne
wind energy to just these seven bases studied could provide up to $135 million in annual
savings for the USAF.
2. Recommendations for Future Research
The results presented in this thesis show that AWE is viable for supplying USAF
base energy needs. It is important to continue analysis of energy conversion on different
blade designs, because what is most efficient and most cost-effective for the design of an
AWE system can then be determined and made into a functioning system for use by the
USAF and DoD.
It is also recommended that a follow-on cost analysis for the blades of different
designs be done. This analysis would compare how much total energy is produced over
the lifetime of an AWE system rotor blade, and project how much longer one blade
would last than the other. Then, a final comparison on which blades would win out in
lifetime costs would help AWE technology be affordable from the get-go of USAF use.
Future research should be conducted to develop the flight controls of an AWE
system. A Finite Element Model should be constructed, in order to optimize the

107
structures used for the AWE system. Additional analysis to optimize the number of
rotors used in a single AWE system should also be conducted.
Because AWE technology has the potential to transform the energy dynamics
within the USAF, it is recommended that the Air Force immediately begin a program to
develop and field an AWE system. Major companies and research offices should
compete for bids in an effort to rapidly advance, improve, and employ AWE technology.
Ken Caldeira, Professor of Global Ecology, has said, ―There is enough energy in
high-altitude winds to power civilization 100 times over. Sooner or later, we’re going to
learn to harness that vast resource and use it to run civilization.‖7 This thesis
recommends continued research and active development of harnessing high-altitude wind
power, or AWE, for the use of the USAF.

108
Appendix A: Design Tool Screen Shots
Figure 39. Design tool screen shot of optimal blade design calculations

109
Figure 40. Design tool screen shot of simplified blade design calculations (Part 1)

110
Figure 41. Design tool screen shot of simplified blade design calculations (Part 2)

111
Figure 42. Design tool screen shot of atmosphere density calculations

112
Figure 43. Design tool screen shot of thrust and lift capacity calculations

113
Figure 44. Design tool screen shot of USAF base AWE cost and energy savings calculations

114
Appendix B: USAF Base Feasibility Study Data
Table 14. USAF base electricity consumption data for 2007
Air Force Bases UtilityFY07 Consumption
(MWH)States Air Force Bases Utility
FY07 Consumption
(MWH)States
ASCENSION ISLAND 3,479 N/A LACKLAND AFB (incl. Wilford Hall) City Public Serv-SA 286,317 Texas
AF ACADEMY City of Colo Spgs, WAPA 123,454 Colorado LANGLEY AFB Virginia Elect Pwr Co/PJM 169,034 Virginia
ALTUS AFB Western Farmers Electric 64,175 Oklahoma LAUGHLIN AFB AEP Texas Central 43,721 Texas
ANDERSEN AFB Navy/ Guam Power Authority 74,388 Guam LITTLE ROCK AFB Entergy 77,529 Arkansas
ANDREWS AFB PEPCO/PJM 88,415 Maryland LOS ANGELES AFB So Cal Edison 32,495 California
ARNOLD AFB TVA 564,132 Tennessee LUKE AFB Arizona Public Service, WAPA 89,948 Arizona
BARKSDALE AFB SWEPCO 108,208 Louisiana MacDILL AFB Tampa Electric Co. 133,851 Florida
BEALE AFB PG&E, WAPA (100%) 96,954 California MALMSTROM AFB Montana Power Co 78,356 Montana
BOLLING AFB PEPCO/PJM 83,259 D.C. MARCH ARB So Cal Edison 38,878 California
BUCKLEY AFB Public Serv Colorado 103,175 Colorado MAXWELL AFB Ala. Power Co. 109,828 Alabama
CANNON AFB SW Public Serv, WAPA 40,182 New Mexico McCHORD AFB City of Seattle 87,355 Washington
CAPE CANAVERAL AFS FP&L 129,775 Florida McCONNELL AFB Kansas Gas & Elect 39,349 Kansas
CHARLESTON AFB Santee Cooper 61,131 South Carolina McGUIRE AFB Jersey Central P&L 80,796 New Jersey
CHEYENNE MTN AFB Colorado Spgs Util, WAPA 32,608 Colorado MINOT AFB Verendrye Elect 64,168 North Dakota
COLUMBUS AFB TVA 47,717 Mississippi MOODY AFB Colquitt EMC 48,535 Georgia
DAVIS-MONTHAN AFB Tucson Elect Pwr 104,520 Arizona MT HOME AFB Idaho Electric 46,237 Idaho
DOBBINS ARB Georgia Pwr Co. 21,625 Georgia NELLIS AFB Nevada Power, WAPA 114,032 Nevada
DOVER AFB City of Dover/Delaware 60,342 Delaware CREECH (Part of Nellis AFB) Nevada Power, WAPA 10,815 Nevada
DYESS AFB AEP Texas North 69,368 Texas OFFUTT AFB Omaha Public Power/ WAPA (100%) 154,128 Nebraska
EDWARDS AFB So Cal Edison, LADWP, WAPA 180,621 California PATRICK AFB Fla. Power & Light 70,355 Florida
EGLIN AFB Gulf Power Co. 301,744 Florida PETERSON AFB City of Colo Spgs, WAPA 128,599 Colorado
EIELSON AFB Golden Valley Electric Assoc./ Self-Gen 1,162 Alaska POPE AFB Ft. Bragg (Carolina P&L) 30,959 North Carolina
ELLSWORTH AFB WAPA (Basin Elect) 54,442 South Dakota RANDOLPH AFB City Public Serv-SA 92,208 Texas
ELMENDORF AFB ML&P 147,801 Alaska ROBINS AFB Georgia Pwr Co. 392,612 Georgia
F E WARREN AFB Rocky Mtn Gen., WAPA 114,214 Wyoming SCHRIEVER (FALCON) AFB Mtn View Elect / WAPA 79,099 Colorado
FAIRCHILD AFB BPA 90,206 Washington SCOTT AFB Illinois Power Co. 171,974 Illinois
GOODFELLOW AFB AEP Texas North 47,791 Texas SEYMOUR-JOHNSON AFB Carolina P&L 70,730 North Carolina
GRAND FORKS AFB Nodak Co-op/WAPA 87,578 North Dakota SHAW AFB S. Carolina Elect & Gas 87,955 South Carolina
GUNTER AFB Ala. Power Co. 53,838 Alabama SHEPPARD AFB TXO 137,082 Texas
HANSCOM AFB Boston Edison/ NEPOOL 46,586 Massachusetts TINKER AFB OG&E 460,255 Oklahoma
HICKAM AFB HECO 129,943 Hawaii TRAVIS AFB PG&E, WAPA (100%) 127,856 California
HILL AFB Utah Pwr & Light, WAPA 269,049 Utah TYNDALL AFB Gulf Power Co. 99,288 Florida
HOLLOMAN AFB El Paso Electric, WAPA, Otero Co-op 118,155 New Mexico VANCE AFB SWAPA 27,532 Oklahoma
HURLBURT FLD Gulf Power Co. 110,704 Florida VANDENBERG AFB PG&E 241,241 California
KEESLER AFB Miss. Power Co. 138,597 Mississippi WHITEMAN AFB Energy One 72,938 Missouri
KIRTLAND AFB Public Serv New Mex/ WAPA 112,134 New Mexico WRIGHT-PATTERSON AFB Dayton P&L/PJM 488,081 Ohio

115
(1) Ellsworth
(2) Grand Forks
(3) Minot
(4) Mountain Home
Air traffic ranking lowest
to highest density
1. Ellsworth
2. Grand Forks
3. Minot
4. Mountain Home
5. Davis-Monthan
6. Vandenberg
7. Eglin
8. Vance
9. Randolph
10. McChord
11. Beale
12. Tinker
13. Hill
14. Little Rock
15. F.E. Warren
16. Luke
17. Barksdale
18. Arnold
19. Los Angeles
20. MacDill
21. Seymour Johnson
22. Pope
23. Wright-Patterson
24. Patrick
25. Hanscom
26. Langley
27. McGuire

116
(5) Davis-Monthan
(6) Vandenberg
(7) Eglin
(8) Vance
(9) Randolph
(10) McChord
(11) Beale
(12) Tinker

117
(13) Hill
(14) Little Rock
(15) F.E. Warren
(16) Luke
(17) Barksdale
(18) Arnold
(19) Los Angeles
(20) MacDill

118
(21) Seymour Johnson
(22) Pope
(23) Wright-Patterson
(24) Patrick
(25) Hanscom
(26) Langley
(27) McGuire
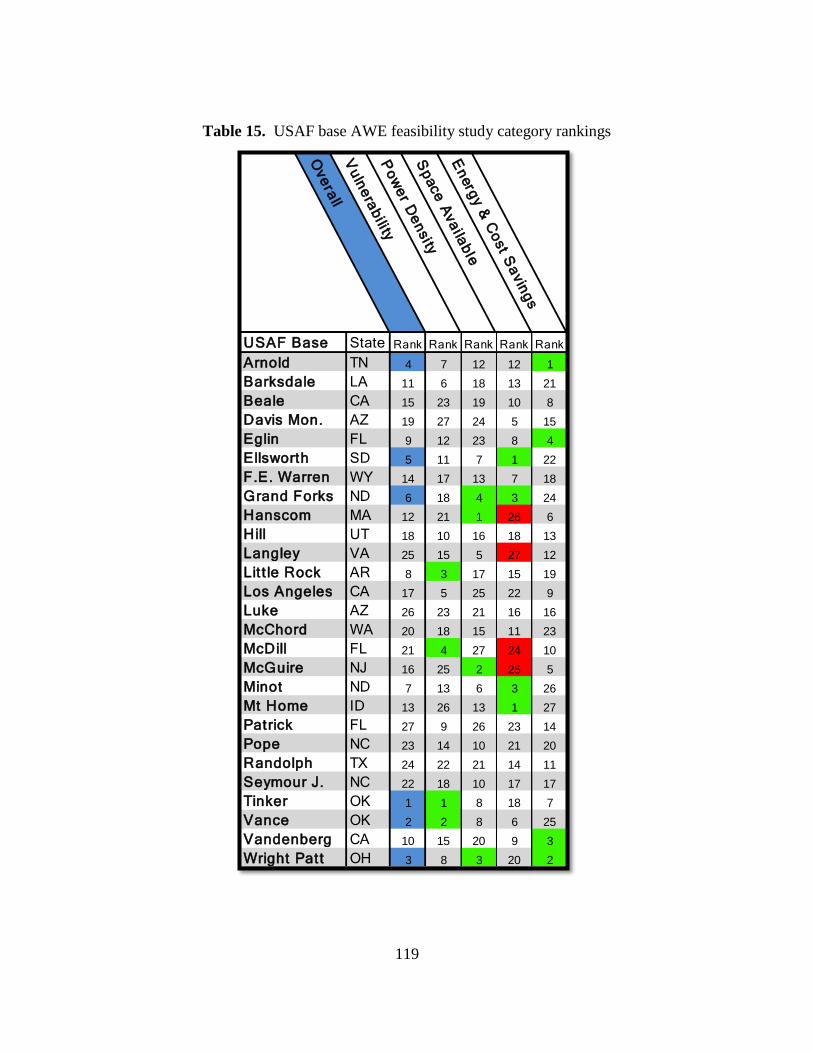
119
Table 15. USAF base AWE feasibility study category rankings
Ove
rall
Vu
lne
rab
ili tyP
ow
er D
en
sity
Sp
ace
Ava
ilab
leE
nerg
y &
Co
st S
avin
gs
USAF Base State Rank Rank Rank Rank Rank
Arnold TN 4 7 12 12 1
Barksdale LA 11 6 18 13 21
Beale CA 15 23 19 10 8
Davis Mon. AZ 19 27 24 5 15
Eglin FL 9 12 23 8 4
Ellsworth SD 5 11 7 1 22
F.E. Warren WY 14 17 13 7 18
Grand Forks ND 6 18 4 3 24
Hanscom MA 12 21 1 26 6
Hill UT 18 10 16 18 13
Langley VA 25 15 5 27 12
Lit t le Rock AR 8 3 17 15 19
Los Angeles CA 17 5 25 22 9
Luke AZ 26 23 21 16 16
McChord WA 20 18 15 11 23
McDill FL 21 4 27 24 10
McGuire NJ 16 25 2 25 5
Minot ND 7 13 6 3 26
Mt Home ID 13 26 13 1 27
Patrick FL 27 9 26 23 14
Pope NC 23 14 10 21 20
Randolph TX 24 22 21 14 11
Seymour J. NC 22 18 10 17 17
Tinker OK 1 1 8 18 7
Vance OK 2 2 8 6 25
Vandenberg CA 10 15 20 9 3
Wright Patt OH 3 8 3 20 2

120
References
1Hillburn, M., "The Price of Power: Pentagon seeks more sources of renewable energy
to control future costs," Sea Power, Vol. 50, No. 7, 2007, pp. 20-22.
2The White House. "National Security Strategy," [updated 2010]
http://www.whitehouse.gov/sites/default/files/rss_viewer/national_security_strategy.pdf
[cited 06/01/2010].
3Yergin, D., "Energy Independence," Wall Street Journal, No. January 23, 2007.
4Aliberti, K., and Bruen, T.L., "Energy on Demand," Army Logistician, Vol. 39, No. 1,
2007, pp. 28-33.
5Manwell, J., McGowan, J., and Rogers, A., "Wind Energy Explained : Theory,
Design, and Application," Wiley, West Sussex, United Kingdom, 2009.
6GAO, "DOD Needs to Take Actions to Address Challenges in Meeting Federal
Renewable Energy Goals," U.S. Government Accountability Office, GAO-10-104, 2010.
7AWE Consortium. "Airborne Wind Energy Consortium,"
http://www.aweconsortium.org/ [cited 2/2/2011].
8AWE Consortium. "Airborne Wind Energy Conference," http://www.awec2010.com/
[cited 2/2/2011].
9Fagiano, L., Milanese, M., and Piga, D., "High-Altitude Wind Power Generation,"
Energy Conversion, IEEE Transactions on, Vol. 25, No. 1, 2010, pp. 168-180.
10Roberts, B.W., Shepard, D.H., Caldeira, K., "Harnessing High-Altitude Wind
Power," Energy Conversion, IEEE Transactions on, Vol. 22, No. 1, 2007, pp. 136-144.
11Magenn Power Inc. "Magenn Power Inc." http://www.magenn.com/index.php [cited
5/18/2010].
12NASA. "AtmosModeler Simulator - Version 1.2a,"
http://www.grc.nasa.gov/WWW/K-12/airplane/atmosi.html [cited 5/21/2010].
13Archer, C.L., and Caldeira, K., "Global assessment of high-altitude wind power,"
Energies, Vol. 2, No. 2, 2009, pp. 307-319.
14Sky WindPower Corporation. "Sky WindPower Corporation,"
http://www.skywindpower.com/ww/index.htm [cited 5/18/2010].

121
15Garrad Hassan. "Best practice for accurate wind speed measurements,"
http://www.wind-energy-the-facts.org/en/part-i-technology/chapter-2-wind-resource-
estimation/local-wind-resource-assessment-and-energy-analysis/best-practice-for-
accurate-wind-speed-measurements.html [cited 5/29/2010].
16Canale, M., Fagiano, L., and Milanese, M., "Power Kites for Wind Energy
Generation: Applications of Control," Control Systems Magazine, IEEE, Vol. 27, No. 6,
2007, pp. 25.
17Wikipedia contributors. "File:Jetstreamconfig.jpg"
http://en.wikipedia.org/wiki/File:Jetstreamconfig.jpg [cited 2/23/2011].
18Pacific Northwest National Laboratory. "Wind Energy Resource Atlas of the United
States," http://rredc.nrel.gov/wind/pubs/atlas/maps/chap2/2-01m.html [cited 8/12/2010].
19American Meteorological Society, "Tapping Wind Power at High Altitudes,"
Bulletin of the American Meteorological Society, Vol. 90, No. 9, 2009, pp. 1259-1261.
20Applied Fiber. "Applied Fiber Synthetic Cable End Fittings & Terminations In
Action," http://www.applied-fiber.com/applied-fiber-news.html [cited 5/26/2010].
21Canale, M., Fagiano, L., Milanese, M., "KiteGen project: control as key technology
for a quantum leap in wind energy generators," American Control Conference, 2007.
ACC '07, 2007, pp. 3522.
22Canale, M., Fagiano, L., Ippolito, M., "Control of tethered airfoils for a new class of
wind energy generator," Decision and Control, 2006 45th IEEE Conference on, 2006, pp.
4020.
23Canale, M., Fagiano, L., and Milanese, M., "High Altitude Wind Energy Generation
Using Controlled Power Kites," Control Systems Technology, IEEE Transactions on,
Vol. 18, No. 2, 2010, pp. 279.
24Kite Gen Research s.r.l. "Kite Gen concept,"
http://kitegen.com/press/kiwicarusel_hd_logo.jpg [cited 5/25/2010].
25Argatov, I., Rautakorpi, P., and Silvennoinen, R., "Estimation of the mechanical
energy output of the kite wind generator," Renewable Energy, Vol. 34, No. 6, 2009, pp.
1525-1532.
26Joby Energy Inc. "Joby Energy Homepage," http://jobyenergy.com/ [cited 2/2/2011].
27Lundstrom, K., Amandori, K., and Krus, P., "Validation of Small Scale Electric
Propulsion System Models," AIAA, 2010.

122
28Wikipedia contributors. "Density of air," http://en.wikipedia.org/wiki/Density_of_air
[cited 11/16/2010].
29Anonymous "Atmosphere, Composition and Structure,"
http://www.scienceclarified.com/As-Bi/Atmosphere-Composition-and-Structure.html
[cited 11/16/2010].
30Anonymous "Gas Viscosity Calculator,"
http://www.lmnoeng.com/Flow/GasViscosity.htm [cited 11/16/2010].
31Anonymous "Sutherland Formula,"
http://www.wolframalpha.com/input/?i=sutherland+formula [cited 11/16/2010].
32M. Ragheb. "Optimal Rotor Tip Speed Ratio,"
https://netfiles.uiuc.edu/mragheb/www/NPRE%20475%20Wind%20Power%20Systems/
Optimal%20Rotor%20Tip%20Speed%20Ratio.pdf [cited 11/16/2010].
33Anonymous "UIUC Airfoil Data Site," http://www.ae.illinois.edu/m-
selig/ads/coord_database.html [cited 11/16/2010].
34Sabatowski, P.A., Thal, A.E., and Sitzabee, W.E., "Trend Analysis of U.S. Power
Outages," Proceedings of the 2010 Industrial Engineering Research Conference A.
Johnson and J Miller, eds. 2010,
35Sabatowski, P.A., "Security Vulnerability Trends Related to Electric Power Supplied
at Military Installations," Air Force Institute of Technology Wright-Patterson AFB, OH,
Graduate School of Engineering and Management, Mar 2010,
36U.S. Census Bureau. "Population Estimates,"
http://www.census.gov/popest/gallery/maps/County-Density-09.html [cited 1/27/2011].
37Cockpitvisit. "Airline Route Mapper," http://arm.64hosts.com/ [cited 1/27/2011].
38Energy Information Administration. "Electric Power Annual - U.S. Electric Industry
Residential Average Retail Price of Electricity by State,"
http://www.eia.doe.gov/cneaf/electricity/epa/fig7p5.html [cited 2/1/2011].
39Assistant Secretary of the Air Force for Installations, Environment and Logistics
(SAF/IE). "Air Force Energy Plan 2010,"
http://www.safie.hq.af.mil/shared/media/document/AFD-091208-027.pdf [cited 2010].

123
Biography
Captain Troy L. Cahoon graduated from Cardston High School in Cardston,
Alberta, Canada in 1994. He completed his Bachelor of Science in Mechanical
Engineering at Brigham Young University (BYU), UT, in 2003. He received his United
States Air Force commission on April 28, 2003, after completing Reserve Officer
Training at BYU.
The first USAF assignment for Captain Cahoon was at Wright-Patterson AFB,
Ohio. He worked as an electronic warfare engineer and program manager for the Special
Ops Systems Group of the Aerospace Systems Center, providing upgrades for the AC-
130 Gunship and other Special Ops aircraft. Starting in May 2006, he was assigned to
Hill AFB, Utah, as a test engineer, and then program manager, for the Range Threats
Squadron of the 84th
Combat Sustainment Wing. In June 2008, Captain Cahoon moved
to the Range Squadron of the 388th
Fighter Wing, also at Hill AFB. There he worked as a
range instrumentation engineer on the Utah Test and Training Range (UTTR). In August
2009, Captain Cahoon entered the Graduate School of Engineering and Management at
the Air Force Institute of Technology (AFIT), where he graduated in March 2011 with a
Master’s degree in Aeronautical Engineering. Captain Cahoon’s current assignment is at
Edwards AFB, California, where he is working in the Air Force Research Laboratory
(AFRL), Propulsion Directorate.

REPORT DOCUMENTATION PAGE Form Approved OMB No. 074-0188
The public reporting burden for this collection of information is estimated to average 1 hour per response, including the time for reviewing instructions, searching existing data sources, gathering and maintaining the data needed, and completing and reviewing the collection of information. Send comments regarding this burden estimate or any other aspect of the collection of information, including suggestions for reducing this burden to Department of Defense, Washington Headquarters Services, Directorate for Information Operations and Reports (0704-0188), 1215 Jefferson Davis Highway, Suite 1204, Arlington, VA 22202-4302. Respondents should be aware that notwithstanding any other provision of law, no person shall be subject to an penalty for failing to comply with a collection of information if it does not display a currently valid OMB control number.
PLEASE DO NOT RETURN YOUR FORM TO THE ABOVE ADDRESS.
1. REPORT DATE (DD-MM-YYYY)
05-03-2011 2. REPORT TYPE
Master’s Thesis
3. DATES COVERED (From – To)
Sept 2009 – Mar 2011 4. TITLE AND SUBTITLE
Airborne Wind Energy:
Implementation and Design for the U.S. Air Force
5a. CONTRACT NUMBER
5b. GRANT NUMBER
5c. PROGRAM ELEMENT NUMBER
6. AUTHOR(S)
Cahoon, Troy L., Captain, USAF
5d. PROJECT NUMBER
5e. TASK NUMBER
5f. WORK UNIT NUMBER
7. PERFORMING ORGANIZATION NAMES(S) AND ADDRESS(S)
Air Force Institute of Technology
Graduate School of Engineering and Management (AFIT/ENY)
2950 Hobson Way, Building 640
WPAFB, OH 45433-8865
8. PERFORMING ORGANIZATION REPORT NUMBER
AFIT/GAE/ENY/11-M04
9. SPONSORING/MONITORING AGENCY NAME(S) AND ADDRESS(ES)
N/A
10. SPONSOR/MONITOR’S ACRONYM(S)
11. SPONSOR/MONITOR’S REPORT NUMBER(S)
12. DISTRIBUTION/AVAILABILITY STATEMENT
APPROVED FOR PUBLIC RELEASE; DISTRIBUTION UNLIMITED
13. SUPPLEMENTARY NOTES
14. ABSTRACT
Excitement among researchers about Airborne Wind Energy (AWE) technology matches DoD
aims to advance and employ renewable energy. AWE seeks to cost-effectively tap the vast
supply of wind energy available at altitudes high above the reach of conventional, ground-based
wind turbines (e.g. 500-12,000m). This paper explores viability and implementation of AWE
technology for fulfilling USAF energy needs. Characteristics, potential, and developmental
status of the AWE resource are presented. A design tool for a rotor-based AWE system is
developed, facilitating the analysis of blade performance to simplify design and provide the best
efficiencies for a range of conditions. USAF bases are evaluated upon energy needs, design
requirements, and other factors to determine which bases could benefit most from AWE. Bases
most viable for an AWE project, with 75% potential savings on energy costs/base (up to $40M
annually for larger bases), are: Tinker, Vance, Wright-Patt, Arnold, Ellsworth, and Grand Forks.
Key results reveal it is possible to achieve notable benefits for the USAF using AWE technology. 15. SUBJECT TERMS
High Altitude Airborne Wind Energy (AWE), Renewable, Wind Turbine, Blade Design, Air Force Base
16. SECURITY CLASSIFICATION OF:
17. LIMITATION OF ABSTRACT
UU
18. NUMBER OF PAGES
141
19a. NAME OF RESPONSIBLE PERSON
Frederick G. Harmon, Lt Col, USAF
a. REPORT
U
b. ABSTRACT
U
c. THIS PAGE
U
19b. TELEPHONE NUMBER (Include area code)
DSN 786-3636 x7478 ([email protected])
Standard Form 298 (Rev. 8-98) Prescribed by ANSI Std. Z39-18