air emissions impacts of plug-in hybrid vehicles in
TRANSCRIPT

Air Emissions Impacts of Plug-In Hybrid Vehicles in Minnesota’s Passenger Fleet
March, 2007
Report for Plug-in Hybrid Task Force

This report was prepared by the Minnesota Pollution Control Agency by legislative request for the Plug-in Hybrid Task Force. Cost to prepare this report: Staff time $8700, production $100. Report Coordinator: Anne Claflin Primary Report Contributors: Peter Ciborowski, Innocent Eyoh, John Seltz, and Chun Yi Wu For Further Information: David Thornton Assistant Commissioner (651) 284-0382 Todd Biewen, Manager Environmental Analysis and Outcomes Division (651) 296-8156 Photo Credits: MPCA photos.
2

Table of Contents
Index of Tables ........................................................................................................... 4
Index of Figures .......................................................................................................... 5
Introduction and Background ..................................................................................... 6
Summary of Findings.................................................................................................. 9
Appendix A: Comparison of emissions between vehicle technologies and electricity generation.................................................................................................................. 15
Appendix B: Annual Emissions from the Statewide Fleet: PHEV Market Penetration Rates 10%, 25%, 50% ........................................................................... 23
Appendix C: Annual Emissions from the State Owned and Leased Fleet: PHEV Market Penetration Rates 10%, 25%, 50%............................................................... 31
Appendix D: Methods and Assumptions ................................................................. 39
Appendix E: EPRI PHEV model summary ............................................................. 43
Appendix G: References and Resources.................................................................. 45
3

Index of Tables Summary of Findings Table 1: Relative percent of total conventional vehicle emissions emitted by alternative
technology vehicles..................................................................................................... 9 Table 2: Fuel efficiency estimates for a GREET modeled passenger vehicle and an EPRI
modeled compact car. ............................................................................................... 10 Table 3: Statewide fleet total annual emissions and percent emissions change with 10%
fleet penetration ........................................................................................................ 12 Table 4: State owned and leased fleet total annual emissions and percent emissions
change with 10% fleet penetration............................................................................ 13 Appendix A: Comparison of emissions between vehicle technologies and electricity generation Table 5: Change in carbon dioxide emissions from alternative vehicle technologies
compared to a conventional vehicle.......................................................................... 16 Table 6: Change in volatile organic compound emissions from alternative vehicle
technologies compared to a conventional vehicle.. .................................................. 17 Table 7: Change in carbon monoxide emissions from alternative vehicle technologies
compared to a conventional vehicle.......................................................................... 18 Table 8: Change in nitrogen oxides emissions from alternative vehicle technologies
compared to a conventional vehicle.......................................................................... 19 Table 9: Change in particulate matter (2.5 microns) emissions from alternative vehicle
technologies compared to a conventional vehicle .................................................... 20 Table 10: Change in sulfur dioxide emissions from alternative vehicle technologies
compared to a conventional vehicle.......................................................................... 21 Appendix B: Statewide fleet penetration impacts Table 11: Percent changes in carbon dioxide emissions.................................................. 24 Table 12: Percent changes in volatile organic compounds emissions ............................. 25 Table 13: Percent changes in carbon monoxide emissions.............................................. 26 Table 14: Percent changes in nitrogen oxides emissions................................................. 27 Table 15: Percent changes in particulate matter (2.5 microns) emissions....................... 28 Table 16: Percent changes in sulfur dioxide emissions ................................................... 29 Appendix C: State owned and leased fleet penetration impacts Table 17: Percent changes in carbon dioxide emissions.................................................. 32 Table 18: Percent changes in volatile organic compounds emissions ............................. 33 Table 19: Percent changes in carbon monoxide emissions.............................................. 34 Table 20: Percent changes in nitrogen oxides emissions................................................. 35 Table 21: Percent changes in particulate matter emissions ............................................. 36 Table 22: Percent changes in sulfur dioxide emissions. .................................................. 37
4

Index of Figures Summary of Findings Figure 1: Relative percent change in total pollutant emissions per vehicle compared to
conventional passenger vehicles. .............................................................................. 11 Figure 2: Effects of penetration rates on emissions from a PHEV60. Percent emissions
compared to a conventional vehicle fleet for penetration rates of 10%, 25%, and 50% of the fleet......................................................................................................... 13
Appendix A: Comparison of emissions between vehicle technologies and electricity generation Figure 3: Carbon dioxide emissions (grams/mile) vehicle-to-vehicle comparison. ........ 16 Figure 4: Volatile organic compound emissions (grams/mile) vehicle-to-vehicle
comparison................................................................................................................ 17 Figure 5: Carbon monoxide emissions (grams/mile) vehicle-to-vehicle comparison. .... 18 Figure 6: Nitrogen oxides emissions (grams/mile) vehicle-to-vehicle comparison. ....... 19 Figure 7: Particulate matter (2.5 microns) emissions (grams/mile) vehicle-to-vehicle
comparison................................................................................................................ 20 Figure 8: Sulfur dioxide emissions (grams/mile) vehicle-to-vehicle comparison. .......... 21 Appendix B: Statewide fleet penetration impacts Figure 9: Carbon dioxide emissions (annual tons) at 10%, 25%, and 50% market
penetration rates.. ...................................................................................................... 24 Figure 10: Volatile organic compounds emissions at 10%, 25%, and 50% market
penetration rates.. ...................................................................................................... 25 Figure 11: Carbon monoxide emissions at 10%, 25%, and 50% market penetration rates
................................................................................................................................... 26 Figure 12: Nitrogen oxides emissions at 10%, 25%, and 50% market penetration rates. 27 Figure 13: Particulate matter (2.5 microns) emissions at 10%, 25%, and 50% market
penetration rates. ....................................................................................................... 28 Figure 14: Sulfur dioxide emissions at 10%, 25%, and 50% market penetration rates... 29 Appendix C: State owned and leased fleet penetration impacts Figure 15: Carbon dioxide emissions at 10%, 25%, and 50% market penetration rates. 32 Figure 16: Volatile organic compounds emissions at 10%, 25%, and 50% market
penetration rates.. ...................................................................................................... 33 Figure 17: Carbon monoxide emissions at 10%, 25%, and 50% market penetration rates.
................................................................................................................................... 34 Figure 18: Nitrogen oxides emissions at 10%, 25% and 50% market penetration rates. 35 Figure 19: Particulate matter (2.5 microns) emissions at 10%, 25% and 50% market
penetration rates. ....................................................................................................... 36 Figure 20: Sulfur dioxide emissions at 10%, 25% and 50% market penetration rate. .... 37
5

Introduction and Background Plug-in Hybrid Electric Vehicles (PHEVs) are hybrid vehicles (HEV) that have the ability to charge batteries from an external electrical outlet connected to the power grid. These vehicles can potentially operate as purely battery electric vehicles over short trips. PHEVs are also called grid-connected hybrids and are designated by the all-electric range. An all-electric range of 20 to 60 miles is the typical range now assumed for PHEVs. PHEVs are in early demonstration stages and are not currently in production, but can be converted by increasing the battery capacity, adding an AC-powered battery pack charger, and changing the controller circuitry to require the vehicle to make full use of the increase in electrical energy. The CalCars Initiative created PHEV prototypes; a Prius was converted into a PRIUS+ by adding EDrive Systems lithium-ion batteries, achieving a 25-30 mile range functioning on all-electric power. The Plug-in Hybrid Task Force and the Minnesota Legislature, under Chapter 245, Section 3, tasked the Minnesota Pollution Control Agency (MPCA) to evaluate the emissions impacts of incorporating PHEVs into the vehicle fleet. This study models the environmental impacts, specifically criteria pollutant and greenhouse gas emissions, associated with converting portions of all light-duty vehicles operated in Minnesota to PHEVs. We also evaluate the emission consequences of converting the fleet of light-duty vehicles owned or leased by the State of Minnesota to PHEVs. Light-duty vehicles include compact cars, sedans, and station wagons. Emissions are evaluated for 2020. To understand how PHEVs would affect emissions in 2020, a base-case non-PHEV scenario relying on conventional vehicles operating with standard internal combustion engines (ICE) was developed. As an additional alternative to conventional ICE vehicles, a scenario involving pure hybrid electric vehicles (HEVs) was considered. Similar studies have been undertaken that yielded results supporting our findings. Bentley (1992) conducted a fuel-cycle study examining CO2 emissions and found that all-electric vehicle CO2 emissions decrease as coal combustion in electricity generation decreases. Wang and Santini (1993) completed a similar fuel-cycle study that included criteria pollutants; all-electric vehicles reduced air emissions except for SO2 emissions, which increased as a result of coal-based electricity generation. A study from the Argonne National Laboratory (1998) also found an increase in SO2 emissions because of electricity generation, and that NOx and SO2 emissions were very dependent on the control technology installed at electric power plants. All-electric vehicle emissions have been more extensively studied than PHEV emissions, but can be compared through the proportions of electric and ICE operation. Argonne National Laboratory developed the GREET model to compare PHEVs, and found the same patterns in emissions, considering a combination of gasoline end electric fuel.
6

Included in the evaluation for this study are: all emissions from vehicle operations, emissions at the electric power plant, and, in the case of refined petroleum fuels, refinery emissions and emissions associated with movements of refined petroleum products. The emissions from fuel production were estimated using the Greenhouse Gases, Regulated Emissions and Energy Use in Transportation (GREET) model created by Argonne National Laboratory. This model is able to estimate emissions from future technology and the effects of future emissions controls. A 90:10 gasoline-to-ethanol mixture, E10, was assumed for use in all vehicles. Modeled outputs from MOBILE6 were used to develop information for the conventional vehicle baseline forecast. MOBILE6, developed by the Environmental Protection Agency, estimates the emission factors from vehicle operations, including tailpipe and evaporative emissions and brake and tire wear. This model takes vehicle characteristics, vehicle age distribution, fuel characteristics, activities, changes in vehicle emission standards, ambient conditions, and other factors into account when calculating vehicle emissions. Emissions factors taken from the MOBILE6 conventional vehicle output were then used in the GREET model to calculate projected emissions from alternative technology vehicle operations. To model the operation in 2020 of a PHEV, information was taken from Electric Power Research Institute (EPRI) reports comparing the benefits and impacts of hybrid electric vehicles for various configurations and sizes. Two possible configurations are a PHEV 20 vehicle that has an all electric (battery-powered) range of approximately 20 miles, and a PHEV 60 vehicle has an all-electric range of approximately 60 miles. EPRI provided the proportions of miles traveled under all-electric and internal combustion engine (ICE) power. Because a number of regular trip lengths fall within the all-electric ranges, a PHEV 20 runs on electricity for 40% of the miles traveled, and a PHEV 60 runs on electricity for 75% of the miles traveled, considering average trip lengths. Because of the difficulty in determining exact emissions profiles for future electricity generation, the task force approved evaluating rough estimates of anticipated emissions, over a range of entirely coal-based generation, to entirely wind-based generation. This does not include the other fuels that are used for electricity generation in Minnesota. Five hypothetical scenarios were examined:
• 100% of electricity will be generated by coal • 80% of electricity will be generated by coal, 20% by wind • 60% of electricity will be generated by coal, 40% by wind • 40% of electricity will be generated by coal, 60% by wind • 100% of electricity will be generated by wind.
Considering the Governor’s initiative to increase renewable energy, the electricity generation mix in 2020 will likely be most similar to the scenario where 60% of electricity is generated by coal and 40% is generated by wind; nuclear power generation also has zero emissions and would be a portion of the electricity modeled as wind power.
7
Minnesota also uses natural gas, which was not included in modeling. The scenario where all electricity is generated by wind is used only for modeling the impacts of vehicle technology penetration in the state owned and leased fleet because green power could be realistically purchased at that scale. In order to compare the technologies and fuel sources, the emissions per mile for a single vehicle are shown in addition to the effects of market penetration. For the purpose of this study, models were set up representing the impacts of including each type of alternative technology vehicle in the statewide and state owned fleets at rates of 10%, 25% and 50% of the miles traveled by all passenger vehicles. Detailed explanations of methods for calculation and data sources are included in Appendix D.
8

Summary of Findings Single Vehicle Comparison Comparing alternative vehicle emissions per mile is the basis for calculating the impacts of incorporating the vehicles into the state fleet. Table 1 shows GREET-modeled PHEV emissions as a percentage of modeled 2020 emissions for a conventional ICE vehicle; these results are shown graphically in Figure 1. As noted above, emissions for the conventional ICE vehicle were developed using MOBILE6. The emission estimates shown in Table 1 are for comparable mid-sized sedans (GREET average passenger car). Emissions estimates were calculated from the emissions produced by fuel production and vehicle operations (Appendix A). The following conclusions can be drawn from a vehicle-to-vehicle comparison:
• With the exception of SO2, emissions for both the PHEV and the HEV are lower than emissions from the conventional ICE vehicle.
• A PHEV has marginally lower emissions for all emittants, except CO2 and SO2. • Emissions from PHEVs per mile decrease as the all-electric range increases from
20 miles to 60 miles, again with the exception of SO2. • Emissions per mile from PHEVs are generally 30% to 60% lower than emissions
per mile for the conventional ICE vehicles. PHEV Air Emissions as a % of Emissions from Conventional Vehicles Hybrid Electric Vehicle PHEV 20 PHEV60
60% Coal, 40% Wind 60% Coal, 40% Wind
CO2 59% 65% 66%
VOC 69% 42% 18% CO 100% 60% 25% NOX 80% 62% 48% PM 2.5 76% 71% 66%
SO2 63% 170% 265% Table 1: Relative percent of total conventional vehicle emissions emitted by alternative technology vehicles for each class of technology at the future scenario where electricity is generated by 60% coal and 40% wind power. Per-mile PHEV emissions of SO2 are higher than for either the conventional gasoline-driven ICE or the hybrid electric vehicles due to the high sulfur content of the coal that is assumed to be combusted at the power plant. In the example shown in Table 1, 60% of the electricity consumed by the plug-in electric side of the vehicle is assumed to be generated through coal combustion. For purposes of this calculation,1 an average SO2
______________________________________________________________________________________1 Current SO2 emissions are approximately 0.5 lbs per MMBtu. For a PHEV, SO2 emissions must be less than 0.1 lbs per MMBtu for a PHEV 20 using 60% coal electricity to outperform the modeled conventional vehicle.
9
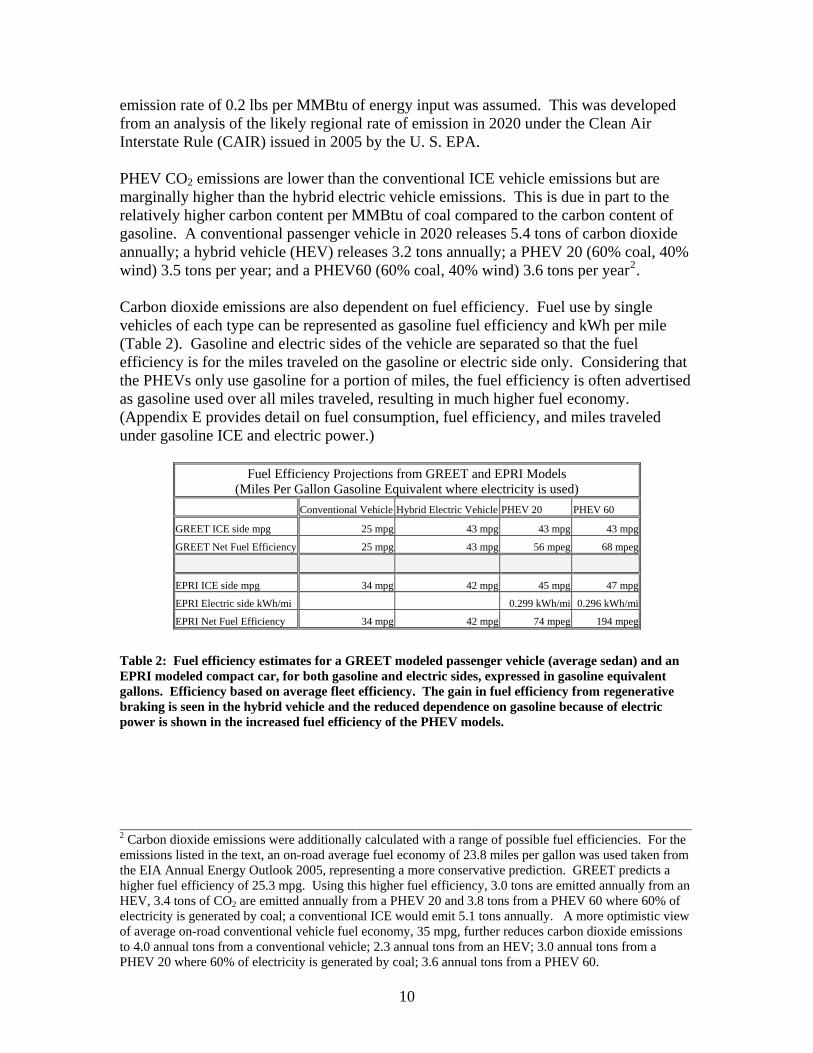
emission rate of 0.2 lbs per MMBtu of energy input was assumed. This was developed from an analysis of the likely regional rate of emission in 2020 under the Clean Air Interstate Rule (CAIR) issued in 2005 by the U. S. EPA. PHEV CO2 emissions are lower than the conventional ICE vehicle emissions but are marginally higher than the hybrid electric vehicle emissions. This is due in part to the relatively higher carbon content per MMBtu of coal compared to the carbon content of gasoline. A conventional passenger vehicle in 2020 releases 5.4 tons of carbon dioxide annually; a hybrid vehicle (HEV) releases 3.2 tons annually; a PHEV 20 (60% coal, 40% wind) 3.5 tons per year; and a PHEV60 (60% coal, 40% wind) 3.6 tons per year2. Carbon dioxide emissions are also dependent on fuel efficiency. Fuel use by single vehicles of each type can be represented as gasoline fuel efficiency and kWh per mile (Table 2). Gasoline and electric sides of the vehicle are separated so that the fuel efficiency is for the miles traveled on the gasoline or electric side only. Considering that the PHEVs only use gasoline for a portion of miles, the fuel efficiency is often advertised as gasoline used over all miles traveled, resulting in much higher fuel economy. (Appendix E provides detail on fuel consumption, fuel efficiency, and miles traveled under gasoline ICE and electric power.)
Fuel Efficiency Projections from GREET and EPRI Models (Miles Per Gallon Gasoline Equivalent where electricity is used)
Conventional Vehicle Hybrid Electric Vehicle PHEV 20 PHEV 60
GREET ICE side mpg 25 mpg 43 mpg 43 mpg 43 mpg
GREET Net Fuel Efficiency 25 mpg 43 mpg 56 mpeg 68 mpeg
EPRI ICE side mpg 34 mpg 42 mpg 45 mpg 47 mpg
EPRI Electric side kWh/mi 0.299 kWh/mi 0.296 kWh/mi
EPRI Net Fuel Efficiency 34 mpg 42 mpg 74 mpeg 194 mpeg
Table 2: Fuel efficiency estimates for a GREET modeled passenger vehicle (average sedan) and an EPRI modeled compact car, for both gasoline and electric sides, expressed in gasoline equivalent gallons. Efficiency based on average fleet efficiency. The gain in fuel efficiency from regenerative braking is seen in the hybrid vehicle and the reduced dependence on gasoline because of electric power is shown in the increased fuel efficiency of the PHEV models.
______________________________________________________________________________________ 2 Carbon dioxide emissions were additionally calculated with a range of possible fuel efficiencies. For the emissions listed in the text, an on-road average fuel economy of 23.8 miles per gallon was used taken from the EIA Annual Energy Outlook 2005, representing a more conservative prediction. GREET predicts a higher fuel efficiency of 25.3 mpg. Using this higher fuel efficiency, 3.0 tons are emitted annually from an HEV, 3.4 tons of CO2 are emitted annually from a PHEV 20 and 3.8 tons from a PHEV 60 where 60% of electricity is generated by coal; a conventional ICE would emit 5.1 tons annually. A more optimistic view of average on-road conventional vehicle fuel economy, 35 mpg, further reduces carbon dioxide emissions to 4.0 annual tons from a conventional vehicle; 2.3 annual tons from an HEV; 3.0 annual tons from a PHEV 20 where 60% of electricity is generated by coal; 3.6 annual tons from a PHEV 60.
10

0
50
100
150
200
250
300
Hybrid Electric Vehicle PHEV 20 PHEV 60
Passenger Vehicle Technology Types
Perc
ent E
mis
sion
s C
ompa
red
to C
onve
ntio
nal V
ehic
les
(Ele
ctric
ity G
ener
ated
60%
Coa
l and
40%
Win
d Po
wer
)
CO2VOCCONOXPM2.5SO2
Figure 1: Relative percent change in total pollutant emissions per vehicle compared to conventional passenger vehicles, for each class of technology in the future scenario where electricity is generated by 60% coal and 40% wind power. Emissions greater than 100% represent an increase in emissions over a conventional ICE vehicle.
Change in Fleet Emissions To estimate the fleet effects of the introduction of PHEVs, the emissions changes identified in Table 1 were introduced into the conventional vehicle base emission forecast. This base emission forecast was developed using MOBILE6. The following was assumed:
• Total statewide VMT increases from 56.5 billion vehicle miles traveled (VMT) in 2006 to 75.5 billion VMT in 2020.
• Passenger car VMT is a percentage of total 2020 VMT (34.59%); this was taken from the 2004 U. S. EPA CAIR VMT Projection modeling.
• Passenger car VMT is then 26 billion miles in 2020. The fleet penetration calculation was performed for 10%, 25% and 50% penetration of PHEVs into the fleet, based on miles traveled. The 10% fleet penetration scenario is shown in Table 3. With only 12 years remaining before 2020, it seems unlikely that more than 10% of the fleet in fact could be PHEVs. At higher penetration rates, the impacts are proportionally greater. (The higher penetration scenarios are shown in Appendix B – Statewide Fleet Penetration Effects, and Appendix C – State Owned Fleet Penetration Effects).
11

The following conclusions can be drawn from the 10% fleet penetration scenario, where electricity is generated by 60% coal and 40% wind power:
• Fleet emissions with 10% PHEV penetration are generally lower than emissions from conventional vehicle fleets. Across most pollutants, fleet emissions are 3% to 8% lower with 10% PHEV penetration.
• With the exception of SO2 and CO2, fleet emissions are generally lower with 10% PHEV penetration than 10% HEV penetration.
• Fleet SO2 emissions increase 7% to 17% with 10% PHEVs; this results from dependence on coal electricity generation in the scenario.
• PHEV emissions of CO2 are lower than for the conventional ICE by about 400,000 tons.
• Fleet emissions of CO2 using 10% hybrid electric vehicles are about 0.5% lower than with 10% fleet penetration with PHEVs.
Total Annual Statewide Fleet Emissions and Change in Emissions at 10% Alternative Vehicle Penetration
Conventional Vehicle Fleet Hybrid Electric Vehicle PHEV 20 PHEV 60
10% Penetration 10% Penetration 10% Penetration
Annual emissions
(tons)3Annual emissions
(tons) % Change Annual emissions
(tons) % Change Annual emissions
(tons) % Change CO2 11,749,182 11,265,392 -4.1 11,337,384 -3.5 11,348,903 -3.4 VOC 21,207 20,550 -3.1 19,972 -5.8 19,459 -8.2 CO 316,779 316,736 0.0 304,141 -4.0 293,126 -7.5 NOx 12,311 12,061 -2.0 11,845 -3.8 11,668 -5.2 PM2.5 728 710 -2.4 707 -2.9 703 -3.4 SO2 2,295 2,209 -3.7 2,455 7.0 2,673 16.5
Table 3: Statewide fleet total annual emissions and percent emissions change with 10% fleet penetration, compared to conventional passenger vehicles, for each class of technology and electricity generated by 60% coal and 40% wind power. The percent decrease or increase in emissions is equal for the state owned fleet and for the statewide vehicle fleet; the total emissions for the statewide and state owned fleets are proportionally scaled. Emissions changes shown in red are increases compared to a completely conventional vehicle fleet.
Emissions changes depend on how quickly PHEVs are assumed to enter the fleet. Figure 2 shows the effect of different PHEV penetration rates for PHEV 60 vehicles. If by 2020, 50% of the fleet of all privately- and publicly-owned passenger cars was comprised of PHEVs, most emittants would be 15 to 40% lower than for a fleet of 100% conventional ICE vehicles. However, in the case of SO2, emissions would actually increase by 182%.
______________________________________________________________________________________3 Total annual statewide tons of pollution emitted from all sources (2001 data): CO = 2,342,279 tons, NOX = 450,693, PM2.5 = 203,492, SO2 = 148,827, VOC = 413,204. Data available at EPA AirData.
12

0
20
40
60
80
100
120
140
160
180
200
CO2 VOC CO NOX PM2.5 SOX
PHEV
60
emis
sion
s as
a p
erce
nt o
f con
vent
iona
l veh
icle
em
issi
ons
10% Penetration25% Penetration50% Penetration
Figure 2: Effects of penetration rates on emissions from a PHEV 60, electricity generated by 60% coal, 40% wind power. Percent emissions compared to a conventional vehicle fleet for penetration rates of 10%, 25%, and 50% of the fleet.
The effect of PHEV penetration on fleet emissions from passenger cars owned or leased by the State of Minnesota is shown in Table 3. We used the same methods as were used to estimate emissions for all privately-and publicly-owned vehicles traveling Minnesota highways. Modeled air emissions at 2020 declined for all emittants but SO2. Due to the extremely small number of vehicles owned or leased by the state—2,099 total vehicles in the passenger car class—the associated emission reductions were small in absolute terms. The largest reductions were for CO2, which declined by about 250 tons. All other changes were a few tons or less. Total Annual State Owned Fleet Emissions and Change in Emissions at 10% Alternative Vehicle Penetration
Conventional Vehicle Fleet Hybrid Electric Vehicle PHEV 20 PHEV 60
10% Penetration 10% Penetration 10% Penetration
Annual emissions
(tons) Annual emissions
(tons) % Change Annual emissions
(tons) % Change Annual emissions
(tons) % Change CO2 7250 6952 -4.1 6996 -3.5 7003 -3.4 VOC 13.1 12.7 -3.1 12.3 -5.8 12.0 -8.2 CO 195 195 0.0 188 -4.0 181 -7.5 NOx 7.60 7.44 -2.0 7.31 -3.8 7.20 -5.2 PM2.5 0.449 0.438 -2.4 0.436 -2.9 0.434 -3.4 SO2 1.42 1.36 -3.7 1.51 7.0 1.65 16.5
Table 4: State owned and leased fleet total annual emissions and percent emissions change with 10% fleet penetration, compared to conventional passenger vehicles, for each class of technology and electricity generated by 60% coal and 40% wind power. Emissions changes shown in red are increases compared to a completely conventional vehicle fleet.
13
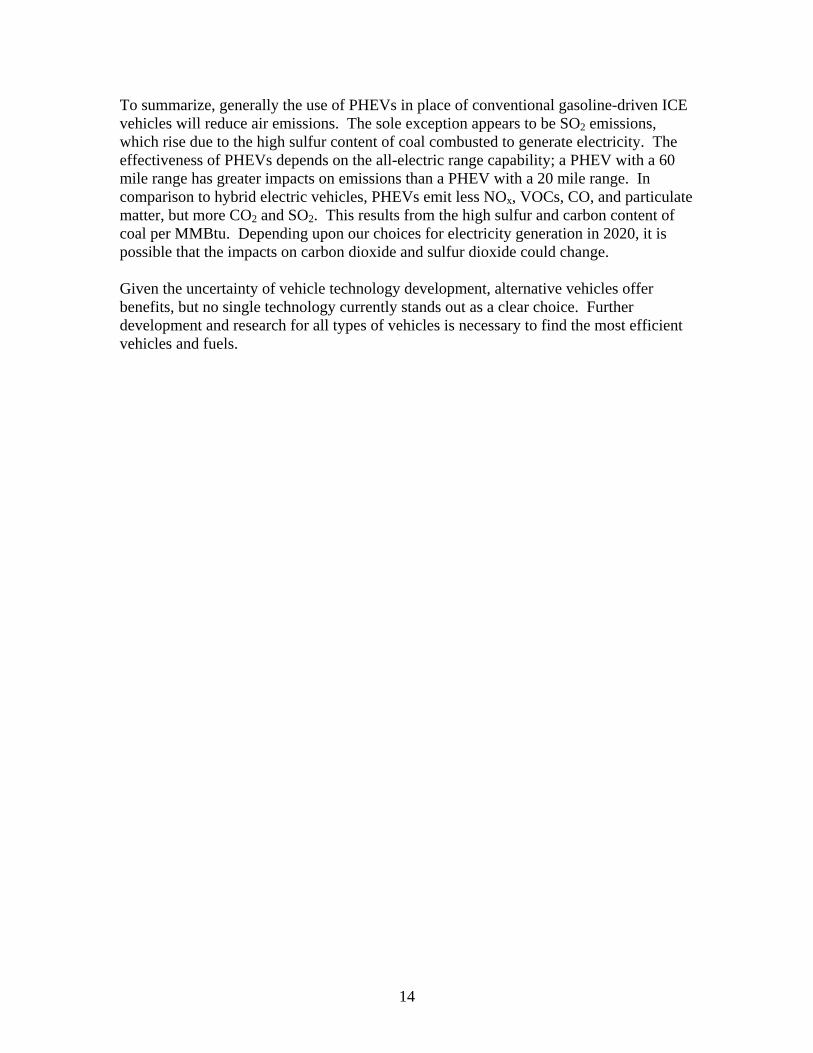
To summarize, generally the use of PHEVs in place of conventional gasoline-driven ICE vehicles will reduce air emissions. The sole exception appears to be SO2 emissions, which rise due to the high sulfur content of coal combusted to generate electricity. The effectiveness of PHEVs depends on the all-electric range capability; a PHEV with a 60 mile range has greater impacts on emissions than a PHEV with a 20 mile range. In comparison to hybrid electric vehicles, PHEVs emit less NOx, VOCs, CO, and particulate matter, but more CO2 and SO2. This results from the high sulfur and carbon content of coal per MMBtu. Depending upon our choices for electricity generation in 2020, it is possible that the impacts on carbon dioxide and sulfur dioxide could change. Given the uncertainty of vehicle technology development, alternative vehicles offer benefits, but no single technology currently stands out as a clear choice. Further development and research for all types of vehicles is necessary to find the most efficient vehicles and fuels.
14

Appendix A: Comparison of emissions between vehicle technologies and electricity generation Notes for vehicle-to-vehicle comparisons: Each pollutant is shown on one page; the figure illustrates the portions of emissions from vehicle operations (including tailpipe emissions, evaporation, and brake and tire wear) and fuel production. The tables list the percentage change in emissions for each vehicle type and electricity combination compared to a conventional passenger car. All emissions are in grams per mile to demonstrate the differences between vehicle technology and electricity generation emissions. The PHEV 20, across the electricity generation range, has the same vehicle operations emissions because the same volume of gasoline is used regardless of electricity; the same is true for a PHEV 60.
15

0
50
100
150
200
250
300
350
400
450
500
100 %Coal
80% Coal,20% Wind
60% Coal,40% Wind
40% Coal,60% Wind
100%Wind
100 %Coal
80% Coal,20% Wind
60% Coal,40% Wind
40% Coal,60% Wind
100%Wind
ConventionalVehicle
HybridElectricVehicle
PHEV 20 PHEV 60
Passenger Vehicle Technology Types
Car
bon
Dio
xide
Em
issi
ons
(g/m
ile)
Vehicle Operation Emissions Fuel Production Emissions
Figure 3: Carbon dioxide emissions (grams/mile) vehicle-to-vehicle comparison.
Vehicle Operation Emissions (g/mile)
Fuel Production Emissions (g/mile)
Total Emissions (g/mile)
Percent Change Compared to Conventional Vehicle
Conventional Vehicle 335 73 408 Hybrid Electric Vehicle 196 44 240 -41 %
100 % Coal 118 229 347 -15 %80% Coal, 20% Wind 118 188 306 -25 %60% Coal, 40% Wind 118 148 265 -35 %40% Coal, 60% Wind 118 110.8 228 -44 %
PHEV 20 100% Wind 118 26 143 -64 %100 % Coal 29 392 421 3 %80% Coal, 20% Wind 29 316 345 -15 %60% Coal, 40% Wind 29 239 269 -34 %40% Coal, 60% Wind 29 171 200 -51 %
PHEV 60 100% Wind 29 11 40 -90 %
Table 5: Change in carbon dioxide emissions from alternative vehicle technologies compared to a conventional vehicle. Red numbers indicate increase in emissions.
16

0.000
0.100
0.200
0.300
0.400
0.500
0.600
0.700
0.800
100 %Coal
80% Coal,20% Wind
60% Coal,40% Wind
40% Coal,60% Wind
100%Wind
100 %Coal
80% Coal,20% Wind
60% Coal,40% Wind
40% Coal,60% Wind
100%Wind
ConventionalVehicle
HybridElectricVehicle
PHEV 20 PHEV 60
Passenger Vehicle Technology Types
Vola
tile
Org
anic
Com
poun
ds E
mis
sion
s (g
/mile
)Vehicle Operation Emissions Fuel Production Emissions
Figure 4: Volatile organic compound emissions (grams/mile) vehicle-to-vehicle comparison.
Vehicle Operation Emissions (g/mile)
Fuel Production Emissions (g/mile)
Total Emissions (g/mile)
Percent Change Compared to Conventional Vehicle
Conventional Vehicle 0.623 0.113 0.736 Hybrid Electric Vehicle 0.445 0.063 0.508 -31.0 %
100 % Coal 0.267 0.041 0.308 -58.1 %80% Coal, 20% Wind 0.267 0.041 0.308 -58.2 %60% Coal, 40% Wind 0.267 0.041 0.308 -58.2 %40% Coal, 60% Wind 0.267 0.040 0.307 -58.3 %
PHEV 20 100% Wind 0.267 0.040 0.307 -58.4 %100 % Coal 0.111 0.020 0.131 -82.2 %80% Coal, 20% Wind 0.111 0.019 0.130 -82.3 %60% Coal, 40% Wind 0.111 0.018 0.130 -82.4 %40% Coal, 60% Wind 0.111 0.018 0.129 -82.5 %
PHEV 60 100% Wind 0.111 0.017 0.128 -83.7 %
Table 6: Change in volatile organic compound emissions from alternative vehicle technologies compared to a conventional vehicle. VOCs are closely related to gasoline production and use, and show variation only between vehicle types with different gasoline requirements with little impact from electricity production.
17

0.00
2.00
4.00
6.00
8.00
10.00
12.00
100 %Coal
80% Coal,20% Wind
60% Coal,40% Wind
40% Coal,60% Wind
100%Wind
100 %Coal
80% Coal,20% Wind
60% Coal,40% Wind
40% Coal,60% Wind
100%Wind
ConventionalVehicle
HybridElectricVehicle
PHEV 20 PHEV 60
Passenger Vehicle Technology Types
Car
bon
Mon
oxid
e (g
/mile
)Vehicle Operation Emissions Fuel Production Emissions
Figure 5: Carbon monoxide emissions (grams/mile) vehicle-to-vehicle comparison.
Vehicle Operation Emissions (g/mile)
Fuel Production Emissions (g/mile)
Total Emissions (g/mile)
Percent Change Compared to Conventional Vehicle
Conventional Vehicle 10.96 0.041 11.00 Hybrid Electric Vehicle 10.96 0.026 10.99 -0.1 %
100 % Coal 6.58 0.051 6.63 -39.8 %80% Coal, 20% Wind 6.58 0.043 6.62 -39.8 %60% Coal, 40% Wind 6.58 0.036 6.61 -39.9 %40% Coal, 60% Wind 6.58 0.029 6.60 -40.0 %
PHEV 20 100% Wind 6.58 0.014 6.59 -40.1 %100 % Coal 2.74 0.074 2.81 -74.4 %80% Coal, 20% Wind 2.74 0.060 2.80 -74.5 %60% Coal, 40% Wind 2.74 0.047 2.79 -74.7 %40% Coal, 60% Wind 2.74 0.034 2.77 -74.8 %
PHEV 60 100% Wind 2.74 0.006 2.75 -75.0 %
Table 7: Change in carbon monoxide emissions from alternative vehicle technologies compared to a conventional vehicle.
18

0.000
0.050
0.100
0.150
0.200
0.250
0.300
0.350
0.400
0.450
100 %Coal
80% Coal,20% Wind
60% Coal,40% Wind
40% Coal,60% Wind
100%Wind
100 %Coal
80% Coal,20% Wind
60% Coal,40% Wind
40% Coal,60% Wind
100%Wind
ConventionalVehicle
HybridElectricVehicle
PHEV 20 PHEV 60
Passenger Vehicle Technology Types
Nitr
ogen
Oxi
des
Emis
sion
s (g
/mile
)Vehicle Operation Emissions Fuel Production Emissions
Figure 6: Nitrogen oxides emissions (grams/mile) vehicle-to-vehicle comparison.
Vehicle Operation Emissions
Fuel Production Emissions
Total Emissions
Percent Change Compared to Conventional Vehicle
Conventional Vehicle 0.328 0.099 0.428 Hybrid Electric Vehicle 0.276 0.065 0.341 -20 %
100 % Coal 0.166 0.143 0.309 -28 %80% Coal, 20% Wind 0.166 0.122 0.287 -33 %60% Coal, 40% Wind 0.166 0.100 0.266 -38 %40% Coal, 60% Wind 0.166 0.080 0.246 -42 %
PHEV 20 100% Wind 0.166 0.039 0.204 -52 %100 % Coal 0.069 0.215 0.284 -33 %80% Coal, 20% Wind 0.069 0.175 0.244 -43 %60% Coal, 40% Wind 0.069 0.135 0.204 -52 %40% Coal, 60% Wind 0.069 0.099 0.168 -61 %
PHEV 60 100% Wind 0.069 0.016 0.085 -80 %
Table 8: Change in nitrogen oxides emissions from alternative vehicle technologies compared to a conventional vehicle
19

0.000
0.005
0.010
0.015
0.020
0.025
0.030
100 %Coal
80% Coal,20% Wind
60% Coal,40% Wind
40% Coal,60% Wind
100%Wind
100 %Coal
80% Coal,20% Wind
60% Coal,40% Wind
40% Coal,60% Wind
100%Wind
ConventionalVehicle
HybridElectricVehicle
PHEV 20 PHEV 60
Passenger Vehicle Technology Types
PM 2
.5 E
mis
sion
s (g
/mile
)Vehicle Operation Emissions Fuel Production Emissions
Figure 7: Particulate matter (2.5 microns) emissions (grams/mile) vehicle-to-vehicle comparison.
Vehicle Operation Emissions (g/mile)
Fuel Production Emissions (g/mile)
Total Emissions (g/mile)
Percent Change Compared to Conventional Vehicle
Conventional Vehicle 0.011 0.014 0.025 Hybrid Electric Vehicle 0.011 0.008 0.019 -24 %
100 % Coal 0.009 0.012 0.021 -18 %80% Coal, 20% Wind 0.009 0.010 0.019 -24 %60% Coal, 40% Wind 0.009 0.009 0.018 -29 %40% Coal, 60% Wind 0.009 0.008 0.017 -34 %
PHEV 20 100% Wind 0.009 0.005 0.014 -46 %100 % Coal 0.007 0.015 0.022 -14 %80% Coal, 20% Wind 0.007 0.012 0.019 -24 %60% Coal, 40% Wind 0.007 0.010 0.017 -34 %40% Coal, 60% Wind 0.007 0.007 0.014 -43 %
PHEV 60 100% Wind 0.007 0.002 0.009 -65 %
Table 9: Change in particulate matter (2.5 microns) emissions from alternative vehicle technologies compared to a conventional vehicle
20
0.000
0.050
0.100
0.150
0.200
0.250
0.300
0.350
0.400
100 %Coal
80% Coal,20% Wind
60% Coal,40% Wind
40% Coal,60% Wind
100%Wind
100 %Coal
80% Coal,20% Wind
60% Coal,40% Wind
40% Coal,60% Wind
100%Wind
ConventionalVehicle
HybridElectricVehicle
PHEV 20 PHEV 60
Passenger Vehicle Technology Types
Sulfu
r Dio
xide
Em
issi
ons
(g/m
ile)
Vehicle Operation Emissions Fuel Production Emissions
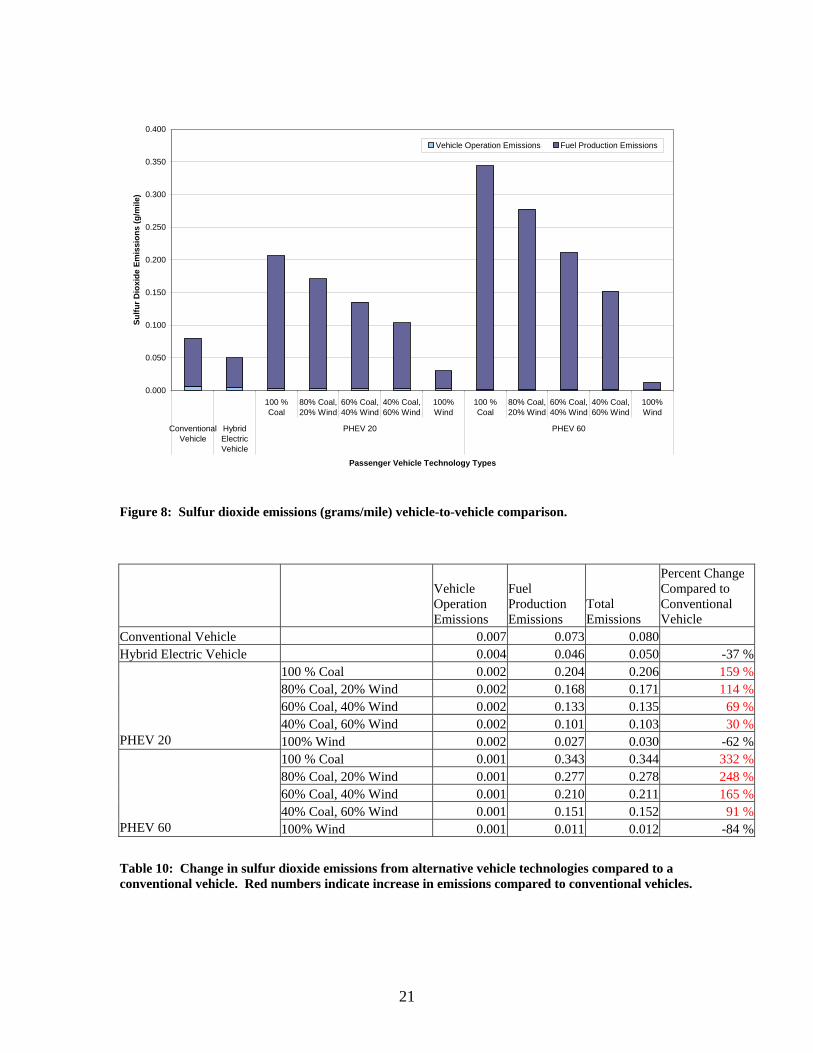
Figure 8: Sulfur dioxide emissions (grams/mile) vehicle-to-vehicle comparison.
Vehicle Operation Emissions
Fuel Production Emissions
Total Emissions
Percent Change Compared to Conventional Vehicle
Conventional Vehicle 0.007 0.073 0.080 Hybrid Electric Vehicle 0.004 0.046 0.050 -37 %
100 % Coal 0.002 0.204 0.206 159 %80% Coal, 20% Wind 0.002 0.168 0.171 114 %60% Coal, 40% Wind 0.002 0.133 0.135 69 %40% Coal, 60% Wind 0.002 0.101 0.103 30 %
PHEV 20 100% Wind 0.002 0.027 0.030 -62 %100 % Coal 0.001 0.343 0.344 332 %80% Coal, 20% Wind 0.001 0.277 0.278 248 %60% Coal, 40% Wind 0.001 0.210 0.211 165 %40% Coal, 60% Wind 0.001 0.151 0.152 91 %
PHEV 60 100% Wind 0.001 0.011 0.012 -84 %
Table 10: Change in sulfur dioxide emissions from alternative vehicle technologies compared to a conventional vehicle. Red numbers indicate increase in emissions compared to conventional vehicles.
21

22

Appendix B: Annual Emissions from the Statewide Fleet: PHEV Market Penetration Rates 10%, 25%, 50% Notes for fleet penetration figures: Each pollutant is featured on two pages. Three figures show the annual emissions from the vehicle technologies incorporated into the statewide vehicle fleet for each modeled penetration rate (10%, 25% and 50% of the fleet). An entirely conventional vehicle fleet is shown for comparison to no action taken. Each pollutant is also shown in a table describing the percent change in emissions achieved by incorporating the different distributions of alternative vehicles. The percentages of change in emissions at penetration rates are the same for the statewide and state owned fleet, but the differences in impacts are seen in the net decreases. All emissions are in annual tons.
23

0
2,000,000
4,000,000
6,000,000
8,000,000
10,000,000
12,000,000
14,000,000
100 %Coal
80%Coal,20%Wind
60%Coal,40%Wind
40%Coal,60%Wind
100 %Coal
80%Coal,20%Wind
60%Coal,40%Wind
40%Coal,60%Wind
ConventionalVehicle Fleet
HybridElectricVehicle
PHEV 20 PHEV 60
Car
bon
Dio
xide
Em
issi
ons
(ann
ual t
ons)
- M
arke
t Pen
etra
tion
Impa
cts
in S
tate
wid
e Ve
hicl
e Fl
eet
10% penetration25% penetration 50% penetration
Figure 9: Carbon dioxide emissions (annual tons) at 10%, 25%, and 50% market penetration rates. Conventional vehicle column shows a fleet with no alternative technology vehicles.
10% 25% 50% Hybrid Electric Vehicle -4.1 % -10.3 % -20.6 % PHEV 20 100 % Coal -1.5 % -3.7 % -7.5 % 80% Coal, 20% Wind -2.5 % -6.3 % -12.5 % 60% Coal, 40% Wind -3.5 % -8.8 % -17.5 % 40% Coal, 60% Wind -4.4 % -11.0 % -22.0 % PHEV 60 100 % Coal 0.3 % 0.8 % 1.6 % 80% Coal, 20% Wind -1.5 % -3.9 % -7.7 % 60% Coal, 40% Wind -3.4 % -8.5 % -17.0 % 40% Coal, 60% Wind -5.1 % -12.7 % -25.4 %
Table 11: Percent changes in carbon dioxide emissions at market penetration rates of 10%, 25%, and 50% in the statewide vehicle fleet for alternative technology vehicles compared to a fleet of conventional vehicles. Red numbers indicate an increase in emissions.
24
0
5,000
10,000
15,000
20,000
25,000
100 %Coal
80% Coal,20% Wind
60% Coal,40% Wind
40% Coal,60% Wind
100 %Coal
80% Coal,20% Wind
60% Coal,40% Wind
40% Coal,60% Wind
ConventionalVehicle Fleet
HybridElectricVehicle
PHEV 20 PHEV 60
Vola
tile
Org
anic
Com
poun
ds E
mis
sion
s (a
nnua
l ton
s) -
Mar
ket P
enet
ratio
n Im
pact
s in
Sta
tew
ide
Vehi
cle
Flee
t
10% penetration25% penetration 50% penetration
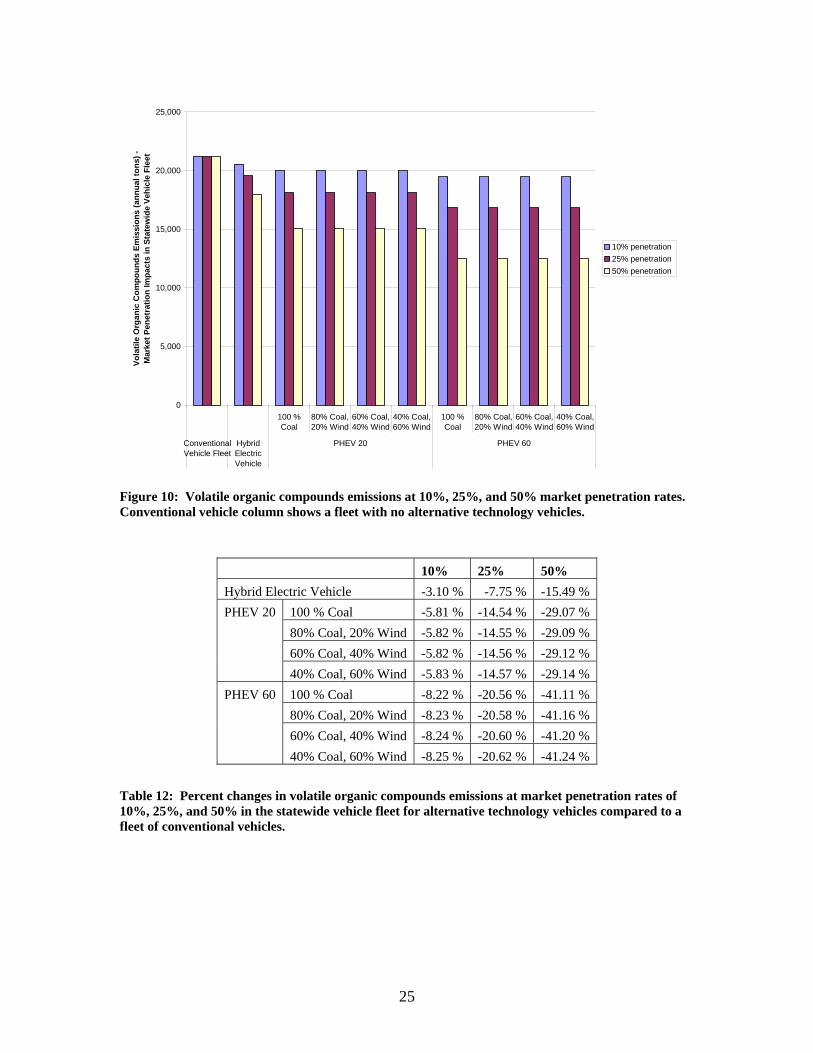
Figure 10: Volatile organic compounds emissions at 10%, 25%, and 50% market penetration rates. Conventional vehicle column shows a fleet with no alternative technology vehicles.
10% 25% 50% Hybrid Electric Vehicle -3.10 % -7.75 % -15.49 % PHEV 20 100 % Coal -5.81 % -14.54 % -29.07 % 80% Coal, 20% Wind -5.82 % -14.55 % -29.09 % 60% Coal, 40% Wind -5.82 % -14.56 % -29.12 % 40% Coal, 60% Wind -5.83 % -14.57 % -29.14 % PHEV 60 100 % Coal -8.22 % -20.56 % -41.11 % 80% Coal, 20% Wind -8.23 % -20.58 % -41.16 % 60% Coal, 40% Wind -8.24 % -20.60 % -41.20 % 40% Coal, 60% Wind -8.25 % -20.62 % -41.24 %
Table 12: Percent changes in volatile organic compounds emissions at market penetration rates of 10%, 25%, and 50% in the statewide vehicle fleet for alternative technology vehicles compared to a fleet of conventional vehicles.
25

0
50,000
100,000
150,000
200,000
250,000
300,000
350,000
100 %Coal
80% Coal,20% Wind
60% Coal,40% Wind
40% Coal,60% Wind
100 %Coal
80% Coal,20% Wind
60% Coal,40% Wind
40% Coal,60% Wind
ConventionalVehicle Fleet
HybridElectricVehicle
PHEV 20 PHEV 60
Car
bon
Mon
oxid
e Em
issi
ons
(ann
ual t
ons)
- M
arke
t Pen
etra
tion
Impa
cts
in S
tate
wid
e Ve
hicl
e Fl
eet
10% penetration25% penetration 50% penetration
Figure 11: Carbon monoxide emissions at 10%, 25%, and 50% market penetration rates. Conventional vehicle column shows a fleet with no alternative technology vehicles.
10% 25% 50% Hybrid Electric Vehicle -0.01 % -0.03 % -0.07 % PHEV 20 100 % Coal -3.98 % -9.94 % -19.88 % 80% Coal, 20% Wind -3.98 % -9.96 % -19.92 % 60% Coal, 40% Wind -3.99 % -9.97 % -19.95 % 40% Coal, 60% Wind -4.00 % -9.99 % -19.98 % PHEV 60 100 % Coal -7.44 % -18.61 % -37.21 % 80% Coal, 20% Wind -7.45 % -18.64 % -37.27 % 60% Coal, 40% Wind -7.47 % -18.67 % -37.33 % 40% Coal, 60% Wind -7.48 % -18.70 % -37.39 %
Table 13: Percent changes in carbon monoxide emissions at market penetration rates of 10%, 25%, and 50% in the statewide vehicle fleet for alternative technology vehicles compared to a fleet of conventional vehicles.
26
0
2,000
4,000
6,000
8,000
10,000
12,000
14,000
100 %Coal
80% Coal,20% Wind
60% Coal,40% Wind
40% Coal,60% Wind
100 %Coal
80% Coal,20% Wind
60% Coal,40% Wind
40% Coal,60% Wind
ConventionalVehicle Fleet
HybridElectricVehicle
PHEV 20 PHEV 60
Nitr
ogen
Oxi
des
Emis
sion
s (a
nnua
l ton
s) -
Mar
ket P
enet
ratio
n Im
pact
s in
Sta
tew
ide
Vehi
cle
Flee
t
10% penetration25% penetration 50% penetration
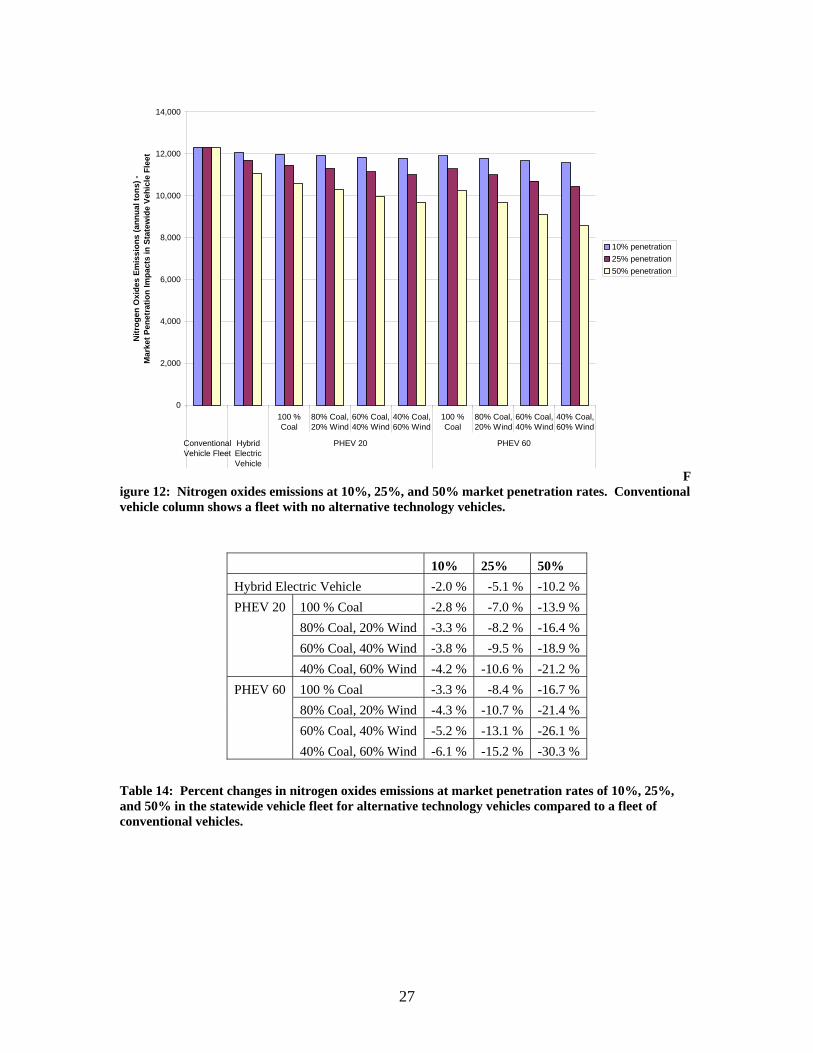
Figure 12: Nitrogen oxides emissions at 10%, 25%, and 50% market penetration rates. Conventional vehicle column shows a fleet with no alternative technology vehicles.
10% 25% 50% Hybrid Electric Vehicle -2.0 % -5.1 % -10.2 % PHEV 20 100 % Coal -2.8 % -7.0 % -13.9 % 80% Coal, 20% Wind -3.3 % -8.2 % -16.4 % 60% Coal, 40% Wind -3.8 % -9.5 % -18.9 % 40% Coal, 60% Wind -4.2 % -10.6 % -21.2 % PHEV 60 100 % Coal -3.3 % -8.4 % -16.7 % 80% Coal, 20% Wind -4.3 % -10.7 % -21.4 % 60% Coal, 40% Wind -5.2 % -13.1 % -26.1 % 40% Coal, 60% Wind -6.1 % -15.2 % -30.3 %
Table 14: Percent changes in nitrogen oxides emissions at market penetration rates of 10%, 25%, and 50% in the statewide vehicle fleet for alternative technology vehicles compared to a fleet of conventional vehicles.
27

0
100
200
300
400
500
600
700
800
100 %Coal
80% Coal,20% Wind
60% Coal,40% Wind
40% Coal,60% Wind
100 %Coal
80% Coal,20% Wind
60% Coal,40% Wind
40% Coal,60% Wind
ConventionalVehicle Fleet
HybridElectricVehicle
PHEV 20 PHEV 60
Part
icul
ate
Mat
ter (
2.5)
Em
issi
ons
(ann
ual t
ons)
- M
arke
t Pen
etra
tion
Impa
cts
in S
tate
wid
e Ve
hicl
e Fl
eet
10% penetration25% penetration 50% penetration
Figure 13: Particulate matter (2.5 microns) emissions at 10%, 25%, and 50% market penetration rates. Conventional vehicle column shows a fleet with no alternative technology vehicles.
10% 25% 50% Hybrid Electric Vehicle -2.4 % -6.0 % -11.9 % PHEV 20 100 % Coal -1.8 % -4.6 % -9.1 % 80% Coal, 20% Wind -2.4 % -5.9 % -11.9 % 60% Coal, 40% Wind -2.9 % -7.3 % -14.6 % 40% Coal, 60% Wind -3.4 % -8.6 % -17.2 % PHEV 60 100 % Coal -1.4 % -3.4 % -6.8 % 80% Coal, 20% Wind -2.4 % -5.9 % -11.9 % 60% Coal, 40% Wind -3.4 % -8.5 % -17.0 % 40% Coal, 60% Wind -4.3 % -10.9 % -21.7 %
Table 15: Percent changes in particulate matter (2.5 microns) emissions at market penetration rates of 10%, 25%, and 50% in the statewide vehicle fleet for alternative technology vehicles compared to a fleet of conventional vehicles.
28

0
1,000
2,000
3,000
4,000
5,000
6,000
7,000
100 %Coal
80% Coal,20% Wind
60% Coal,40% Wind
40% Coal,60% Wind
100 %Coal
80% Coal,20% Wind
60% Coal,40% Wind
40% Coal,60% Wind
ConventionalVehicle Fleet
HybridElectricVehicle
PHEV 20 PHEV 60
Sulfu
r Dio
xide
Em
issi
ons
(ann
ual t
ons)
- M
arke
t Pen
etra
tion
Impa
cts
in S
tate
wid
e Ve
hicl
e Fl
eet
10% penetration25% penetration 50% penetration
Figure 14: Sulfur dioxide emissions at 10%, 25%, and 50% market penetration rates. Conventional vehicle column shows a fleet with no alternative technology vehicles.
10% 25% 50% Hybrid Electric Vehicle -3.7 % -9.3 % -18.7 % PHEV 20 100 % Coal 15.9 % 39.7 % 79.3 % 80% Coal, 20% Wind 11.4 % 28.6 % 57.1 % 60% Coal, 40% Wind 7.0 % 17.5 % 34.9 % 40% Coal, 60% Wind 3.0 % 7.4 % 14.8 % PHEV 60 100 % Coal 33.2 % 82.9 % 165.8 % 80% Coal, 20% Wind 24.8 % 62.1 % 124.2 % 60% Coal, 40% Wind 16.5 % 41.3 % 82.5 % 40% Coal, 60% Wind 9.1 % 22.7 % 45.3 %
Table 16: Percent changes in sulfur dioxide emissions at market penetration rates of 10%, 25%, and 50% in the statewide vehicle fleet for alternative technology vehicles compared to a fleet of conventional vehicles. Red numbers indicate an increase in emissions.
29

30
Appendix C: Annual Emissions from the State Owned and Leased Fleet: PHEV Market Penetration Rates 10%, 25%, 50% Notes for fleet penetration figures: Each pollutant is featured on two pages. The three figures show the annual emissions from the vehicle technologies incorporated into the state owned and leased vehicle fleet for each modeled penetration rate (10%, 25% and 50% of the fleet). Each pollutant is also shown in a table describing the percent change in emissions achieved by incorporating the different distributions of alternative vehicles. An entirely conventional vehicle fleet is shown for comparison to no action taken. The percentages of change in emissions at penetration rates are the same for the statewide and state owned fleet, but the differences in impacts are seen in the net decreases. All emissions are in annual tons.
31

0
1000
2000
3000
4000
5000
6000
7000
8000
100%coal
80%Coal /20%Wind
60%coal /40%wind
40%coal /60%wind
100%Wind
100%Coal
80 %Coal/20%Wind
60%Coal /40%Wind
40%coal /60%wind
100%Wind
ConventionalVehicle Fleet
HEV PHEV 20 PHEV 60
Car
bon
Dio
xide
Em
issi
ons
(ann
ual t
ons)
- M
arke
t Pen
etra
tion
Impa
cts
in S
tate
Ow
ned
Vehi
cle
Flee
t
10% Penetration25% Penetration50% Penetration
Figure 15: Carbon dioxide emissions at 10%, 25%, and 50% market penetration rates. Conventional vehicle column shows a fleet with no alternative technology vehicles.
10% 25% 50% Hybrid Electric Vehicle -4.1 % -10.3 % -20.6 % PHEV 20 100 % Coal -1.5 % -3.7 % -7.5 % 80% Coal, 20% Wind -2.5 % -6.3 % -12.5 % 60% Coal, 40% Wind -3.5 % -8.8 % -17.5 % 40% Coal, 60% Wind -4.4 % -11.0 % -22.0 % 100% Wind -6.5 % -16.2 % -32.5 % PHEV 60 100 % Coal 0.3 % 0.8 % 1.6 % 80% Coal, 20% Wind -1.5 % -3.9 % -7.7 % 60% Coal, 40% Wind -3.4 % -8.5 % -17.0 % 40% Coal, 60% Wind -5.1 % -12.7 % -25.4 % 100% Wind -9.0 % -22.5 % -45.1 %
Table 17: Percent changes in carbon dioxide emissions at market penetration rates of 10%, 25%, and 50% in the state owned and leased vehicle fleet for alternative technology vehicles compared to a fleet of conventional vehicles. Red numbers indicate an increase in emissions.
32

0
2
4
6
8
10
12
14
100%coal
80%Coal /20%Wind
60%coal /40%wind
40%coal /60%wind
100%Wind
100%Coal
80 %Coal/20%Wind
60%Coal /40%Wind
40%coal /60%wind
100%Wind
ConventionalVehicle Fleet
HEV PHEV 20 PHEV 60
Vola
tile
Org
anic
Com
poun
ds E
mis
sion
s (a
nnua
l ton
s) -
Mar
ket P
enet
ratio
n Im
pact
s in
Sta
te O
wne
d Ve
hicl
e Fl
eet
10% Penetration25% Penetration50% Penetration
Figure 16: Volatile organic compounds emissions at 10%, 25%, and 50% market penetration rates. Conventional vehicle column shows a fleet with no alternative technology vehicles. .
10% 25% 50% Hybrid Electric Vehicle -3.10 % -7.75 % -15.49 % PHEV 20 100 % Coal -5.81 % -14.54 % -29.07 % 80% Coal, 20% Wind -5.82 % -14.55 % -29.09 % 60% Coal, 40% Wind -5.82 % -14.56 % -29.12 % 40% Coal, 60% Wind -5.83 % -14.57 % -29.14 % 100% Wind -5.84 % -14.59 % -29.18 % PHEV 60 100 % Coal -8.22 % -20.56 % -41.11 % 80% Coal, 20% Wind -8.23 % -20.58 % -41.16 % 60% Coal, 40% Wind -8.24 % -20.60 % -41.20 % 40% Coal, 60% Wind -8.25 % -20.62 % -41.24 % 100% Wind -8.26 % -20.66 % -41.32 %
Table 18: Percent changes in volatile organic compounds emissions at market penetration rates of 10%, 25%, and 50% in the state owned and leased vehicle fleet for alternative technology vehicles compared to a fleet of conventional vehicles.
33

0
20
40
60
80
100
120
140
160
180
200
100%coal
80%Coal /20%Wind
60%coal /40%wind
40%coal /60%wind
100%Wind
100%Coal
80 %Coal/20%Wind
60%Coal /40%Wind
40%coal /60%wind
100%Wind
ConventionalVehicle Fleet
HEV PHEV 20 PHEV 60
Car
bon
Mon
oxid
e Em
issi
ons
(ann
ual t
ons)
- M
arke
t Pen
etra
tion
Impa
cts
in S
tate
Ow
ned
Vehi
cle
Flee
t
10% Penetration25% Penetration50% Penetration
Figure 17: Carbon monoxide emissions at 10%, 25%, and 50% market penetration rates. Conventional vehicle column shows a fleet with no alternative technology vehicles.
10% 25% 50% Hybrid Electric Vehicle -0.01 % -0.03 % -0.07 % PHEV 20 100 % Coal -3.98 % -9.94 % -19.88 % 80% Coal, 20% Wind -3.98 % -9.96 % -19.92 % 60% Coal, 40% Wind -3.99 % -9.97 % -19.95 % 40% Coal, 60% Wind -4.00 % -9.99 % -19.98 % 100% Wind -4.01 % -10.02 % -20.05 % PHEV 60 100 % Coal -7.44 % -18.61 % -37.21 % 80% Coal, 20% Wind -7.45 % -18.64 % -37.27 % 60% Coal, 40% Wind -7.47 % -18.67 % -37.33 % 40% Coal, 60% Wind -7.48 % -18.70 % -37.39 % 100% Wind -7.50 % -18.76 % -37.52 %
Table 19: Percent changes in carbon monoxide emissions at market penetration rates of 10%, 25%, and 50% in the state owned and leased vehicle fleet for alternative technology vehicles compared to a fleet of conventional vehicles.
34

0
1
2
3
4
5
6
7
8
100%coal
80%Coal /20%Wind
60%coal /40%wind
40%coal /60%wind
100%Wind
100%Coal
80 %Coal/20%Wind
60%Coal /40%Wind
40%coal /60%wind
100%Wind
ConventionalVehicle Fleet
HEV PHEV 20 PHEV 60
Nitr
ogen
Oxi
des
Emis
sion
s (a
nnua
l ton
s) -
Mar
ket P
enet
ratio
n Im
pact
s in
Sta
te O
wne
d Ve
hicl
e Fl
eet
10% Penetration25% Penetration50% Penetration
Figure 18: Nitrogen oxides emissions at 10%, 25% and 50% market penetration rates. Conventional vehicle column shows a fleet with no alternative technology vehicles.
10% 25% 50% Hybrid Electric Vehicle -2.0 % -5.1 % -10.2 % PHEV 20 100 % Coal -2.8 % -7.0 % -13.9 % 80% Coal, 20% Wind -3.3 % -8.2 % -16.4 % 60% Coal, 40% Wind -3.8 % -9.5 % -18.9 % 40% Coal, 60% Wind -4.2 % -10.6 % -21.2 % 100% Wind -5.2 % -13.0 % -26.1 % PHEV 60 100 % Coal -3.3 % -8.4 % -16.7 % 80% Coal, 20% Wind -4.3 % -10.7 % -21.4 % 60% Coal, 40% Wind -5.2 % -13.1 % -26.1 % 40% Coal, 60% Wind -6.1 % -15.2 % -30.3 % 100% Wind -8.0 % -20.0 % -40.0 %
Table 20: Percent changes in nitrogen oxides emissions at market penetration rates of 10%, 25%, and 50% in the state owned and leased vehicle fleet for alternative technology vehicles compared to a fleet of conventional vehicles.
35

0.00
0.05
0.10
0.15
0.20
0.25
0.30
0.35
0.40
0.45
0.50
100%coal
80%Coal /20%Wind
60%coal /40%wind
40%coal /60%wind
100%Wind
100%Coal
80 %Coal/20%Wind
60%Coal /40%Wind
40%coal /60%wind
100%Wind
ConventionalVehicle Fleet
HEV PHEV 20 PHEV 60
Part
icul
ate
Mat
ter (
2.5)
Em
issi
ons
(ann
ual t
ons)
- M
arke
t Pen
etra
tion
Impa
cts
in S
tate
Ow
ned
Vehi
cle
Flee
t
10% Penetration25% Penetration50% Penetration
Figure 19: Particulate matter (2.5 microns) emissions at 10%, 25% and 50% market penetration rates. Conventional vehicle column shows a fleet with no alternative technology vehicles.
10% 25% 50% Hybrid Electric Vehicle -2.4 % -6.0 % -11.9 % PHEV 20 100 % Coal -1.8 % -4.6 % -9.1 % 80% Coal, 20% Wind -2.4 % -5.9 % -11.9 % 60% Coal, 40% Wind -2.9 % -7.3 % -14.6 % 40% Coal, 60% Wind -3.4 % -8.6 % -17.2 % 100% Wind -4.6 % -11.4 % -22.8 % PHEV 60 100 % Coal -1.4 % -3.4 % -6.8 % 80% Coal, 20% Wind -2.4 % -5.9 % -11.9 % 60% Coal, 40% Wind -3.4 % -8.5 % -17.0 % 40% Coal, 60% Wind -4.3 % -10.9 % -21.7 % 100% Wind -6.5 % -16.2 % -32.3 %
Table 21: Percent changes in particulate matter emissions at market penetration rates of 10%, 25%, and 50% in the state owned and leased vehicle fleet for alternative technology vehicles compared to a fleet of conventional vehicles.
36

0.0
0.5
1.0
1.5
2.0
2.5
3.0
3.5
4.0
100%coal
80%Coal /20%Wind
60%coal /40%wind
40%coal /60%wind
100%Wind
100%Coal
80 %Coal/20%Wind
60%Coal /40%Wind
40%coal /60%wind
100%Wind
ConventionalVehicle Fleet
HEV PHEV 20 PHEV 60
Sulfu
r Dio
xide
Em
issi
ons
(ann
ual t
ons)
- M
arke
t Pen
etra
tion
Impa
cts
in S
tate
Ow
ned
Vehi
cle
Flee
t
10% Penetration25% Penetration50% Penetration
Figure 20: Sulfur dioxide emissions at 10%, 25% and 50% market penetration rate. Conventional vehicle column shows a fleet with no alternative technology vehicles.
10% 25% 50% Hybrid Electric Vehicle -3.7 % -9.3 % -18.7 % PHEV 20 100 % Coal 15.9 % 39.7 % 79.3 % 80% Coal, 20% Wind 11.4 % 28.6 % 57.1 % 60% Coal, 40% Wind 7.0 % 17.5 % 34.9 % 40% Coal, 60% Wind 3.0 % 7.4 % 14.8 % 100% Wind -6.2 % -15.6 % -31.2 % PHEV 60 100 % Coal 33.2 % 82.9 % 165.8 % 80% Coal, 20% Wind 24.8 % 62.1 % 124.2 % 60% Coal, 40% Wind 16.5 % 41.3 % 82.5 % 40% Coal, 60% Wind 9.1 % 22.7 % 45.3 % 100% Wind -8.4 % -21.1 % -42.2 %
Table 22: Percent changes in sulfur dioxide emissions at market penetration rates of 10%, 25%, and 50% in the state owned and leased vehicle fleet for alternative technology vehicles compared to a fleet of conventional vehicles. Red numbers indicate an increase in emissions.
37

38

Appendix D: Methods and Assumptions Fuel Production Emissions – GREET Model The GREET model calculates fuel-production emissions for CO2, VOCs, CO, NOx, SO2, and PM2.5, as well as other emissions, as predicted for conventional and alternative technology vehicles in the future. Emissions for fuel production were calculated for E10 gasoline and electricity generation. Fuel production includes all emissions associated with production, transportation, storage, and distribution. Ethanol All vehicles used E10 on the internal combustion engine side. Ethanol was assumed to be produced using corn; using ethanol produced from biomass could produce different results. Also, changing milling processes (dry or wet) and the fuel used to produce ethanol would alter the results. Electricity The electricity generation mixes were simplified from the actual state mix. Scenarios were set up where 100% of electricity was generated by coal, 80% was generated by coal with 20% generated by wind, 60% was generated by coal with 40% generated by wind, 40% was generated by coal with 60% generated by wind, and where 100% of electricity was generated by wind. The scenario where 60% of electricity is generated by coal and 40% by wind power is an approximation of the Governor’s 25x25 renewable energy plan emissions in 2020, considering Minnesota's use of nuclear energy, coal, and renewable energy. This simplification excludes possible fuel sources such as residual fuel oil, natural gas, or biomass. Advanced coal technology plant efficiency was adjusted to 42% based on EPA estimates and emissions were adjusted based on state specific expectations. Sulfur Dioxide and Nitrogen Oxides Emissions Adjustments Adjustments to the nitrogen oxides and sulfur dioxide emissions were made to more accurately reflect the Minnesota-specific impacts of current or expected rules. Current SO2 emissions from electricity production are approximately 0.5 lbs per MMBtu. Because of control technology required by the Clean Air Interstate Rule (CAIR), Minnesota expects to have lower nitrogen oxides and sulfur dioxide emissions in 2020 than the predicted national average. Emissions were adjusted to 0.12 lbs NOx per MMBtu and 0.2 lbs SO2 per MMBtu and converted to lbs/kWh using the five year average heat rate from Xcel’s Sherburne 1, 2, and 3 (10,500 Btu/kWh). The new electricity generation emissions were incorporated into the fuel production emissions, holding gasoline production emissions separate.
39
Vehicle Operations Emissions – MOBILE6.2 Distribution of Vehicle Registration and Ages
Separate MOBILE6 runs were performed for rural and urban counties, to account for different driving patterns. Two composite vehicle registration distributions for rural and urban counties, to describe the ages of vehicles operating, were developed based on data specific to each county in Minnesota produced by SonomaTech, using the 2004 vehicle registration information from the MN Department of Public Safety. Vehicle age takes degradation over time into account. This information initially was used to estimate 2002 on-road mobile source emissions for the Central Regional Air Planning Association (CENRAP) to assist in planning to reduce haze and fine particulate matter. These composite vehicle registration distributions were also used by the Lake Michigan Air Directors Consortium (LADCO) 2005 emissions calculation. Fuel Characteristics Currently, all gasoline sold in Minnesota is blended with 10% ethanol by volume, creating E10. There is a possibility that the proportion of ethanol will rise, but emissions data is less certain for these higher mixtures. The fleet in 2020 was assumed to use E10 oxygenated gasoline, with an average oxygen content of 2.7%. E85 flex-fuel vehicles were not included in this study. Fuel characteristics influence the evaporative and exhaust emissions of air pollutants. The average amount of sulfur in gasoline was assumed to be 15.0 ppm in 2020. Sulfur levels in gasoline have been as high as 340 ppm on average in 1999 throughout the United States. Sulfur in gasoline affects the effectiveness of catalytic converters, which convert nitrogen oxides, carbon monoxide, and hydrocarbons into less harmful gases. Tier 2 emissions standards under the Clean Air Act have reduced the concentration of sulfur in gasoline. Gasoline RVP (Reid Vapor Pressure) is a measure of the volatility of gasoline. The EPA rules set limits on volatility during summer months in an effort to reduce emissions of volatile organic compounds, a major contributor to ground-level ozone (smog). The RVP is assumed to be 13.4 psi in January and 9.0 psi in July. Daily Temperature Range
MOBILE6.2 uses the ambient air temperature minimum and maximum to perform calculations with consideration to the temperature impacts on emissions. These temperatures were assumed to be a minimum of 72o F and maximum of 85o F for the summer and a minimum of 16o F and maximum of 38o F for the winter.
40

Temperature will also affect the performance of the batteries powering the all electric side of plug-in hybrid vehicles. Cold weather significantly decreases the distance traveled using batteries, but data was not available to model the specific impacts of Minnesota weather on PHEVs, and temperature was not taken into account in the GREET model. Estimation of Speed on Model Highway Network Speed assignment information was derived by the Metropolitan Council with a travel demand forecast model. The average congested-model speeds, aggregated by area type, were used in the MOBILE6.2 model to derive the composite emission factors. Carbon Dioxide Adjustments Carbon dioxide emissions from vehicle operations were adjusted for consistency with Minnesota inventories. Fuel use data from the EIA Annual Energy Outlook were used with the energy and carbon content of gasoline and ethanol to determine the total grams of carbon dioxide, which could be converted to grams per mile traveled and reincorporated into the vehicle operation emissions. Future Alternative Vehicle Assumptions – GREET and EPRI Model The share of electricity used, and related emissions, were calculated using the EPRI model of a PHEV 20 and PHEV 60, where a PHEV 20 uses electricity for 40% of miles traveled and a PHEV 60 uses electricity for 75% of miles traveled. The proportions of emissions from electricity and gasoline were calculated separately using GREET and combined into the total fuel production emissions. The fuel efficiency assumed by GREET for an average conventional vehicle in 2020 is 25.3 mpg. This accounts for higher fuel economy in new vehicles and the fuel economy of existing vehicles that will still be a portion of the future fleet. MOBILE6 is not able to estimate the emissions from future technology. Improvements in fuel efficiency for alternative technology vehicles expected in the GREET model was taken into account when calculating the alternative technology vehicle operation emissions from MOBILE6 conventional vehicle results. Vehicle Miles Traveled Statewide Fleet The Minnesota Department of Transportation projected Minnesota-specific statewide vehicle miles traveled (VMT) in 2020. Vehicle miles traveled are calculated by county using annual average daily travel for each type of roadway, and aggregated for statewide VMT.
41

The projected VMT for 2020 is based on trend analysis of 1992-2005 VMT where the 2005 base year VMT is 56.5 billion miles. Counties have specifically calculated unique growth rates that projected statewide changes in VMT. Projected VMT for 2020 used for this report is 75.5 billion miles, where passenger vehicles travel a proportion of the total (26 billion miles). The statewide VMT accounted for the miles traveled by all types of vehicles, and it was necessary to extract the proportion of miles traveled by passenger vehicles. The trends in SUV purchasing patterns have slowed since MOBILE6.2 was programmed, and in order to re-adjust the VMT proportions back onto the long-term trend, the EPA commissioned a new projection. The revised projection considers the observed data collected by the Federal Highway Administration to create growth factors, and reclassifies the vehicle types into the classes used in MOBILE6.2. These projections are not specific to Minnesota, but the revision yields a more accurate prediction of the proportion of VMT by passenger vehicles (34.59% of VMT). State Owned Fleet The state owned fleet was assumed to change little, because no significant growth is expected in state government. The number of vehicles was held constant from the 2006 Central Motor Pool census, while the VMT was increased at the state expected rate. VMT was projected from urban and rural growth rates, combined by the proportions of miles traveled in urban and rural areas. Data for the current state fleet was limited, and the only current miles traveled that are recorded are associated with the Central Motor Pool, which accounts for 1290 passenger vehicles. According to data obtained from the Minnesota Department of Administration, the state owned and leased passenger vehicle count was 2099 vehicles for FY 2006; a significant portion of these vehicles are represented by the Central Motor Pool data. The Central Motor Pool data was used to calculate the average VMT for the projection into 2020.
42

Appendix E: EPRI PHEV model summary The model developed by EPRI was used to model the proportions of miles traveled under all electric and gasoline ICE conditions. The only information used from this study was this proportion of all electric travel. EPRI Passenger Vehicles*
Vehicle Description Fuel Economy** Annual Vehicle Miles Traveled***
Fuel Consumption
Conventional (CV)
Internal combustion – baseline for comparison
City Gasoline: 28 mpg Hwy Gasoline: 38mpg Net: 34 mpg
City Gasoline: 6,528 mi Hwy Gasoline: 6,794 mi
Gallons gasoline: 406 kWh electricity: 0
Hybrid (HEV 0)
Parallel hybrid with a small battery for power assist and regenerative braking, but no plug-in capability and no all-electric range
City Gasoline: 44 mpg Hwy Gasoline: 39mpg Net: 41 mpg
City Gasoline: 6,528 mi Hwy Gasoline: 6,794 mi
Gallons gasoline: 322 kWh electricity: 0
Plug-in Hybrid (PHEV 20)
Parallel hybrid that can operate like an HEV 0 but also has plug-in capability and a battery of sufficient capability to provide 20 miles of all electric range. 40% of miles traveled use electricity, 60% of miles traveled use gasoline
City Gasoline: 44 mpg Hwy Gasoline: 45 mpg City Electric: 0.277 kWh/mi Hwy Electric: 0.320 kWh/mi Net: 74 mpg
City Gasoline: 3,943 mi Hwy Gasoline: 4,103 mi City Electric: 2,585 mi Hwy Electric: 2,691 mi
Gallons gasoline: 180 kWh electricity: 1,577
Plug-in Hybrid (PHEV 60)
Parallel hybrid that can operate like an HEV 0 but also has plug-in capability and a battery of sufficient capability to provide 60 miles of all electric range. 75% of miles traveled use electricity, 25% of miles traveled use gasoline
City Gasoline: 46 mpg Hwy Gasoline: 47 mpg City Electric: 0.277 kWh/mi Hwy Electric: 0.315 kWh/mi Net: 194 mpg
City Gasoline: 1,569 mi Hwy Gasoline: 1,633 mi City Electric: 4,959 mi Hwy Electric: 5,161 mi
Gallons gasoline: 69 kWh electricity: 2,999
*EPRI reports were used only to establish the proportion of miles traveled under electric and ICE power. The fuel economy used for comparison in the report is derived from GREET and the VMT were modeled by Mn/DOT and adjusted using a conversion of MOBILE6.2 proportions developed by the EPA. **GREET net fuel economy: conventional vehicle – 25 mpg, HEV – 43 mpg, PHEV 20 – 56 mpg, and PHEV 60 – 68 mpg. ***Gas and Electric cycles figured using ADVISOR, assuming that batteries must stay above 20% charge and speed was within 2 mph of speed limit. Proportions ICE and electric determined by the probability that an entire trip could be completed on all electric power. VMT used for the study was derived from state specific information, not the EPRI model.
43

Appendix F: Abbreviations and Acronyms
− CO – Carbon monoxide. A criteria air pollutant resulting from incomplete fuel combustion in vehicles. Carbon monoxide inhibits the body’s ability to absorb oxygen.
− CO2 – Carbon dioxide. A product of combustion. Increasing concentrations of this gas contributes to global climate change.
− CENRAP – Central Regional Air Planning Association. − CV – Conventional vehicle − EPRI – Electric Power Research Institute − E10 – Gasoline blended with 10% ethanol. All gasoline sold in Minnesota is E10 − E85 – Gasoline blended with 85% ethanol for use in flex fuel vehicles. − GREET – Model published by Argonne National Labs and the Department of
Energy. Stands for: Greenhouse gases, Regulated Emissions, and Energy use in Transportation.
− HEV – Hybrid Electric Vehicle. Examples: Toyota Prius, Honda Civic Hybrid, Ford Escape Hybrid
− ICE – Internal combustion engine. − LADCO – Lake Michigan Air Directors Consortium − MMBtu – Million Btu (British Thermal Units). A measure of the energy content
in fuels. − NOx – Nitrogen Oxides. A criteria air pollutant that reacts with hydrocarbons to
form ozone, or smog. Unlike atmospheric ozone, concentrations of ozone at the ground level can have serious health effects.
− PHEV – Plug-in Hybrid Electric Vehicle. − PHEV 20 – A plug-in hybrid vehicle with an all electric range of 20 miles. − PHEV 60 – A plug-in hybrid vehicle with an all electric range of 60 miles. − PM 2.5 – Particulate matter less than 2.5 microns. This criteria air pollutant can
cause respiratory health effects. − PSI – Pounds per square inch. A measure of pressure − RVP – Reid Vapor Pressure. A measure of gasoline volatility by psi. − SO2 – Sulfur dioxide. A criteria air pollutant that contributes to acid rain
deposition. − VMT – Vehicle miles traveled. − VOC – Volatile Organic Compounds. These are key chemicals in the reactions
that form ozone, or smog, which causes health effects.
44

Appendix G: References and Resources Argonne National Laboratory. 1998. Total Energy Cycle Assessment of Electric and Conventional Vehicles: An Energy and Environmental Analysis. Vol. 1 and 2. Prepared for Office of Energy Efficiency and Renewable Energy, U. S. Department of Energy, Washington D. C. Argonne National Laboratory, Chicago IL: 1999. GREET 1.5 – Transportation Fuel Cycle Model. Volume 1: Methodology, Development, Use, and Results. Argonne National Laboratory, Chicago, IL: 2006. GREET: Greenhouse Gases, Regulated Emissions, and Energy Use in Transportation. Version 1.7, October 2006. Software available: http://www.transportation.anl.gov/software/GREET/ Bentley J. M., et al. 1992. The Impact of Electric Vehicles on CO2 Emissions. Arthur D. Little, Publishers. CalCars: The California Cars Initiative. http://www.calcars.org/ EPRI, Palo Alto CA: 2001. Comparing the Benefits and Impacts of Hybrid Electric Vehicle Options. 1000349. EPRI, Palo Alto CA: 2002. Comparing the Benefits and Impacts of Hybrid Electric Vehicle Options for Compact Sedan and Sport Utility Vehicles. 1006892. Federal Highway Administration. 2007.Highway Statistics 2005. Metropolitan Council. 2007. Average Speed of Travel by Roadway Type. Mark Filipi. Personal communication via e-mail, January 22, 2007. E-mail: [email protected] Minnesota Department of Administration. 2007. State of Minnesota Central Motor Pool Data. Tim Morse. Personal communication via e-mail, February 8, 2007. E-mail: [email protected] Minnesota Department of Administration. 2007. State of Minnesota Vehicle Count. Tim Morse. Personal communication via e-mail, January 29, 2007. E-mail: [email protected] Minnesota Department of Transportation. 2007. Minnesota Vehicle Miles Traveled. Gene Hicks. Personal communication via e-mail, January 12, 2007. E-mail: [email protected] Sanna, Lucy. Fall 2005. Driving the Solution: The Plug-In Hybrid Vehicle. EPRI Journal.
45
SonomaTech. September 21, 2004CENRAP Inventory Files for Mobile Sources and Agricultural Dust – NIF 3.0 Format & SMOKE Format. . http://cenrap.sonomatech.com/CENRAP_Mobile_AgDust.htm Thompson, Stephen and James B. McCarthy. May, 1999. Sulfur in Gasoline: CRS Report for Congress. Available: http://www.ncseonline.org/NLE/CRSreports/energy/eng-51.cfm U. S. Environmental Protection Agency. AirData. Available: http://www.epa.gov/oar/data/index.html U. S. Environmental Protection Agency. Guide on Federal and State Summer RVP Standards for Conventional Gas Only. Available: http://www.epa.gov/otaq/volatility.htm Updated March, 2006. U. S. Environmental Protection Agency Pechan and Industrial Economics, Inc. 2004. Documentation of 2003 VMT Projection Methodology - CAIR. EPA Contract 68-W-02-048, WA B-41. U. S. Environmental Protection Agency. MOBILE6.2 Vehicle Emissions Modeling Software. Software available: http://www.epa.gov/otaq/m6.htm Wang M. Q., and D. J. Santini. 1993. Magnitude and Value of Electric Vehicle Emissions Reductions for Six Driving Cycles in Four U.S. Cities with varying Air Quality Problems. Transportation Research Record. 1416:33-42.
46