air cleaning devices: towards design of sustainable buildings · laboratory test method for...
TRANSCRIPT

Fariborz Haghighat, FASHRAE, FISIAQConcordia Research Chair – Tier 1Department of Building, Civil and Environmental EngineeringConcordia UniversityMontreal, Canada
Air Cleaning Devices: Towards Design of Sustainable Buildings

Acknowledgement•Other Research Team Members for the project
–Dr. Chang-Seo Lee–Dr. Lexuan Zhong–Dr. Ali Khazarei–Ms. Donya Farhanyan–Mr. Alireza Aghighi
•Sponsors–Dectron Internationale–NSERC CRD program–Concordia University (Research Chair)

Introduction
•Sustainability, IAQ•Substantial market•Manufacturer’s claims on VOC removal •Limited information data and measurement techniques•Lack of standard methods for testing, etc.


Source: website

Air Cleaning Technologies•Airborne Particles
–Fibrous filters, electrostatic precipitators, etc.•Microorganisms (Bioaerosols)
–UV disinfection, HEPA filters, etc.•Gases
–Sorption filtration–Ultraviolet photocatalytic oxidation (UV-PCO)–Non-thermal plasma,–Etc.

Ventilation Systems in Buildings
Thermal Comfort
ASHRAE Standard 55
Indoor Air Quality
ASHRAE Standard 62

Thermal Comfort

Global Thermal Comfort
•Air Temperature•Relative Humidity•Air Velocity/Distribution•Activity Level•Clothing Thermal Resistance

ASHRAE Standard 62

Ventilation
•Von Pettenkofer (1858) suggested use of CO2 as indicator of IAQ
–1000 PPM as a maximum level to overcome hindrance of odour from human effluents.
–ΔCO2 = 500 PPM (10 l/s)

IAQ & Adaptation
•Yaglou (1937) –CO2 limitation–Occupants' adaptation
•Cain (1983)–Occupants’ adaptation–No relation with ventilation rate
Ventilation rate % of odour acceptance% of odour acceptance
m3/h Visitors Occupants
9 68 96
18 75 96
27 79 92
36 81 95

IAQ & Adaptation

Carbon Dioxide Generation Rate•According to ASHRAE standard 62, building occupants generate
Activity Liter/min Ft3/min
Resting
Sitting
Light work
Manual work
0.20
0.25
0.38
0.50
0.0071
0.0088
0.0135
0.0177
0.0106 Ft3/min/person.
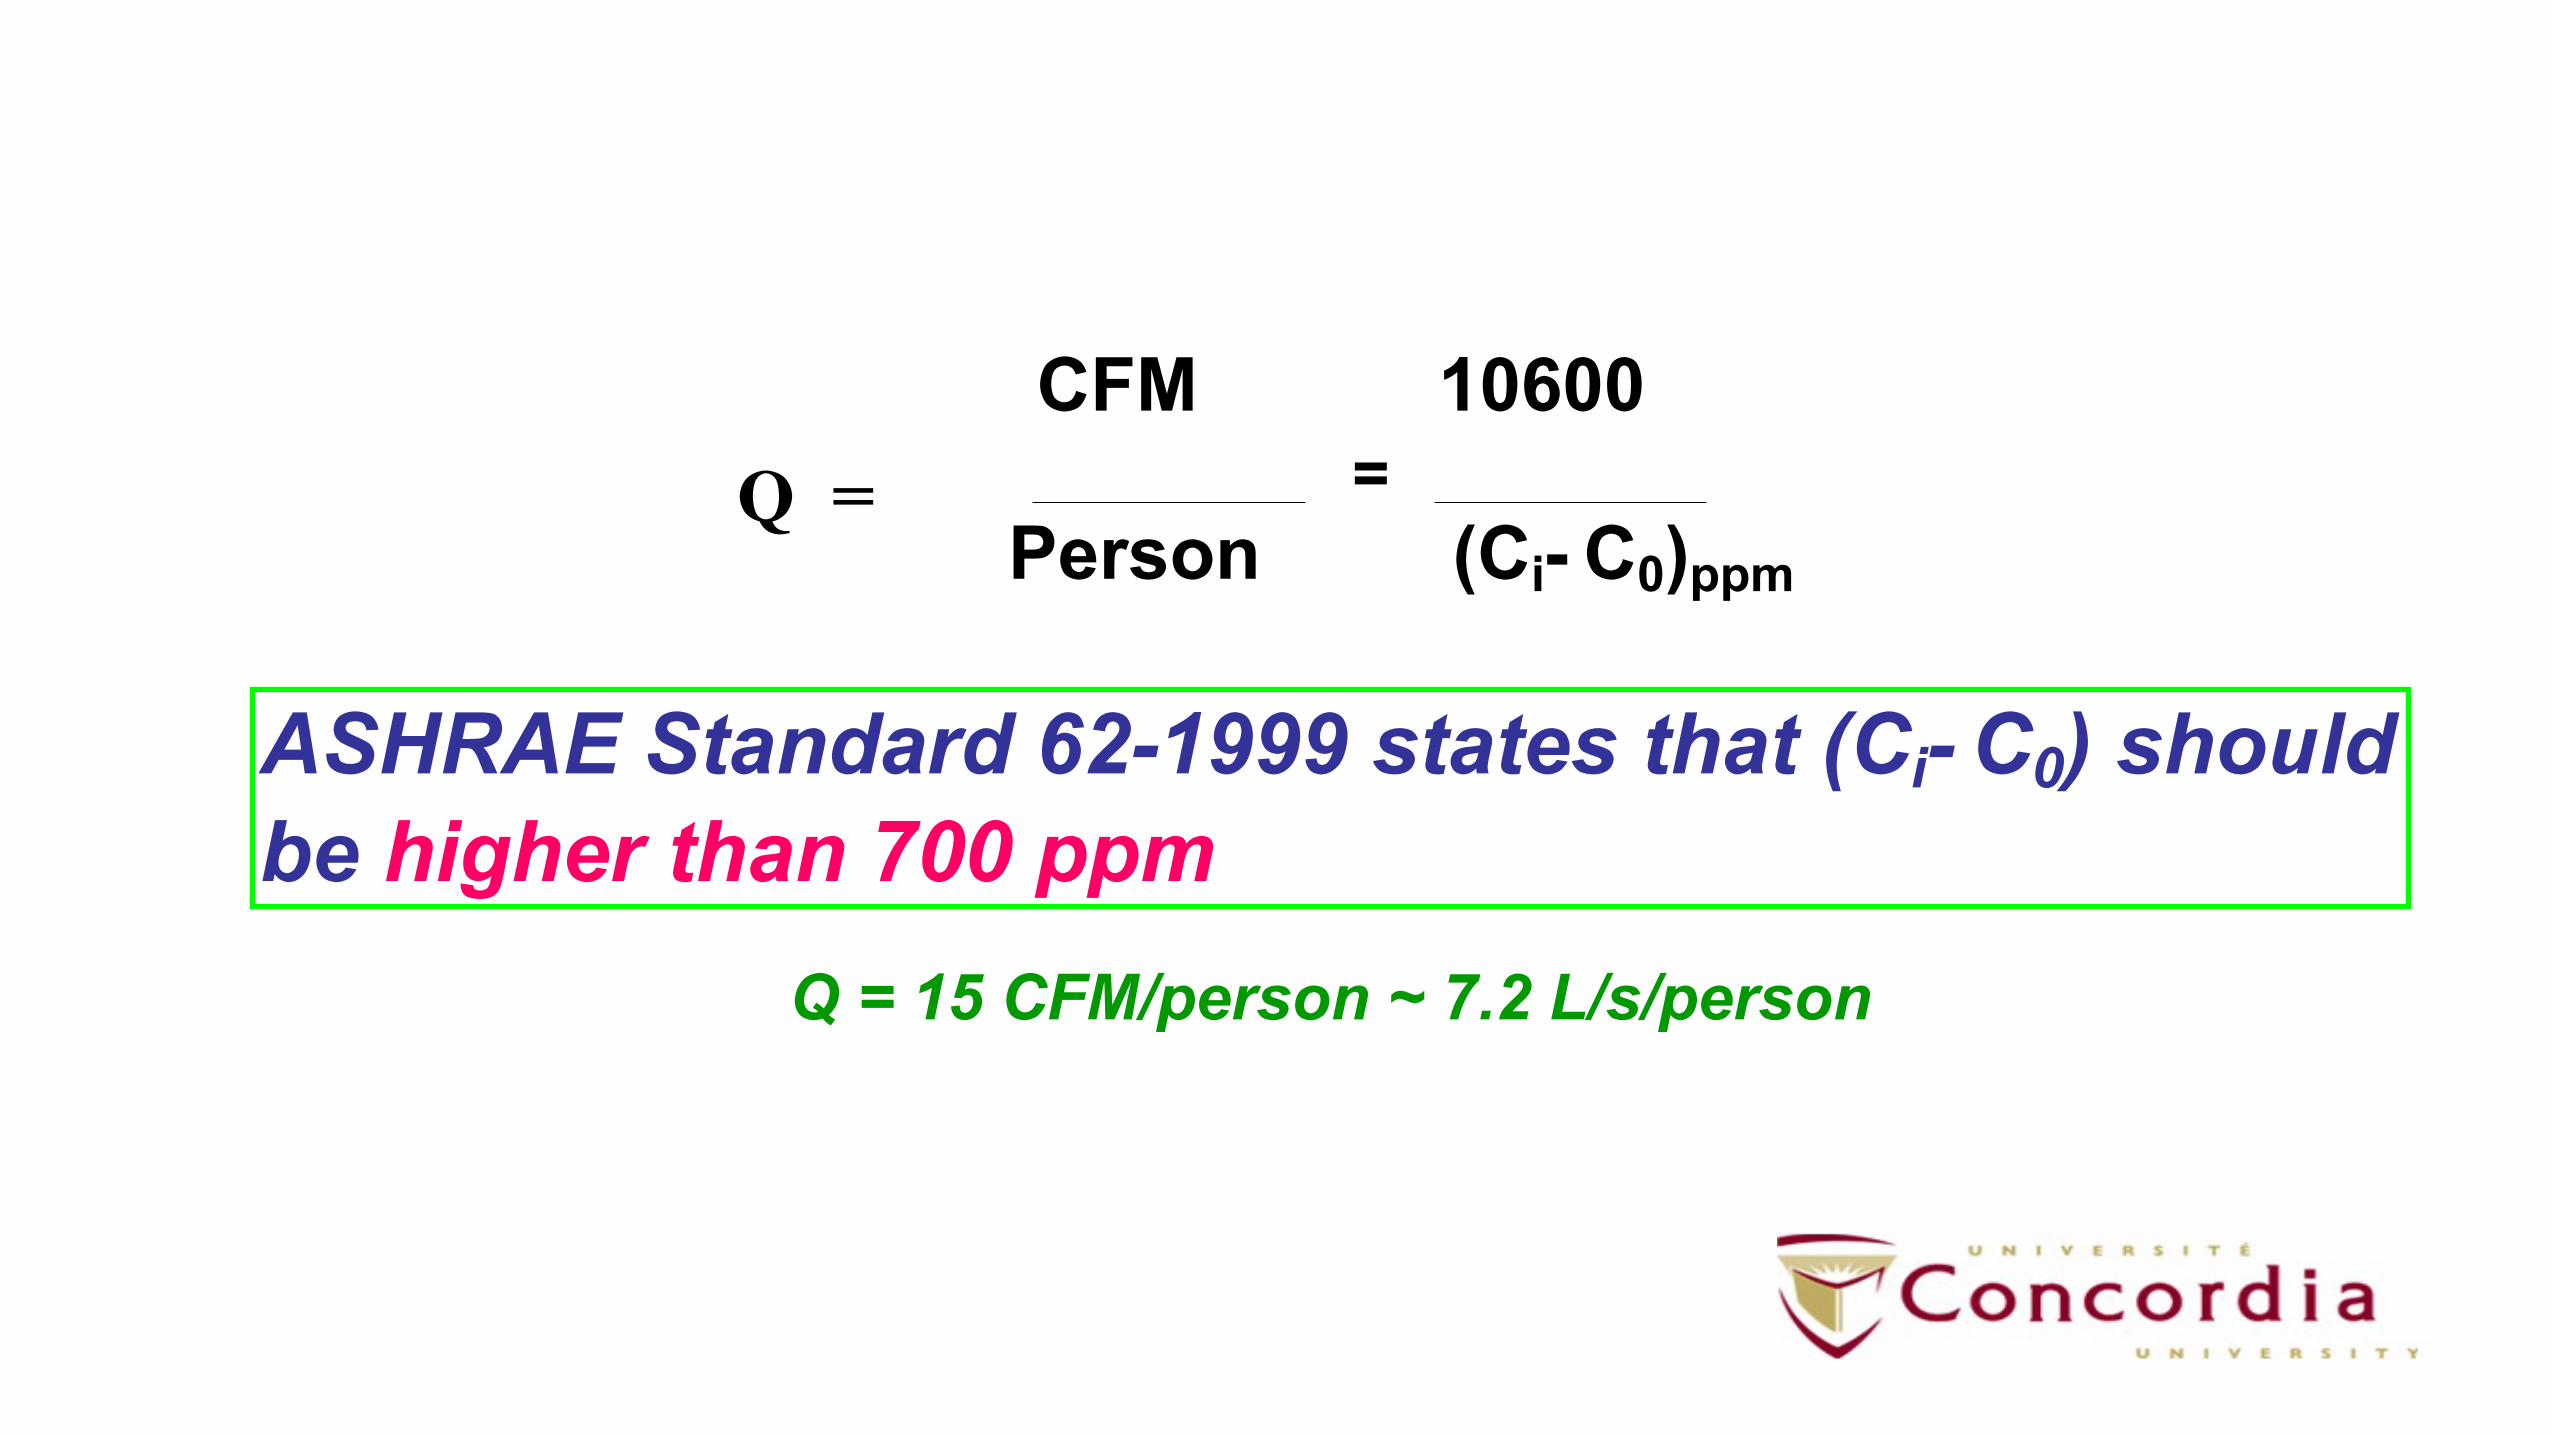
(Ci- C0)ppm
10600
Person
CFM=Q =
ASHRAE Standard 62-1999 states that (Ci- C0) should be higher than 700 ppm
Q = 15 CFM/person ~ 7.2 L/s/person

Ventilation Rate (l/s)
Basis 1 lit/s = 2.11 CFM
> 0.3 2% CO2, (respiration)
>0.5 1% CO2, (performance)
> 1 0.5% CO2, (TLV)
>3.5 0.15% CO2, (body odor)
2.5 ASHRAE Standard 62-1981
3.5 Swedish Building Code 1980
4 Nordic Building Regulation Committee 1981
5-7 Berglund et al (body odor)
8 Fanger et al (body odor)
7.5 ASHRAE Standard 62-1989
5-10 Swedish Building Code 1988
10-30 Swedish Allergy Committee 1989
16-20 Weber et al (Tobacco Smoke)
14-50 Fanger et al (Total odor)
NASA guideline
US Navy guideline / OSHA Std.
WHO guideline

•How to evaluate and how to consider materials and equipment emission rate in order to determine the ventilation rate?

EXAMPLE•WOOD STAINS: nonane, decane, undecane, dimethyloctane, dimethyl-nonane, trimethlylbenzene
•POLYURETHANE: nonane, decane, undecane, butanone, ethylbenzene, dimethylbenzene
•LATEX PAINT: 2-propanol, butanone, ethylbenzene, propylbenzene, 1,1-oxybisbutane, toluene

VOC
•BENZENE (Source: paints, stains) respiratory tract irritation - long term exposure could increase the risk of cancer;
•XYLENES (Source: varnish and solvents) is a narcotic and irritant that can affect the heart, liver, kidney and nervous system;
•TOLUENE (Source: chipboard) is a narcotic and may cause anemia;

Primary Sources• WOOD PRODUCTS• FLOOR COVERINGS• WALL COVERINGS• CEILING MATERIALS• INSULATION• DUCT LINER• FURNISHING• PAINTS• COATINGS• ADHESIVES, CAULKS• SEALANTS• SOLVENTS, STAIN• FLOOR WAX, TEXTILES
• OFFICE EQUIPMENTS, COPIERS, PRINTERS

Primary Sources

Source Characterization: Emission Rate
ASTM D 5116
0.5m×0.4m×0.25m

Emission Rate
0
5 000
10 000
15 000
20 000
0 94,4 188,9 283,3 377,8 472,2 566,7 661,1 755,6 850,0
Ca
(ug/
m3)
Time (h)
Measured DataCFD ModelAnalytical Modelnumerical Model

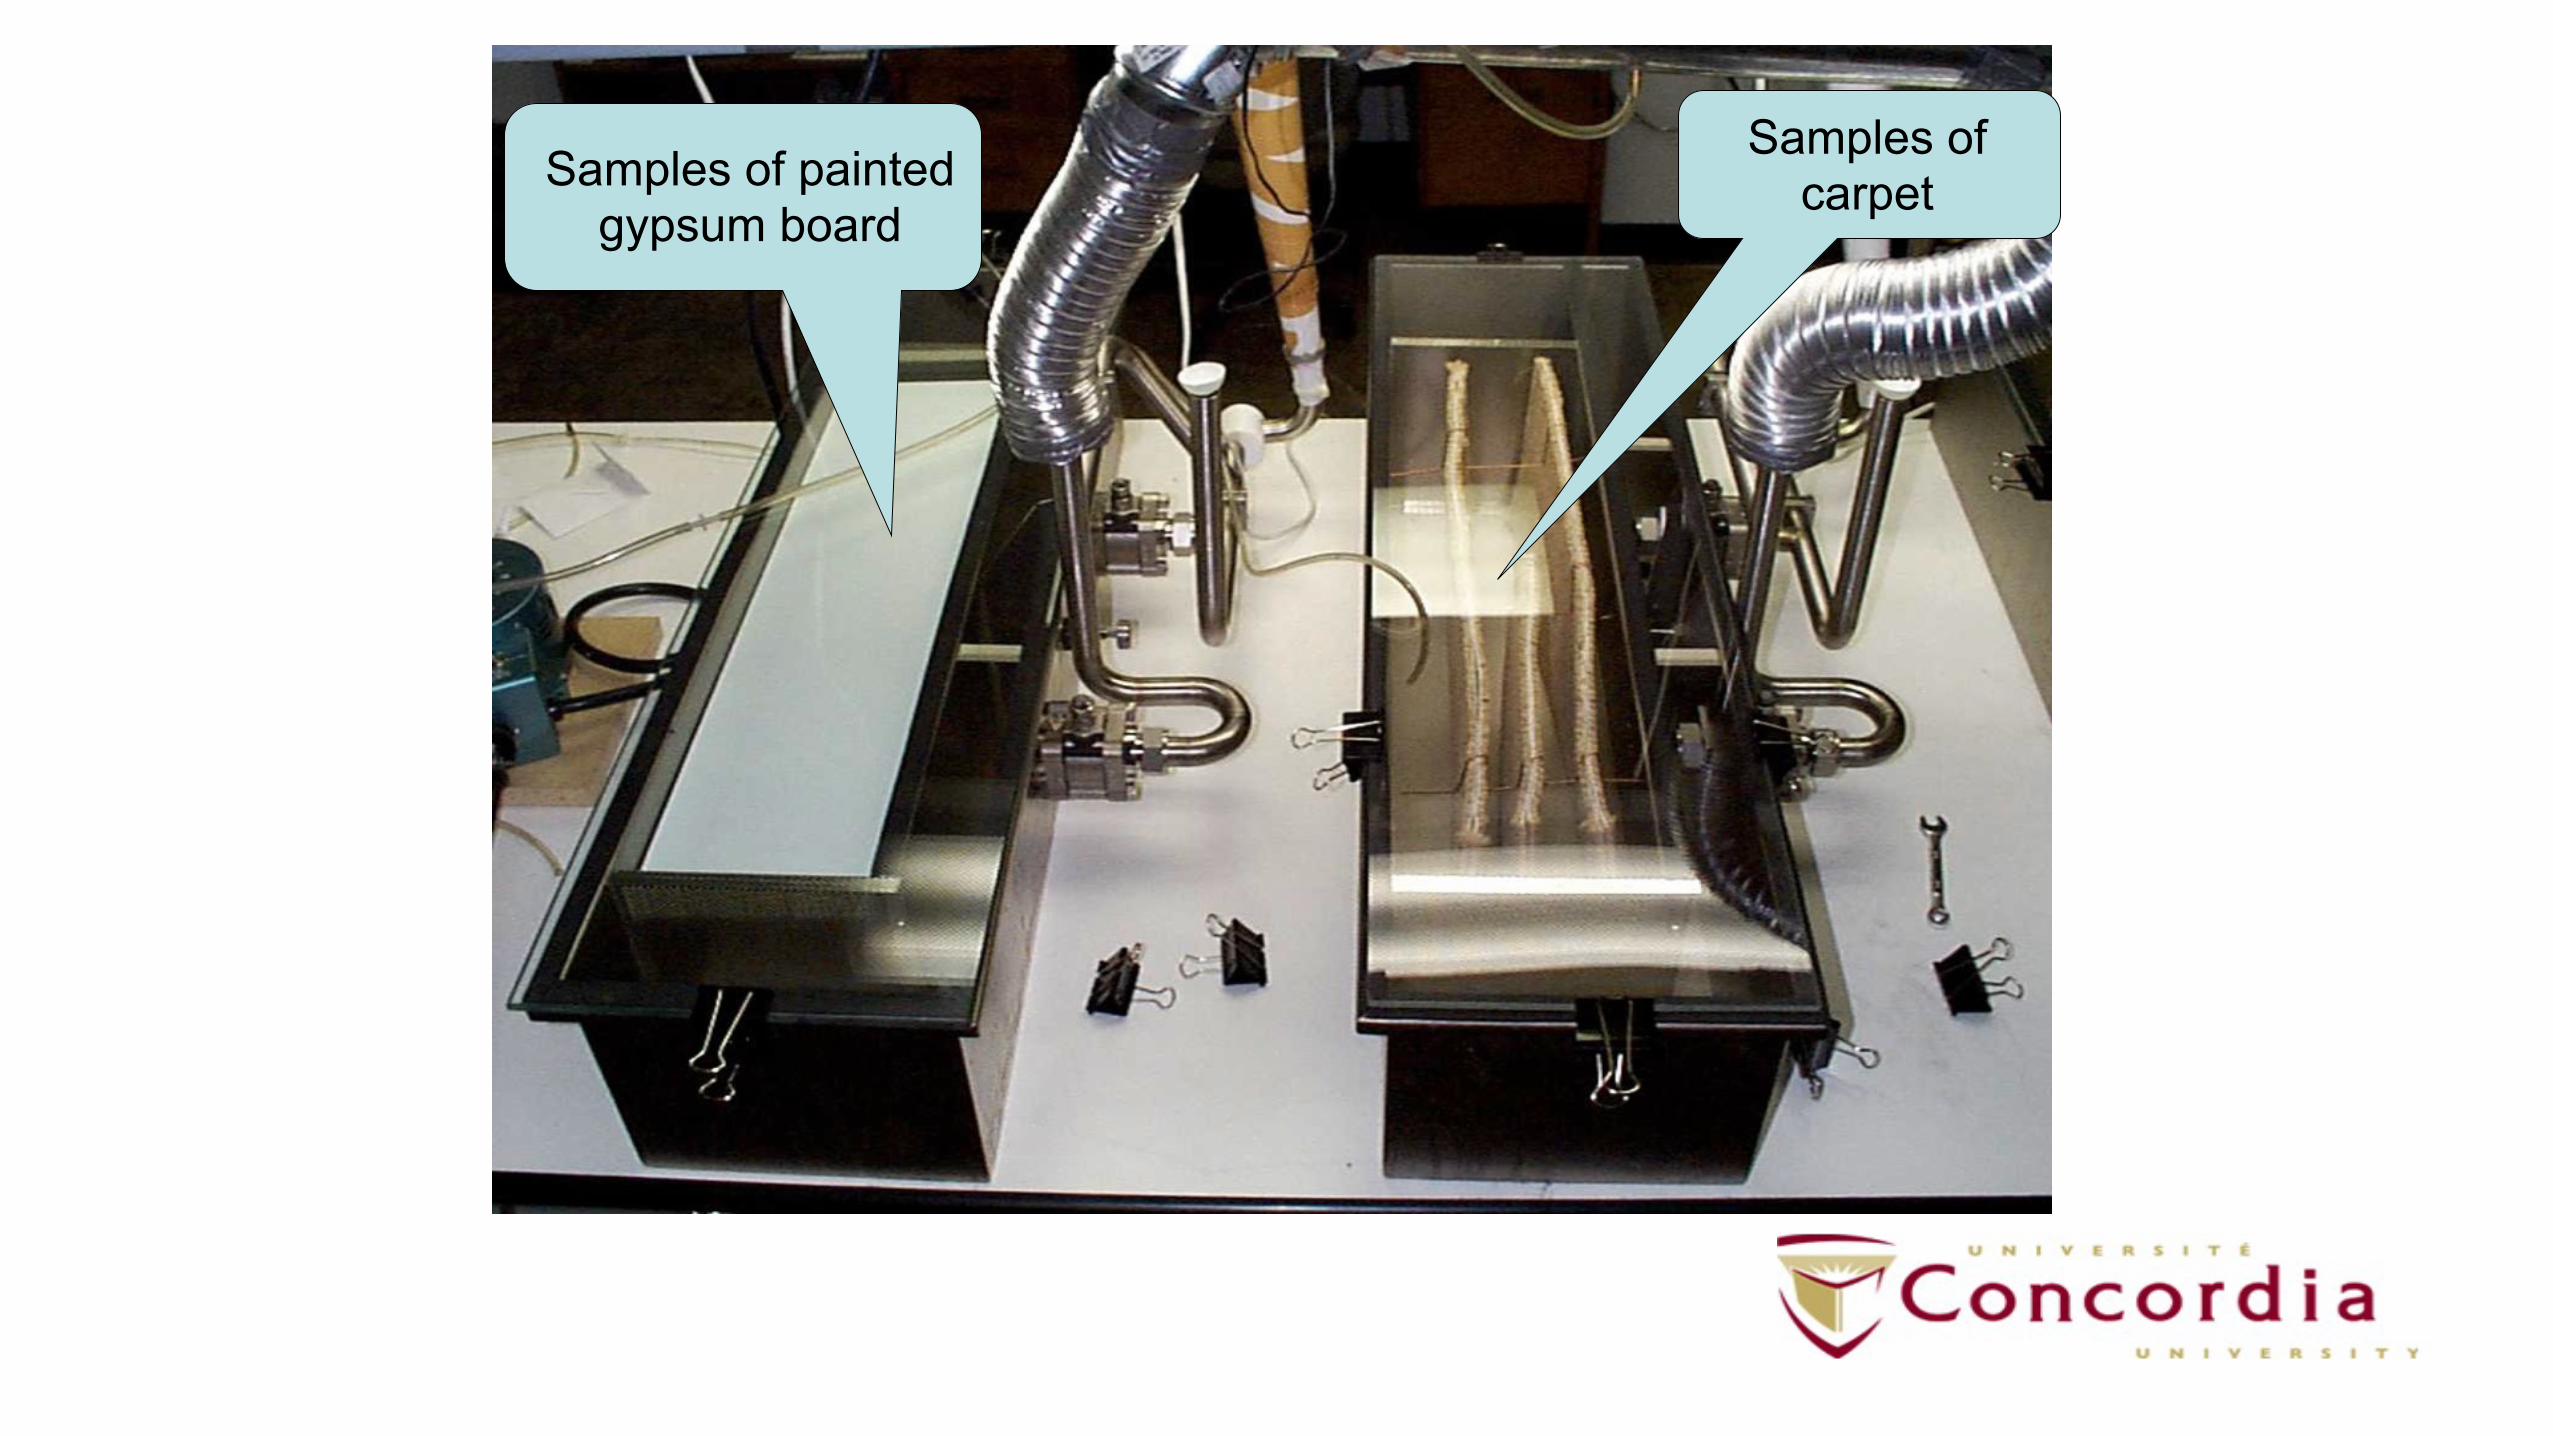
Samples of paintedgypsum board
Samples ofcarpet

Experimental Set-up

During this test you are exposed to air which contains compounds usually found in office environments. How acceptable is the air quality? Please mark on the scale. 2. Rating of odor intensity
How intense is the odor in the air? Choose a number assuming the odor intensity in the laboratory is 10.
The odor intensity is:
1. Acceptability ratingClearly not acceptable
Just not acceptableJust acceptable
Clearly acceptable
Voting Sheet

Procedure

Acc
epta
bilit
y
-10-8-6-4-202468
100.1 1 10 100
Dilution factor
Paint 1Carpet 1PVCSupply
Empty chamber
Exposure-Response Relationship
3.82.7

Acceptability assessments for individual and combined materials with the required dilution needed to reach the acceptability of an
empty chamber
Materials Paint Carpet PVC PVC&Carpet
Paint &PVC
Paint & Carpet
Acceptability without dilution -1.07 -3 -1.4 -2.27 -0.84 -1.66
Required dil. to match supply air acceptability
(2)10.7 14.4 10.6 12.4 16.7 21.7

Conclusions • The impact of increased ventilation on perceived air quality vary from one building material to another
• The relationship between acceptability and dilution factor is more flat for combined materials than for an individual material
• The ventilation rate needed to reach a certain acceptability level will be higher for combined materials than for an individual material
Not sustainable

One Cause and Effect - Heat Island More heat and
cooling load
Increased use of
cooling units
More energy consumption
Higher cooling costs
More air pollution
A blanket of ground-level
ozone (smog)
Health problems
Hotter outdoor temperatures
Source: website

Unsustainable
Source: website

•How to improve the IAQ without increasing energy consumption?

Air Cleaners
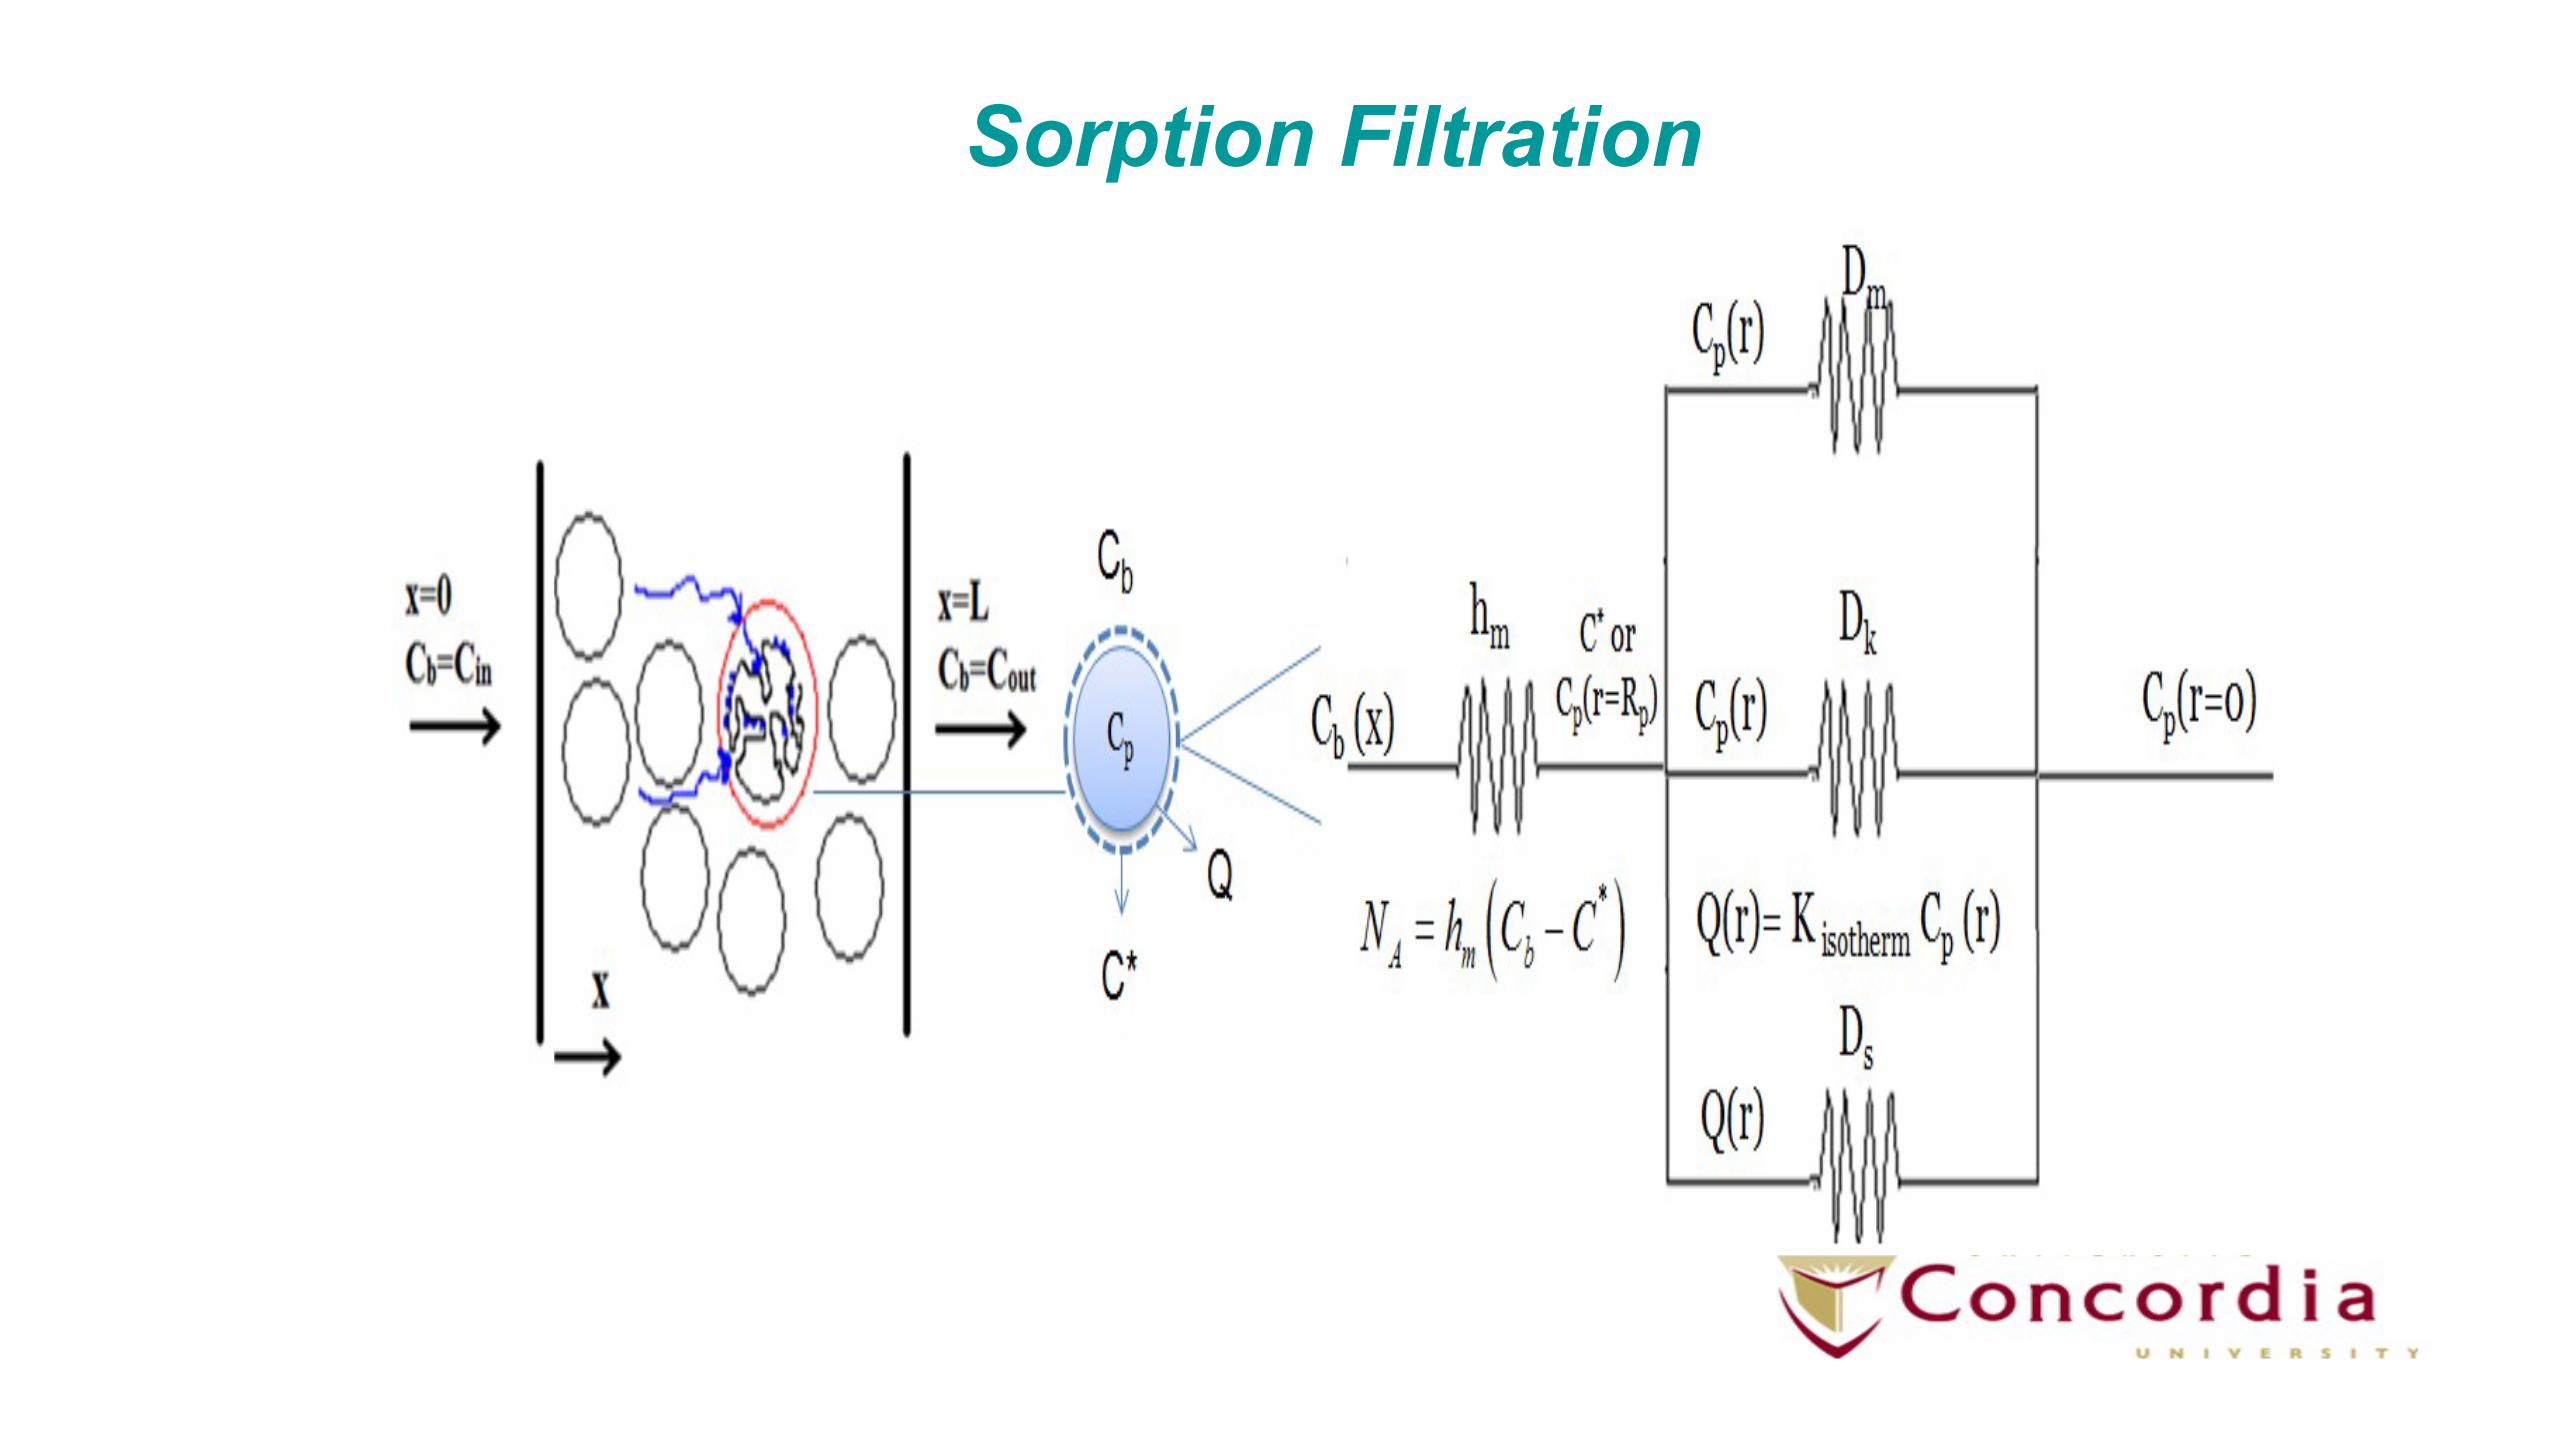
Sorption filtration is the most widely used gaseous air cleaning mechanism in non-industrial buildings.Different sorbent materialsoActivated carbon, Zeolite, etc.
Different product structuresPacked bed, pleated media, etc.

Sorption Filtration
From bulk gas to the external surface of solid phaseDiffusion through pore of solid and migration from external surface to internal pore surfaceAdsorption from gas phase to solid phase
Hunter, P., S., T., Oyama, Control of Volatile Organic Compound Emissions, John Wiley & Sons, Inc., 2000, 45.
Steps in Contaminant Adsorption
Sorption Filtration

Measurement Techniques/Standards
ASHRAE Standard 145.1 ASHRAE Standard 145.2
Loose Granular Media Air Cleaning Devices

ASHRAE Standard 145.1 Laboratory Test Method for Assessing the Performance of Gas-
Phase Air Cleaning Systems: Loose Granular MediaClean Air Supply
HumidificationControl System
Challenge Gas
Temperature Control System
Media Column
PressureMeasurement
Temperature & HumidityMeasurement
Measurement InstrumentsSource: ASHRAE Standard 145.1

ASHRAE Standard 145.2Laboratory Test Method for
Assessing the Performance of Gas-Phase Air Cleaning Systems: Air Cleaning Devices
–Full-scale test duct from ASHRAE Standard 52.2
–Single compound at 100
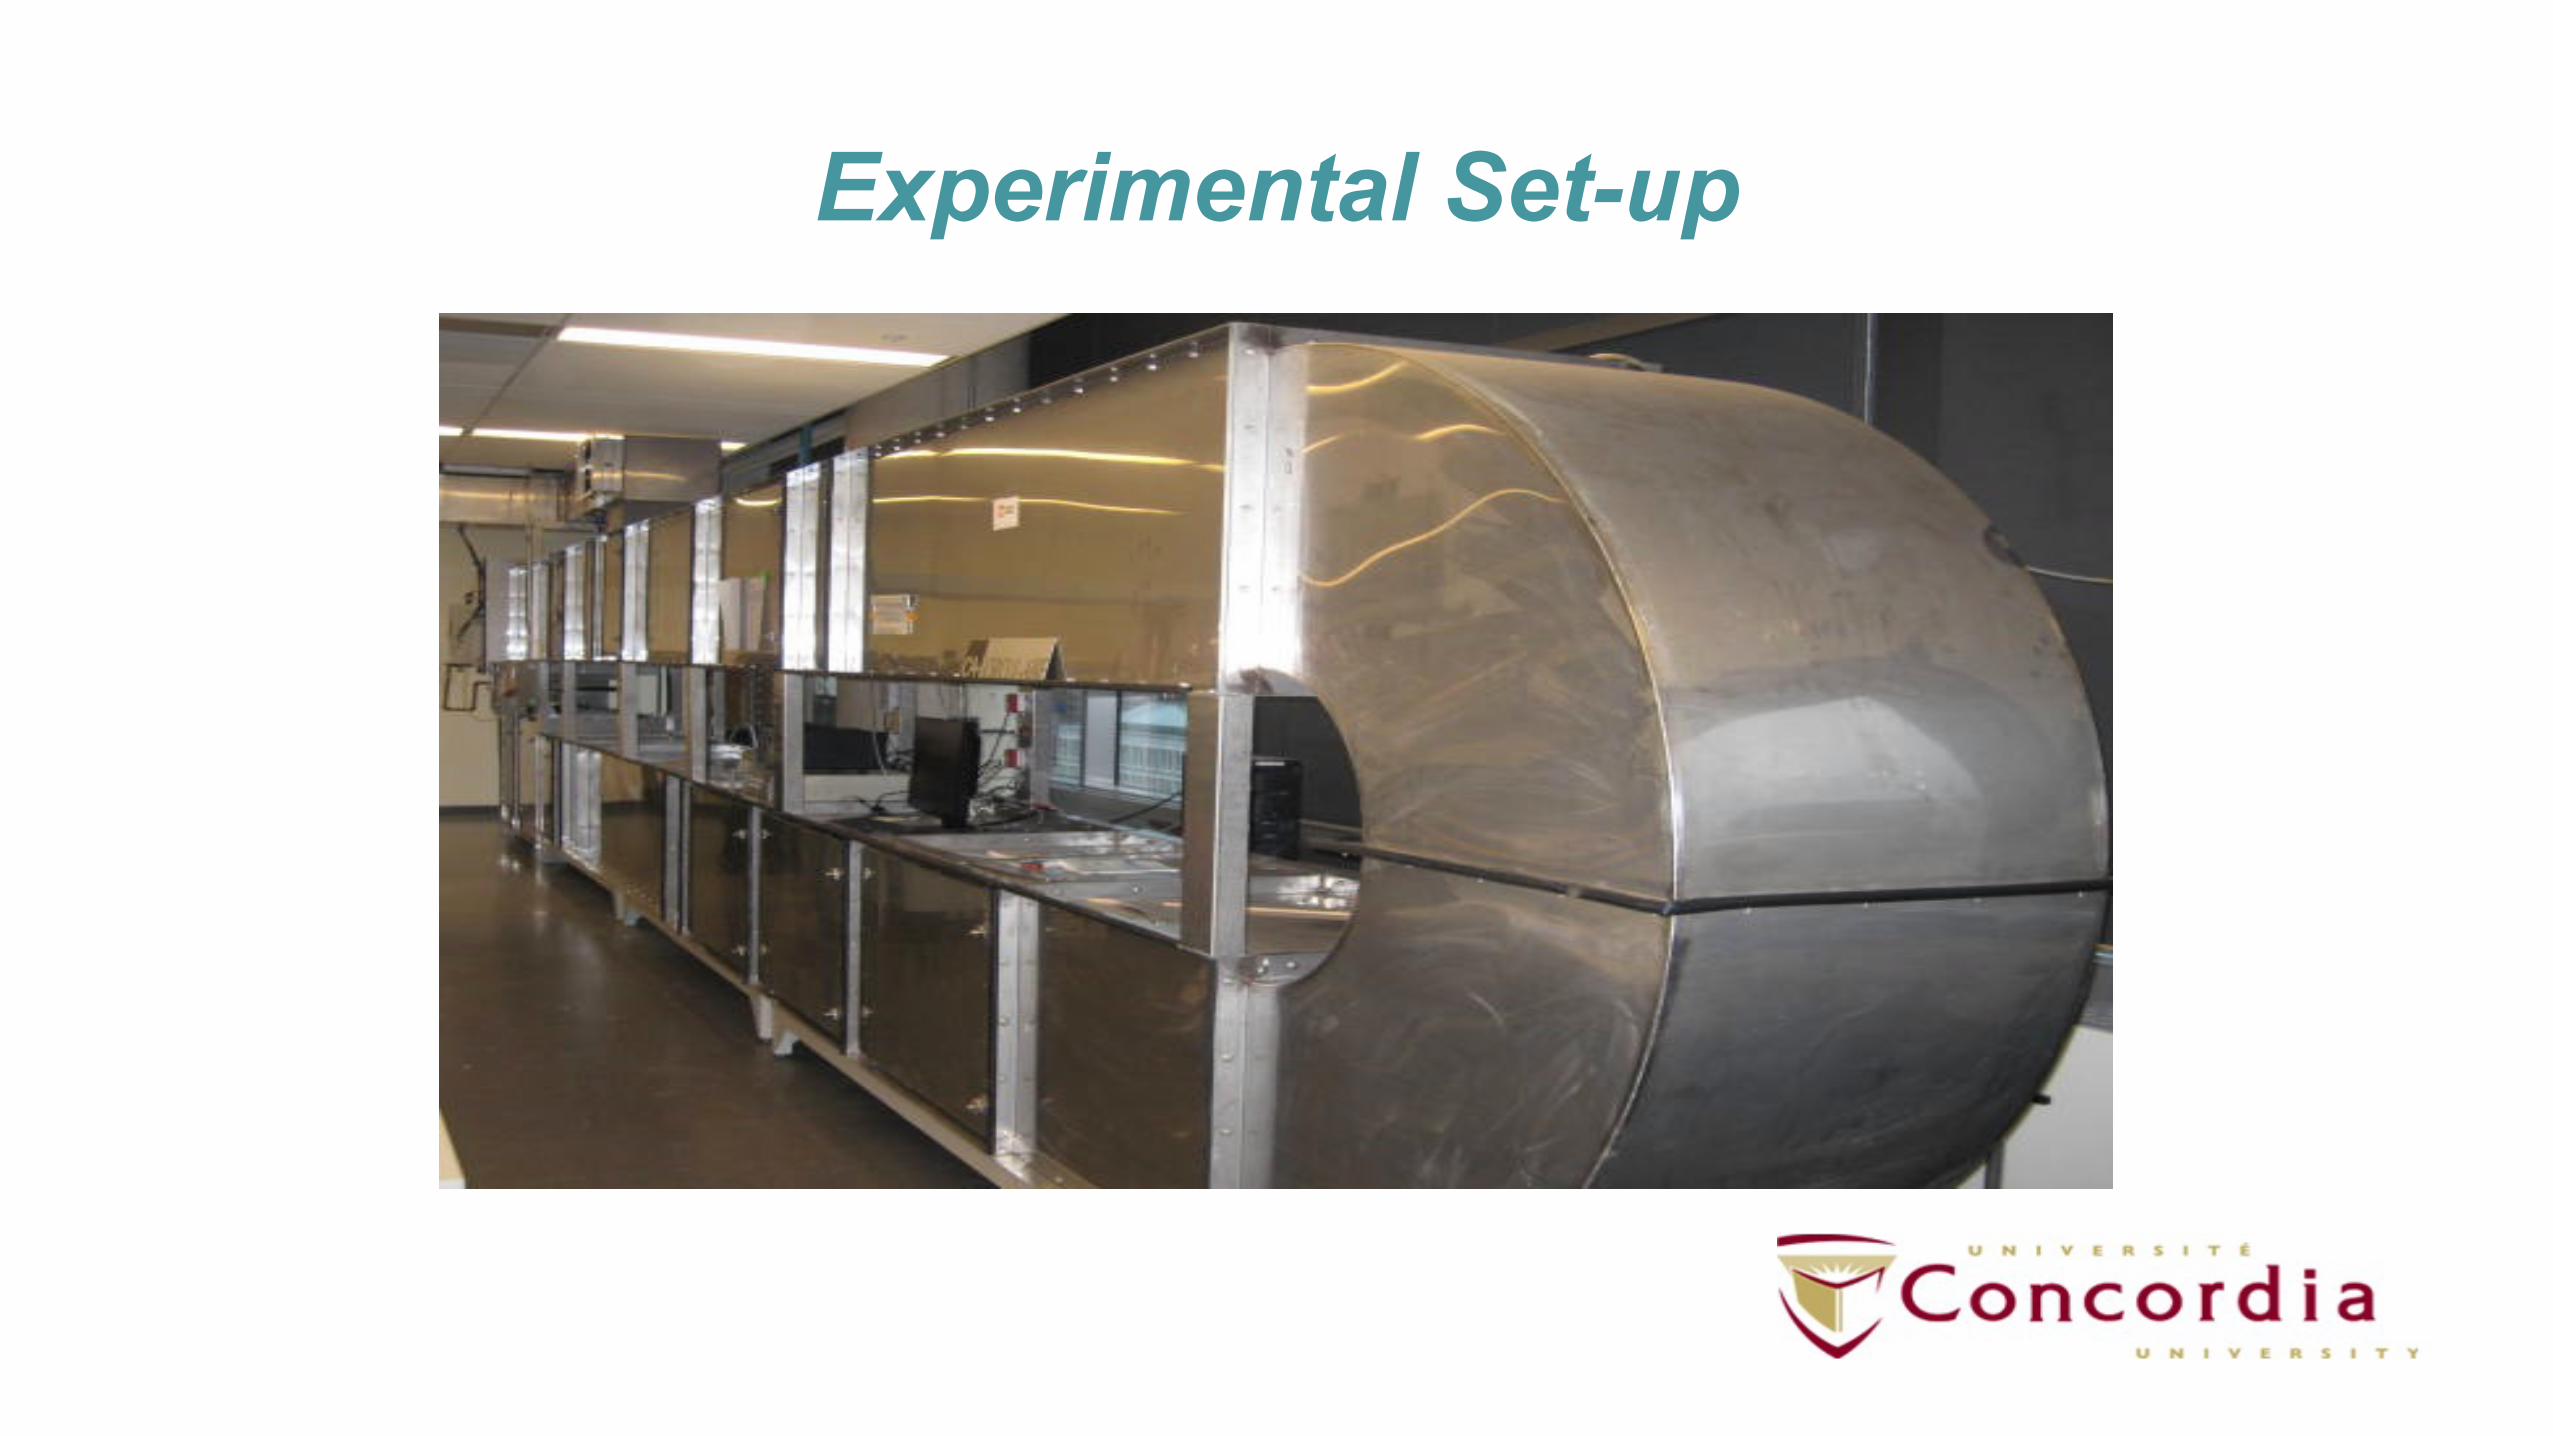
Experimental Set-up

Full-scale dynamic test set-up
40

Full-scale dynamic test set-up
40

Full-scale dynamic test set-up
40

Full-scale dynamic test set-up
40

Full-scale dynamic test set-up
40

Results

Effect of %RH

V-shape Module•Flow resistances (sealed)

Pleated Rigid Carbon Filters•Flow resistances

VanOsdell 1996
toluene
Limitations

Conclusions
•AC could be a solution,•ASHRAE standards tests can be used to compare different filters,
•Needs to develop a procedure to predict the filter performance at low concentrations using existing standards
•Needs routine maintenance and cost (pressure drop and regeneration)

high capacityhigh efficiency
high pressure-drophigh energy usage
Advantages Disadvantages1)Carbon filtration
VOCs/bacteria destroyed
2)PCO technologylow pressure-droplow energy usageno post-treatmentlong life serviceOperation at room T and
pressure
Other Possible Techniques

UV-PCO Reactions Chemical bond energies: 100 – 1000 kJ/mol
604 kJ/mol-1 302 151
200 nm 400 nm 800 nm
ULTRAVIOLET VISIBLE INFRARED
UV – and VIS region is expected to induce chemical reactions.
Bond E (kJ/mol) λ (nm)O-H 465 257C-H 415 288N-H 390 307C-O 360 332C-C 348 344C-Cl 339 353Br-Br 193 620O-O 146 820

UV-PCO

UV-Lamps and Catalyst substratesCatalyst:Catalyst substrate A consists of TiO2 coated on fiber glass and 105.7063 ± 1.6269 m2/g BET surface area.Catalyst substrate B consists of TiO2 coated on activated carbon with 887.6638 ± 10.6871 m2/g BET surface area.
UV-Lamps: VUV lamps with 254nm+185nm wavelength irradiation;UVC lamps with 254nm wavelength irradiation
Catalyst ACatalyst B

Effect of UV-Lamps•A
Removal efficiency versus the initial concentration of target compounds in the presence of VUV and UVC lamps.

Effect of UV-Lamps
By-products yield versus the initial concentration of target compounds in the presence of VUV and UVC lamps.

Effect of Catalyst Substrate
Removal efficiency versus the initial concentration of target compounds in the presence of VUV over TiO2/AC and TiO2/FG

Effect of Catalyst Substrate
By-products yield versus the initial concentration of target compounds in the presence of VUV over TiO2/AC and TiO2/FG
Preliminary Conclusion• Experimental results demonstrated that VUV lamps outperformed UVC lamps for
degradation of model compounds. However, higher amount of by-products were formed in the case of VUV lamps, and crotonaldehyde was only generated in the presence of VUV lamps for both p-xylene and n-hexane.
• The yield of by-products in UV-PCO of n-hexane was greater than p-xylene in the presence of both VUV and UVC lamps. This demonstrates that more partial oxidation and side reactions happen in n-hexane oxidation compared to the p-xylene.
• Comparison of the performance of catalyst substrates, TiO2 /FG and TiO2 /AC, showed that TiO2 /AC has better properties for degradation of target compounds. This is the case especially for UV-PCO of p-xylene where even lower amount of by-products were formed over this catalyst substrate.

Summary and Conclusion•Sorption filtration is still the most effective off-the-shelf commercial technology,
•UV-PCO is a promising technology if designed properly,•However, products tested did not show significant removal effectiveness and generated by-products;–Develop the appropriate substrate,–Develop a methodology to optimize the design
•Further work is needed to develop rating system for product evaluation.