aig first quarter 2008financialsupplement
TRANSCRIPT
This report should be read in conjunction with AIG's Quarterly Report on Form 10-Q for the quarter ended March 31, 2008 filed with the Securities and Exchange Commission.
American International Group, Inc.
Financial Supplement
First Quarter 2008

American International Group, Inc.Financial Supplement
Table of Contents
Consolidated Consolidated Statement of Income (Loss)……. ......................................................................................1 Consolidated Statement of Segment Operations .................................................................................2 - 3 Consolidated Statement of Segment Operations Revenues and Income Graphs ......................................4 Summary of FAS 133 Effect ..............................................................................................................5 - 6 Consolidated Balance Sheet.....................................................................................................................7 Book Value per Share..............................................................................................................................8 General Insurance General Insurance Operating Statistics ....................................................................................................9 Reconciliation of Net Loss Reserves .....................................................................................................10 AIG Commercial Insurance Operating Statistics ...................................................................................11 AIG Commercial Insurance Gross Premiums Written by Line of Business...........................................12 Personal Lines Insurance Operating Statistics .......................................................................................13 Mortgage Guaranty (UGC) Insurance Operating Statistics....................................................................14 Mortgage Guaranty (UGC) Insurance Product Statistics .......................................................................15 Transatlantic Holdings, Inc. Insurance Operating Statistics...................................................................16 Foreign General Insurance Operating Statistics.....................................................................................17 Foreign General Insurance Gross Premiums Written.............................................................................18 General Insurance Notes........................................................................................................................19 Life Insurance & Retirement Services Life Insurance & Retirement Services Operating Statistics ...................................................................20 Domestic Life Insurance & Retirement Services Operating Statistics ...................................................21 Domestic Life Insurance Product Statistics ...................................................................................22 - 23 Domestic Life Insurance Other Data ....................................................................................................24 Domestic Life Insurance Deferred Policy Acquisition Costs, Sales Inducements and Value of Business Acquired..................................................................25 - 26 Domestic Life Insurance Notes..............................................................................................................27 Domestic Retirement Services Product Statistics ..........................................................................28 - 29 Domestic Retirement Services Account Value Rollforward ..................................................................30 Domestic Retirement Services Spread Information ........................................................................31 - 32 Domestic Retirement Services Deferred Policy Acquisition Costs, Sales Inducements and Value of Business Acquired.........................................................................33 Domestic Retirement Services – Individual Variable Annuities Guaranteed Benefits ....................34 - 35 Domestic Retirement Services Notes.....................................................................................................36 Foreign Life Insurance & Retirement Services Operating Statistics ......................................................37 Foreign Life Insurance & Retirement Services Product Statistics...................................................38 - 39
Japan and Other Product Statistics................................................................................................. 40 - 41 Asia Product Statistics ................................................................................................................... 42 - 43 Foreign Life Insurance & Retirement Services Premium Statistics........................................................44 Foreign Life Insurance & Retirement Services Premiums, Deposits and Other Considerations.............45 Foreign Life Insurance & Retirement Services Reserves ............................................................... 46 - 47 Foreign Retirement Services Spread Information ..................................................................................48 Foreign Life Insurance & Retirement Services Deferred Policy Acquisition Costs, Sales Inducements and Value of Business Acquired ...................................................... 49 - 50 Foreign Life Insurance & Retirement Services Notes .................................................................... 51 - 52 Life Insurance & Retirement Services Partnership Income....................................................................53 Life Insurance & Retirement Services Net Realized Capital Gains (Losses) .........................................54 Life Insurance & Retirement Services Statutory Surplus and Net Income.............................................55 Financial Services Financial Services Operating Statistics ..................................................................................................56 International Lease Finance Corporation Aircraft Leases and Orders....................................................57 Consumer Finance Operating Statistics .................................................................................................58 Consumer Finance Other Data...............................................................................................................59 Financial Services Notes........................................................................................................................60 Asset Management Asset Management Operating Statistics.................................................................................................61 Asset Management Other Data ..............................................................................................................62 Asset Management Notes ......................................................................................................................63 Other .................................................................................................................................................64 Consolidated Net Realized Capital Gains (Losses) ............................................65 Investments Cash and Invested Assets by Segment ........................................................................................... 66 - 69 Other Invested Assets by Segment.........................................................................................................70 Return on Average Partnership Assets by Segment ...............................................................................71 Worldwide Insurance and Asset Management Bond Portfolio Ratings..................................................72 Domestic Insurance and Asset Management Bond Portfolio Ratings ....................................................73 Asset-Backed Securities and Collateralized Debt Obligations that Include Residential Mortgages .......74 Commercial Mortgage-Backed Securities..............................................................................................75 Comment on Regulation G ..................................................................................76
American International Group, Inc.Investor Relations
Charlene M. Hamrah, Vice President and Director(212)770-6293

American International Group, Inc.Consolidated Statement of Income (Loss)
(in millions, except per share data)
Three Months Ended March 31, March 31, Dec. 31, Sequential
2008 2007 % Chg 2007 % Chg
Revenues: Premiums and other considerations $ 20,672 $ 19,642 5.2 % $ 20,394 1.4 %Net investment income 4,954 7,124 (30.5) 7,470 (33.7)Net realized capital gains (losses) (1) (2) (6,089) (70) NM (2,630) NMUnrealized market valuation losses on AIGFP super senior credit default swap portfolio (3) (9,107) - NM (11,120) NMOther income (1) (4) 3,601 3,949 (8.8) 4,319 (16.6)
Total revenues (1) 14,031 30,645 (54.2) 18,433 (23.9)Benefits and expenses:
Incurred policy losses and benefits 15,882 16,146 (1.6) 18,153 (12.5)Insurance acquisition and other operating expenses 9,413 8,327 13.0 8,716 8.0
Total benefits and expenses 25,295 24,473 3.4 26,869 (5.9)Income (loss) before income taxes (benefits) and minority interest (11,264) 6,172 NM (8,436) NMIncome taxes (benefits) (5) (3,537) 1,726 NM (3,413) NMIncome (loss) before minority interest (7,727) 4,446 NM (5,023) NMMinority interest (78) (316) NM (269) NMNet income (loss) $ (7,805) $ 4,130 NM % $ (5,292) NM %Earnings (loss) per common share:
Basic $ (3.09) $ 1.58 NM % $ (2.08) NM %Diluted $ (3.09) $ 1.58 NM % $ (2.08) NM %
Dividends declared per common share $ 0.200 $ 0.165 21.2 % $ 0.200 0.0 %Average shares outstanding:
Basic 2,528 2,612 2,550 Diluted 2,528 2,621 2,550
Note: (1) Includes gains (losses) from hedging activities that did not qualify for hedge accounting treatment under FAS 133 "Accounting for Derivative Instruments and Hedging Activities" (FAS 133), including the related foreign exchange gains and losses. For the three months ended March 31, 2008 and 2007 and December 31, 2007, net realized capital gains (losses) includesa loss of $316 million, a loss of $137 million and a loss of $431 million, respectively; other income includes a loss of $432 million, a loss of $315 million and a gain of $56 million, respectively; and total revenues includes a loss of $748 million, a loss of $452 million and a loss of $375 million, respectively.
(2) Includes other-than-temporary impairment charges of $5.59 billion, $467 million and $2.64 billion in the three months ended March 31, 2008 and 2007 and December 31, 2007, respectively.
(3) Represents unrealized market valuation losses on Capital Markets’ super senior credit default swap portfolio. (4) Includes other-than-temporary impairment charges of $643 million on Capital Markets’ available for sale investment securities in the three months ended December 31, 2007. (5) Includes increased reserves of $703 million for uncertain tax positions and discrete period items in the three months ended March 31, 2008.
1
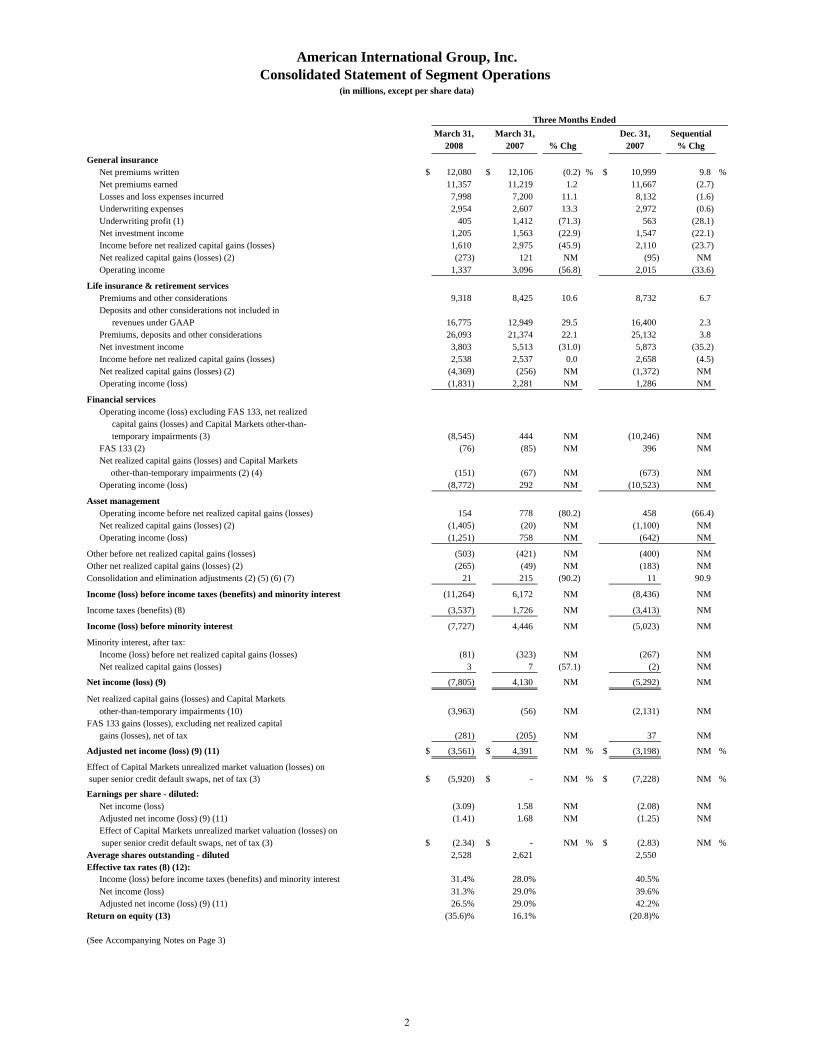
American International Group, Inc.Consolidated Statement of Segment Operations
(in millions, except per share data)
Three Months Ended March 31, March 31, Dec. 31, Sequential
2008 2007 % Chg 2007 % ChgGeneral insurance
Net premiums written $ 12,080 $ 12,106 (0.2) % $ 10,999 9.8 %Net premiums earned 11,357 11,219 1.2 11,667 (2.7)Losses and loss expenses incurred 7,998 7,200 11.1 8,132 (1.6)Underwriting expenses 2,954 2,607 13.3 2,972 (0.6)Underwriting profit (1) 405 1,412 (71.3) 563 (28.1)Net investment income 1,205 1,563 (22.9) 1,547 (22.1)Income before net realized capital gains (losses) 1,610 2,975 (45.9) 2,110 (23.7)Net realized capital gains (losses) (2) (273) 121 NM (95) NM Operating income 1,337 3,096 (56.8) 2,015 (33.6)
Life insurance & retirement services Premiums and other considerations 9,318 8,425 10.6 8,732 6.7Deposits and other considerations not included in
revenues under GAAP 16,775 12,949 29.5 16,400 2.3Premiums, deposits and other considerations 26,093 21,374 22.1 25,132 3.8Net investment income 3,803 5,513 (31.0) 5,873 (35.2)Income before net realized capital gains (losses) 2,538 2,537 0.0 2,658 (4.5)Net realized capital gains (losses) (2) (4,369) (256) NM (1,372) NM Operating income (loss) (1,831) 2,281 NM 1,286 NM
Financial services Operating income (loss) excluding FAS 133, net realized
capital gains (losses) and Capital Markets other-than-temporary impairments (3) (8,545) 444 NM (10,246) NM
FAS 133 (2) (76) (85) NM 396 NM Net realized capital gains (losses) and Capital Markets other-than-temporary impairments (2) (4) (151) (67) NM (673) NM Operating income (loss) (8,772) 292 NM (10,523) NM
Asset management Operating income before net realized capital gains (losses) 154 778 (80.2) 458 (66.4)Net realized capital gains (losses) (2) (1,405) (20) NM (1,100) NM Operating income (loss) (1,251) 758 NM (642) NM
Other before net realized capital gains (losses) (503) (421) NM (400) NM Other net realized capital gains (losses) (2) (265) (49) NM (183) NM Consolidation and elimination adjustments (2) (5) (6) (7) 21 215 (90.2) 11 90.9
Income (loss) before income taxes (benefits) and minority interest (11,264) 6,172 NM (8,436) NM
Income taxes (benefits) (8) (3,537) 1,726 NM (3,413) NM
Income (loss) before minority interest (7,727) 4,446 NM (5,023) NM
Minority interest, after tax:Income (loss) before net realized capital gains (losses) (81) (323) NM (267) NM Net realized capital gains (losses) 3 7 (57.1) (2) NM
Net income (loss) (9) (7,805) 4,130 NM (5,292) NM
Net realized capital gains (losses) and Capital Marketsother-than-temporary impairments (10) (3,963) (56) NM (2,131) NM
FAS 133 gains (losses), excluding net realized capital gains (losses), net of tax (281) (205) NM 37 NM
Adjusted net income (loss) (9) (11) $ (3,561) $ 4,391 NM % $ (3,198) NM %
Effect of Capital Markets unrealized market valuation (losses) on super senior credit default swaps, net of tax (3) $ (5,920) $ - NM % $ (7,228) NM %
Earnings per share - diluted:Net income (loss) (3.09) 1.58 NM (2.08) NM Adjusted net income (loss) (9) (11) (1.41) 1.68 NM (1.25) NM Effect of Capital Markets unrealized market valuation (losses) on super senior credit default swaps, net of tax (3) $ (2.34) $ - NM % $ (2.83) NM %
Average shares outstanding - diluted 2,528 2,621 2,550 Effective tax rates (8) (12):
Income (loss) before income taxes (benefits) and minority interest 31.4% 28.0% 40.5%Net income (loss) 31.3% 29.0% 39.6%Adjusted net income (loss) (9) (11) 26.5% 29.0% 42.2%
Return on equity (13) (35.6)% 16.1% (20.8)%
(See Accompanying Notes on Page 3)
2
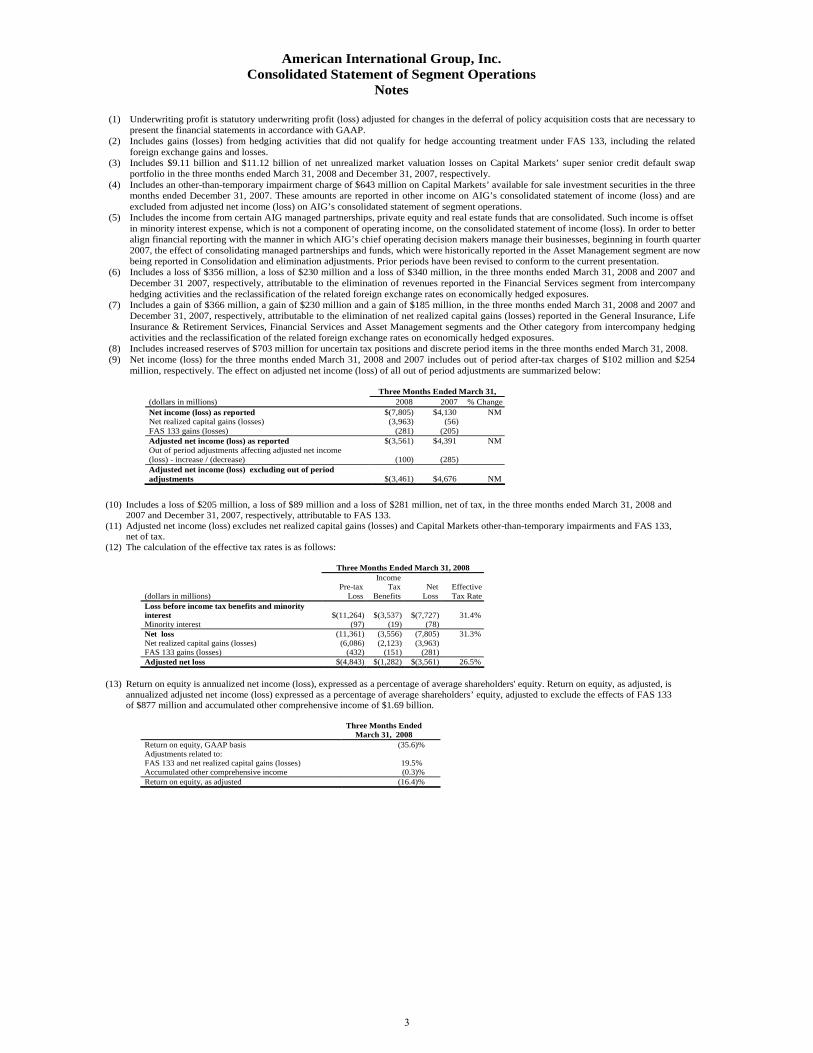
American International Group, Inc. Consolidated Statement of Segment Operations
Notes
(1) Underwriting profit is statutory underwriting profit (loss) adjusted for changes in the deferral of policy acquisition costs that are necessary to
present the financial statements in accordance with GAAP. (2) Includes gains (losses) from hedging activities that did not qualify for hedge accounting treatment under FAS 133, including the related
foreign exchange gains and losses. (3) Includes $9.11 billion and $11.12 billion of net unrealized market valuation losses on Capital Markets’ super senior credit default swap
portfolio in the three months ended March 31, 2008 and December 31, 2007, respectively. (4) Includes an other-than-temporary impairment charge of $643 million on Capital Markets’ available for sale investment securities in the three
months ended December 31, 2007. These amounts are reported in other income on AIG’s consolidated statement of income (loss) and are excluded from adjusted net income (loss) on AIG’s consolidated statement of segment operations.
(5) Includes the income from certain AIG managed partnerships, private equity and real estate funds that are consolidated. Such income is offset in minority interest expense, which is not a component of operating income, on the consolidated statement of income (loss). In order to better align financial reporting with the manner in which AIG’s chief operating decision makers manage their businesses, beginning in fourth quarter 2007, the effect of consolidating managed partnerships and funds, which were historically reported in the Asset Management segment are now being reported in Consolidation and elimination adjustments. Prior periods have been revised to conform to the current presentation.
(6) Includes a loss of $356 million, a loss of $230 million and a loss of $340 million, in the three months ended March 31, 2008 and 2007 and December 31 2007, respectively, attributable to the elimination of revenues reported in the Financial Services segment from intercompany hedging activities and the reclassification of the related foreign exchange rates on economically hedged exposures.
(7) Includes a gain of $366 million, a gain of $230 million and a gain of $185 million, in the three months ended March 31, 2008 and 2007 and December 31, 2007, respectively, attributable to the elimination of net realized capital gains (losses) reported in the General Insurance, Life Insurance & Retirement Services, Financial Services and Asset Management segments and the Other category from intercompany hedging activities and the reclassification of the related foreign exchange rates on economically hedged exposures.
(8) Includes increased reserves of $703 million for uncertain tax positions and discrete period items in the three months ended March 31, 2008. (9) Net income (loss) for the three months ended March 31, 2008 and 2007 includes out of period after-tax charges of $102 million and $254
million, respectively. The effect on adjusted net income (loss) of all out of period adjustments are summarized below:
Three Months Ended March 31, (dollars in millions) 2008 2007 % ChangeNet income (loss) as reported $(7,805) $4,130 NMNet realized capital gains (losses) (3,963) (56)FAS 133 gains (losses) (281) (205)Adjusted net income (loss) as reported $(3,561) $4,391 NMOut of period adjustments affecting adjusted net income (loss) - increase / (decrease) (100) (285)Adjusted net income (loss) excluding out of period adjustments $(3,461) $4,676 NM
(10) Includes a loss of $205 million, a loss of $89 million and a loss of $281 million, net of tax, in the three months ended March 31, 2008 and 2007 and December 31, 2007, respectively, attributable to FAS 133.
(11) Adjusted net income (loss) excludes net realized capital gains (losses) and Capital Markets other-than-temporary impairments and FAS 133, net of tax.
(12) The calculation of the effective tax rates is as follows:
(13) Return on equity is annualized net income (loss), expressed as a percentage of average shareholders' equity. Return on equity, as adjusted, is
annualized adjusted net income (loss) expressed as a percentage of average shareholders’ equity, adjusted to exclude the effects of FAS 133 of $877 million and accumulated other comprehensive income of $1.69 billion.
Three Months Ended
March 31, 2008 Return on equity, GAAP basis (35.6)% Adjustments related to: FAS 133 and net realized capital gains (losses) 19.5% Accumulated other comprehensive income (0.3)% Return on equity, as adjusted (16.4)%
Three Months Ended March 31, 2008
Pre-taxIncome
Tax Net Effective(dollars in millions) Loss Benefits Loss Tax RateLoss before income tax benefits and minority interest $(11,264) $(3,537) $(7,727) 31.4%Minority interest (97) (19) (78)Net loss (11,361) (3,556) (7,805) 31.3%Net realized capital gains (losses) (6,086) (2,123) (3,963)FAS 133 gains (losses) (432) (151) (281)Adjusted net loss $(4,843) $(1,282) $(3,561) 26.5%
3

American International Group, Inc. Revenues and Income Graphs
Three Months Ended March 31, 2008
Revenues
Income Before Income Taxes and Minority Interest
Foreign Life Insurance & Retirement
Services29.9%
Domestic Life Insurance & Retirement
Services14.2%
Foreign General Insurance
12.5%
Domestic General Insurance
29.8%
Asset Management
4.2%Financial Services
9.4%
Domestic General Insurance
16.3%
Asset Management3.2%
Financial Services11.5%
Foreign Life Insurance &
Retirement Services30.0%
Domestic Life Insurance &
Retirement Services22.2%
Foreign General Insurance
16.8%
Note: The effects of net realized capital gains (losses), unrealized market valuation losses, FAS 133, other and consolidation and elimination adjustments are excluded.
Excludes Unrealized Market Valuation Losses of $9.11 billion. See Page 56.
Excludes Unrealized Market Valuation Losses of $9.11 billion. See Page 56.
4

American International Group, Inc.Summary of FAS 133 Effect (1)
(in millions)
Three Months EndedMarch 31, March 31, Dec. 31,
2008 2007 2007
$ (76) $ (85) $ 396
46 1 (206)
(402) (102) (134)
- (23) -
- (106) -
(402) (231) (134)
Total pre-tax effect (432) (315) 56
Total after-tax effect (281) (205) 37
(128) (75) (42)
(444) (71) (457)
(22) (3) (7)
90 (123) (14)
(178) (95) (96)
Eliminations and Reclassifications (5) 366 230 185
Total pre-tax effect (316) (137) (431)
Total after-tax effect (205) (89) (281)
Total pre-tax effect (748) (452) (375)
Total after tax-effect $ (486) $ (294) $ (244)
(See Accompanying Notes on Page 6)
Financial Services (2)
Other
Asset Management
FAS 133 effect on net realized capital gains (losses):
FAS 133 effect on total income:
General Insurance
Life Insurance & Retirement Services
Financial Services (4)
FAS 133 effect on operating income (loss) before net realized capital gains (losses):
Intercompany Eliminations (3)
Foreign Exchange Rates on Economically Hedged Debt Exposures:
Financial Services
Asset Management
Other
Total Foreign Exchange Rates on Economically Hedged Debt Exposures (3)
5

American International Group, Inc. Summary of FAS 133 Effect
Notes
(1) This schedule summarizes the effect of derivative gains and losses on operating income that are effective economic
hedges of investments and borrowings that did not qualify for hedge accounting treatment under FAS 133. In cases where hedge accounting has not been applied to these derivative transactions during the periods presented, an offsetting gain or loss on the hedged exposure has not been recognized in operating income. The mismatch in the earnings recognition on the derivatives and the hedged exposures has resulted in increased volatility in the operating results that does not reflect properly the effectiveness of these hedging activities.
(2) The net loss in the three months ended March 31, 2007 include a $166 million reduction in the fair value of certain derivatives that are an integral part of, and economically hedge, the structured transactions potentially affected by the proposed guidance by the U.S. Treasury Department affecting the ability to claim foreign tax credits. The three months ended December 31, 2007 include out of period charges of $51 million.
(3) Represents the elimination of revenues reported in the Financial Services segment from intercompany hedging activities and the reclassification of the related foreign exchange rates on economically hedged exposures.
(4) In the second quarter of 2007, AGF and ILFC began applying hedge accounting to most of their derivatives hedging interest rate and foreign exchange risks associated with their floating rate and foreign currency denominated borrowings.
(5) Represents the elimination of net realized capital gains (losses) from intercompany hedging activities and the reclassification of the related foreign exchange rates on economically hedged exposures.
6
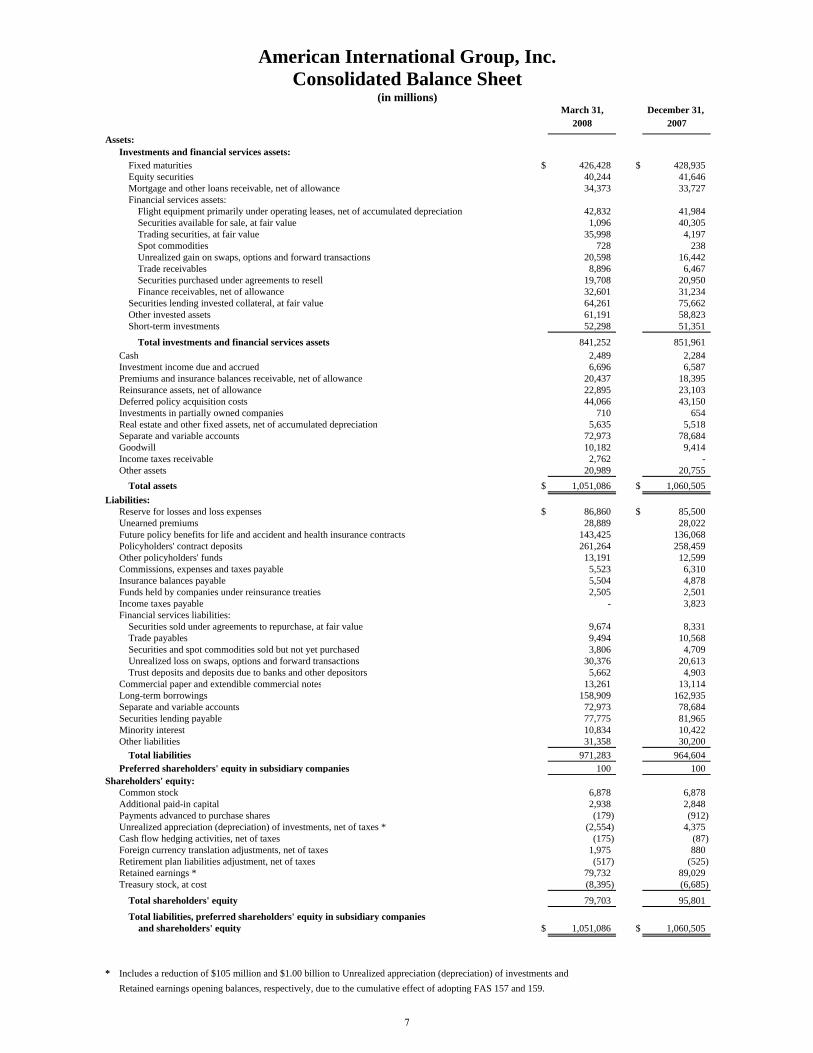
American International Group, Inc.Consolidated Balance Sheet
(in millions)March 31, December 31,
2008 2007
Assets:Investments and financial services assets:
Fixed maturities $ 426,428 $ 428,935 Equity securities 40,244 41,646 Mortgage and other loans receivable, net of allowance 34,373 33,727 Financial services assets:
Flight equipment primarily under operating leases, net of accumulated depreciation 42,832 41,984 Securities available for sale, at fair value 1,096 40,305 Trading securities, at fair value 35,998 4,197 Spot commodities 728 238 Unrealized gain on swaps, options and forward transactions 20,598 16,442 Trade receivables 8,896 6,467 Securities purchased under agreements to resell 19,708 20,950 Finance receivables, net of allowance 32,601 31,234
Securities lending invested collateral, at fair value 64,261 75,662 Other invested assets 61,191 58,823 Short-term investments 52,298 51,351
Total investments and financial services assets 841,252 851,961 2,489 2,284
Investment income due and accrued 6,696 6,587 Premiums and insurance balances receivable, net of allowance 20,437 18,395 Reinsurance assets, net of allowance 22,895 23,103 Deferred policy acquisition costs 44,066 43,150 Investments in partially owned companies 710 654 Real estate and other fixed assets, net of accumulated depreciation 5,635 5,518 Separate and variable accounts 72,973 78,684 Goodwill 10,182 9,414 Income taxes receivable 2,762 - Other assets 20,989 20,755
Total assets $ 1,051,086 $ 1,060,505 Liabilities:
Reserve for losses and loss expenses $ 86,860 $ 85,500 Unearned premiums 28,889 28,022 Future policy benefits for life and accident and health insurance contracts 143,425 136,068 Policyholders' contract deposits 261,264 258,459 Other policyholders' funds 13,191 12,599 Commissions, expenses and taxes payable 5,523 6,310 Insurance balances payable 5,504 4,878 Funds held by companies under reinsurance treaties 2,505 2,501 Income taxes payable - 3,823 Financial services liabilities:
Securities sold under agreements to repurchase, at fair value 9,674 8,331 Trade payables 9,494 10,568 Securities and spot commodities sold but not yet purchased 3,806 4,709 Unrealized loss on swaps, options and forward transactions 30,376 20,613 Trust deposits and deposits due to banks and other depositors 5,662 4,903
Commercial paper and extendible commercial notes 13,261 13,114 Long-term borrowings 158,909 162,935 Separate and variable accounts 72,973 78,684 Securities lending payable 77,775 81,965 Minority interest 10,834 10,422 Other liabilities 31,358 30,200
Total liabilities 971,283 964,604 Preferred shareholders' equity in subsidiary companies 100 100
Shareholders' equity:Common stock 360 6,878 6,878 Additional paid-in capital 365 2,938 2,848 Payments advanced to purchase shares 365 (179) (912) Unrealized appreciation (depreciation) of investments, net of taxes * 370 (2,554) 4,375 Cash flow hedging activities, net of taxes 376 (175) (87) Foreign currency translation adjustments, net of taxes 375 1,975 880 Retirement plan liabilities adjustment, net of taxes 378 (517) (525) Retained earnings * 380 79,732 89,029 Treasury stock, at cost 385 (8,395) (6,685)
Total shareholders' equity 390 79,703 95,801
Total liabilities, preferred shareholders' equity in subsidiary companies and shareholders' equity $ 1,051,086 $ 1,060,505
* Includes a reduction of $105 million and $1.00 billion to Unrealized appreciation (depreciation) of investments and Retained earnings opening balances, respectively, due to the cumulative effect of adopting FAS 157 and 159.
Cash
7

Shareholders'Book Value EquityPer Share Shareholders' excluding
Book Value excluding Equity URA (1)Per Share URA (1) (in millions) (in millions)
December 31, 2000 $ 17.25 $ 17.28 $ 45,239 $ 45,320December 31, 2001 19.07 18.27 49,881 47,790December 31, 2002 22.34 19.99 58,303 52,154
March 31, 2003 23.56 20.61 61,462 53,750June 30, 2003 25.98 21.44 67,774 55,933September 30, 2003 25.54 22.17 66,612 57,807December 31, 2003 26.54 23.06 69,230 60,159
March 31, 2004 28.73 24.05 74,921 62,739June 30, 2004 27.08 25.07 70,544 65,304September 30, 2004 29.34 26.01 76,427 67,747December 31, 2004 30.69 26.71 79,673 69,347
March 31, 2005 31.45 27.96 81,608 72,561June 30, 2005 34.15 29.48 88,613 76,509September 30, 2005 34.03 29.95 88,333 77,729December 31, 2005 33.24 30.03 86,317 77,969
March 31, 2006 34.03 31.39 88,390 81,541June 30, 2006 33.76 32.66 87,709 84,851September 30, 2006 36.99 34.11 96,154 88,658December 31, 2006 39.09 35.21 101,677 91,594
March 31, 2007 39.64 35.43 103,055 92,121June 30, 2007 40.44 36.81 104,330 94,959September 30, 2007 40.81 38.10 104,067 97,148December 31, 2007 37.87 36.14 95,801 91,426
March 31, 2008 (2) $ 31.93 (3) $ 32.96 $ 79,703 $ 82,257
Note: (1) Unrealized appreciation of investments (URA), net of taxes.(2) Includes a reduction of $1.11 billion to opening shareholders' equity due to the cumulative
effect of adopting FAS 157 and 159.
(3) Total shareholders' equityTotal common shares issued - treasury shares
= $31.93
American International Group, Inc.Book Value per Share
$79,703,226,602
2,751,327,476 - 255,499,218
8

American International Group, Inc.General Insurance Operating Statistics
(dollars in millions)
March 31, March 31, Dec. 31, Sequential2008 2007 % Chg 2007 % Chg
Gross premiums written $ 16,038 $ 16,012 0.2 % $ 13,044 23.0 %
Ceded premiums written 3,958 3,906 1.3 2,045 93.5
Net premiums written 12,080 12,106 (0.2) 10,999 9.8
Net premiums earned 11,357 11,219 1.2 11,667 (2.7)
Paid losses 6,737 5,661 19.0 6,618 1.8Change in net loss reserves 1,331 1,501 (11.3) 2,031 (34.5)Less foreign exchange effect 70 (38) NM 517 (86.5)
Losses and loss expenses incurred (1) (2) 7,998 7,200 11.1 8,132 (1.6),Statutory underwriting expenses 3,193 2,826 13.0 2,962 7.8
Statutory underwriting profit 166 1,193 (86.1) 573 (71.0)
Change in deferred acquisition costs 239 219 9.1 (10) NM
Underwriting profit 405 1,412 (71.3) 563 (28.1)
Net investment income (3)
Interest and dividends 1,266 1,157 9.4 1,274 (0.6)Partnership income 66 375 (82.4) 307 (78.5)Mutual funds (92) 123 NM 41 NMOther investment income (4) 74 67 10.4 75 (1.3)Investment expense (109) (159) (31.4) (150) (27.3)
Total 1,205 1,563 (22.9) 1,547 (22.1)
Operating income before net realized capital gains (losses) 1,610 2,975 (45.9) 2,110 (23.7)
Net realized capital gains (losses) (3) (273) 121 NM (95) NM
Operating income $ 1,337 $ 3,096 (56.8) % $ 2,015 (33.6) %
Net loss and loss expense reserve (at period end) $ 70,836 $ 64,131 10.5 % $ 69,505 1.9 %
Underwriting ratios:Loss ratio 70.43 64.18 69.70Expense ratio 26.43 23.34 26.93Combined ratio 96.86 87.52 96.63Combined ratio excluding significant
current year catastrophe-related losses 96.13 87.52 95.12
Foreign exchange effect on worldwide growth:Net premiums written
Growth in original currency (5) (3.3) %Foreign exchange effect 3.1Growth as reported in U.S. $ (0.2) %
(See Accompanying Notes on Page 19)
Three Months Ended
9
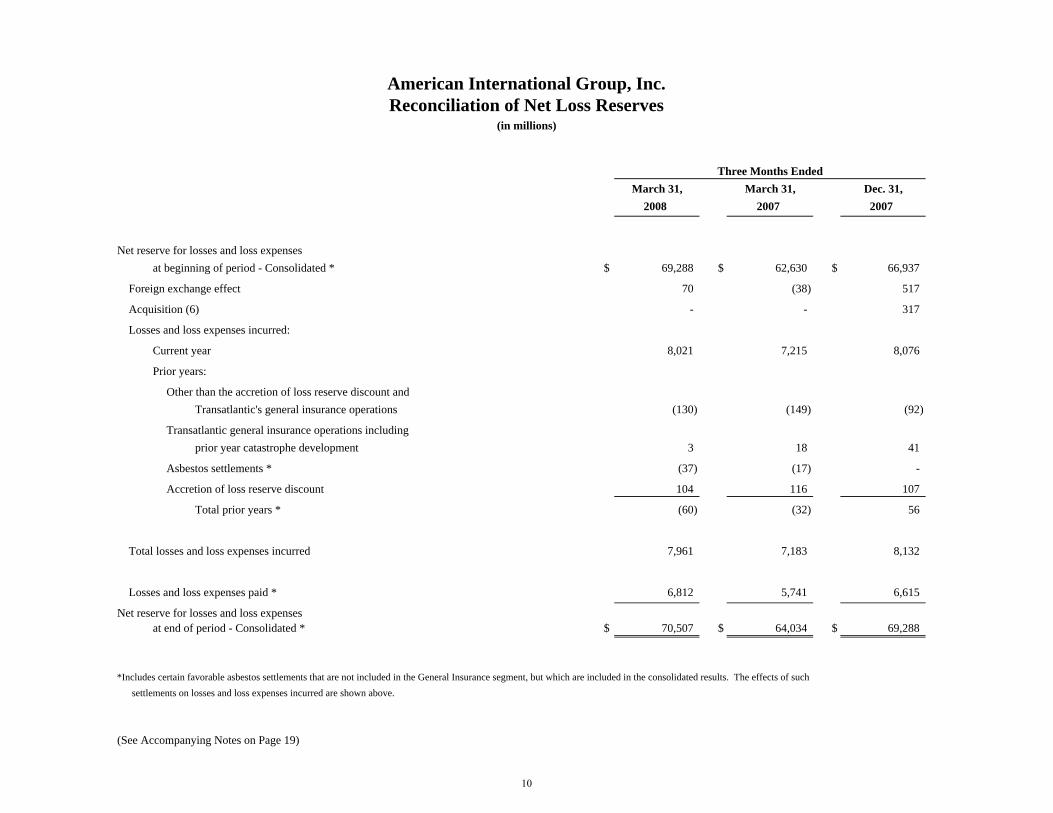
March 31, March 31, Dec. 31,2008 2007 2007
Net reserve for losses and loss expenses at beginning of period - Consolidated * $ 69,288 $ 62,630 $ 66,937
Foreign exchange effect 70 (38) 517
Acquisition (6) - - 317
Losses and loss expenses incurred:
Current year 8,021 7,215 8,076
Prior years:
Other than the accretion of loss reserve discount andTransatlantic's general insurance operations (130) (149) (92)
Transatlantic general insurance operations includingprior year catastrophe development 3 18 41
Asbestos settlements * (37) (17) -
Accretion of loss reserve discount 104 116 107
Total prior years * (60) (32) 56
Total losses and loss expenses incurred 7,961 7,183 8,132
Losses and loss expenses paid * 6,812 5,741 6,615
Net reserve for losses and loss expenses at end of period - Consolidated * $ 70,507 $ 64,034 $ 69,288
*Includes certain favorable asbestos settlements that are not included in the General Insurance segment, but which are included in the consolidated results. The effects of such settlements on losses and loss expenses incurred are shown above.
(See Accompanying Notes on Page 19)
(in millions)
Three Months Ended
American International Group, Inc.Reconciliation of Net Loss Reserves
10

American International Group, Inc.AIG Commercial Insurance Operating Statistics
(dollars in millions)
Three Months EndedMarch 31, March 31, Dec. 31, Sequential
2008 2007 % Chg 2007 % Chg
Net premiums written $ 5,113 $ 6,009 (14.9) % $ 5,652 (9.5) %
Net premiums earned 5,417 5,981 (9.4) 5,930 (8.7)
Losses and loss expenses incurred (1) (2) 3,975 4,041 (1.6) 4,207 (5.5)
Statutory underwriting expenses 1,224 1,156 5.9 1,063 15.1
Statutory underwriting profit 218 784 (72.2) 660 (67.0)
Change in deferred acquisition costs (3) 35 NM (9) NM
Underwriting profit 215 819 (73.7) 651 (67.0)
Net investment income
Interest and dividends 775 715 8.4 785 (1.3)Partnership income 38 337 (88.7) 269 (85.9)Mutual funds (39) 71 NM 1 NMOther investment income (4) 46 43 7.0 42 9.5Investment expense (77) (133) (42.1) (89) (13.5)
Total 743 1,033 (28.1) 1,008 (26.3)
Operating income before net realized capital gains (losses) 958 1,852 (48.3) 1,659 (42.3)
Net realized capital gains (losses) (173) 77 NM (16) NM
Operating income $ 785 $ 1,929 (59.3) % $ 1,643 (52.2) %
Underwriting ratios:
Loss ratio 73.38 67.59 70.93Expense ratio 23.94 19.22 18.79Combined ratio 97.32 86.81 89.72Combined ratio excluding significant
current year catastrophe-related losses 95.78 86.81 88.01
(See Accompanying Notes on Page 19)
11
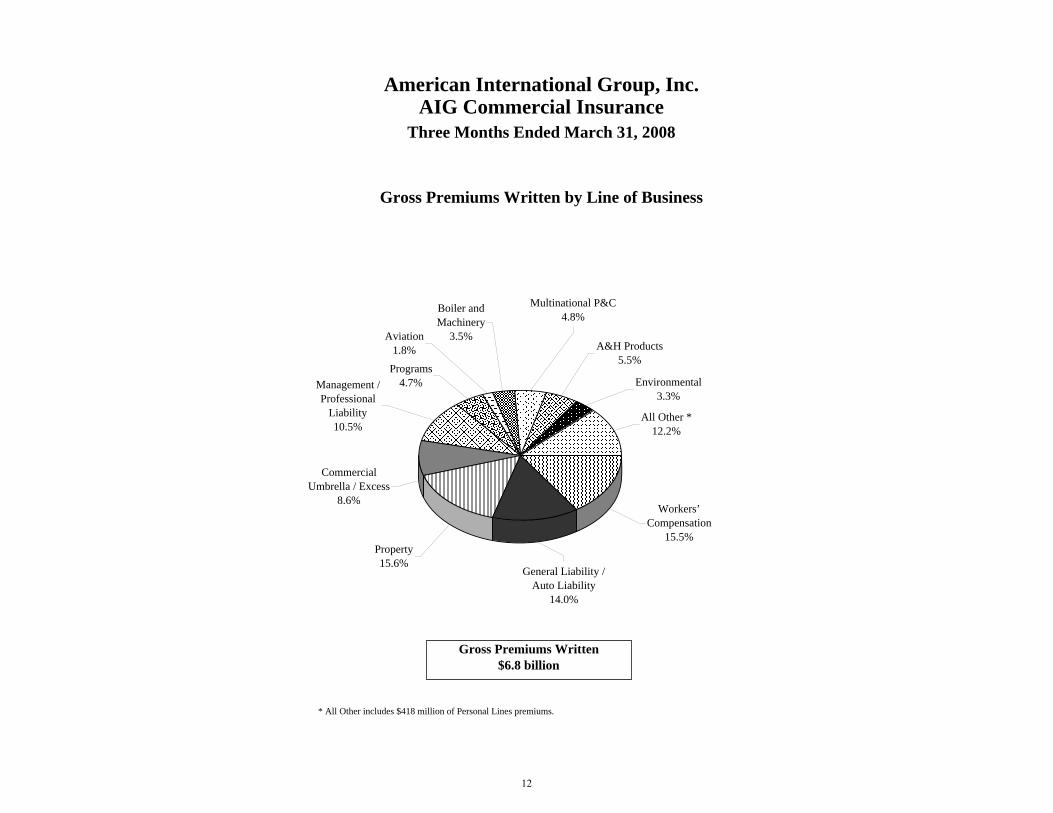
American International Group, Inc.AIG Commercial Insurance
Three Months Ended March 31, 2008
Gross Premiums Written by Line of Business
* All Other includes $418 million of Personal Lines premiums.
Gross Premiums Written $6.8 billion
Property15.6%
General Liability / Auto Liability
14.0%
Aviation1.8%
Boiler and Machinery
3.5%A&H Products
5.5%
Environmental3.3%
Multinational P&C4.8%
Programs4.7%
Commercial Umbrella / Excess
8.6%
Management / Professional
Liability10.5%
All Other *12.2%
Workers’ Compensation
15.5%
12
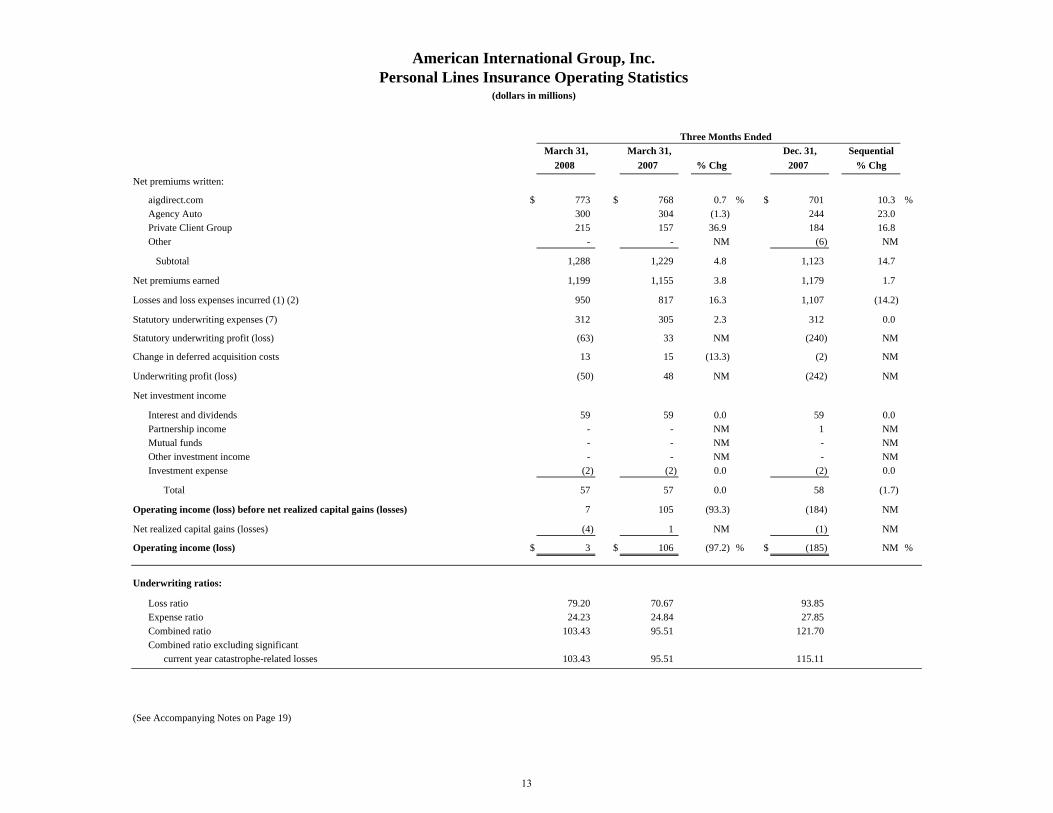
American International Group, Inc.Personal Lines Insurance Operating Statistics
(dollars in millions)
Three Months EndedMarch 31, March 31, Dec. 31, Sequential
2008 2007 % Chg 2007 % ChgNet premiums written:
aigdirect.com $ 773 $ 768 0.7 % $ 701 10.3 %Agency Auto 300 304 (1.3) 244 23.0Private Client Group 215 157 36.9 184 16.8Other - - NM (6) NM
Subtotal 1,288 1,229 4.8 1,123 14.7
Net premiums earned 1,199 1,155 3.8 1,179 1.7
Losses and loss expenses incurred (1) (2) 950 817 16.3 1,107 (14.2)
Statutory underwriting expenses (7) 312 305 2.3 312 0.0
Statutory underwriting profit (loss) (63) 33 NM (240) NM
Change in deferred acquisition costs 13 15 (13.3) (2) NM
Underwriting profit (loss) (50) 48 NM (242) NM
Net investment income
Interest and dividends 59 59 0.0 59 0.0Partnership income - - NM 1 NMMutual funds - - NM - NMOther investment income - - NM - NMInvestment expense (2) (2) 0.0 (2) 0.0
Total 57 57 0.0 58 (1.7)
Operating income (loss) before net realized capital gains (losses) 7 105 (93.3) (184) NM
Net realized capital gains (losses) (4) 1 NM (1) NM
Operating income (loss) $ 3 $ 106 (97.2) % $ (185) NM %
Underwriting ratios:
Loss ratio 79.20 70.67 93.85Expense ratio 24.23 24.84 27.85Combined ratio 103.43 95.51 121.70Combined ratio excluding significant
current year catastrophe-related losses 103.43 95.51 115.11
(See Accompanying Notes on Page 19)
13
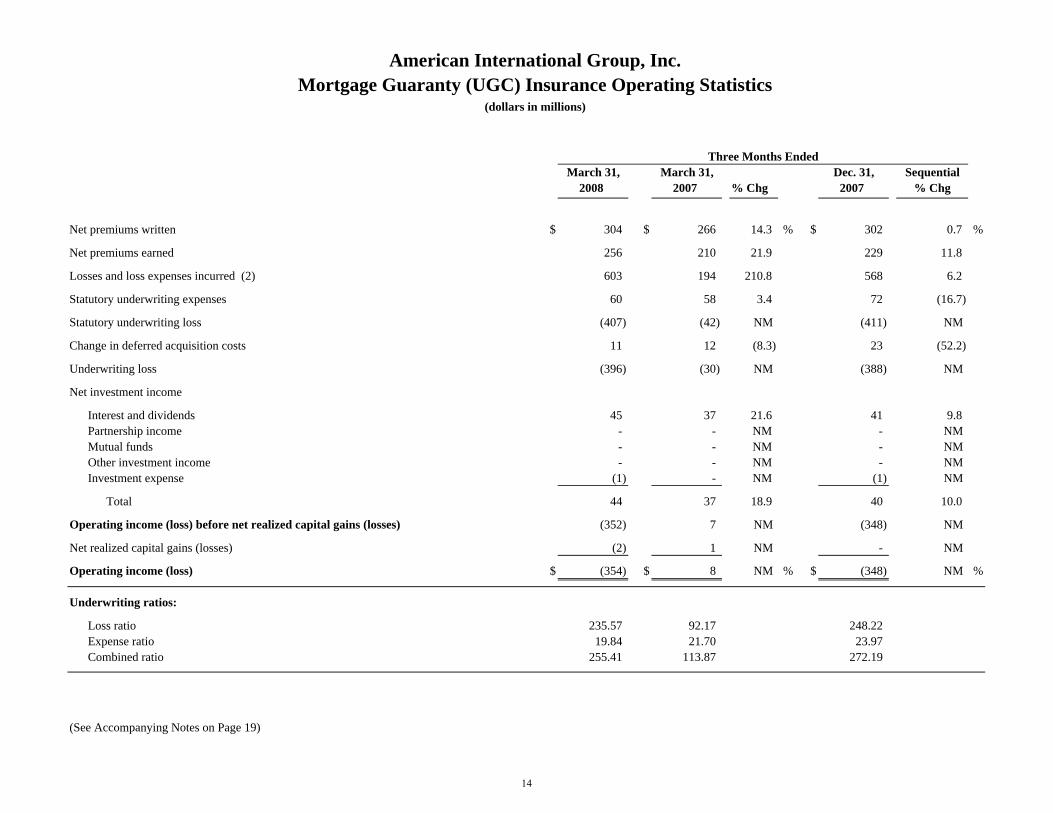
American International Group, Inc.Mortgage Guaranty (UGC) Insurance Operating Statistics
(dollars in millions)
Three Months EndedMarch 31, March 31, Dec. 31, Sequential
2008 2007 % Chg 2007 % Chg
Net premiums written $ 304 $ 266 14.3 % $ 302 0.7 %
Net premiums earned 256 210 21.9 229 11.8
Losses and loss expenses incurred (2) 603 194 210.8 568 6.2
Statutory underwriting expenses 60 58 3.4 72 (16.7)
Statutory underwriting loss (407) (42) NM (411) NM
Change in deferred acquisition costs 11 12 (8.3) 23 (52.2)
Underwriting loss (396) (30) NM (388) NM
Net investment income
Interest and dividends 45 37 21.6 41 9.8Partnership income - - NM - NM Mutual funds - - NM - NM Other investment income - - NM - NM Investment expense (1) - NM (1) NM
Total 44 37 18.9 40 10.0
Operating income (loss) before net realized capital gains (losses) (352) 7 NM (348) NM
Net realized capital gains (losses) (2) 1 NM - NM
Operating income (loss) $ (354) $ 8 NM % $ (348) NM %
Underwriting ratios:
Loss ratio 235.57 92.17 248.22Expense ratio 19.84 21.70 23.97Combined ratio 255.41 113.87 272.19
(See Accompanying Notes on Page 19)
14
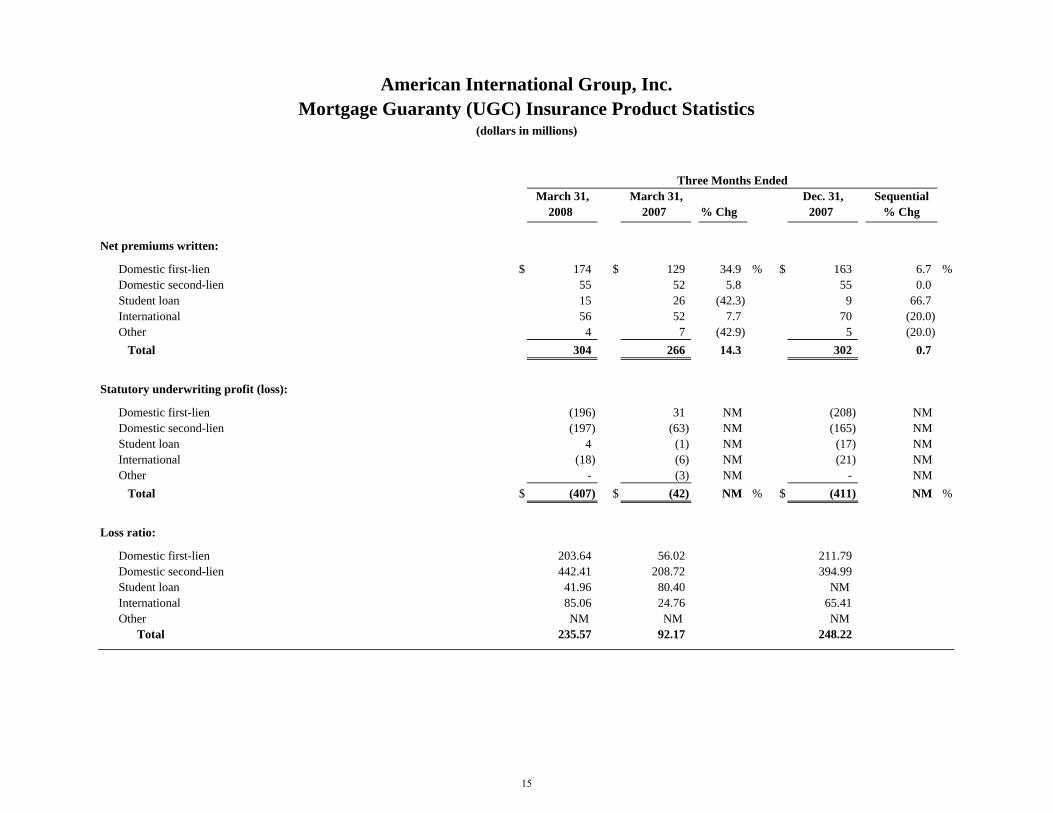
American International Group, Inc.Mortgage Guaranty (UGC) Insurance Product Statistics
(dollars in millions)
Three Months EndedMarch 31, March 31, Dec. 31, Sequential
2008 2007 % Chg 2007 % Chg
Net premiums written:
Domestic first-lien $ 174 $ 129 34.9 % $ 163 6.7 %Domestic second-lien 55 52 5.8 55 0.0Student loan 15 26 (42.3) 9 66.7International 56 52 7.7 70 (20.0)Other 4 7 (42.9) 5 (20.0) Total 304 266 14.3 302 0.7
Statutory underwriting profit (loss):
Domestic first-lien (196) 31 NM (208) NM Domestic second-lien (197) (63) NM (165) NM Student loan 4 (1) NM (17) NM International (18) (6) NM (21) NM Other - (3) NM - NM Total $ (407) $ (42) NM % $ (411) NM %
Loss ratio:
Domestic first-lien 203.64 56.02 211.79Domestic second-lien 442.41 208.72 394.99Student loan 41.96 80.40 NMInternational 85.06 24.76 65.41Other NM NM NM
Total 235.57 92.17 248.22
15

American International Group, Inc.Transatlantic Holdings, Inc. Insurance Operating Statistics
(dollars in millions)
Three Months Ended
March 31, March 31, Dec. 31, Sequential2008 2007 % Chg 2007 % Chg
Net premiums written: Domestic $ 548 $ 516 6.2 % $ 466 17.6 %International 488 468 4.3 535 (8.8)
Subtotal 1,036 984 5.3 1,001 3.5
Net premiums earned 1,017 965 5.4 1,030 (1.3)
Losses and loss expenses incurred (2) (8) 675 676 (0.1) 690 (2.2)
Statutory underwriting expenses 288 273 5.5 281 2.5
Statutory underwriting profit 54 16 237.5 59 (8.5)
Change in deferred acquisition costs 6 4 50.0 (5) NM
Underwriting profit 60 20 200.0 54 11.1
Net investment income
Interest and dividends 116 105 10.5 113 2.7Partnership income 1 8 (87.5) 7 (85.7)Mutual funds - - NM - NMOther investment income (4) 2 5 (60.0) 4 (50.0)Investment expense (2) (2) 0.0 (2) 0.0
Total 117 116 0.9 122 (4.1)
Operating income before net realized capital gains (losses) 177 136 30.1 176 0.6
Net realized capital gains (losses) (15) 15 NM (23) NM
Operating income $ 162 $ 151 7.3 % $ 153 5.9 %
Underwriting ratios:
Loss ratio 66.40 70.01 67.05Expense ratio 27.82 27.79 28.08Combined ratio 94.22 97.80 95.13Combined ratio excluding significant
current year catastrophe-related losses 94.22 97.80 95.12
Foreign exchange effect on Transatlantic's growth:
Net premiums writtenGrowth in original currency (5) 1.4 %Foreign exchange effect 3.9Growth as reported in U.S. $ 5.3 %
(See Accompanying Notes on Page 19)
16

American International Group, Inc.Foreign General Insurance Operating Statistics
(dollars in millions)
Three Months EndedMarch 31, March 31, Dec. 31, Sequential
2008 2007 % Chg 2007 % Chg
Net premiums written $ 4,339 $ 3,618 19.9 % $ 2,921 48.5 %
Net premiums earned 3,468 2,908 19.3 3,299 5.1
Losses and loss expenses incurred (2) (8) 1,795 1,472 21.9 1,560 15.1
Statutory underwriting expenses (9) 1,309 1,034 26.6 1,234 6.1
Statutory underwriting profit 364 402 (9.5) 505 (27.9)
Change in deferred acquisition costs 212 153 38.6 (17) NM
Underwriting profit 576 555 3.8 488 18.0
Net investment income
Interest and dividends 269 240 12.1 274 (1.8)Partnership income 27 30 (10.0) 30 (10.0)Mutual funds (53) 52 NM 40 NMOther investment income (4) 26 19 36.8 29 (10.3)Investment expense (27) (22) 22.7 (56) (51.8)
Total 242 319 (24.1) 317 (23.7)
Operating income before net realized capital gains (losses) 818 874 (6.4) 805 1.6
Net realized capital gains (losses) (82) 35 NM (51) NM
Operating income (10) $ 736 $ 909 (19.0) % $ 754 (2.4) %
Underwriting ratios:Loss ratio 51.78 50.64 47.31Expense ratio 30.16 28.58 42.25Combined ratio 81.94 79.22 89.56
Foreign exchange effect on Foreign General's growth:Net premiums written
Growth in original currency (5) 10.5 %Foreign exchange effect 9.4Growth as reported in U.S. $ 19.9 %
(See Accompanying Notes on Page 19)
17

Gross Premiums Written by Division
American International Group, Inc.Foreign General Insurance Gross Premiums Written
Three Months Ended March 31, 2008
Gross Premiums Written by Region
Property6.4%
Casualty13.2%Specialty Lines
15.3%
Lloyd's4.4%
Accident & Health14.7%
Personal Lines12.1%
Other / Service Business
8.6% Aviation2.8%
Marine and Energy22.5%
Africa / Middle East /
Mediterranean / South Asia
2.9%Asia /
Australasia 7.2%
Europe31.4%
Far East12.1%
Americas14.3%
U.K. / Ireland32.1%
Gross Premiums Written $7.3 billion
18

(1) Includes significant current year catastrophe-related losses and net reinstatement premiums as follows:
Three Months Ended (in millions) March 31, 2008 March 31, 2007 Dec. 31, 2007 AIG Commercial Insurance $83 $- $100 Personal Lines - - 75 General Insurance $83 $- $175
(2) The following table summarize development, (favorable) or unfavorable, of incurred losses and loss expenses for prior years (other than accretion of
discount):
Three Months Ended (in millions) March 31, 2008 March 31, 2007 Dec. 31, 2007 AIG Commercial Insurance $(217) $(87) $75 Personal Lines 36 (29) 36 Mortgage Guaranty 68 31 (25)Foreign General (17) (64) (178)Subtotal (130) (149) (92)Transatlantic 3 18 41 Asbestos settlement (37) (17) - Total $(164) $(148) $(51)
(3) Total may not equal the sum of the individual group totals due to consolidating eliminations. (4) Other investment income is comprised principally of real estate income, changes in market value associated with trading portfolios and income from
securities lending. (5) Computed using a constant exchange rate for each period. (6) Reflects the opening balances with respect to the acquisition of WüBA in fourth quarter 2007. (7) Includes $6 million, $1 million and $31 million of transaction and integration costs in the three months ended March 31, 2008 and 2007 and December
31, 2007, respectively, associated with the 21st Century acquisition. Statutory underwriting expenses include the results of wholly owned Personal Lines agencies and the amortization of advertising costs.
(8) Includes severe but non-catastrophic losses of $36 million in the three months ended March 31, 2007 for Transatlantic and $61 million, $25 million and $47 million in the three months ended March 31, 2008 and 2007 and December 31, 2007, respectively, for Foreign General.
(9) Statutory underwriting expenses include the results of wholly owned Foreign General agencies and the amortization of advertising costs. (10) Income statement accounts expressed in non-functional currencies are translated into U.S. dollars using average exchange rates.
American International Group, Inc. General Insurance
Notes
19

American International Group, Inc.Life Insurance & Retirement Services Operating Statistics
(dollars in millions)
Three Months EndedMarch 31, March 31, Dec. 31,
2008 2007 2007Premiums, deposits and other considerations $ 26,093 $ 21,374 22.1 % $ 25,132 3.8 %Revenues:
Premiums and other considerations $ 9,318 $ 8,425 10.6 % $ 8,732 6.7 %Net investment income
Interest and dividends 4,648 4,543 2.3 4,386 6.0Partnership income excluding synfuels 44 205 (78.5) 235 (81.3)Partnership loss - synfuels (4) (33) NM - NMUnit investment trusts (101) 37 NM 333 NMOther 146 70 108.6 150 (2.7)Investment expenses (145) (106) 36.8 (108) 34.3
Net investment income before policyholder investment income and trading gains (losses) 4,588 4,716 (2.7) 4,996 (8.2)Net investment income related to policyholder investment income and trading gains (losses) (785) 797 NM 877 NM
Total net investment income 3,803 5,513 (31.0) 5,873 (35.2)
Total revenues excluding net realized capital gains (losses) and policyholder investment income and trading gains (losses) 13,906 13,141 5.8 13,728 1.3
Total revenues excluding net realized capital gains (losses) 13,121 13,938 (5.9) 14,605 (10.2)
Benefits and expenses:Incurred policy losses and benefits before the effect of incurred policy losses and benefits
related to policyholder investment income and trading gains (losses) 8,710 8,163 6.7 9,154 (4.9)Incurred policy losses and benefits related to policyholder investment income and trading gains (losses) (785) 797 NM 877 NM
Incurred policy losses and benefits 7,925 8,960 (11.6) 10,031 (21.0)Insurance acquisition and other operating expenses 2,658 2,441 8.9 1,916 38.7
Total benefits and expenses 10,583 11,401 (7.2) 11,947 (11.4)
Operating income excluding net realized capital gains (losses) 2,538 2,537 0.0 2,658 (4.5)Net realized capital gains (losses) (4,369) (256) NM (1,372) NMOperating income (loss) $ (1,831) $ 2,281 NM % $ 1,286 NM %
Foreign exchange effect on worldwide growth:Premiums, deposits and other considerations
Growth in original currency* 19.0 %Foreign exchange effect 3.1 Growth as reported in U.S. $ 22.1
Premiums and other considerations Growth in original currency* 6.0 Foreign exchange effect 4.6 Growth as reported in U.S. $ 10.6 %
Gross life insurance in force (at period end) $ 2,410,145 $ 2,082,547 15.7 % $ 2,312,045 4.2 %
*
Sequential% Chg% Chg
Computed using a constant exchange rate for each period.
20

American International Group, Inc.Domestic Life Insurance & Retirement Services Operating Statistics
(dollars in millions)
Three Months EndedMarch 31, March 31, Dec. 31,
2008 2007 2007Premiums, deposits and other considerations $ 7,561 $ 6,124 23.5 % $ 6,129 23.4 %Revenues:
Premiums and other considerations $ 1,871 $ 1,812 3.3 % $ 1,752 6.8 %Net investment income:
Interest and dividends 2,340 2,534 (7.7) 2,414 (3.1)Partnership income excluding synfuels 42 157 (73.2) 193 (78.2)Partnership loss - synfuels (4) (33) NM - NMUnit investment trusts (2) 2 NM 1 NMOther 34 2 NM 67 (49.3)Investment expenses (32) (32) 0.0 (35) (8.6)
Net investment income before policyholder investment income and trading gains (losses) 2,378 2,630 (9.6) 2,640 (9.9)Net investment income related to policyholder investment income and trading gains (losses) (23) - NM (5) NM
Total net investment income 2,355 2,630 (10.5) 2,635 (10.6)
Total revenues excluding net realized capital gains (losses) and policyholder investment income and trading gains (losses) 4,249 4,442 (4.3) 4,392 (3.3)
Total revenues excluding net realized capital gains (losses) 4,226 4,442 (4.9) 4,387 (3.7)
Benefits and expenses:Incurred policy losses and benefits before the effect of incurred policy losses and benefits
related to policyholder investment income and trading gains (losses) 2,591 2,583 0.3 2,511 3.2Incurred policy losses and benefits related to policyholder investment income and trading gains (losses) (23) - NM (5) NMIncurred policy losses and benefits 2,568 2,583 (0.6) 2,506 2.5Insurance acquisition and other operating expenses 577 841 (31.4) 854 (32.4)
Total benefits and expenses 3,145 3,424 (8.1) 3,360 (6.4)
Operating income before net realized capital gains (losses) 1,081 1,018 6.2 1,027 5.3Net realized capital gains (losses) (3,647) (21) NM (1,264) NMOperating income (loss) $ (2,566) $ 997 NM % $ (237) NM %
Gross life insurance in force (at period end) $ 998,771 $ 924,440 8.0 % $ 984,794 1.4 %
% ChgSequential
% Chg
21

American International Group, Inc.Domestic Life Insurance Product Statistics
(dollars in millions)
Three Months EndedMarch 31, March 31, Dec. 31,
2008 2007 2007
Premiums, deposits and other considerations (1):Life insurance $ 799 $ 757 5.5 % $ 848 (5.8) %Home service 233 228 2.2 246 (5.3)Group life/health 208 231 (10.0) 209 (0.5)Payout annuities 799 685 16.6 616 29.7Individual fixed and runoff annuities 84 87 (3.4) 69 21.7
Total premiums, deposits and other considerations 2,123 1,988 6.8 1,988 6.8
Premiums and other considerations:Life insurance 589 578 1.9 585 0.7Home service 188 195 (3.6) 191 (1.6)Group life/health 204 229 (10.9) 205 (0.5)Payout annuities (2) 594 512 16.0 450 32.0Individual fixed and runoff annuities 12 14 (14.3) 13 (7.7)
Total premiums and other considerations 1,587 1,528 3.9 1,444 9.9
Net investment income (3):Life insurance 396 372 6.5 384 3.1Home service 153 161 (5.0) 161 (5.0)Group life/health 47 53 (11.3) 48 (2.1)Payout annuities 303 289 4.8 301 0.7Individual fixed and runoff annuities 108 130 (16.9) 110 (1.8)
Net investment income before policyholder investment income and trading gains (losses) 1,007 1,005 0.2 1,004 0.3Net investment income related to policyholder investment income and trading gains (losses) (4) (23) - NM (5) NM
Total net investment income 984 1,005 (2.1) 999 (1.5)
Incurred policy losses and benefits excluding amortization ofsales inducement related to net realized capital gains (losses):Life insurance 559 550 1.6 590 (5.3)Home service 171 174 (1.7) 169 1.2Group life/health 151 178 (15.2) 138 9.4Payout annuities 809 720 12.4 685 18.1Individual fixed and runoff annuities 64 84 (23.8) 80 (20.0)
Total incurred policy losses and benefits excluding amortization of sales inducementsrelated to net realized capital gains (losses) before the effect of incurred policy lossesand benefits related to policyholder investment income and trading gains (losses) 1,754 1,706 2.8 1,662 5.5Incurred policy losses and benefits related to policyholder investment income and trading gains (losses) (4) (23) - NM (5) NM
Total incurred policy losses and benefits excluding amortizationof sales inducements related to net realized capital gains (losses) 1,731 1,706 1.5 1,657 4.5
Insurance acquisition and other operating expenses excluding amortization ofdeferred acquisition costs and VOBA related to net realized capital gains (losses):Life insurance 213 210 1.4 177 20.3Home service 95 99 (4.0) 110 (13.6)Group life/health 84 101 (16.8) 99 (15.2)Payout annuities 28 24 16.7 31 (9.7)Individual fixed and runoff annuities 22 37 (40.5) 26 (15.4)
Total insurance acquisition and other operating expenses excluding amortizationof deferred acquisition costs and VOBA related to net realized capital gains (losses) $ 442 $ 471 (6.2) % $ 443 (0.2) %
(See Accompanying Notes on Page 27)
Sequential% Chg% Chg
22

American International Group, Inc.Domestic Life Insurance Product Statistics (continued)
(dollars in millions)
Three Months EndedMarch 31, March 31, Dec. 31,
2008 2007 % Chg 2007
Operating income excluding net realized capital gains (losses) and relatedamortization of acquisition costs, VOBA and sales inducements:Life insurance $ 213 $ 190 12.1 % $ 202 5.4 %Home service 75 83 (9.6) 73 2.7Group life/health 16 3 433.3 16 0.0Payout annuities 60 57 5.3 35 71.4Individual fixed and runoff annuities 34 23 47.8 17 100.0
Total operating income excluding net realized capital gains (losses) andrelated amortization of acquisition costs, VOBA and sales inducements 398 356 11.8 343 16.0
Amortization (benefit) of deferred acquisition costs, VOBA and sales inducements related to net realized capital gains (losses):Life insurance (3) - NM (2) NM Home service (3) (1) NM (1) NM Group life/health - (1) NM - NM Payout annuities - - NM - NM Individual fixed and runoff annuities (14) 1 NM (2) NM
Total amortization (benefit) of deferred acquisition costs, VOBAand sales inducements related to net realized capital gains (losses) (20) (1) NM (5) NM
Operating income before net realized capital gains (losses):Life insurance 216 190 13.7 204 5.9Home service 78 84 (7.1) 74 5.4Group life/health 16 4 300.0 16 0.0Payout annuities 60 57 5.3 35 71.4Individual fixed and runoff annuities 48 22 118.2 19 152.6
Total operating income before net realized capital gains (losses) (5) 418 357 17.1 348 20.1
Net realized capital gains (losses):Life insurance (1,055) (3) NM (371) NM Home service (140) (2) NM (58) NM Group life/health (14) (1) NM (6) NM Payout annuities (22) (6) NM (16) NM Individual fixed and runoff annuities (57) - NM (29) NM
Total net realized capital gains (losses) (1,288) (12) NM (480) NM
Operating income (loss): Life insurance (839) 187 NM (167) NM Home service (62) 82 NM 16 NM Group life/health 2 3 (33.3) 10 (80.0)Payout annuities 38 51 (25.5) 19 100.0Individual fixed and runoff annuities (9) 22 NM (10) NM
Total operating income (loss) $ (870) $ 345 NM % $ (132) NM %
(See Accompanying Notes on Page 27)
% ChgSequential
23

American International Group, Inc.Domestic Life Insurance Other Data
(dollars in millions)
Three Months Ended / As ofMarch 31, March 31, Dec. 31,
2008 2007 2007
Life insurancePeriodic premium sales (6):
Individual/retail $ 110 $ 118 (6.8) % $ 143 (23.1) %Institutional markets 19 3 NM 4 375.0
Total periodic premium sales 129 121 6.6 147 (12.2)
Periodic premium sales by product:Universal life 47 51 (7.8) 80 (41.3)Variable universal life 27 13 107.7 11 145.5Term life 52 55 (5.5) 54 (3.7)Whole life/other 3 2 50.0 2 50.0
Total periodic premium sales 129 121 6.6 147 (12.2)
Unscheduled and single deposits 60 66 (9.1) 111 (45.9)Life insurance reserves 24,863 23,431 6.1 24,879 (0.1)Gross life insurance in force 813,690 739,139 10.1 799,972 1.7
Home serviceLife/Accident & Health sales (6) 20 24 (16.7) 25 (20.0)Fixed annuity sales 29 20 45.0 43 (32.6)Unscheduled and single deposits 5 3 66.7 6 (16.7)Total insurance reserves 7,450 7,389 0.8 7,431 0.3Gross life insurance in force 65,508 64,415 1.7 65,443 0.1
Group life/healthAnnualized earned premium 897 942 (4.8) 912 (1.6)Gross life insurance in force 99,144 99,528 (0.4) 98,970 0.2
Payout annuitiesInsurance reserves 17,022 15,055 13.1 16,452 3.5
Individual fixed annuities (including runoff)Insurance reserves $ 8,909 $ 10,793 (17.5) % $ 9,424 (5.5) %
(See Accompanying Notes on Page 27)
% Chg % ChgSequential
24
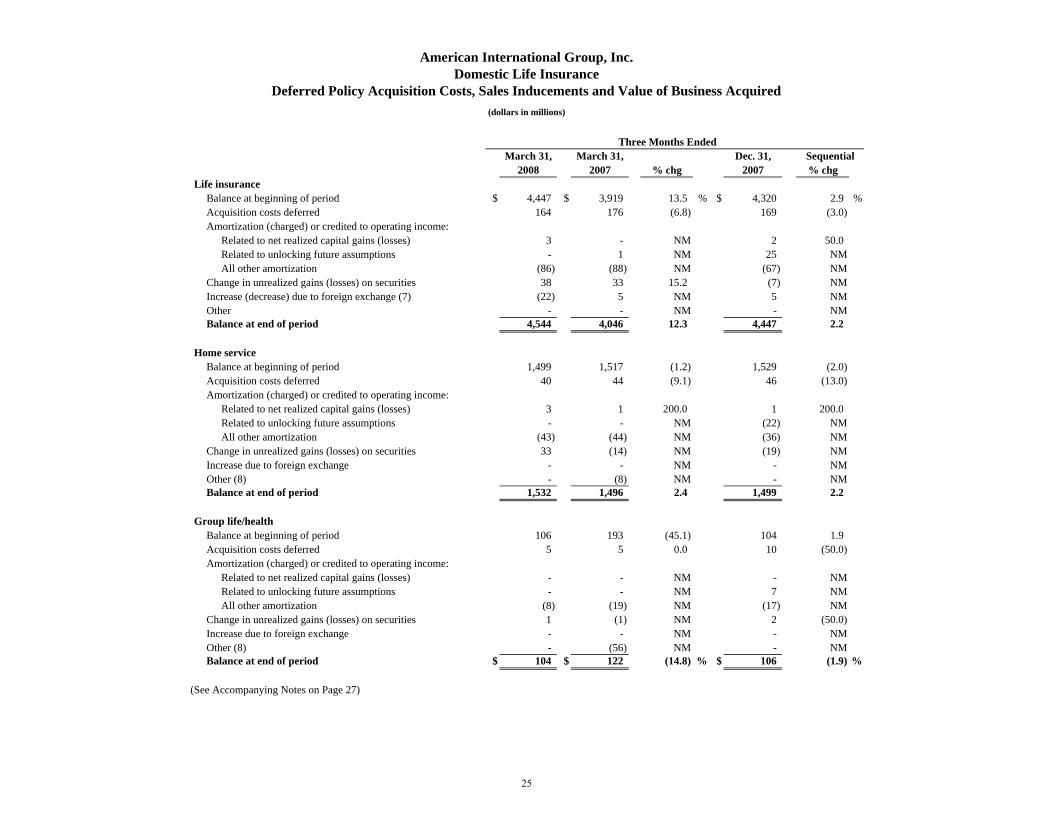
March 31, March 31, Dec. 31,2008 2007 % chg 2007 % chg
Life insuranceBalance at beginning of period $ 4,447 $ 3,919 13.5 % $ 4,320 2.9 %Acquisition costs deferred 164 176 (6.8) 169 (3.0)Amortization (charged) or credited to operating income:
Related to net realized capital gains (losses) 3 - NM 2 50.0Related to unlocking future assumptions - 1 NM 25 NMAll other amortization (86) (88) NM (67) NM
Change in unrealized gains (losses) on securities 38 33 15.2 (7) NMIncrease (decrease) due to foreign exchange (7) (22) 5 NM 5 NMOther - - NM - NMBalance at end of period 4,544 4,046 12.3 4,447 2.2
Home serviceBalance at beginning of period 1,499 1,517 (1.2) 1,529 (2.0)Acquisition costs deferred 40 44 (9.1) 46 (13.0)Amortization (charged) or credited to operating income:
Related to net realized capital gains (losses) 3 1 200.0 1 200.0Related to unlocking future assumptions - - NM (22) NMAll other amortization (43) (44) NM (36) NM
Change in unrealized gains (losses) on securities 33 (14) NM (19) NMIncrease due to foreign exchange - - NM - NMOther (8) - (8) NM - NMBalance at end of period 1,532 1,496 2.4 1,499 2.2
Group life/healthBalance at beginning of period 106 193 (45.1) 104 1.9Acquisition costs deferred 5 5 0.0 10 (50.0)Amortization (charged) or credited to operating income:
Related to net realized capital gains (losses) - - NM - NMRelated to unlocking future assumptions - - NM 7 NMAll other amortization (8) (19) NM (17) NM
Change in unrealized gains (losses) on securities 1 (1) NM 2 (50.0)Increase due to foreign exchange - - NM - NMOther (8) - (56) NM - NMBalance at end of period $ 104 $ 122 (14.8) % $ 106 (1.9) %
(See Accompanying Notes on Page 27)
Sequential
American International Group, Inc.Domestic Life Insurance
Deferred Policy Acquisition Costs, Sales Inducements and Value of Business Acquired(dollars in millions)
Three Months Ended
25

March 31, March 31, Dec. 31,2008 2007 % chg 2007 % chg
Payout annuitiesBalance at beginning of period $ 75 $ 62 21.0 % $ 72 4.2 %Acquisition costs deferred 4 4 0.0 4 0.0Amortization (charged) or credited to operating income:
Related to net realized capital gains (losses) - - NM - NMRelated to unlocking future assumptions - - NM - NMAll other amortization (1) (1) NM (1) NM
Change in unrealized gains (losses) on securities - - NM - NMIncrease due to foreign exchange - - NM - NMOther - - NM - NMBalance at end of period 78 65 20.0 75 4.0
Individual fixed and runoff annuitiesBalance at beginning of period 358 361 (0.8) 386 (7.3)Acquisition costs deferred 11 9 22.2 8 37.5Amortization (charged) or credited to operating income:
Related to net realized capital gains (losses) 14 (1) NM 2 NMRelated to unlocking future assumptions - - NM (5) NMAll other amortization (16) (27) NM (22) NM
Change in unrealized gains (losses) on securities 22 3 NM (11) NMDecrease due to foreign exchange (1) - NM - NMOther - - NM - NMBalance at end of period 388 345 12.5 358 8.4
TotalBalance at beginning of period 6,485 6,052 7.2 6,411 1.2Acquisition costs deferred 224 238 (5.9) 237 (5.5)Amortization (charged) or credited to operating income:
Related to net realized capital gains (losses) 20 - NM 5 300.0Related to unlocking future assumptions - 1 NM 5 NMAll other amortization (154) (179) NM (143) NM
Change in unrealized gains (losses) on securities 94 21 347.6 (35) NMIncrease (decrease) due to foreign exchange (7) (23) 5 NM 5 NMOther (8) - (64) NM - NMBalance at end of period $ 6,646 $ 6,074 9.4 % $ 6,485 2.5 %
(See Accompanying Notes on Page 27)
(dollars in millions)
SequentialThree Months Ended
American International Group, Inc.Domestic Life Insurance
Deferred Policy Acquisition Costs, Sales Inducements and Value of Business Acquired (continued)
26

American International Group, Inc. Domestic Life Insurance
Notes
(1) Premiums, deposits and other considerations represent aggregate business activity presented on a non-GAAP basis. (2) Includes structured settlements, single premium immediate annuities and terminal funding annuities. (3) Includes enhancements of $39 million, $80 million and $44 million for the three months ended March 31, 2008 and 2007 and
December 31, 2007, respectively. Enhancements include gains on calls, prepayment fees and trading gains (losses) not associated with SOP 03-1.
(4) Relates principally to assets held in various trading securities accounts that did not qualify for separate account treatment under SOP 03-1. These amounts are offset by an equal amount included in incurred policy losses and benefits.
(5) Operating income before net realized capital losses did not include any significant infrequent or unusual items, including changes in actuarial estimates, for the three months ended March 31, 2008 and 2007. Operating income for the three months ended December 31, 2007 included charges of $55 million for changes in actuarial estimates. Excluding these charges, the operating income before net realized capital losses for the first three months of 2008 grew 3.7% over the three months ended December 31, 2007.
(6) Periodic premium sales represents premium from new business expected to be collected over a one-year period. (7) Relates to business in Canada. (8) For the first three months of 2007, the amount primarily represents the cumulative effect of implementing SOP 05-1
effective January 1, 2007.
27

American International Group, Inc.Domestic Retirement Services Product Statistics
(dollars in millions)
Three Months EndedMarch 31, March 31, Dec. 31, Sequential
2008 2007 % Chg 2007 % Chg
Premiums, deposits and other considerations (1):Group retirement products (1) $ 1,877 $ 1,883 (0.3) % $ 1,821 3.1 %Individual fixed annuities 2,531 1,231 105.6 1,228 106.1Individual variable annuities 1,017 1,008 0.9 1,079 (5.7)Individual annuities - runoff 13 14 (7.1) 13 0.0
Total premiums, deposits and other considerations 5,438 4,136 31.5 4,141 31.3
Fee and other income:Group retirement products 107 105 1.9 115 (7.0)Individual fixed annuities 23 25 (8.0) 21 9.5Individual variable annuities 152 146 4.1 167 (9.0)Individual annuities - runoff 2 8 (75.0) 5 (60.0)
Total fee and other income 284 284 0.0 308 (7.8)
Investment spread:Net investment income:Group retirement products 494 570 (13.3) 559 (11.6)Individual fixed annuities 759 914 (17.0) 941 (19.3)Individual variable annuities 35 42 (16.7) 43 (18.6)Individual annuities - runoff 83 99 (16.2) 93 (10.8)
Total net investment income 1,371 1,625 (15.6) 1,636 (16.2)
Interest credited:Group retirement products 301 290 3.8 301 0.0Individual fixed annuities 479 486 (1.4) 493 (2.8)Individual variable annuities 27 26 3.8 31 (12.9)Individual annuities - runoff 61 67 (9.0) 63 (3.2)
Total interest credited 868 869 (0.1) 888 (2.3)
Net investment spread:Group retirement products 193 280 (31.1) 258 (25.2)Individual fixed annuities 280 428 (34.6) 448 (37.5)Individual variable annuities 8 16 (50.0) 12 (33.3)Individual annuities - runoff 22 32 (31.3) 30 (26.7)
Total net investment spread 503 756 (33.5) 748 (32.8)
Insurance acquisition and other operating expenses excluding amortization ofdeferred acquisition costs and VOBA related to net realized capital gains (losses):Group retirement products (2) 96 99 (3.0) 131 (26.7)Individual fixed annuities 135 136 (0.7) 135 0.0Individual variable annuities (2) 114 112 1.8 182 (37.4)Individual annuities - runoff 13 23 (43.5) 13 0.0
Total insurance acquisition and other operating expenses excluding amortizationof deferred acquisition costs and VOBA related to net realized capital gains (losses) $ 358 $ 370 (3.2) % $ 461 (22.3) %
(See Accompanying Notes on Pages 36)
28
American International Group, Inc.Domestic Retirement Services Product Statistics (continued)
(dollars in millions)
Three Months EndedMarch 31, March 31, Dec. 31, Sequential
2008 2007 % Chg 2007 % Chg
Operating income excluding net realized capital gains (losses) and relatedamortization of acquisition costs, VOBA and sales inducements:Group retirement products $ 204 $ 286 (28.7) % $ 242 (15.7) %Individual fixed annuities 168 317 (47.0) 334 (49.7)Individual variable annuities 46 50 (8.0) (3) NM Individual annuities - runoff 11 17 (35.3) 22 (50.0)Total operating income excluding net realized capital gains (losses) and
related amortization of acquisition costs, VOBA and sales inducements 429 670 (36.0) 595 (27.9)
Amortization expense (benefit) of deferred acquisition costs, VOBAan sales inducements related to net realized capital gains (losses):Group retirement products (43) - NM (15) NM Individual fixed annuities (122) 3 NM (73) NM Individual variable annuities (69) 8 NM 5 NM Individual annuities - runoff - (2) NM (1) NM
Total amortization expense (benefit) of deferred acquisition costs, VOBAand sales inducements related to net realized capital gains (losses) (234) 9 NM (84) NM
Operating income (loss) before net realized capital gains (losses):Group retirement products 247 286 (13.6) 257 (3.9)Individual fixed annuities 290 314 (7.6) 407 (28.7)Individual variable annuities 115 42 173.8 (8) NM Individual annuities - runoff 11 19 (42.1) 23 (52.2)
Total operating income before net realized capital gains (losses) (3) 663 661 0.3 679 (2.4)
Net realized capital gains (losses):Group retirement products (740) (10) NM (222) NM Individual fixed annuities (1,246) (11) NM (483) NM Individual variable annuities (252) 10 NM (16) NM Individual annuities - runoff (121) 2 NM (63) NM
Total net realized capital gains (losses) (2,359) (9) NM (784) NM
Operating income (loss):Group retirement products (493) 276 NM 35 NM Individual fixed annuities (956) 303 NM (76) NM Individual variable annuities (137) 52 NM (24) NM Individual annuities - runoff (110) 21 NM (40) NM
Total operating income (loss) $ (1,696) $ 652 NM % $ (105) NM %
(See Accompanying Notes on Pages 36)
29
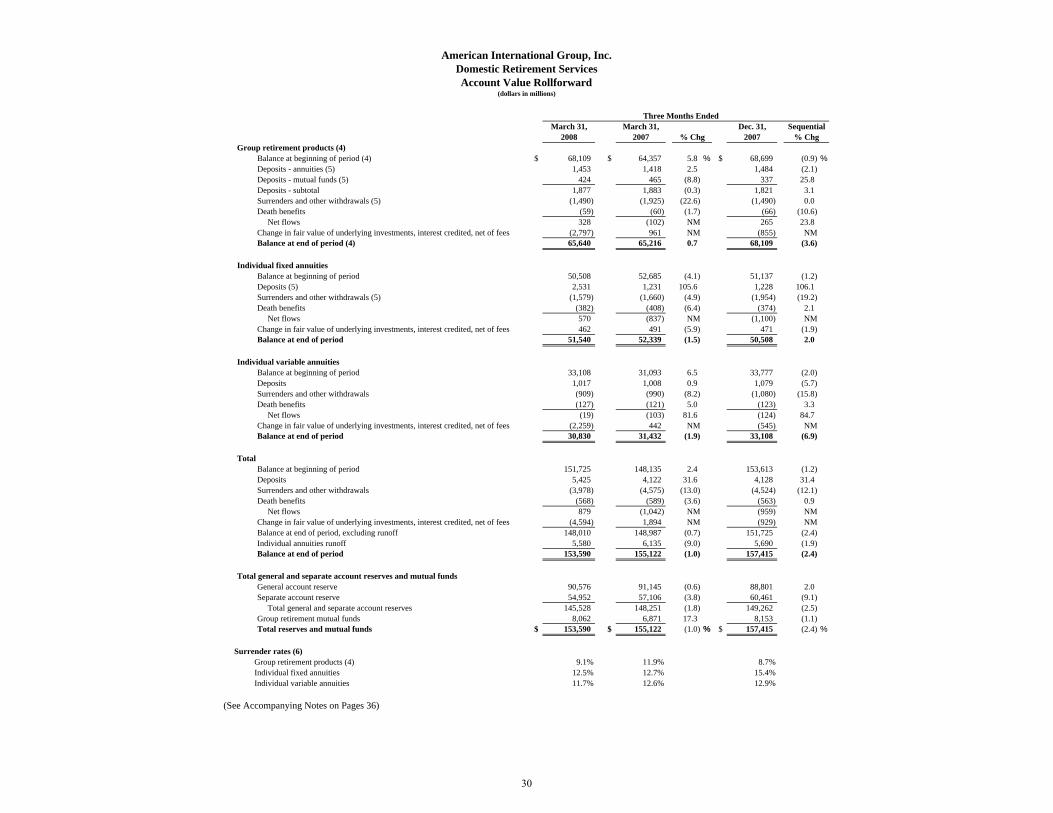
Three Months EndedMarch 31, March 31, Dec. 31,
2008 2007 2007Group retirement products (4)
Balance at beginning of period (4) $ 68,109 $ 64,357 5.8 % $ 68,699 (0.9) %Deposits - annuities (5) 1,453 1,418 2.5 1,484 (2.1)Deposits - mutual funds (5) 424 465 (8.8) 337 25.8Deposits - subtotal 1,877 1,883 (0.3) 1,821 3.1Surrenders and other withdrawals (5) (1,490) (1,925) (22.6) (1,490) 0.0Death benefits (59) (60) (1.7) (66) (10.6) Net flows 328 (102) NM 265 23.8Change in fair value of underlying investments, interest credited, net of fees (2,797) 961 NM (855) NMBalance at end of period (4) 65,640 65,216 0.7 68,109 (3.6)
Individual fixed annuitiesBalance at beginning of period 50,508 52,685 (4.1) 51,137 (1.2)Deposits (5) 2,531 1,231 105.6 1,228 106.1Surrenders and other withdrawals (5) (1,579) (1,660) (4.9) (1,954) (19.2)Death benefits (382) (408) (6.4) (374) 2.1 Net flows 570 (837) NM (1,100) NMChange in fair value of underlying investments, interest credited, net of fees 462 491 (5.9) 471 (1.9)Balance at end of period 51,540 52,339 (1.5) 50,508 2.0
Individual variable annuitiesBalance at beginning of period 33,108 31,093 6.5 33,777 (2.0)Deposits 1,017 1,008 0.9 1,079 (5.7)Surrenders and other withdrawals (909) (990) (8.2) (1,080) (15.8)Death benefits (127) (121) 5.0 (123) 3.3 Net flows (19) (103) 81.6 (124) 84.7Change in fair value of underlying investments, interest credited, net of fees (2,259) 442 NM (545) NMBalance at end of period 30,830 31,432 (1.9) 33,108 (6.9)
TotalBalance at beginning of period 151,725 148,135 2.4 153,613 (1.2)Deposits 5,425 4,122 31.6 4,128 31.4Surrenders and other withdrawals (3,978) (4,575) (13.0) (4,524) (12.1)Death benefits (568) (589) (3.6) (563) 0.9 Net flows 879 (1,042) NM (959) NMChange in fair value of underlying investments, interest credited, net of fees (4,594) 1,894 NM (929) NMBalance at end of period, excluding runoff 148,010 148,987 (0.7) 151,725 (2.4)Individual annuities runoff 5,580 6,135 (9.0) 5,690 (1.9)Balance at end of period 153,590 155,122 (1.0) 157,415 (2.4)
Total general and separate account reserves and mutual fundsGeneral account reserve 90,576 91,145 (0.6) 88,801 2.0Separate account reserve 54,952 57,106 (3.8) 60,461 (9.1) Total general and separate account reserves 145,528 148,251 (1.8) 149,262 (2.5)Group retirement mutual funds 8,062 6,871 17.3 8,153 (1.1)Total reserves and mutual funds $ 153,590 $ 155,122 (1.0) % $ 157,415 (2.4) %
Surrender rates (6)Group retirement products (4) 9.1% 11.9% 8.7%Individual fixed annuities 12.5% 12.7% 15.4%Individual variable annuities 11.7% 12.6% 12.9%
(See Accompanying Notes on Pages 36)
% ChgSequential
% Chg
American International Group, Inc.Domestic Retirement Services
(dollars in millions)Account Value Rollforward
30

American International Group, Inc.Domestic Retirement Services Spread Information
(dollars in millions)
Three Months EndedMarch 31, March 31, Dec. 31,
2008 2007 2007Spread information
Group retirement productsBase investment income (a) $ 487 $ 492 (1.0) % $ 498 (2.2) %Partnerships (b) 13 49 (73.5) 40 (67.5)Other enhancements (c) (6) 29 NM 22 NM
Total net investment income $ 494 $ 570 (13.3) % $ 560 (11.8) %
Base yield (a) 6.14 % 6.09 % 6.33 %Partnerships (b) (0.29) % 0.20 % (0.03) %Other enhancements (c) (0.07) % 0.36 % 0.27 %
Total 5.78 % 6.65 % 6.57 %Cost of funds (d) 3.91 % 3.79 % 3.94 %Net spread rate, as reported (d) 1.87 % 2.86 % 2.63 %Net spread rate excluding partnerships
and other enhancements 2.23 % 2.30 % 2.39 %
Individual fixed annuitiesBase investment income (a) $ 753 $ 794 (5.2) % $ 778 (3.2) %Partnerships (b) 1 81 (98.8) 137 (99.3)Other enhancements (c) 5 39 (87.2) 26 (80.8)
Total net investment income $ 759 $ 914 (17.0) % $ 941 (19.3) %
Base yield (a) 5.83 % 5.94 % 6.04 %Partnerships (b) (0.33) % 0.31 % 0.66 %Other enhancements (c) 0.04 % 0.30 % 0.20 %
Total 5.54 % 6.55 % 6.90 %Cost of funds (d) 3.53 % 3.49 % 3.58 %Net spread rate, as reported (d) 2.01 % 3.06 % 3.32 %Net spread rate excluding partnerships
and other enhancements 2.31 % 2.45 % 2.46 %
Sequential% Chg% Chg
31
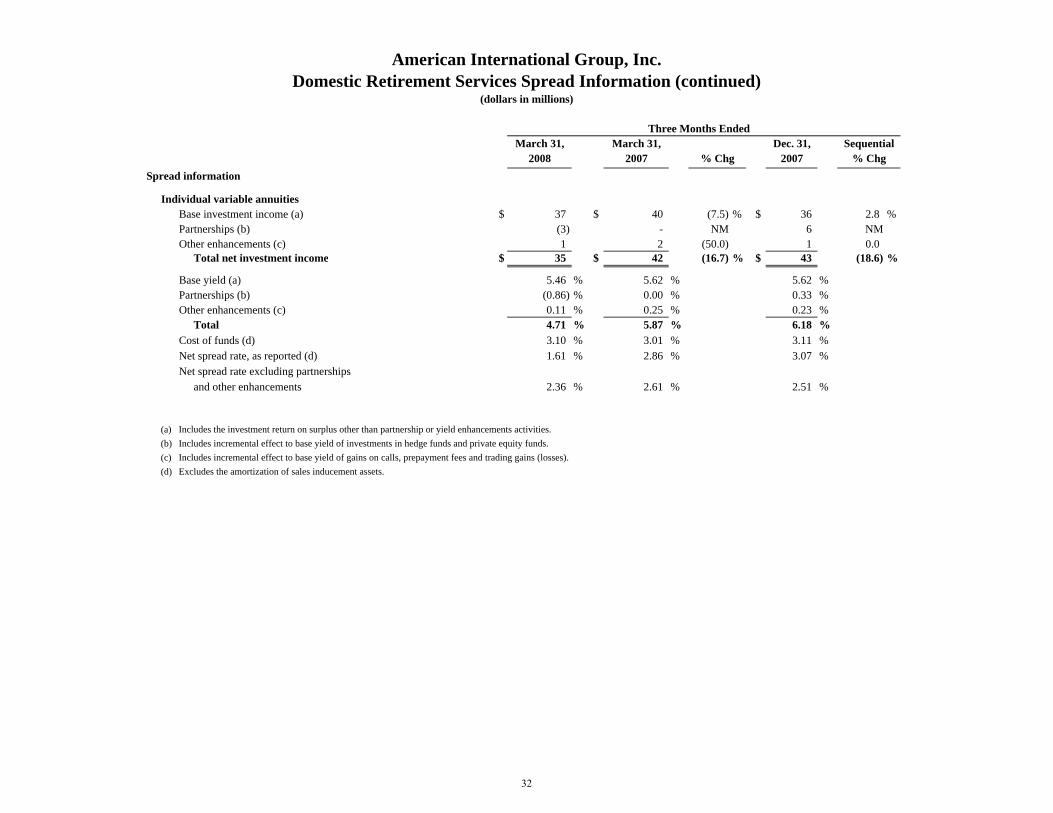
American International Group, Inc.Domestic Retirement Services Spread Information (continued)
(dollars in millions)
Three Months EndedMarch 31, March 31, Dec. 31,
2008 2007 2007Spread information
Individual variable annuitiesBase investment income (a) $ 37 $ 40 (7.5) % $ 36 2.8 %Partnerships (b) (3) - NM 6 NMOther enhancements (c) 1 2 (50.0) 1 0.0
Total net investment income $ 35 $ 42 (16.7) % $ 43 (18.6) %
Base yield (a) 5.46 % 5.62 % 5.62 %Partnerships (b) (0.86) % 0.00 % 0.33 %Other enhancements (c) 0.11 % 0.25 % 0.23 %
Total 4.71 % 5.87 % 6.18 %Cost of funds (d) 3.10 % 3.01 % 3.11 %Net spread rate, as reported (d) 1.61 % 2.86 % 3.07 %Net spread rate excluding partnerships
and other enhancements 2.36 % 2.61 % 2.51 %
(a)(b)(c)(d)
Includes incremental effect to base yield of gains on calls, prepayment fees and trading gains (losses).Excludes the amortization of sales inducement assets.
% Chg % Chg
Includes the investment return on surplus other than partnership or yield enhancements activities.Includes incremental effect to base yield of investments in hedge funds and private equity funds.
Sequential
32

March 31, March 31, Dec. 31, Sequential2008 2007 % chg 2007 % chg
Group retirement productsBalance at beginning of period $ 2,074 $ 1,897 9.3 % $ 2,058 0.8 %Acquisition costs deferred 54 50 8.0 60 (10.0)Amortization (charged) or credited to operating income:
Related to net realized capital gains (losses) 43 - NM 15 186.7Related to unlocking future assumptions - 2 NM - NMAll other amortization (7) (33) (41) NM (66) NM
Change in unrealized gains (losses) on securities (10) (13) NM 7 NMIncrease due to foreign exchange 1 - NM - NMBalance at end of period 2,129 1,895 12.3 2,074 2.7
Individual fixed annuitiesBalance at beginning of period 2,980 2,835 5.1 2,994 (0.5)Acquisition costs deferred 163 104 56.7 100 63.0Amortization (charged) or credited to operating income:
Related to net realized capital gains (losses) 122 (3) NM 73 67.1Related to unlocking future assumptions - - NM 1 NMAll other amortization (143) (147) NM (160) NM
Change in unrealized gains (losses) on securities 105 (102) NM (28) NMBalance at end of period 3,227 2,687 20.1 2,980 8.3
Individual variable annuitiesBalance at beginning of period 1,666 1,679 (0.8) 1,745 (4.5)Acquisition costs deferred 75 66 13.6 79 (5.1)Amortization (charged) or credited to operating income:
Related to net realized capital gains (losses) 69 (8) NM (5) NMRelated to unlocking future assumptions - - NM (13) NMAll other amortization (7) (50) (59) NM (132) NM
Change in unrealized gains (losses) on securities 5 21 (76.2) (8) NMBalance at end of period 1,765 1,699 3.9 1,666 5.9
Individual annuities - runoffBalance at beginning of period 109 $ 127 (14.2) 128 (14.8)Amortization (charged) or credited to operating income:
Related to net realized capital gains (losses) - 2 NM 1 NMRelated to unlocking future assumptions - - NM - NMAll other amortization (8) (13) NM (9) NM
Change in unrealized losses on securities (2) (2) NM (11) NMBalance at end of period 99 114 (13.2) 109 (9.2)
TotalBalance at beginning of period 6,829 6,538 4.5 6,925 (1.4)Acquisition costs deferred 292 220 32.7 239 22.2Amortization (charged) or credited to operating income:
Related to net realized capital gains (losses) 234 (9) NM 84 178.6Related to unlocking future assumptions - 2 NM (12) NMAll other amortization (7) (234) (260) NM (367) NM
Change in unrealized gains (losses) on securities 98 (96) NM (40) NMIncrease due to foreign exchange 1 - NM - NMBalance at end of period $ 7,220 $ 6,395 12.9 % $ 6,829 5.7 %
(See Accompanying Notes on Pages 36)
Three Months Ended
American International Group, Inc.Domestic Retirement Services
Deferred Policy Acquisition Costs, Sales Inducements and Value of Business Acquired(dollars in millions)
33

Account Net Amount RetainedValue at Risk NAR
Guaranteed Minimum Death Benefit ("GMDB") Type (including Earnings Enhancement Benefit) (a):Return of premium (b) $ 4,071 $ 75 $ 75 Reset (c) 961 72 72 Ratchet (d) 14,636 1,359 1,133 Roll-up (e) 7,749 667 652 Combination (f) 247 49 49 Return of premium, with earnings enhancement (g) 3 - - Ratchet, with earnings enhancement (h) 1,775 242 70 Roll-up, with earnings enhancement (i) 737 73 11 Combination with earnings enhancement (j) 54 11 11
30,233 2,548 2,073
Guaranteed Minimum Income Benefit ("GMIB") Type (k):Roll-up (e) 553 60 21 No roll-up (l) 5,820 24 13
6,373 84 34
Guaranteed Minimum Account Value ("GMAV") Type (m):Ten year waiting period 2,027 9 9
Guaranteed Minimum Withdrawal Benefit ("GMWB") Type (n):Minimum amount guarantees (o) 1,080 4 4 Lifetime guarantees (p) 5,301 353 353
6,381 357 357
(a)
(b)(c)(d)(e)(f)(g)(h)(i)(j)(k)(l)(m)(n)(o)(p)
A roll-up benefit which also pays a percent of earnings in the contract, if any.
A guaranteed minimum withdrawal benefit establishes an amount that can be taken as withdrawals which can be taken over a fixed period or for life, regardless of market performance, even if the account value drops to zero.Amount is available over a fixed period.Amount is available over the life of the owner (and spouse, if elected).
A combination benefit which also pays a percent of earnings in the contract, if any.A guaranteed minimum income benefit establishes a minimum amount available to be annuitized regardless of actual performance in the product. The benefit is not available until a set number of years after contract issue.An amount based on premiums deposited or other set amount.A guaranteed minimum account value ensures a return of premium invested at the end of 10 years. The amount is based on premium in a defined period.
An amount equal to premiums deposited accumulated at a set interest rate.An amount equal to the greater of a ratchet or a roll-up.A return of premium benefit which also pays a percent of the earnings in the contract, if any.A ratchet benefit which also pays a percent of earnings in the contract, if any.
benefits may be subject to a maximum amount based on age of owner or dollar amount.Premium deposited into the contract.An amount that is reset to the account value, if greater, at a specified contract anniversary.An amount equal to the highest account value achieved on any contract anniversary.
A guaranteed minimum death benefit is an amount paid from a variable annuity at death of the owner. This benefit protects beneficiaries from market volatility and may be different than the account value. Each of these
March 31, 2008
American International Group, Inc.Domestic Retirement Services - Individual Variable Annuities
Guaranteed Benefits(dollars in millions)
34

March 31, Dec. 31, Sept. 30, June 30, March 31,2008 2007 2007 2007 2007
Other DataS&P 500 Index value 1,323 1,469 1,527 1,504 1,421
Total Account Value $ 30,830 $ 33,108 $ 33,777 $ 33,051 $ 31,432
Account value by benefit type: Guaranteed Minimum Death Benefits 30,233 32,812 33,484 32,764 31,164 Guaranteed Minimum Income Benefits 6,373 7,226 7,685 7,826 7,701 Guaranteed Minimum Account Value 2,027 2,272 2,365 2,364 2,281 Guaranteed Minimum Withdrawal Benefits 6,381 6,248 5,751 4,958 4,038
Net amount at risk: Guaranteed Minimum Death Benefits 2,548 1,250 1,098 1,160 1,299 Guaranteed Minimum Income Benefits 84 39 28 36 43 Guaranteed Minimum Account Value 9 1 - - - Guaranteed Minimum Withdrawal Benefits 357 45 6 6 6
Retained net amount at risk: Guaranteed Minimum Death Benefits 2,073 1,005 879 952 1,115 Guaranteed Minimum Income Benefits 34 15 11 14 16 Guaranteed Minimum Account Value 9 1 - - - Guaranteed Minimum Withdrawal Benefits 357 45 6 6 6
Liability for guaranteed benefits (GMDB & GMIB) $ 82 $ 77 $ 89 $ 81 $ 81
American International Group, Inc.Domestic Retirement Services - Individual Variable Annuities
Guaranteed Benefits (continued)(dollars in millions)
35

American International Group, Inc. Domestic Retirement Services
Notes
(1) Premiums, deposits and other considerations represent aggregate business activity presented on a non-GAAP basis. Group retirement products include mutual funds of $424 million, $465 million and $337 million for the three months ended March 31, 2008 and 2007 and December 31, 2007, respectively.
(2) Group Retirement Products and Individual Variable Annuities include an increase of $18 million and $55 million, respectively, related to change in actuarial estimates for the three months ended December 31, 2007.
(3) Operating income before net realized capital losses did not include any significant infrequent or unusual items, including changes in actuarial estimates, for the three months ended March 31, 2008 and 2007. Operating income for the three months ended December 31, 2007 included charges of $83 million for changes in actuarial estimates. Excluding these charges, the operating income before net realized capital losses for the first three months of 2008 declined 13.0% from the three months ended December 31, 2007.
(4) Includes group retirement annuities and group mutual funds. The balance at the beginning of period for the three months ended March 31, 2008 and 2007 and December 31, 2007 includes group mutual funds of $8.2 billion, $6.4 billion and $8.2 billion, respectively. The balance at the end of period for March 31, 2008 and 2007 and December 31, 2007 includes group mutual funds of $8.1 billion, $6.9 billion and $8.2 billion, respectively.
(5) Excludes internal replacements from one contract into a new contract. If included, deposits and surrenders for group retirement products and individual fixed annuities would increase.
(6) Surrender rates are based upon all benefits, surrenders and withdrawals except for death benefits and excluding internal replacements from one contract into a new contract.
(7) For the three months ended December 31, 2007, all other amortization for DAC, VOBA and Sales Inducements includes $(20) million and $(64) million related to change in actuarial estimates for Group Retirement Products and Individual Variable Annuities, respectively.
36
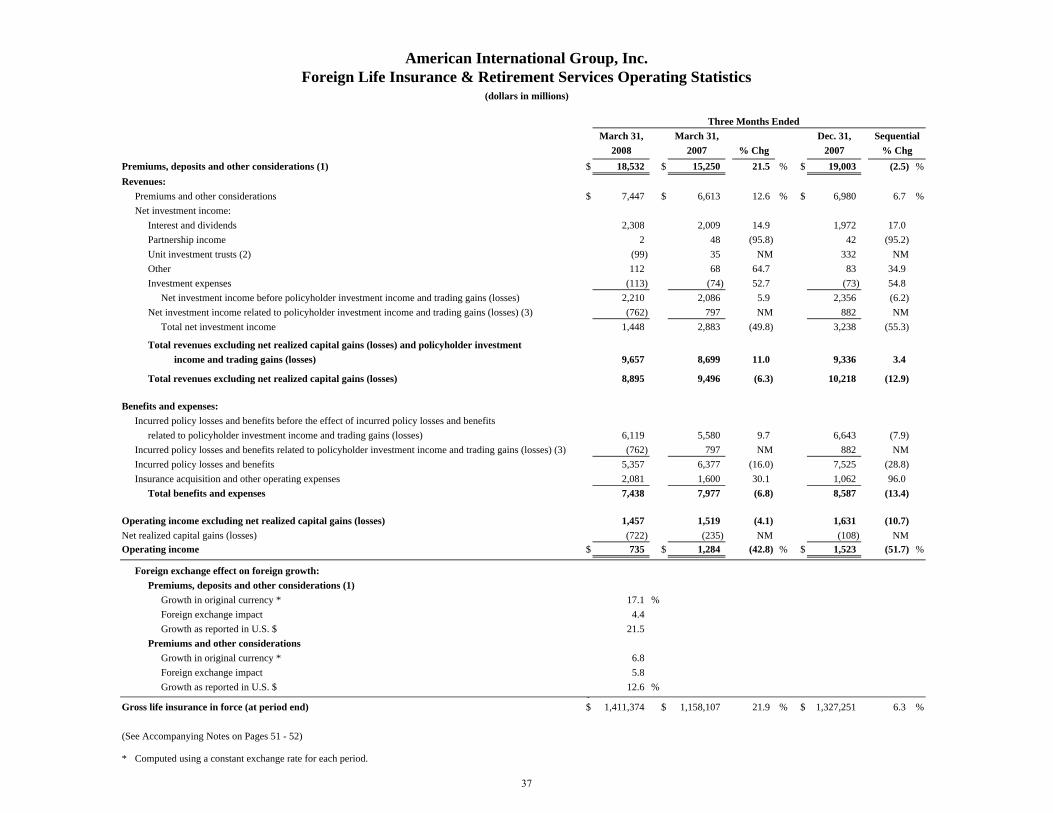
American International Group, Inc.Foreign Life Insurance & Retirement Services Operating Statistics
(dollars in millions)
Three Months EndedMarch 31, March 31, Dec. 31,
2008 2007 % Chg 2007Premiums, deposits and other considerations (1) $ 18,532 $ 15,250 21.5 % $ 19,003 (2.5) %Revenues:
Premiums and other considerations $ 7,447 $ 6,613 12.6 % $ 6,980 6.7 %Net investment income:
Interest and dividends 2,308 2,009 14.9 1,972 17.0Partnership income 2 48 (95.8) 42 (95.2)Unit investment trusts (2) (99) 35 NM 332 NMOther 112 68 64.7 83 34.9Investment expenses (113) (74) 52.7 (73) 54.8
Net investment income before policyholder investment income and trading gains (losses) 2,210 2,086 5.9 2,356 (6.2)Net investment income related to policyholder investment income and trading gains (losses) (3) (762) 797 NM 882 NM
Total net investment income 1,448 2,883 (49.8) 3,238 (55.3)
Total revenues excluding net realized capital gains (losses) and policyholder investment income and trading gains (losses) 9,657 8,699 11.0 9,336 3.4
Total revenues excluding net realized capital gains (losses) 8,895 9,496 (6.3) 10,218 (12.9)
Benefits and expenses:Incurred policy losses and benefits before the effect of incurred policy losses and benefits
related to policyholder investment income and trading gains (losses) 6,119 5,580 9.7 6,643 (7.9)Incurred policy losses and benefits related to policyholder investment income and trading gains (losses) (3) (762) 797 NM 882 NMIncurred policy losses and benefits 5,357 6,377 (16.0) 7,525 (28.8)Insurance acquisition and other operating expenses 2,081 1,600 30.1 1,062 96.0
Total benefits and expenses 7,438 7,977 (6.8) 8,587 (13.4)
Operating income excluding net realized capital gains (losses) 1,457 1,519 (4.1) 1,631 (10.7)Net realized capital gains (losses) (722) (235) NM (108) NMOperating income $ 735 $ 1,284 (42.8) % $ 1,523 (51.7) %
Foreign exchange effect on foreign growth:Premiums, deposits and other considerations (1)
Growth in original currency * 17.1 %Foreign exchange impact 4.4 Growth as reported in U.S. $ 21.5
Premiums and other considerations Growth in original currency * 6.8 Foreign exchange impact 5.8 Growth as reported in U.S. $ 12.6 %
$Gross life insurance in force (at period end) $ 1,411,374 $ 1,158,107 21.9 % $ 1,327,251 6.3 %
(See Accompanying Notes on Pages 51 - 52)
*
Sequential% Chg
Computed using a constant exchange rate for each period.
37
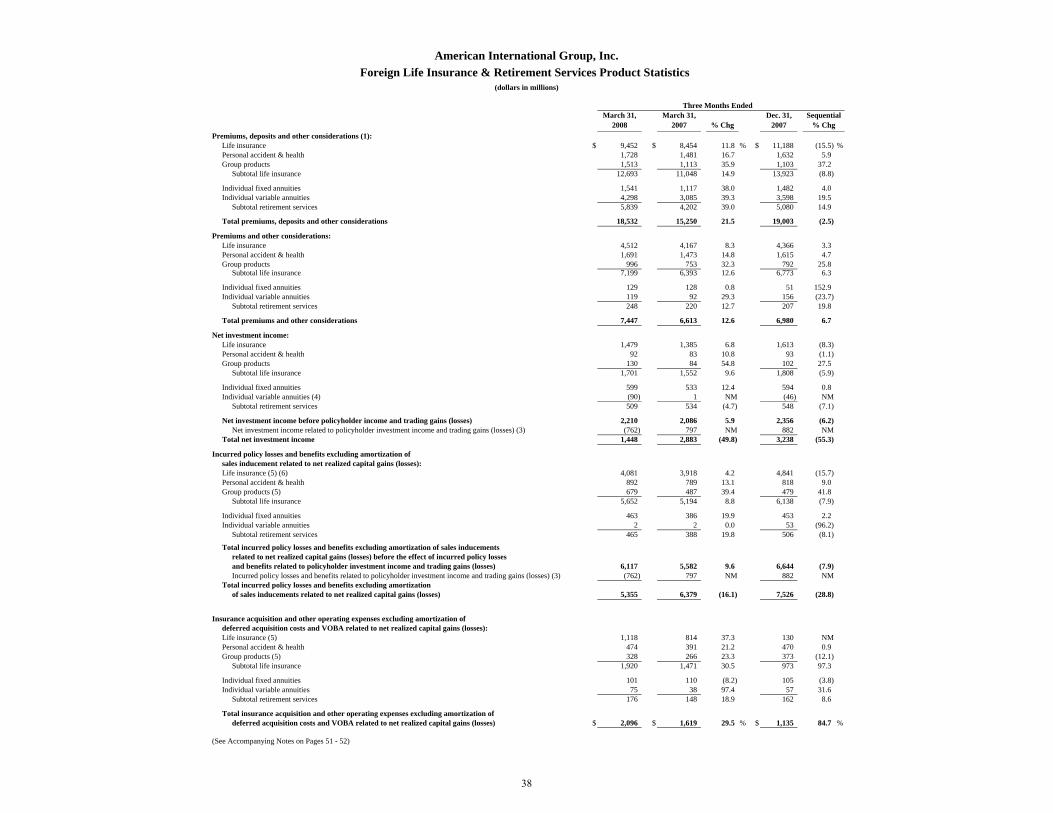
American International Group, Inc.Foreign Life Insurance & Retirement Services Product Statistics
(dollars in millions)
Three Months EndedMarch 31, March 31, Dec. 31,
2008 2007 % Chg 2007Premiums, deposits and other considerations (1):
Life insurance $ 9,452 $ 8,454 11.8 % $ 11,188 (15.5) %Personal accident & health 1,728 1,481 16.7 1,632 5.9Group products 1,513 1,113 35.9 1,103 37.2
Subtotal life insurance 12,693 11,048 14.9 13,923 (8.8)
Individual fixed annuities 1,541 1,117 38.0 1,482 4.0Individual variable annuities 4,298 3,085 39.3 3,598 19.5
Subtotal retirement services 5,839 4,202 39.0 5,080 14.9
Total premiums, deposits and other considerations 18,532 15,250 21.5 19,003 (2.5)
Premiums and other considerations:Life insurance 4,512 4,167 8.3 4,366 3.3Personal accident & health 1,691 1,473 14.8 1,615 4.7Group products 996 753 32.3 792 25.8
Subtotal life insurance 7,199 6,393 12.6 6,773 6.3
Individual fixed annuities 129 128 0.8 51 152.9Individual variable annuities 119 92 29.3 156 (23.7)
Subtotal retirement services 248 220 12.7 207 19.8
Total premiums and other considerations 7,447 6,613 12.6 6,980 6.7
Net investment income:Life insurance 1,479 1,385 6.8 1,613 (8.3)Personal accident & health 92 83 10.8 93 (1.1)Group products 130 84 54.8 102 27.5
Subtotal life insurance 1,701 1,552 9.6 1,808 (5.9)
Individual fixed annuities 599 533 12.4 594 0.8Individual variable annuities (4) (90) 1 NM (46) NM
Subtotal retirement services 509 534 (4.7) 548 (7.1)
Net investment income before policyholder income and trading gains (losses) 2,210 2,086 5.9 2,356 (6.2)Net investment income related to policyholder investment income and trading gains (losses) (3) (762) 797 NM 882 NM
Total net investment income 1,448 2,883 (49.8) 3,238 (55.3)
Incurred policy losses and benefits excluding amortization ofsales inducement related to net realized capital gains (losses):Life insurance (5) (6) 4,081 3,918 4.2 4,841 (15.7)Personal accident & health 892 789 13.1 818 9.0Group products (5) 679 487 39.4 479 41.8
Subtotal life insurance 5,652 5,194 8.8 6,138 (7.9)
Individual fixed annuities 463 386 19.9 453 2.2Individual variable annuities 2 2 0.0 53 (96.2)
Subtotal retirement services 465 388 19.8 506 (8.1)
Total incurred policy losses and benefits excluding amortization of sales inducementsrelated to net realized capital gains (losses) before the effect of incurred policy lossesand benefits related to policyholder investment income and trading gains (losses) 6,117 5,582 9.6 6,644 (7.9)Incurred policy losses and benefits related to policyholder investment income and trading gains (losses) (3) (762) 797 NM 882 NM
Total incurred policy losses and benefits excluding amortizationof sales inducements related to net realized capital gains (losses) 5,355 6,379 (16.1) 7,526 (28.8)
Insurance acquisition and other operating expenses excluding amortization ofdeferred acquisition costs and VOBA related to net realized capital gains (losses):Life insurance (5) 1,118 814 37.3 130 NMPersonal accident & health 474 391 21.2 470 0.9Group products (5) 328 266 23.3 373 (12.1)
Subtotal life insurance 1,920 1,471 30.5 973 97.3
Individual fixed annuities 101 110 (8.2) 105 (3.8)Individual variable annuities 75 38 97.4 57 31.6
Subtotal retirement services 176 148 18.9 162 8.6
Total insurance acquisition and other operating expenses excluding amortization ofdeferred acquisition costs and VOBA related to net realized capital gains (losses) $ 2,096 $ 1,619 29.5 % $ 1,135 84.7 %
(See Accompanying Notes on Pages 51 - 52)
% ChgSequential
38

American International Group, Inc.Foreign Life Insurance & Retirement Services Product Statistics (continued)
(dollars in millions)
Three Months EndedMarch 31, March 31, Dec. 31,
2008 2007 % Chg 2007
Operating income (loss) excluding net realized capital gains (losses) and relatedamortization of acquisition costs, VOBA and sales inducements:Life insurance $ 792 $ 820 (3.4) % $ 1,008 (21.4) %Personal accident & health 417 376 10.9 420 (0.7)Group products 119 84 41.7 42 183.3
Subtotal life insurance 1,328 1,280 3.8 1,470 (9.7)
Individual fixed annuities 164 165 (0.6) 87 88.5Individual variable annuities (48) 53 NM - NM
Subtotal retirement services 116 218 (46.8) 87 33.3
Total operating income excluding net realized capital gains (losses) andrelated amortization of acquisition costs, VOBA and sales inducements 1,444 1,498 (3.6) 1,557 (7.3)
Amortization expense (benefit) of deferred acquisition costs, VOBA and sales inducements related to net realized capital gains (losses):Life insurance (6) - NM 3 NMPersonal accident & health - - NM - NMGroup products - - NM - NM
Subtotal life insurance (6) - NM 3 NM
Individual fixed annuities (7) (21) NM (77) NMIndividual variable annuities - - NM - NM
Subtotal retirement services (7) (21) NM (77) NM
Total amortization expense (benefit) of deferred acquisition costs, VOBAand sales inducements related to net realized capital gains (losses) (13) (21) NM (74) NM
Operating income (loss) before net realized capital gains (losses):Life insurance 798 820 (2.7) 1,005 (20.6)Personal accident & health 417 376 10.9 420 (0.7)Group products 119 84 41.7 42 183.3
Subtotal life insurance 1,334 1,280 4.2 1,467 (9.1)
Individual fixed annuities 171 186 (8.1) 164 4.3Individual variable annuities (48) 53 NM - NM
Subtotal retirement services 123 239 (48.5) 164 (25.0)
Total operating income before net realized capital gains (losses) (7) 1,457 1,519 (4.1) 1,631 (10.7)
Net realized capital gains (losses):Life insurance (567) (168) NM 38 NMPersonal accident & health (40) (8) NM (9) NMGroup products (30) (21) NM (12) NM
Subtotal life insurance (637) (197) NM 17 NM
Individual fixed annuities (113) (37) NM (103) NMIndividual variable annuities 28 (1) NM (22) NM
Subtotal retirement services (85) (38) NM (125) NM
Total net realized capital gains (losses) (722) (235) NM (108) NM
Operating income (loss):Life insurance 231 652 (64.6) 1,043 (77.9)Personal accident & health 377 368 2.4 411 (8.3)Group products 89 63 41.3 30 196.7
Subtotal life insurance 697 1,083 (35.6) 1,484 (53.0)
Individual fixed annuities 58 149 (61.1) 61 (4.9)Individual variable annuities (20) 52 NM (22) NM
Subtotal retirement services 38 201 (81.1) 39 (2.6)
Total operating income $ 735 $ 1,284 (42.8) % $ 1,523 (51.7) %
(See Accompanying Notes on Pages 51 - 52)
Sequential% Chg
39
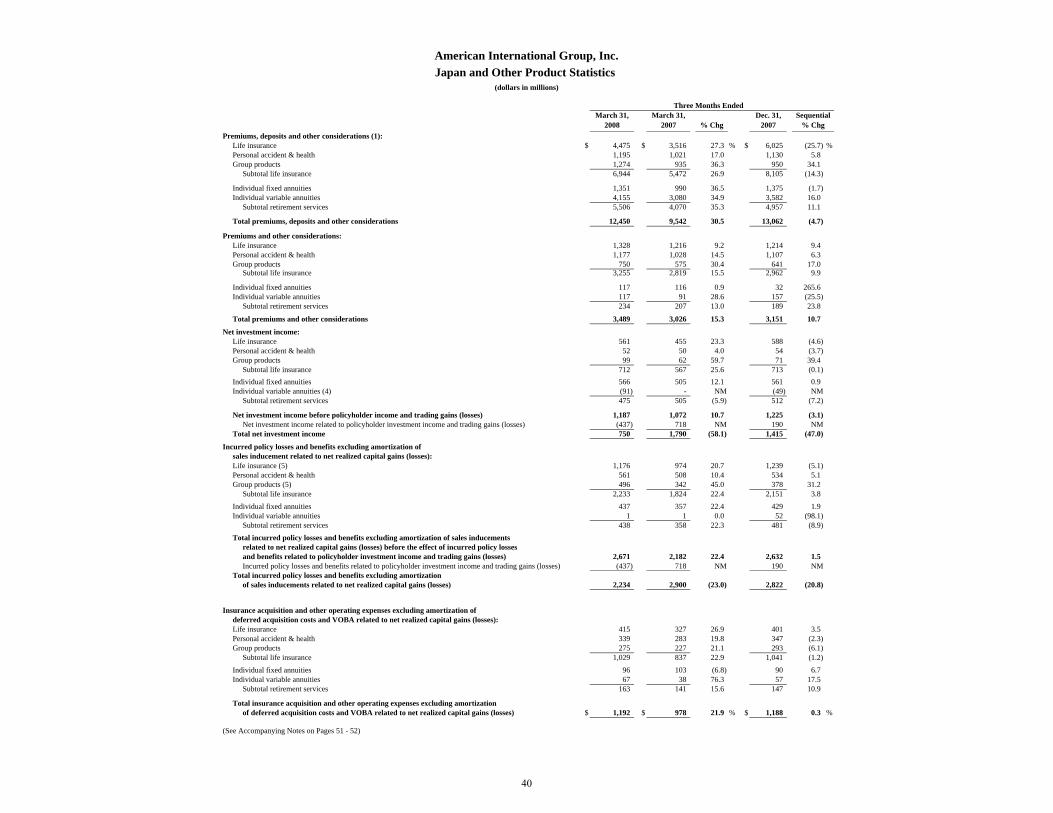
American International Group, Inc.Japan and Other Product Statistics
(dollars in millions)
Three Months EndedMarch 31, March 31, Dec. 31,
2008 2007 % Chg 2007Premiums, deposits and other considerations (1):
Life insurance $ 4,475 $ 3,516 27.3 % $ 6,025 (25.7) %Personal accident & health 1,195 1,021 17.0 1,130 5.8Group products 1,274 935 36.3 950 34.1
Subtotal life insurance 6,944 5,472 26.9 8,105 (14.3)
Individual fixed annuities 1,351 990 36.5 1,375 (1.7)Individual variable annuities 4,155 3,080 34.9 3,582 16.0
Subtotal retirement services 5,506 4,070 35.3 4,957 11.1
Total premiums, deposits and other considerations 12,450 9,542 30.5 13,062 (4.7)
Premiums and other considerations:Life insurance 1,328 1,216 9.2 1,214 9.4Personal accident & health 1,177 1,028 14.5 1,107 6.3Group products 750 575 30.4 641 17.0
Subtotal life insurance 3,255 2,819 15.5 2,962 9.9
Individual fixed annuities 117 116 0.9 32 265.6Individual variable annuities 117 91 28.6 157 (25.5)
Subtotal retirement services 234 207 13.0 189 23.8
Total premiums and other considerations 3,489 3,026 15.3 3,151 10.7
Net investment income:Life insurance 561 455 23.3 588 (4.6)Personal accident & health 52 50 4.0 54 (3.7)Group products 99 62 59.7 71 39.4
Subtotal life insurance 712 567 25.6 713 (0.1)Individual fixed annuities 566 505 12.1 561 0.9Individual variable annuities (4) (91) - NM (49) NM
Subtotal retirement services 475 505 (5.9) 512 (7.2)
Net investment income before policyholder income and trading gains (losses) 1,187 1,072 10.7 1,225 (3.1)Net investment income related to policyholder investment income and trading gains (losses) (437) 718 NM 190 NM
Total net investment income 750 1,790 (58.1) 1,415 (47.0)
Incurred policy losses and benefits excluding amortization ofsales inducement related to net realized capital gains (losses):Life insurance (5) 1,176 974 20.7 1,239 (5.1)Personal accident & health 561 508 10.4 534 5.1Group products (5) 496 342 45.0 378 31.2
Subtotal life insurance 2,233 1,824 22.4 2,151 3.8Individual fixed annuities 437 357 22.4 429 1.9Individual variable annuities 1 1 0.0 52 (98.1)
Subtotal retirement services 438 358 22.3 481 (8.9)Total incurred policy losses and benefits excluding amortization of sales inducements
related to net realized capital gains (losses) before the effect of incurred policy lossesand benefits related to policyholder investment income and trading gains (losses) 2,671 2,182 22.4 2,632 1.5Incurred policy losses and benefits related to policyholder investment income and trading gains (losses) (437) 718 NM 190 NM
Total incurred policy losses and benefits excluding amortizationof sales inducements related to net realized capital gains (losses) 2,234 2,900 (23.0) 2,822 (20.8)
Insurance acquisition and other operating expenses excluding amortization ofdeferred acquisition costs and VOBA related to net realized capital gains (losses):Life insurance 415 327 26.9 401 3.5Personal accident & health 339 283 19.8 347 (2.3)Group products 275 227 21.1 293 (6.1)
Subtotal life insurance 1,029 837 22.9 1,041 (1.2)Individual fixed annuities 96 103 (6.8) 90 6.7Individual variable annuities 67 38 76.3 57 17.5
Subtotal retirement services 163 141 15.6 147 10.9
Total insurance acquisition and other operating expenses excluding amortizationof deferred acquisition costs and VOBA related to net realized capital gains (losses) $ 1,192 $ 978 21.9 % $ 1,188 0.3 %
(See Accompanying Notes on Pages 51 - 52)
Sequential% Chg
40
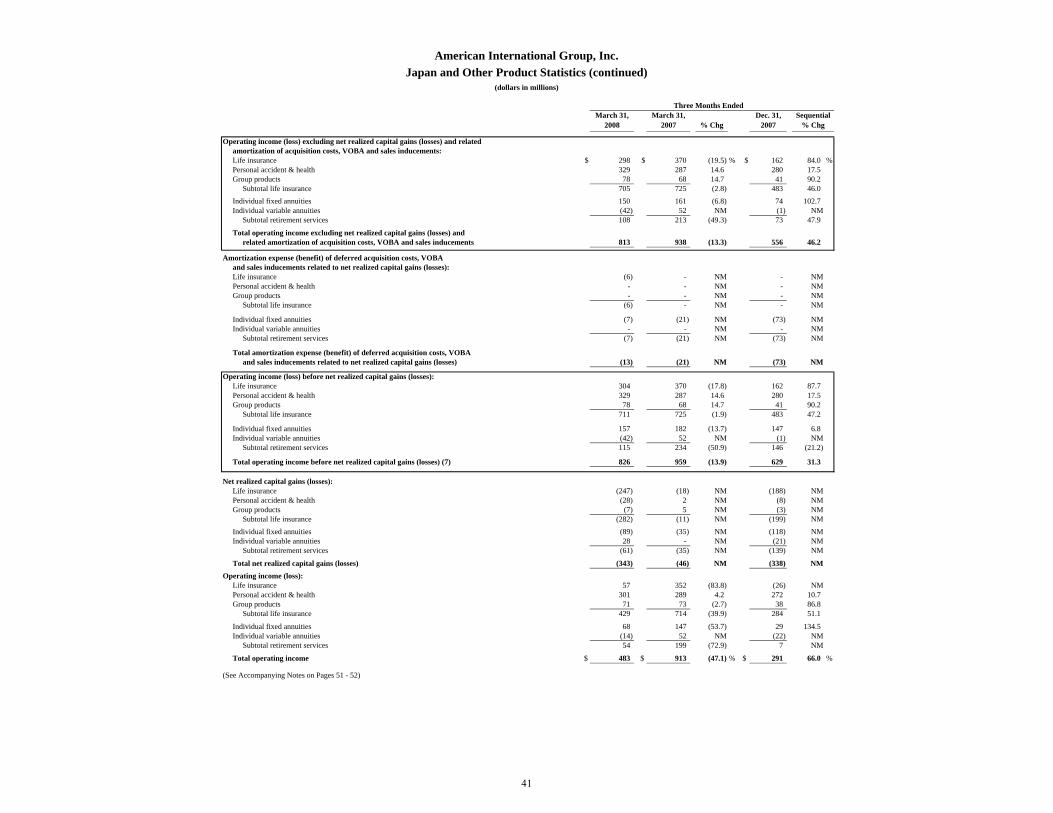
American International Group, Inc.Japan and Other Product Statistics (continued)
(dollars in millions)
Three Months EndedMarch 31, March 31, Dec. 31,
2008 2007 % Chg 2007
Operating income (loss) excluding net realized capital gains (losses) and relatedamortization of acquisition costs, VOBA and sales inducements:Life insurance $ 298 $ 370 (19.5) % $ 162 84.0 %Personal accident & health 329 287 14.6 280 17.5Group products 78 68 14.7 41 90.2
Subtotal life insurance 705 725 (2.8) 483 46.0Individual fixed annuities 150 161 (6.8) 74 102.7Individual variable annuities (42) 52 NM (1) NM
Subtotal retirement services 108 213 (49.3) 73 47.9
Total operating income excluding net realized capital gains (losses) andrelated amortization of acquisition costs, VOBA and sales inducements 813 938 (13.3) 556 46.2
Amortization expense (benefit) of deferred acquisition costs, VOBAand sales inducements related to net realized capital gains (losses):Life insurance (6) - NM - NMPersonal accident & health - - NM - NMGroup products - - NM - NM
Subtotal life insurance (6) - NM - NM
Individual fixed annuities (7) (21) NM (73) NMIndividual variable annuities - - NM - NM
Subtotal retirement services (7) (21) NM (73) NM
Total amortization expense (benefit) of deferred acquisition costs, VOBA and sales inducements related to net realized capital gains (losses) (13) (21) NM (73) NM
Operating income (loss) before net realized capital gains (losses):Life insurance 304 370 (17.8) 162 87.7Personal accident & health 329 287 14.6 280 17.5Group products 78 68 14.7 41 90.2
Subtotal life insurance 711 725 (1.9) 483 47.2
Individual fixed annuities 157 182 (13.7) 147 6.8Individual variable annuities (42) 52 NM (1) NM
Subtotal retirement services 115 234 (50.9) 146 (21.2)
Total operating income before net realized capital gains (losses) (7) 826 959 (13.9) 629 31.3
Net realized capital gains (losses):Life insurance (247) (18) NM (188) NMPersonal accident & health (28) 2 NM (8) NMGroup products (7) 5 NM (3) NM
Subtotal life insurance (282) (11) NM (199) NMIndividual fixed annuities (89) (35) NM (118) NMIndividual variable annuities 28 - NM (21) NM
Subtotal retirement services (61) (35) NM (139) NM
Total net realized capital gains (losses) (343) (46) NM (338) NMOperating income (loss):
Life insurance 57 352 (83.8) (26) NMPersonal accident & health 301 289 4.2 272 10.7Group products 71 73 (2.7) 38 86.8
Subtotal life insurance 429 714 (39.9) 284 51.1
Individual fixed annuities 68 147 (53.7) 29 134.5Individual variable annuities (14) 52 NM (22) NM
Subtotal retirement services 54 199 (72.9) 7 NM
Total operating income $ 483 $ 913 (47.1) % $ 291 66.0 %
(See Accompanying Notes on Pages 51 - 52)
Sequential% Chg
41
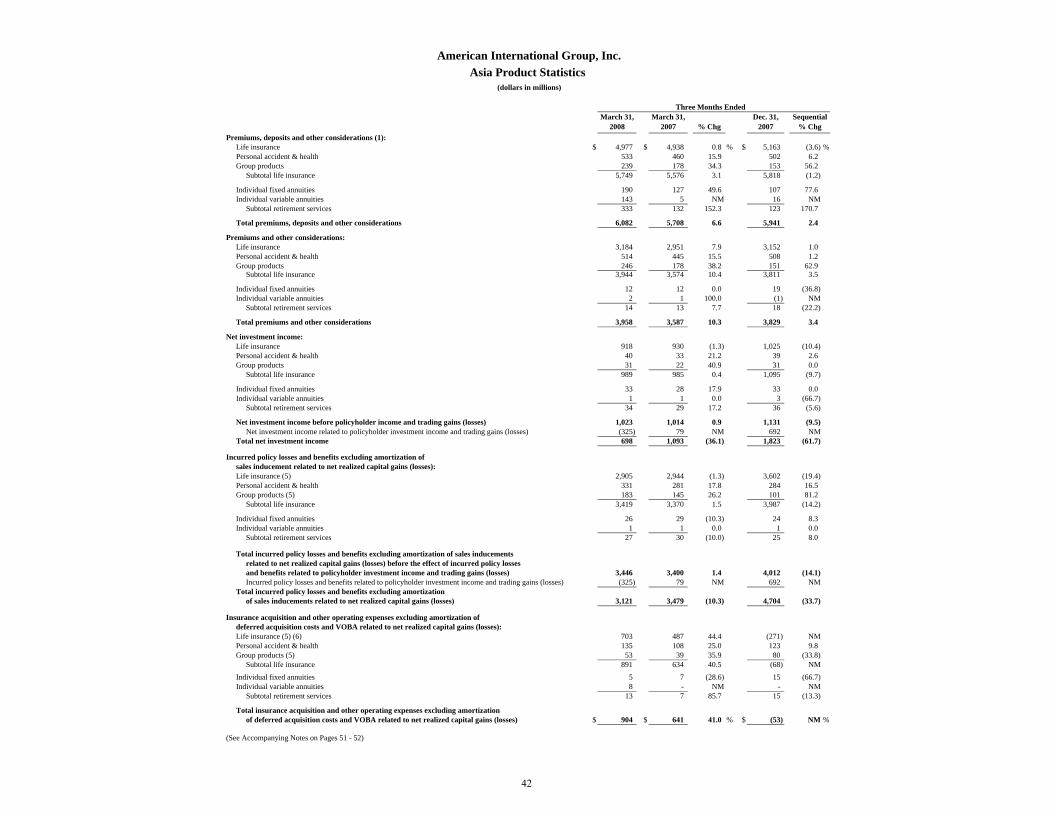
Three Months EndedMarch 31, March 31, Dec. 31,
2008 2007 % Chg 2007Premiums, deposits and other considerations (1):
Life insurance $ 4,977 $ 4,938 0.8 % $ 5,163 (3.6) %Personal accident & health 533 460 15.9 502 6.2Group products 239 178 34.3 153 56.2
Subtotal life insurance 5,749 5,576 3.1 5,818 (1.2)
Individual fixed annuities 190 127 49.6 107 77.6Individual variable annuities 143 5 NM 16 NM
Subtotal retirement services 333 132 152.3 123 170.7
Total premiums, deposits and other considerations 6,082 5,708 6.6 5,941 2.4
Premiums and other considerations:Life insurance 3,184 2,951 7.9 3,152 1.0Personal accident & health 514 445 15.5 508 1.2Group products 246 178 38.2 151 62.9
Subtotal life insurance 3,944 3,574 10.4 3,811 3.5
Individual fixed annuities 12 12 0.0 19 (36.8)Individual variable annuities 2 1 100.0 (1) NM
Subtotal retirement services 14 13 7.7 18 (22.2)
Total premiums and other considerations 3,958 3,587 10.3 3,829 3.4
Net investment income:Life insurance 918 930 (1.3) 1,025 (10.4)Personal accident & health 40 33 21.2 39 2.6Group products 31 22 40.9 31 0.0
Subtotal life insurance 989 985 0.4 1,095 (9.7)
Individual fixed annuities 33 28 17.9 33 0.0Individual variable annuities 1 1 0.0 3 (66.7)
Subtotal retirement services 34 29 17.2 36 (5.6)
Net investment income before policyholder income and trading gains (losses) 1,023 1,014 0.9 1,131 (9.5)Net investment income related to policyholder investment income and trading gains (losses) (325) 79 NM 692 NM
Total net investment income 698 1,093 (36.1) 1,823 (61.7)
Incurred policy losses and benefits excluding amortization ofsales inducement related to net realized capital gains (losses):Life insurance (5) 2,905 2,944 (1.3) 3,602 (19.4)Personal accident & health 331 281 17.8 284 16.5Group products (5) 183 145 26.2 101 81.2
Subtotal life insurance 3,419 3,370 1.5 3,987 (14.2)
Individual fixed annuities 26 29 (10.3) 24 8.3Individual variable annuities 1 1 0.0 1 0.0
Subtotal retirement services 27 30 (10.0) 25 8.0
Total incurred policy losses and benefits excluding amortization of sales inducementsrelated to net realized capital gains (losses) before the effect of incurred policy lossesand benefits related to policyholder investment income and trading gains (losses) 3,446 3,400 1.4 4,012 (14.1)Incurred policy losses and benefits related to policyholder investment income and trading gains (losses) (325) 79 NM 692 NM
Total incurred policy losses and benefits excluding amortizationof sales inducements related to net realized capital gains (losses) 3,121 3,479 (10.3) 4,704 (33.7)
Insurance acquisition and other operating expenses excluding amortization ofdeferred acquisition costs and VOBA related to net realized capital gains (losses):Life insurance (5) (6) 703 487 44.4 (271) NMPersonal accident & health 135 108 25.0 123 9.8Group products (5) 53 39 35.9 80 (33.8)
Subtotal life insurance 891 634 40.5 (68) NMIndividual fixed annuities 5 7 (28.6) 15 (66.7)Individual variable annuities 8 - NM - NM
Subtotal retirement services 13 7 85.7 15 (13.3)
Total insurance acquisition and other operating expenses excluding amortizationof deferred acquisition costs and VOBA related to net realized capital gains (losses) $ 904 $ 641 41.0 % $ (53) NM %
(See Accompanying Notes on Pages 51 - 52)
American International Group, Inc.Asia Product Statistics
(dollars in millions)
Sequential% Chg
42

Three Months EndedMarch 31, March 31, Dec. 31,
2008 2007 % Chg 2007
Operating income (loss) excluding net realized capital gains (losses) and relatedamortization of acquisition costs, VOBA and sales inducements:Life insurance $ 494 $ 450 9.8 % $ 846 (41.6) %Personal accident & health 88 89 (1.1) 140 (37.1)Group products 41 16 156.3 1 NM
Subtotal life insurance 623 555 12.3 987 (36.9)
Individual fixed annuities 14 4 250.0 13 7.7Individual variable annuities (6) 1 NM 1 NM
Subtotal retirement services 8 5 60.0 14 (42.9)
Total operating income excluding net realized capital gains (losses) andrelated amortization of acquisition costs, VOBA and sales inducements 631 560 12.7 1,001 (37.0)
Amortization expense (benefit) of deferred acquisition costs, VOBA and sales inducements related to net realized capital gains (losses):Life insurance - - NM 3 NMPersonal accident & health - - NM - NMGroup products - - NM - NM
Subtotal life insurance - - NM 3 NM
Individual fixed annuities - - NM (4) NMIndividual variable annuities - - NM - NM
Subtotal retirement services - - NM (4) NM
Total amortization expense (benefit) of deferred acquisition costs, VOBA and sales inducements related to net realized capital gains (losses) - - NM (1) NM
Operating income (loss) before net realized capital gains (losses):Life insurance 494 450 9.8 843 (41.4)Personal accident & health 88 89 (1.1) 140 (37.1)Group products 41 16 156.3 1 NM
Subtotal life insurance 623 555 12.3 984 (36.7)
Individual fixed annuities 14 4 250.0 17 (17.6)Individual variable annuities (6) 1 NM 1 NM
Subtotal retirement services 8 5 60.0 18 (55.6)
Total operating income before net realized capital gains (losses) (7) 631 560 12.7 1,002 (37.0)
Net realized capital gains (losses):Life insurance (320) (150) NM 226 NMPersonal accident & health (12) (10) NM (1) NMGroup products (23) (26) NM (9) NM
Subtotal life insurance (355) (186) NM 216 NM
Individual fixed annuities (24) (2) NM 15 NMIndividual variable annuities - (1) NM (1) NM
Subtotal retirement services (24) (3) NM 14 NM
Total net realized capital gains (losses) (379) (189) NM 230 NM
Operating income (loss):Life insurance 174 300 (42.0) 1,069 (83.7)Personal accident & health 76 79 (3.8) 139 (45.3)Group products 18 (10) NM (8) NM
Subtotal life insurance 268 369 (27.4) 1,200 (77.7)
Individual fixed annuities (10) 2 NM 32 NMIndividual variable annuities (6) - NM - NM
Subtotal retirement services (16) 2 NM 32 NM
Total operating income $ 252 $ 371 (32.1) % $ 1,232 (79.5) %
(See Accompanying Notes on Pages 51 - 52)
Sequential% Chg
Asia Product Statistics (continued)(dollars in millions)
American International Group, Inc.
43

First Year Premiums (8) Single Premiums Three Months Ended Three Months Ended
March 31, March 31, Dec. 31, March 31, March 31, Dec. 31,2008 2007 % Chg 2007 2008 2007 % Chg 2007
Life insuranceJapan $ 158 $ 211 (25.1) % $ 162 (2.5) % $ 368 $ 345 6.7 % $ 469 (21.5) %China 25 27 (7.4) 31 (19.4) 100 66 51.5 106 (5.7)Taiwan 157 179 (12.3) 157 0.0 182 194 (6.2) 207 (12.1)Other Asia 383 313 22.4 454 (15.6) 652 370 76.2 955 (31.7)Europe (9) 43 34 26.5 43 0.0 2,180 1,415 54.1 3,709 (41.2)All other regions 41 36 13.9 45 (8.9) 40 30 33.3 70 (42.9)Total 807 800 0.9 892 (9.5) 3,522 2,420 45.5 5,516 (36.1)
Personal accident & healthJapan 146 153 (4.6) 148 (1.4) 26 2 NM 2 NMChina 9 8 12.5 12 (25.0) 1 - NM 1 0.0Taiwan 26 27 (3.7) 25 4.0 - - NM - NMOther Asia 77 92 (16.3) 83 (7.2) - - NM - NMEurope 24 21 14.3 28 (14.3) 5 4 25.0 5 0.0All other regions 12 11 9.1 13 (7.7) 4 4 0.0 6 (33.3)Total 294 312 (5.8) 309 (4.9) 36 10 260.0 14 157.1
Group productsJapan 6 3 100.0 4 50.0 - - NM - NMChina 6 3 100.0 3 100.0 - - NM - NMTaiwan 5 3 66.7 4 25.0 2 1 100.0 1 100.0Other Asia 32 19 68.4 23 39.1 20 16 25.0 23 (13.0)Europe 27 20 35.0 23 17.4 242 161 50.3 154 57.1All other regions 183 134 36.6 148 23.6 91 37 145.9 78 16.7Total 259 182 42.3 205 26.3 355 215 65.1 256 38.7
Total premiumsJapan 310 367 (15.5) 314 (1.3) 394 347 13.5 471 (16.3)China 40 38 5.3 46 (13.0) 101 66 53.0 107 (5.6)Taiwan 188 209 (10.0) 186 1.1 184 195 (5.6) 208 (11.5)Other Asia 492 424 16.0 560 (12.1) 672 386 74.1 978 (31.3)Europe 94 75 25.3 94 0.0 2,427 1,580 53.6 3,868 (37.3)All other regions 236 181 30.4 206 14.6 135 71 90.1 154 (12.3)Total (10) $ 1,360 $ 1,294 5.1 % $ 1,406 (3.3) % $ 3,913 $ 2,645 47.9 % $ 5,786 (32.4) %
(See Accompanying Notes on Pages 51 - 52)
% ChgSequential
% Chg
American International Group, Inc.Foreign Life Insurance & Retirement Services Premium Statistics
(dollars in millions)
Sequential
44

March 31, March 31, Dec. 31,2008 2007 % Chg 2007
Life insuranceLife insurance
Japan $ 1,765 $ 1,661 6.3 % $ 1,779 (0.8) %China 261 201 29.9 300 (13.0)Taiwan 1,929 2,399 (19.6) 1,449 33.1Other Asia 2,826 2,375 19.0 3,441 (17.9)Europe 2,460 1,641 49.9 3,976 (38.1)All other regions 211 177 19.2 243 (13.2) Total 9,452 8,454 11.8 11,188 (15.5)
Personal accident & healthJapan 1,033 889 16.2 967 6.8China 34 27 25.9 34 0.0Taiwan 194 175 10.9 157 23.6Other Asia 311 261 19.2 316 (1.6)Europe 108 91 18.7 108 0.0All other regions 48 38 26.3 50 (4.0) Total 1,728 1,481 16.7 1,632 5.9
Group productsJapan 134 123 8.9 117 14.5China 11 3 266.7 4 175.0Taiwan 27 26 3.8 26 3.8Other Asia 201 147 36.7 123 63.4Europe 529 389 36.0 371 42.6All other regions 611 425 43.8 462 32.3 Total 1,513 1,113 35.9 1,103 37.2
Total life insuranceJapan 2,932 2,673 9.7 2,863 2.4China 306 231 32.5 338 (9.5)Taiwan 2,150 2,600 (17.3) 1,632 31.7Other Asia 3,338 2,783 19.9 3,880 (14.0)Europe 3,097 2,121 46.0 4,455 (30.5)All other regions 870 640 35.9 755 15.2 Total 12,693 11,048 14.9 13,923 (8.8)
Retirement servicesIndividual fixed annuities
Japan 1,239 919 34.8 1,271 (2.5)Korea 166 114 45.6 78 112.8Other Asia 24 13 84.6 29 (17.2)Europe 98 64 53.1 89 10.1All other regions 14 7 100.0 15 (6.7) Total 1,541 1,117 38.0 1,482 4.0
Individual variable annuitiesJapan 244 274 (10.9) 257 (5.1)Korea - - NM - NMOther Asia 142 5 NM 16 NMEurope 3,912 2,806 39.4 3,325 17.7All other regions - - NM - NM Total 4,298 3,085 39.3 3,598 19.5
Total retirement servicesJapan 1,483 1,193 24.3 1,528 (2.9)Korea 166 114 45.6 78 112.8Other Asia 166 18 NM 45 268.9Europe 4,010 2,870 39.7 3,414 17.5All other regions 14 7 100.0 15 (6.7) Total (10) 5,839 4,202 39.0 5,080 14.9
Total premiums, deposits andother considerations $ 18,532 $ 15,250 21.5 % $ 19,003 (2.5) %
(See Accompanying Notes on Pages 51 - 52)
% Chg
Three Months Ended
American International Group, Inc.Foreign Life Insurance & Retirement ServicesPremiums, Deposits and Other Considerations
(dollars in millions)
Sequential
45
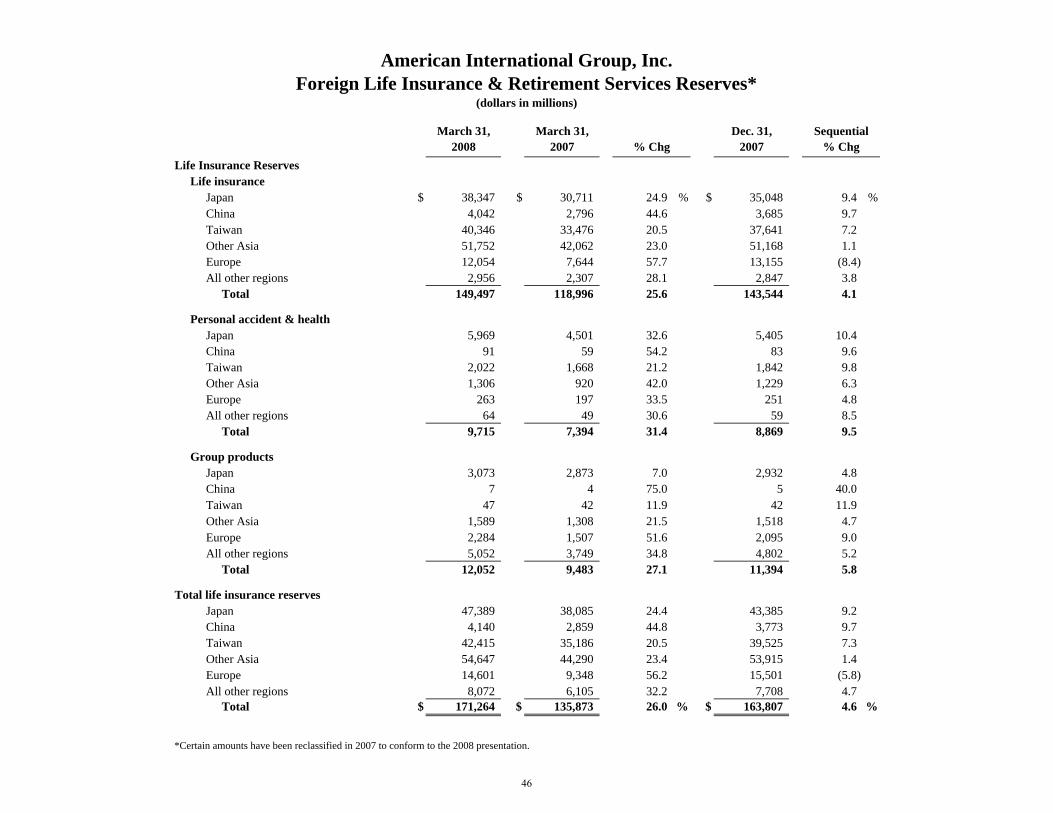
American International Group, Inc.Foreign Life Insurance & Retirement Services Reserves*
(dollars in millions)
March 31, March 31, Dec. 31,2008 2007 2007
Life Insurance Reserves Life insurance
Japan $ 38,347 $ 30,711 24.9 % $ 35,048 9.4 %China 4,042 2,796 44.6 3,685 9.7Taiwan 40,346 33,476 20.5 37,641 7.2Other Asia 51,752 42,062 23.0 51,168 1.1Europe 12,054 7,644 57.7 13,155 (8.4)All other regions 2,956 2,307 28.1 2,847 3.8
Total 149,497 118,996 25.6 143,544 4.1
Personal accident & healthJapan 5,969 4,501 32.6 5,405 10.4China 91 59 54.2 83 9.6Taiwan 2,022 1,668 21.2 1,842 9.8Other Asia 1,306 920 42.0 1,229 6.3Europe 263 197 33.5 251 4.8All other regions 64 49 30.6 59 8.5
Total 9,715 7,394 31.4 8,869 9.5
Group productsJapan 3,073 2,873 7.0 2,932 4.8China 7 4 75.0 5 40.0Taiwan 47 42 11.9 42 11.9Other Asia 1,589 1,308 21.5 1,518 4.7Europe 2,284 1,507 51.6 2,095 9.0All other regions 5,052 3,749 34.8 4,802 5.2
Total 12,052 9,483 27.1 11,394 5.8
Total life insurance reservesJapan 47,389 38,085 24.4 43,385 9.2China 4,140 2,859 44.8 3,773 9.7Taiwan 42,415 35,186 20.5 39,525 7.3Other Asia 54,647 44,290 23.4 53,915 1.4Europe 14,601 9,348 56.2 15,501 (5.8)All other regions 8,072 6,105 32.2 7,708 4.7
Total $ 171,264 $ 135,873 26.0 % $ 163,807 4.6 %
*Certain amounts have been reclassified in 2007 to conform to the 2008 presentation.
% ChgSequential
% Chg
46

American International Group, Inc.Foreign Life Insurance & Retirement Services Reserves (continued)*
(dollars in millions)
March 31, March 31, Dec. 31,2008 2007 2007
Retirement Services Reserves Individual fixed annuities
Japan $ 46,338 $ 41,560 11.5 % $ 44,666 3.7 %Korea 2,127 1,761 20.8 2,079 2.3Other Asia 449 366 22.7 428 4.9Europe 2,023 1,765 14.6 2,015 0.4All other regions 679 342 98.5 388 75.0
Total 51,616 45,794 12.7 49,576 4.1
Individual variable annuitiesJapan 6,235 5,370 16.1 6,149 1.4Other Asia 295 77 283.1 131 125.2Europe 22,210 20,106 10.5 21,938 1.2All other regions - - NM - NM
Total 28,740 25,553 12.5 28,218 1.8
Policy and Contract Claims Reserves Personal accident & health
Japan 290 239 21.3 279 3.9China 7 5 40.0 7 0.0Taiwan 69 54 27.8 64 7.8Other Asia 115 98 17.3 99 16.2Europe 86 79 8.9 89 (3.4)All other regions 40 39 2.6 32 25.0
Total 607 514 18.1 570 6.5
Group accident & healthJapan - 1 NM - NMTaiwan 4 4 0.0 5 (20.0)Other Asia 22 17 29.4 20 10.0Europe 10 5 100.0 7 42.9All other regions 92 76 21.1 87 5.7
Total $ 128 $ 103 24.3 % $ 119 7.6 %
*Certain amounts have been reclassified in 2007 to conform to the 2008 presentation.
% Chg% ChgSequential
47
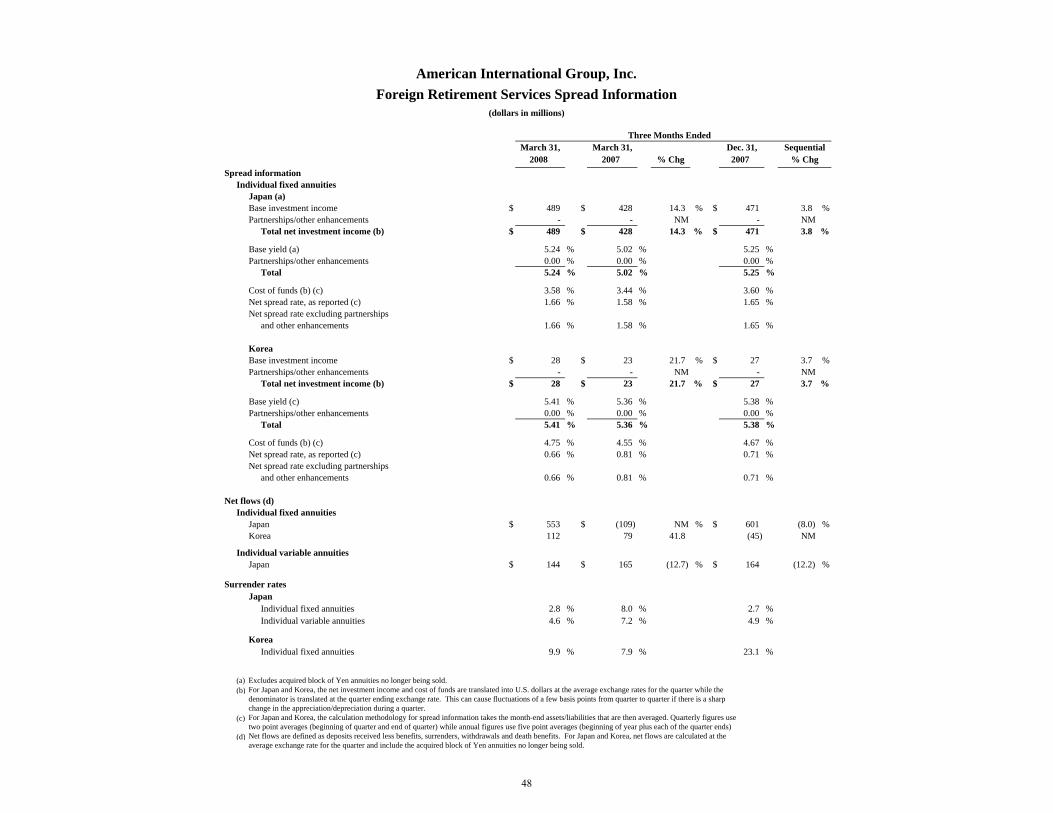
American International Group, Inc.Foreign Retirement Services Spread Information
(dollars in millions)
Three Months EndedMarch 31, March 31, Dec. 31, Sequential
2008 2007 % Chg 2007 % ChgSpread information
Individual fixed annuitiesJapan (a)Base investment income $ 489 $ 428 14.3 % $ 471 3.8 %Partnerships/other enhancements - - NM - NM
Total net investment income (b) $ 489 $ 428 14.3 % $ 471 3.8 %
Base yield (a) 5.24 % 5.02 % 5.25 %Partnerships/other enhancements 0.00 % 0.00 % 0.00 %
Total 5.24 % 5.02 % 5.25 %
Cost of funds (b) (c) 3.58 % 3.44 % 3.60 %Net spread rate, as reported (c) 1.66 % 1.58 % 1.65 %Net spread rate excluding partnerships
and other enhancements 1.66 % 1.58 % 1.65 %
KoreaBase investment income $ 28 $ 23 21.7 % $ 27 3.7 %Partnerships/other enhancements - - NM - NM
Total net investment income (b) $ 28 $ 23 21.7 % $ 27 3.7 %
Base yield (c) 5.41 % 5.36 % 5.38 %Partnerships/other enhancements 0.00 % 0.00 % 0.00 %
Total 5.41 % 5.36 % 5.38 %
Cost of funds (b) (c) 4.75 % 4.55 % 4.67 %Net spread rate, as reported (c) 0.66 % 0.81 % 0.71 %Net spread rate excluding partnerships
and other enhancements 0.66 % 0.81 % 0.71 %
Net flows (d)Individual fixed annuities
Japan $ 553 $ (109) NM % $ 601 (8.0) %Korea 112 79 41.8 (45) NM
Individual variable annuitiesJapan $ 144 $ 165 (12.7) % $ 164 (12.2) %
Surrender ratesJapan
Individual fixed annuities 2.8 % 8.0 % 2.7 %Individual variable annuities 4.6 % 7.2 % 4.9 %
KoreaIndividual fixed annuities 9.9 % 7.9 % 23.1 %
(a) Excludes acquired block of Yen annuities no longer being sold.(b) For Japan and Korea, the net investment income and cost of funds are translated into U.S. dollars at the average exchange rates for the quarter while the
denominator is translated at the quarter ending exchange rate. This can cause fluctuations of a few basis points from quarter to quarter if there is a sharpchange in the appreciation/depreciation during a quarter.
(c) For Japan and Korea, the calculation methodology for spread information takes the month-end assets/liabilities that are then averaged. Quarterly figures usetwo point averages (beginning of quarter and end of quarter) while annual figures use five point averages (beginning of year plus each of the quarter ends)
(d) Net flows are defined as deposits received less benefits, surrenders, withdrawals and death benefits. For Japan and Korea, net flows are calculated at theaverage exchange rate for the quarter and include the acquired block of Yen annuities no longer being sold.
48

March 31, March 31, Dec. 31, Sequential2008 2007 % chg 2007 % chg
Life insuranceBalance at beginning of period $ 18,198 $ 14,519 25.3 % $ 16,041 13.4 %Acquisition costs deferred 781 746 4.7 1,132 (31.0)Amortization (charged) or credited to operating income:
Related to net realized capital gains (losses) 7 (1) NM (3) NMRelated to unlocking future assumptions (8) 11 NM (85) NMAll other amortization (11) (525) (363) NM 605 NM
Change in unrealized gains (losses) on securities (42) (5) NM 28 NMIncrease due to foreign exchange 640 (99) NM 416 53.8Other (12) (1,461) (6) NM 64 NMBalance at end of period 17,590 14,802 18.8 18,198 (3.3)
Personal accident & healthBalance at beginning of period 5,601 4,769 17.4 5,272 6.2Acquisition costs deferred 341 385 (11.4) 330 3.3Amortization (charged) or credited to operating income:
Related to net realized capital gains (losses) - - NM - NMRelated to unlocking future assumptions - - NM - NMAll other amortization (228) (176) NM (211) NM
Increase (decrease) due to foreign exchange 279 (102) NM 210 32.9Other (12) 17 - NM - NMBalance at end of period 6,010 4,876 23.3 5,601 7.3
Group productsBalance at beginning of period 474 200 137.0 393 20.6Acquisition costs deferred 107 13 NM 145 (26.2)Amortization (charged) or credited to operating income:
Related to net realized capital gains (losses) - - NM - NMRelated to unlocking future assumptions - - NM - NMAll other amortization (11) (54) (18) NM (102) NM
Change in unrealized gains (losses) on securities - - NM - NMIncrease due to foreign exchange 26 (2) NM 40 (35.0)Other (12) - (54) NM (2) NMBalance at end of period $ 553 $ 139 297.8 % $ 474 16.7 %
(See Accompanying Notes on Pages 51 - 52)
American International Group, Inc.Foreign Life Insurance & Retirement Services
Deferred Policy Acquisition Costs, Sales Inducements and Value of Business Acquired(dollars in millions)
Three Months Ended
49

March 31, March 31, Dec. 31, Sequential2008 2007 % chg 2007 % chg
Individual fixed annuitiesBalance at beginning of period $ 1,954 $ 1,564 24.9 % $ 2,124 (8.0) %Acquisition costs deferred 87 60 45.0 88 (1.1)Amortization (charged) or credited to operating income:
Related to net realized capital gains (losses) 6 21 (71.4) 77 (92.2)Related to unlocking future assumptions 2 - NM 9 (77.8)All other amortization (89) (84) NM (79) NM
Change in unrealized gains (losses) on securities (45) (7) NM (282) NMIncrease due to foreign exchange 12 25 (52.0) 18 (33.3)Other (12) - - NM (1) NMBalance at end of period 1,927 1,579 22.0 1,954 (1.4)
Individual variable annuitiesBalance at beginning of period 629 505 24.6 589 6.8Acquisition costs deferred 61 45 35.6 40 52.5Amortization (charged) or credited to operating income:
Related to net realized capital gains (losses) - - NM - NMRelated to unlocking future assumptions - - NM - NMAll other amortization (37) (16) NM (28) NM
Change in unrealized gains (losses) on securities - - NM - NMIncrease due to foreign exchange 23 (7) NM 28 (17.9)Other - - NM - NMBalance at end of period 676 527 28.3 629 7.5
TotalBalance at beginning of period 26,856 21,557 24.6 24,419 10.0Acquisition costs deferred 1,377 1,249 10.2 1,735 (20.6)Amortization (charged) or credited to operating income:
Related to net realized capital gains (losses) 13 20 (35.0) 74 (82.4)Related to unlocking future assumptions (6) 11 NM (76) NMAll other amortization (933) (657) NM 185 NM
Change in unrealized gains (losses) on securities (87) (12) NM (254) NMIncrease due to foreign exchange 980 (185) NM 712 37.6Other (12) (1,444) (60) NM 61 NMBalance at end of period $ 26,756 $ 21,923 22.0 % $ 26,856 (0.4) %
(See Accompanying Notes on Pages 51 - 52)
(dollars in millions)
Three Months Ended
American International Group, Inc.Foreign Life Insurance & Retirement Services
Deferred Policy Acquisition Costs, Sales Inducements and Value of Business Acquired (continued)
50
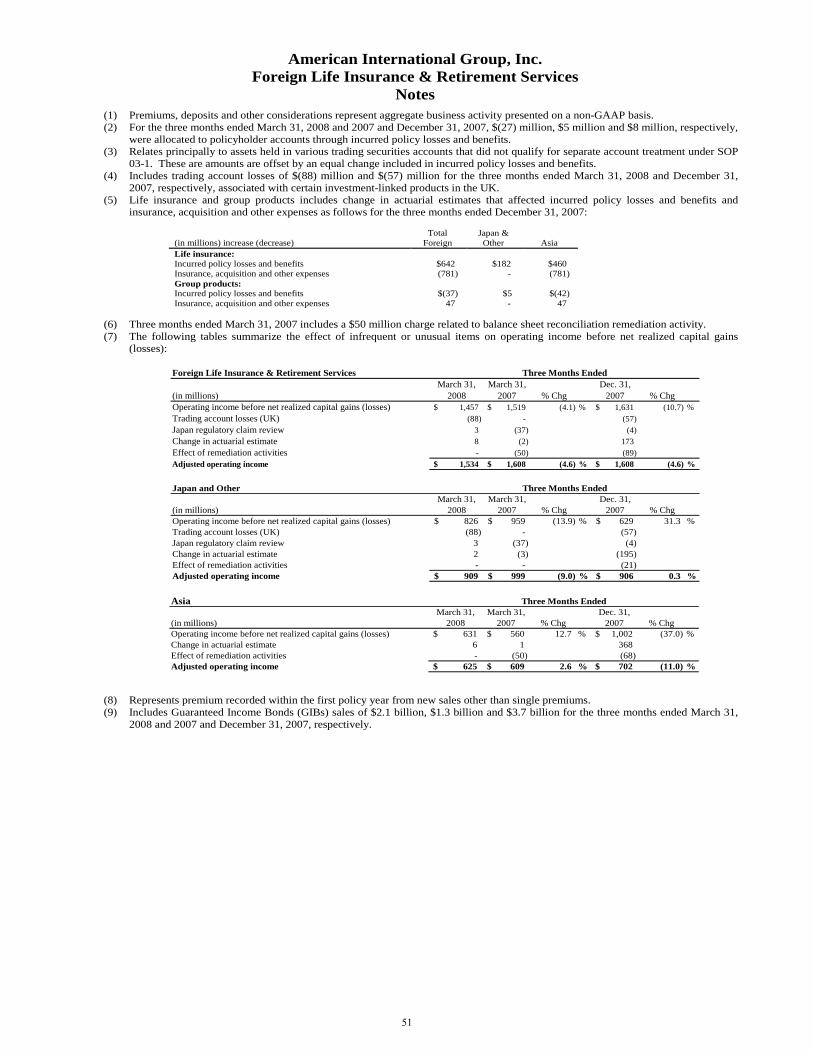
American International Group, Inc. Foreign Life Insurance & Retirement Services
Notes
(1) Premiums, deposits and other considerations represent aggregate business activity presented on a non-GAAP basis. (2) For the three months ended March 31, 2008 and 2007 and December 31, 2007, $(27) million, $5 million and $8 million, respectively,
were allocated to policyholder accounts through incurred policy losses and benefits. (3) Relates principally to assets held in various trading securities accounts that did not qualify for separate account treatment under SOP
03-1. These are amounts are offset by an equal change included in incurred policy losses and benefits. (4) Includes trading account losses of $(88) million and $(57) million for the three months ended March 31, 2008 and December 31,
2007, respectively, associated with certain investment-linked products in the UK. (5) Life insurance and group products includes change in actuarial estimates that affected incurred policy losses and benefits and
insurance, acquisition and other expenses as follows for the three months ended December 31, 2007:
(in millions) increase (decrease) Total
Foreign
Japan &
Other Asia Life insurance: Incurred policy losses and benefits $642 $182 $460 Insurance, acquisition and other expenses (781) - (781) Group products: Incurred policy losses and benefits $(37) $5 $(42) Insurance, acquisition and other expenses 47 - 47
(6) Three months ended March 31, 2007 includes a $50 million charge related to balance sheet reconciliation remediation activity. (7) The following tables summarize the effect of infrequent or unusual items on operating income before net realized capital gains
(losses):
Foreign Life Insurance & Retirement ServicesMarch 31, March 31, Dec. 31,
(in millions) 2008 2007 % Chg 2007 % ChgOperating income before net realized capital gains (losses) 1,457$ 1,519$ (4.1) % 1,631$ (10.7) %Trading account losses (UK) (88) - (57) Japan regulatory claim review 3 (37) (4) Change in actuarial estimate 8 (2) 173 Effect of remediation activities - (50) (89) Adjusted operating income 1,534$ 1,608$ (4.6) % 1,608$ (4.6) %
Three Months Ended
Japan and OtherMarch 31, March 31, Dec. 31,
(in millions) 2008 2007 % Chg 2007 % ChgOperating income before net realized capital gains (losses) 826$ 959$ (13.9) % 629$ 31.3 %Trading account losses (UK) (88) - (57) Japan regulatory claim review 3 (37) (4) Change in actuarial estimate 2 (3) (195) Effect of remediation activities - - (21) Adjusted operating income 909$ 999$ (9.0) % 906$ 0.3 %
Three Months Ended
AsiaMarch 31, March 31, Dec. 31,
(in millions) 2008 2007 % Chg 2007 % ChgOperating income before net realized capital gains (losses) 631$ 560$ 12.7 % 1,002$ (37.0) %Change in actuarial estimate 6 1 368 Effect of remediation activities - (50) (68) Adjusted operating income 625$ 609$ 2.6 % 702$ (11.0) %
Three Months Ended
(8) Represents premium recorded within the first policy year from new sales other than single premiums. (9) Includes Guaranteed Income Bonds (GIBs) sales of $2.1 billion, $1.3 billion and $3.7 billion for the three months ended March 31,
2008 and 2007 and December 31, 2007, respectively.
51

American International Group, Inc. Foreign Life Insurance & Retirement Services
Notes (continued)
(10) The following tables reflect first year premiums, single premiums and annuity deposits by reporting segment with growth rates presented in US dollars and original currency.
Foreign Life Insurance & Retirement Services Three Months Ended Percentage (in millions) March 31, Increase/(Decrease) 2008 2007 US$
Original Currency
First year premiums $1,360 $1,294 5% (1)% Single premiums 3,913 2,645 48 44 Annuity deposits 5,839 4,202 39 37
Japan & Other Three Months Ended Percentage (in millions) March 31, Increase/(Decrease)
2008 2007 US$ Original
Currency First year premiums $642 $620 4% (6)% Single premiums 2,956 1,997 48 44 Annuity deposits 5,507 4,071 35 33
Asia Three Months Ended Percentage (in millions) March 31, Increase/(Decrease)
2008 2007 US$ Original
Currency First year premiums $718 $674 7% 4% Single premiums 957 648 48 42 Annuity deposits 332 131 153 150
(11) For the three months ended December 31, 2007, all other amortization for DAC and VOBA includes $864 million and $(47) million
related to changes in actuarial estimates for Life Insurance and Group Products, respectively. (12) For the three months ended March 31, 2008, Other represents the cumulative effect of adoption of FAS 159. For the three months
ended March 31, 2007, Other primarily represents the cumulative effect of adoption of SOP 05-1. For the three months ended December 31, 2007, Other is primarily related to balance sheet reclassifications.
52

American International Group, Inc.Life Insurance & Retirement Services Partnership Income
(dollars in millions)
Three Months EndedMarch 31, March 31, Dec. 31, Sequential
2008 2007 % chg 2007 % chgForeign life insurance & retirement services:
Life insurance $ 2 $ 37 (94.6) % $ 32 (93.8) %Personal accident & health (2) 7 NM 3 NMGroup Products - - NM - NMIndividual fixed annuities 2 4 (50.0) 7 (71.4)
Total 2 48 (95.8) 42 (95.2)
Domestic life insurance:Excluding Synfuels:Life insurance 28 23 21.7 9 211.1
Home service 3 4 (25.0) 1 200.0Subtotal excluding Synfuels 31 27 14.8 10 210.0
Synfuels *:Life insurance (2) (22) NM 1 NM
Home service (2) (11) NM (1) NMSubtotal Synfuels (4) (33) NM - NM
Total 27 (6) NM 10 170.0
Domestic retirement services:Group retirement products 13 49 (73.5) 40 (67.5)Individual fixed annuities 1 81 (98.8) 137 (99.3)Individual variable annuities (3) - NM 6 NM
Total 11 130 (91.5) 183 (94.0)
Total life insurance & retirement services $ 40 $ 172 (76.7) % $ 235 (83.0) %
* Investment in certain limited liability companies that invest in synthetic fuel production facilities as a means of generating income tax credits.
53
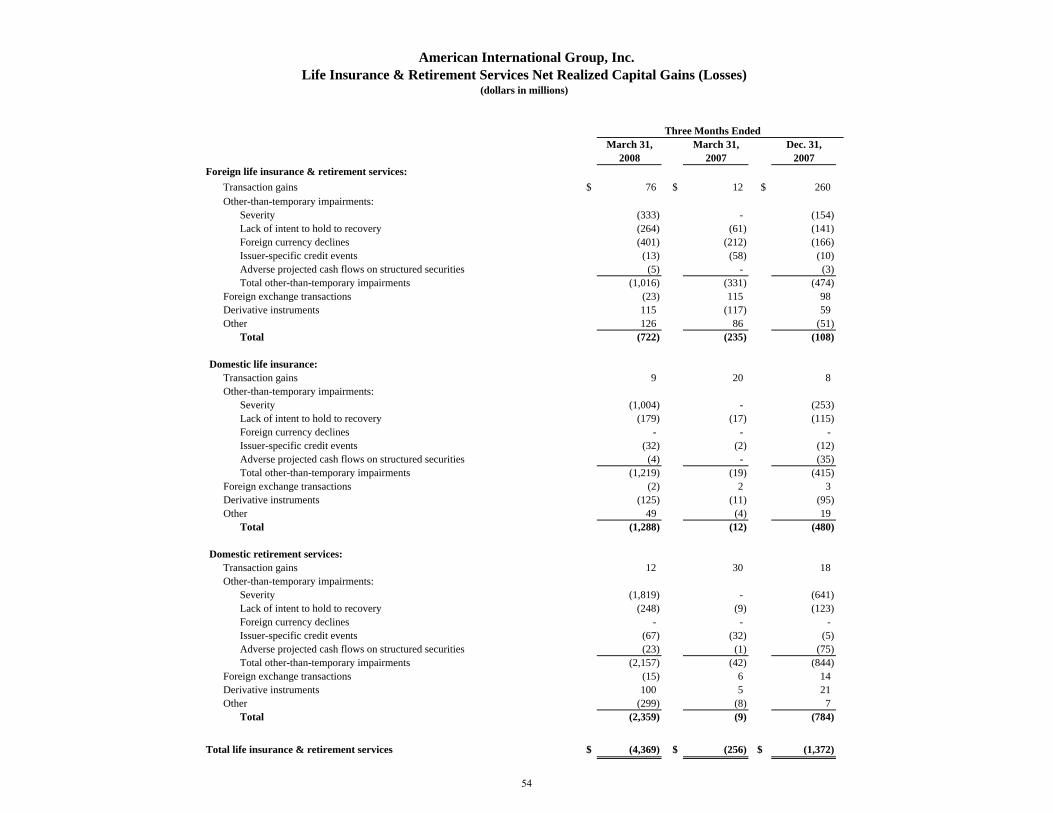
Three Months EndedMarch 31, March 31, Dec. 31,
2008 2007 2007Foreign life insurance & retirement services:
Transaction gains $ 76 $ 12 $ 260 Other-than-temporary impairments:
Severity (333) - (154) Lack of intent to hold to recovery (264) (61) (141) Foreign currency declines (401) (212) (166) Issuer-specific credit events (13) (58) (10) Adverse projected cash flows on structured securities (5) - (3) Total other-than-temporary impairments (1,016) (331) (474)
Foreign exchange transactions (23) 115 98 Derivative instruments 115 (117) 59 Other 126 86 (51)
Total (722) (235) (108)
Domestic life insurance:Transaction gains 9 20 8 Other-than-temporary impairments:
Severity (1,004) - (253) Lack of intent to hold to recovery (179) (17) (115) Foreign currency declines - - - Issuer-specific credit events (32) (2) (12) Adverse projected cash flows on structured securities (4) - (35) Total other-than-temporary impairments (1,219) (19) (415)
Foreign exchange transactions (2) 2 3 Derivative instruments (125) (11) (95) Other 49 (4) 19
Total (1,288) (12) (480)
Domestic retirement services:Transaction gains 12 30 18 Other-than-temporary impairments:
Severity (1,819) - (641) Lack of intent to hold to recovery (248) (9) (123) Foreign currency declines - - - Issuer-specific credit events (67) (32) (5) Adverse projected cash flows on structured securities (23) (1) (75) Total other-than-temporary impairments (2,157) (42) (844)
Foreign exchange transactions (15) 6 14 Derivative instruments 100 5 21 Other (299) (8) 7
Total (2,359) (9) (784)
Total life insurance & retirement services $ (4,369) $ (256) $ (1,372)
Life Insurance & Retirement Services Net Realized Capital Gains (Losses)American International Group, Inc.
(dollars in millions)
54

American International Group, Inc.Life Insurance & Retirement Services Statutory Surplus and Net Income
(dollars in millions)
Domestic IntercompanyJapan Domestic Life Retirement Consolidations/
and Other (a) (b) (c) Asia (c) (d) Insurance (e) (f) Services (e) (g) Eliminations Total2007Statutory Surplus $ 10,655 $ 10,968 $ 6,102 $ 11,078 $ (5,591) $ 33,212 Statutory Net Income 1,502 1,864 517 545 37 4,465
2006Statutory Surplus 8,648 13,332 5,390 11,916 (4,228) 35,058 Statutory Net Income 1,483 1,093 902 1,569 41 5,088
2005Statutory Surplus 7,390 10,266 5,301 11,101 (3,319) 30,739 Statutory Net Income $ 1,200 $ 1,212 $ 943 $ 1,416 $ (9) $ 4,762
Note: (a) Includes the life operations of American Life Insurance Company (ALICO), AIG Star Life Insurance Company and AIG Edison Life Insurance Company.(b) Net income for ALICO includes subsidiaries presented on a consolidated basis.(c) Estimated regulatory surplus and net income as of November 30th.(d) Includes American International Assurance Company, Limited together with American International Assurance Company (Bermuda), Limited (AIA), American International
Reinsurance Company Limited, Nan Shan Life Insurance Company, Limited and The Philippine American Life and General Insurance Company.(e) For U.S. domestic entities, fiscal period ends December 31st.(f) Includes the life operations of American General Life Insurance Company, American General Life and Accident Insurance Company, AIG Life Insurance Company, American
International Life Assurance Company of New York, Delaware American Life Insurance Company and Pacific Union Assurance Company.(g) Includes the life operations of AIG Annuity Insurance Company, The Variable Annuity Life Insurance Company, SunAmerica Life Insurance Company and AIG SunAmerica
Life Assurance Company.
55

March 31, March 31, Dec. 31, Sequential2008 2007 % Chg 2007 % Chg
Revenues:
Aircraft Leasing $ 1,216 $ 1,087 11.9 % $ 1,226 (0.8) %
Capital Markets:
Excluding Unrealized Market Valuation Losses (1) 440 313 40.6 687 (36.0)
Unrealized Market Valuation Losses - Capital Markets (2) (9,107) - NM (11,120) NM
Subtotal (8,667) 313 NM (10,433) NMConsumer Finance (3) 1,007 883 14.0 961 4.8
Other, including intercompany adjustments 111 70 58.6 105 5.7
Total revenues excluding FAS 133, Capital Marketsother-than-temporary impairments and net realized capital gains (losses) (6,333) 2,353 NM (8,141) NM
FAS 133 - Capital Markets (4) (5) (76) (85) NM 396 NM
Capital Markets other-than-temporary impairments (6) - - NM (643) NM
Net realized capital gains (losses) (7) (151) (67) NM (30) NMTotal revenues $ (6,560) $ 2,201 NM % $ (8,418) NM %
Operating income (loss):
Aircraft Leasing $ 272 $ 193 40.9 % $ 248 9.7 %
Capital Markets:
Excluding Unrealized Market Valuation Losses (1) 256 153 67.3 627 (59.2)
Unrealized Market Valuation Losses (2) (9,107) - NM (11,120) NM
Subtotal (8,851) 153 NM (10,493) NM
Consumer Finance (3) 24 74 (67.6) (7) NMOther, including intercompany adjustments 10 24 (58.3) 6 66.7
Total operating income (loss) excluding FAS 133,Capital Markets other-than-temporary impairmentsand net realized capital gains (losses) (8,545) 444 NM (10,246) NM
FAS 133 - Capital Markets (4) (5) (76) (85) NM 396 NM
Capital Markets other-than-temporary impairments (6) - - NM (643) NMNet realized capital gains (losses) (7) (151) (67) NM (30) NMTotal operating income (loss) $ (8,772) $ 292 NM % $ (10,523) NM %
(See Accompanying Notes on Page 60)
American International Group, Inc.Financial Services Operating Statistics
(dollars in millions)
Three Months Ended
56

Aircraft Type: In Fleet (8) Orders Orders 2008 2009 2010 2011-2017
Airbus:A300-600R 6 0 0 0 0 0 0A310-300 7 0 0 0 0 0 0A319 121 16 16 7 8 1 0A320-200 153 31 31 15 13 3 0A321-100 12 0 0 0 0 0 0A321-200 62 12 12 4 7 1 0A330-200 58 6 6 1 5 0 0A330-300 26 3 3 3 0 0 0A340-300 15 0 0 0 0 0 0A340-600 13 0 0 0 0 0 0A350-800 0 12 12 0 0 0 12A350-900 0 8 8 0 0 0 8A380 (9) 0 10 10 0 0 0 10
473 98 98 30 33 5 30
Boeing:737-300/400/500 56 0 0 0 0 0 0737-600/700/800 185 34 34 18 6 0 10747-200F 1 0 0 0 0 0 0747-300 2 0 0 0 0 0 0747-400 13 0 0 0 0 0 0747-400ERF 4 0 0 0 0 0 0757-200 64 0 0 0 0 0 0767-200 3 0 0 0 0 0 0767-300 51 0 0 0 0 0 0777-200B 39 0 0 0 0 0 0777-300 30 5 5 2 3 0 0787-800 (10) 0 67 67 0 0 10 57787-900 0 7 7 0 0 0 7
448 113 113 20 9 10 74
McDonnell Douglas:MD-11 8 0 0 0 0 0 0MD-83 1 0 0 0 0 0 0
9 0 0 0 0 0 0Total 930 211 211 50 42 15 104
Orders Placed 100% 88% 80%
(See Accompanying Notes on Page 60)
Year of Delivery
American International Group, Inc.International Lease Finance Corporation (ILFC)
Aircraft Leases and Orders March 31, 2008
Number of Aircraft
57

March 31, March 31, Dec. 31, Sequential2008 2007 % Chg 2007 % Chg
Revenues:
American General Finance (3) $ 757 $ 703 7.7 % $ 732 3.4 %
AIG Consumer Finance Group, Inc. 236 165 43.0 214 10.3AIG Federal Savings Bank 14 15 (6.7) 15 (6.7)
Total revenues excluding net realized capital gains (losses) 1,007 883 14.0 961 4.8
Net realized capital gains (losses) (11) (76) (38) NM (2) NMTotal revenues $ 931 $ 845 10.2 % $ 959 (2.9) %
Operating income (loss):
American General Finance (3) $ 11 $ 50 (78.0) % $ 9 22.2 %
AIG Consumer Finance Group, Inc. 11 21 (47.6) (18) NM
AIG Federal Savings Bank 2 3 (33.3) 2 0.0
Total operating income (loss) excluding net realized capital gains (losses) 24 74 (67.6) (7) NM
Net realized capital gains (losses) (11) (76) (38) NM (2) NMTotal operating income (loss) $ (52) $ 36 NM % $ (9) NM %
(See Accompanying Notes on Page 60)
American International Group, Inc.Consumer Finance Operating Statistics
(dollars in millions)
Three Months Ended
58
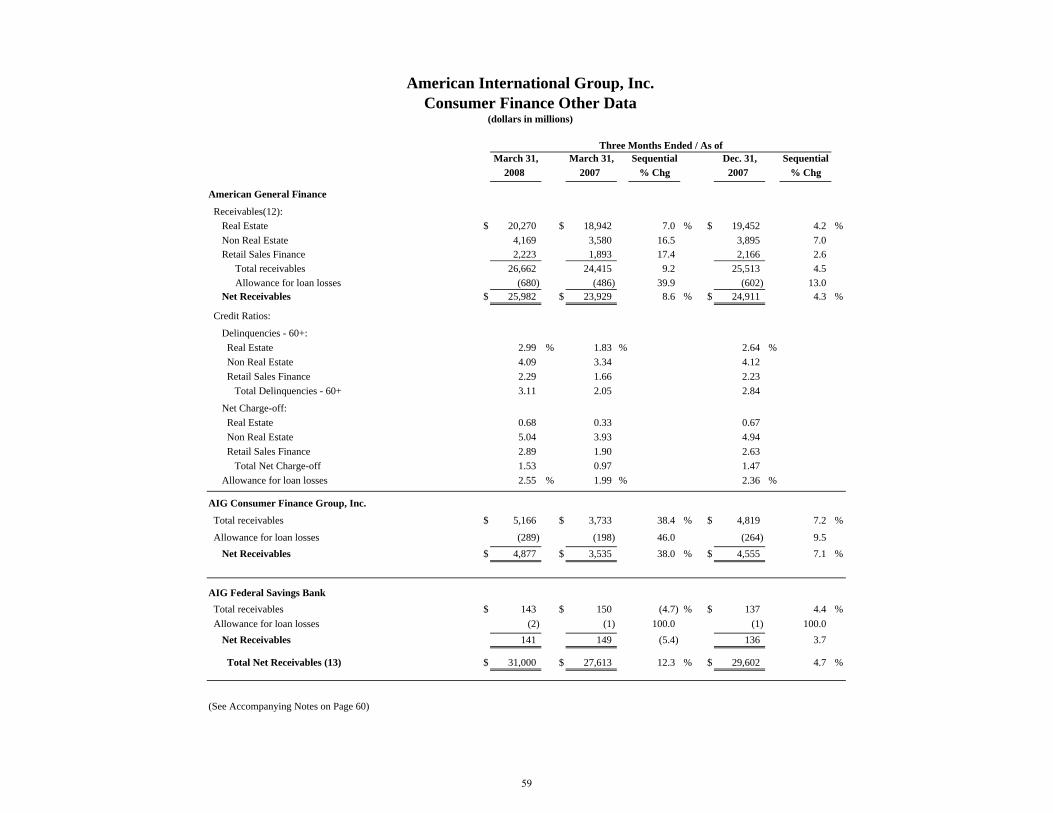
March 31, March 31, Sequential Dec. 31, Sequential2008 2007 % Chg 2007 % Chg
American General Finance
Receivables(12):Real Estate $ 20,270 $ 18,942 7.0 % $ 19,452 4.2 %Non Real Estate 4,169 3,580 16.5 3,895 7.0Retail Sales Finance 2,223 1,893 17.4 2,166 2.6
Total receivables 26,662 24,415 9.2 25,513 4.5Allowance for loan losses (680) (486) 39.9 (602) 13.0
Net Receivables $ 25,982 $ 23,929 8.6 % $ 24,911 4.3 %
Credit Ratios:
Delinquencies - 60+: Real Estate 2.99 % 1.83 % 2.64 % Non Real Estate 4.09 3.34 4.12 Retail Sales Finance 2.29 1.66 2.23 Total Delinquencies - 60+ 3.11 2.05 2.84
Net Charge-off: Real Estate 0.68 0.33 0.67 Non Real Estate 5.04 3.93 4.94 Retail Sales Finance 2.89 1.90 2.63 Total Net Charge-off 1.53 0.97 1.47Allowance for loan losses 2.55 % 1.99 % 2.36 %
AIG Consumer Finance Group, Inc.
Total receivables $ 5,166 $ 3,733 38.4 % $ 4,819 7.2 %
Allowance for loan losses (289) (198) 46.0 (264) 9.5Net Receivables $ 4,877 $ 3,535 38.0 % $ 4,555 7.1 %
AIG Federal Savings Bank Total receivables $ 143 $ 150 (4.7) % $ 137 4.4 % Allowance for loan losses (2) (1) 100.0 (1) 100.0
Net Receivables 141 149 (5.4) 136 3.7
Total Net Receivables (13) $ 31,000 $ 27,613 12.3 % $ 29,602 4.7 %
(See Accompanying Notes on Page 60)
American International Group, Inc.Consumer Finance Other Data
(dollars in millions)
Three Months Ended / As of
59

American International Group, Inc. Financial Services
Notes
(1) Includes net unrealized market valuation gains of $130 million and $270 million for the three months ended March 31, 2008 and December 31, 2007, respectively, related to certain credit default swaps and embedded credit derivatives in credit-linked notes.
(2) Includes unrealized market valuation losses on Capital Markets’ super senior credit default swap portfolio. (3) The three months ended March 31, 2007 includes a pre-tax charge of $128 million in connection with domestic
consumer finance’s mortgage banking activities and a recovery of $65 million from a favorable out of court settlement. (4) Includes the gains (losses) from hedging activities that did not qualify for hedge accounting treatment under FAS 133,
including the related foreign exchange gains and losses. These amounts result primarily from interest rate and foreign currency derivatives that are effective economic hedges of borrowings.
(5) The three months ended December 31, 2007 includes an out of period charge of $51 million. (6) Represents an other-than-temporary impairment charge on Capital Markets’ available for sale investment securities.
These amounts are reported in other income on AIG’s consolidated statement of income and are excluded from adjusted net income (loss) on AIG’s consolidated statement of segment operations.
(7) Net realized capital gains (losses) are as follows;
Three Months Ended (in millions) March 31, 2008 March 31, 2007 Dec. 31, 2007 Aircraft Leasing $(51) $(29) $- Consumer Finance (76) (38) (2) Other (24) - (28) Total $(151) $(67) $(30)
These amounts result primarily from the effect of hedging activities that did not qualify for hedge accounting treatment under FAS 133, including the related foreign exchange gains and losses. In second quarter 2007, AGF and ILFC began applying hedge accounting to most of their derivatives hedging interest rate and foreign exchange risks associated with their floating rate and foreign currency denominated borrowings.
(8) In fleet includes 9 finance leases. (9) ILFC has a cancellation option in 2010 on the 10 A380 firm orders. (10) Subsequent to March 31, 2008, Boeing informed ILFC that the original 787 deliveries running from 2010 – 2017
would be delayed by an average in excess of 27 months per aircraft. (11) Includes the effect of hedging activities that did not qualify for hedge accounting treatment under FAS 133, including
the related foreign exchange gains and losses. For the three months ended March 31, 2008 and 2007 and December 31, 2007, the effect was $(46) million, $(36) million and $1 million, respectively. The amounts result primarily from interest rate and foreign currency derivatives that are effective economic hedges of borrowings. In second quarter 2007, AGF began applying hedge accounting to most of their derivatives hedging interest rate and foreign exchange risks associated their floating rate and foreign currency denominated borrowings.
(12) Effective February 29, 2008, AGF purchased a portion of Equity One, Inc.’s consumer finance receivable portfolio consisting of $1.0 billion of real estate loans, $290 million of non-real estate loans and $156 million of retail sales finance receivables.
(13) Total net receivables exclude finance receivables held for sale of $80 million, $983 million and $233 million at March 31, 2008 and 2007 and December 31, 2007, respectively.
60

March 31, March 31, Dec. 31, Sequential2008 2007 % Chg 2007 % Chg
Revenues:Guaranteed investment contracts (3) (4) $ 371 $ 917 (59.5) % $ 515 (28.0) %Matched investment program 142 118 20.3 196 (27.6)Institutional asset management (5) 607 429 41.5 895 (32.2)Brokerage service and mutual funds 74 78 (5.1) 79 (6.3)Other asset management (6) 62 147 (57.8) 71 (12.7)
Total excluding net realized capital gains (losses) 1,256 1,689 (25.6) 1,756 (28.5)Net realized capital gains (losses) (7) (8) (1,405) (20) NM (1,100) NM
Total revenues $ (149) $ 1,669 NM % $ 656 NM %
Operating income (loss):Guaranteed investment contracts (3) (4) $ 51 $ 485 (89.5) % $ 143 (64.3) %Matched investment program (9) 20 26 (23.1) 1 NM Institutional asset management (5) (10) 5 97 (94.8) 221 (97.7)Brokerage service and mutual funds 19 26 (26.9) 26 (26.9)Other asset management (6) 59 144 (59.0) 67 (11.9)
Total excluding net realized capital gains (losses) 154 778 (80.2) 458 (66.4)Net realized capital gains (losses) (7) (8) (1,405) (20) NM (1,100) NM
Total operating income (loss) $ (1,251) $ 758 NM % $ (642) NM %
(See Accompanying Notes on Page 63)
American International Group, Inc.Asset Management Operating Statistics (1) (2)
(dollars in millions)
Three Months Ended
61

March 31, March 31, Dec. 31, Sequential2008 2007 % Chg 2007 % Chg
Guaranteed Investment Contracts:
Reserves $ 23,621 $ 29,190 (19.1) % $ 25,294 (6.6) %
Spread InformationBase investment income $ 320 $ 430 (25.6) % $ 348 (8.0) %Partnerships (4) 45 462 (90.3) 143 (68.5)Other enhancements 6 25 (76.0) 24 (75.0)Total net investment income $ 371 $ 917 (59.5) % $ 515 (28.0) %
Base yield 5.56% 5.85% 5.74%Partnerships (11) -0.27% 4.74% 1.09%Other enhancements (12) 0.11% 0.33% 0.39%Total 5.40% 10.92% 7.22%Spread Data Without Hedge Accounting (13) Cost of funds (13) 5.01% 5.50% 5.56% Net spread rate, as reported (13) 0.39% 5.42% 1.66% Net spread rate excluding
partnerships and other enhancements (13) 0.55% 0.35% 0.18%
Spread Data Assuming Hedge Accounting (14) Cost of funds with effect of
economic hedges (14) 4.67% 4.99% 5.11% Net spread rate with effect of
economic hedges (14) 0.73% 5.93% 2.11% Net economic spread rate excluding
partnerships and other enhancements (14) 0.89% 0.86% 0.63%
Matched Investment ProgramSecurities issuance $ 0 $ 2,147 NM % $ 1,257 NM %Notes and bonds payable $ 15,080 $ 7,672 96.6 % $ 14,267 5.7 %
(See Accompanying Notes on Page 63)
American International Group, Inc.Asset Management Other Data
(dollars in millions)
Three Months Ended / As of
62

American International Group, Inc. Asset Management
Notes
(1) AIG's non-affiliated client assets under management, including mutual funds and institutional accounts, approximated
$91.4 billion, $76.5 billion and $94.2 billion at March 31, 2008 and 2007 and December 31 2007, respectively. (2) In order to better align financial reporting with the manner in which AIG’s chief operating decision makers manage
their businesses, beginning in fourth quarter 2007, the effect of consolidating managed partnerships and funds, which were historically reported in the Asset Management segment, are now being reported in the Consolidation and elimination adjustments category. Prior period amounts have been revised to conform to the current presentation.
(3) The Matched Investment Program has replaced the GIC program, which is in runoff, as AIG’s principal spread-based investment activity.
(4) The three months ended March 31, 2007 includes a distribution from a single partnership of $164 million, which became available after a five-year restriction on capital withdrawal.
(5) Includes AIG Investments and certain smaller asset management operations. (6) Consists primarily of SunAmerica Inc. partnerships. (7) Net realized capital gains (losses) are as follows;
Three Months Ended (in millions) March 31, 2008 March 31, 2007 Dec. 31, 2007Spread Based Investment Business - GIC $(372) $(30) $(464)Spread Based Investment Business - MIP (950) 10 (528)Institutional Asset Management (83) - (108) Total $(1,405) $(20) $(1,100)
The net realized capital losses for the Guaranteed Investment Contracts and the Matched Investment Program in both the three month periods ending March 31, 2008 and December 31, 2007, were primarily due to (a) other-than-temporary impairments on fixed income investments (b) foreign exchange, interest rate and credit related mark to market losses on derivative instruments that while economically hedged did not qualify for hedge accounting treatment and (c) the impact of foreign exchange movements on foreign denominated GIC reserves. For the three month periods ending March 31, 2008 and December 31, 2007, other-than-temporary impairments on fixed income investments were $(539) million and $(321) million for the GIC business and $(494) million and $(346) million for the MIP, respectively.
(8) Includes $(74) million, $0 and $(108) million of net realized capital gains (losses) on derivatives for Institutional Asset Management in the three months ended March 31, 2008 and 2007 and December 31, 2007. These net realized capital gains (losses) relate to interest rate hedges on warehoused investment financing that are not eligible for hedge accounting treatment.
(9) The three months ended March 31, 2008 and December 31, 2007 include $16 million and $23 million, respectively, of lower of cost or market adjustments on bank loans held for sale.
(10) Includes $8 million in distribution expenses related to the launch of several new investment products in the three months ended December 31, 2007, and $(18) million, $(12) million and $22 million in gains (losses) in the three months ended March 31, 2008 and 2007 and December 31, 2007, respectively, due to carrying warehoused investments. These gains (losses) include operating income or losses as well as the costs of funding these investments.
(11) Includes incremental effect to base yields of investments in hedge funds, private equity funds and affordable multi-housing partnerships.
(12) Includes incremental effect to base yields of gains on calls, dollar roll income, prepayment fees and trading gains (losses).
(13) Represents cost of funds without FAS 133 accounting for economic hedges where the effects of derivative transactions are recorded in net realized capital gains (losses).
(14) Represents cost of funds on an economic basis including the effects of derivative transactions assuming hedge accounting treatment under FAS 133 is applied.
63

American International Group, Inc.Other
(in millions)
Three Months EndedMarch 31, March 31, Dec. 31,
2008 2007 2007Other before net realized capital gains (losses):
Equity earnings in partially owned companies $ 8 $ 41 $ 29 Interest expense (368) (252) (354) Unallocated corporate expenses (1) (93) (172) (51) Other miscellaneous, net (50) (38) (24)
Subtotal (2) (503) (421) (400) ( )Other net realized capital gains (losses) (265) (49) (183)
Total other - net $ (768) $ (470) $ (583)
Consolidation and elimination adjustments:Before net realized capital gains (losses)
FAS 133 (3) $ (356) $ (230) $ (340) Income from consolidated managed partnerships & funds (2) (4) 41 246 189 All other (2) (38) (2) 12 Subtotal (353) 14 (139)
Net realized capital gains (losses)Reclassification of FAS 133 to other (5) 366 230 185 All other eliminations 8 (29) (35) Subtotal 374 201 150
Total consolidation and elimination adjustments $ 21 $ 215 $ 11
Note: (1) Includes expenses of corporate staff not attributable to specific business segments, expenses related to efforts to improve internal controls, corporate initiatives and certain compensation plan expenses.
(2) Components of adjusted net income (loss). (3) Represents the elimination of revenues reported in the Financial Services segment from intercompany hedging activities and the
reclassification of the related foreign exchange rates on economically hedged exposures. (4) Includes the income from certain AIG managed partnerships, private equity and real estate funds that are consolidated. Such income is
offset in minority interest expense, which is not a component of operating income, on the consolidated statement of income (loss). In order to better align financial reporting with the manner in which AIG’s chief operating decision makers manage their businesses, beginning in fourth quarter 2007, the effect of consolidating managed partnerships and funds, which were historically reported as a component of the Asset Management segment, are now being reported in Other. Prior period amounts have been revised to conform to the current presentation.
(5) Represents the elimination of net realized capital gains (losses) reported in the General Insurance, Life Insurance & Retirement Services, Financial Services and Asset Managements segments and in AIG’s Other category from intercompany hedging activities and the reclassification of the related foreign exchange rates on economically hedged exposures.
64
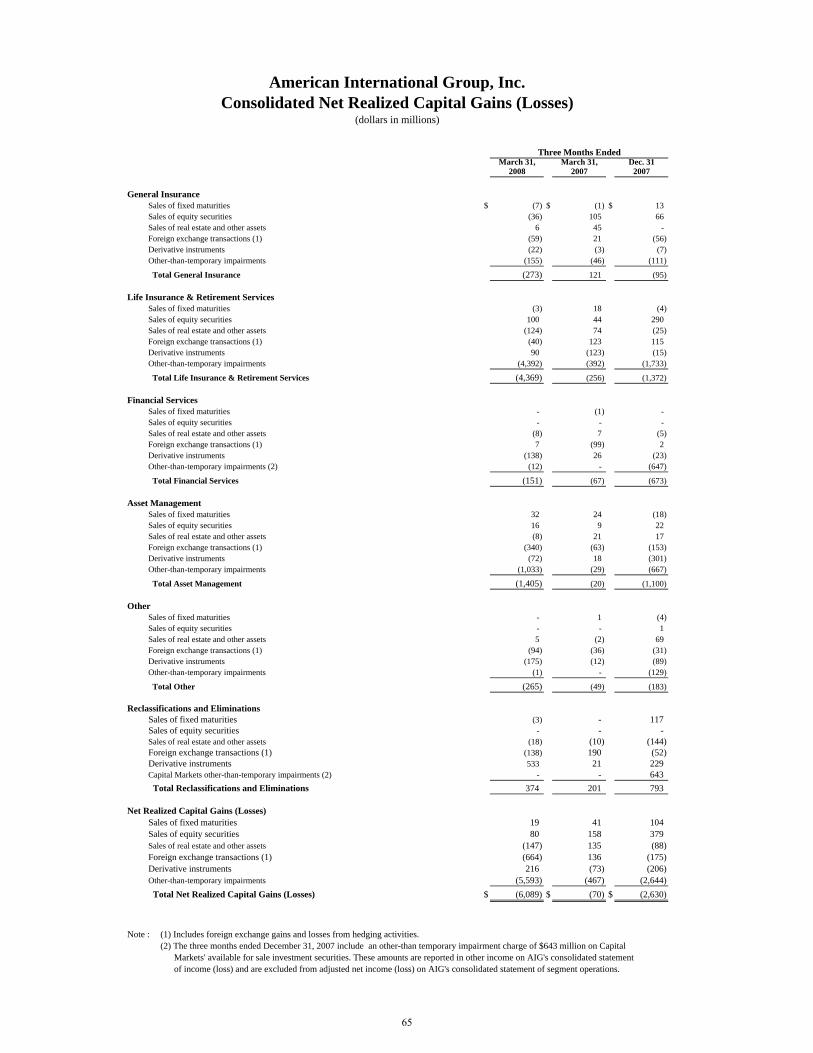
Three Months EndedMarch 31, March 31, Dec. 31
2008 2007 2007
General InsuranceSales of fixed maturities $ (7) $ (1) $ 13 Sales of equity securities (36) 105 66 Sales of real estate and other assets 6 45 - Foreign exchange transactions (1) (59) 21 (56) Derivative instruments (22) (3) (7) Other-than-temporary impairments (155) (46) (111)
Total General Insurance (273) 121 (95)
Life Insurance & Retirement ServicesSales of fixed maturities (3) 18 (4) Sales of equity securities 100 44 290 Sales of real estate and other assets (124) 74 (25) Foreign exchange transactions (1) (40) 123 115 Derivative instruments 90 (123) (15) Other-than-temporary impairments (4,392) (392) (1,733)
Total Life Insurance & Retirement Services (4,369) (256) (1,372)
Financial ServicesSales of fixed maturities - (1) - Sales of equity securities - - - Sales of real estate and other assets (8) 7 (5) Foreign exchange transactions (1) 7 (99) 2 Derivative instruments (138) 26 (23) Other-than-temporary impairments (2) (12) - (647)
Total Financial Services (151) (67) (673)
Asset ManagementSales of fixed maturities 32 24 (18) Sales of equity securities 16 9 22 Sales of real estate and other assets (8) 21 17 Foreign exchange transactions (1) (340) (63) (153) Derivative instruments (72) 18 (301) Other-than-temporary impairments (1,033) (29) (667)
Total Asset Management (1,405) (20) (1,100)
OtherSales of fixed maturities - 1 (4) Sales of equity securities - - 1 Sales of real estate and other assets 5 (2) 69 Foreign exchange transactions (1) (94) (36) (31) Derivative instruments (175) (12) (89) Other-than-temporary impairments (1) - (129)
Total Other (265) (49) (183)
Reclassifications and EliminationsSales of fixed maturities (3) - 117 Sales of equity securities - - - Sales of real estate and other assets (18) (10) (144) Foreign exchange transactions (1) (138) 190 (52) Derivative instruments 533 21 229 Capital Markets other-than-temporary impairments (2) - - 643 Total Reclassifications and Eliminations 374 201 793
Net Realized Capital Gains (Losses)Sales of fixed maturities 19 41 104 Sales of equity securities 80 158 379 Sales of real estate and other assets (147) 135 (88) Foreign exchange transactions (1) (664) 136 (175) Derivative instruments 216 (73) (206) Other-than-temporary impairments (5,593) (467) (2,644) Total Net Realized Capital Gains (Losses) $ (6,089) $ (70) $ (2,630)
Note : (1) Includes foreign exchange gains and losses from hedging activities.(2) The three months ended December 31, 2007 include an other-than temporary impairment charge of $643 million on Capital Markets' available for sale investment securities. These amounts are reported in other income on AIG's consolidated statement of income (loss) and are excluded from adjusted net income (loss) on AIG's consolidated statement of segment operations.
American International Group, Inc.Consolidated Net Realized Capital Gains (Losses)
(dollars in millions)
65
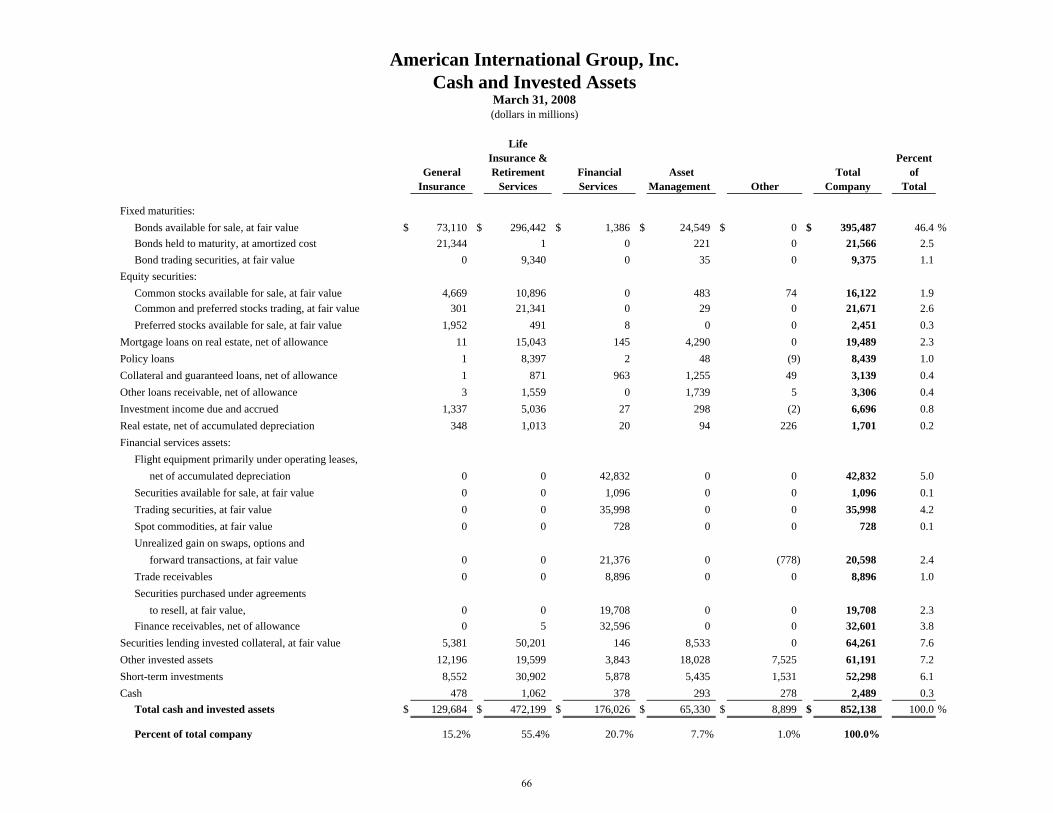
American International Group, Inc.Cash and Invested Assets
March 31, 2008(dollars in millions)
LifeInsurance & Percent
General Retirement Financial Asset Total ofInsurance Services Services Management Other Company Total
Fixed maturities:Bonds available for sale, at fair value $ 73,110 $ 296,442 $ 1,386 $ 24,549 $ 0 $ 395,487 46.4 %Bonds held to maturity, at amortized cost 21,344 1 0 221 0 21,566 2.5Bond trading securities, at fair value 0 9,340 0 35 0 9,375 1.1
Equity securities:Common stocks available for sale, at fair value 4,669 10,896 0 483 74 16,122 1.9Common and preferred stocks trading, at fair value 301 21,341 0 29 0 21,671 2.6Preferred stocks available for sale, at fair value 1,952 491 8 0 0 2,451 0.3
Mortgage loans on real estate, net of allowance 11 15,043 145 4,290 0 19,489 2.3Policy loans 1 8,397 2 48 (9) 8,439 1.0Collateral and guaranteed loans, net of allowance 1 871 963 1,255 49 3,139 0.4Other loans receivable, net of allowance 3 1,559 0 1,739 5 3,306 0.4Investment income due and accrued 1,337 5,036 27 298 (2) 6,696 0.8Real estate, net of accumulated depreciation 348 1,013 20 94 226 1,701 0.2Financial services assets:
Flight equipment primarily under operating leases, net of accumulated depreciation 0 0 42,832 0 0 42,832 5.0Securities available for sale, at fair value 0 0 1,096 0 0 1,096 0.1Trading securities, at fair value 0 0 35,998 0 0 35,998 4.2Spot commodities, at fair value 0 0 728 0 0 728 0.1Unrealized gain on swaps, options and
forward transactions, at fair value 0 0 21,376 0 (778) 20,598 2.4Trade receivables 0 0 8,896 0 0 8,896 1.0Securities purchased under agreements to resell, at fair value, 0 0 19,708 0 0 19,708 2.3Finance receivables, net of allowance 0 5 32,596 0 0 32,601 3.8
Securities lending invested collateral, at fair value 5,381 50,201 146 8,533 0 64,261 7.6Other invested assets 12,196 19,599 3,843 18,028 7,525 61,191 7.2Short-term investments 8,552 30,902 5,878 5,435 1,531 52,298 6.1Cash 478 1,062 378 293 278 2,489 0.3
Total cash and invested assets $ 129,684 $ 472,199 $ 176,026 $ 65,330 $ 8,899 $ 852,138 100.0 %
Percent of total company 15.2% 55.4% 20.7% 7.7% 1.0% 100.0%
66

American International Group, Inc. Cash and Invested Assets
General Insurance (dollars in millions)
Percent PercentMarch 31, 2008 of December 31, 2007 of
Domestic Foreign Total Total Domestic Foreign Total Total
Fixed maturities:Bonds available for sale, at fair value $ 53,421 $ 19,689 $ 73,110 56.4 % $ 54,583 $ 19,474 $ 74,057 57.1 %Bonds held to maturity, at amortized cost 21,161 183 21,344 16.5 21,176 179 21,355 16.5Bond trading securities, at fair value 0 0 0 0.0 0 0 0 0.0
Equity securities:Common stocks available for sale, at fair value 3,751 918 4,669 3.6 4,509 1,090 5,599 4.3Common and preferred stocks trading, at fair value 301 0 301 0.2 321 0 321 0.2Preferred stocks available for sale, at fair value 1,950 2 1,952 1.5 1,883 2 1,885 1.5
Mortgage loans on real estate, net of allowance 8 3 11 0.0 8 3 11 0.0Policy loans 0 1 1 0.0 0 1 1 0.0Collateral and guaranteed loans, net of allowance 0 1 1 0.0 0 1 1 0.0Other loans receivable, net of allowance 3 0 3 0.0 0 0 0 0.0Investment income due and accrued 995 342 1,337 1.0 1,042 389 1,431 1.1Real estate, net of accumulated depreciation 45 303 348 0.3 46 303 349 0.3Financial services assets:
Flight equipment primarily under operating leases, net of accumulated depreciation 0 0 0 0.0 0 0 0 0.0Securities available for sale, at fair value 0 0 0 0.0 0 0 0 0.0Trading securities, at fair value 0 0 0 0.0 0 0 0 0.0Spot commodities, at fair value 0 0 0 0.0 0 0 0 0.0Unrealized gain on swaps, options and
forward transactions, at fair value 0 0 0 0.0 0 0 0 0.0Trade receivables 0 0 0 0.0 0 0 0 0.0Securities purchased under agreements to resell, at fair value 0 0 0 0.0 0 0 0 0.0Finance receivables, net of allowance 0 0 0 0.0 0 0 0 0.0
Securities lending invested collateral, at fair value 2,605 2,776 5,381 4.1 2,552 2,479 5,031 3.9Other invested assets 10,219 1,977 12,196 9.4 9,996 1,899 11,895 9.2Short-term investments 3,255 5,297 8,552 6.6 2,405 4,951 7,356 5.7Cash 291 187 478 0.4 281 216 497 0.2
Total cash and invested assets $ 98,005 $ 31,679 $ 129,684 100.0 % $ 98,802 $ 30,987 $ 129,789 100.0 %
Percent of total company 11.5% 3.7% 15.2% 11.5% 3.6% 15.1%Return on average invested assets 3.7% 5.0%g g gReturn on average invested assets excluding securities lending collateral 3.9% 5.2%
67

Percent PercentMarch 31, 2008 of December 31, 2007 of
Domestic Foreign Total Total Domestic Foreign Total Total
Fixed maturities:Bonds available for sale, at fair value $ 122,066 $ 174,376 $ 296,442 62.8 % $ 127,839 $ 166,323 $ 294,162 62.5 %Bonds held to maturity, at amortized cost 0 1 1 0.0 0 1 1 0.0Bond trading securities, at fair value 325 9,015 9,340 2.0 423 9,525 9,948 2.1
Equity securities:Common stocks available for sale, at fair value 137 10,759 10,896 2.3 170 11,446 11,616 2.5Common and preferred stocks trading, at fair value 547 20,794 21,341 4.5 594 20,432 21,026 4.5Preferred stocks available for sale, at fair value 251 240 491 0.1 250 227 477 0.1
Mortgage loans on real estate, net of allowance 11,460 3,583 15,043 3.2 11,447 3,261 14,708 3.1Policy loans 3,002 5,395 8,397 1.8 3,012 5,045 8,057 1.7Collateral and guaranteed loans, net of allowance 291 580 871 0.2 289 492 781 0.2Other loans receivable, net of allowance 996 563 1,559 0.3 770 535 1,305 0.3Investment income due and accrued 1,855 3,181 5,036 1.1 1,762 2,966 4,728 1.0Real estate, net of accumulated depreciation 113 900 1,013 0.2 114 862 976 0.2Financial services assets:
Flight equipment primarily under operating leases, net of accumulated depreciation 0 0 0 0.0 0 0 0 0.0Securities available for sale, at fair value 0 0 0 0.0 0 0 0 0.0Trading securities, at fair value 0 0 0 0.0 0 0 0 0.0Spot commodities, at fair value 0 0 0 0.0 0 0 0 0.0Unrealized gain on swaps, options and
fforward transactions, at fair value 0 0 0 0.0 0 0 0 0.0Trade receivables 0 0 0 0.0 0 0 0 0.0Securities purchased under agreements to resell, at fair value 0 0 0 0.0 0 0 0 0.0Finance receivables, net of allowance 0 5 5 0.0 0 5 5 0.0
Securities lending invested collateral, at fair value 43,008 7,193 50,201 10.6 49,527 7,944 57,471 12.2Other invested assets 9,597 10,002 19,599 4.2 9,877 9,138 19,015 4.0Short-term investments 9,027 21,875 30,902 6.5 3,329 21,907 25,236 5.4Cash 71 991 1,062 0.2 70 930 1,000 0.2
Total cash and invested assets $ 202,746 $ 269,453 $ 472,199 100.0 % $ 209,473 $ 261,039 $ 470,512 100.0 %
Percent of total company 23.8% 31.6% 55.4% 24.3% 30.3% 54.6%Return on average invested assets 3.2% 5.0%Return on average invested assets excluding securities lending collateral 3.6% 5.6%
American International Group, Inc. Cash and Invested Assets
Life Insurance & Retirement Services (dollars in millions)
68
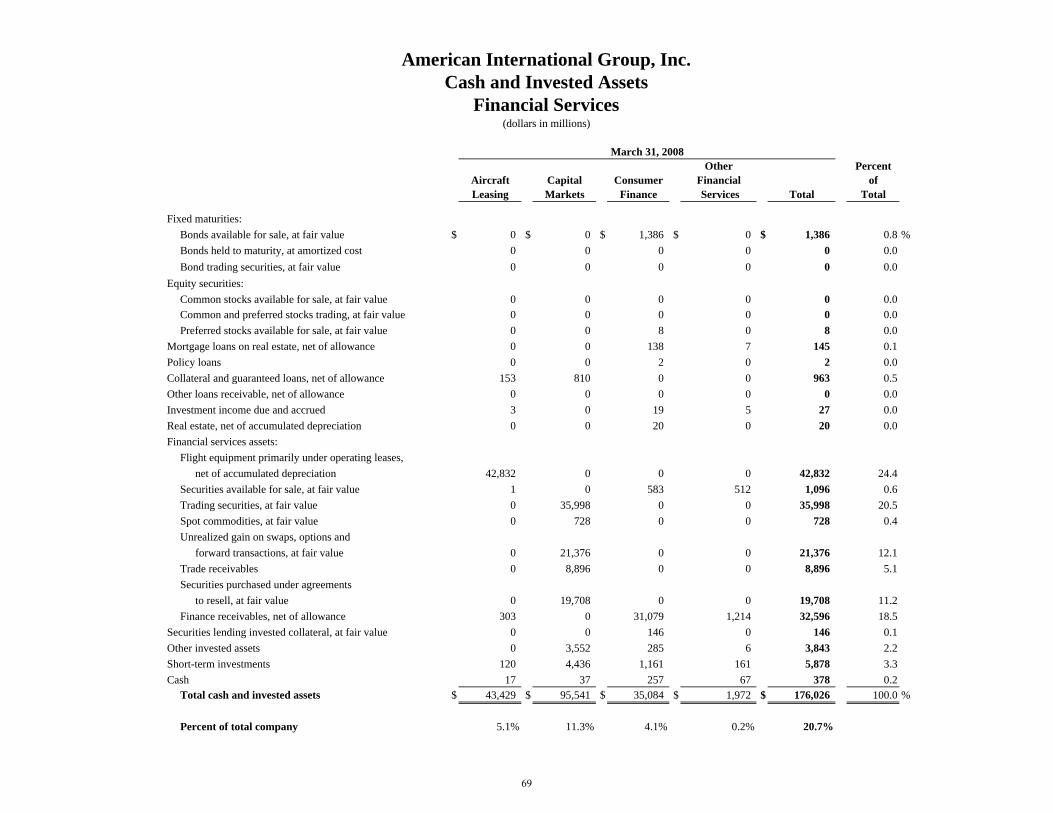
American International Group, Inc.Cash and Invested Assets
Financial Services(dollars in millions)
March 31, 2008Other Percent
Aircraft Capital Consumer Financial ofLeasing Markets Finance Services Total Total
Fixed maturities:Bonds available for sale, at fair value $ 0 $ 0 $ 1,386 $ 0 $ 1,386 0.8 %Bonds held to maturity, at amortized cost 0 0 0 0 0 0.0Bond trading securities, at fair value 0 0 0 0 0 0.0
Equity securities:Common stocks available for sale, at fair value 0 0 0 0 0 0.0Common and preferred stocks trading, at fair value 0 0 0 0 0 0.0Preferred stocks available for sale, at fair value 0 0 8 0 8 0.0
Mortgage loans on real estate, net of allowance 0 0 138 7 145 0.1Policy loans 0 0 2 0 2 0.0Collateral and guaranteed loans, net of allowance 153 810 0 0 963 0.5Other loans receivable, net of allowance 0 0 0 0 0 0.0Investment income due and accrued 3 0 19 5 27 0.0Real estate, net of accumulated depreciation 0 0 20 0 20 0.0Financial services assets:
Flight equipment primarily under operating leases, net of accumulated depreciation 42,832 0 0 0 42,832 24.4Securities available for sale, at fair value 1 0 583 512 1,096 0.6Trading securities, at fair value 0 35,998 0 0 35,998 20.5Spot commodities, at fair value 0 728 0 0 728 0.4Unrealized gain on swaps, options and
forward transactions, at fair value 0 21,376 0 0 21,376 12.1Trade receivables 0 8,896 0 0 8,896 5.1Securities purchased under agreements to resell, at fair value 0 19,708 0 0 19,708 11.2Finance receivables, net of allowance 303 0 31,079 1,214 32,596 18.5
Securities lending invested collateral, at fair value 0 0 146 0 146 0.1Other invested assets 0 3,552 285 6 3,843 2.2Short-term investments 120 4,436 1,161 161 5,878 3.3Cash 17 37 257 67 378 0.2
Total cash and invested assets $ 43,429 $ 95,541 $ 35,084 $ 1,972 $ 176,026 100.0 %
Percent of total company 5.1% 11.3% 4.1% 0.2% 20.7%
69

March 31, Dec. 31,2008 2007 % chg
Domestic General InsurancePartnerships (1) $ 7,476 $ 7,416 0.8 %Mutual Funds 259 294 (12.1)Real Estate - - NMAll Other 2,484 2,286 8.7Total Domestic General Insurance 10,219 9,996 2.2
Foreign General InsurancePartnerships (1) 954 877 8.7Mutual Funds 808 857 (5.7)Real Estate 153 150 2.2All Other 62 15 313.0Total Foreign General Insurance 1,977 1,899 4.1
Domestic Life InsurancePartnerships (1) 1,094 976 12.1Mutual Funds 82 83 (1.6)Real Estate 103 115 (10.5)All Other 705 727 (3.0)Total Domestic Life Insurance 1,984 1,901 4.4
Domestic Retirement ServicesPartnerships (1) 6,170 6,482 (4.8)Mutual Funds 21 12 73.9Real Estate 87 86 1.0All Other 1,335 1,396 (4.4)Total Domestic Retirement Services 7,613 7,976 (4.6)
Foreign Life Insurance & Retirement ServicesPartnerships (1) 1,747 1,589 9.9Mutual Funds 3,152 3,027 4.1Real Estate 2,717 2,566 5.9All Other 2,386 1,956 22.0Total Foreign Life Insurance & Retirement Services 10,002 9,138 9.5
Asset ManagementPartnerships (1) 9,943 9,669 2.8Mutual Funds - - NMReal Estate 7,437 6,960 6.9All Other 648 632 2.5Total Asset Management 18,028 17,261 4.4
Financial Services and OtherPartnerships (1) 2,058 1,929 6.7Mutual Funds 735 618 18.9Real Estate - - NMAll Other 1,531 1,491 2.7Total Financial Services and Other 4,324 4,038 7.1Consolidated Managed Partnerships & Funds (2) 7,044 6,614 6.5
Total AIG Other Invested AssetsPartnerships (1) 29,442 28,938 1.7Mutual Funds 5,057 4,891 3.4Real Estate 10,497 9,877 6.3All Other (3) 9,151 8,503 7.6Consolidated Managed Partnerships & Funds (2) 7,044 6,614 6.5
Total AIG Other Invested Assets $ 61,191 $ 58,823 4.0 %
Note: (1) Includes private equity partnerships, hedge funds and AIG managed funds.
(2) Represents AIG managed partnerships and funds that are consolidated.
(3) Consist primarily of Life Insurance investments in aircraft equipment, investments in life settlement
contracts and other miscellaneous investments.
American International Group, IncOther Invested Assets
(dollars in millions)
70
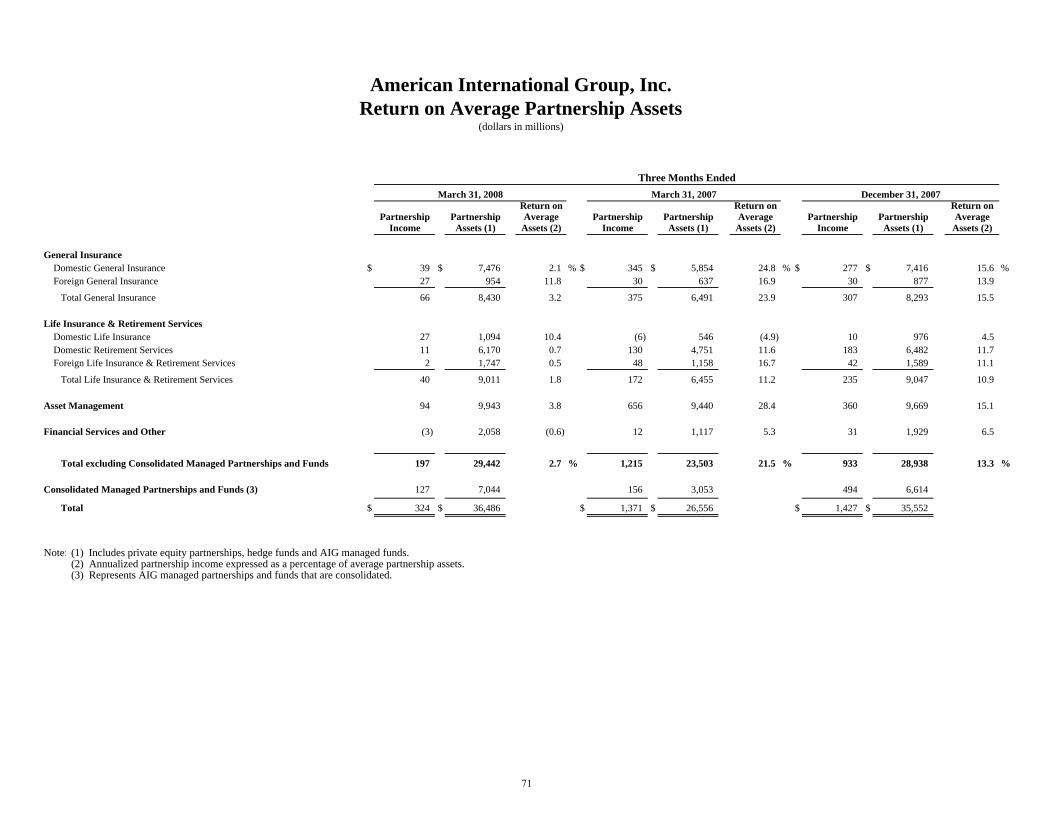
Return on Return on Return onPartnership Partnership Average Partnership Partnership Average Partnership Partnership Average
Income Assets (1) Assets (2) Income Assets (1) Assets (2) Income Assets (1) Assets (2)
General Insurance Domestic General Insurance $ 39 $ 7,476 2.1 % $ 345 $ 5,854 24.8 % $ 277 $ 7,416 15.6 % Foreign General Insurance 27 954 11.8 30 637 16.9 30 877 13.9
Total General Insurance 66 8,430 3.2 375 6,491 23.9 307 8,293 15.5
Life Insurance & Retirement Services Domestic Life Insurance 27 1,094 10.4 (6) 546 (4.9) 10 976 4.5 Domestic Retirement Services 11 6,170 0.7 130 4,751 11.6 183 6,482 11.7 Foreign Life Insurance & Retirement Services 2 1,747 0.5 48 1,158 16.7 42 1,589 11.1
Total Life Insurance & Retirement Services 40 9,011 1.8 172 6,455 11.2 235 9,047 10.9
Asset Management 94 9,943 3.8 656 9,440 28.4 360 9,669 15.1
Financial Services and Other (3) 2,058 (0.6) 12 1,117 5.3 31 1,929 6.5
Total excluding Consolidated Managed Partnerships and Funds 197 29,442 2.7 % 1,215 23,503 21.5 % 933 28,938 13.3 %
Consolidated Managed Partnerships and Funds (3) 127 7,044 156 3,053 494 6,614
Total $ 324 $ 36,486 $ 1,371 $ 26,556 $ 1,427 $ 35,552
Note: (1) Includes private equity partnerships, hedge funds and AIG managed funds. (2) Annualized partnership income expressed as a percentage of average partnership assets. (3) Represents AIG managed partnerships and funds that are consolidated.
American International Group, Inc.Return on Average Partnership Assets
(dollars in millions)
Three Months EndedMarch 31, 2008 March 31, 2007 December 31, 2007
71

(1) Ratings by nationally recognized rating agencies or similar foreign services. AIG reviews the credit quality of the foreign portfolio non-rated fixed income investments.(2) Includes bonds reported in securities lending invested collateral on the consolidated balance sheet.
Total Domestic Bond Portfolio Ratings Total Foreign Bond Portfolio Ratings (1)
American International Group, Inc.Worldwide Insurance and Asset Management
Bond PortfolioMarch 31, 2008
Lower3% BBB
6%
Non-Rated1%
AAA21%
AA44%
A25%
AAA45%
Lower4%
Non-Rated1%
A13%
BBB16%
AA21%
Foreign Bonds (2)$211.6 billion
Domestic Bonds (2)$270.2 billion
72

Retirement Services and Asset Management
Bond Ratings Bond RatingsAAA............................... 68.2% AAA.............................. 36.8%
AA................................. 26.3% AA................................. 18.5%
A................................... 4.6% A................................... 17.0%
BBB............................... 0.6% BBB.............................. 21.7%
Non-Rated.................... 0.1% Non-Rated.................... 0.1%
Lower............................ 0.2% Lower............................ 5.9%
Domestic General Insurance Bonds *$77.1 billion
* Includes bonds reported in securities lending invested collateral on the consolidated balance sheet.
Asset Management Bonds *$193.1 billion
Domestic General Insurance
Domestic Life Insurance &Retirement Services and
Domestic Life Insurance &
American International Group, Inc.Domestic Insurance and Asset Management
Bond PortfolioMarch 31, 2008
Tax Exempt80%
Taxable20%
73

TotalAmortized
RMBS CMBS CDO/ABS CostRating AAA $ 74,352 $ 17,963 $ 5,617 $ 97,932
AA 4,727 2,923 1,351 9,001
A 1,512 1,870 3,026 6,408
BBB and below 1,734 278 1,547 3,559
Total $ 82,325 $ 23,034 $ 11,541 $ 116,900
Collateral TypeU.S. agencies $ 14,541
Prime non-agency 18,671
Alt-A 23,701
Other housing related 3,769
Subprime 21,643
Total $ 82,325
TotalAmortized
Subprime Mortgages Prior 2004 2005 2006 2007 2008 Cost
Rating AAA $ 511 $ 463 $ 5,242 $ 8,129 $ 4,555 $ - $ 18,900
AA 41 101 280 899 334 - 1,655
A 86 98 92 165 19 - 460
BBB and below 3 80 28 512 5 - 628
Total $ 641 $ 742 $ 5,642 $ 9,705 $ 4,913 $ - $ 21,643
Year of Vintage
American International Group, Inc. (Excludes AIGFP)Asset-Backed Securities and Collateralized Debt Obligations that Include Residential Mortgages
March 31, 2008(dollars in millions)
Asset Class
74

CMBS Portfolio
Description Amortized Cost Percentage
CMBS (traditional) 20,358$ 89%ReRemic / CRE CDO 1,940 8%Agency 256 1%Other 480 2% Total 23,034$ 100%
CMBS by Rating
Rating PercentageAAA 78%AA 13%A 8%BBB and below 1% Total 100%
CMBS by Vintage
Year of Vintage Percentage2007 23%2006 14%2005 19%2004 16%Prior 28% Total 100%
CMBS by Geographic Region
Geographic Region PercentageNew York 17%California 15%Texas 7%Florida 6%Virginia 4%Illinois 4%New Jersey 3%Pennsylvania 3%Georgia 3%Massachusetts 3%All Other 35% Total 100%
American International Group, Inc. (Excludes AIGFP)Commercial Mortgage-Backed Securities
March 31, 2008(dollars in millions)
75

Comment on Regulation G
This financial supplement includes certain non-GAAP financial measures. The reconciliations of such measures to the most comparable GAAP figures in accordance with Regulation G are included within the relevant tables.
Throughout this financial supplement, AIG presents its operations in the way it believes will be most meaningful and useful, as well as most transparent, to the investing public and others who use AIG’s financial information in evaluating the performance of AIG. That presentation includes the use of certain non-GAAP measures. In addition to the GAAP presentations, in some cases, revenues, net income, operating income and related rates of performance, and out of period adjustments are shown exclusive of realized capital gains (losses), the effect of FIN 46(R), the effect of EITF 04-5, the effect of FAS 133, the effect of trading account losses, the effect of remediation activities, the effect of change in actuarial estimate, the effect of expenses of industry wide reviews and the effect of catastrophe-related losses.
AIG excludes the effects of FIN 46(R) and EITF 04-5, and the effect of hedging activities that did not qualify for hedge accounting treatment under FAS 133, although they are economically effective hedges, because AIG believes that excluding these items permits investors to better assess the performance of the underlying businesses. AIG believes that providing information in a non-GAAP manner is more useful to investors and analysts. Likewise, AIG excludes certain entities consolidated pursuant to FIN 46(R) or EITF 04-5, including certain AIG managed partnerships, private equity and real estate funds, where AIG does not in fact have the economic interest that is presumed to be held by consolidation, because AIG believes this presentation is more meaningful than the GAAP presentation.
Although the investment of premiums to generate investment income (or loss) and realized capital gains or losses is an integral part of both life and
general insurance operations, the determination to realize capital gains or losses is independent of the insurance underwriting process. Moreover, under applicable GAAP accounting requirements, losses can be recorded as the result of other than temporary declines in value without actual realization. In sum, investment income and realized capital gains or losses for any particular period are not indicative of underlying business performance for such period.
AIG believes that underwriting profit (loss) provides investors with financial information that is not only meaningful but critically important to understanding the results of property and casualty insurance operations. Operating income of a property and casualty insurance company includes three components: underwriting profit (loss), net investment income and realized capital gains (losses). Without disclosure of underwriting profit (loss), it is impossible to determine how successful an insurance company is in its core business activity of assessing and underwriting risk. Including investment income and net realized capital gains (losses) in operating income without disclosing underwriting profit (loss) can mask underwriting losses. The amount of net investment income may be driven by changes in interest rates and other factors that are totally unrelated to underwriting performance.
Underwriting profit (loss) is an important measurement used by AIG senior management to evaluate the performance of its property and casualty
insurance operations. AIG includes the measurement required in statutory financial statements filed with state insurance departments and adjusts for changes in deferred acquisition costs in order to make the measure more consistent with the information provided in AIG’s consolidated financial statements. Further, the equity analysts who follow AIG exclude the realized capital transactions in their analyses for the same reason and consistently request that AIG provide the non-GAAP information.
Life and retirement services production (premiums, deposits and other considerations), gross premiums written, net premiums written and loss, expense and combined ratios are presented in accordance with accounting principles prescribed or permitted by insurance regulatory authorities because these are standard measures of performance used in the insurance industry and thus allow for more meaningful comparisons with AIG’s insurance competitors.
76